Article

Experimental and Numerical Optimization Study on Performance of Phase-Change Thermal Energy Storage System

School of Environmental Science and Engineering, Tianjin University, Tianjin 300350, China
*
Author to whom correspondence should be addressed.
Energies 2023, 16(10), 4148; https://doi.org/10.3390/en16104148
Submission received: 16 April 2023 / Revised: 9 May 2023 / Accepted: 14 May 2023 / Published: 17 May 2023

Abstract

:
Promoting the use of solar energy resources has always involved the challenges of instability and supply–demand mismatch. The key to solving these issues is to efficiently store and utilize solar energy resources using high-performance heat storage devices. This study designed a high-performance shell-and-tube phase-change thermal storage device and established a numerical model using ANSYS software to summarize the device’s dynamic melting law. To verify the accuracy of the numerical simulation, a performance testing platform for the phase-change thermal storage device was built to investigate the impact of various factors, such as the inlet water temperature, inlet water flow rate, type of heat storage, and initial temperature of the device, and to reveal the change law of the device’s performance. The results show that the inlet water temperature has the most significant impact on the device’s heat storage and release performance. When the device’s heat storage or release is used for heating, changing the inlet water flow rate has a weak and limited effect on the device’s performance. However, when the device’s heat release is used to provide domestic hot water, increasing the make-up water temperature and reducing the inlet water flow rate can significantly improve the device’s effective heat release. Furthermore, based on the experimental validation of the model’s correctness, this study further simulated and studied the impact of different factors on the device’s heat storage process to optimize its structural design and provide technical references for the device’s actual operation and installation. The results show that the placement of fins has a negligible effect on the performance of the heat storage device while reducing the fin spacing and increasing the fin thickness can significantly improve the melting efficiency of the phase-change material (PCM). Additionally, the heat storage characteristics of the device are significantly better in the vertical installation mode than in the horizontal installation mode. This study provides theoretical guidance and technical references for the design and use of phase-change thermal storage devices.

1. Introduction

Solar energy boasts rich reserves, wide distribution, and a high degree of environmental friendliness. In China, over two-thirds of the country’s regions receive annual radiation exceeding 5020 MJ/m2, while numerous winter heating areas possess considerable solar energy resources, providing an optimal basis for promoting the utilization of solar energy [1,2]. However, despite the potential for replacing conventional energy sources with solar energy to reduce building heating energy consumption and carbon emissions, solar energy utilization still encounters stability issues. Furthermore, the supply of solar energy utilization systems can conflict with the construction loads of building environments. This conflict is mainly due to the mismatch between the peak periods of solar energy supply and the trough periods of building heat loads and vice versa. Therefore, the development of high-performance and reliable heat storage equipment that can efficiently store and allocate solar energy resources is a crucial solution to address this problem.
The phase-change thermal energy storage (TES) device mainly consists of three parts: the phase-change material, the heat exchange component, and the heat exchange fluid. Therefore, the heat transfer characteristics of the phase-change material, the heat exchange effect of the heat exchange component, and the flow characteristics of the heat exchange fluid all affect the thermal performance of the TES device. Improving the thermal performance of the TES device has great research significance and application value. In recent years, many scholars have explored the enhancement of heat exchange and the improvement of TES performance. Among them, changing the structural form, adding fins, and adjusting the heat exchange fluid conditions are common methods used by scholars to enhance heat exchange.
According to whether the heat exchange fluid is in direct contact with the phase-change material, TES devices can be divided into direct contact and indirect contact types [3]. The direct-contact-type TES device refers to the mixing of the phase-change material and the heat exchange fluid in the device, and heat exchange is carried out through direct contact. In the later stage of heat exchange, the two need to be separated. The application process of this type of device is more complex, and some phase-change materials cannot be in direct contact with the heat exchange fluid, so it is less common in practical applications. The indirect-contact-type TES device encapsulates the phase-change material through the heat exchange component, which is more convenient to operate than the direct contact type and avoids the loss of phase-change materials. Therefore, it is widely used in engineering [4]. The phase-change materials are mainly encapsulated in rectangular containers, slender coils, and cylindrical containers. According to their encapsulation form, the indirect-contact-type TES device is mainly divided into three types of structures: flat plate; stacked; and tube and shell.
The structure of a flat-plate phase-change TES system is relatively simple, and the plate size is a crucial factor affecting its performance. Many researchers have explored this issue. Campos-Celador et al. [5] conducted a comparative study between a pure water TES system and a plate heat storage system using paraffin as a PCM. The results showed that the volume of the phase-change heat storage system was half that of the pure water system when storing the same amount of heat, and it had better heat storage and release capacity. Prieto et al. [6] investigated the relationship between the thickness of the phase-change plate and heat transfer efficiency, finding that reducing the thickness can enhance the heat transfer effect, increasing the heat transfer rate up to five times.
Stacked TES systems are filled with encapsulated small-volume PCMs, and the heat transfer fluid flows through the gaps in the PCM stack, providing a larger heat transfer area than other methods. Reda studied the effects of different diameters on the heat storage process of a stacked TES system with spherical encapsulation, finding that smaller diameter phase-change spheres have a relatively high heat transfer efficiency. Shamsi et al. simulated the heat storage process of a stacked bed TES system and found that increasing the temperature or flow rate of the heat transfer fluid can improve the heat storage rate and amount.
The shell-and-tube type TES system has a higher heat storage density per unit volume, has a simpler encapsulation of the PCM, and is easier to combine with various forms of heat exchangers, making it a preferred choice for over 70% of latent heat thermal energy storage systems (LHTESs) [7]. Pipe-and-shell heat exchangers are common forms of heat exchange components in phase-change thermal energy storage systems. Coil-shaped heat exchangers can achieve longer heat exchange paths in small sizes, effectively increasing the heat exchange time between the fluid and the phase-change material and improving the heat exchange efficiency [8]. Cheng et al. [9] conducted numerical simulations on a phase-change thermal energy storage system with an embedded spiral coil and analyzed the effects of natural convection, the heat transfer fluid flow rate, and the initial parameters of the system on the system’s heat release characteristics. The results showed that increasing the inlet flow rate of the heat transfer fluid is beneficial for improving the heat release efficiency, and natural convection has a significant impact on the heat release performance. Duan et al. [10] established an experimental platform for the thermal performance of a phase-change thermal energy storage system and studied the effects of the flow rate of the heat transfer fluid and the number of series-connected coil-shaped heat exchangers on the heat release performance of the system. The results showed that reducing the flow rate and increasing the number of series-connected coils can both extend the effective heat release time.
Vyshak et al. [11] studied the total time required for PCM to melt in containers with three different geometric configurations (rectangular, cylindrical, and cylindrical shell) with the same volume and heat transfer surface area, finding that cylindrical shells require the shortest time for equal energy storage under the same PCM mass and heat transfer surface area, and this geometric effect becomes more pronounced as the PCM mass increases. Liang et al. [12] simulated the effect of different pipe length-to-diameter ratios and PCM volume ratios on the performance of a shell-and-tube type phase-change TES system, finding that the effective energy storage ratio increases with an increase in the pipe length-to-diameter ratio and that there is an optimal PCM volume ratio. Only when the PCM volume ratio is greater than a certain value can an increase in the effective thermal conductivity of the PCM effectively improve the effective energy storage ratio.
Increasing the heat transfer area between the heat transfer fluid and PCM is an effective means of enhancing heat transfer efficiency, and attaching fins is a common way to increase the heat transfer area. Numerous studies have shown that the thermal performance of phase-change thermal storage devices can be significantly improved by adding fins. Tay et al. [13] attached fins and pin fins to the heat transfer tube to enhance heat transfer efficiency in the intensification device and compared the improvement effects of the two through numerical simulation and experimental research. The results showed that the heat storage effect of fins was better, and the heat storage time was shortened by 25% compared with pin fins. Rathod et al. [14] conducted a comparative study on the heat storage performance of the phase-change thermal storage device before and after the addition of fins. The results showed that the heat storage efficiency was significantly improved after adding three longitudinal fins. When the inlet temperatures of the heat transfer fluid were 80 °C and 85 °C, the heat storage time was shortened by 12.5% and 24.52%, respectively. Mat et al. [15] studied the inner fins, outer fins, and inner and outer fin enhancement technologies in the triplex-tube heat exchanger (TTHX) as well as the influence of fin length on the enhancement technology. The results showed that the three enhancement technologies did not have a significant difference on the PCM melting rate. Compared with the three-tube heat exchanger without fins, the time for the complete melting of inner and outer fins with a length of 42 mm was reduced by 43.3%.
The number, thickness, shape, and arrangement of fins have an impact on the performance of phase-change TES systems. Al-Abidi et al. [16] numerically simulated the melting heat transfer process of PCM with fins inside and outside of a triple-tube heat exchanger (TTHX) and found that the melting time was influenced by the number of fins, the length of fins, and the thickness of fins. The complete melting times for four, six, and eight fins were 69.5%, 56.5%, and 43.4%, respectively, compared to no fins. The melting times for fins with lengths of 10 mm, 20 mm, 30 mm, and 42 mm were 73.9%, 60.8%, 47.8%, and 43.4%, respectively, compared to no fins. The melting times for fins with thicknesses of 1 mm, 2 mm, 3 mm, and 4 mm were 43.4%, 39%, 39%, and 35%, respectively, compared to no fins. Yuan et al. [17] simulated a cylindrical phase-change TES unit using paraffin RT82 as the PCM and established different numerical models by changing the number and width of fins and the radius of the cylindrical TES tube to compare their TES performance and obtain optimal model parameters. Castell et al. [18] conducted experimental research on a phase-change TES system with fins and pointed out that the melting rate increased with decrease in fin spacing and increases in the temperature difference between the heat transfer fluid and the PCM. Shatikian et al. studied the effect of different fin thicknesses on the TES process of a phase-change TES system and found that increasing the fin thickness accelerated the melting of the PCM but shortened the fin spacing and reduced the amount of PCM. A reasonable configuration of fin thickness and spacing can improve the heat transfer performance of the TES system.
Prieto et al. [19] investigated the effect of different PCMs on the heat storage and release performance of the same structure, and the results showed that paraffin with higher enthalpy had stronger heat storage capacity and longer heat release duration, while stearic acid with higher heat transfer coefficient had better heat transfer effect and could better meet the load demand during peak hours. Bansal et al. [20] used organic acid as the phase-change heat storage material and verified the applicability of the heat transfer model combining solar collectors and phase-change heat storage under various operating conditions using numerical simulation. The results showed that the system combining PCMs and collectors was superior to the system separating PCMs and collectors. Rathod et al. [21] used the analytic hierarchy process (AHP) method combined with the technique for order preference by similarity to ideal solution (TOPSIS) and fuzzy TOPSIS methods to select the optimal PCM for a solar hot water system. Xu et al. [22] used the AHP and TOPSIS methods to select the optimal PCM for a solar air conditioning system and validated the selected results through Ashby’s method.
Improving the structure of the device and changing the heat flux density can effectively enhance the heat transfer performance of the device. Some scholars have changed the parameters of the heat transfer fluid and the device during the heat storage and release process to achieve optimal operating conditions. Hosseini et al. [23] conducted experimental and simulation studies on a horizontally placed shell-and-tube latent heat storage device, which showed that raising the temperature of the heat transfer fluid can shorten the melting time of the device. When the inlet temperature was 80 °C, the melting time of the phase-change material inside the device was reduced by 37%. Rathod et al. [24] conducted experimental studies on a vertically placed shell-and-tube device during the heat storage process and observed the melting differences of the device by changing the inlet flow rate and heat transfer fluid temperature. The results showed that reducing the mass flow rate or inlet temperature of the heat transfer fluid would increase the total melting time of the phase-change material. During the phase-change process of the material, the inlet temperature of the fluid had a more significant impact on the melting of the device than the mass flow rate. Wang et al. [25] simulated the heat storage performance of a shell-and-tube phase-change heat storage device and found that increasing the inlet flow velocity of the heat transfer fluid would decrease the total energy storage efficiency of the device while increasing the heat storage rate; raising the inlet temperature of the heat transfer fluid could simultaneously improve the heat storage rate and energy efficiency ratio of the device. Hou et al. [26] conducted experimental studies on a phase-change heat storage device with annular phase-change units and found that increasing the flow rate of the heat transfer fluid could enhance the heat storage and release rate of the device, but the flow rate should not be too large; otherwise, the heat storage and release effect could not be guaranteed.
The design and enhancement of heat exchange in phase-change thermal storage devices can be summarized as follows: (1) Compared to direct- and indirect-contact-type phase-change thermal storage devices, the tube-and-shell structure has advantages, such as versatility in combination with various heat exchangers, convenient packaging, and a high heat storage density, making it more favored by researchers. (2) The performance of phase-change thermal storage devices is affected by factors such as the number, thickness, spacing, shape, and arrangement of fins. (3) The heat storage effect of phase-change thermal storage devices is influenced by factors such as the inlet temperature and flow rate of the heat exchange fluid and the flow direction.
There are still several issues in the current research on phase-change thermal storage devices: (1) In terms of numerical simulation, the heat exchange tube is often simplified as a partial tube section, and the heat storage and release process is simulated and analyzed. However, the numerical model is significantly different from the actual structure. For example, for longer coiled pipes, the temperature of the heat exchange fluid changes during flow, resulting in discrepancies between the results obtained from analyzing partial pipe sections and the actual performance. (2) In terms of operating conditions, most studies focus on the effects of heat exchange fluid temperature and flow rate on the heat storage performance of the device and the effects of the heat exchange fluid flow rate and initial device temperature on the heat release performance of the device. Research on the effects of heat exchange fluid flow direction on the heat storage performance of the device and the effects of heat exchange fluid temperature on the heat release performance of the device is limited. (3) In terms of performance analysis, some studies only evaluate the performance of the device based on the melting or solidification effect of the PCM, without considering the heat storage capacity, instantaneous power, and effective heat release efficiency of the device under different operating conditions.
The objectives of this study are as follows: (1) establish a physical model and a mathematical model to use numerical simulation software to simulate the heat storage process of the phase-change thermal storage device and to summarize the dynamic melting law of the phase-change thermal storage device; (2) set up a test bench to test the thermal performance of the phase-change thermal storage device, clarify the operation mode of the system and the specific experimental scheme, and investigate the influence of different factors on the thermal storage and release performance of the device; (3) based on the experimental data, analyze the variations in the dynamic characteristics of the thermal storage device with the inlet water temperature; inlet water flow rate; and thermal storage method and the variations in the dynamic characteristics of the thermal release device with the initial temperature; inlet water temperature; inlet water flow rate; and thermal release method of the device, then use the analysis to select the optimal operating conditions and compare the numerical simulation with the experimental results to verify the accuracy of the numerical simulation.
The structure of this paper is as follows: Section 2 introduces the physical model, control equations, and numerical simulation methods. Section 3 describes the phase-change experiments. Section 4 summarizes and analyzes the experimental results. Section 5 uses numerical simulation methods to study the performance of the phase-change thermal storage device.

2. Materials and Method

2.1. Physical Model

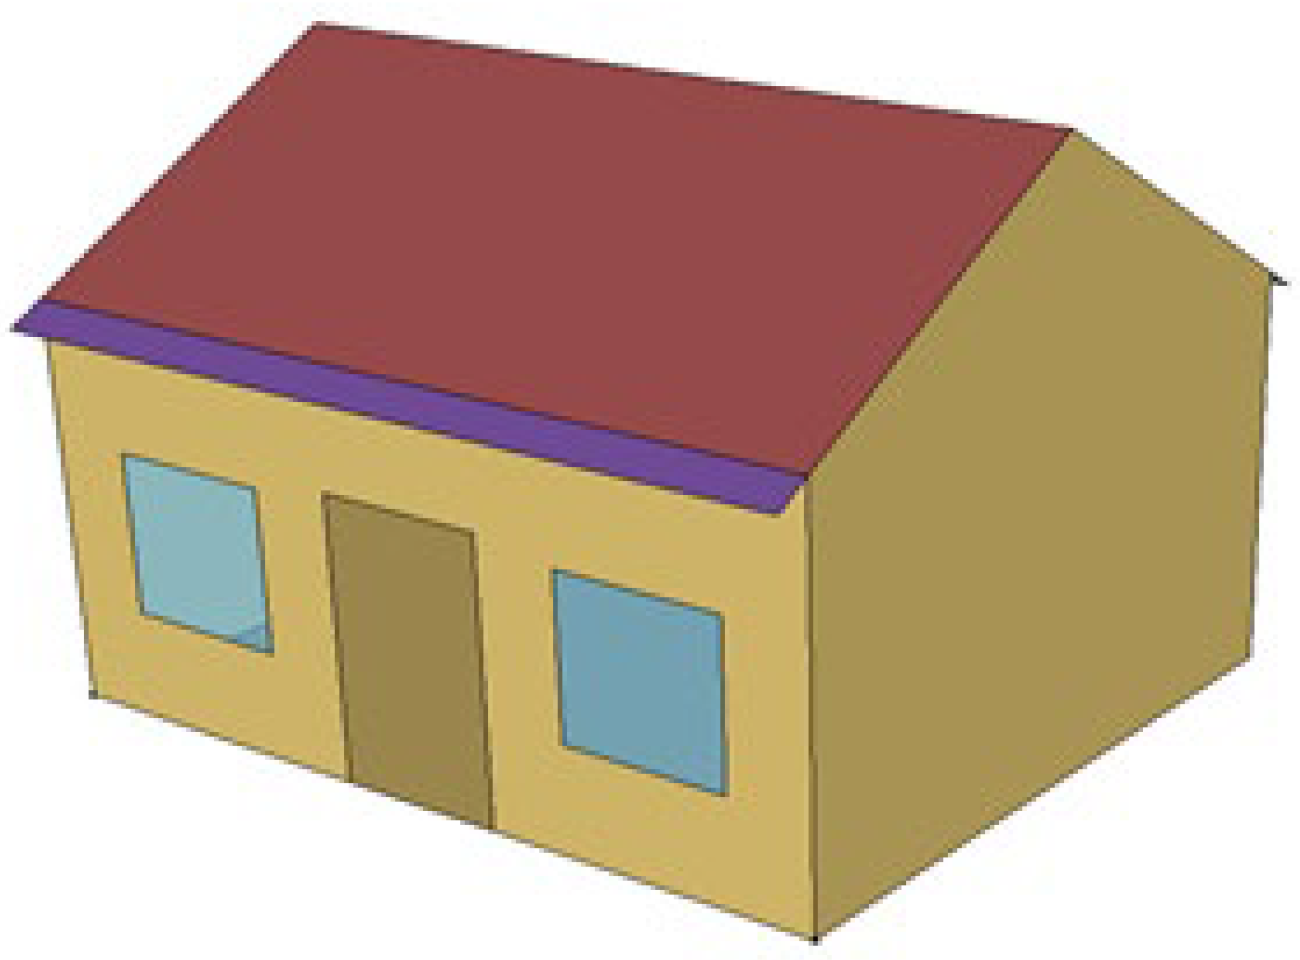
This device is primarily designed for small-scale solar water heating systems in buildings. A small wooden building model in Inner Mongolia, China is shown in Figure A2 in Appendix A. Energyplus software was used to simulate and calculate the unit area heat load of the building under the coldest design condition, which was determined to be 22.56 W/m2. The heating area of the designed device is 15 m2, and the device provides heat for 12 h. The calculated heating capacity of the device is 4.06 kWh [27].
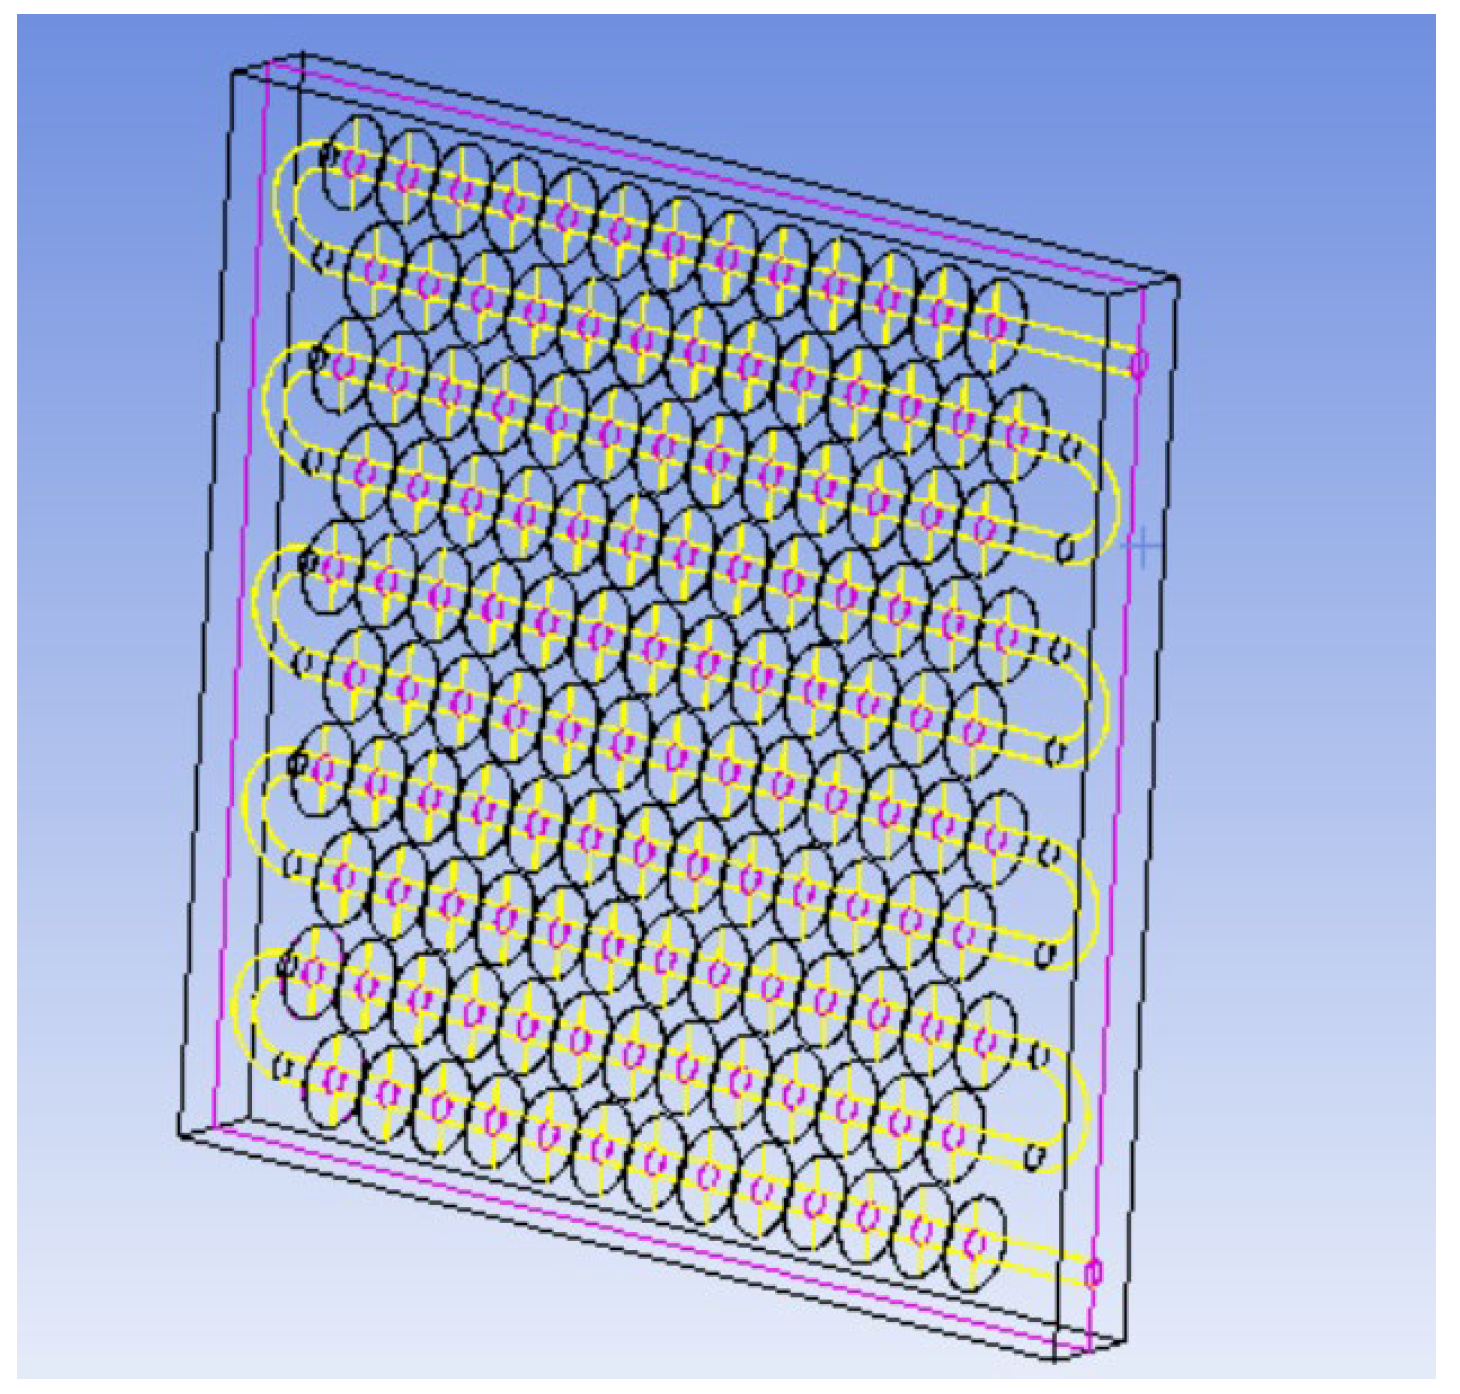
The physical model diagram of the phase-change TES device studied in this paper is shown in Figure 1. The physical model of the device mainly consists of a metal coil with fins and a square box outside the device. The internal space of the box is 820 mm long, 290 mm wide, and 800 mm high. There is one group of serpentines with fins inside the box, and each group of coils is composed of 10 straight pipes with a length of 700 mm, 9 semicircular pipes with a radius of 38 mm, and inlet and outlet pipes. The fin thickness is 1 mm, and the fin spacing is 50 mm. The heat transfer fluid enters from the top of the coil and exits from the bottom.
Due to the extremely complex phase-change process, the heat storage calculation process of the device is simplified by the following assumptions to reduce the computation time:
(1)
The outer wall of the device box has good insulation properties, and the heat loss of the phase-change device is ignored.
(2)
The PCM is isotropic, and the physical parameters of the solid and liquid phases are constant and do not change with temperature.
(3)
Natural convection heat transfer between liquid PCMs is considered by introducing the Boussinesq assumption.
(4)
The heat transfer fluid is an incompressible Newtonian fluid.
(5)
Axial heat conduction and viscous dissipation in the heat transfer fluid are neglected.
(6)
Since the flow and heat transfer of water in the finned tube are axisymmetric, the phase-change device can be simplified to a two-dimensional model.

2.2. Control Equation

Based on the above assumptions, a transient two-dimensional control equation is established to describe the phase change region. The continuity equation is used to describe the law of density change of the fluid, which states that the net mass inflow into a certain control volume per unit of time is equal to the increase in mass of the control volume during that time [9]. In a Cartesian coordinate system, its differential form is as follows:
ρ τ + ( ρ u ) x + ( ρ v ) y = 0
Here, ρ represents fluid density, τ denotes time in seconds (s), u represents the x-component of the velocity vector in meters per second (m/s), and v represents the y-component of the velocity vector in meters per second (m/s).
u x + v y = 0
The momentum conservation equation is used to describe the momentum equation of viscous incompressible fluids, which states that the rate of change of the total momentum of a control volume microelement in a unit of time is equal to the sum of all external forces acting on the microelement control volume during that time [16]. In the Cartesian coordinate system, its differential form is expressed as follows:
ρ ( u τ + u u x + v u y ) = f x + μ ( 2 u x 2 + 2 u y 2 ) P x
ρ ( v τ + u v x + v v y ) = f y + μ ( 2 v x 2 + 2 v y 2 ) P y
Here, f x and f y represent the components of the volume force in the x and y directions, respectively, in units of Pa; μ represents the dynamic viscosity coefficient in units of N·s/m2; P represents the pressure, in units of Pa.
The energy equation is the differential form of the first law of thermodynamics, which is a fundamental equation for analyzing flow systems with heat exchange. It describes the rate of change of the total energy of a control volume element over a unit of time, equal to the sum of the net rates of energy transfer in and out of the element, and the impact of surface and body forces on the element [16]. In rectangular coordinates, its differential form is expressed as follows:
( ρ T ) τ + d i v ( ρ ν T ) = d i v ( λ C P g r a d T ) + S T
Here, T denotes the temperature in Kelvin (K), λ represents the thermal conductivity of the fluid in units of W/(m·K), C P is the specific heat capacity at constant pressure in units of J/(kg·K), and S T stands for the source term.
The governing equations for the enthalpy-based model in this study are given as follows [9]:
d d t V   ρ h d V + S   ρ h d A = S   λ T d A + V   q d V  
Here, h represents the enthalpy of PCM in kJ/kg, ρ represents the density of PCM in kg/m3, and λ represents the thermal conductivity of PCM in W/(m·K).
When the specific heat of the solid–liquid phase of the PCM is constant, the relationship between temperature and enthalpy is as follows [15]:
h = h s + L
h = h r e f + T r e f T C P d T
Here, L represents the latent heat of the phase change material, measured in kJ/kg, T r e f represents the reference temperature, measured in K, and h r e f represents the enthalpy of the phase change material at the reference temperature, measured in kJ/kg.

2.3. Numerical Simulation

A 2D model of a phase-change TES device was established using DesignModeler in ANSYS Workbench software for simulation. The model was then imported into the Meshing module for grid generation. Mesh selection is a prerequisite for numerical calculations and one of the decisive factors affecting the computational efficiency and accuracy of the results [28]. Mesh selection should consider factors such as the type of physical problem and computational efficiency and should follow the following two principles [29]: (1) save computation time while ensuring accuracy; (2) select several sets of meshes with different densities for comparison to obtaining mesh-independent solutions.
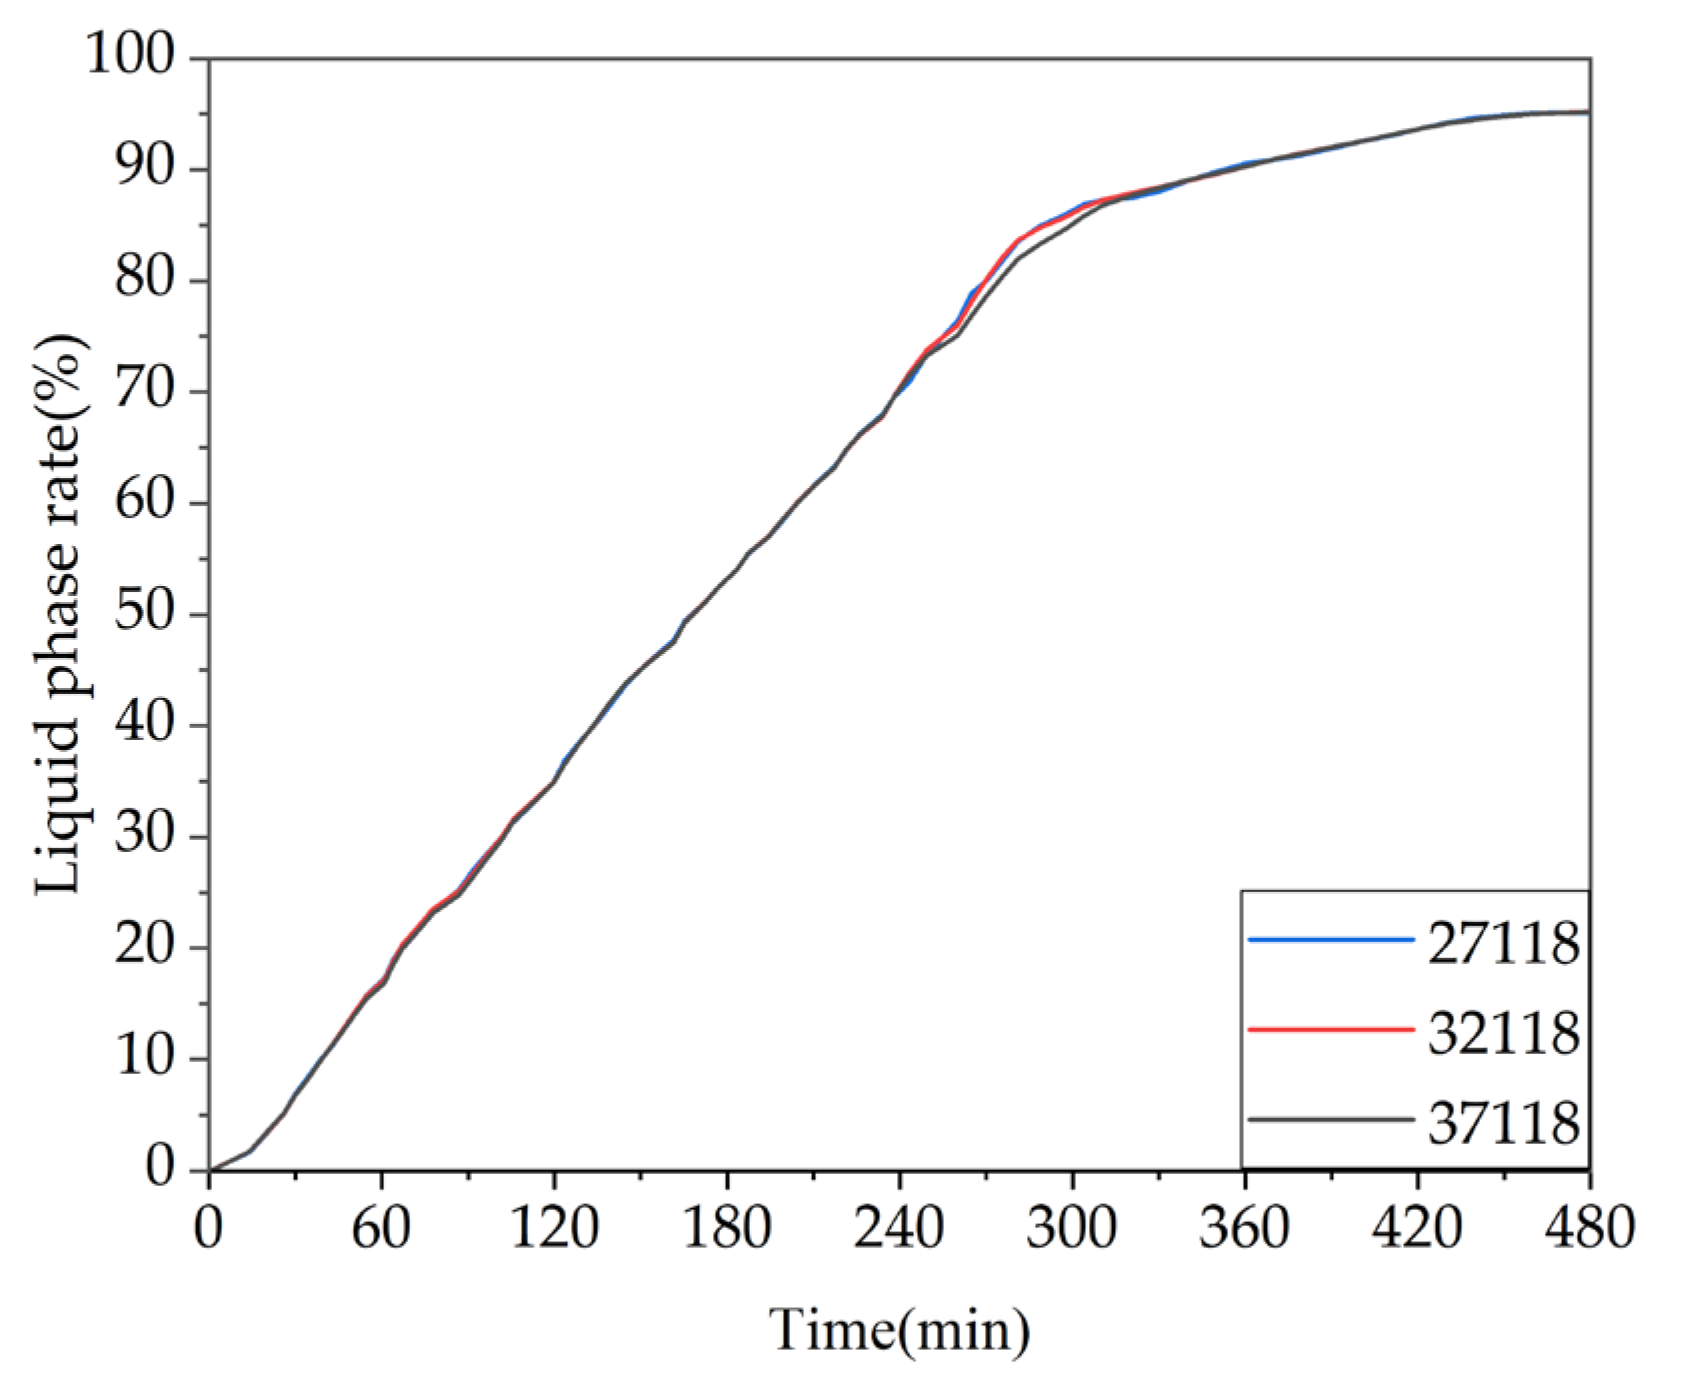
The results of the grid independence test can be found in Figure A2 in Appendix A. It can be seen that, under the same operating conditions, the simulation results of the three grid models with different numbers of grids almost overlap. To balance computational accuracy and speed, this study chose the grid model with 32118 grids, as shown in Figure 2. The model was then imported into the FLUENT software for simulation, which is based on enthalpy–porosity and finite volume methods [9].

2.4. Indicators

The liquid fraction, denoted as β, is defined as the percentage of liquid substance in the entire control volume and is calculated using Equation (9) [30]. In the liquid mixing region, the liquid fraction ranges from 0 to 1. If the phase-change material completely solidifies, the liquid fraction is 0, while if it completely melts into the liquid state, the liquid fraction is 1.
β = {   0 ,     T T s T T s T l T s , 1 ,     T T l     T s < T < T l
T s represents the solid-phase line temperature of the PCM, expressed in Kelvin (K). T l represents the liquid phase line temperature of the PCM, expressed in Kelvin (K).
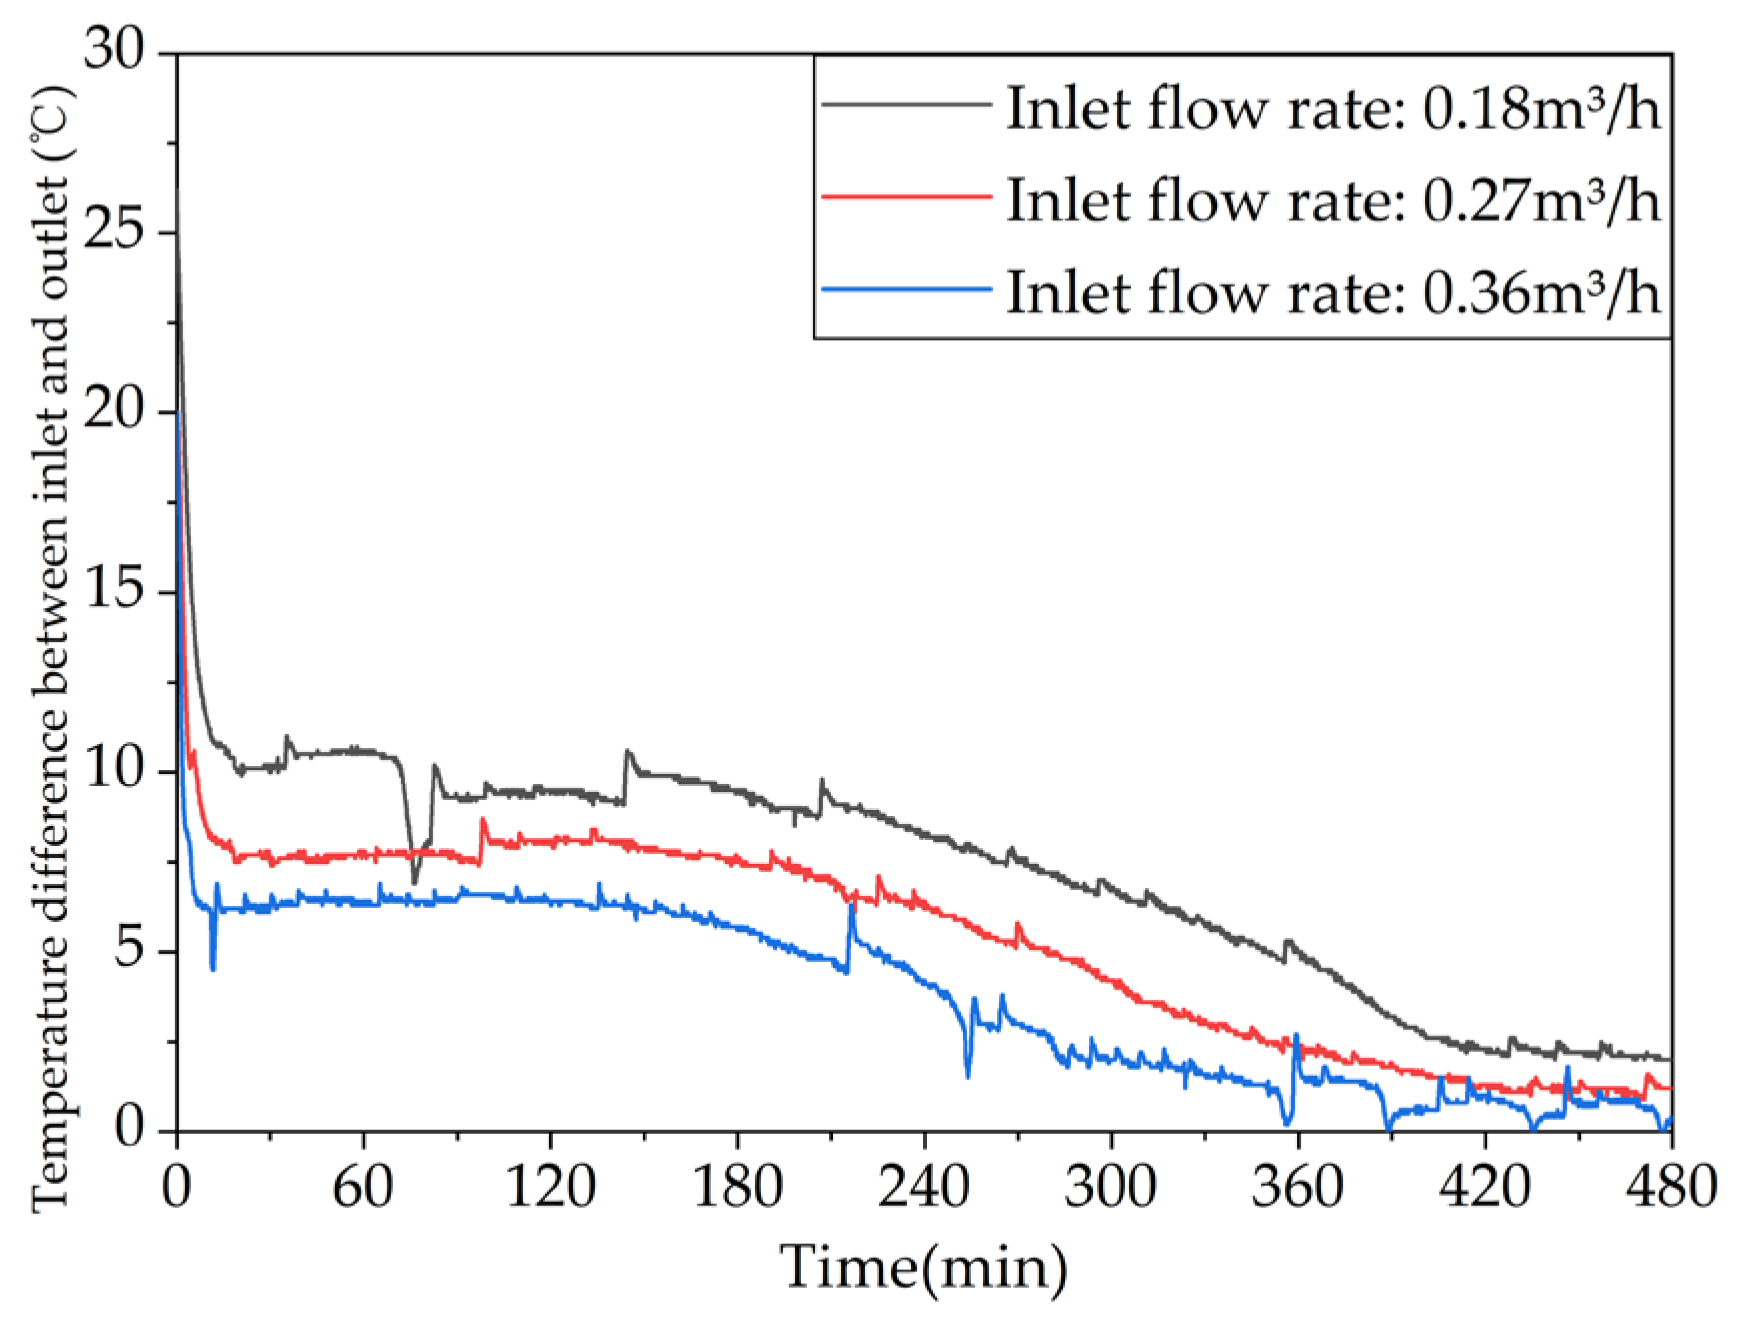
The energy storage performance of the phase-change TES system determines the amount of usable energy during the night. The evaluation indicators for the energy storage process mainly include the inlet and outlet water temperature difference, the total amount of stored heat, and the average stored heat power.
Q x = t 1 t 2 ρ c p V ( T i n T o u t ) d t 3600
P x ¯ = Q x t 2 t 1
Here, Q x represents the stored heat capacity of the device in kJ, P x ¯ represents the average stored heat power in kW, t 1 is the start time of the energy storage process in seconds, t 2 is the end time of the energy storage process in seconds, ρ is the density of water in kg/m³ (assumed as 1000 kg/m³), c p is the specific heat capacity of water at constant pressure in kJ/(kg·K) (taken as 4.2 kJ/(kg·K)), V is the flow rate of the inlet water in m³/h, T i n is the inlet temperature of the device in °C, and T o u t is the outlet temperature of the device in °C.
The heat release performance of the phase-change TES system determines the energy utilization efficiency on the demand side. The evaluation indicators for the heat release process mainly include the inlet and outlet water temperature difference, effective heat release time, effective heat release efficiency, and heat release power. Among them, the effective heat release efficiency is defined as the ratio of the energy content in the water discharged from the TES during the effective heat release time to the stored heat energy in the TES at the beginning of the heat release process.
Q s = t 1 t 2 ρ c p V ( T o u t T i n ) d t 3600
η = Q s Q x
Here, Q s represents the heat released by the device, measured in kJ; η denotes the effective energy release efficiency; and t 1 and t 2 represent the start and end times of the heat release process, measured in seconds.
The formula for calculating the instantaneous heat release power is as follows:
P = ρ c p V ( T o u t T i n ) 3600
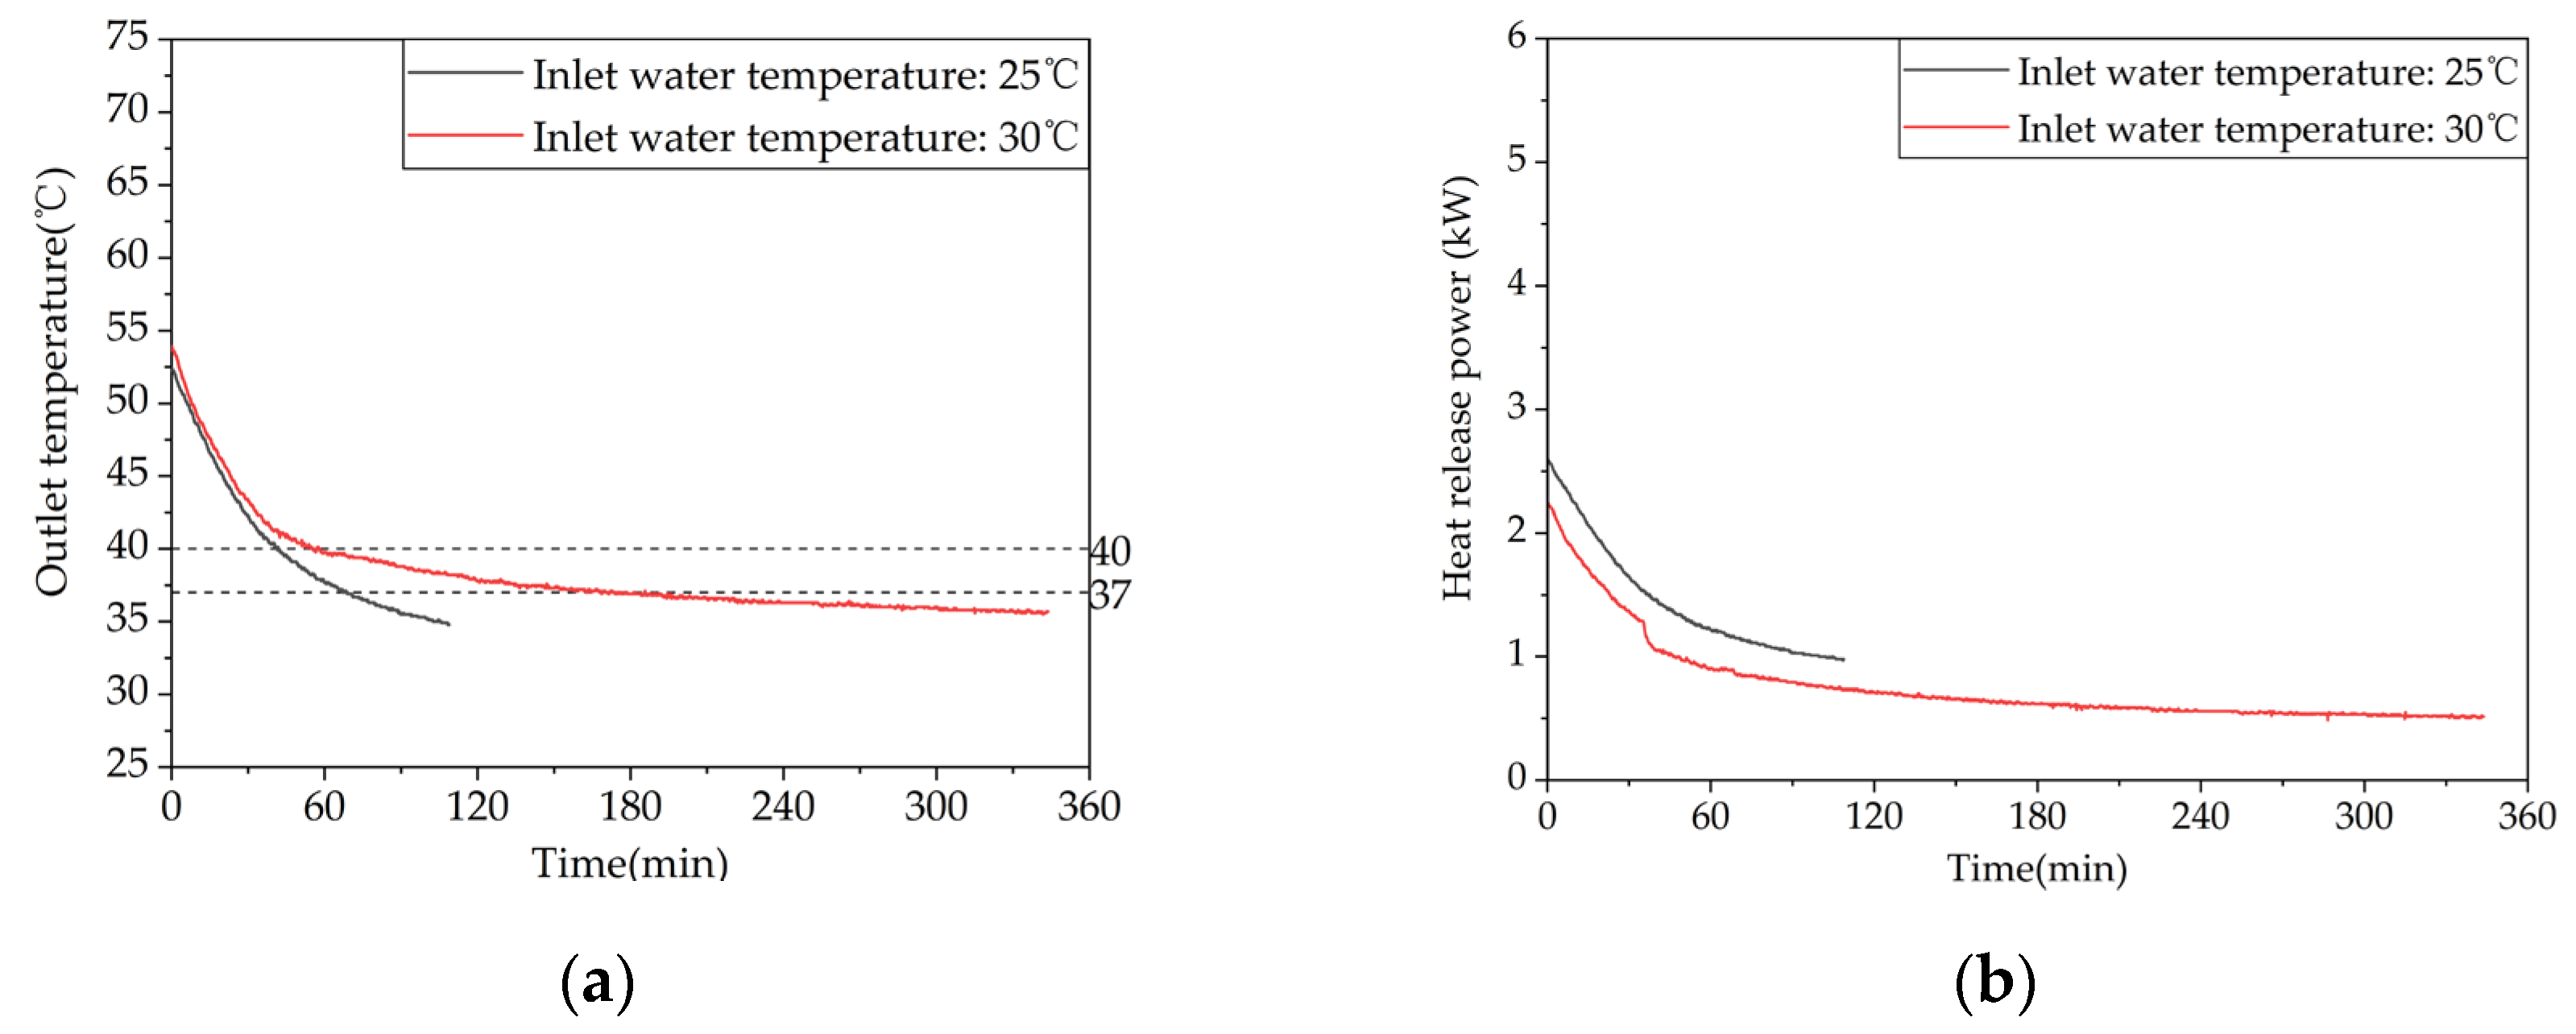
The heat release conditions considered in this paper are classified into two types: effective heat release occurs when the device releases heat for heating and its heat release power is higher than the building heat load (P ≥ 0.338 kW). According to the Standard, the recommended water temperature for shower use is 37–40 °C, while for washbasin spout use it is 30 °C. Additionally, the maximum daily water consumption quota per person per day is 4080 L. Therefore, when the device releases heat for a domestic hot water supply, an outlet water temperature higher than 37 °C ( T o u t   ≥ 37 °C) is considered effective for showering; for a domestic hot water outlet, a water temperature higher than 30 °C ( T o u t   ≥ 30 °C) is considered effective. This paper particularly emphasizes the heat release of the device when the outlet water temperature exceeds 37 °C.

3. Experimental Verification

3.1. Experimental Purpose and Principle

The purpose of building a performance testing experimental platform for the latent heat storage device is twofold: firstly, to verify the accuracy of numerical simulation and lay a foundation for the optimization of phasechange heat storage devices through simulation research; secondly, to investigate the effects of different factors, such as inlet water temperature, inlet flow rate, heat storage and release mode, and initial temperature on the device’s heat storage and release performance. This aims to explore the influencing factors of the device’s heat storage and release performance and provide references for the practical application of phase change heat storage devices. Due to limitations in the experimental site and conditions, an electric boiler was used to simulate the solar collector outlet water and user heating return water, and a chiller was used to simulate the cold water replenishment for domestic hot water. As shown in Figure 3, a performance testing experimental platform for phase change heat storage devices was built to conduct experiments on the heat storage and release performance of the device.
The experimental system principle is illustrated in Figure 4, the symbols 1–11 in the figure represent valvesDuring the charging process, hot water flows from the electric boiler into the phase change heat storage device for heat exchange, passes through the water pump, and then returns to the electric boiler for reheating. During the discharging process, the electric boiler or the chiller provides low-temperature water at a specified temperature, which flows into the phasechange heat storage device to absorb heat and raise the water temperature. The temperatures at different measurement points within the device and the inlet and outlet water temperatures are recorded under different conditions using a data logger.

3.2. Experimental Apparatus

The internal structure of the phase-change device is shown in Figure 5, consisting of a heat storage box, finned coils, and electric heating plates with the main parameters listed in Table 1. The equipment used in the experiment and their technical specifications are detailed in Table 2. During the charging process, hot water exchanges heat with the PCM as it flows through the device, and then it is reheated in the electric boiler after passing through a pump. During discharging, low-temperature water from the electric boiler or chiller enters the device, absorbs the heat released by the PCM, and then exits at a higher temperature. The temperature of the PCM inside the device can reflect the process of heat storage and release in the phase-change device, while the temperature difference between the inlet and outlet of the device can reflect the heat storage and release effect of the phase-change device. Therefore, the focus of this experiment is to measure the temperature of the PCM inside the device and the inlet and outlet water temperatures of the device. As the water flows into the device from the top and exits from the bottom, there are temperature differences at different heights inside the device, and the structure at different positions in the same horizontal direction is not identical, resulting in different heat transfer effects. Therefore, 21 measurement points are arranged at different positions inside the device to detect temperature changes. The specific arrangement of the measuring points is shown in Figure 6. Temperatures at different points inside and at the inlet and outlet of the device are recorded by a data acquisition system consisting of K-type thermocouples, a data logger, and MX-100 Standard software on a PC. The temperature readings are displayed and recorded in real time by the software.

3.3. PCM

The present study focuses on the application of a PCM in a solar thermal system for providing space heating and domestic hot water in residential buildings. To meet the operational requirements of the system, a commercially available PCM produced by Hubei Saimo, China New Energy Technology Co., Ltd. in China with a phase-change temperature range of 45–50 °C is selected. Figure 7 shows its DSC performance test chart (DSC data provided by the company): the PCM exhibits a high energy storage density, small undercooling, and good thermal stability. The melting onset, peak, and end temperatures are 46.1, 50.5, and 52.7 °C, respectively, with a melting enthalpy of 238.2 kJ/kg, while the solidification onset, peak, and end temperatures are 36.9, 44.8, and 48.1 °C, respectively, with a solidification enthalpy of 236.9 kJ/kg.

3.4. Experimental Design

To investigate the effects of inlet temperature, inlet flow rate, and device temperature on the heat storage and release performance of the device, this experiment set different operating condition parameters for the heat storage, heating release, and domestic hot water release, and the specific schemes are shown in Table 3 and Table 4.
During the experiment, the data were recorded using a data collector and the change in the temperature of the measurement points on the PC was observed. The test was considered to be complete when the temperature of the measurement points in the device remained stable around the inlet temperature or when the heat storage time was up to 8 h, the heating heat release time was up to 14 h, and the outlet temperature was below 35 °C in the domestic hot water heat release operation.

4. Results and Discussion

4.1. Numerical Simulation and Experimental Results Comparison and Validation

To verify the agreement between experimental and simulation results, Figure 8 compares the measured and simulated temperatures at measuring points 13 and 17 under 2 thermal storage conditions. The average relative errors between the simulated and experimental values at measuring points for the charging process (a) were 2.69% and 6.24%, respectively, while for the charging process (b) they were 3.13% and 5.86%, respectively. Overall, the experimental and simulated values showed good agreement. There could be two reasons for the errors: (1) the simplification assumptions made during the numerical simulation calculation and the neglect of heat loss in the phase-change device and (2) the fluctuation in the outlet water temperature of the electric boiler and the chiller during the experiment, while the outlet water temperature in the simulation was constant, which resulted in errors.

4.2. Heat Storage and Release Characteristics of Phase-change Thermal Storage Device

Figure 9a–c illustrate the temperature variation trends of 21 internal measuring points within the device over time, under different operating conditions, including heat storage, heat release, and domestic hot water heat release conditions. To facilitate the observation of the storage and release heat power, six representative measuring points are selected for analysis and plotted in the phase-change heat storage apparatus. Measuring points 1 and 9 correspond to the most and least favorable heat transfer points of coil group 1, respectively. Measuring point 11 is the center point of coil group 2 and also the center point of the phase-change heat storage apparatus. Measuring points 13, 17, and 21 correspond to the most favorable, center, and least favorable heat transfer points of coil group 3, respectively. Therefore, representative measuring points are selected for comparison under different operating conditions in subsequent sections.
Figure 9a depicts the evolution in TES temperature at different positions within the apparatus. Three dashed lines indicate the beginning, peak, and end temperatures of the phase-change material (PCM) melting process. The figure demonstrates that the PCM TES process can be categorized into three distinct stages: (i) an initial stage, during which the PCM is in a sensible heat storage state and has not undergone any phase change—at this stage, the temperature rises relatively fast due to the large temperature difference between the inlet water and the PCM, and the heat transfer occurs mainly through conduction; (ii) a middle stage, during which the PCM undergoes a phase change and is in a latent heat storage state, resulting in a considerably reduced temperature rise rate—at this stage, the PCM close to the tube wall and fins melts first due to the density difference, causing the liquid PCM to rise and solid PCM to sink, resulting in natural convection as the predominant heat transfer mechanism; and (iii) a late stage, during which the PCM completes the phase-change process and enters another sensible heat storage stage, resulting in a significantly increased temperature rise rate. As the temperature difference between the PCM and the inlet water is smaller during this stage, the heat transfer mechanism is mainly conduction, but the temperature rise rate is slower than that in the initial stage. Additionally, the temperature curves of some measuring points exhibit fluctuations at the end of melting and during the transition back to the initial sensible heat storage stage due to the coexistence of melted and solid PCM in the vicinity of these points, resulting in heat and mass transfer phenomena. Moreover, periodic fluctuations in the inlet water temperature caused by the 2°C hysteresis of the electric boiler can also cause fluctuations in the temperature measurements at the measuring points within the apparatus.
The temperature variation patterns in Figure 9b,c are similar, and their causes are similar to those in (a). It is worth noting that the temperature drop rate at each measuring point during the hot water release process decreases as the inlet flow rate increases. At the end of the release process, the temperature at each measuring point decreases as the inlet flow rate increases, which is different from the heat release process during heating.
Comparing different operating conditions in the experiment, this study analyzes the influence of factors such as inlet temperature, inlet flow rate, and device temperature on the heat storage and release performance of the device.

4.3. Inlet Temperature

4.3.1. Heat Storage Performance

To investigate the effect of storage temperature on the heat storage performance of a phase-change thermal storage device, experiments were conducted under three different inflow temperatures of 58 °C, 63 °C, and 68 °C with a controlled inflow rate of 0.27 m³/h, corresponding to test conditions 1–3 in Table 3. The temperature variations inside the device for the three storage conditions are shown in Figure 10. When the inflow temperature was increased from 58 °C to 63 °C, the duration of the storage phase at measuring points 13, 17, and 21 decreased by 44%, 33.9%, and 30.4%, respectively. Similarly, when the inflow temperature was increased from 63 °C to 68 °C, the duration of the storage phase at these points decreased by 24.6%, 29.7%, and 24.4%, respectively. When the inflow temperature was increased from 58 °C to 68 °C, the duration of the storage phase at these points decreased by 57.8%, 53.6%, and 47.4%, respectively. Thus, increasing the inflow temperature can significantly enhance the storage performance, especially at lower storage temperatures.
Figure 11 shows the variation in the temperature difference between the inlet and outlet of the device with time at different inlet temperatures. As can be seen from the figure, at the beginning of the charging process, the temperature differences between the inlet and outlet of the three working conditions were 11.1 °C, 7.4 °C, and 19.7 °C, respectively. At the end of the charging process, the temperature differences were reduced to 2.9 °C, 1.8 °C, and 1.2 °C, respectively. Therefore, as the inlet temperature increases, the thermal storage performance of the device is improved and more heat is stored in the phase-change material, resulting in a gradual decrease in the temperature difference between the inlet and outlet. As can be seen from Table A1 in Appendix A, the increase in inlet water temperature from 58 °C to 58 °C or 63 °C resulted in a 29.47% or 46.60% increase in the amount of heat stored in the unit, respectively.

4.3.2. Heat Release Performance of Heating

To investigate the influence of inlet water temperature on the heating performance of phase-change heating systems, heating performance tests were conducted under three different inlet water temperatures, namely, 25 °C, 30 °C, and 35 °C, with a constant flow rate of 0.27 m³/h. The corresponding heating conditions are labeled as test conditions 7–9 in Table 4. The temperature changes inside the phase-change device at different locations for the three storage heating conditions are shown in Figure 12. It can be seen from the figure that as the inlet water temperature increased from 25 °C to 30 °C the time taken for measurement points 13, 17, and 21 to reach the end of the heat release temperature was extended by 94.9%, 77.2%, and 46.1%, respectively. When the inlet water temperature was further increased from 30 °C to 35 °C, the time taken for these measurement points to reach the end of the heat release temperature was extended by 46.6%, 21.2%, and 32.3%, respectively. When the inlet water temperature was increased from 25 °C to 35 °C, the time taken for these measurement points to reach the end of the heat release temperature was 2.86 times, 2.15 times, and 1.93 times longer than the original time, respectively. Therefore, increasing the inlet water temperature can significantly prolong the heat release duration of the device. In addition, as the distance between the measurement points and the inlet of the thermal fluid increased, the start time of the phase change gradually shortened due to the poorer heat transfer effect at measurement points that were farther away from the inlet during the heat storage phase. As a result, the time taken for these measurement points to reach the end of the heat release temperature gradually increased because increasing the inlet water temperature reduced the temperature difference between the PCM and the inlet water, thereby weakening the heat transfer effect.
Figure 13 shows the variations in the temperature difference at the inlet and outlet of the system and the instantaneous heat release rate as a function of time for different inlet water temperatures. The instantaneous heat release rates at the initial stage of heat release exhibit significant differences among the three operating conditions, with higher inlet water temperatures leading to lower heat release rates. As the heat release process progresses, the heat release rates gradually decrease and the differences among the three operating conditions become smaller. These results indicate that although increasing the inlet water temperature can prolong the heat release time of the device it can also weaken the heat release effect relatively. The heat release capacities for the three operating conditions are shown in Table A2 in Appendix A. Appropriately increasing the inlet water temperature can help to extend the effective heat release time, but it will simultaneously reduce the effective heat release amount and efficiency of the device. When the inlet water temperature is reduced from 35 °C to 30 °C or 25 °C, the effective heat release amounts of the device increase by 43.23% or 57.17%.

4.3.3. Heat Release Performance of Domestic Hot Water

To investigate the effect of inlet water temperature on the heat release performance of a phase change storage device for domestic hot water, experiments were conducted on the heat release conditions of domestic hot water at inlet temperatures of 25 °C and 30 °C, with a controlled inlet flow rate of 0.08 m³/h. Figure 14 shows the temperature trend of heat release at different measurement points inside the phase change storage device over time. The results indicate that when the inlet water temperature was increased from 25 °C to 30 °C the time taken for measurement point 1 to start phase change was prolonged by 18.2%, i.e., from 66 min to 77 min. Thus, it can be concluded that raising the inlet water temperature can effectively prolong the heat release time.
Figure 15 shows the variations in outlet water temperature and instantaneous heat release power of the device over time at different inlet water temperatures. As shown in Figure 15a, the trends of outlet water temperature changes are consistent for the two working conditions. The outlet water temperature decreases gradually with increases in heat exchange time, and the rate of temperature drop decreases gradually. From Table A3 in Appendix A, the effective heat release durations of the two working conditions are 69 min and 186 min, respectively, providing 92 L and 248 L of hot water above 37 °C. The trends of instantaneous heat release power for both working conditions are consistent, as shown in Figure 15b, with a rapid initial decrease rate followed by a gradual slowing. The instantaneous heat release power decreases with increasing temperatures. The effective heat release amounts are 6905 kJ and 10,491 kJ, respectively. Therefore, it is evident that increasing the inlet water temperature can significantly increase the effective heat release duration and the effective heat release amount of the device. When the make-up water temperature is raised from 25 °C to 30 °C, the effective heat release amount of the device increases by 35.23%.

4.4. Inlet Flow Rate

4.4.1. Heat Storage Performance

Figure 16 shows a comparative analysis of the temperature difference rise for test conditions 4, 3, and 6 at typical locations on the same row of pipes. The results reveal that the start time of the phase change increases with the distance between the measurement point and the thermal fluid inlet, while it decreases with an increasing flow rate. When the heat storage inlet flow rate is increased from 0.18 m³/h to 0.27 m³/h, the storage start time at points 13, 17, and 21 decreases by 6.1%, 8.8%, and 15.9%, respectively. Similarly, when the heat storage inlet flow rate is further increased from 0.27 m³/h to 0.36 m³/h, the storage start time at points 13, 17, and 21 decreases by 15.2%, 13.5%, and 17.8%, respectively. Furthermore, when the heat storage inlet flow rate is increased from 0.18 m³/h to 0.36 m³/h, the storage start time at points 13, 17, and 21 decreases by 20.4%, 21.1%, and 30.8%, respectively. These results indicate that increasing the inlet flow rate can enhance the heat storage performance, although its effect on improving the heat storage rate is limited compared to increasing the inlet water temperature.
Figure 17 shows the variation in the temperature difference between the inlet and outlet of the system with time for different inlet water flow rates. As depicted in the figure, the temperature differences at the end of the charging process for the three operating conditions are 2.0 °C, 1.2 °C, and 0.4 °C, respectively. With an increase in the inlet water flow rate, the temperature difference gradually decreases. This is because the increased flow rate leads to a shorter time for the hot water to enter and exit the system, resulting in a shorter time for the heat exchange between the phase-change material and the fluid. As can be seen from Table A1 in Appendix A, when the flow rate is increased from 0.18 m³/h to 0.27 m³/h or 0.36 m³/h the heat storage capacity of the unit is only increased by 9.26% or 4.66% Therefore, increasing the inlet water flow rate can increase the heat storage capacity of the unit, but the effect is limited.

4.4.2. Heat Release Performance of Heating

Figure 18 shows a comparative analysis of the temperature difference rise for test conditions 10, 8, and 11 at typical locations on the same row of pipes. From the figure, it can be seen that the starting times of the phase change were almost identical for all measuring points under the three working conditions. At the end of the heat release process, the temperatures at the measuring points decreased with an increasing flow rate, but the difference was not significant. When the heat release inlet flow rate was increased from 0.18 m³/h to 0.27 m³/h, the time taken for measuring points 13, 17, and 21 to reach the heat release termination temperature was reduced by 3.2%, 7.8%, and 12.1%, respectively. When the heat release inlet flow rate was further increased from 0.27 m³/h to 0.36 m³/h, the time taken for measuring points 13, 17, and 21 to reach the heat release termination temperature was reduced by 2.8%, 2.2%, and 0.3%, respectively. When the heat release inlet flow rate was increased from 0.18 m³/h to 0.36 m³/h, the time taken for measuring points 13, 17, and 21 to reach the heat release termination temperature was reduced by 5.9%, 9.8%, and 12.4%, respectively. These results suggest that increasing the inlet flow rate has a limited effect on improving the heat release efficiency of the system.
Figure 19 shows the variation trends of the device’s inlet–outlet temperature difference and instantaneous heat release power over time at different inlet water flow rates. As shown in Figure 19a, the inlet–outlet water temperature differences of the three working conditions at the end of heat release are 1.4 °C, 1.0 °C, and 0.9 °C, respectively, indicating that the inlet–outlet water temperature difference decreases gradually with increases in the inlet water flow rate. This is because the increased inlet water flow rate leads to a shorter time for hot water to enter and exit the device and a shorter time for heat exchange between the heat-carrying fluid and the phase-change material, resulting in a lower outlet water temperature. The inlet–outlet water temperature differences of working conditions 10 and 8 are very close, indicating that increasing the flow rate has limited improvement on the device’s heat release performance. As shown in Figure 19b, the instantaneous heat release power curves of the three working conditions are very close, and the instantaneous heat release power of working condition 11 with the highest inlet water flow rate is slightly higher than the other two working conditions. As can be seen from Table A2 in Appendix A, when the heat release rate is 0.36 m³/h the instantaneous heat release power of the device is still greater than the room’s heat load at the end of the heat release experiment, so its effective heat release time is greater than 50,400 s, the effective heat release amount is greater than 37,554 kJ, and the effective heat release efficiency is greater than 78.23%. When the heat release rate is increased from 0.18 m³/h to 0.27 m³/h, the effective heat release amount of the device only increases by 8.56%. Therefore, increasing the inlet water flow rate helps to improve the effective heat release amount and efficiency of the device; at the same time, it prolongs the effective heat release time, but the improvement effect is relatively limited.

4.4.3. Heat Release Performance of Domestic Hot Water

Figure 20 shows the variation in temperature at different measurement points inside the phase-change TES unit with time, under different inlet water flow rates. When the inlet water flow rate is 0.05 m³/h, measurement point 1 starts to undergo phase change 78 min after the onset of heat release. When the inlet water flow rate is 0.08 m³/h, measurement point 1 starts to undergo a phase change 66 min after the onset of heat release. When the inlet water flow rate is 0.11 m³/h, measurement point 1 starts to undergo phase change 66 min after the onset of heat release. Increasing the inlet water flow rate from 0.05 m³/h to 0.08 m³/h shortens the duration of the phase change at measurement point 1 by 15.4%, indicating that increasing the inlet water flow rate can accelerate the heat release process, but its effectiveness is limited.
Figure 21 shows the variations in the outlet water temperature and instantaneous heat release power with time at different inlet water flow rates. As shown in Figure 21a, the outlet water temperature decreases gradually with increases in the heat exchange time for all three operating conditions, and the rate of temperature drop decreases gradually as well. Figure 21b shows that the trends of the heat release power curves for the three conditions are consistent, with a rapid initial decline rate and a gradual flattening in the later stage. When the inlet water flow rate decreases from 0.11 m³/h to 0.08 m³/h or 0.05 m³/h, the effective heat release amount of the device increases by 16.46% or 65.49%, respectively. Therefore, the flow rate has a significant impact on the instantaneous heat release power, which increases with the increase of the flow rate. It can also be seen that the lower the inlet water flow rate, the higher the initial outlet water temperature corresponding to the heat release, because the decrease in inlet water flow rate will increase the time for hot water to enter and exit the device and the time for the heat exchange between the hot fluid and the phase-change material, thereby increasing the outlet water temperature.

4.5. Type of Heat Storage

To investigate the influence of the type of heat storage on the heat storage performance of phase-change heat storage units, an experimental study was conducted on two heat storage conditions, i.e., conditions 5 and 6 in Table 3, with the electric heating plate set at 68 °C and the inlet water temperature controlled at 68 °C with a flow rate of 0.36 m³/h, one with the electric heating plate on and one with it off. The temperature difference between the two conditions was compared and analyzed at a typical position along the same pipeline.
As shown in Figure 22, the time required for measuring point 13 to complete the phase change above the termination temperature was 61 min and 108 min for the two conditions, respectively. For measuring point 17, it was 85 min and 130 min, and for measuring point 21, it was 106 min and 243 min. When the electric heating plate was turned on, the times for measuring points 13, 17, and 21 to complete the phase change were reduced by 43.5%, 34.6%, and 56.4%, respectively. Therefore, it is clear that turning on the electric heating plate significantly shortens the time required for the phase-change heat storage process.
Figure 23 shows the variation trend of the inlet–outlet temperature difference of the unit over time under different heat storage methods. It can be seen from the figure that it took 228 min for the temperature difference to drop below 0.5 °C in condition 5 and 474 min in condition 6, with average heat storage powers of 1.74 kW and 1.60 kW, respectively. The temperature difference decreased significantly faster with the electric heating plate turned on than with only hot water storage, as turning on the electric heating plate significantly accelerated the melting process of the phase-change heat storage unit, reducing the time for the unit to be in the latent heat storage state. The unit prioritizes completing the phase-change process before returning to the sensible heat storage state, where the heat storage effect is mainly influenced by the temperature difference between the inlet water and the unit. As the unit temperature rises, the inlet–outlet temperature difference gradually decreases.

4.6. Initial Average Temperature of the Device

Figure 24 shows a comparative analysis of the difference in temperature rise at typical locations on the same row of tubes at different initial average temperatures of the unit. It shows that the higher the initial heat release temperature, the longer the time it takes for the various measuring points inside the device to reach the end of the phase change. When the initial heat release temperature was increased from 53 °C to 58 °C, the time it took for measuring points 13, 17, and 21 to reach the heat release termination temperature was extended by 26.1%, 16.9%, and 24.7%, respectively. When the initial heat release temperature was increased from 58 °C to 63 °C, the time it took for points 13, 17, and 21 to reach the heat release termination temperature was extended by 8.9%, 7.1%, and 15.7%, respectively. When the initial heat release temperature was increased from 53 °C to 63 °C, the time it took for points 13, 17, and 21 to reach the heat release termination temperature was extended by 37.2%, 25.2%, and 44.3%, respectively. Therefore, increasing the initial heat release temperature of the device means increasing its energy storage capacity, which can extend the heat release time. However, once the temperature is raised to a certain level the improvement effect will gradually diminish.
Figure 25 shows the variation trends of the inlet–outlet temperature difference and the instantaneous heat release rate of the device with different initial temperatures. As shown in Figure 25a, increasing the initial heat release temperature leads to an increase in the inlet–outlet water temperature difference of the device, which is more significant in the early stage of heat release. This is because a higher initial temperature means that the device stores more heat. During heat release, the larger temperature difference between the device and cold water results in a better heat transfer and lower outlet temperature. As the heat release process proceeds, the phase-change material in the device gradually solidifies, and the natural convection effect weakens, causing the inlet–outlet water temperature difference to stabilize gradually. In the later stage of heat release, the variations in the inlet–outlet water temperature difference among the three working conditions are negligible, and the inlet–outlet water temperature differences of the three working conditions at the end of heat release are 0.8 °C, 0.9 °C, and 1.0 °C for conditions 7, 8, and 9, respectively. As shown in Figure 25b, the instantaneous heat release rates of the three working conditions are higher for those with higher initial temperatures during the early stage of heat release, following the same trend as the inlet–outlet temperature difference. As the heat release process proceeds, the heat release rates decrease gradually for all three conditions. From Table A3 in Appendix A, when the initial temperature of the device is increased from 53 °C to 58 °C or 63 °C the effective heat release amount of the device is increased by 11.96% or 28.22%, respectively. This indicates that increasing the initial temperature can enhance the early-stage heat release performance of the device, but overall, the improvement in the heat release performance of the device is not significant.

5. Optimizing Phase-change TES System Performance

In this section, the impact of various factors on the TES process in the system was investigated using numerical simulation, providing a theoretical basis for the structural design and practical application of phase-change TES systems.
Figure A3, Figure A4, Figure A5 and Figure A6 in Appendix A show the numerical models for the fins under different factor studies.

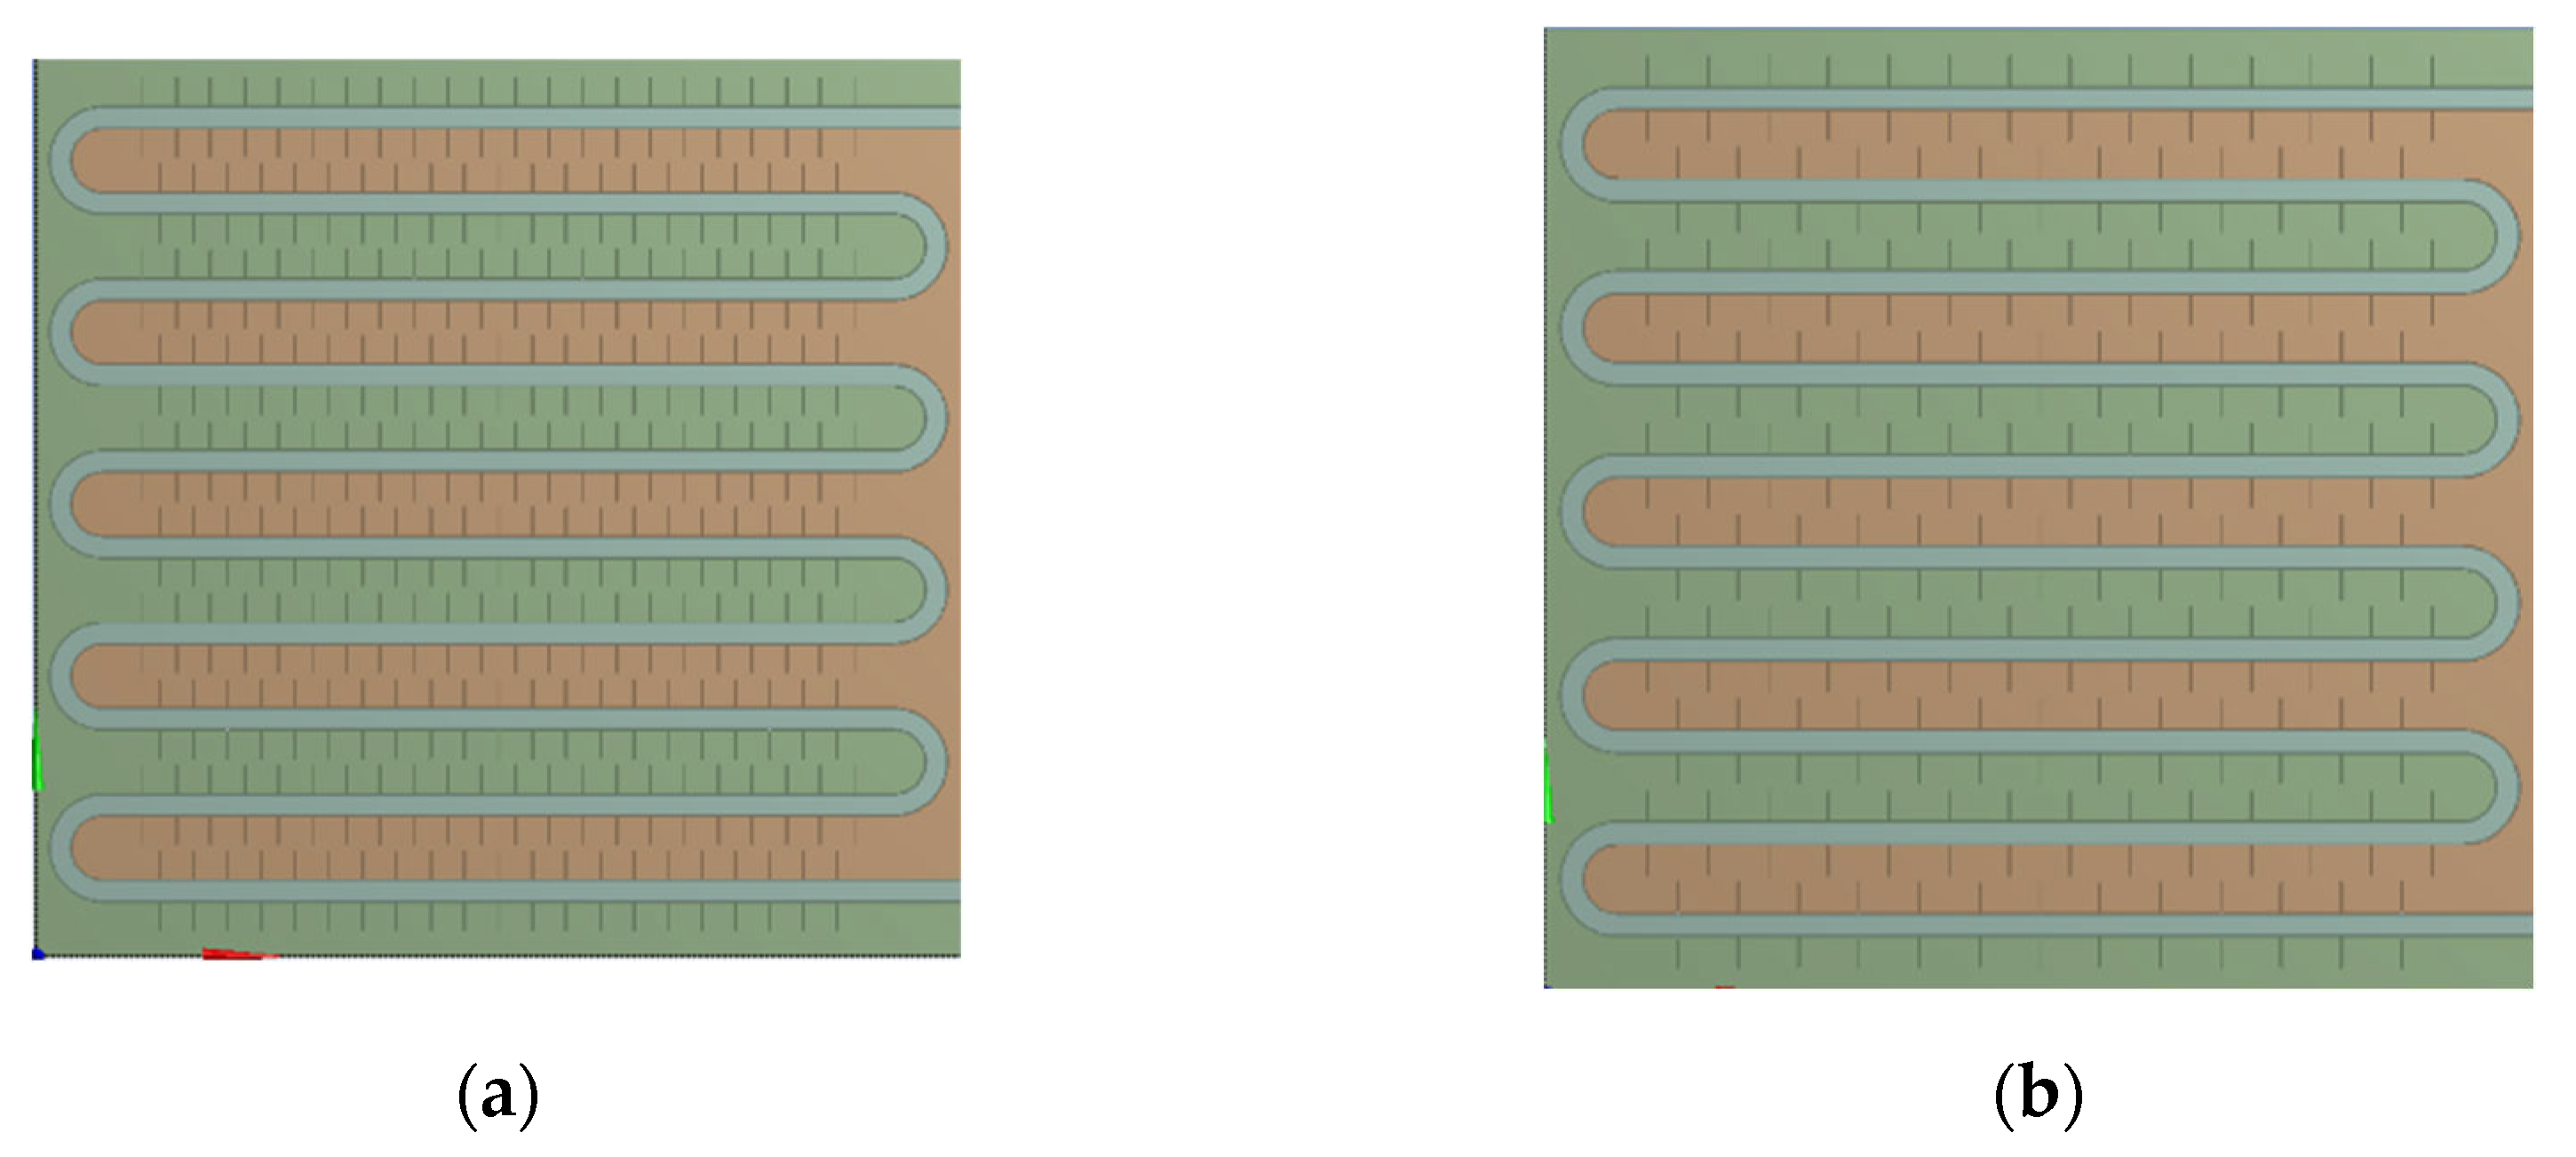
5.1. Fin Arrangements

To investigate the effect of fin arrangement on the phase-change process, simulation models with aligned fins and staggered fins were selected. As shown in Figure A3 in Appendix A, the liquid fraction and temperature distribution characteristics were analyzed at different times, and the time differences required for completing the phase-change heat storage were compared. Figure 26 shows the simulation results of the two different fin arrangements. As shown in Figure 26a, the distribution of the melting region in the device with aligned fins is different from that in the device with staggered fins. The unfused area between the coils in the device with aligned fins is circular, while in the device with staggered fins it is semicircular. However, the liquid-phase fraction of the two devices is almost the same at the same time, and both devices have a liquid-phase fraction of 0.95 at the end of the heat storage process. As shown in Figure 26b, there are several small areas with relatively low temperatures between the coils in the device with aligned fins, while the temperature distribution inside the device with staggered fins is more uniform at the same time. After 4 h of heat storage, the device with aligned fins has the highest average temperature, and the enclosed area formed by the fins and coil bends has a better heat transfer efficiency and therefore heats up faster. When the heat storage time reaches 6 h, the high-temperature area between the coils in the device with aligned fins is rectangular, while the high-temperature area between the coils in the device with staggered fins is trapezoidal with a wider upper part and a narrower lower part. The average temperature of both finned devices is around 59.7 °C. When the heat storage time reaches 8 h, the average temperatures of the two devices are 61.55 °C and 61.59 °C, respectively, and the device with staggered fins exhibits the best melting effect. Based on the entire phase-change heat storage process, it can be concluded that the melting of the PCM in the heat storage device is mainly influenced by the distance to the pipe wall and fins, and there is no significant difference in melting efficiency between devices with aligned or staggered fins. The device with staggered fins has a slightly better heat storage effect than the device with aligned fins, but the difference is not significant.
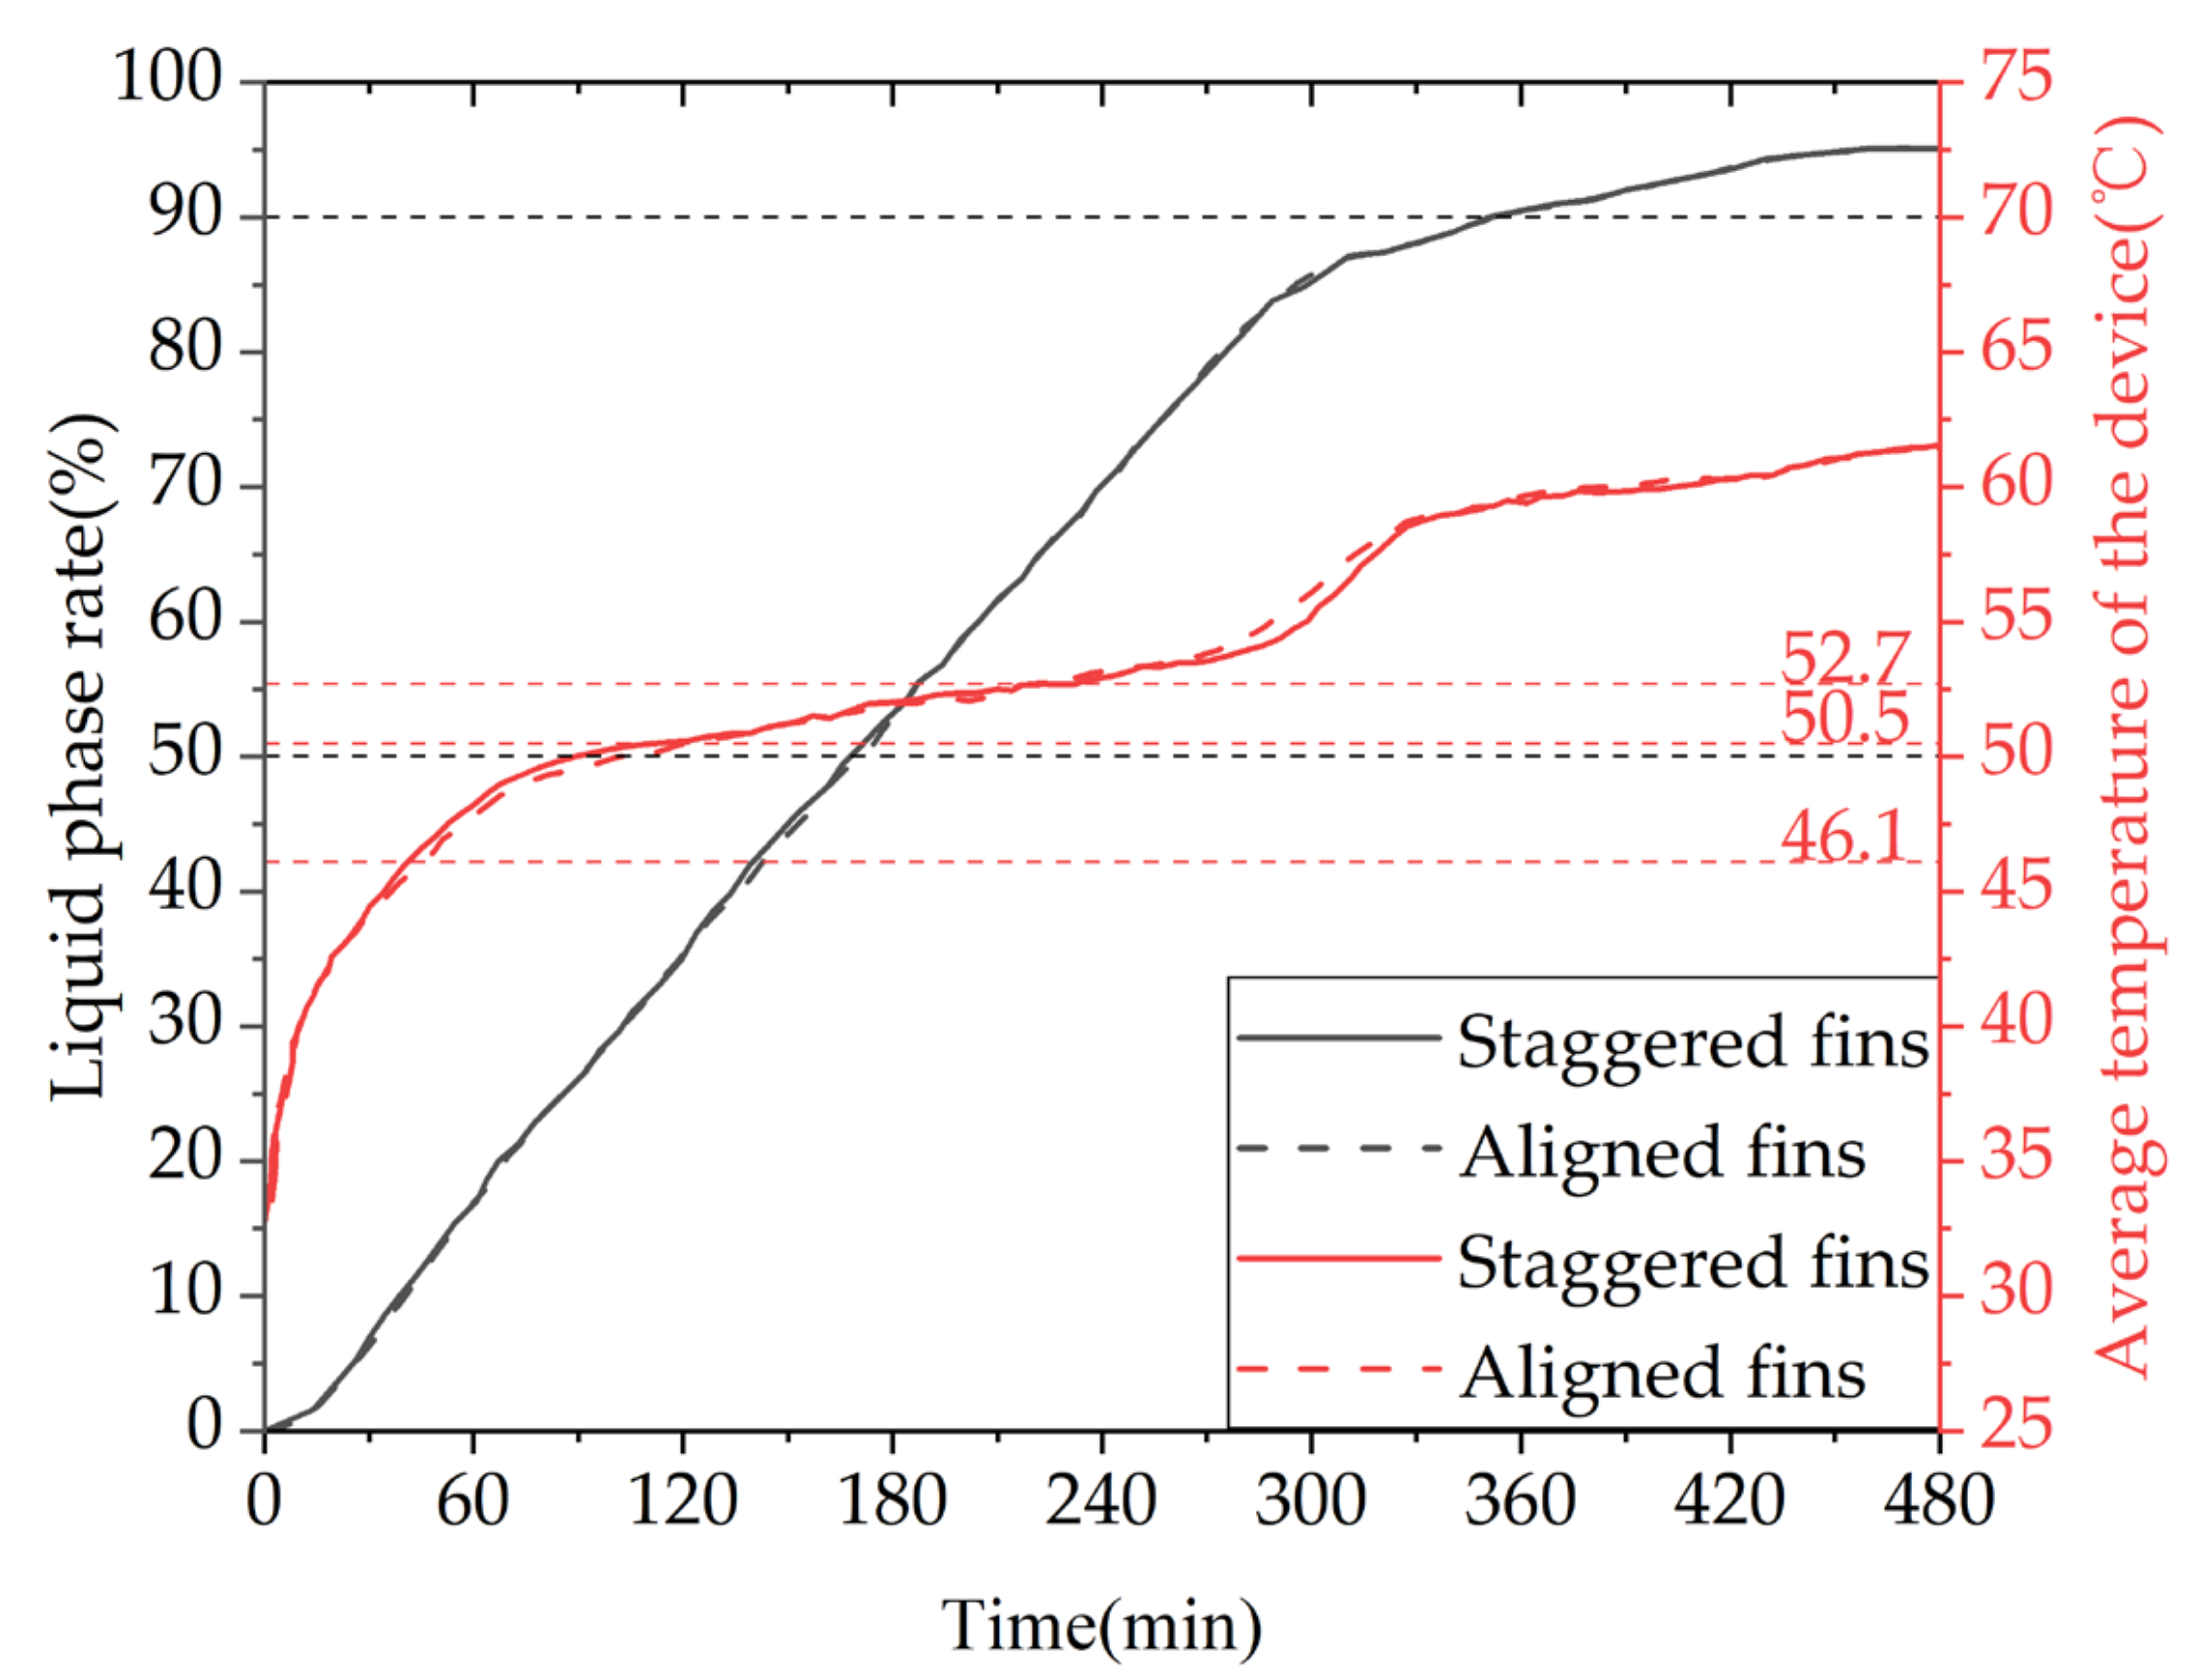
Figure 27 shows the variation in the liquid fraction and average temperature of a phase-change TES unit with different fin arrangements over time. The gray line represents the liquid fraction curve for the straight fins, while the red line corresponds to the temperature curve of the TES unit. The time required for 50% and 90% of the PCM to melt inside the TES unit with the two fin arrangements is 10,170 s and 20,920 s, and 10,050 s and 21,190 s, respectively. During the entire charging process, the liquid fraction curves of the TES unit with the two fin arrangements almost overlap, indicating that the difference in melting performance of the aligned or staggered fin arrangement is negligible. From the graph, it can be seen that the time required for the average temperature of the TES unit to reach 50 °C with the two fin arrangements is 6020 s and 5280 s, respectively. During the entire charging process, the average temperature curves of the TES unit with the two fin arrangements are almost the same, and the average temperature of the TES unit with the staggered fins is slightly higher than that with the aligned fins most of the time.
Therefore, it can be concluded that the TES unit with the staggered fin arrangement has a better heat storage performance than the TES unit with the aligned fin arrangement, but the difference is not significant. Considering that the length of the fins is limited to less than half the tube spacing for aligned fin arrangements, while the length of the fins and tube spacing can be adjusted over a wider range for staggered fin arrangements, the fins in the TES unit should preferably be arranged in a staggered manner. However, if the conditions are restricted, the aligned fin arrangement can also be used, and the heat storage performance of the TES unit with the two fin arrangements will not differ significantly.
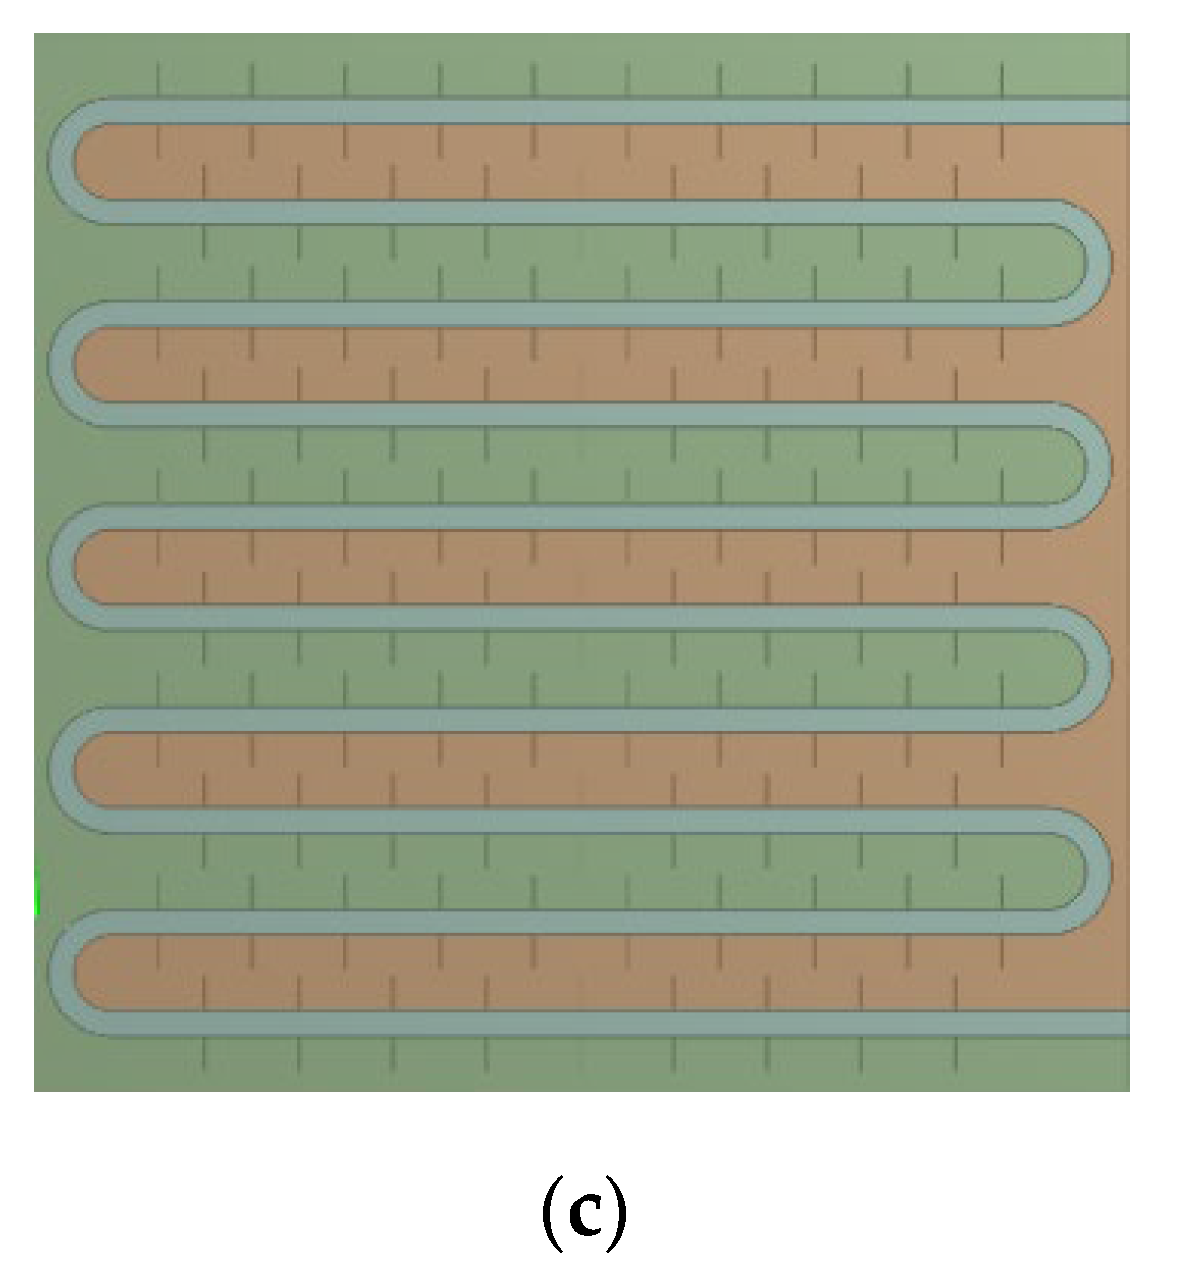
5.2. Fin Spacing

To investigate the effect of fin spacing on the thermal storage process, device models with fin spacings of 30 mm, 50 mm, and 70 mm were selected for simulation, as shown in Figure A4 in Appendix A. The liquid fraction and temperature distribution characteristics within the models were analyzed at different time points, and the differences in the time required to complete phase-change thermal storage were compared.
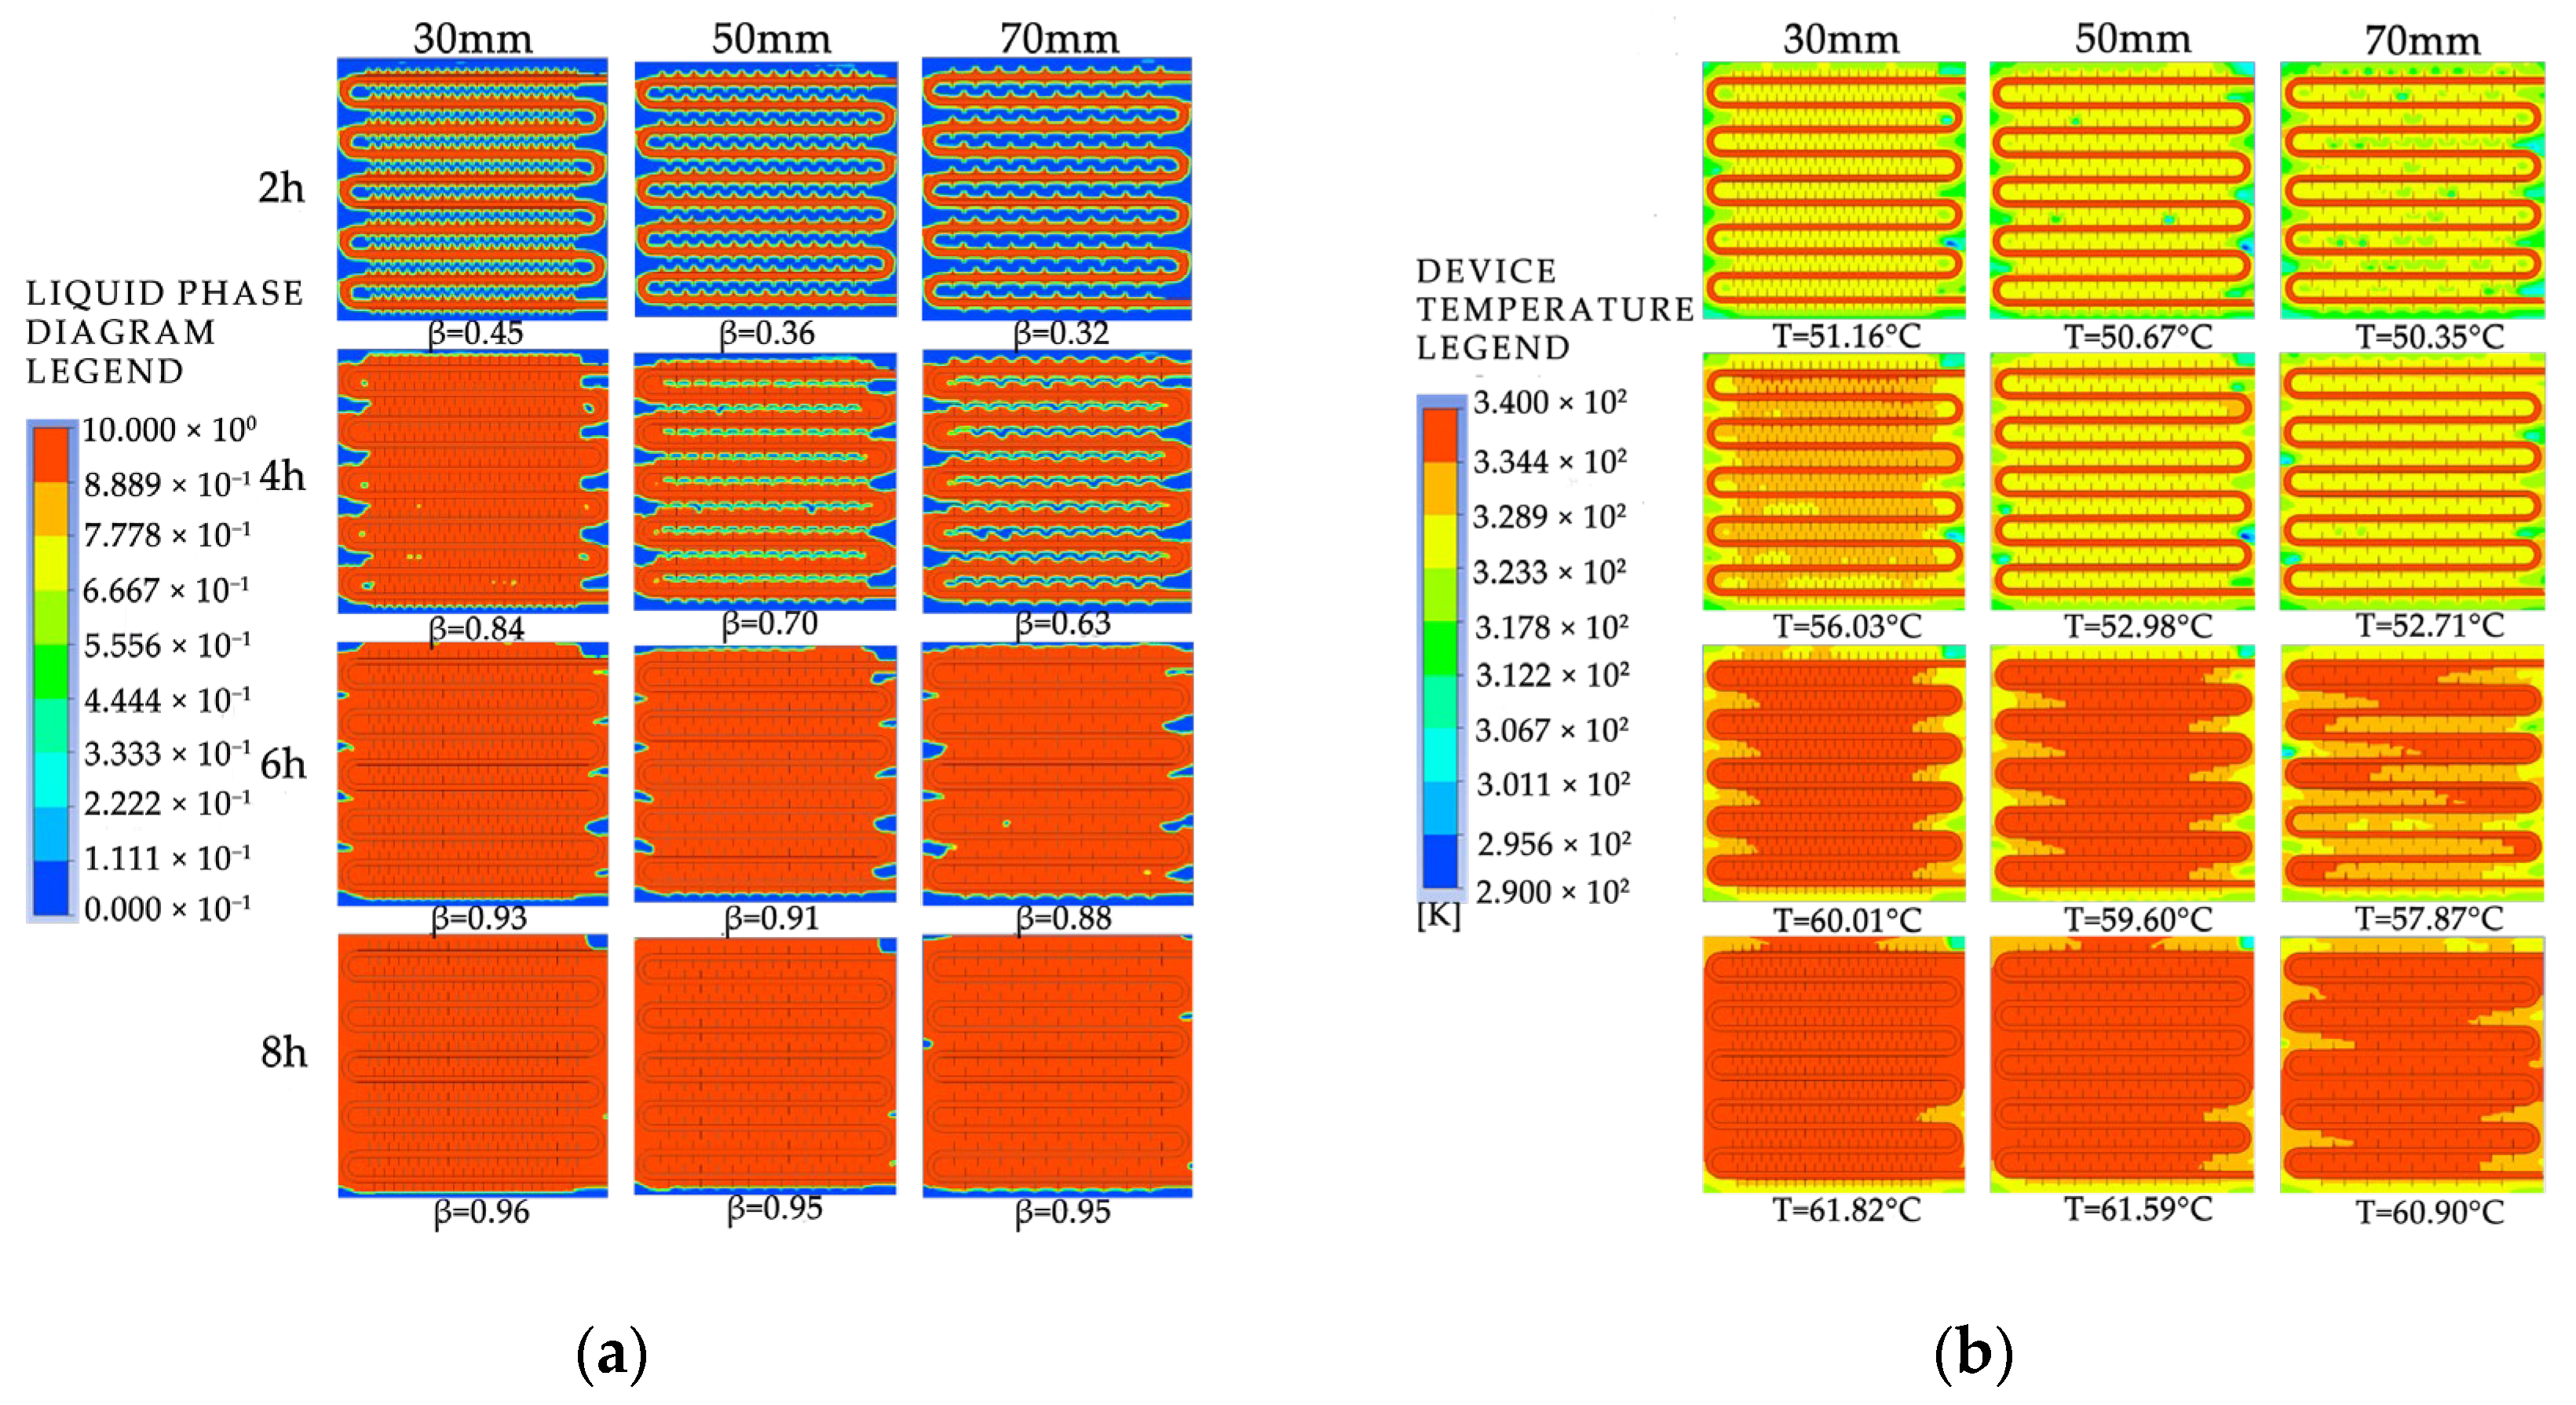
Figure 28 shows the simulated cloud maps of the devices with different fin spacings. 
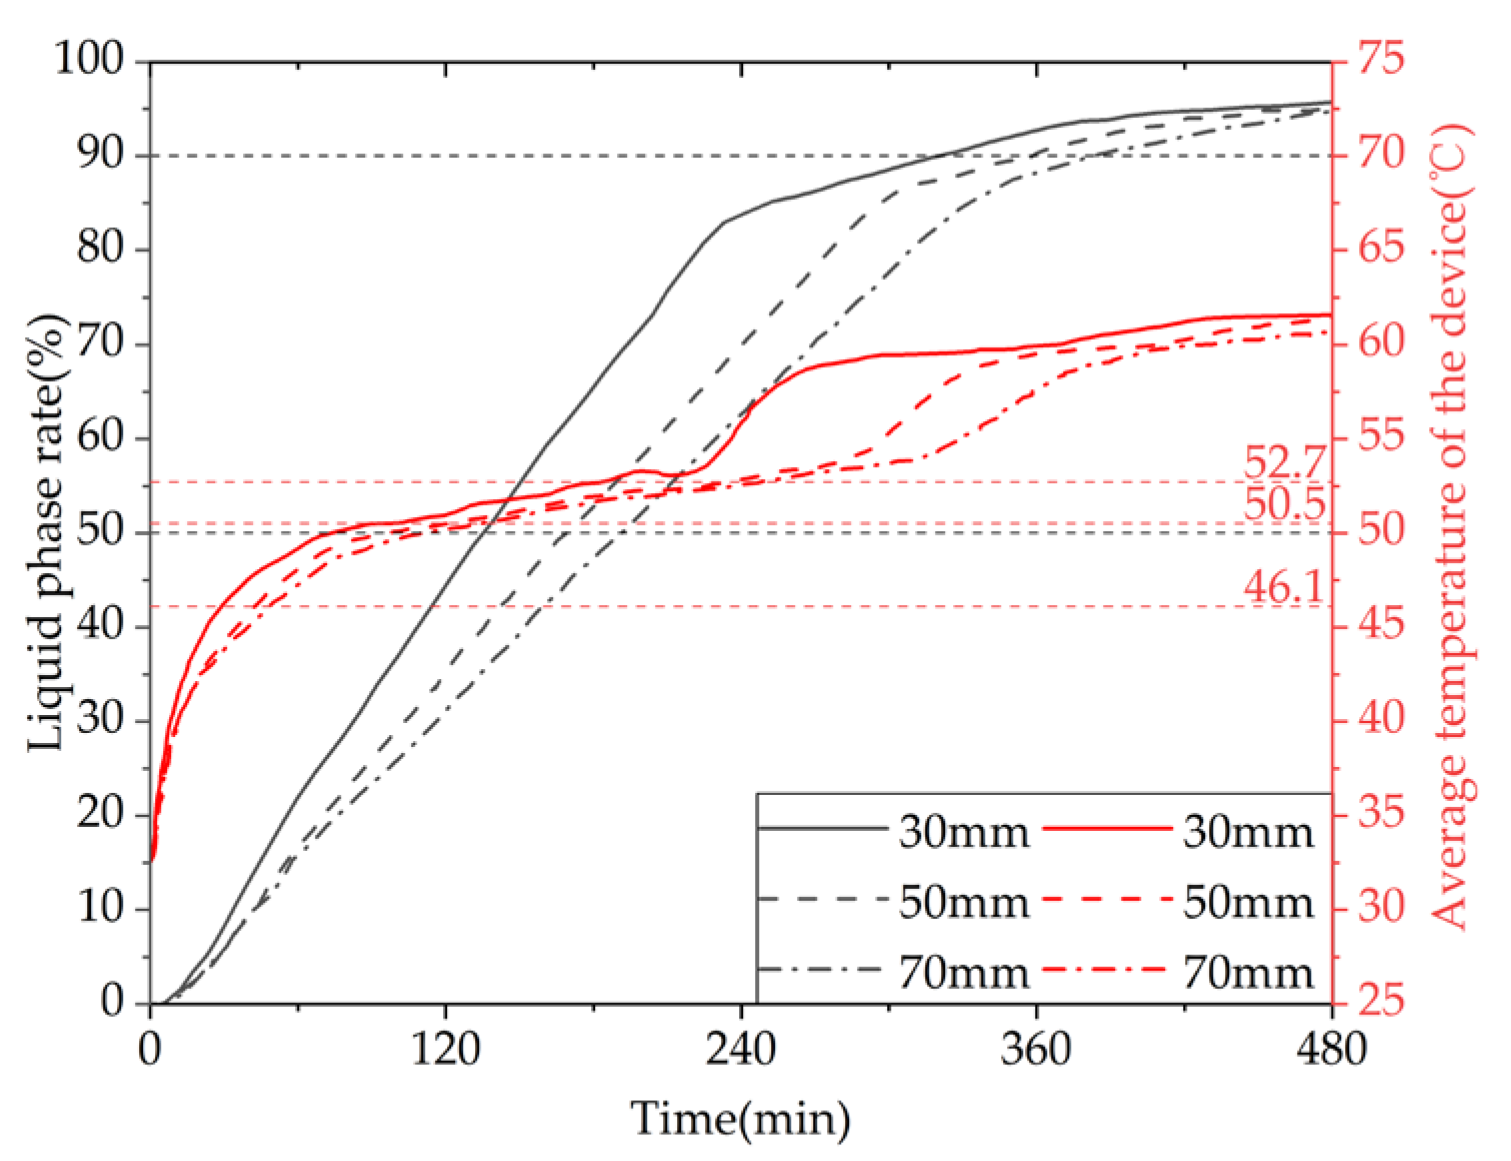
Figure 29 shows the variation curves of liquid fraction and average temperature with time for the phase-change TES device under different fin spacings. The gray line represents the liquid fraction curve, and the red line represents the device temperature curve. It can be observed that there are differences in the rate of change of the liquid fraction under different fin spacings, but the overall trend is consistent: the melting rate of the device is fast in the early stage of TES, and a clear inflection point appears in the later stage, with the liquid fraction curve relatively flat and the melting rate decreasing. This is because the solid PCM dominates the device in the early stage, and the presence of fins increases the heat exchange area, resulting in a faster melting rate. In the later stage, most of the PCM around the fins and pipelines has melted, and the heat transfer coefficient of the PCM is small, resulting in a significant slowdown in the melting rate. The time required for 50% of the PCM in the device to melt under three different fin spacings is 7980 s, 9940 s, and 11,170 s, respectively. When the fin spacing is reduced from 70 mm to 50 mm or 30 mm, the time required for 90% of the PCM to melt in the device is reduced by 11.01% and 28.56%, respectively. The time required for 90% of the PCM to melt in the device is 19,140 s, 21,190 s, and 22,900 s, respectively. When the fin spacing is reduced from 70 mm to 50 mm or 30 mm, the time required for 90% of the PCM to melt in the device is reduced by 7.47% and 16.42%, respectively. It can be seen from the figure that there are differences in the average rate of change of the device under different fin spacings, but the overall trend is consistent. There are two clear inflection points during the TES stage: the first one appears when the solid–liquid phase change is completed, at which point the device changes from latent heat storage to sensible heat storage, and the temperature rise rate increases. The second one appears when the average temperature of the device is around 60 °C in the later stage of TES. This is because most of the PCM inside the device has melted, and the temperature distribution is more uniform than in the early stage, resulting in weaker natural convection. Heat transfer mainly occurs in the form of conduction, and the heat transfer coefficient of the PCM is small, resulting in a significant slowdown in the melting rate. The time required for the average temperature of the device under three different fin spacings to reach 60 °C is 21,510 s, 23,710 s, and 25,110 s, respectively. When the fin spacing is reduced from 70 mm to 50 mm or 30 mm, the time required for the average temperature of the device to reach 60 °C is reduced by 5.58% and 14.34%, respectively.
Given the aforementioned, it can be inferred that for a given heat storage condition, a smaller fin spacing leads to a faster melting rate of the PCM (PCM), resulting in a shorter completion time of the storage process, a more uniform melting degree of PCM within the device, a higher average temperature of the device, and a greater TES capacity. However, a reduction in the fin spacing will increase the number of fins, thereby reducing the PCM capacity within the device and increasing the manufacturing cost of the fins. Therefore, in practical applications, the choice of fin spacing should be based on a comprehensive consideration of the demand for use and the economic feasibility of the device. For solar-energy-rich regions with support for longer storage times, there is no need for an excessively small fin spacing, whereas for shorter storage times a reduction in the fin spacing can be appropriate to enhance the TES performance of the device.
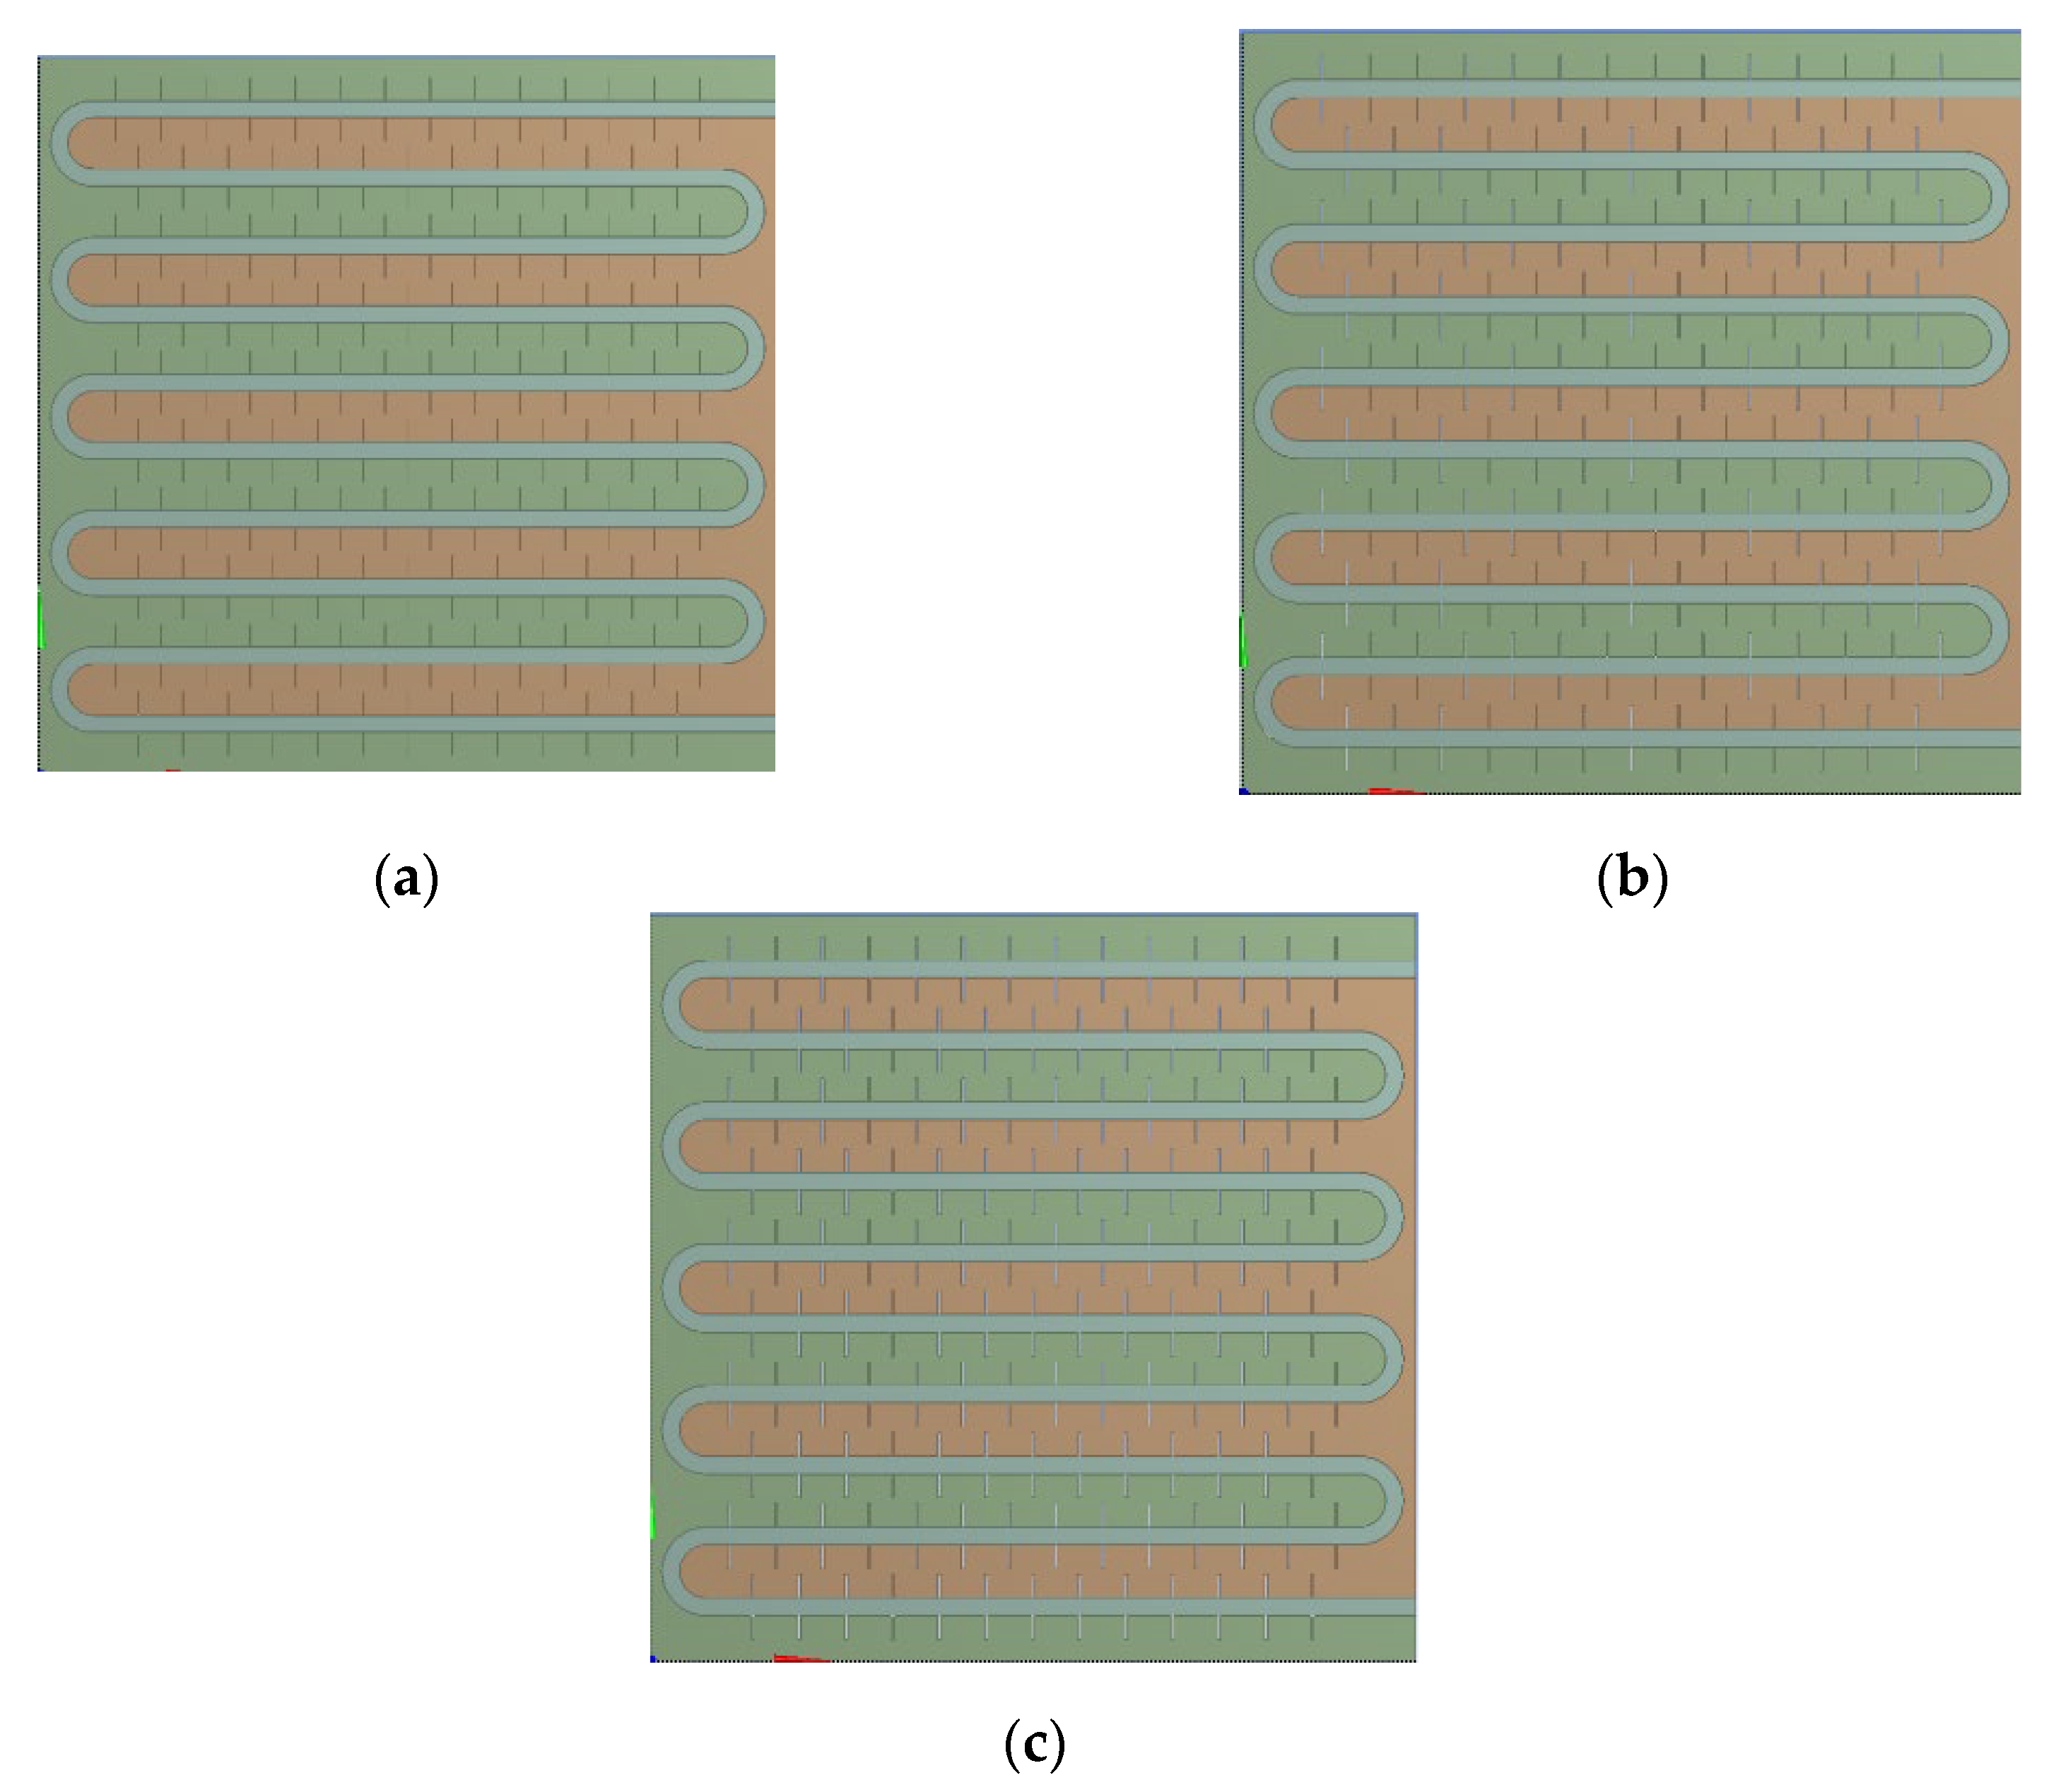
5.3. Fin Thickness

To investigate the effect of fin thickness on the thermal storage process, device models with fin thicknesses of 1 mm, 2 mm, and 3 mm were selected for simulation, as shown in Figure A5 in Appendix A. The liquid-phase ratio and temperature distribution characteristics inside the models were analyzed at different times, and the differences in the time required to complete the phase-change thermal storage were compared.
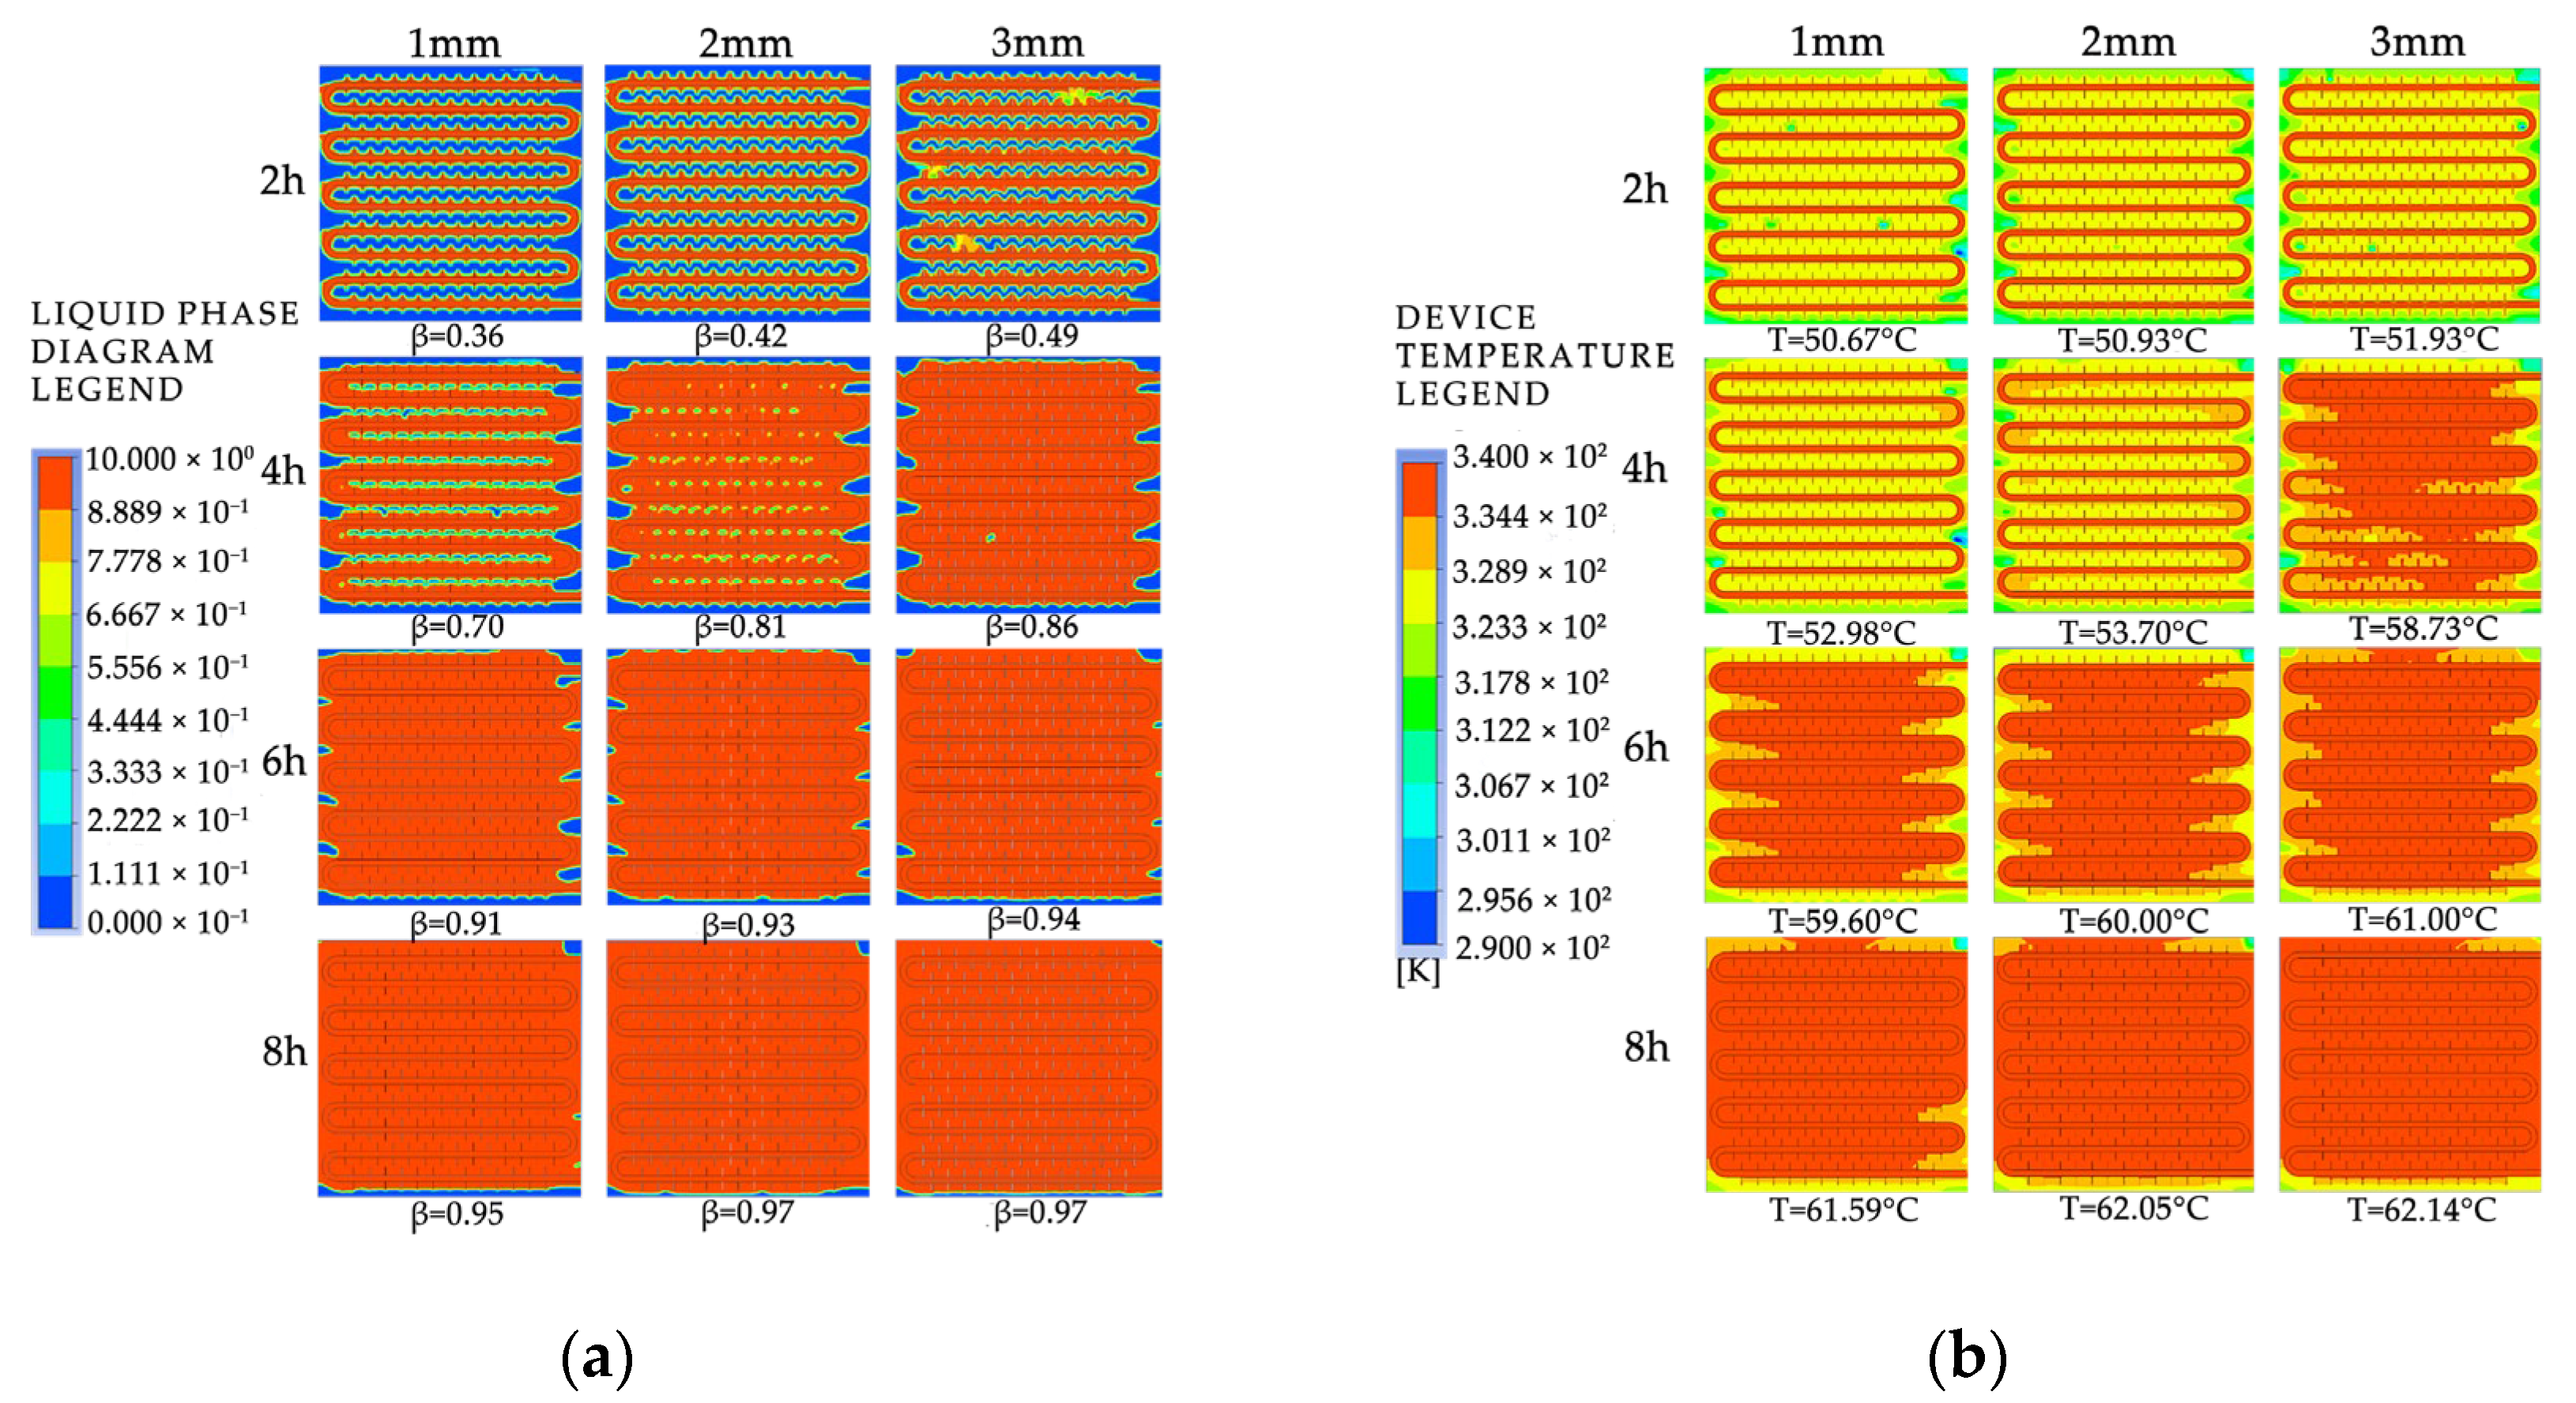
Figure 30 shows the simulation cloud maps of the devices under different fin thicknesses. 
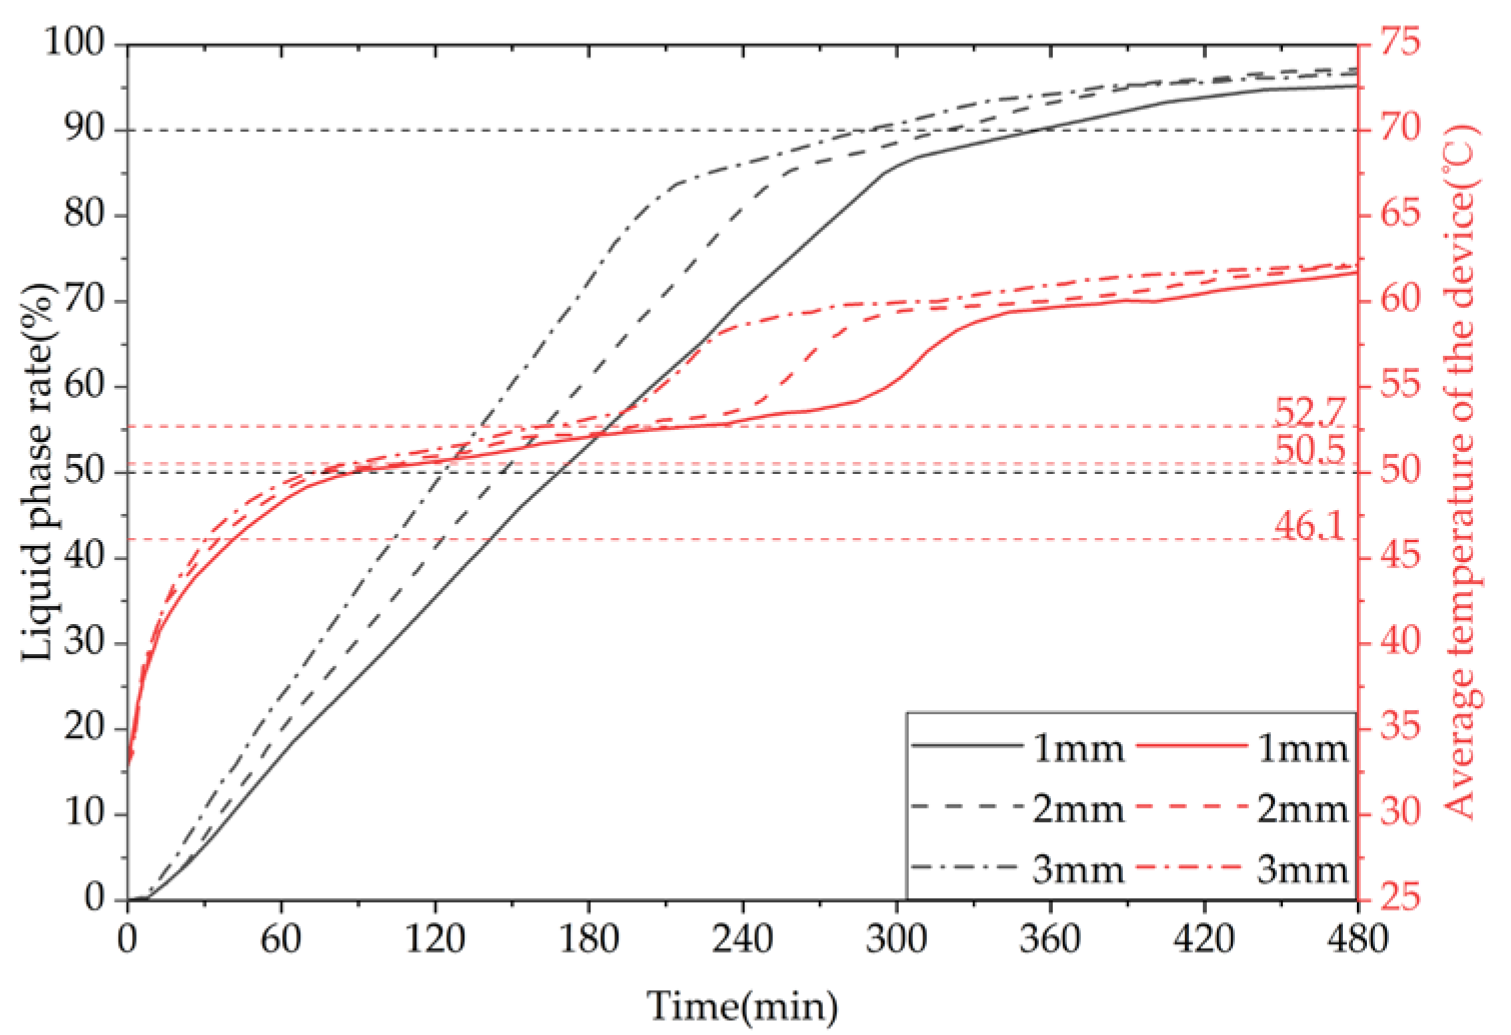
Figure 31 shows the comparison of the liquid-phase and average temperature variation trend for a phase-change TES device with different fin thicknesses. The gray line represents the liquid-phase comparison curve, while the red line represents the device temperature curve. The melting times of 50% of the phase-change materials (PCMs) inside the device correspond to three different fin thicknesses of 1 mm, 2 mm, and 3 mm, which are 9940 s, 8580 s, and 7290 s, respectively. When the fin thickness increases from 1 mm to 2 mm or 3 mm, the melting times of 50% of the PCM inside the device are reduced by 13.68% and 26.66%, respectively. The melting times of 90% of the PCM inside the device correspond to the three fin thicknesses of 1 mm, 2 mm, and 3 mm, which are 20,710 s, 18,620 s, and 16,760 s, respectively. When the fin thickness increases from 1 mm to 2 mm or 3 mm, the melting times of 90% of the PCM inside the device are reduced by 10.09% and 19.07%, respectively. In conclusion, increasing the fin thickness can significantly enhance the melting efficiency of the device.
It can be inferred from the above that, under the same heat storage conditions, an increase in fin thickness leads to a faster melting rate of PCM (PCM), a shorter time required for completing the heat storage process, a more uniform degree of PCM melting at the end of the process, a higher average temperature of the heat storage device, and a greater heat storage capacity. However, increasing the fin thickness reduces the PCM capacity of the device and raises the manufacturing cost of the finned tubes. Therefore, in practical applications, the selection of fin thickness should be based on a comprehensive consideration of the requirements for use and the economic feasibility of the device. For solar-rich regions with relatively long heat storage times, a fin thickness of no more than 2 mm is recommended, whereas for shorter heat storage times an increase in fin thickness can be considered to enhance the heat storage performance of the device.

5.4. Inlet Flow Direction and Installation Method

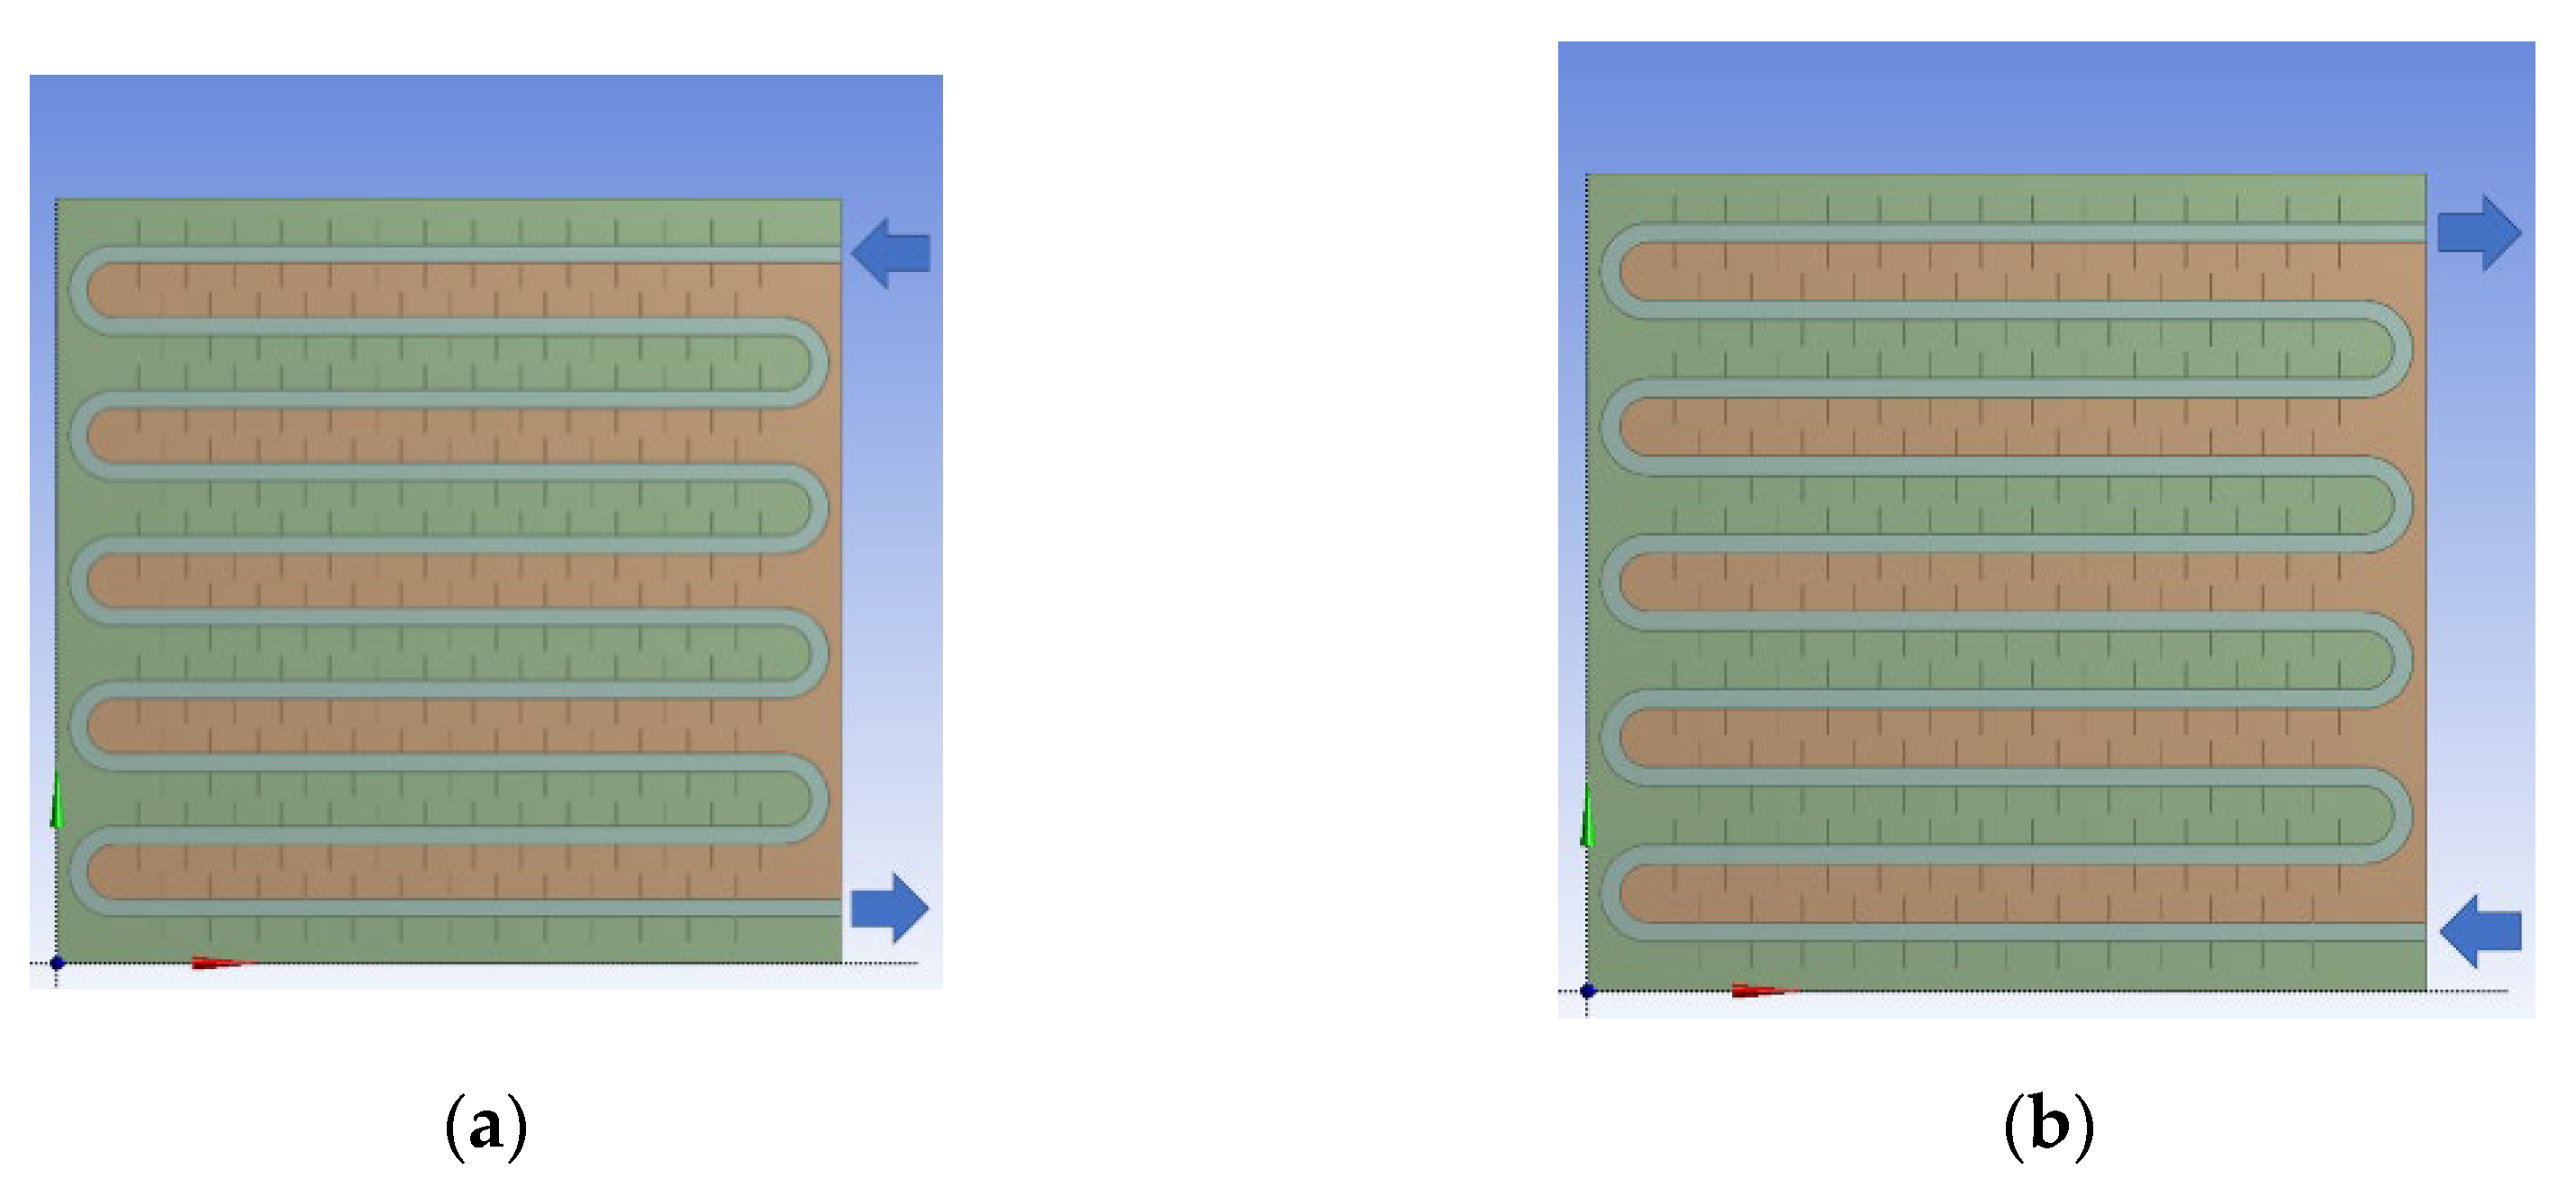
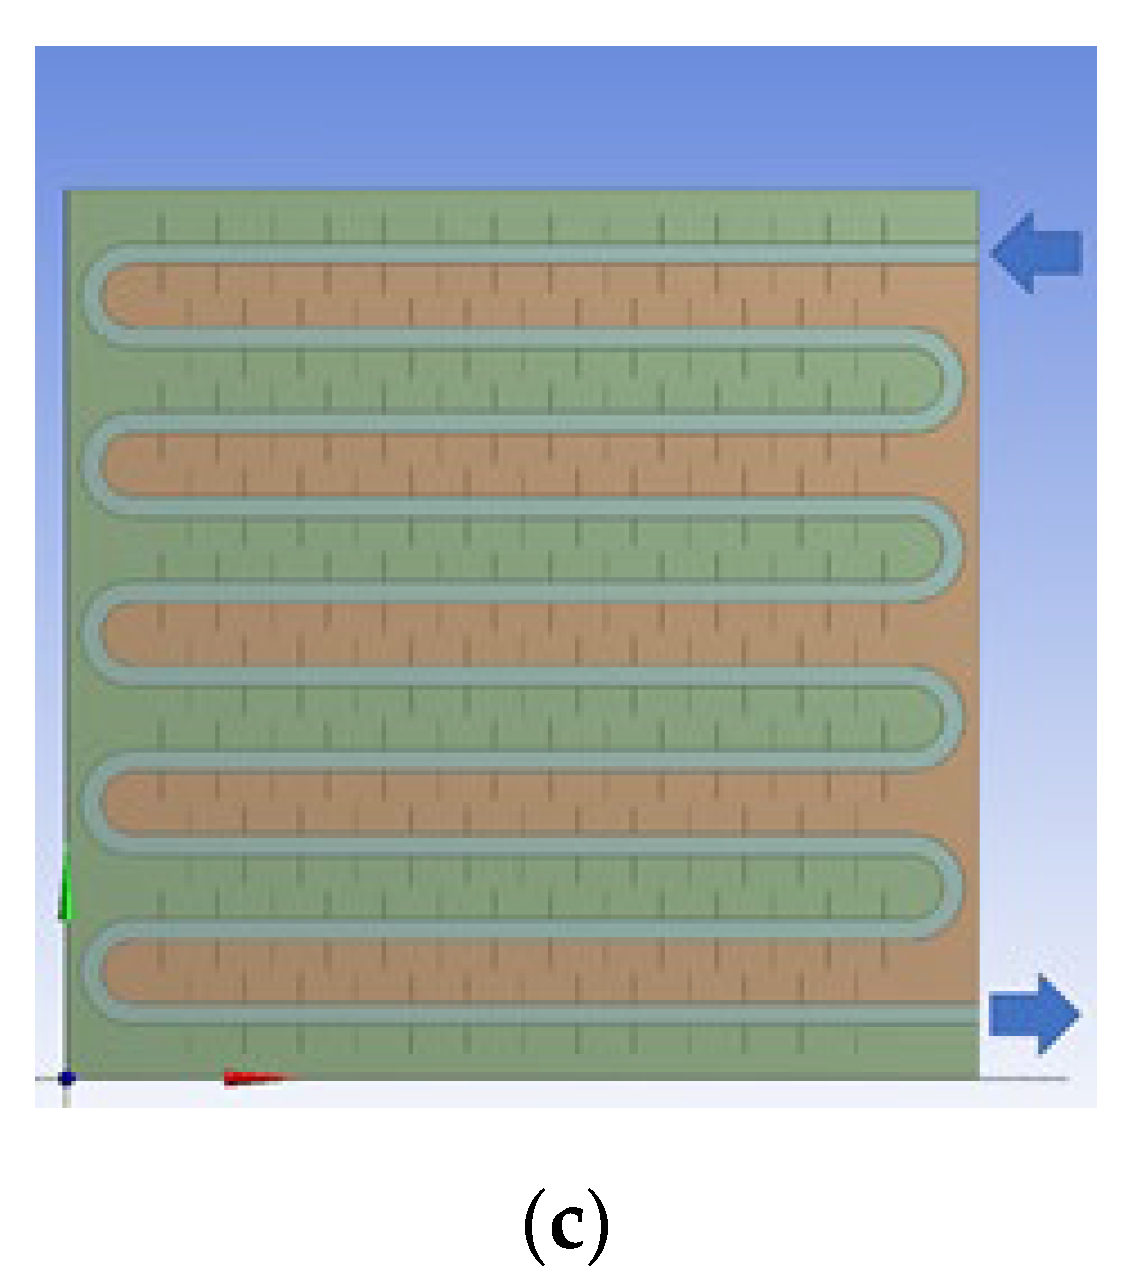
To investigate the effects of the device’s water inlet direction and installation method on the heat storage process, we set the installation method with the longer edge of the device aligned with the direction of gravity as the vertical installation. We selected models of the device with the fluid entering from the bottom and exiting from the top for horizontal installation and with the fluid entering from the top and exiting from the top for vertical installation and analyzed the liquid-phase fraction and temperature distribution characteristics inside the models at different time points, as shown in Figure A6 in Appendix A. We compared the differences in the time required to complete the phase-change heat storage.
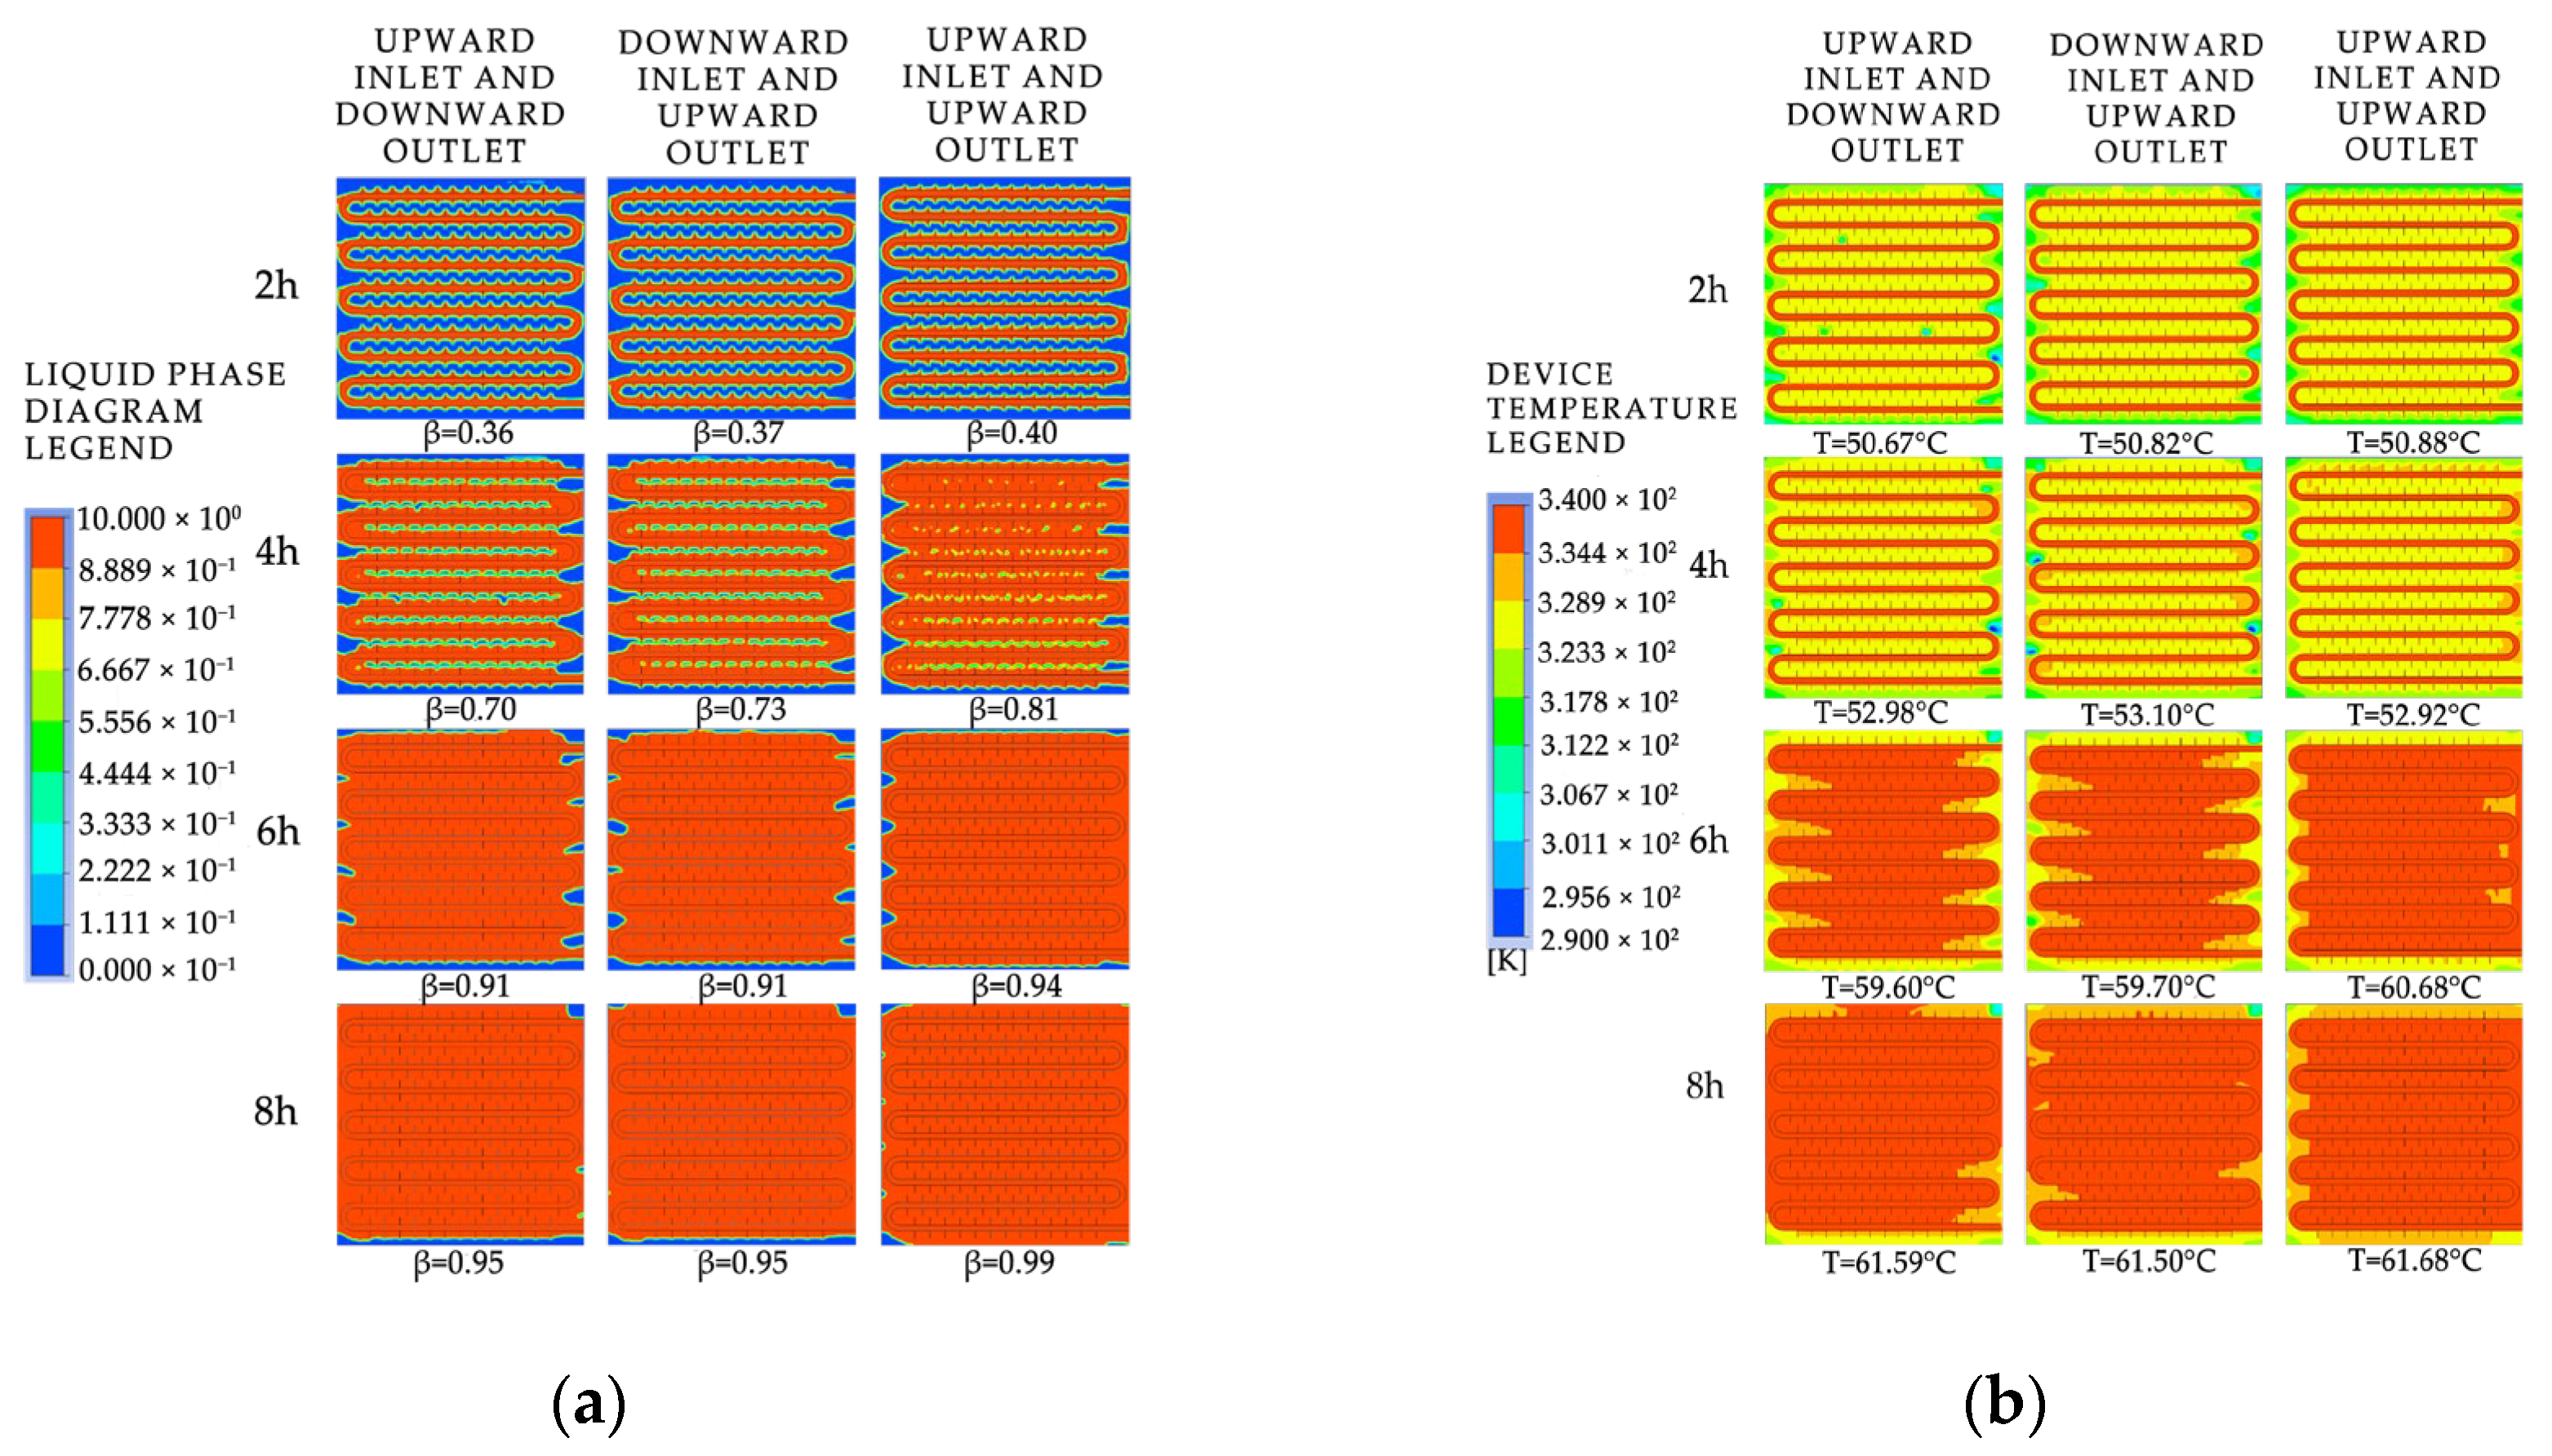
Figure 32 presents the simulation contour maps of the device under different water inlet directions and installation methods. According to the comprehensive analysis of the entire heat storage process, the melting effect of the vertically installed device is significantly better than that of the horizontally installed one, because the vertical installation provides a larger spatial scale in the direction of gravity, which is conducive to the formation of natural convection inside the device. When both are installed horizontally, the heat exchange method of downward inlet and upward outlet is better than that of upward inlet and downward outlet during the early stage of heat storage. After the heat storage time exceeds 6 h, there is not much difference in the heat storage effect of the two water inlet methods, because the heated fluid flows in the longer coil and exchanges heat with the device while flowing, and the fluid temperature inside the coil gradually decreases. Moreover, due to the density difference between the solid and liquid phase-change materials, there will be a temperature stratification phenomenon in the device during the heat storage process under the influence of gravity, with the upper part having a higher temperature than the lower part. When the device is horizontally placed, the downward inlet and upward outlet heat exchange method will increase the heat exchange temperature difference and improve the heat exchange effect.
Based on the overall heat storage process, it can be concluded that the melting effect of the vertically installed device is significantly better than that of the horizontally installed device. This is because the vertically installed device provides a larger spatial scale in the direction of gravity, which is conducive to the formation of natural convection inside the device. For devices installed horizontally, the heat transfer method of downward inlet and upward outlet performs better than the upward inlet and downward outlet in the early stage of heat storage. However, after a heat storage time exceeding 6 h the heat storage effect of the two inflow methods is not significantly different. This is because the hot fluid flows through the longer path of the coil, exchanging heat with the device as it flows, and the fluid temperature inside the pipe gradually decreases. Additionally, due to the density difference between the solid and liquid PCMs, the device experiences temperature stratification, where the upper part of the device has a higher temperature than the lower part during heat storage under the influence of gravity. When the device is horizontally installed, the downflow–upflow heat transfer method can increase the heat transfer temperature difference, thereby improving the heat transfer effect.
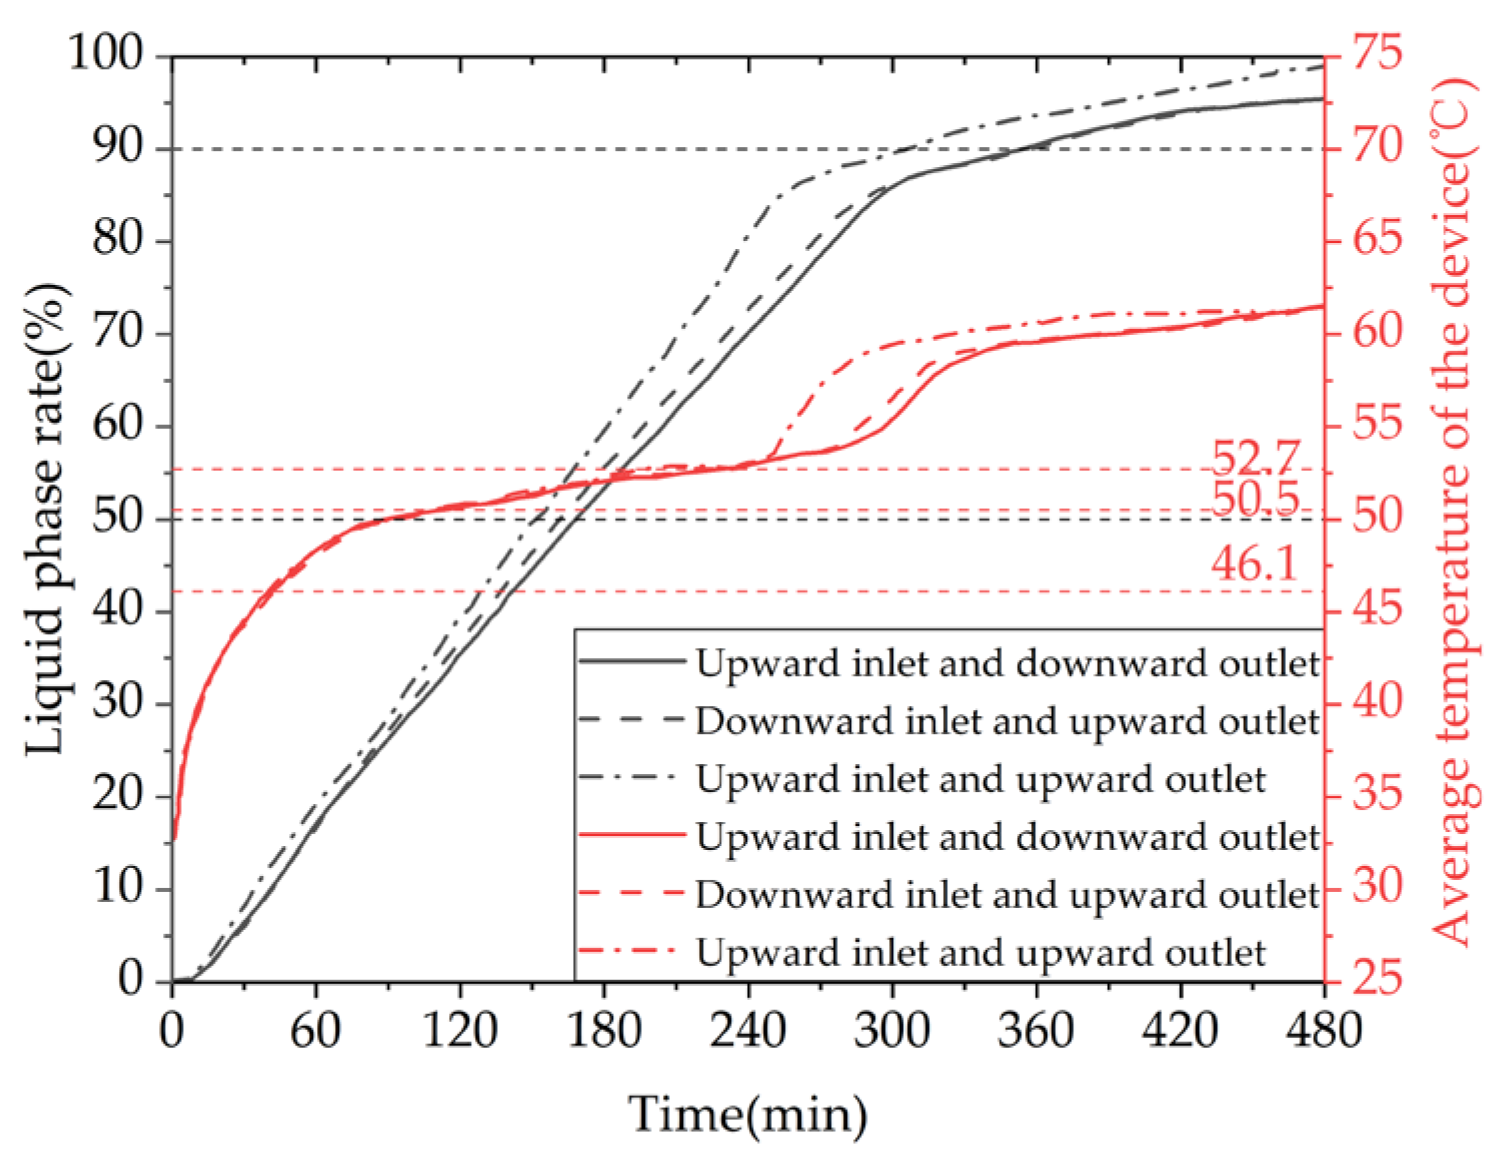
Figure 33 shows the variation curves of the liquid fraction and the average temperature of the phase-change TES device with different water inlet directions and installation methods over time. The gray line represents the liquid fraction curve, while the red line represents the device temperature curve. The time required for the liquid fraction to reach 50% under three operating conditions is 9940 s, 9530 s, and 8940 s, respectively. When the operating condition is changed from horizontal up-in and down-out to horizontal down-in and up-out or vertical up-in and up-out, the time required for 50% of the PCM in the device to melt is shortened by 4.12% and 10.06%, respectively. The time required for 90% of the PCM in the device to melt is 20,710 s, 20,680 s, and 17,770 s, respectively. When the operating condition is changed from horizontal up-in and down-out to horizontal down-in and up-out or vertical up-in and up-out, the time required for 90% of the PCM in the device to melt is shortened by 0.14% and 14.20%, respectively. In conclusion, the heat storage performance of the device is significantly better in the vertical installation mode than in the horizontal installation mode, while the effect of changing the water inlet direction on the heat storage performance of the device is small in the horizontal installation mode. Additionally, the time required for the device’s average temperature to reach 60 °C under the three operating conditions is 23,720 s, 23,250 s, and 19,420 s, respectively. When the operating condition is changed from horizontal up-in and down-out to horizontal down-in and up-out or vertical up-in and up-out, the time required for the device average temperature to reach 60 °C is shortened by 1.98% and 18.13%, respectively. From the graph, it can be seen that within the first 4 h of heat storage the average temperatures of the device under the three operating conditions are similar, while after 4 h the vertical installation device has a significantly improved temperature rise rate.

6. Conclusions

Based on the summary of the design and enhanced heat transfer research of phase-change thermal energy storage (TES) devices both domestically and internationally, this study presents a multifunctional phase-change TES and heat transfer device suitable for small wooden buildings in regions with abundant solar energy and other renewable energy sources. The device has a small footprint, high heat storage density, and good heat storage and release performance. To explore its performance characteristics, a TES device performance testing platform was built, and the variation in heat storage and release characteristics was analyzed based on experimental data. Furthermore, the effects of various factors on the heat storage process of the device were simulated and studied based on the validation of the experimental verification model.
The experimental results indicate that when the device is used for heating the effective heat release efficiency is higher than 78% at an initial temperature of 63 °C, an inlet temperature of 30 °C, and a flow rate of 0.36 m3/h. The device’s heat release power exceeds the building’s heat load for more than 14 h. When the device is used for providing domestic hot water, at an initial temperature of 58 °C, an inlet temperature of 25 °C, and a flow rate of 0.05 m3/h, the device can provide more than 130 L of hot water above 37 °C, meeting the shower water needs of at least two people, with an effective heat release of 9855 KJ.
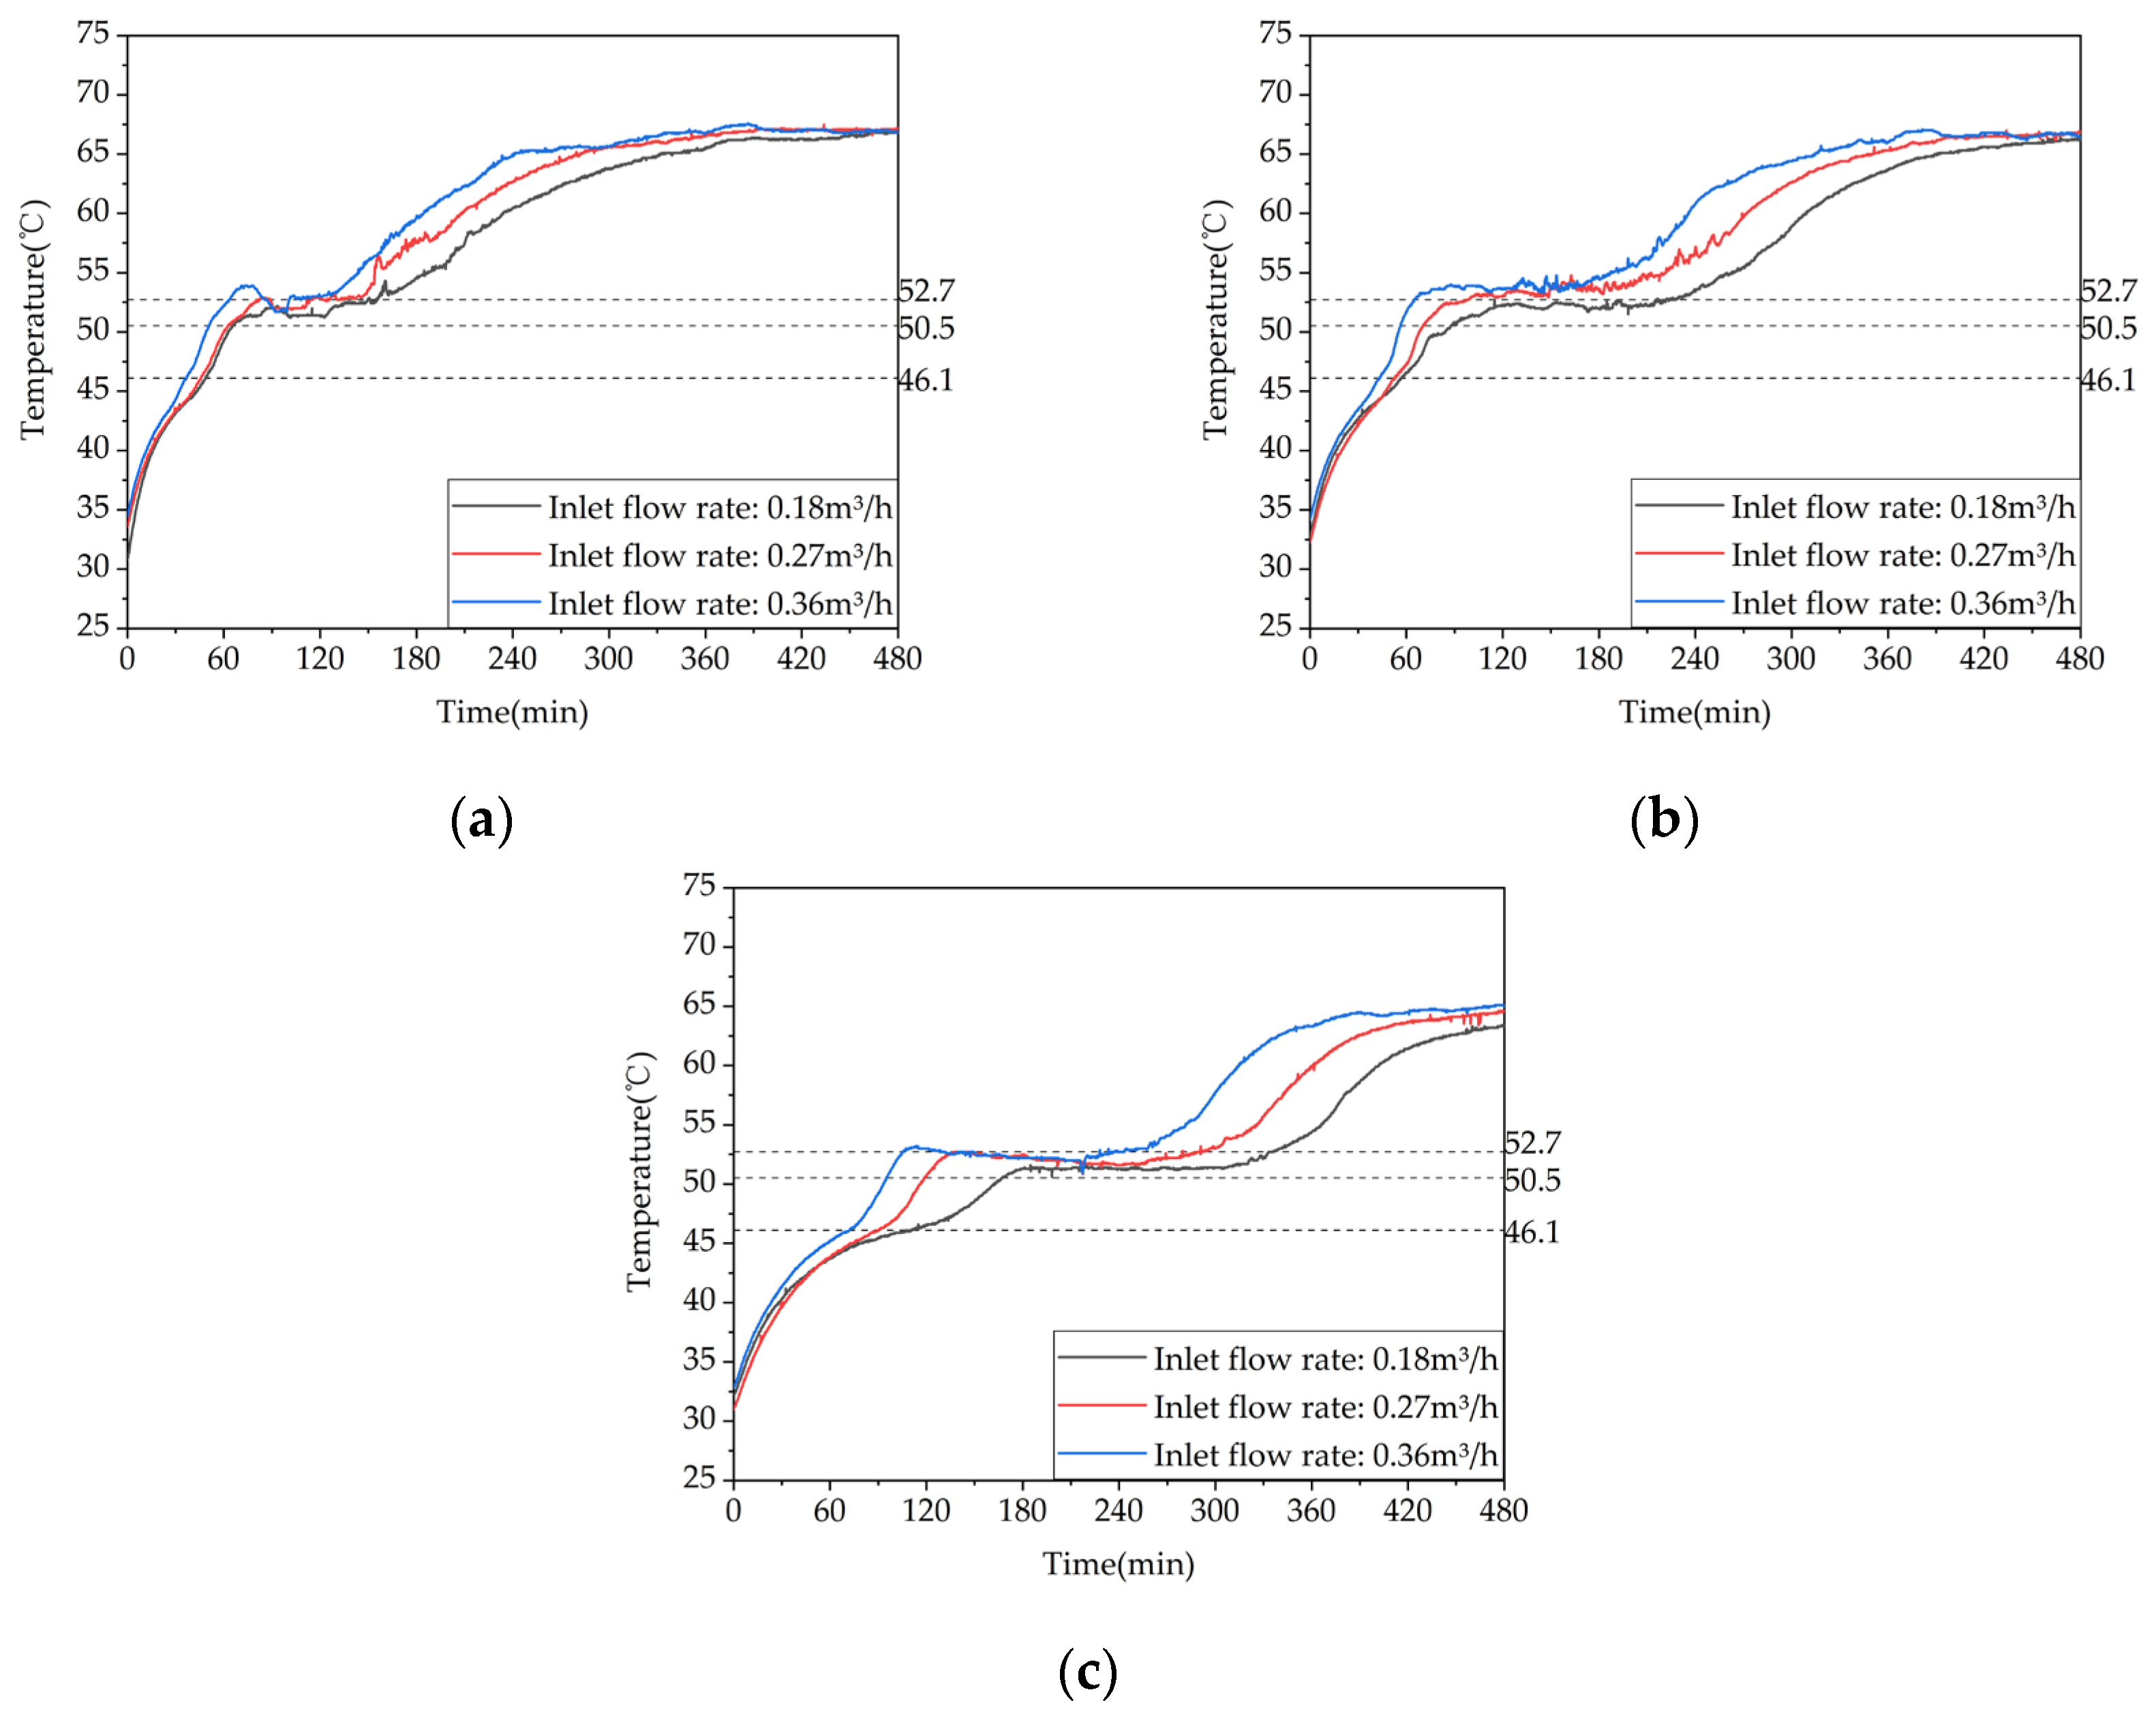
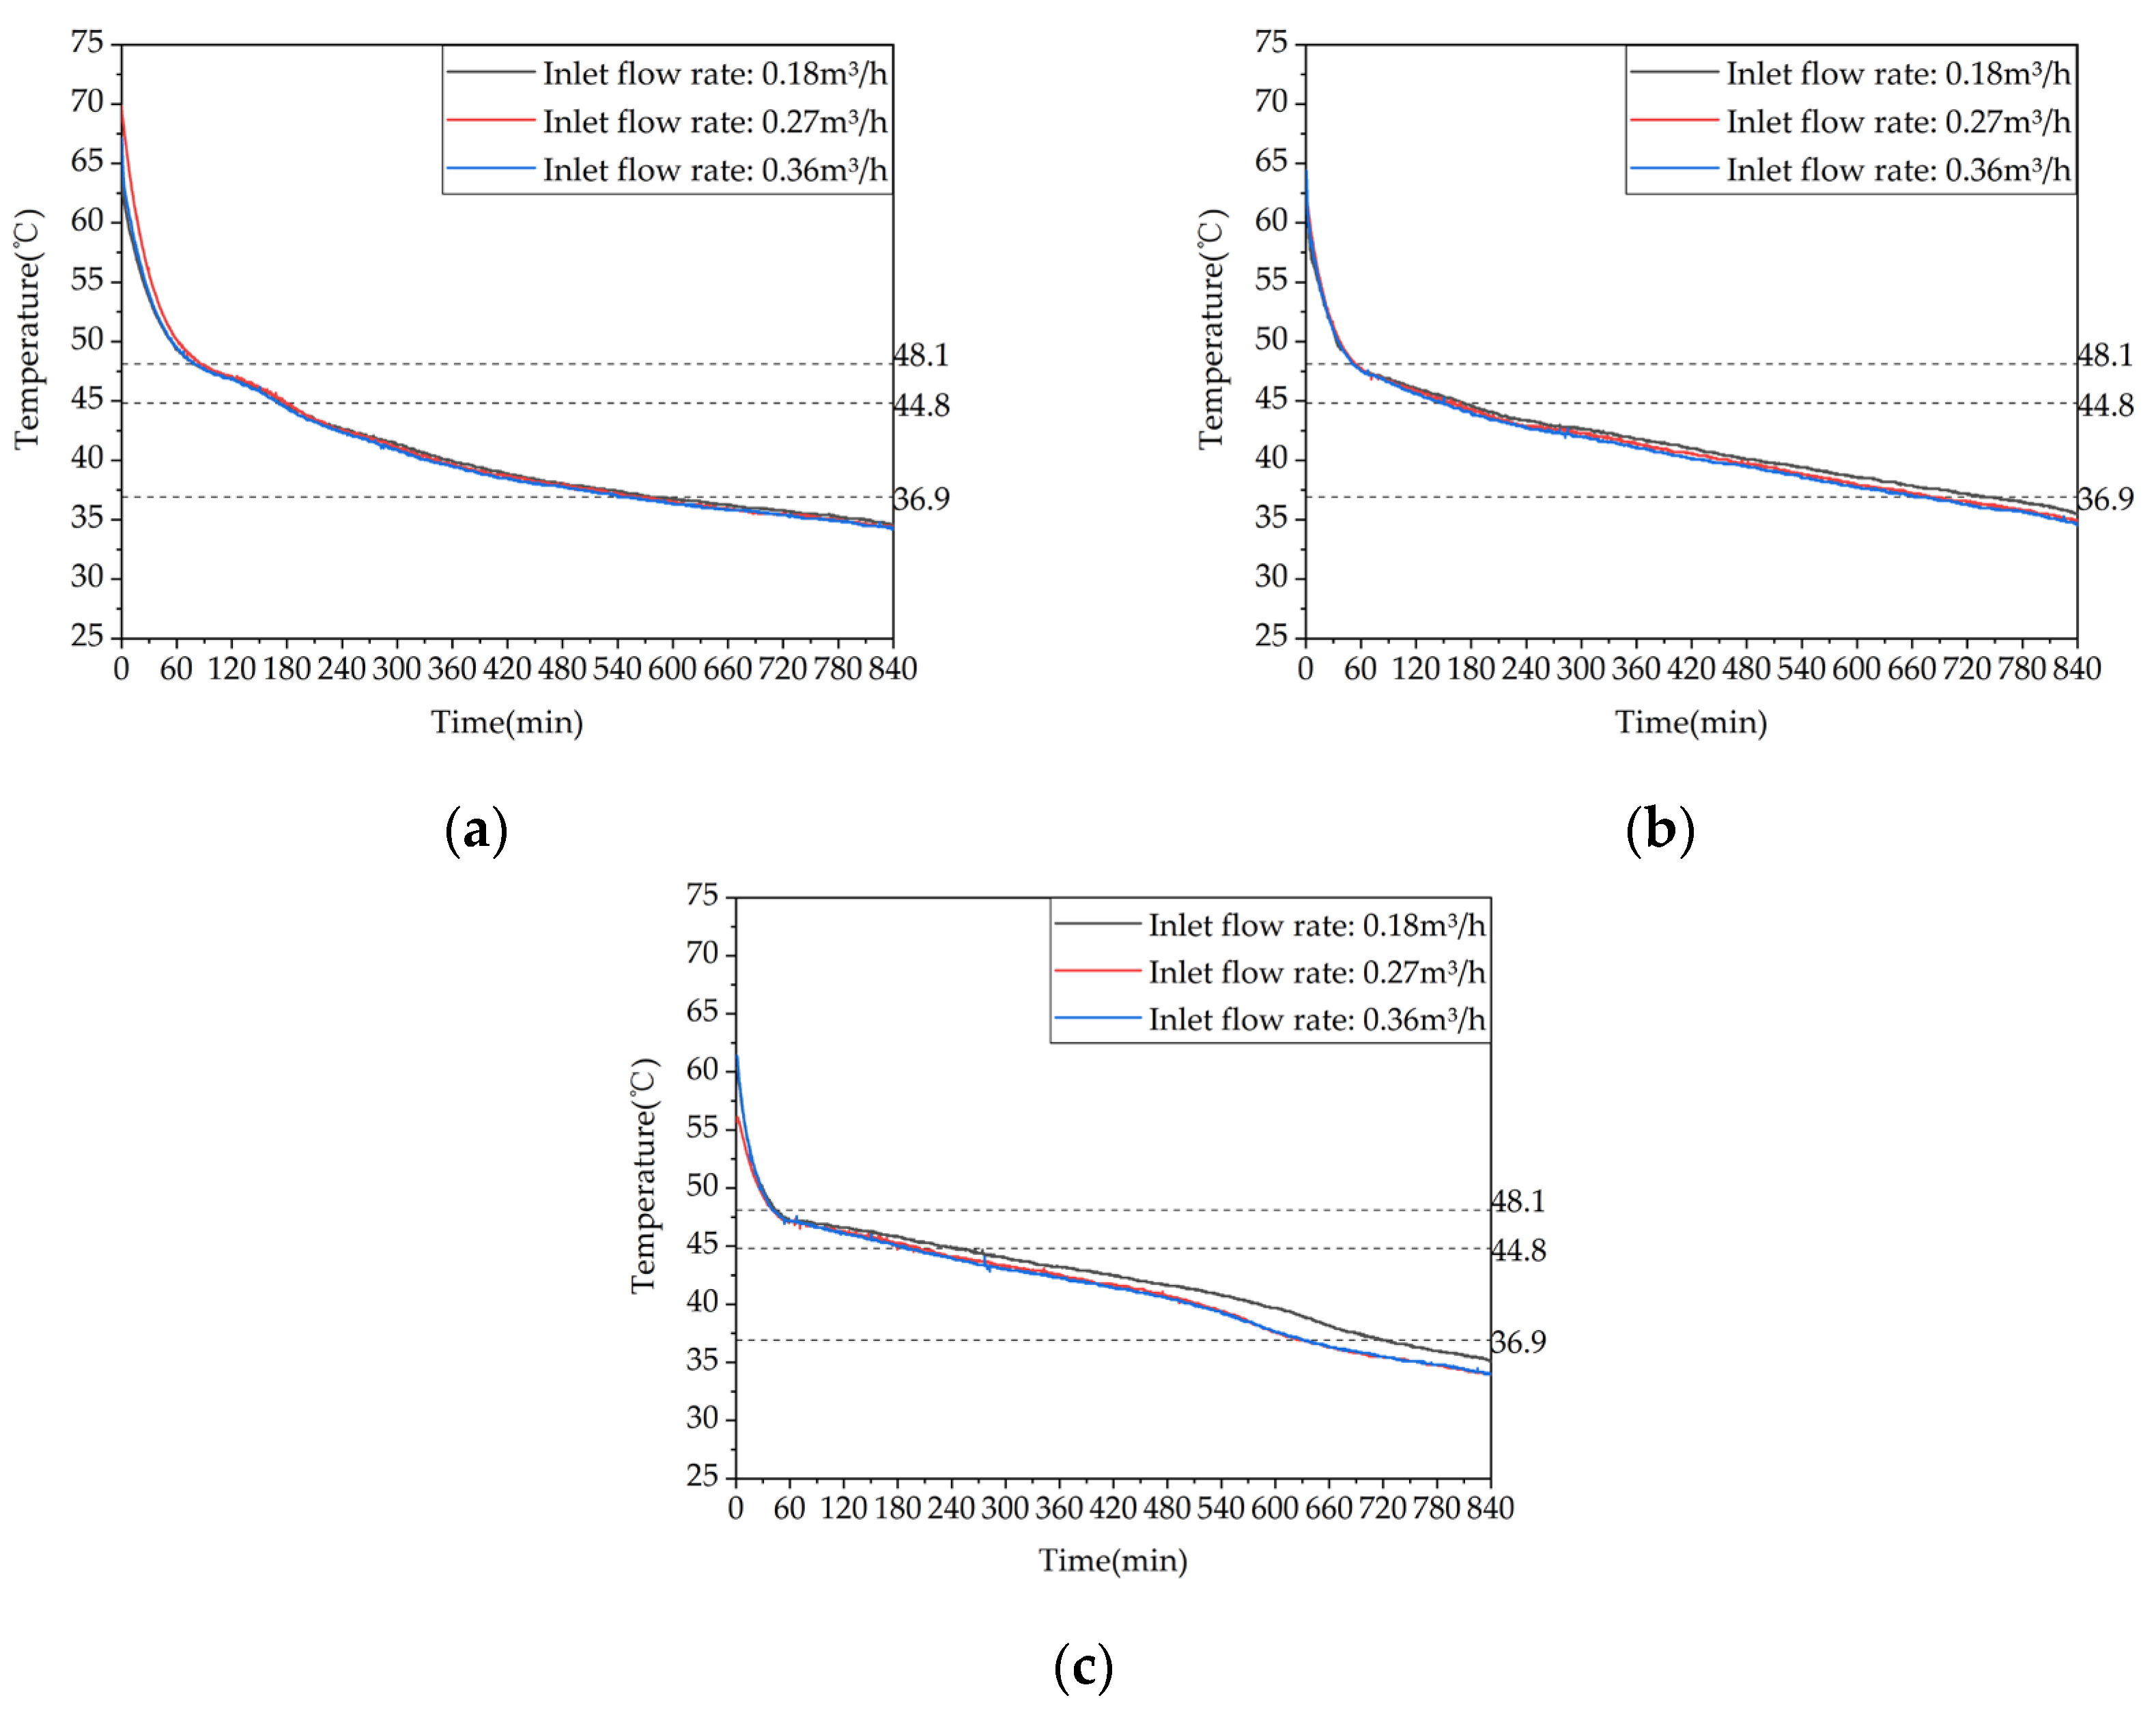
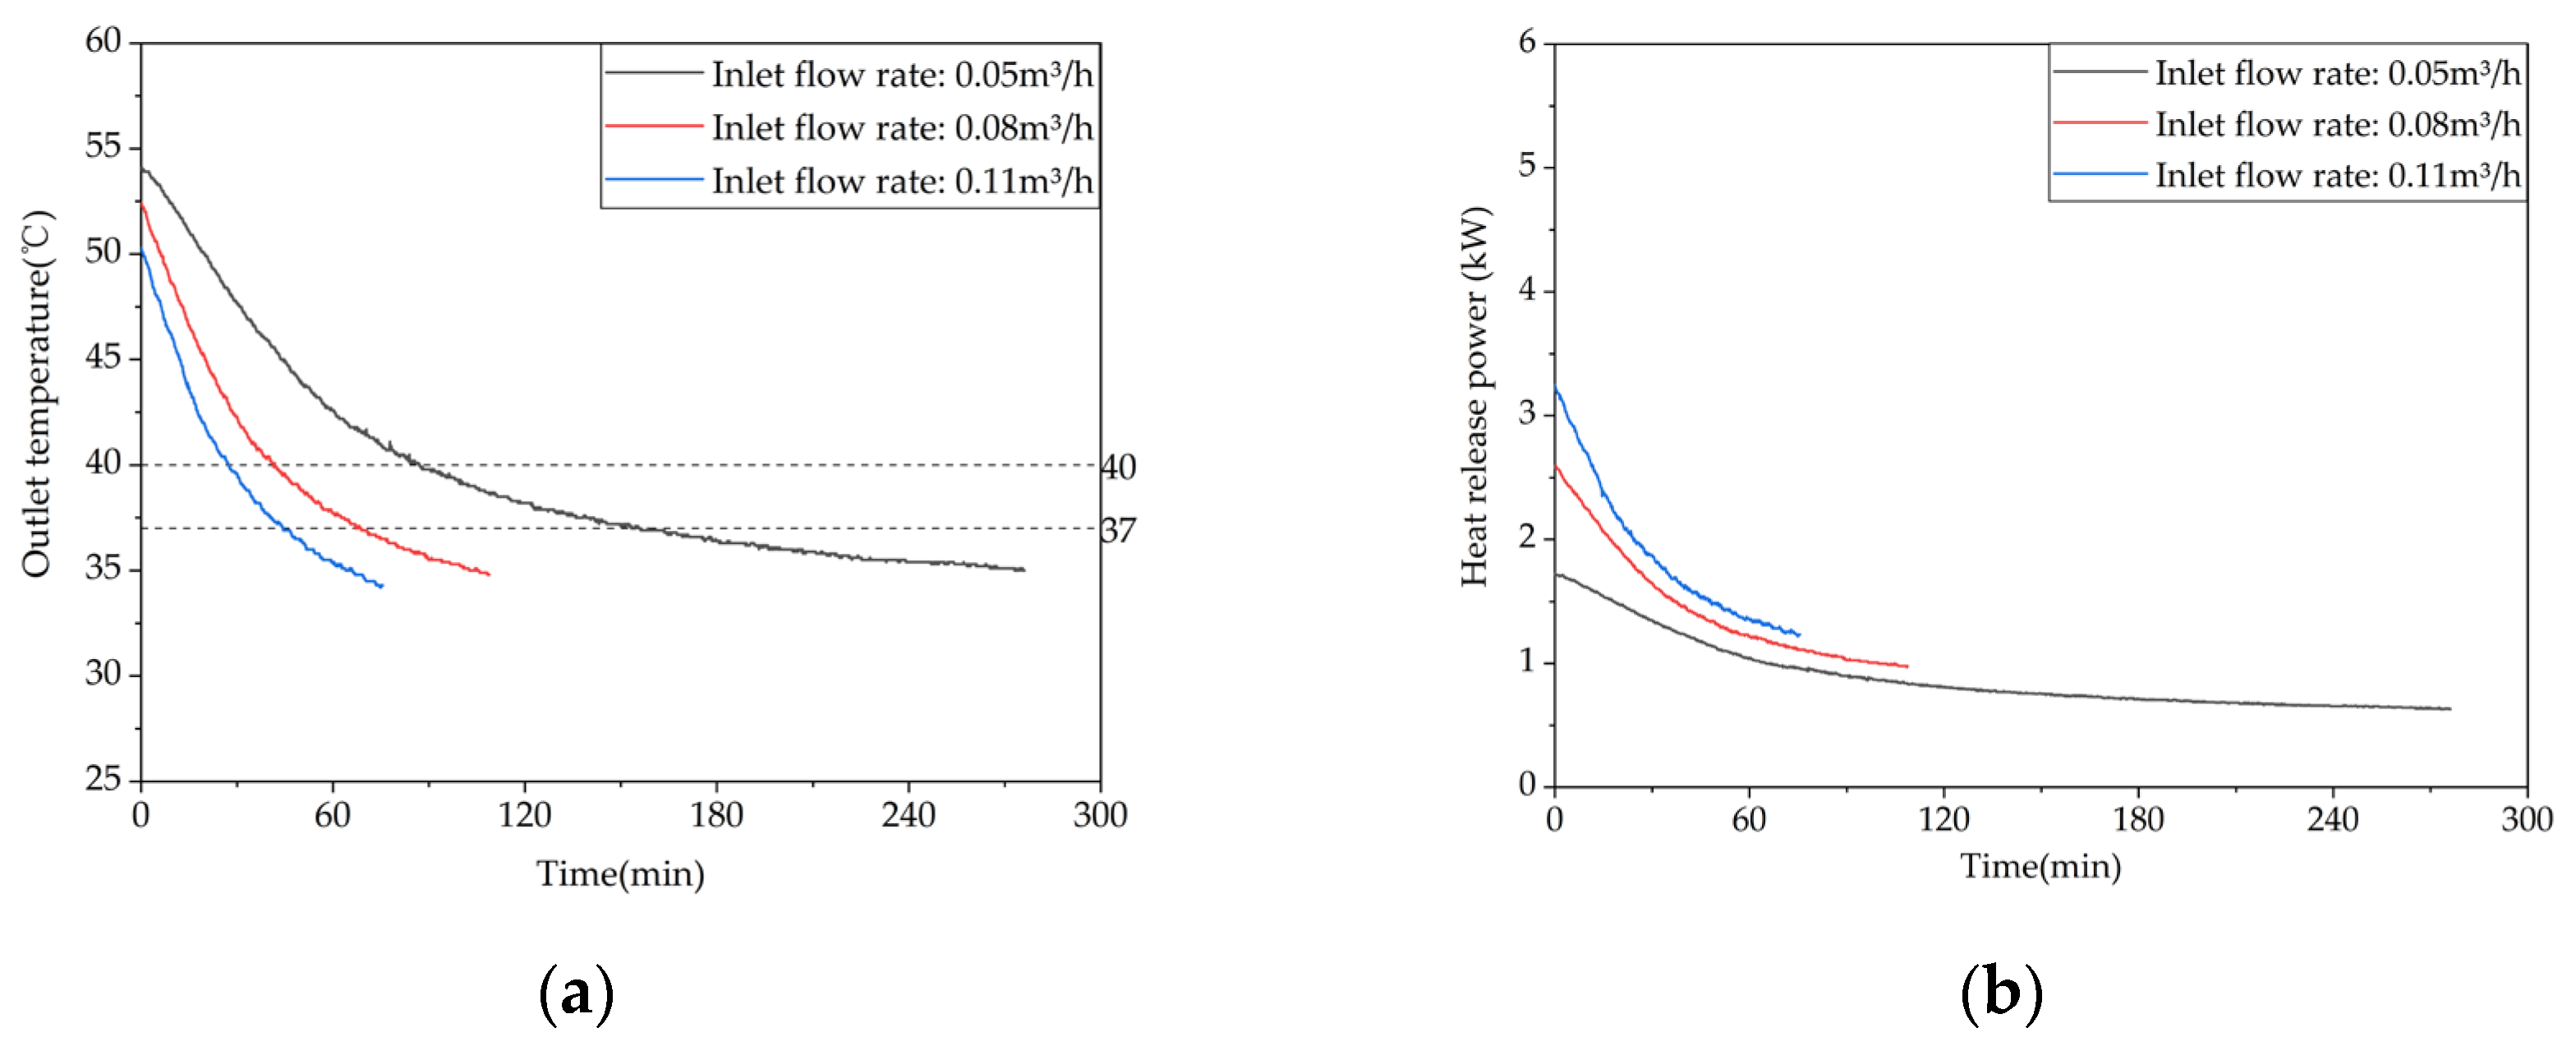
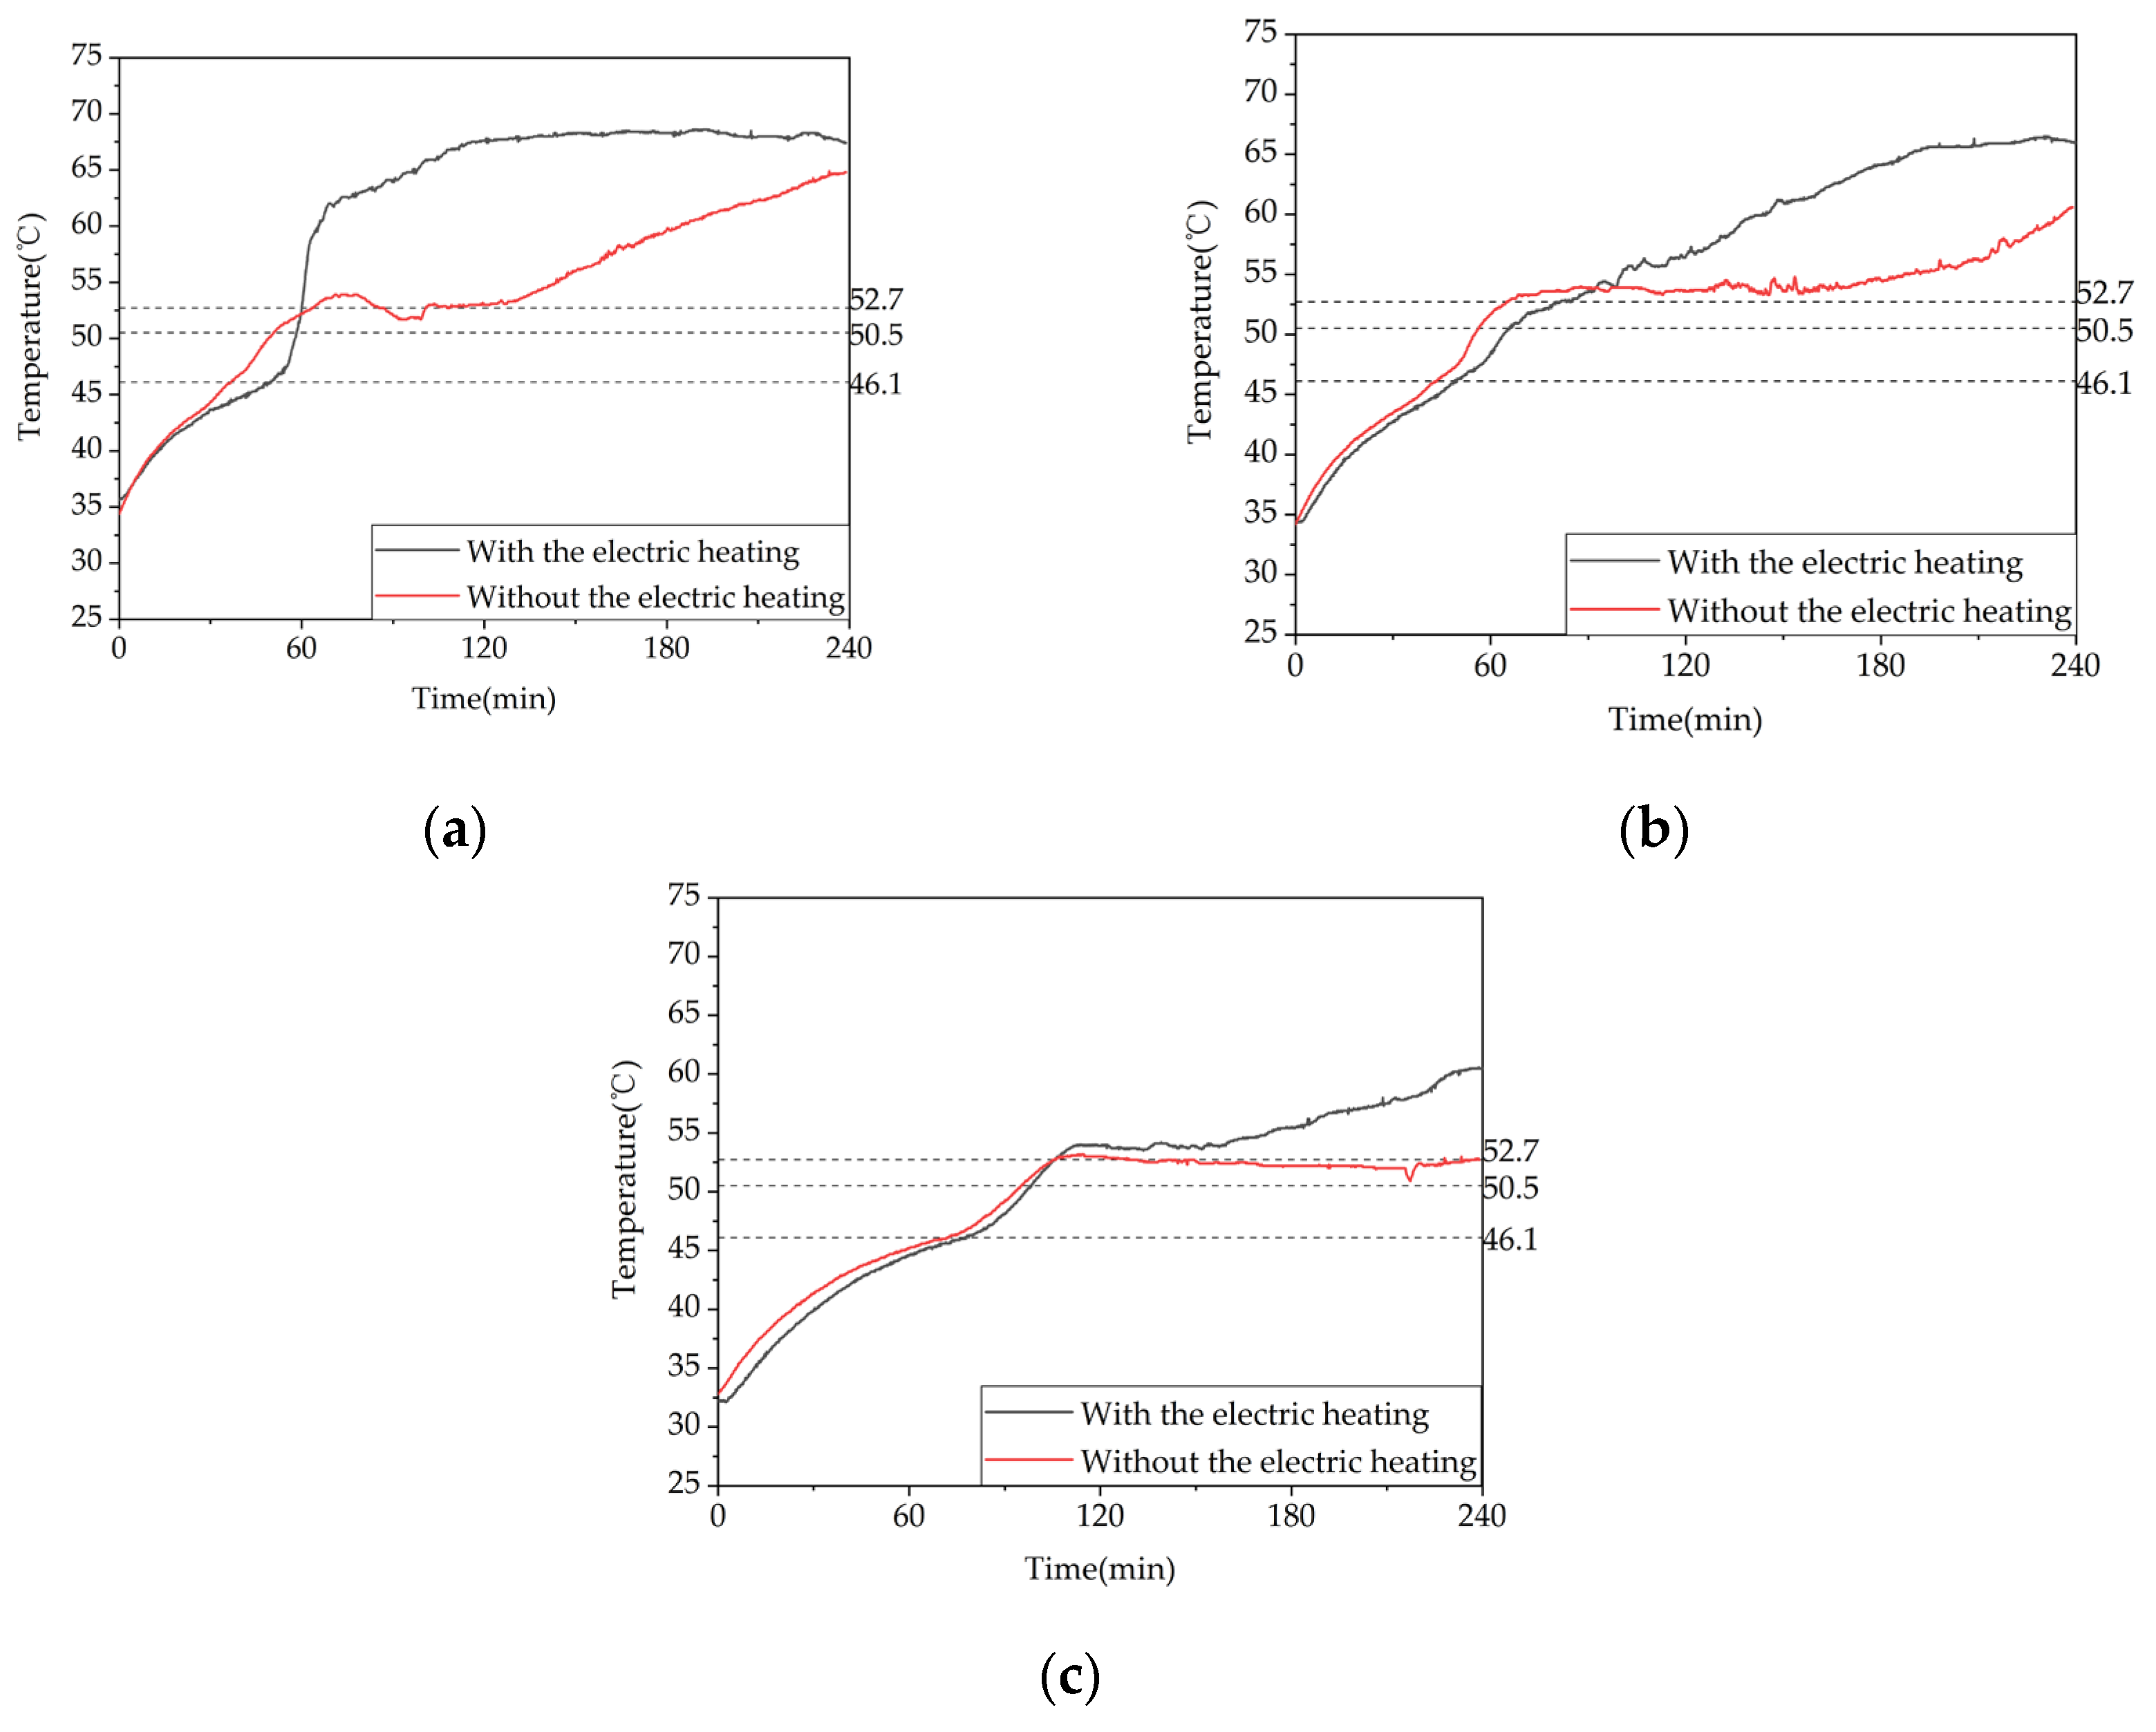
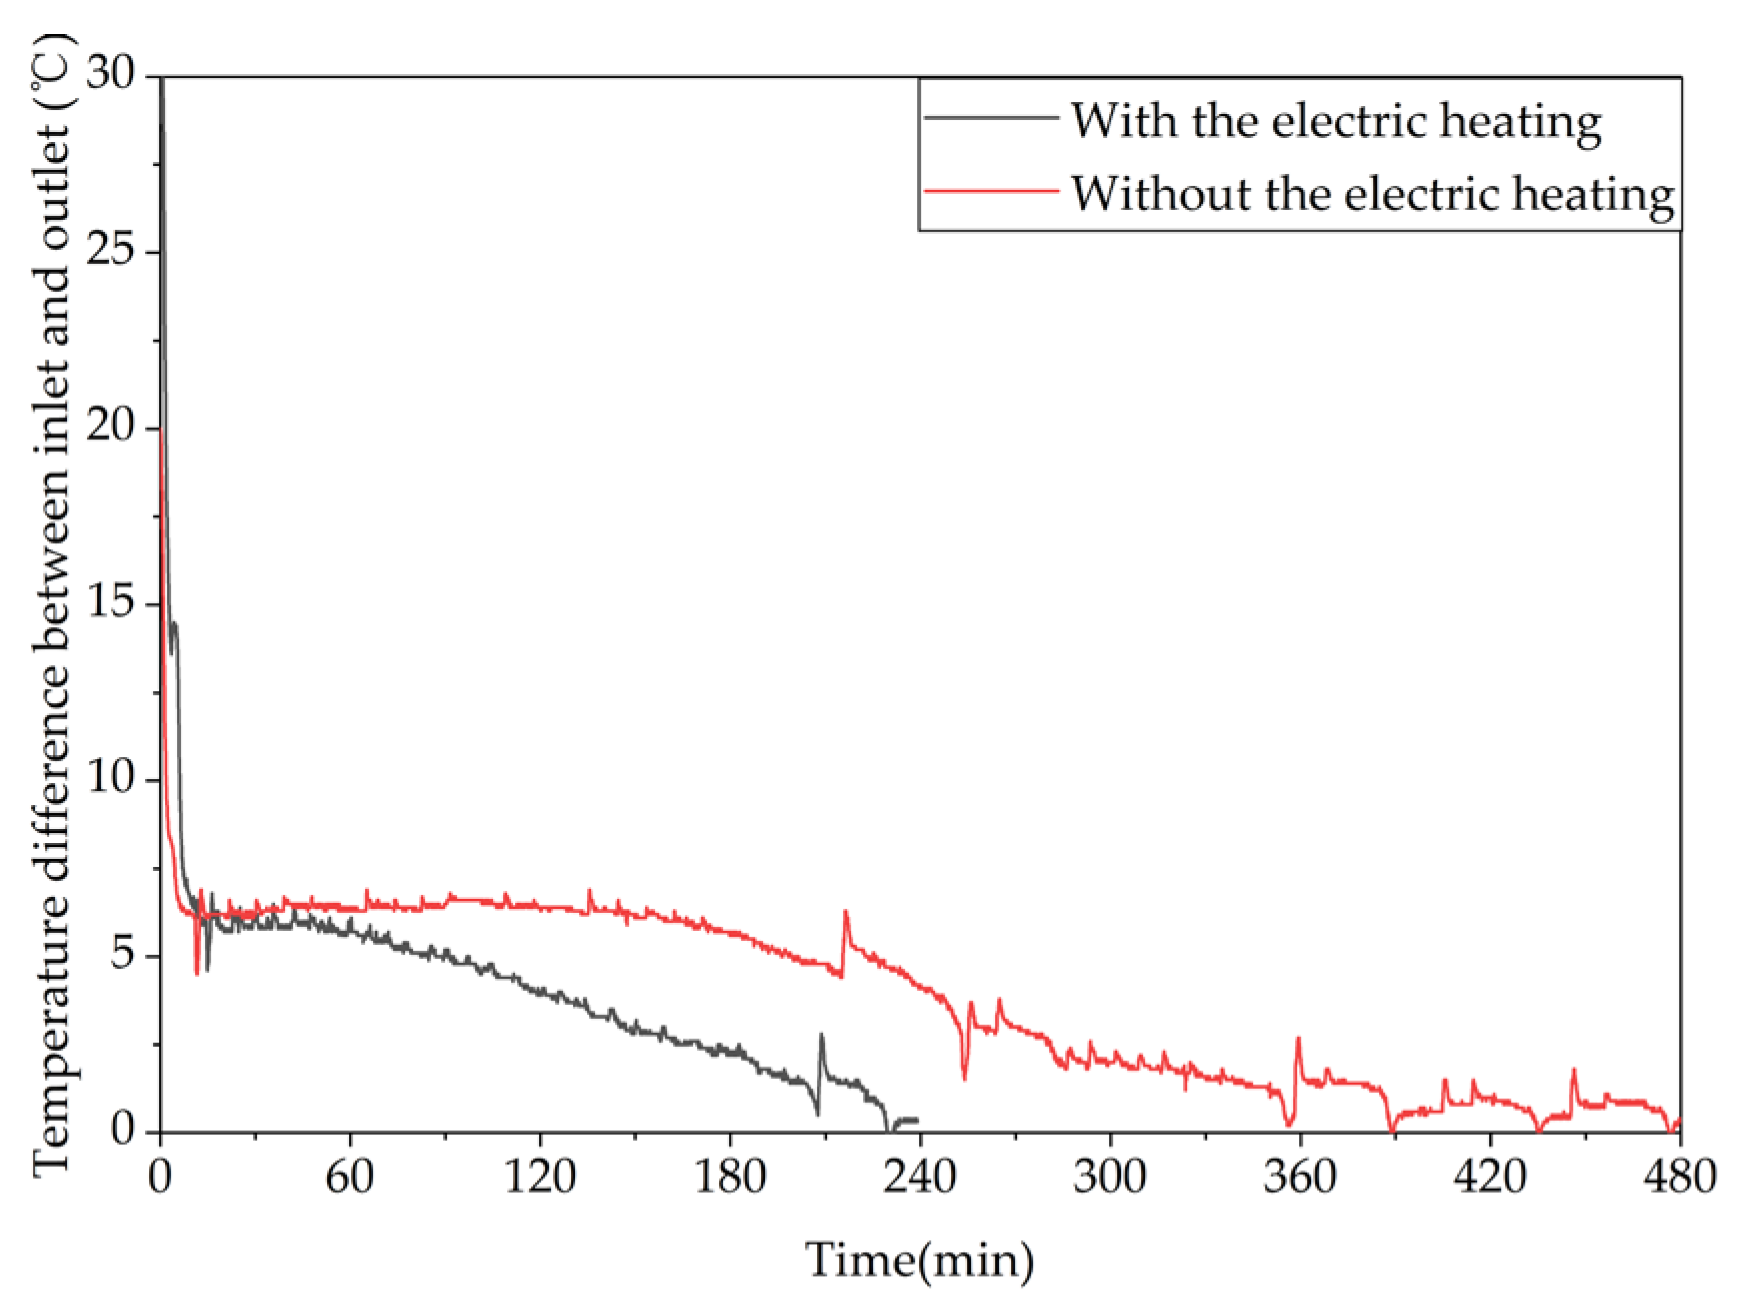
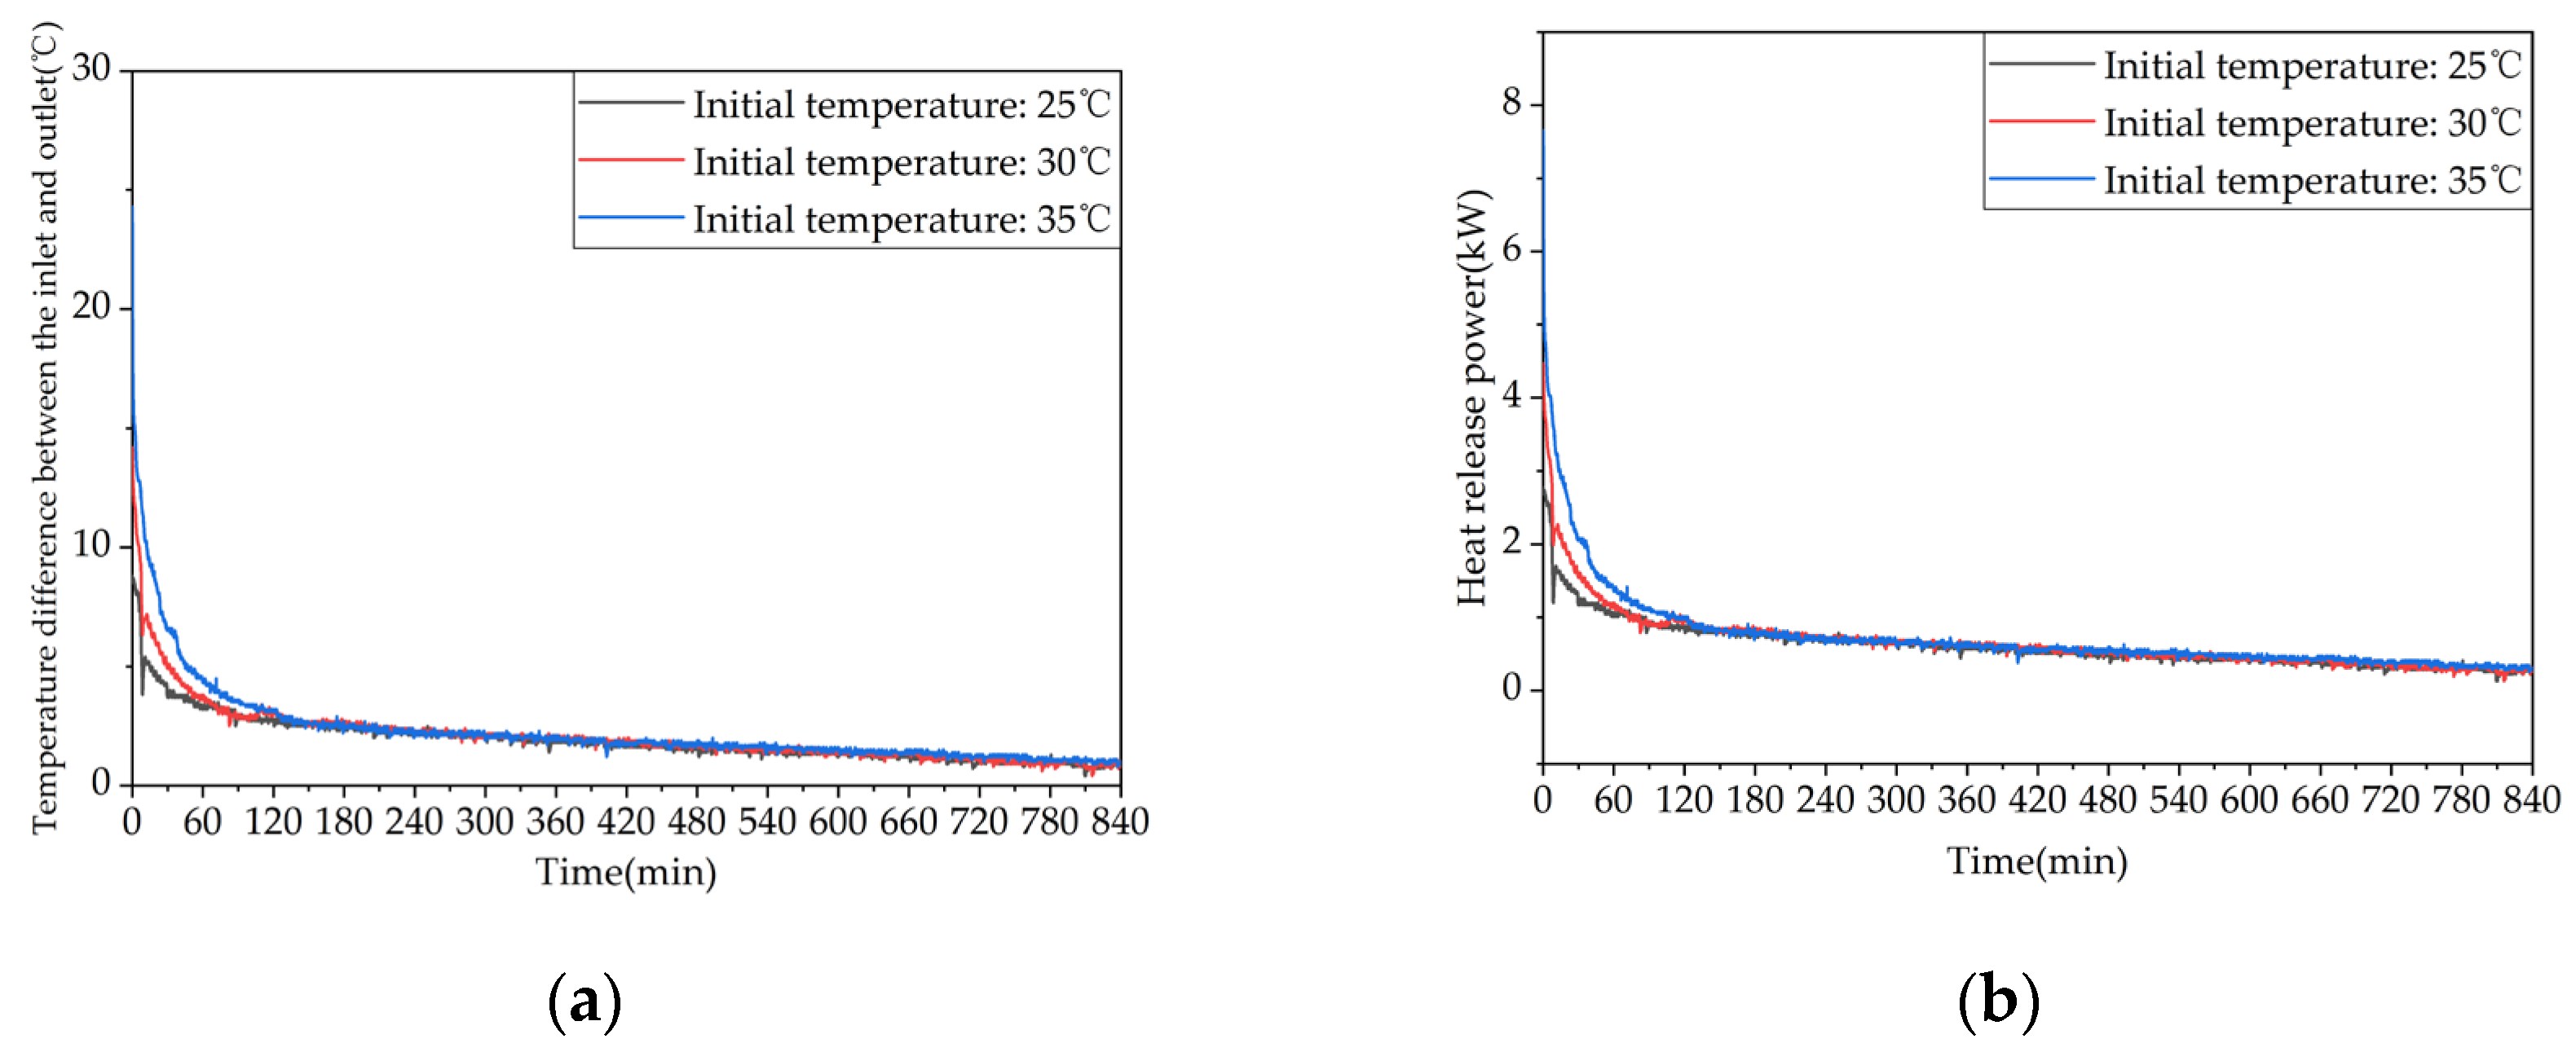
This study explains the performance changes of the system under different operating conditions, including heat storage, space heating, and domestic hot water heating, through experiments: (1) Under heat storage conditions, increasing the inlet water temperature, inlet water flow rate, and using an electric heating plate to assist in heating can all contribute to improving the heat storage performance of the system. Increasing the inlet water temperature can significantly enhance the heat storage effect, and when the heat storage temperature is low increasing the inlet water temperature has a more obvious effect on improving the heat storage rate. However, the effect of increasing the flow rate on heat storage performance is limited, and after a certain flow rate increasing the flow rate will actually cause the heat storage power to decrease. When the flow rate is increased from 0.18 m³/h to 0.27 m³/h or 0.36 m³/h, the heat storage capacity of the system only increases by 9.26% or 4.66%, respectively. Simultaneously heating hot water using an electric heating plate can significantly shorten the time required for heat storage. Compared to not using an electric heating plate, the time required for heat storage is shortened by 4.1 h when the temperature difference between the inlet and outlet water drops to 0.5 °C. (2) When the system releases heat for winter heating, reducing the inlet water temperature, increasing the inlet water flow rate, and raising the initial average temperature of the system can all contribute to improving the heat release performance of the system. The inlet water temperature has the most significant effect on the heat release effect of the system. When the inlet water temperature is decreased from 35 °C to 30 °C or 25 °C, the effective heat release of the system increases by 43.23% or 57.17%, respectively. Increasing the flow rate has a relatively weak effect on improving the heat release performance of the system. When the heat release flow rate is increased from 0.18 m³/h to 0.27 m³/h, the effective heat release of the system only increases by 8.56%. Increasing the initial average temperature of the system can significantly improve the sensible heat release power of the system. When the initial temperature of the system is increased from 53 °C to 58 °C or 63 °C, the effective heat release of the system increases by 11.96% or 28.22%, respectively. However, the improvement of heat release capacity is not significant in the later stages of heat release. (3) When the system releases heat to provide domestic hot water, increasing the make-up water temperature or reducing the inlet water flow rate can significantly increase the effective hot water output and heat release of the system. When the make-up water temperature is increased from 25 °C to 30 °C, the effective heat release of the system increases by 35.23%. When the inlet water flow rate is reduced from 0.11 m³/h to 0.08 m³/h or 0.05 m³/h, the effective heat release of the system increases by 16.46% or 65.49%, respectively.
This study investigates the effects of fin arrangement, fin spacing, fin thickness, inlet flow direction, and installation orientation on the thermal storage process through simulations. The results show that the staggered fin arrangement performs better than aligned fins, but the difference is not significant. Reducing the fin spacing and increasing the fin thickness can significantly improve the melting efficiency of the phase-change material. When the fin spacing is reduced from 70 mm to 50 mm or 30 mm, the time required for 90% of the phase-change material to melt is reduced by 7.47% and 16.42%, respectively. Increasing the fin thickness from 1 mm to 2 mm or 3 mm reduces the time required for 90% of the phase-change material to melt by 10.09% and 19.07%, respectively. The vertical installation orientation exhibits superior thermal storage characteristics compared to horizontal installation, with the difference mainly manifested in the later stage of thermal storage. When the device is horizontally installed, the thermal storage effect of the bottom-inlet and top-outlet flow direction is superior to that of the top-inlet and bottom-outlet flow direction, with the difference mainly manifested in the early stage of thermal storage. Changing the operating conditions from the horizontal installation with the top-inlet flow to horizontal installation with the bottom-inlet flow or vertical installation reduces the time required for 90% of the phase-change material to melt by 0.14% and 14.20%, respectively.
Compared with other studies [30,31,32,33,34], the phase-change thermal storage device developed in this study has a strong specificity. It is designed to match the energy utilization characteristics of small wooden structures in areas with abundant solar energy, with a target of ultra-low emissions and serving the specific needs of solar hot water systems with a dedicated phase-change thermal storage device. The device has a small footprint and high energy storage density, making it easy to install and move. The effective energy release efficiency of phase-change thermal storage devices is generally between 50% and 80%. In this study, the effective heat release efficiency under conventional heating conditions can reach more than 75%, with a relatively superior heat release performance. When used to provide domestic hot water, the device has a lower make-up water flow rate than similar devices but can provide more domestic hot water. Under outdoor temperatures of about −27 °C, it can provide more than 130 L of domestic hot water at temperatures above 37 °C. The device can effectively coordinate the energy supply–demand contradiction in small wooden solar buildings, with a conventional heat storage efficiency of more than 1.6 kW, and the phase-change material can be melted almost entirely in 5 h. The heating power of the device is stable for more than 12 h when it is above 0.4 kW. The design of the electric heating plate in the device ensures both the heat storage effect and the comprehensive utilization of solar and other renewable energy sources.
The phase-change thermal storage device designed in this paper combines the functions of extreme and non-extreme climate conditions, and the optimization of the internal structure integrates the load performance characteristics required for building heating and domestic hot water. The hot water output external interface can switch between two functions by adjusting the valve, making the use scenarios of the device more flexible and extensive, which is conducive to the deep exploration of solar energy and other renewable energy utilization.

Author Contributions

Methodology, software, investigation, and writing—original draft preparation, Y.T.; conceptualization, resources, supervision, project administration, and funding acquisition, N.Z.; validation, formal analysis, data curation, and visualization, S.L.; writing—review and editing, Y.H. All authors have read and agreed to the published version of the manuscript.

Funding

This research received no external funding.

Data Availability Statement

The manuscript included all required data and implementation information.

Conflicts of Interest

The authors declare no conflict of interest.

Appendix A

Table A1. Comparison of the heat storage performance of the units under different operating conditions.
NumberThe Initial Temperature of the Device (°C)Inlet Water Temperature (°C)Inlet Water Flow Rate (m³/h)Heat Storage ModeHeat Storage Capacity (kJ)Average Heat Storage Power (kW)
133580.27Hot water32,743.781.14
233630.27Hot water42,393.171.47
333680.27Hot water48,001.831.67
433680.18Hot water43,932.951.53
533680.36Electric heating plate + hot water48,001.831.67
633680.36Hot water45,979.921.60
Table A2. Comparison of heating and heat release performance of installations under different operating conditions.
NumberThe Initial Temperature of the Device (°C)Inlet Water Temperature (°C)Inlet Water Flow Rate
(m³/h)
Effective Heat Release Time (h)Effective Heat Release Capacity (kJ)Efficiency of the Device
763250.2712.239,508.1782.31%
863300.2713.436,004.0375.01%
963350.2711.125,137.0052.37%
1063300.1813.733,163.5269.09%
1163300.36>14>37,554.09>78.23%
1253300.2711.728,079.4985.76%
1358300.2712.331,438.8174.16%
Table A3. Comparison of domestic hot water heat release performance of installations under different operating conditions.
NumberThe Initial Temperature of the Device (°C)Inlet Water Temperature
(°C)
Inlet Water Flow Rate (m³/h)Effective Heat Release Time (min)Domestic Hot Water Volume (L)
1458250.05156130
1558250.086992
1658250.114582.5
1758300.086992
Figure A1. Small-scale wooden structure building model.
Energies 16 04148 g0a1
Figure A2. The results of the grid independence test.
Energies 16 04148 g0a2
Figure A3. The numerical models of different fin arrangement schemes: (a) fin alignment arrangement; (b) fin staggered arrangement.
Energies 16 04148 g0a3
Figure A4. The numerical models with different fin spacing: (a) 30 mm fin spacing; (b) 50 mm fin spacing; (c) 70 mm fin spacing.
Energies 16 04148 g0a4aEnergies 16 04148 g0a4b
Figure A5. The numerical models with different fin thicknesses: (a) 1 mm fin thickness; (b) 2 mm fin thickness; (c) 3 mm fin thickness.
Energies 16 04148 g0a5
Figure A6. The numerical models with different inlet flow direction and installation method: (a) horizontal inlet at top and outlet at bottom (gravity Y-axis negative direction); (b) horizontal inlet at bottom and outlet at top (gravity Y-axis negative direction); (c) numerical inlet at top and outlet at top (gravity X-axis negative direction).
Energies 16 04148 g0a6aEnergies 16 04148 g0a6b

References

  1. Xiao, J.H. Exploring the technology of solar energy application in buildings. Sci. Technol. Innov. 2019, 25, 107–108. [Google Scholar]
  2. Ke, L.; Fanneng, H. Analysis on Mainland China’s Solar Energy Distribution and Potential to Utilize Solar Energy as an Alternative Energy Source. Prog. Geogr. 2010, 29, 1049–1054. [Google Scholar]
  3. Kiatsiriroat, T.; Tiansuwan, J.; Suparos, T. Performance analysis of a directcontact thermal energy storage-solidification. Renew. Energy 2000, 20, 195–206. [Google Scholar] [CrossRef]
  4. Horibe, A.; Jang, H.; Haruki, N.; Sano, Y.; Kanbara, H.; Takahashi, K. Melting and solidification heat transfer characteristics of phase change material in a latent heat storage vessel: Effect of perforated partition plate. Int. J. Heat Mass Transf. 2015, 82, 259–266. [Google Scholar] [CrossRef]
  5. Campos-Celador, A.; Diarce, G.; Teres Zubiaga, J.; Bandos, T.V.; Garcia-Romero, A.M.; Lopez, L.M.; Sala, J.M. Design of a finned plate latent heat thermal energy storage system for domestic applications. In Proceedings of the 2nd International Conference on Solar Heating and Cooling for Buildings and Industry (SHC 2013), Freiburg, Germany, 23–25 September 2013; Haberle, A., Ed.; Elsevier: Amsterdam, The Netherlands, 2014; Volume 48, pp. 300–308. [Google Scholar]
  6. Prieto, M.M.; Suárez, I.; González, B. Analysis of the thermal performance of flat plate PCM heat exchangers for heating systems. Appl. Therm. Eng. 2017, 116, 11–23. [Google Scholar] [CrossRef]
  7. Agyenim, F.; Hewitt, N.; Eames, P.; Smyth, M. A review of materials, heat transfer and phase change problem formulation for latent heat thermal energy storage systems (LHTESS). Renew. Sustain. Energy Rev. 2010, 14, 615–628. [Google Scholar] [CrossRef]
  8. Seban, R.A.; McLaughlin, E.F. Heat transfer in tube coils with laminar and turbulent flow. Int. J. Heat Mass Transf. 1963, 6, 387–395. [Google Scholar] [CrossRef]
  9. Cheng, X.; Ren, X.; Li, Y.; Li, M. Numerical Simulation of Spiral Pipe for Phase Change Heat Storage. J. WUT (Inf. Manag. Eng.) 2015, 6, 822–826. [Google Scholar]
  10. Duan, W.; Lu, Y. Experimental Study on the Heat Performance of Shell-Tube Based PCM Storage by Utilizing Off-Peak Power. J. Eng. Thermophys. 2019, 40, 1169–1179. [Google Scholar]
  11. Vyshak, N.R.; Jilani, G. Numerical analysis of latent heat thermal energy storage system. Energy Convers. Manag. 2007, 48, 2161–2168. [Google Scholar] [CrossRef]
  12. Liang, H.; Niu, J.; Gan, Y. Performance optimization for shell-and-tube PCM thermal energy storage. J. Energy Storage 2020, 30, 101421. [Google Scholar] [CrossRef]
  13. Tay, N.H.S.; Bruno, F.; Belusko, M. Comparison of pinned and finned tubes in a phase change thermal energy storage system using CFD. Appl. Energy 2013, 104, 79–86. [Google Scholar] [CrossRef]
  14. Rathod, M.K.; Banerjee, J. Thermal performance enhancement of shell and tube Latent Heat Storage Unit using longitudinal fins. Appl. Therm. Eng. 2015, 75, 1084–1092. [Google Scholar] [CrossRef]
  15. Mat, S.; Al-Abidi, A.A.; Sopian, K.; Sulaiman, M.Y.; Mohammad, A.T. Enhance heat transfer for PCM melting in triplex tube with internal-external fins. Energy Convers. Manag. 2013, 74, 223–236. [Google Scholar] [CrossRef]
  16. Al-Abidi, A.A.; Mat, S.; Sopian, K.; Sulaiman, M.Y.; Mohammad, A.T. Internal and external fin heat transfer enhancement technique for latent heat thermal energy storage in triplex tube heat exchangers. Appl. Therm. Eng. 2013, 53, 147–156. [Google Scholar] [CrossRef]
  17. Yuan, P.; Hao, Y.; Wang, J.; Lv, Y. Numerical Simulation on Solid-liquid Phase Change Process of Thermal Storage Equipment with Inner Fins. J. N. China Univ. Water Resour. Electr. Power (Nat. Sci. Ed.) 2016, 37, 89–92. [Google Scholar]
  18. Castell, A.; Sole, C.; Medrano, M.; Roca, J.; Cabeza, L.F.; Garcia, D. Natural convection heat transfer coefficients in phase change material (PCM) modules with external vertical fins. Appl. Therm. Eng. 2008, 28, 1676–1686. [Google Scholar] [CrossRef]
  19. Prieto, M.M.; Gonzalez, B.; Granado, E. Thermal performance of a heating system working with a PCM plate heat exchanger and comparison with a water tank. Energy Build. 2016, 122, 89–97. [Google Scholar] [CrossRef]
  20. Bansal, N.K.; Buddhi, D. An Analytical Study of a Latent Heat Storage System in a Cylinder. Energy Convers. Manag. 1992, 33, 235–242. [Google Scholar] [CrossRef]
  21. Rathod, M.K.; Kanzaria, H.V. A methodological concept for phase change material selection based on multiple criteria decision analysis with and without fuzzy environment. Mater. Design 2011, 32, 3578–3585. [Google Scholar] [CrossRef]
  22. Xu, H.; Sze, J.Y.; Romagnoli, A.; Py, X. Selection of Phase Change Material for Thermal Energy Storage in Solar Air Conditioning Systems. Energy Procedia 2017, 105, 4281–4288. [Google Scholar] [CrossRef]
  23. Hosseini, M.J.; Ranjbar, A.A.; Sedighi, K.; Rahimi, M. A combined experimental and computational study on the melting behavior of a medium temperature phase change storage material inside shell and tube heat exchanger. Int. Commun. Heat Mass Transf. 2012, 39, 1416–1424. [Google Scholar] [CrossRef]
  24. Rathod, M.K.; Banerjee, J. Experimental Investigations on Latent Heat Storage Unit Using Paraffin Wax as Phase Change Material. Exp. Heat Transf. 2014, 27, 40–55. [Google Scholar] [CrossRef]
  25. Wang, L.-L.; Wang, Y.; Wang, W.-W.; Wang, L.-B. Fully Coupled Numerical Analysis on Thermal Storage Performance of Shell and Tube Bundle Latent Heat Thermal Storage. J. Lanzhou Jiaotong Univ. 2019, 38, 65–74. [Google Scholar]
  26. Hou, P.; Mao, J.; Liu, R.; Chen, F. Design and Operating Characteristics of Heat Storage Device for Annular Unit. J. Refrig. 2018, 39, 98–107. [Google Scholar]
  27. Ni, S.; Zhu, N.; Zhang, Z.; Hou, Y.; Li, S. The operational performance of net zero energy wooden structure building in the severe cold zone: A case study in Hailar of China. Energy Build. 2022, 257, 111788. [Google Scholar] [CrossRef]
  28. Baker, T.J. Mesh generation: Art or science? Prog. Aerosp. Sci. 2005, 41, 29–63. [Google Scholar] [CrossRef]
  29. Yu, B.; Li, J.; Sun, D. Practical Training of Numerical Heat Transfer; Science Press: Beijing, China, 2018; pp. 12–27. [Google Scholar]
  30. Kalapala, L.; Devanuri, J.K. Energy and exergy analyses of latent heat storage unit positioned at different orientations—An experimental study. Energy 2020, 194, 116924. [Google Scholar] [CrossRef]
  31. GB50015-2019; Standard for Buliding Water Supply and Drainage. Ministry of Housing and Urban-Rural Development of the People’s Republic of China, State Administration for Maket Regulation: Beijing, China, 2019; pp. 12–27.
  32. Al Siyabi, I.; Khanna, S.; Mallick, T.; Sundaram, S. An experimental and numerical study on the effect of inclination angle of phase change materials thermal energy storage system. J. Energy Storage 2019, 23, 57–68. [Google Scholar] [CrossRef]
  33. Mahdi, M.S.; Hasan, A.F.; Mahood, H.B.; Campbell, A.N.; Khadom, A.A.; Karim, A.M.E.A.; Sharif, A.O. Numerical study and experimental validation of the effects of orientation and configuration on melting in a latent heat thermal storage unit. J. Energy Storage 2019, 23, 456–468. [Google Scholar] [CrossRef]
  34. Khobragade, S.; Devanuri, J.K. Impact of inclination on the thermal performance of shell and tube latent heat storage system under simultaneous charging and discharging: Numerical investigation. Appl. Therm. Eng. 2022, 214, 118811. [Google Scholar] [CrossRef]
Disclaimer/Publisher’s Note: The statements, opinions, and data contained in all publications are solely those of the individual author(s) and contributor(s) and not of MDPI and/or the editor(s). MDPI and/or the editor(s) disclaim responsibility for any injury to people or property resulting from any ideas, methods, instructions, or products referred to in the content.
Figure 1. Physical model of the phase-change heat storage system.
Energies 16 04148 g001
Figure 2. A mesh model of phase-change TES system.
Energies 16 04148 g002
Figure 3. Experimental setup for testing the performance of the phase-change TES device.
Energies 16 04148 g003
Figure 4. Schematic of the experimental system.
Energies 16 04148 g004
Figure 5. The real structure of phase-change TES device.
Energies 16 04148 g005
Figure 6. Arrangement of thermocouple measurement points within the unit case: (a) tube coil 1; (b) tube coil 2; (c) tube coil 3.
Energies 16 04148 g006
Figure 7. DSC performance test curve of PCM TH-SL49.
Energies 16 04148 g007
Figure 8. The temperature–time curves of simulated and experimental measurement points: (a) inlet temperature of 58 °C and flow rate of 0.27 L/s; (b) inlet temperature of 63 °C and flow rate of 0.27 L/s.
Energies 16 04148 g008
Figure 9. Temperature variation inside the phase-change heat storage: (a) heat storage condition (with the inlet water temperature of 63 °C and an inlet flow rate of 0.27 m³/h); (b) heat release condition of heating (with the initial temperature of the device at 58 °C and the water inlet temperature and flow rate at 30 °C and 0.27 m³/h, respectively; (c) domestic hot water heat release condition (with the initial temperature of 58 °C, an inlet water temperature of 25 °C, and a flow rate of 0.05 m³/h).
Energies 16 04148 g009
Figure 10. Temperature variation inside the phase-change heat storage unit at typical locations under different heat storage conditions: (a) measuring point 13; (b) measuring point 17; (c) measuring point 21.
Energies 16 04148 g010
Figure 11. Different trends of the temperature difference between the inlet and outlet of the device over time under different inlet water temperatures.
Energies 16 04148 g011
Figure 12. Temperature variation inside the phase-change heat storage unit at typical locations under different heat storage conditions: (a) measuring point 13; (b) measuring point 17; (c) measuring point 21.
Energies 16 04148 g012
Figure 13. Heat release performance of the device at different inlet water temperatures: (a) temperature difference between inlet and outlet; (b) instantaneous heat release power.
Energies 16 04148 g013
Figure 14. Temperature variation inside the phase change storage device for domestic hot water under different inlet water temperatures: (a) inlet water temperature: 25 °C; (b) inlet water temperature: 25 °C.
Energies 16 04148 g014
Figure 15. Heat release performance of the device at different inlet water temperatures: (a) temperature difference between inlet and outlet; (b) instantaneous heat release power.
Energies 16 04148 g015
Figure 16. Temperature variation inside the phase-change heat storage unit at typical locations under different heat storage conditions: (a) measuring point 13; (b) measuring point 17; (c) measuring point 21.
Energies 16 04148 g016
Figure 17. Different trends of the temperature difference between the inlet and outlet of the device over time under different inlet flow rates.
Energies 16 04148 g017
Figure 18. Temperature variation inside the phase-change heat storage unit at typical locations under different heat storage conditions: (a) measuring point 13; (b) measuring point 17; (c) measuring point 21.
Energies 16 04148 g018
Figure 19. Heat release capacity of the device at different inlet flow rates: (a) temperature difference between inlet and outlet; (b) instantaneous heat release power.
Energies 16 04148 g019
Figure 20. Temperature variation inside the phase change storage device for domestic hot water under different inlet water temperatures: (a) inlet flow rate: 0.05 m³/h; (b) inlet flow rate: 0.08 m³/h; (c) inlet flow rate: 0.11 m³/h.
Energies 16 04148 g020
Figure 21. Heat release capacity of the device at different inlet flow rates: (a) temperature difference between inlet and outlet; (b) instantaneous heat release power.
Energies 16 04148 g021
Figure 22. Temperature variation inside the phase-change heat storage unit at typical locations under different heat storage conditions: (a) measuring point 13; (b) measuring point 17; (c) measuring point 21.
Energies 16 04148 g022
Figure 23. Different trends of the temperature difference between the inlet and outlet of the device over time under different heating methods.
Energies 16 04148 g023
Figure 24. Temperature variation inside the phase-change heat storage unit at typical locations under different heat storage conditions: (a) measuring point 13; (b) measuring point 17; (c) measuring point 21.
Energies 16 04148 g024
Figure 25. Heat release capacity of the device at initial temperature of the device: (a) temperature difference between inlet and outlet; (b) instantaneous heat release power.
Energies 16 04148 g025
Figure 26. The simulated cloud maps for different fin arrangement configurations: (a) liquid-phase fraction; (b) device temperature.
Energies 16 04148 g026
Figure 27. The liquid fraction and average temperature of the phase-change heat storage unit vary with different fin arrangements.
Energies 16 04148 g027
Figure 28. The simulated cloud maps for different fin spacing arrangements: (a) liquid-phase fraction; (b) device temperature.
Energies 16 04148 g028
Figure 29. The liquid fraction and average temperature of the phase-change heat storage unit vary with different fin spacing.
Energies 16 04148 g029
Figure 30. The simulated cloud maps for different fin thicknesses: (a) liquid-phase fraction; (b) device temperature.
Energies 16 04148 g030
Figure 31. The liquid fraction and average temperature of the phase-change heat storage unit vary with different fin thicknesses.
Energies 16 04148 g031
Figure 32. The simulated cloud maps for different inlet directions and installation orientations: (a) liquid-phase fraction; (b) device temperature.
Energies 16 04148 g032
Figure 33. The liquid fraction and average temperature of the phase-change heat storage unit vary with different inlet flow directions and installation orientations.
Energies 16 04148 g033
Table 1. Detailed parameters of the main components inside the phase-change TES device.
NameMaterialRelevant Parameters
Heat storage tank304 stainless steel Internal dimensions: 820 × 320 × 800 mm
Wall thickness: 2 mm
Diameter: 18 mm
External diameter: 20 mm
Finned tube coil304 stainless steel Vertical center distance between adjacent coils: 304 mm
Horizontal center distance between adjacent coils: 80 mm
Distance to the bottom wall of the box: 25 mm
Distance to the top wall: 128 mm
Electric heating plateAluminiumDimensions: 700 × 25 × 800 mm
Distance to the top wall surface: 80 mm
Table 2. The main equipment and instrument parameters of the experiment.
NameManufacturer SourceModelRelevant Parameters
Electric boilerA.O. SmithDSE-50-90Heating power: 18 kW
Temperature control range for water: 30~88 °C
Rated capacity: 190 L
Minimum differential temperature: 1 °C
Air-cooled chillerZhongke KechuangyiKYKY-LS 65ACooling capacity: 6.5 kW
Water temperature control range: 10~25 °C
Water tank capacity: 40 L
Water control accuracy: ±0.2 °C
Variable-frequency constant-pressure circulating pumpGrundfosCM5-3Rated power: 650 W
Max. variable flow rate: 4.7 m3/h
Electromagnetic flowmeterMeikonLDG-SUP-DN10Measurement range: 0~1.4 m³/h
Accuracy class: ±0.5% R
Rotor flowmeterJuyi InstrumentLZB-WS-10GMeasurement range: 16~160 L/h
ThermocoupleXiamen MingkongK-typeLength: 2.5 m
Data loggerYokogawaMX-100Inputs for DVC/TC/DI/RTD
Electric heating plateJiangsu BuchenBydr-1Voltage: 220 V
Power: 3000 W
Table 3. Heat storage test conditions.
NumberThe Initial Temperature of the Device (°C)Inlet Water Temperature (°C)Inlet Water Flow Rate (m3/h)Heat Storage Mode
133580.27Hot water
233630.27Hot water
333680.27Hot water
433680.18Hot water
533680.36Electric heating plate + Hot water
633680.36Hot water
Table 4. Heat release test conditions.
NumberNumberThe Initial Temperature of the Device (°C)Inlet Water Temperature (°C)Inlet Water Flow Rate (m3/h)
Heating release condition763250.27
863300.27
963350.27
1063300.18
1163300.36
1253300.27
1358300.27
Domestic hot water release condition1458250.05
1558250.08
1658250.11
1758300.08
Disclaimer/Publisher’s Note: The statements, opinions and data contained in all publications are solely those of the individual author(s) and contributor(s) and not of MDPI and/or the editor(s). MDPI and/or the editor(s) disclaim responsibility for any injury to people or property resulting from any ideas, methods, instructions or products referred to in the content.

