1. Introduction
At present, the optimal production operation of large industrial loads poses a challenge that requires long-term sustainable solutions [
1]. This task is further complicated by the need to meet the environmental objectives set by regulatory authorities [
2]. Recent global events, which have resulted in very high electricity prices and highly volatile markets, have emphasized the importance of accurate DAM price forecasting for successful market participation. This is especially true for energy-intensive industrial loads, which directly procure energy from wholesale markets.
As such, electricity price forecasting (EPF) has become a problem of increasing complexity due to various factors, such as the transformation of the energy sector and geopolitical challenges in the power industry. The participation of weather-based, variable energy resources and the implementation difficulties of grid-scale storage solutions, combined with the rising prices of natural gas (NG) and carbon emissions (CO
2), have led to acute volatilities in the electricity markets. Given the above developments, the selection of NG as a transition fuel due to its technical characteristics and economic viability seems to be at risk [
3].
Several forecasting models have been proposed in the literature for EPF [
4]. These models can be broadly categorized into two groups: statistical and machine learning (ML). In [
5,
6], traditional time series techniques are employed for the prediction of electricity price. In both studies, a set of standard system predictors (system load, RES) are included. The results highlight the importance of including system data in the analysis, since they provide critical information about the power system. Nevertheless, the non-linearities between these data and electricity price can not be fully captured by linear models; thus, it is necessary to introduce models that capture non-linearities. To this end, ML models have gained increasing attention in recent years, especially for short-time forecasting horizons where the non-linearities are more evident [
4].
The ML models, which are mostly employed for EPF purposes, are random forest, XGBoost, CNN and LSTM [
7,
8,
9]. In [
10], the RF algorithm is employed to forecast Iberian electricity data, providing accurate results. The algorithm is compared with a benchmark method and outperforms it in all the different forecasting horizons. In [
11], an LSTM network is developed for the prediction of electricity prices from PJM market on a day-ahead horizon. The results showcase that LSTM consistently performs better than traditional ML algorithms by fully exploiting the hidden information in the electricity price. The existing literature shows that, in terms of ML models, the RF and LSTM models present consistently accurate results on different datasets, especially on a day-ahead forecasting horizon; thus, they were selected for extensive study in this work [
4].
Fuzzy neural networks are also employed, since they are able to handle complex and nonlinear relationships between input variables and electricity price [
12,
13]. In [
14], a fuzzy model is developed to predict hourly PJM data architecture, considering past price load and temperature information. The approach relies on the Mamdani Inference Method to create the fuzzy rules in the network, which can greatly influence the forecasting performance. The model has a single output node and every prediction is used as an input to the subsequent forecast. The results clearly indicate the relationship between power system data and the electricity market price. The developed fuzzy logic models found in the literature do not combine predictions from single (stand-alone) forecasting algorithms. Instead, their results rely on a standard set of external inputs related to the electricity market. For that reason, in this study, we first considered the performance of stand-alone ML algorithms, calculated their performance metrics and finally combined them in a fuzzy based architecture, aiming to achieve the minimum possible error.
Large industries are keen to incorporate accurately forecasted electricity prices into their decision support mechanisms and re-consider the scheduling of various industrial processes. In [
15], the economic benefits of integrating an electricity price forecast in the process of industrial scheduling are studied. The results conclude that the benefits for the industry largely depend on the response time of the industrial load to the electricity price fluctuations. In [
16], an energy-cost-oriented scheduling process is designed under different forecasting scenarios, which are directly used by the EPEX spot for the German/Austrian case. Consumer environmental awareness (CEA) provides further incentives to energy-intensive industries regarding the adoption of energy-efficient strategies. In [
17], a study with a plethora of mathematical models (with respect to CEA constraints) is presented, which could support industrial companies’ adoption of such policies. In [
18], a hybrid mathematical model is presented, addressing integrated production scheduling, maintenance planning and energy controlling for manufacturing systems. Finally, a recent trend includes collaboration schemes between industrial enterprises and energy providers, based on a consideration of the time-varying energy price tariffs. In [
19] the energy-efficiency mandate is accommodated via a demand response framework for energy-intensive industries, while in [
20], price signals are provided to the industrial manufacturers to optimise their production scheduling process.
This paper proposes a novel ensemble forecasting model, which combines predictions from two different algorithms. The two selected algorithms are extensively studied in the EPF literature. They consistently present more accurate results compared to traditional time series techniques and other ML algorithms. The combination of these algorithms under a fuzzy-based architecture further enhances the forecasting performance, since the robustness and accuracy of the models are considerably improved. The forecasting tool is incorporated into an optimization problem, which considers the scheduling process of an industrial facility. The energy costs of the facilities are reflected in the electricity price data; thus, accurate forecasting is essential considering the increasing volatility in the markets. The contributions of this work are as follows:
A ensemble forecasting fuzzy model, which involves the output of two different ML algorithms considering market data from neighboring countries.
A scheduling model for industries, incorporating the uncertainty from DAM price prediction.
Validation of the proposed framework in different EU markets.
This paper has been organized as follows:
Section 1 and
Section 2 indicate the various proposed algorithms and how they are integrated into the forecasting framework,
Section 3 compares the different algorithms and indicates the outcome of the forecaster considering data from different countries,
Section 4 shows how the price-forecasting algorithm can be integrated into the decision support system of an industry, and
Section 5 highlights the superiority of the forecasting approach if additional data from neighboring countries are considered.
2. Methodology
The development of a detailed forecaster tool for DAM price prediction is a crucial step in ensuring successful market participation, particularly for energy-intensive industrial loads that procure energy from electricity markets. Market participation refers to the energy procurement, which is directly related to the scheduling process of the industrial facility. Typically, the scheduling procedure occurs anywhere from several weeks in advance to as little as one day prior, depending on the application. The aim is to secure an appropriate quantity of energy in the day-ahead market, which often offers more favorable prices for the industry compared to markets closer to real-time. If the amount of energy is over- or under-procured, the industrial facility is typically responsible for paying the price arbitrage, leading to higher energy costs.
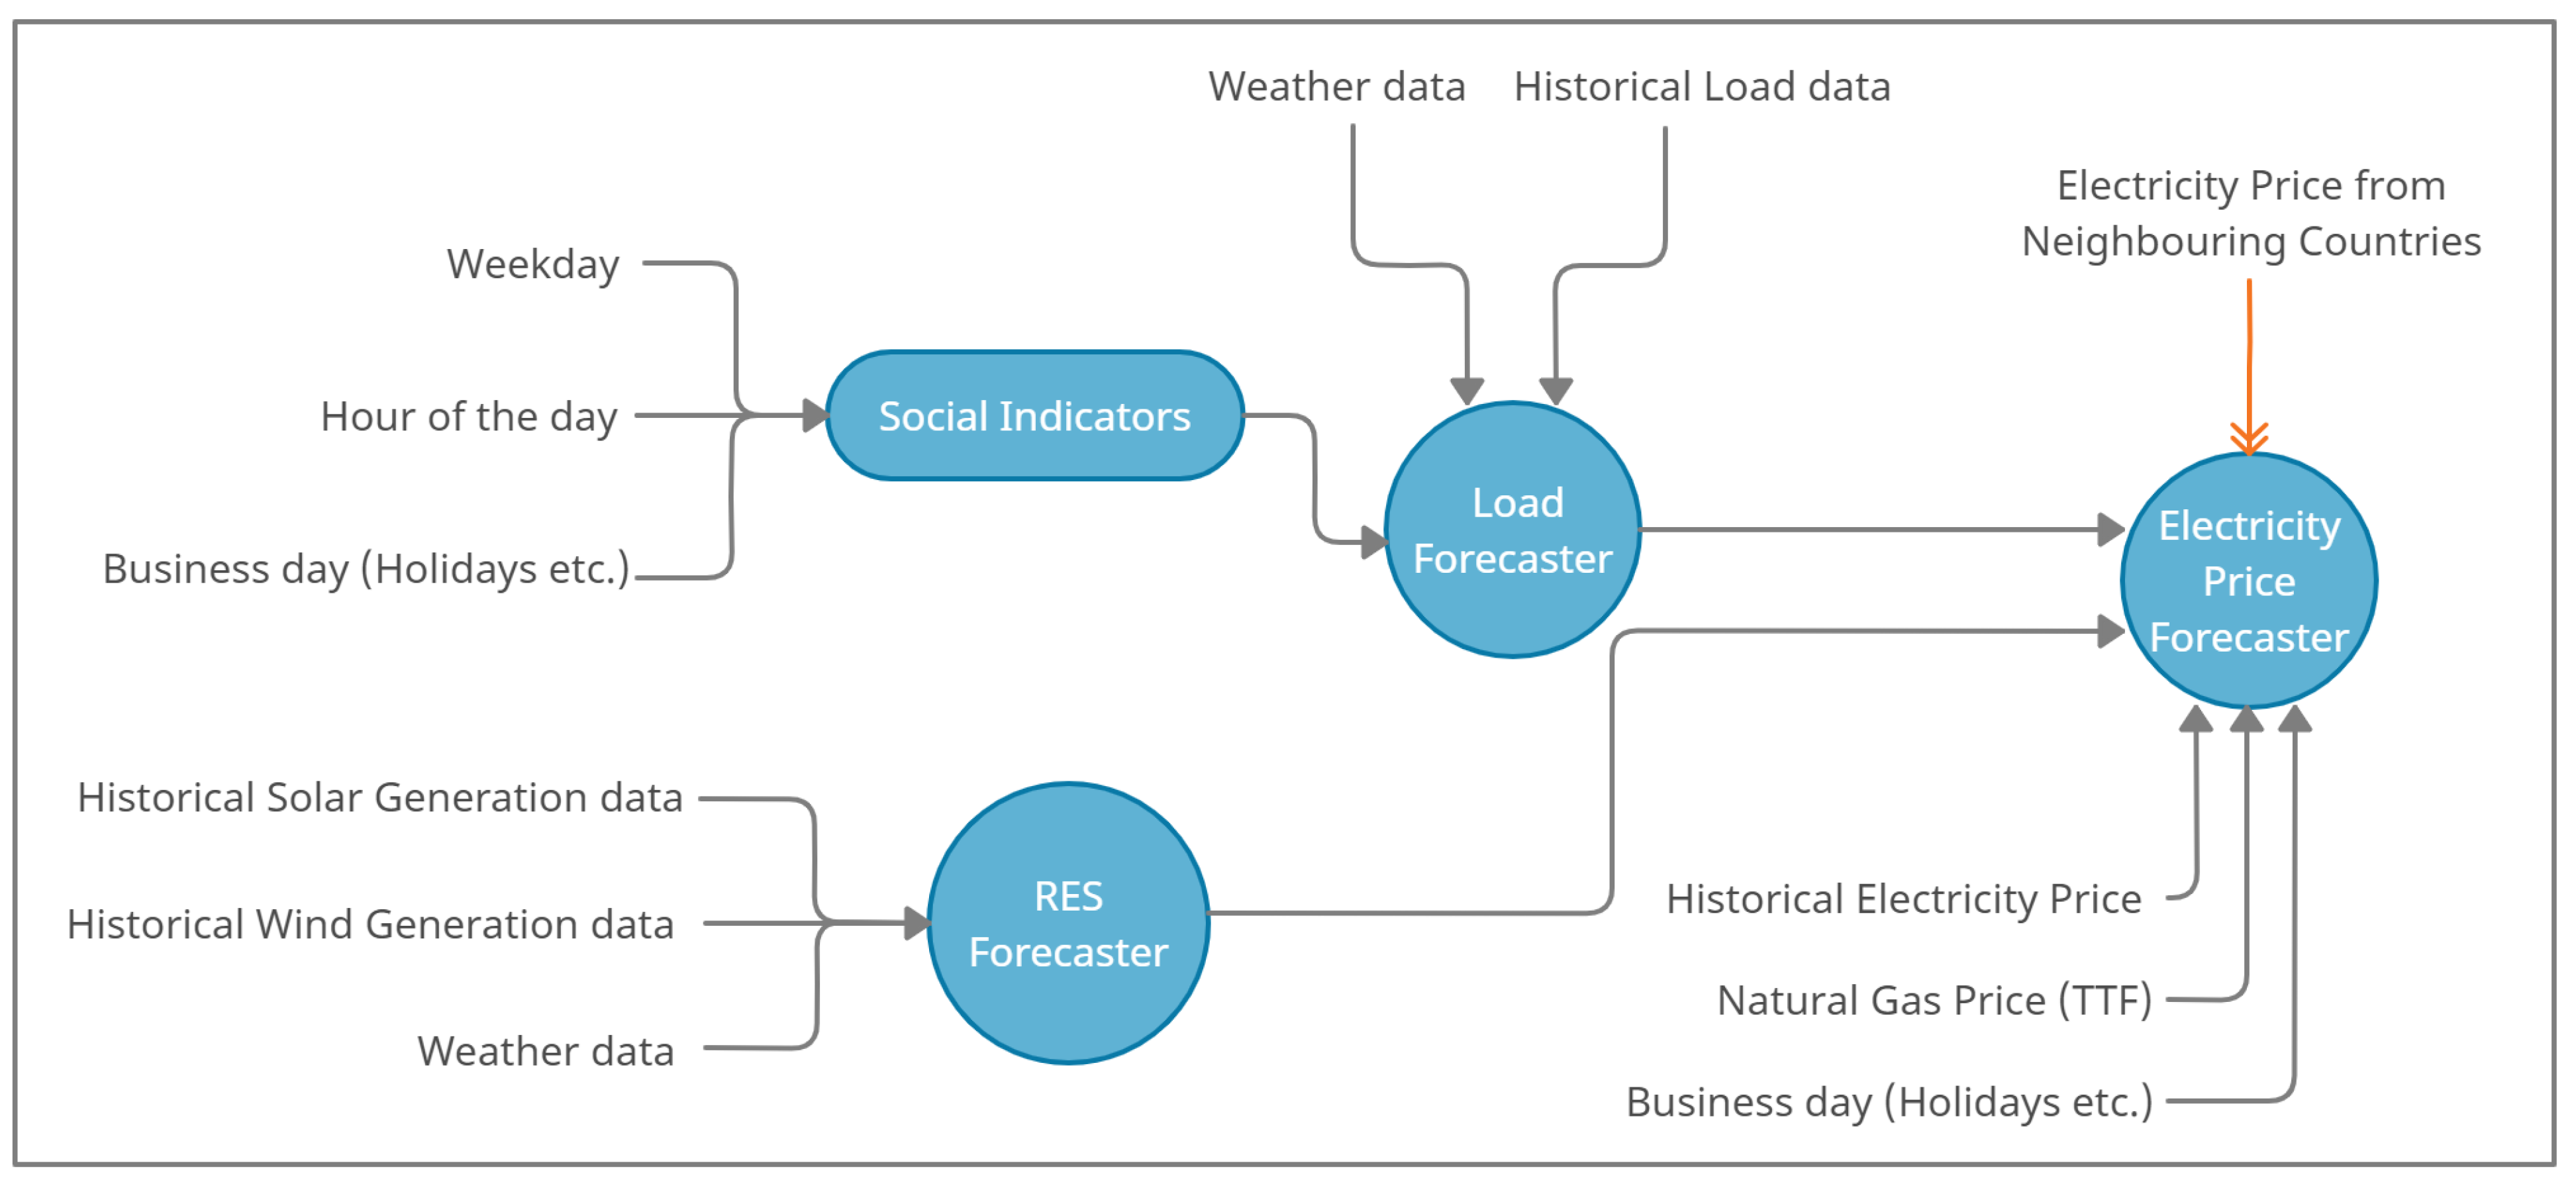
The forecaster tool, as shown in
Figure 1, comprises two sub-forecasters (load and RES forecasters). The load forecasting module provides information about the system load, while the RES forecasting module predicts the generation from weather-dependent energy sources. The outputs from both modules, which provide information from the power system side, are integrated into the main price forecasting module. Additionally, there is a list of external predictors that are also included in the forecasting model. These predictors are listed below:
Historical electricity data (DAM prices).
External market data (natural gas price, carbon emissions price).
Social indicators (hour of the day, weekday, holidays, etc.).
Historical electricity market data are important for making predictions about future electricity market prices. Specific trends and patterns can be identified, showing information about the most relevant market dynamics. External market data, such as prices NG and CO
2, can greatly influence DAM price and are also included [
21]. NG is a major fuel source for electricity generation and its price partially determines the DAM price. In the examined period, NG contribution in the energy mix is significantly high. Natural gas-fired power plants are often used to meet demand during peak hours when electricity prices are the highest. Additionally, CO
2 pricing, a policy tool designed to reduce greenhouse gas emissions by creating a financial incentive for industries and individuals to shift towards more sustainable practices, is also integrated into the model. Finally, social features (e.g., type of day, hour index) can also have an impact on the forecasting performance and thus are included in the analysis. The analysis was based on a one-year dataset from 1 June 2021 to 31 May 2022. This period was selected in order to study the performance of the algorithms in a period with considerably high electricity market prices and increased volatility. It is also noted that, during the same period, increased volatility is observed in the set of external predictors, especially the ones describing market information (e.g., NG price).
The study includes an analysis of two scenarios. Scenario No.1 includes the development of a forecasting model considering external predictors only from the country of interest, while in Scenario No.2, the developed model is enriched by the inclusion of past electricity prices from neighboring countries. This is to showcase the relationship between neighboring countries in the interconnected European electricity market and examine their influence on the forecasting results. Specifically, the electricity prices of the neighboring countries provide valuable information about the supply and demand conditions in the wider energy market, which can help to improve the accuracy of the price forecaster tool.
Overall, the developed framework for electricity price forecasting is a comprehensive system, which integrates multiple sub-modules to provide accurate and reliable price forecasts. By incorporating inputs from neighboring countries and considering a wide range of external factors, the framework is well-equipped to handle the complex and volatile nature of the electricity market.
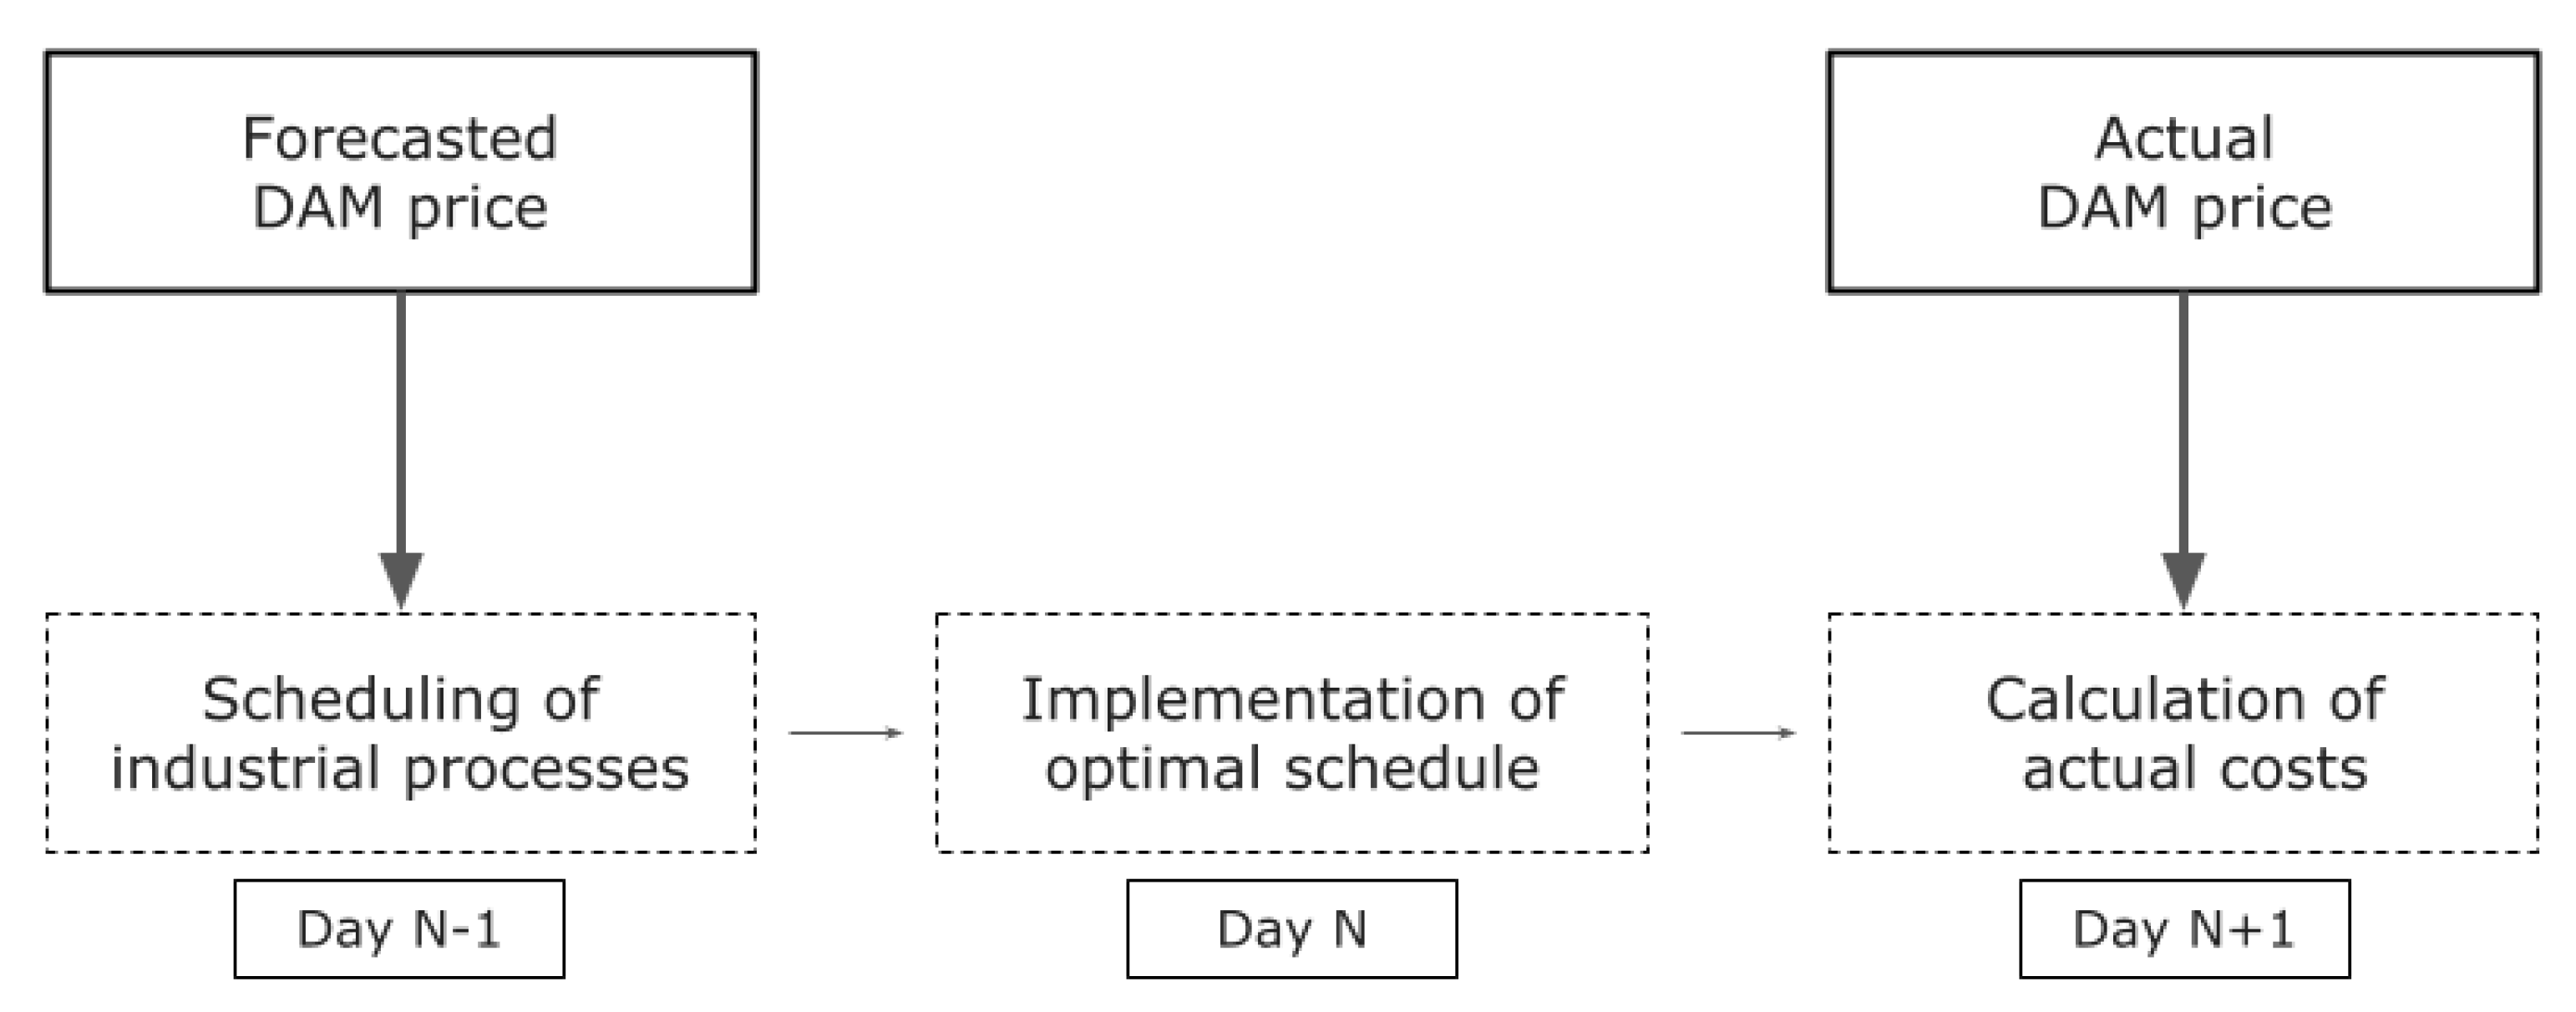
The second part of the study involves the development of an optimization tool that integrates the prediction of the DAM price. The tool considers all the operational constraints of the facility and assigns the processes based on energy cost minimization. The predicted DAM price is included in the objective (cost) function, and thus significantly determines the optimal solution. The prediction can also help the facilities to plan their energy procurement strategy and decide when to buy energy from the market, thereby reducing costs and ensuring stable operations. Therefore, the optimal time for energy-intensive production processes can be determined, leading to improvements in the facility’s energy efficiency.
In
Figure 2, a simplified architecture is provided, showing how the forecasted DAM price is integrated into the optimization tool. The process is scheduled based on the forecasted DAM price. The solution for the optimal schedule is then implemented by the facility. Finally, for the calculation of the actual operational costs, the actual DAM price is taken into account. Overall, the goal of the proposed tool is to project operational costs that will be relatively close to the actual ones, helping the industrial facility to take the optimal decision.
2.1. Load Forecaster
The accurate prediction of system load is critical to the efficient and reliable operation of the power system. Load forecasting, therefore, plays a crucial role in many daily planning and operating decisions in the power industry. Load forecasting is used for several purposes, including the optimal dispatch of power generation units, the scheduling of maintenance activities, and the planning of new infrastructure. In addition to this, the accurate prediction of the system load is essential to ensuring that the power system is balanced and that there is enough energy supply to meet the demand. However, given the uncertain and stochastic nature of the emerging energy mix, load forecasting has proven to be a challenging task. As a result, it has attracted the attention of many research teams who are working to develop new and improved methods of load forecasting [
22,
23,
24,
25,
26].
In this study, the load forecasting module provides an hourly aggregated system load forecast value for of the examined countries on a day-ahead horizon. To achieve this, the module utilizes a set of predictors including historical load values, weather parameters, and social indicators. The analysis period was one year (1 June 2021–31 May 2022). Historical values of system load are considered to be among the most important predictors in load forecasting. They provide valuable information about previous patterns and trends in energy consumption, leading to improved forecaster accuracy. In addition to these, weather parameters are also included, since they capture the impact that weather conditions can have on the system load. For example, temperature and humidity levels strongly influence the amount of energy required for heating or cooling. In our work, the weather parameters that were included are (a) temperature, (b) humidity, (c) solar radiation and (d) wind speed. The data were downloaded by an open-source weather API [
27]. Finally, the module also incorporates social indicators, which capture the impact of human behavior on energy consumption. For example, social indicators such as calendar seasonal information (holidays, etc.) can significantly affect demand patterns, and the incorporation of these factors can improve the accuracy of the module.
For the development of the module, a seasonal autoregressive integrated moving average (SARIMA) was employed. SARIMA models are widely used in load forecasting and have been shown to be effective in many studies. Researchers have used SARIMA models to forecast energy demand at different levels of granularity, including hourly, daily, weekly, and monthly time intervals [
28,
29]. Due to the low complexity of the model and its ability to capture seasonal trends, a SARIMA model was also employed in this study for load forecasting.
The model comprised many different parameters that need to be fine-tuned for the optimal forecasting performance. Specifically, the auto-regressive order (p), integration order (d), and moving average order (q) were used to indicate the order of the time series, while the seasonal component of the model was represented by parameters P, D, Q, and M, representing auto-regressive parameters, integrated parameters, moving average parameters, and periodicity, respectively. To determine the optimal parameters for the SARIMA model, an analysis on the autocorrelation (ACF) and partial autocorrelation function (PACF) were also performed. Time-series cross-validation was employed to fine-tune the model’s parameters. The ordinary least squares (OLS) criterion was used to find the optimal parameters at every fold. Then, the parameters for the maximum forecasting accuracy of the load forecasting module were ensured by (0,1,1) (0,1,1).
2.2. RES Forecaster
RES forecasting is crucial to efficient grid operation, energy trading, and the planning of energy resources. Grid operators rely on these forecasts to balance supply and demand, ensure system stability and avoid disruptions. Energy traders use RES forecasts to optimize their portfolios and maximize profits, while energy planners exploit them to determine the optimal mix of energy resources and infrastructure investments. However, unlike traditional energy sources, their production is highly dependent on weather conditions, making it challenging to accurately forecast their output [
30,
31].
The developed RES forecasting module in our case provides an aggregated day-ahead forecast for the estimated production from weather-based technologies (mainly wind and solar). For the development of the module, a SARIMA model was employed again, as indicated by numerous research papers in the literature [
32,
33]. The seasonality and trend analysis of RES production are significant factors leading to the selection of a model of similar nature (a seasonal one) that can effectively capture these. The module utilizes historical time series data of renewable energy generation and weather parameters. Historical production time series data provide insights into the trends and patterns of renewable energy generation over time, leading to a consistent improvement in the forecast quality. Additionally, weather parameters must be included for the prediction of weather-dependent sources. The weather parameters employed in this study are temperature, wind speed, solar radiation, and humidity [
27]. The optimal model parameters were selected, employing the OLS criterion in every fold of the time series cross-validation process. The selected model parameters were (1,1,1) (1,1,1)
, indicating the auto-regressive, integration, and moving average orders, along with the seasonal component’s order and periodicity.
2.3. Price Forecaster
The price forecasting module is the final component of the system architecture, as shown in
Figure 1. The module considers the predictions provided by the load forecasting and RES forecasting modules, along with a list of external predictors.
The employed algorithms of the price forecasting module are the random forest (RF) and a long short-term memory (LSTM) neural networks. These algorithms were chosen due to their ability to capture the complex nonlinear relationships between the various inputs and the electricity price. After individual predictions are obtained from each algorithm, a fuzzy-based architecture is used to combine them to improve the accuracy of the final forecast. By using a combination of these advanced algorithms, the price forecasting module is able to provide reliable and accurate estimates of future electricity prices, which are critical for efficient decision-making in the power market. In the following subsections, a detailed description of the algorithms employd in the price forecasting module is given.
2.3.1. Random Forest Algorithm
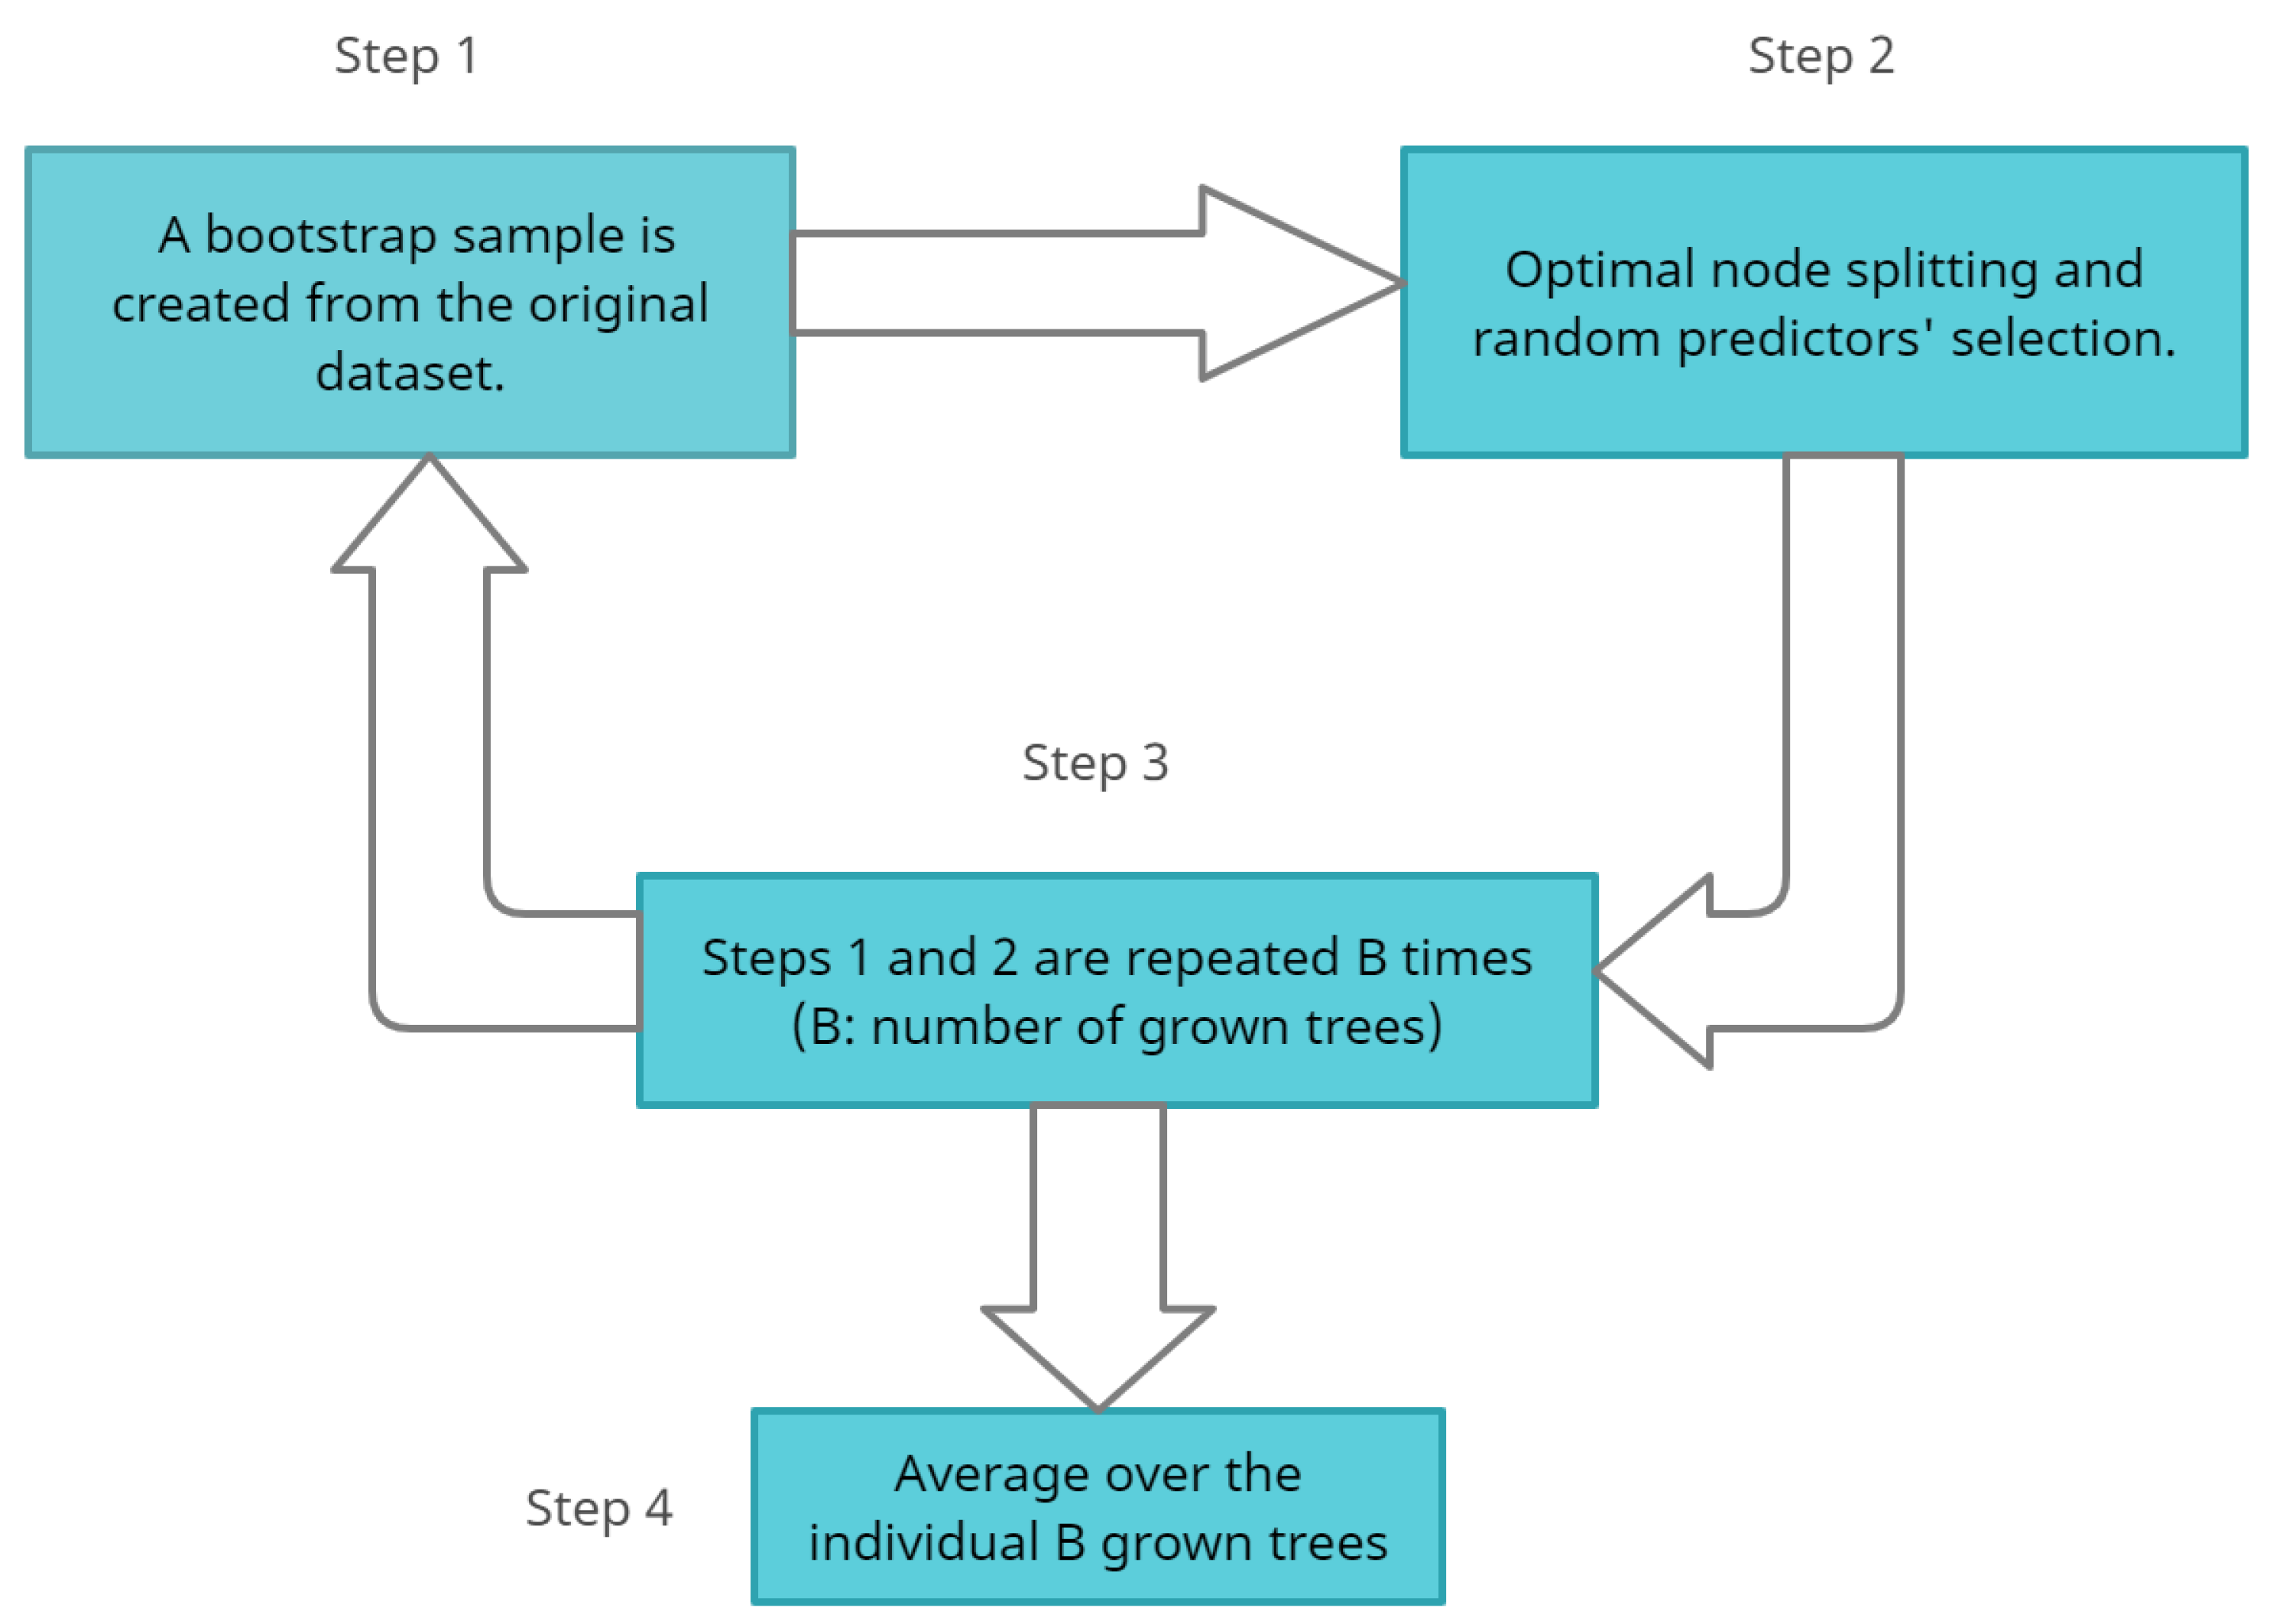
The RF algorithm was selected due to its low computational complexity, its ability to handle large datasets and the easy interperability of the results. RF is an ensemble learning method that can be used both for regression and classification problems [
34]. The principle of the algorithm relies on having uncorrelated models (or trees), which is ensured by bootstrap aggregation (also known as bagging) and the random subspace method. In regression tasks, the average value of the predictions from each decision tree is given as the final prediction. The basic steps of the algorithm are presented in
Figure 3.
In an RF model, there are usually many parameters that need to be finetuned. For a parameter selection that ensure a trade-off between forecasting performance and computational complexity, the OLS criterion was employed. Four parameters of the algorithm were considered. The maximum number of features in each split (a), the maximum depth of the individual trees (a), the maximum number of leaf nodes (a) and the number of decision trees in the forest (a) were fine-tuned using time series cross-validation. Finally, the optimal forecasting accuracy is ensured by setting a = 5, a = 20, a = 2 and a = 100.
2.3.2. Long Short-Term Memory
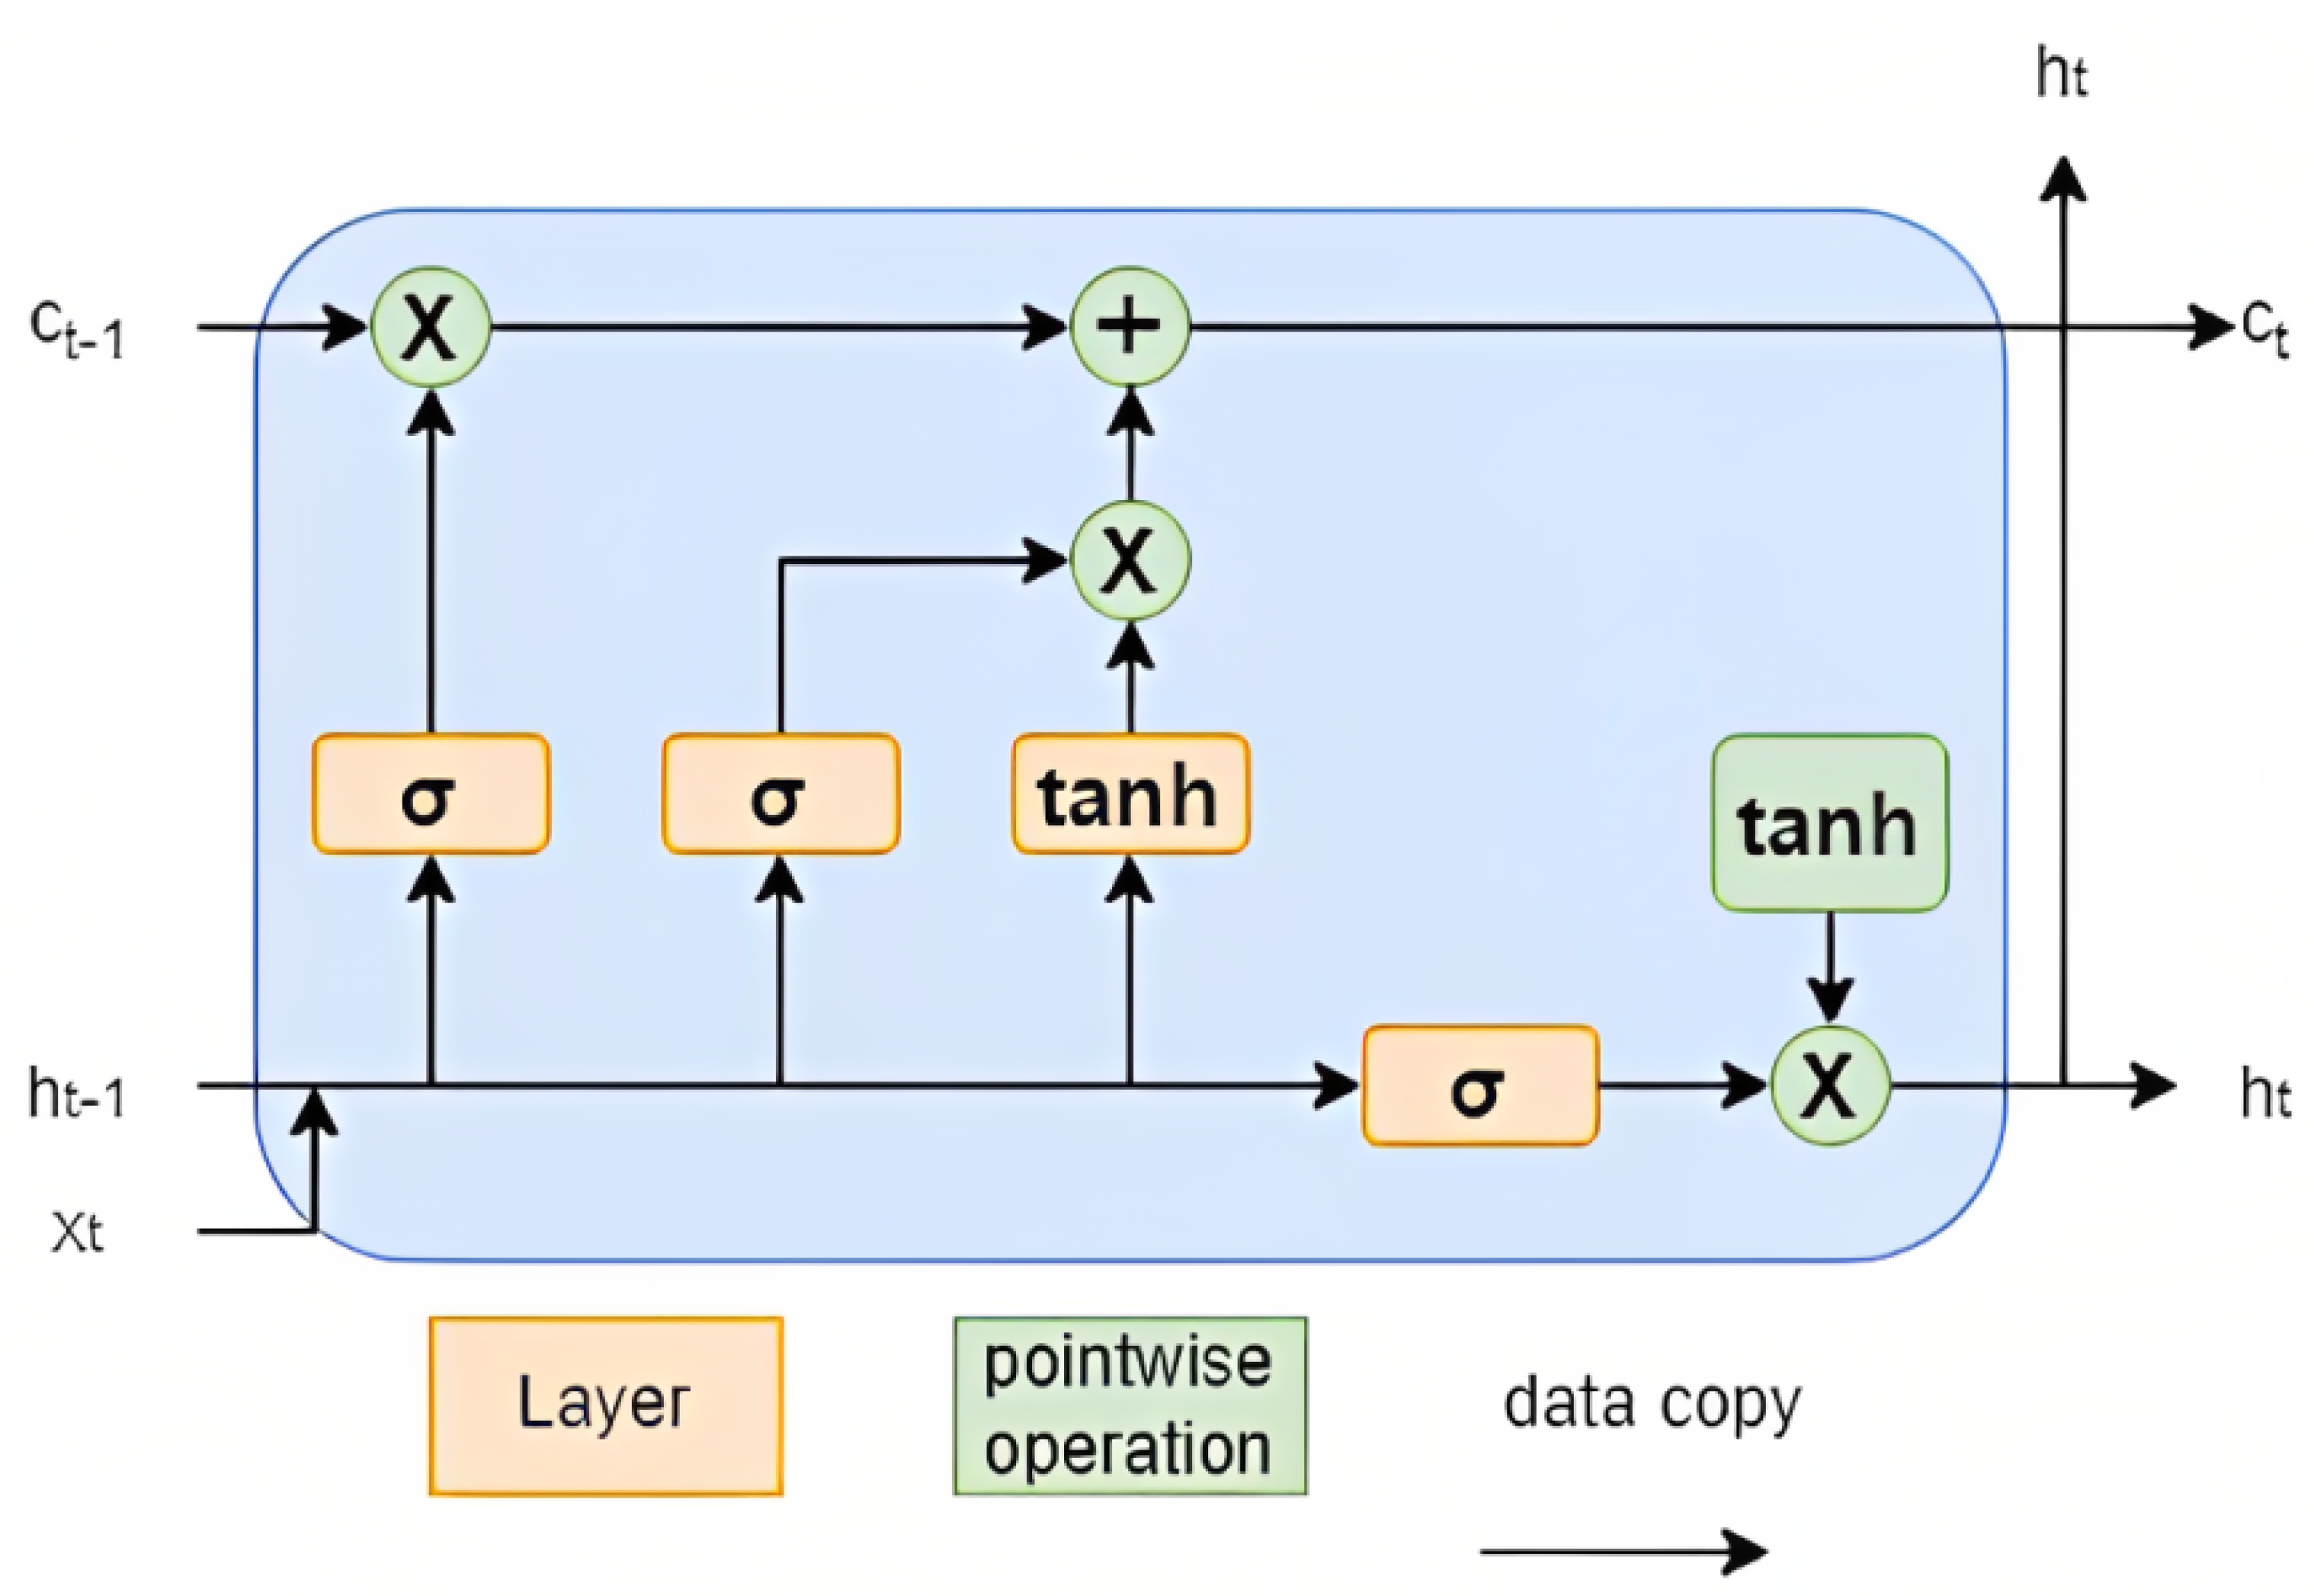
LSTM is a type of recurrent neural network (RNN) used for processing sequential data. It is designed to overcome the limitations of traditional RNNs, which are prone to the vanishing gradient problem when processing long sequences. They are well-suited to time series forecasting as they can handle sequences of variable lengths, capture long-term dependencies between the input and output sequences and model non-linear relationships.
The architecture of an LSTM network consists of several memory cells, which are connected to each other through gates. Three types of gates are employed in LSTMs: the input gate, the forget gate and the output gate. Each gate has its own weight matrix and bias vector, which are learnt during the algorithm training phase. For the final prediction of an LSTM network, the hidden state vector of the last time step is usually employed. In
Figure 4, a basic architecture of an LSTM network is presented.
There are many parameters that need to be fine-tuned in an LSTM model to achieve the highest degree of accuracy. In this study, the parameters that are optimized through time series cross-validation by employing the OLS criterion are the batch size (b), number of epochs (b), learning rate (b), number of units per layer (b) and number of LSTM layers (b). It was derived that the optimal forecasting accuracy is ensured by b = 256, b = 100, b = 0.1, b = 100 and b = 2.
2.3.3. Fuzzy-Based Architecture
A fuzzy-logic model is a mathematical model that incorporates fuzzy logic to deal with uncertainty and imprecise data. This involves mapping input variables to output ones using a set of fuzzy rules that describe the relationship between them.
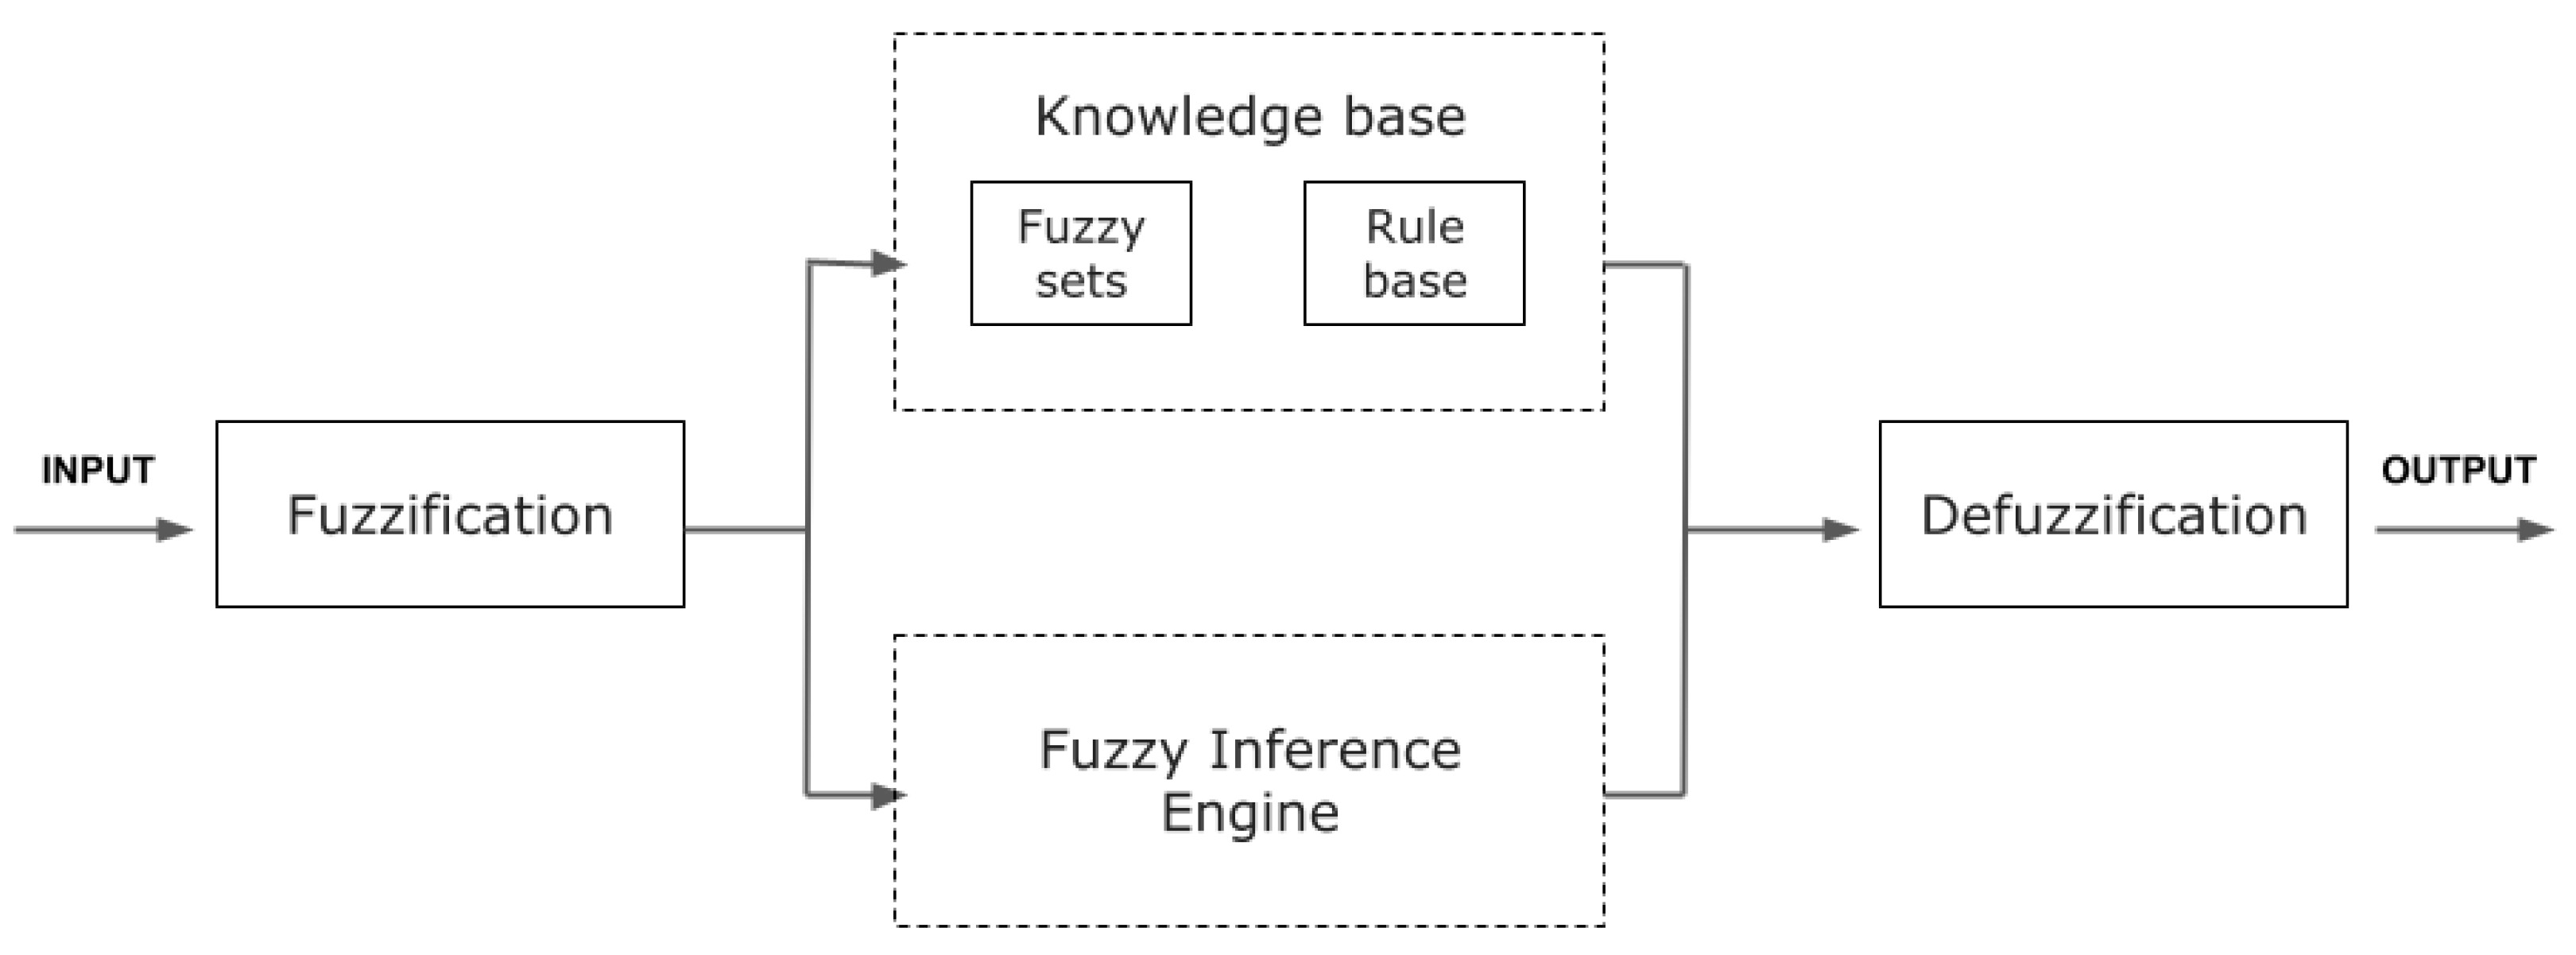
Figure 5 presents a fuzzy logic system (FLS) and its four major units, namely, a fuzzification unit, a fuzzy knowledge-base unit, a fuzzy inference engine unit and a defuzzification unit.
The fuzzification unit is responsible for converting crisp inputs into fuzzy sets. This can be achieved with the use of pre-defined input membership functions. The membership functions associate a weighting factor, which determines the degree of influence or degree of membership for each active rule. The next block includes the knowledge base, which consists of two sub-units: the fuzzy sets database and the rule base. Intuitively, this is the core element of a fuzzy controller as it will contain all the information necessary to accomplish its execution tasks. The inference engine provides the decision-making logic of the controller. It deduces the fuzzy control actions by employing fuzzy implications and the rules of inference. Finally, the defuzzification process converts fuzzy control values into crisp quantities by selecting a single value from the output using a defuzzification method. There are different methods of defuzzification. The most-used ones are the maximum criterion (MC), the center of gravity (CG) and the mean of maximum (MM) [
35].
In this work, the fuzzy-based architecture was used to combine the outputs of two different algorithms (random forest and LSTM) to improve the accuracy of the overall prediction. The fuzzy logic is implemented by assigning weights to the output of each algorithm based on their performance on historical data. These weights are then combined to produce a final prediction that considers the strengths and weaknesses of each algorithm.
A different set of rules was tested to examine the various configurations of the fuzzy network architecture. These rules provide the framework for decision making by defining the relationships between the input and output variables. The suggested architectures (and the corresponding rules) are different depending on the hour of the day, since electricity demand and supply varies significantly over a 24 h period. By using different sets of rules for different hours of the day, the proposed fuzzy architecture can better capture these fluctuations and provide more accurate predictions. The specific rules were selected based on the accuracy of the rule regarding the forecasted value. This involves evaluating the performance of each rule in the network based on how well it predicts the DAM price for a given set of input variables. The rules with the highest accuracy that provide the best predictions were finally selected for inclusion in the network. The list of rules are divided into the following categories:
Market data:
System data:
Models’ performance metrics:
RF historical error.
RF slope error.
LSTM historical error.
LSTM slope error
It is clear that the proposed rules are not limited to market and system data, similar to a standard forecasting fuzzy tool. The additional rules, which explain the error metrics of RF and LSTM models, are important extensions of the proposed fuzzy framework compared to the ones found in the literature. To this end, the uncertainty is better handled and the forecasting framework becomes more robust and less dependent on a single forecasting method.
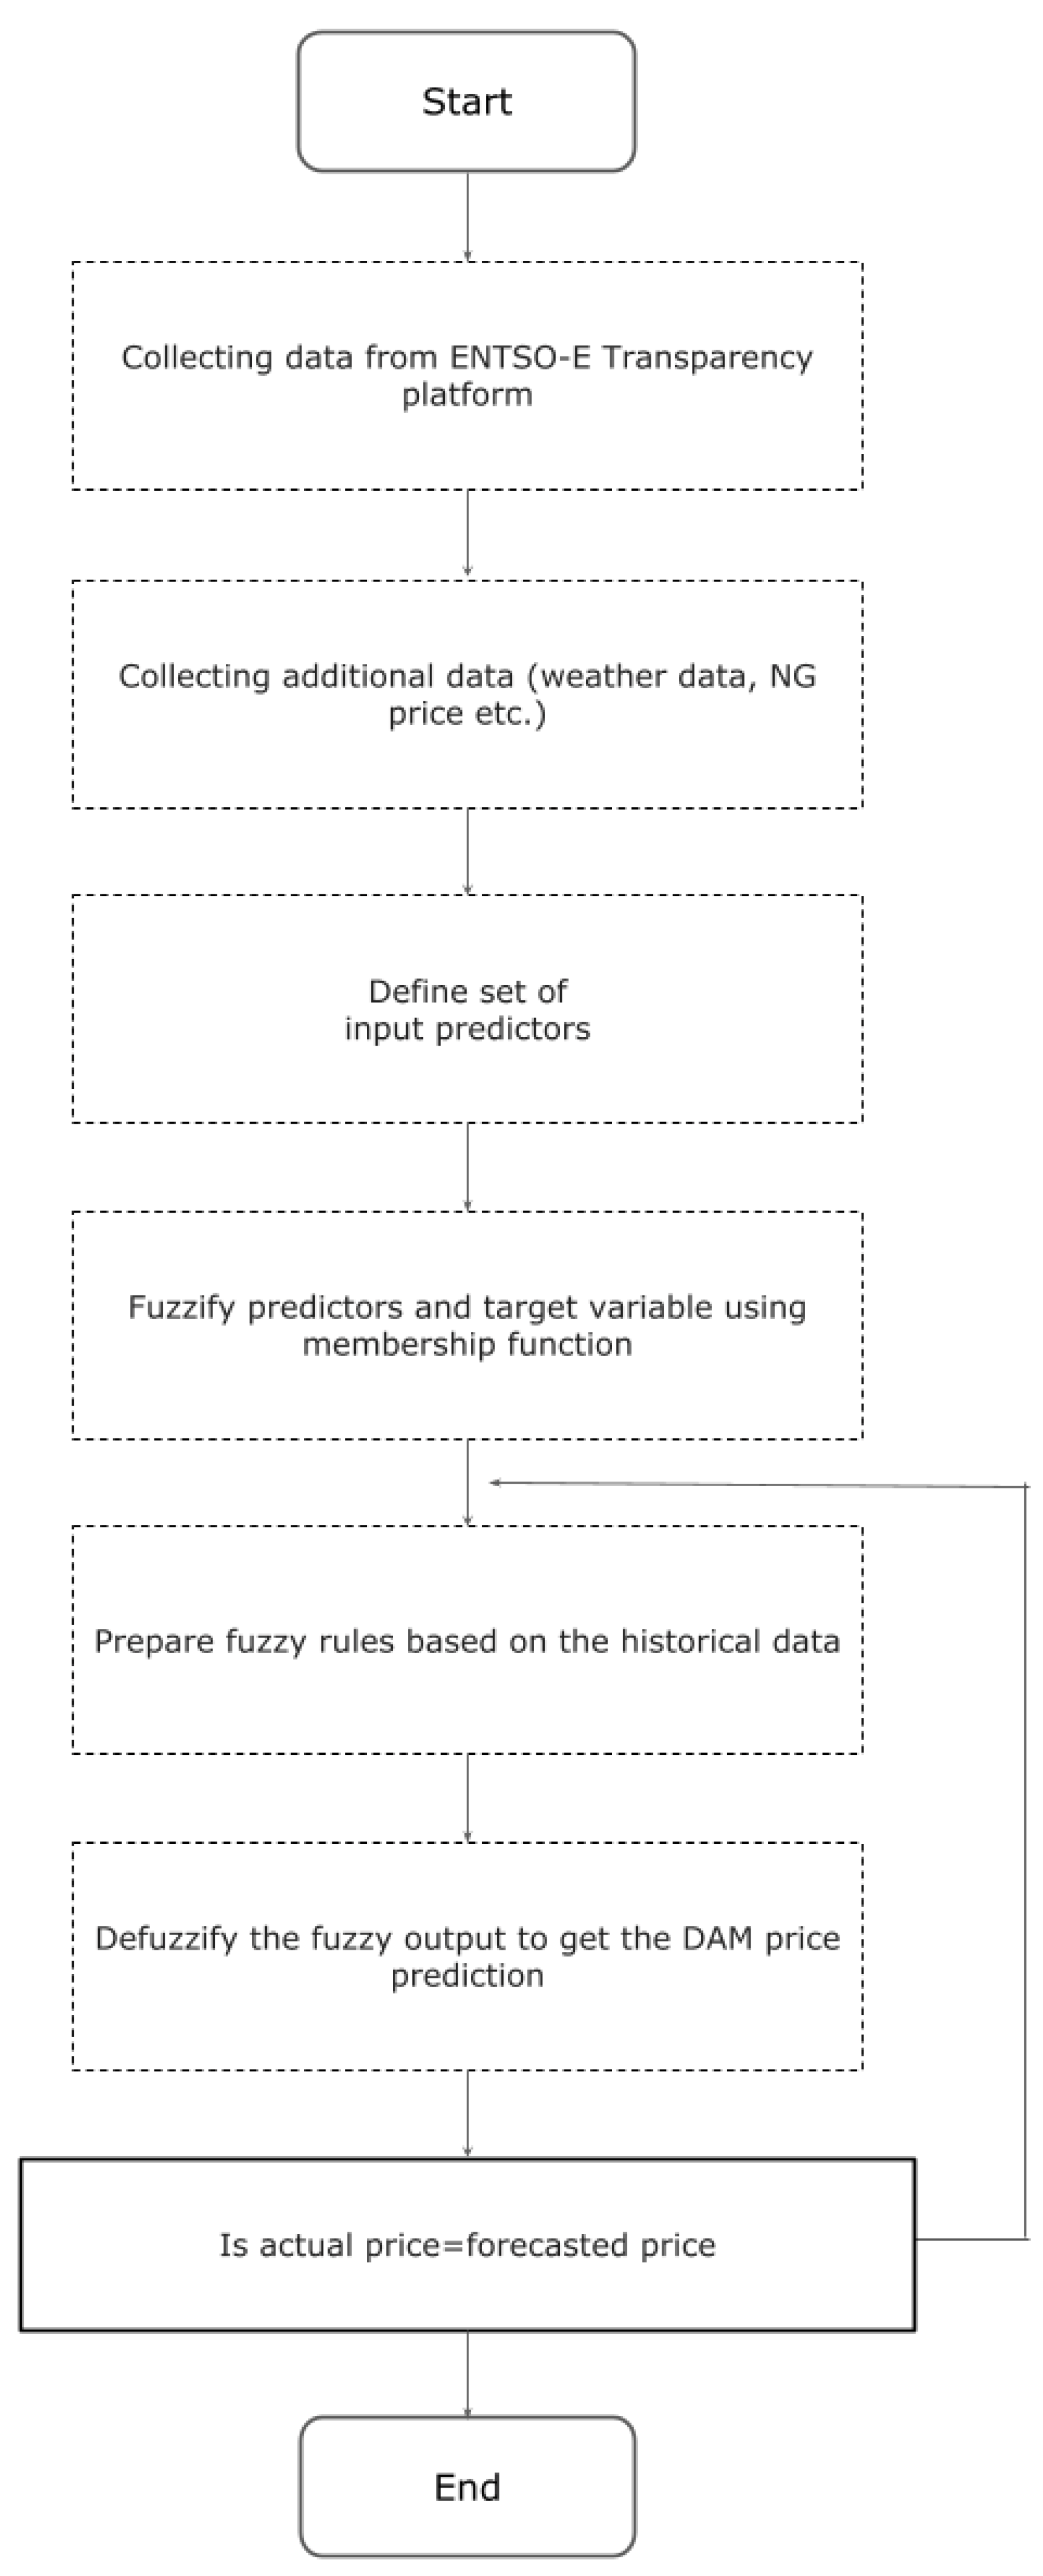
Different weights for the rules are tested for each country depending on the specific market conditions. Each weight value falls within the range from 0 to 1 and represent the relative importance of the different factors. The weight optimization of each rule is made using time-series cross validation, employing the OLS criterion. Different weights are calculated in every fold. The average value of the calculated weights is finally assigned to the proposed fuzzy model. In all cases, increased weight is given to the historical error of the RF and the LSTM model, as these significantly contribute to the forecasting performance. For example, when the LSTM algorithm performs well in predicting prices during periods of high volatility, it is assigned a higher weight when predicting prices during similar periods in the future. Lower weights are assigned to the predictors that have already been considered in the algorithms of RF and LSTM (e.g., lagged DAM electricity prices). As the influence of these predictors has already been reflected, their impact on the fuzzy network is rather limited. The steps of the fuzzy logic methodology used in this study are depicted in
Figure 6.
3. Results
In this section, a statistical analysis of the DAM electricity prices in the examined countries is presented. The forecasting results of the different proposed algorithms are also shown.
3.1. Statistical Analysis
DAM electricity data from four European countries were examined in this study. The selected countries were Greece (GR), Bulgaria (BG), Germany (DE), and Austria (AT). Data (both from market and system perspective) were downloaded by the ENTSO-E Transparency Platform [
36]. The selection of these specific countries is not only based on their geographic proximity but also on the fact that they are located in two different regions of Europe, where distinct market conditions prevail.
Table 1 shows the average DAM electricity prices for the four countries examined over three distinct time periods, emphasizing the significant price hike that occurred after June 2021. In this study, the period under consideration ranged from 1 June 2021 to 31 May 2022, during which there was a rise in electricity prices in European markets due to the energy crisis. The selected period is depicted as period C, while some performance metrics will be also presented for periods A and B to showcase the difference in the forecasting performance.
A noticeable increase of 244% compared to the price of the preceding period (when DAM prices decreased due to the COVID-19 pandemic) can be observed. This increase is indicative of, and similar to, the average increase exhibited in the European wholesale markets. Electricity prices sharply rose as a result of the significant increases in fuel and CO prices, particularly during the latter half of the year. Additionally, higher European gas prices played a crucial role in increasing the marginal cost of European gas-fired power plants, leading to the increased cost of electricity. The European gas price reached its peak and rose 10 times more than the minimum prices in 2021 due to the high global gas demand stemming from high industrial production, low reserve levels in European gas storage facilities, and supply shortages of Russian natural gas.
Additionally, the significantly increased volatility observed across all EU markets during the analyzed period poses a significant challenge in accurately predicting the electricity prices. A greater volatility results in a higher degree of uncertainty, making it difficult to predict prices that fluctuate significantly and unpredictably. As an example, the daily standard deviation of the Greek day-ahead electricity price increased by over twofold in 2021 in comparison to 2020 (from 10% to 22%). In Germany, the increase was even more substantial, rising from 5% in 2020 to 24% in 2021.
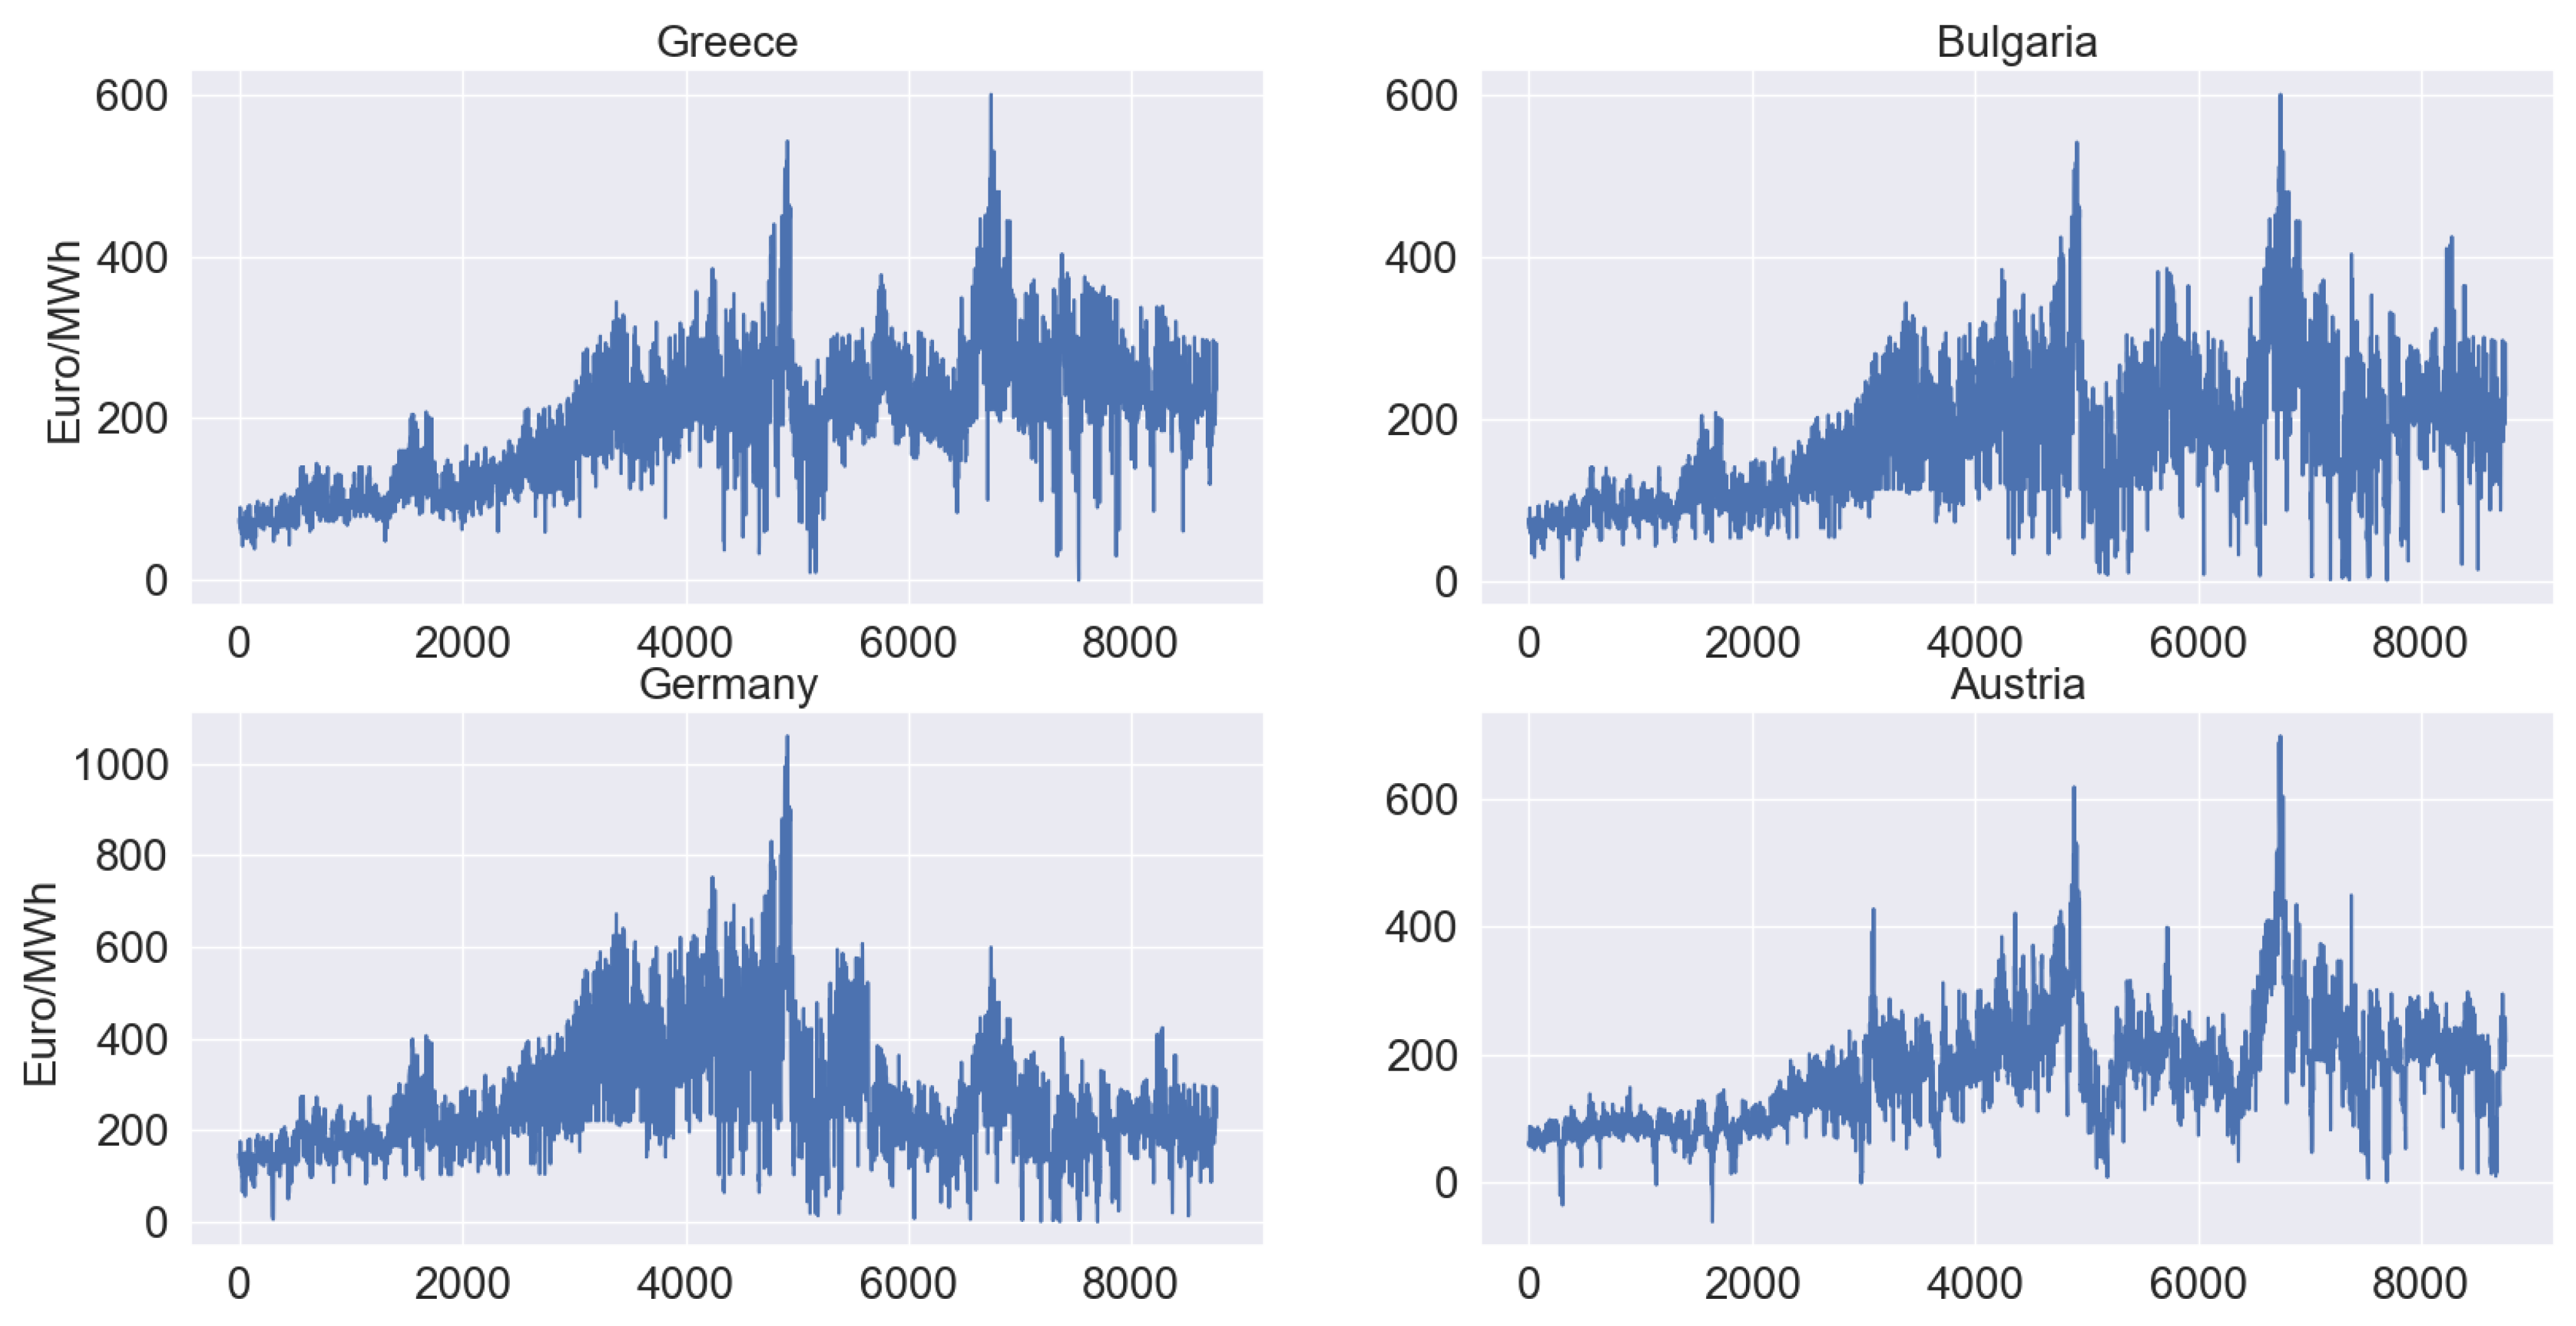
Figure 7 displays time series data of DAM electricity prices for the examined period (period C). The two evident price spikes, which occurred in October 2021 and January 2022, are consistently observed across all the countries, coinciding with the period of highest levels of natural gas prices (TTF index).
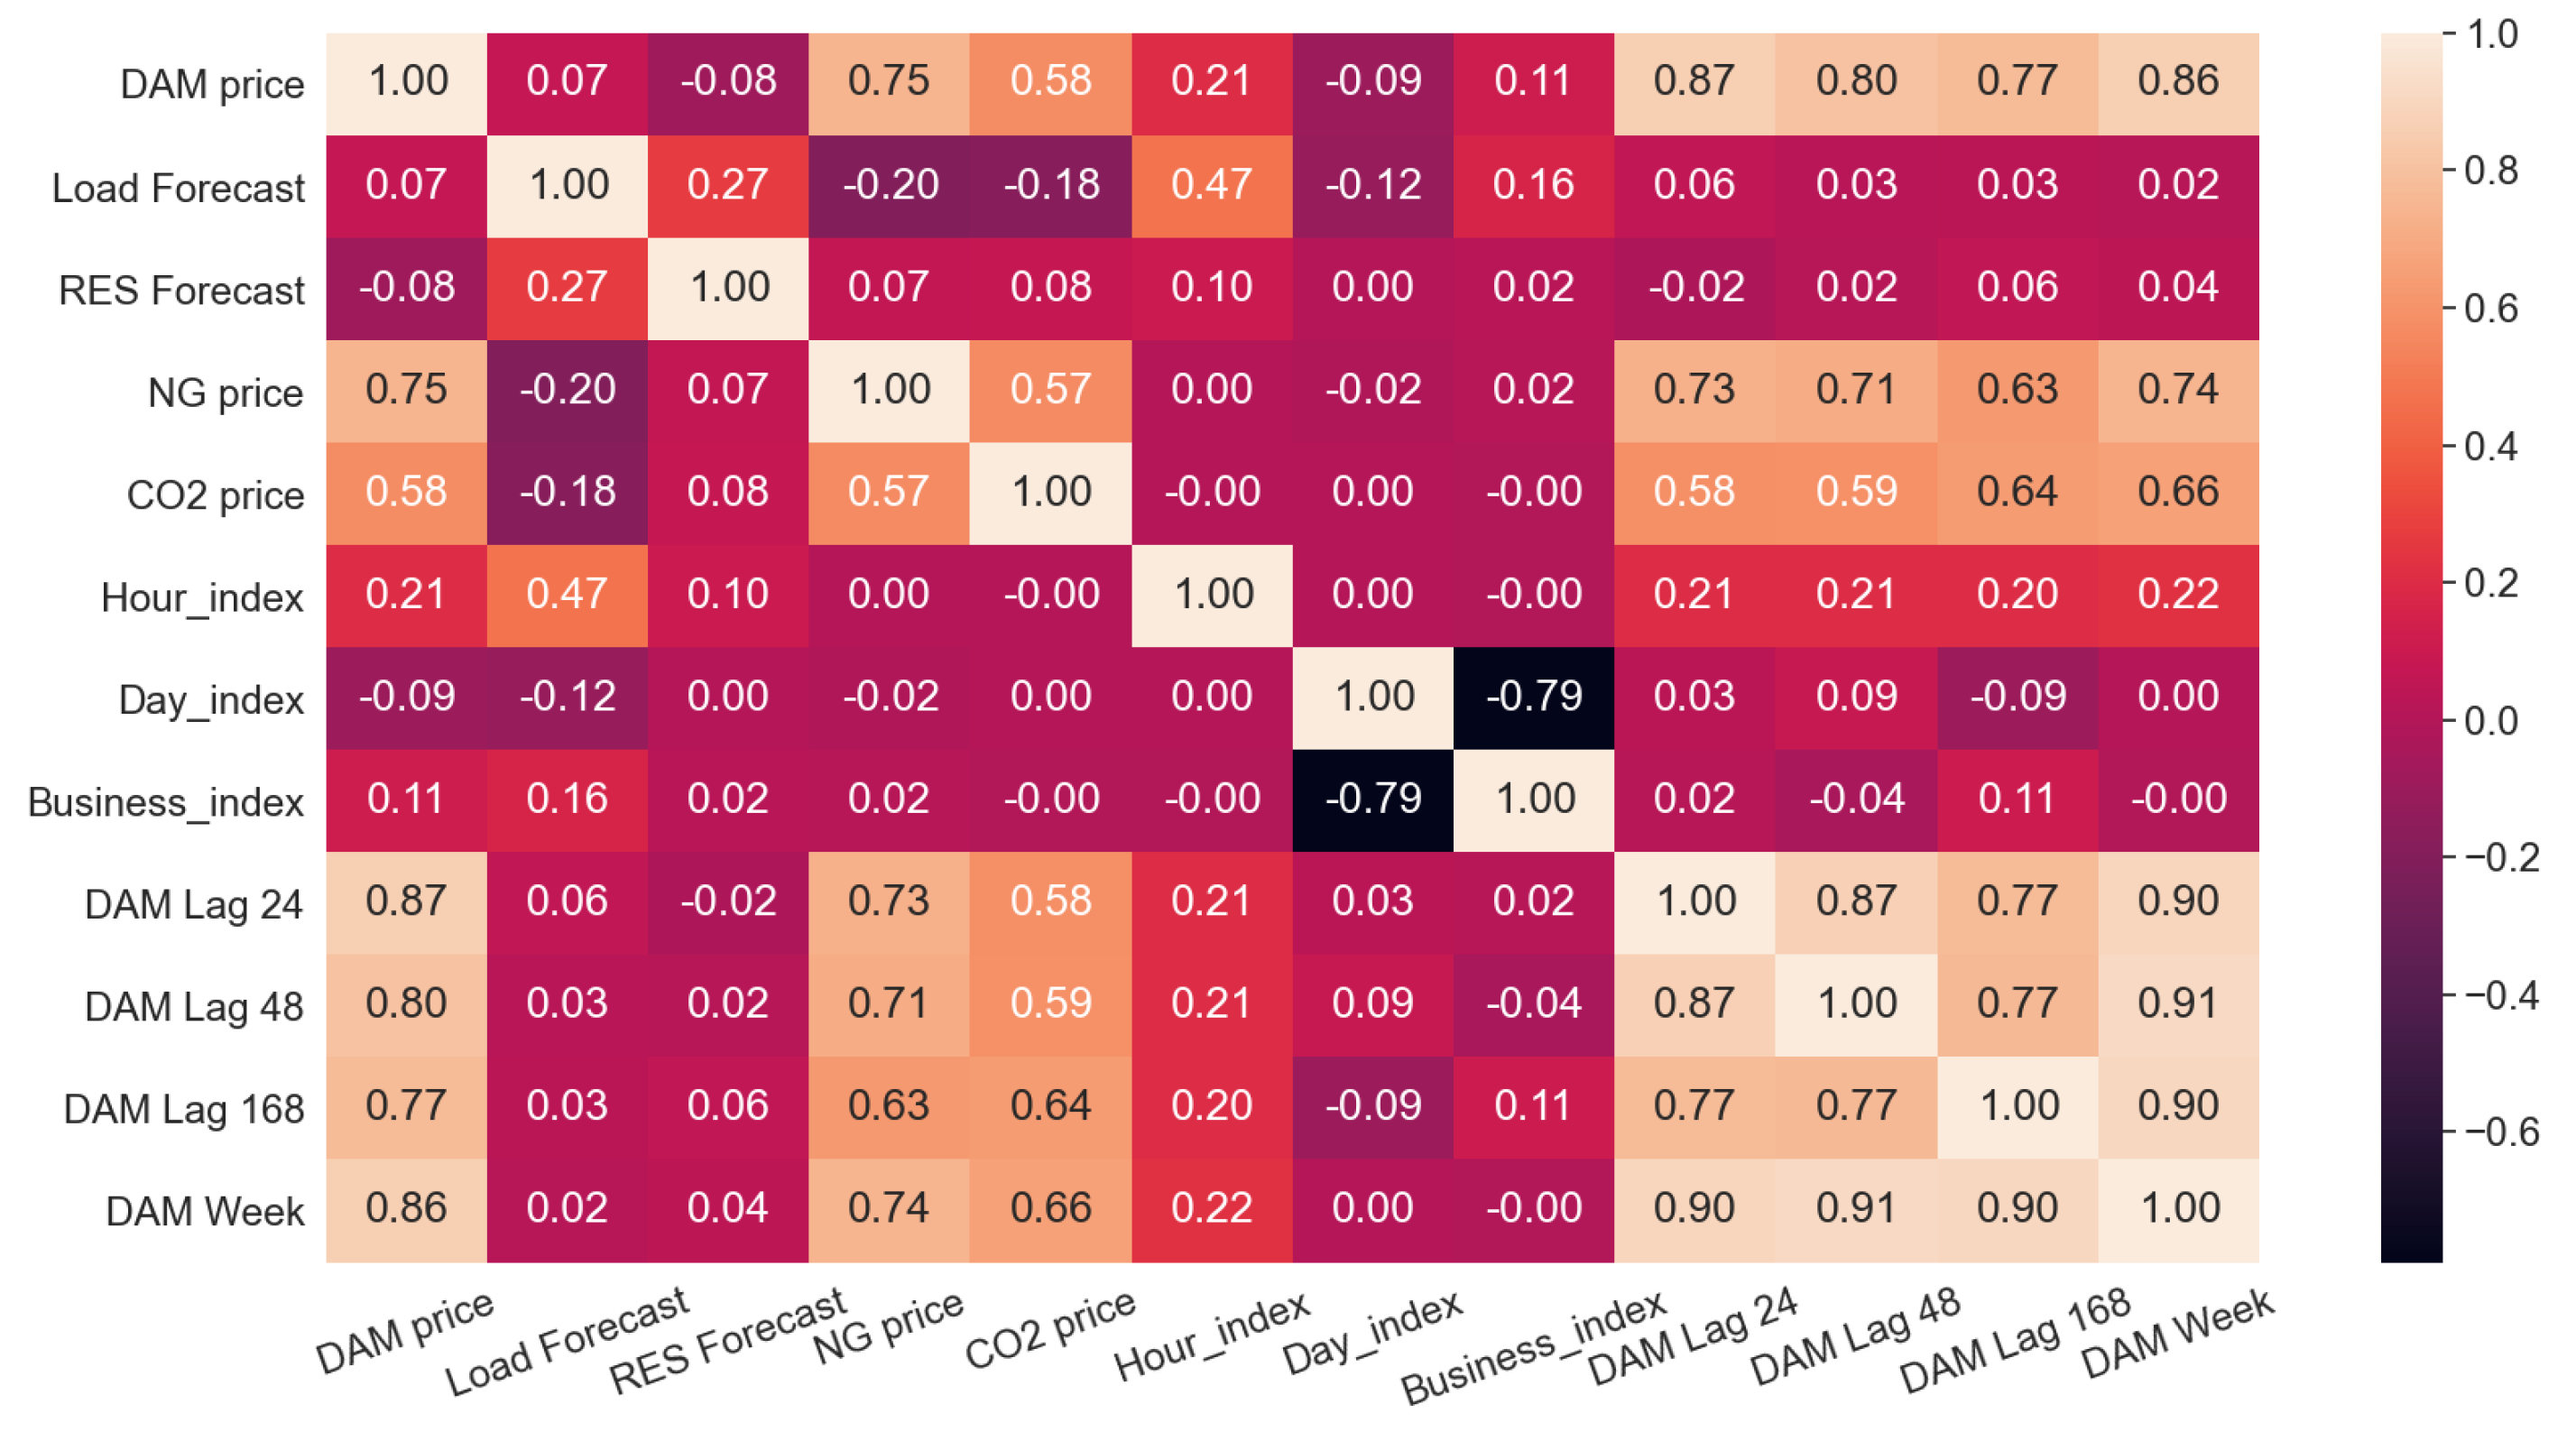
The correlation matrix of the DAM electricity price with respect to the set of external predictors, is presented in
Figure 8. The DAM price demonstrates a strong correlation with lagged electricity price, natural gas (NG) price, and CO
values. Specifically, the lagged DAM prices of the previous day, as well as 2 days and 7 days before, are considered, along with the average value of the previous week. The respective correlations are considerably high, confirming the strong statistical relationship. Regarding NG and CO
prices, the correlation stands for 0.75 and 0.58, respectively. As expected, the relationship between the NG and DAM prices is even higher in hourly indices, where NG power plants are the marginal units and consequently set the price. However, although system data (load and renewable energy sources) and social indicators can enhance the model’s forecasting accuracy, they do not exhibit a high correlation with the DAM price.
3.2. Forecasting Results
To assess the performance of the various forecasting algorithms and optimize their parameters, time series cross-validation was utilized. Unlike traditional cross-validation techniques, which randomly split data into training, validation and test sets, time series cross-validation involves splitting the data in a temporal manner. This means that the sets are divided based on the time order of the observations, ensuring that the model is evaluated on its ability to make accurate predictions for future time periods. The training set iwa used to train the model, while the validation set was used to tune the model’s hyperparameters and prevent overfitting. The test set was used to evaluate the final performance of the model and to estimate its generalization ability [
37].
Two scenarios were examined to determine the impact of neighboring countries’ predictors on forecasting accuracy. In scenario No.1, predictors from the country of interest were exclusively utilized, while scenario No.2 considered additional market data from neighboring countries. All models were fine-tuned on a country-level basis, resulting in distinct models for each scenario, taking advantage of the unique characteristics and dynamics of each country’s market and thus allowing for a more accurate forecasting of the target variable. The evaluation metrics used in the study include R-squared (), mean absolute error (), and mean absolute percentage error (). The measures the proportion of the dependent variable’s variance, which is explained by the independent variables in a regression model. The MAE measures the average of the absolute differences between the actual and the forecasted values, while MAPE provides information on the percentage difference between the residuals (prediction errors).
The mathematical formulas of the metrics are provided below:
where
denotes the true value,
shows the predicted value,
represents the mean value of all the points and n indicates the number of fitted points.
In
Table 2, the forecasting results of scenario No.1 are presented. In this scenario, only predictors from the country of interest are employed, without accounting for the influence of the neighboring countries. The same predictors are studied for all the proposed forecasting algorithms.
The results indicate that the RF algorithm outperforms LSTM in all the selected countries, except for Austria. The highest accuracy was achieved by RF implementation in the case of Greece, in which MAPE stands for 14.7%. However, LSTM implementation in the Bulgarian market provided the highest error, with MAPE being equal to 23%. The proposed fuzzy-based architecture provides an improved performance in all cases. In the cases where one model over-predicts and the other under-predicts the price, the selection of the corresponding weights improves the model’s performance, highlighting the importance of fuzzy logic. It is notable that the error metrics fell within this range due to the considerable volatility of electricity prices during that particular period (as explained in
Section 3.1). The proposed metrics would be significantly improved if applying the forecasting algorithms in periods A and B (see
Table 1). Indicatively, the accuracy of the proposed fuzzy-based architecture for the German case, which now stands for 17.7%, would be enhanced, reaching 12.1% and 11.9% in periods A and B, respectively. For the Greek market, MAPE would further drop to 8.1% and 7.5%, respectively, indicating that, under normal market conditions, the results would be consistently improved.
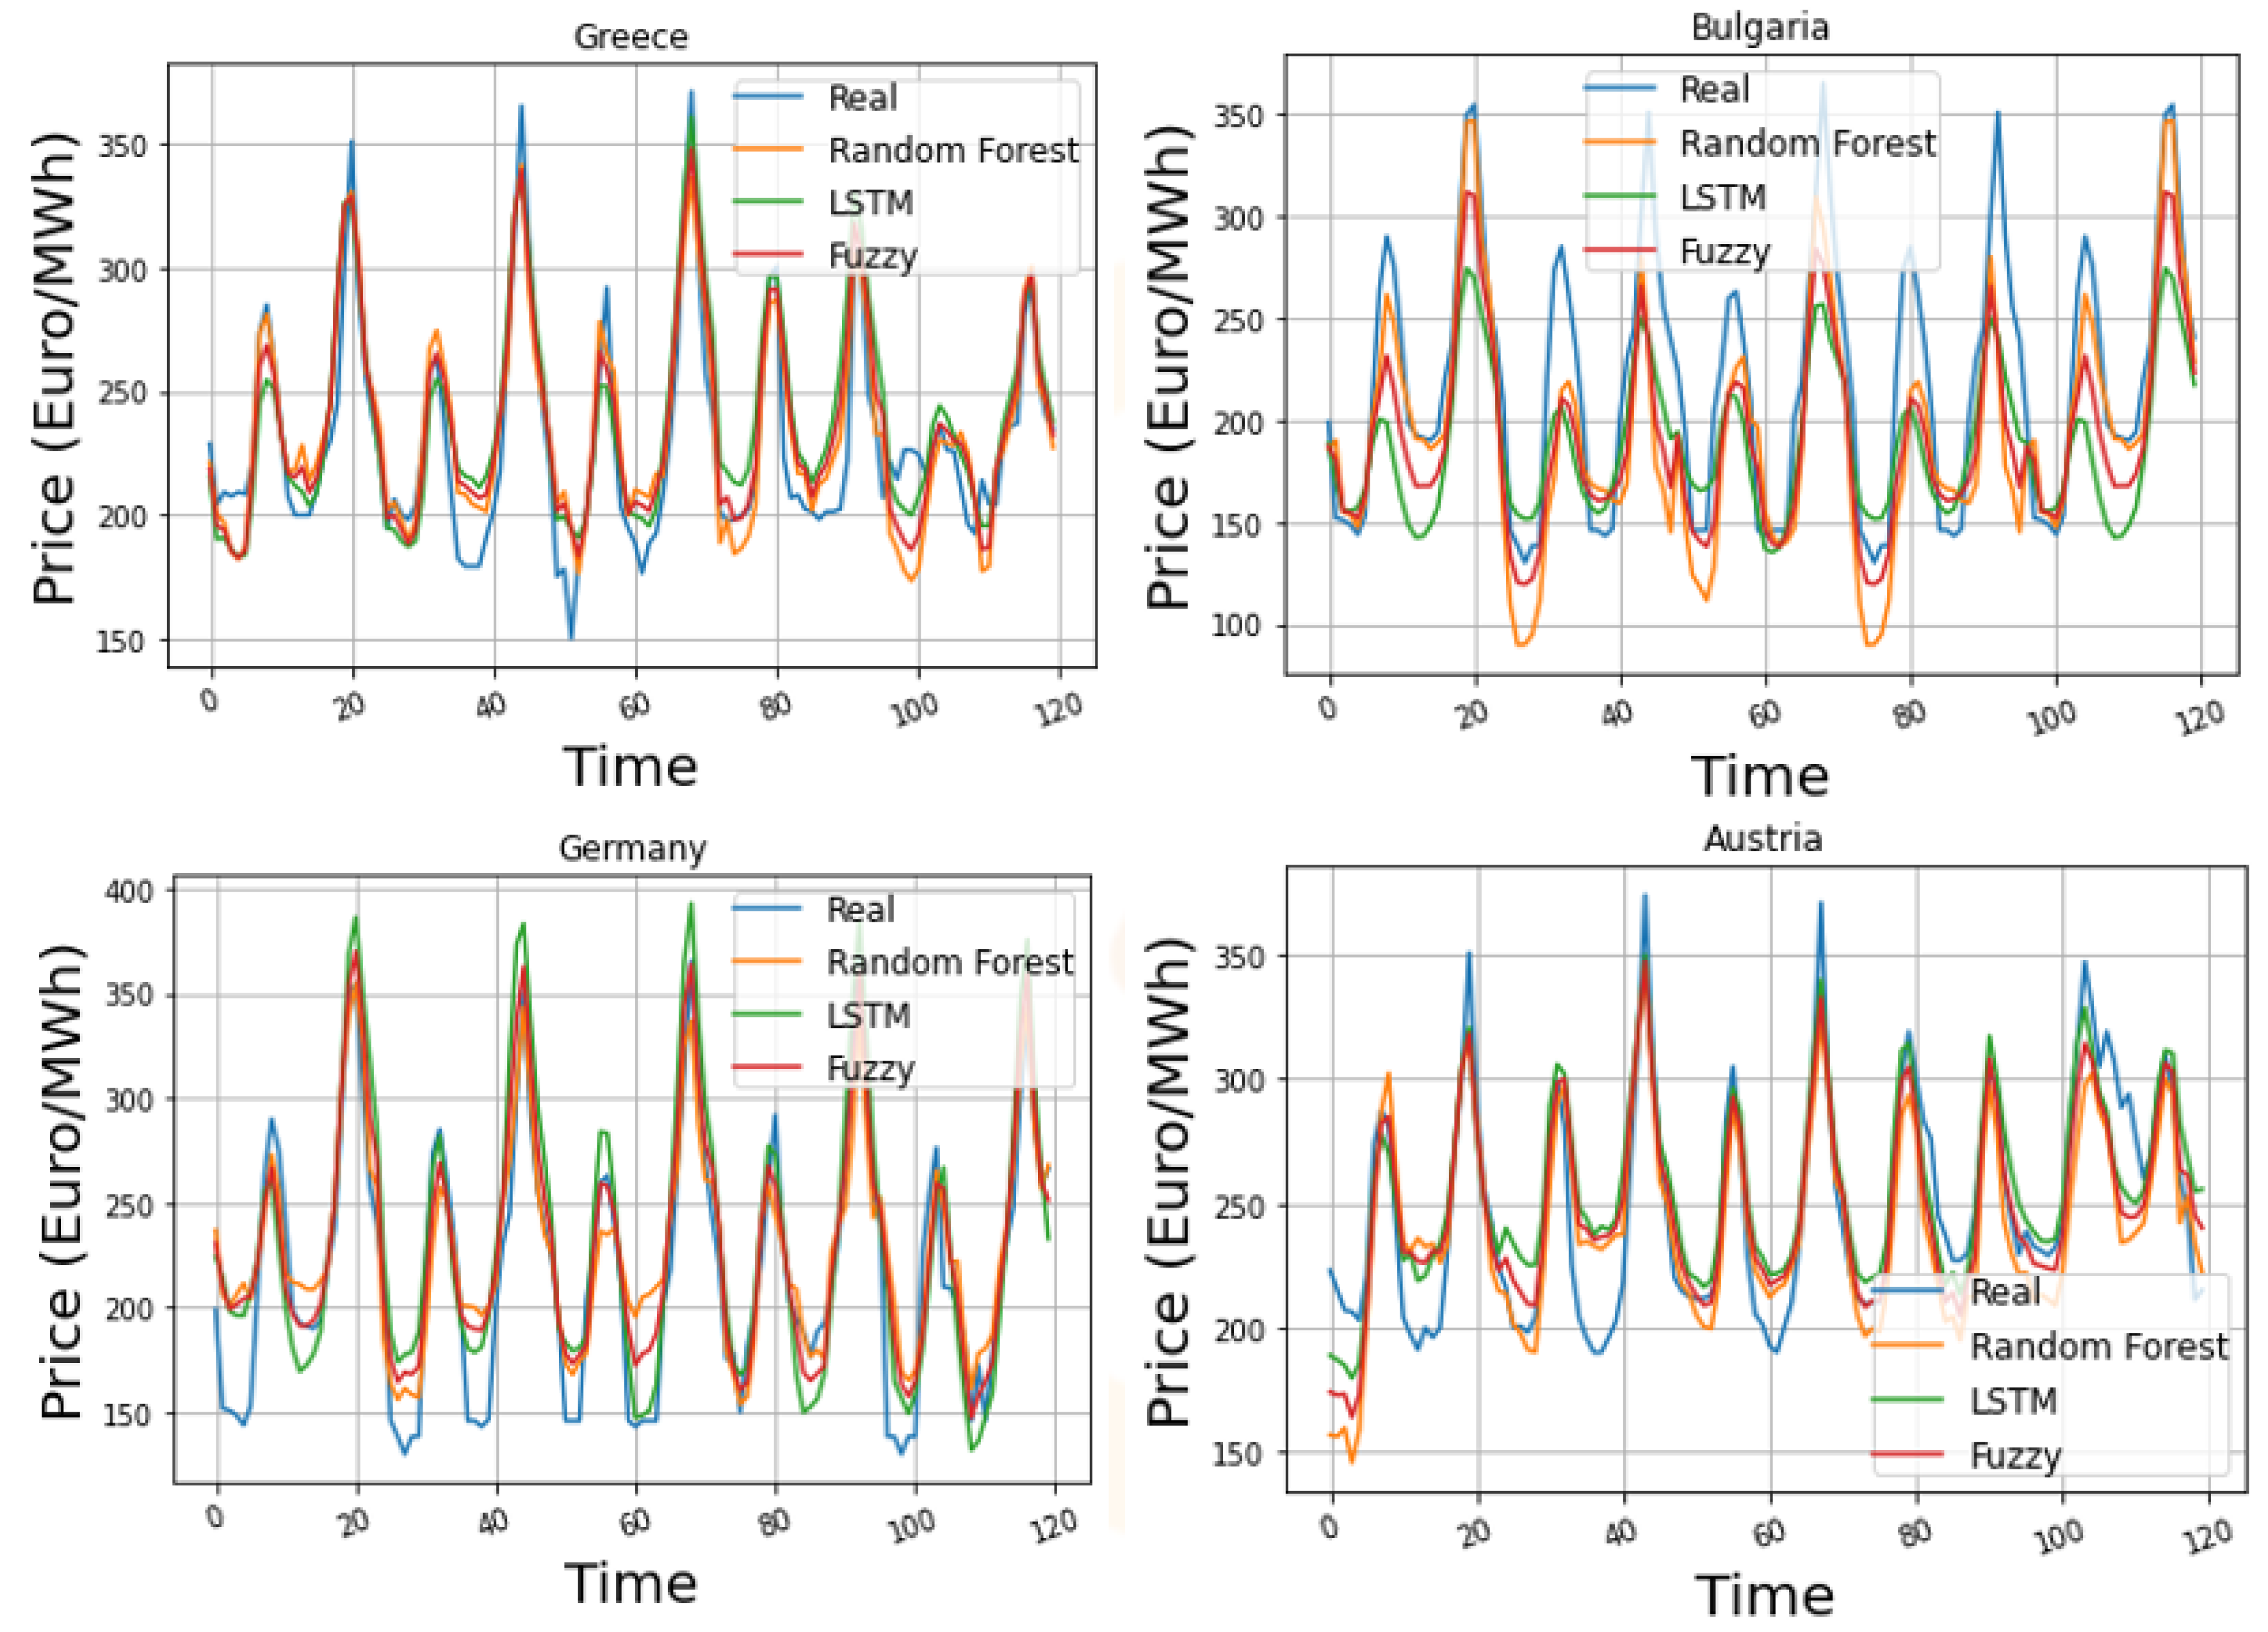
In
Figure 9, a plot showcasing the forecasting results for 5 days of the test set is presented. The specific date range shows indicative DAM prices for the testing period, and thus is appropriate for the comparison. The trend in the DAM price is captured accurately by all the examined forecasting algorithms; the fuzzy logic model appears to have the smallest deviations in the extreme values, which are also reflected in the presented metric results. In
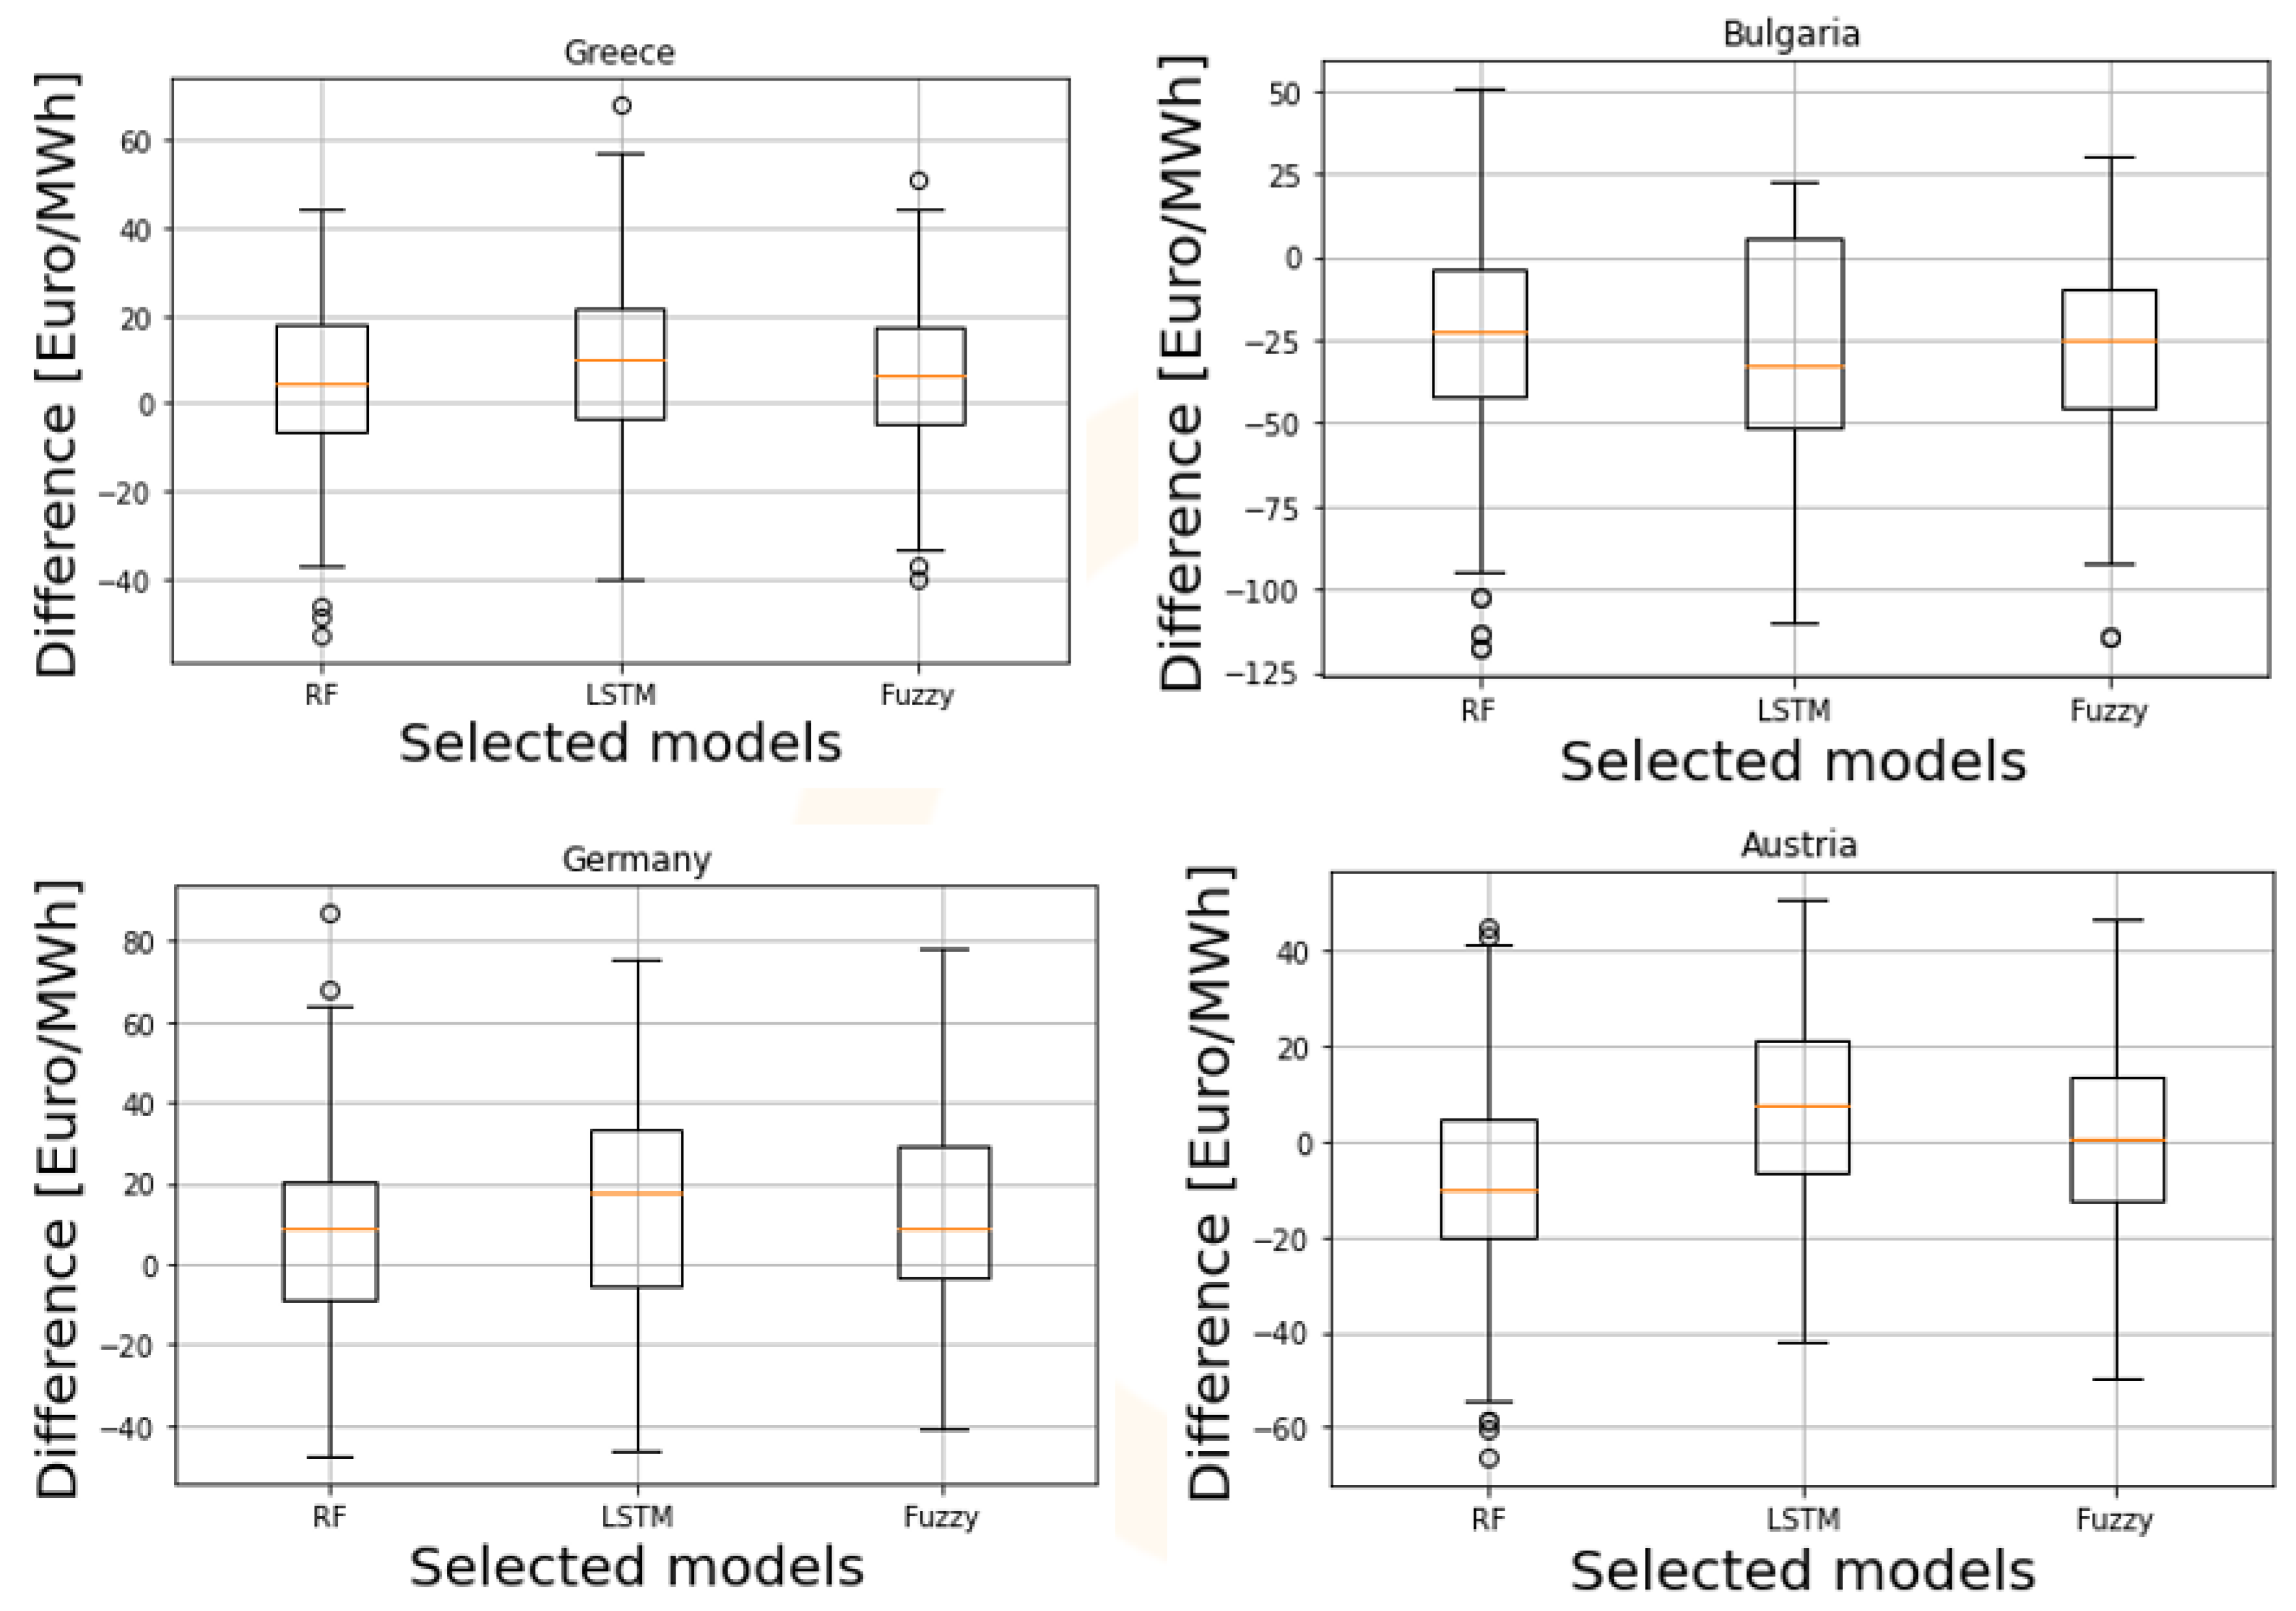
Figure 10, the distribution of the residuals in the test set is depicted in a boxplot. The red line shows where the Q2 quartile is located (median), while the distance between the box’s edges is called the interquartile range (IQR) and shows where the middle 50% of the residuals lie (Q3-Q1). In all the examined countries, the residuals’ median value for the fuzzy logic model is closer to zero. Additionally, the corresponding IQR displays residuals that are more tightly clustered, validating the superiority of the fuzzy logic approach compared to the RF and LSTM.
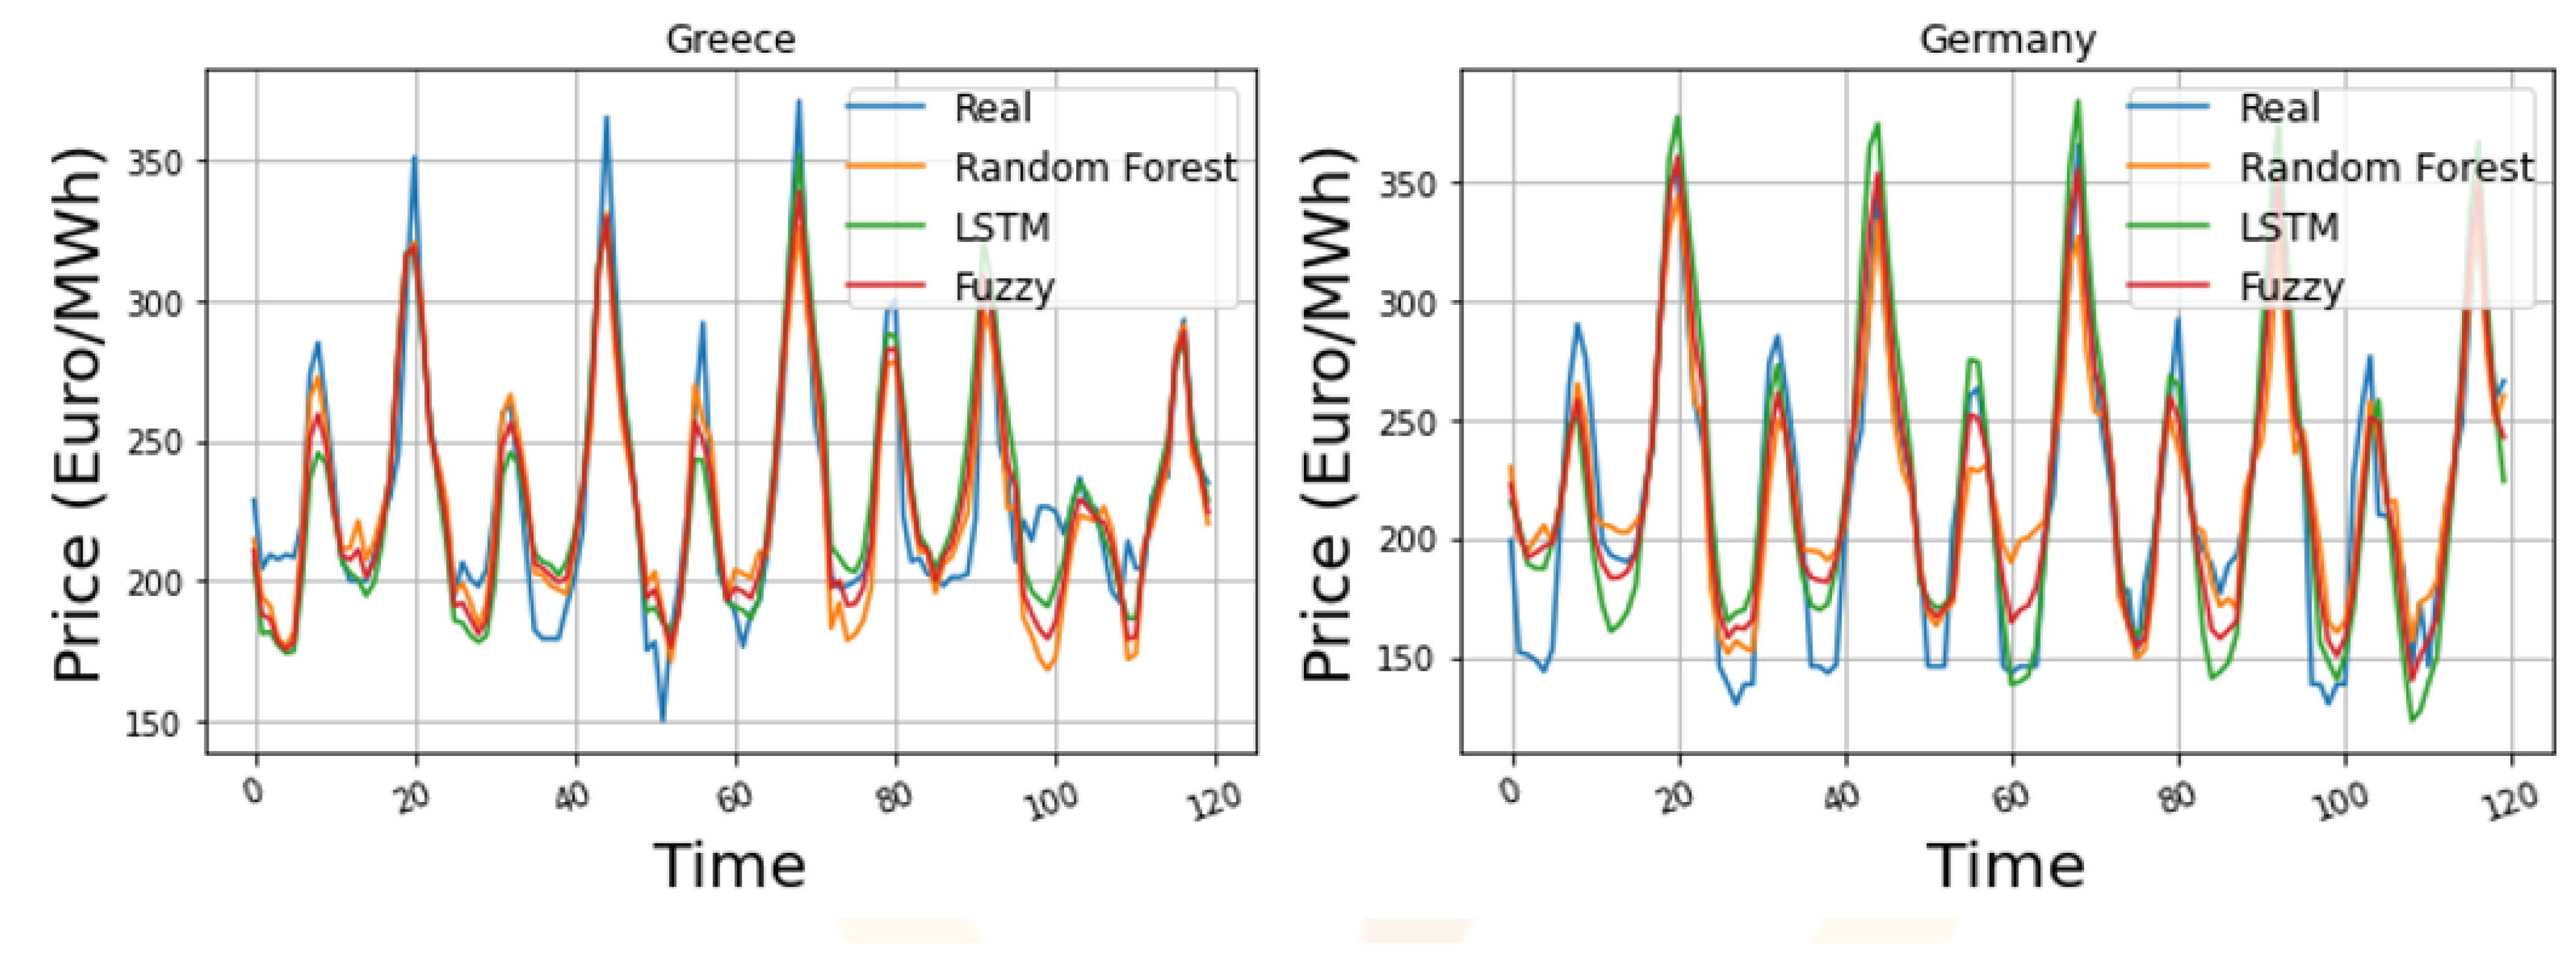
In scenario No.2, the performance of the algorithms in the case of the Greek and German electricity market is studied. Additional predictors are included in both cases. Specifically, the model for Greek DAM price prediction is enriched by the historical electricity data from the Bulgarian market, while the corresponding one for the German electricity market is enhanced by the Austrian data. The results are presented in
Table 3. In both cases, the accuracy is improved, confirming the correlation in electricity data between neighboring countries. The additional value is a result of the hours where there was no price convergence between the neighboring countries. For the remaining hours of the year, in which the same price co-exists, no additional information is added to the model, leading to identical results to Scenario No.1 being obtained. The fuzzy logic model again outperforms the other two algorithms, since it successfully combines the strengths of each model, leading to a better overall performance. The improved accuracy is more evident in the Greek DA market, in which it is enhanced by almost 17% compared to Scenario No.1. In the case of the German market, although there was an improvement, the added value was rather limited due to the fact that the influence of the Austrian market on the German is small.
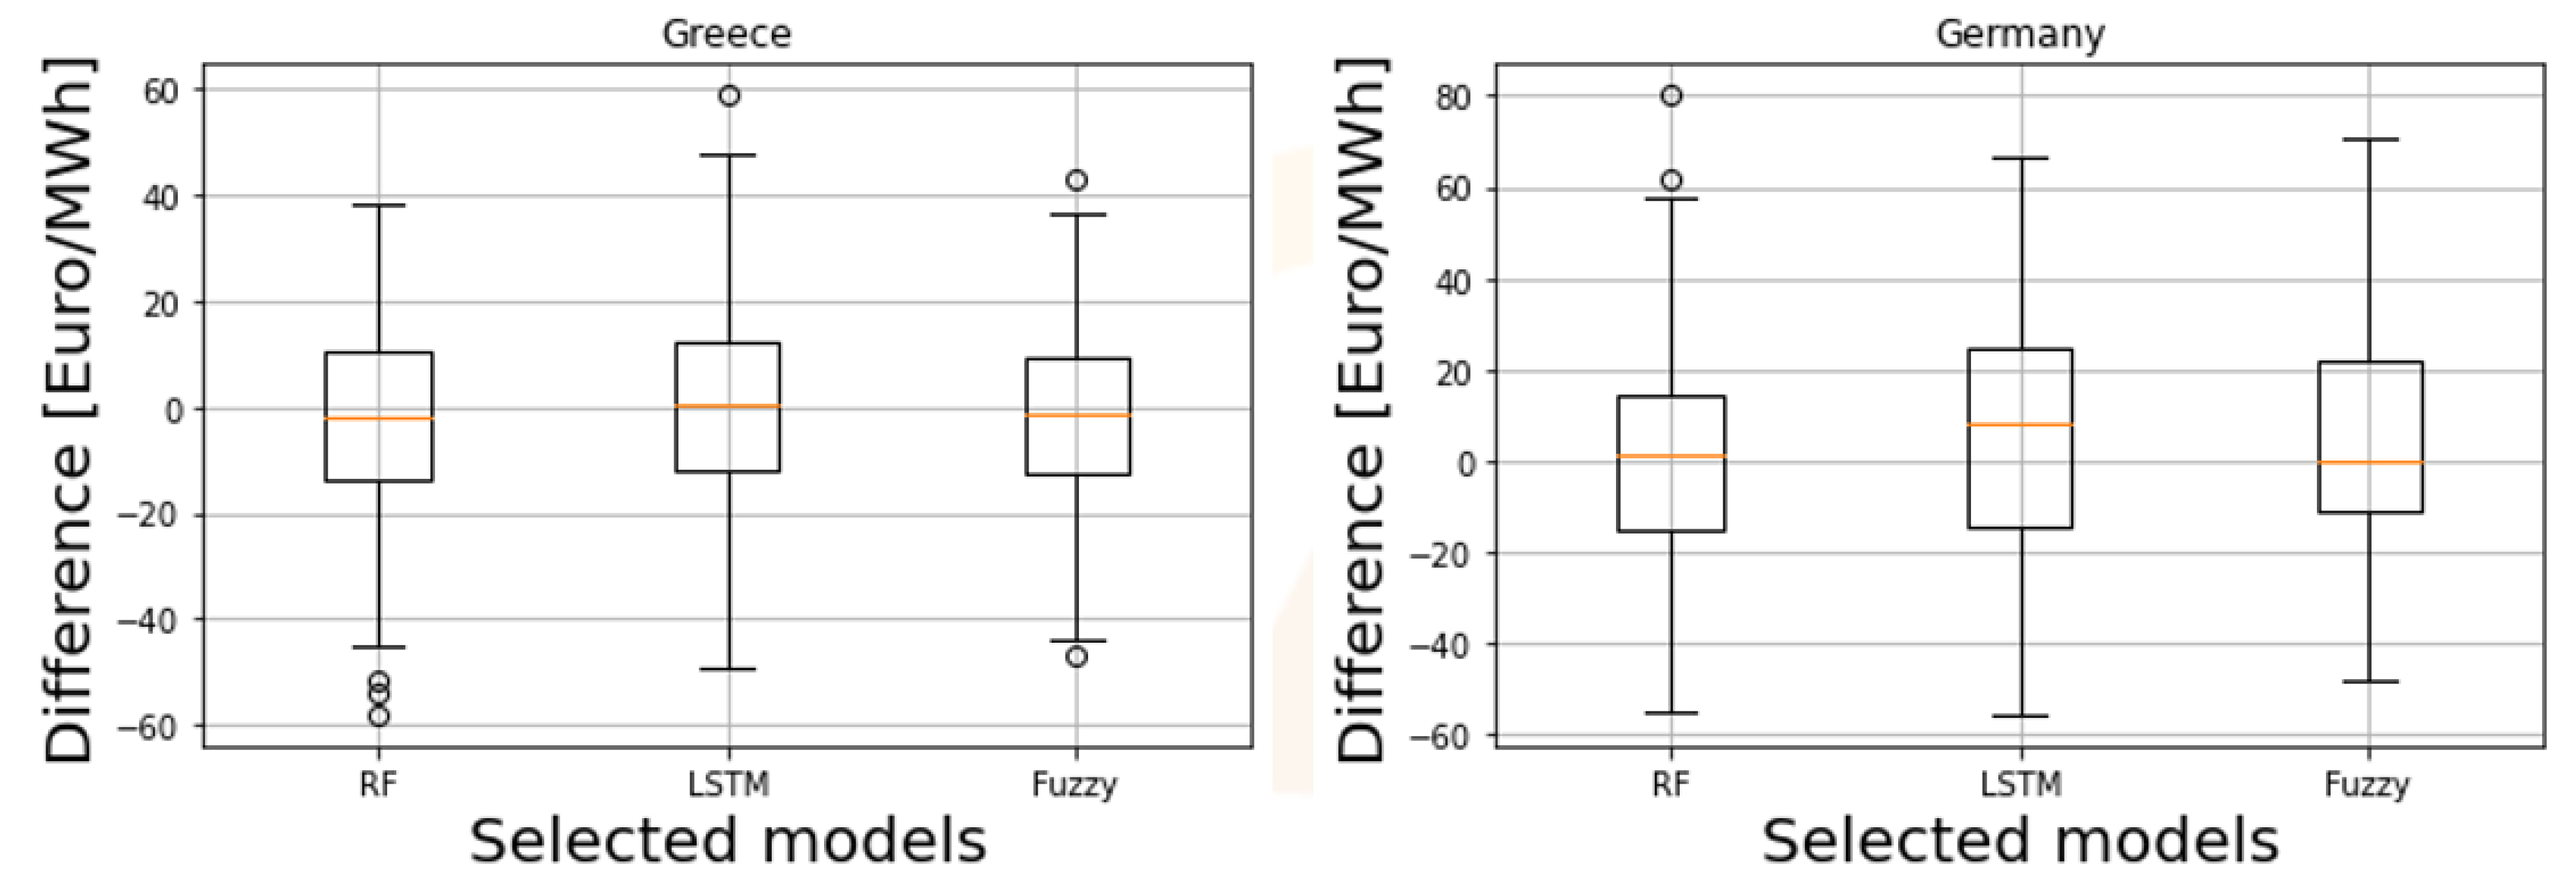
Finally, in
Figure 11 and
Figure 12, the respective time series plots and boxplots, similar to the ones presented for scenario No.1, are presented. Similarly to the previous case, the DAM price trend is captured by all the examined algorithms, while the respective residual distribution is also improved compared to that in Scenario No.1.
Finally, in
Table 4 a comparison of the forecasting performance for the three different periods of
Table 1 is presented for Scenario No.2. This is to validate that the increased volatility of the DAM of period C significantly affects the error metrics of the proposed algorithms. It is evident that the MAPE significantly drops in all cases for periods A and B. Specifically, an average decrease of almost 50% is depicted in both countries, while the proposed fuzzy architecture consistently shows the best performance. The error metrics for period B are lower compared to the ones for period A, mostly due to the decreased system load levels in all EU countries due to COVID-19 pandemic. To this end, it is clear that the examined dataset plays a crucial role in the forecasting performance; however, it was selected to be examined as it is one of the first studies predicting DAM prices in this period of high volatility and uncertainty.
4. Application Example: Scheduling of Industrial Processes
In this section, the application of the aforementioned EPF work to optimize the process scheduling of an industrial facility in terms of energy cost will be presented on a day-ahead scheduling horizon. The energy cost is reflected by integrating the DAM price in which the industry procures energy for covering its needs into the scheduling process.
Mathematical Formulation
To validate the importance of the proposed DAM price forecaster in the scheduling optimization framework, a short description of an optimization scheduling use-case example follows:
Let
be a number of independent orders and
be a list of factories belonging to the same company. The optimal allocation and scheduling of all orders to factories, while minimizing the total energy cost and/or the
emissions, is the main goal. Each order can only be implemented on a subset
of the factories and, due to the heterogeneity of each factory infrastructure, the execution time
and consumed energy
of order
in factory
are not constant. Let
be the orders that can be executed in factory
f. Let the variables
and
denote the start and end time of order
, while the variable
is a binary decision variable that equals 1 when order
is assigned to factory
; otherwise,
. An optional fixed-size interval variable
is introduced for each
and
. Given a specific time horizon
L in which, for each time period
, we have a forecast of the energy cost for each factory
and the renewable energy percentage
in the available energy, for each factory
and for every order
, an array of variables
is introduced that, for each point in the time horizon, calculates the cost and/or the
emissions. This problem can be formulated as a constraint programming (CP) model as follows:
s.t.
Equation (
4) is the objective function, minimizing the total operational energy costs of all factories. Equation (
5) ensures that each order is assigned to exactly one factory. Equations (
6) and (
7) define a binary variable that indicates whether two orders are assigned to the same factory, while Equations (
8) and (
9) define a binary variable that reflects whether order
i is scheduled before order
k. A non-overlapped-in-time execution sequence between two orders
,
is imposed by Equations (
10) and (
11) when they are assigned to the same factory. In addition to the CP model, a number of heuristics and ILP models based on the ideas presented in [
38,
39,
40], were implemented but are outside the scope of the current paper.
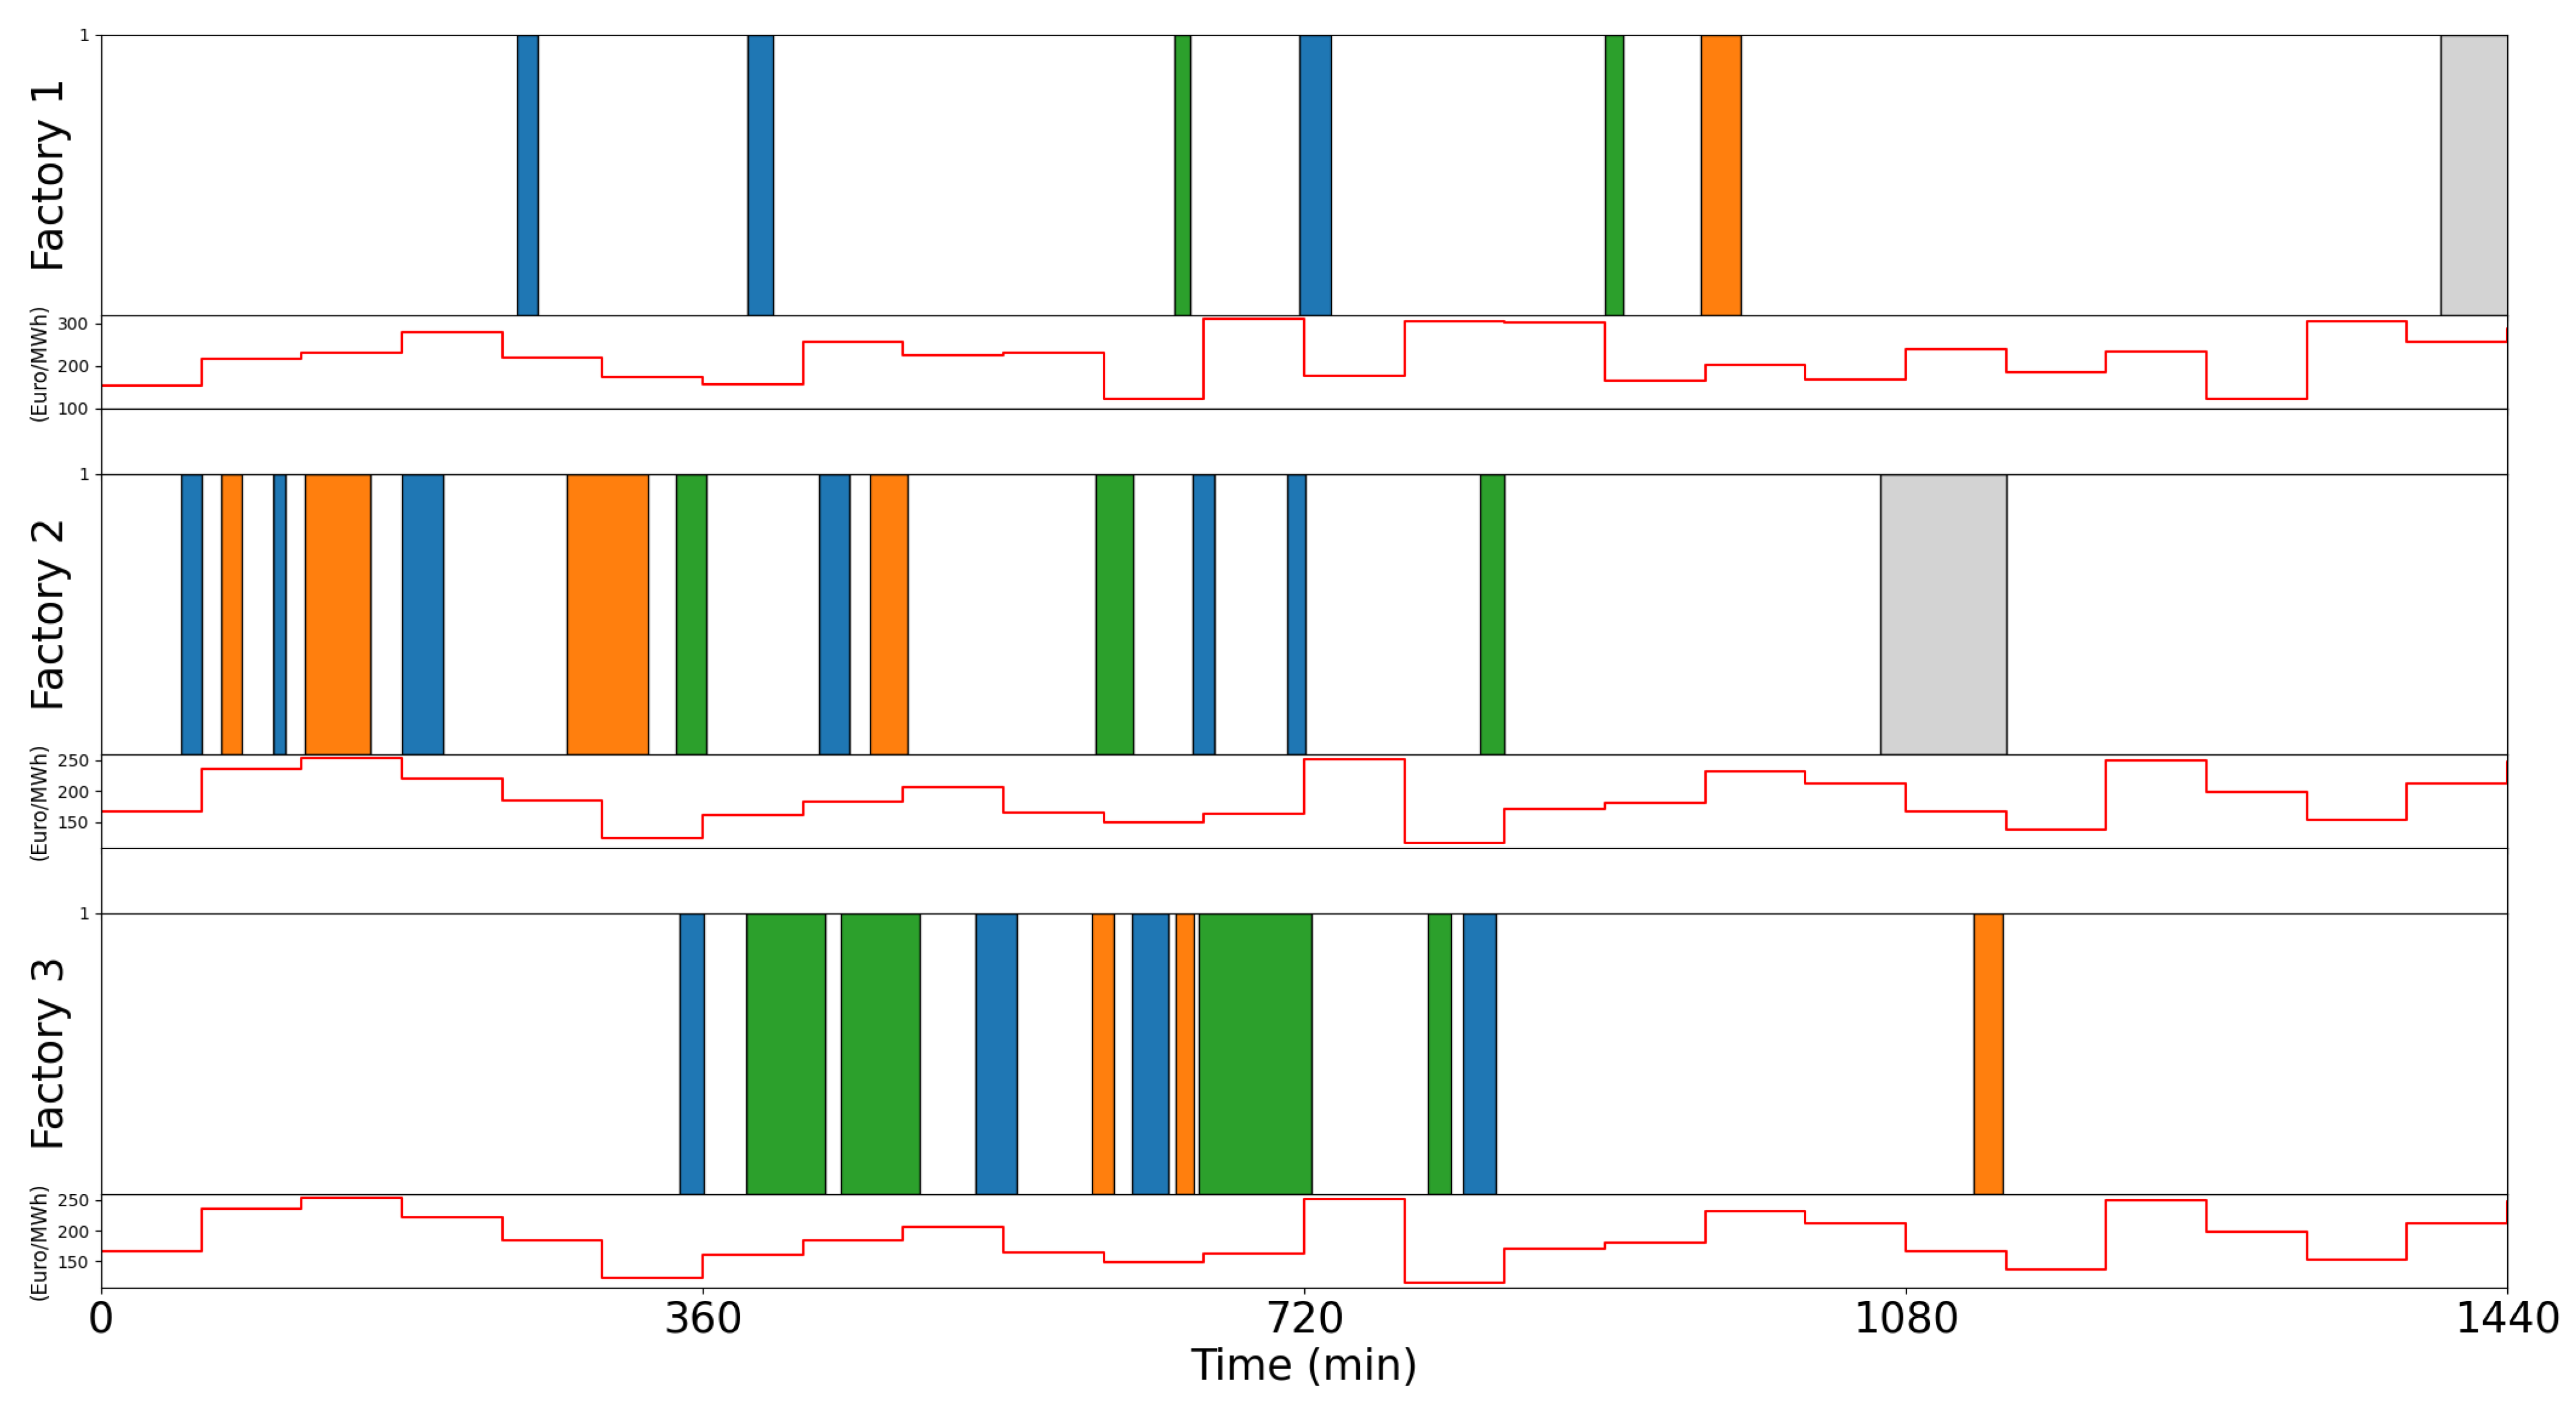
The case of 3 factories and 30 independent jobs was examined in this case study. The solution of the optimization problem is depicted in a Gantt chart in
Figure 13. Each job type is represented by different color (green, blue and orange). Grey represents periods in which the machine inside a factory is not available. The red graph indicates the forecasted energy price on the market region in which each factory is located. Factories 2 and 3 operate on the same market and this is why the same DAM price is considered, while factory 1 is located in a different region.
High-cost periods are avoided; the model ensures that the industrial process starts in the factory with the lowest energy costs if all the relevant constraints (e.g., earliest start time, latest finish time, etc.) are satisfied. As previously mentioned, not all tasks can be assigned to all factories.
Additionally, the operational costs for the optimal planning of the industrial applications considering the three forecasting algorithms are given in
Table 5. Specifically, the minimum, maximum and average costs of the solution were calculated using the forecasted DAM price of the respective method. The real operational costs are also depicted, calculated based on the actual DAM price.
The results indicate that the projected operational costs utilizing the fuzzy logic DAM prediction are the most accurate, standing for an percentage difference error of 5.64% compared to the actual ones. RF’s percentage error stands for 9.72% while LSTM’s error equals 13.51%. The results validate the importance of an accurate DAM price forecast when finding the optimal schedule for the industrial facility in terms of cost minimization. Additionally, the operational costs of the fuzzy logic model has the smallest projected range compared to the RF and LSTM. This is desirable, offering a more robust solution that does not present large differences between the minimum and maximum scenarios.
The reason that significantly better results were achieved in terms of scheduling cost with fuzzy logic compared to the respective forecasting error of the same method is that the scheduling algorithm determines the relatively better assignment and starting time of an order, which is implicitly correlated by the forecasting error. Fuzzy logic time series exhibit a more robust behaviour when comparing the number of underestimated time periods to the overestimated ones, which is an important property for the scheduler. However, underestimating low cost periods or overestimating relatively costlier periods negatively affects the forecasting error of the time series, while they have no effect on the scheduling outcome (difference). A scheduling selection of the orders will be made during the periods with lower forecasted energy costs, which will also be the case if these periods are the lower ones based on the actual data. To this end, the same optimal schedule will be generated by the scheduling algorithm and the operational costs will not be affected.
5. Conclusions
In the study, a DAM price forecasting tool was developed and analyzed in detail. A fuzzy logic approach, which integrates the results of two distinct forecasting algorithms, was implemented. The results show that this approach significantly enhanced the accuracy of the forecasts in all the examined countries. Moreover, including explanatory market data from neighboring countries further improved the accuracy of the forecaster. This improvement was consistent across all the examined countries and was attributed to the hours during which there was no price convergence in the DAM prices. This highlights the importance of incorporating relevant market data from neighboring countries in DAM price forecasting to obtain more accurate and reliable predictions. The distributed forecasting tool can then be used as an important input in the optimal scheduling process of an industrial facility, aiming to minimize energy costs and improve the energy efficiency. The resulting simulation data give strong credence to the claim that the proposed methodologies and tools can remarkably improve the decision making process of energy-intensive industrial facilities.
In summary, the study provides strong evidence that the proposed fuzzy logic approach to DAM price forecasting can significantly improve accuracy, particularly when neighboring countries’ market data are included. The resulting tool can be used as an important input in the decision-making process of energy-intensive industrial facilities, leading to improved energy efficiency and cost savings.
Future research could explore the integration of energy storage and on-site generation into the scheduling application of an industrial facility. As RES production in the energy mix is steadily increased, industries will need to synchronize their energy-intensive processes not only during periods of low electricity prices but also during periods of high RES penetration. This would necessitate the accurate forecasting of not only electricity prices but also RES penetration into the mix to meet the production planning requirements.


 ,
, 


