Article

Study on Intermittent Microwave Convective Drying Characteristics and Flow Field of Porous Media Food

1
School of Materials and Energy, Guangdong University of Technology, Guangzhou 511400, China
2
School of Naval Architecture and Ocean Engineering, Guangzhou Maritime University, Guangzhou 510700, China
*
Authors to whom correspondence should be addressed.
Energies 2023, 16(1), 441; https://doi.org/10.3390/en16010441
Submission received: 30 November 2022 / Revised: 17 December 2022 / Accepted: 28 December 2022 / Published: 30 December 2022

Abstract

:
Numerical simulations were carried out for moist, porous media, intermittent microwave convective drying (IMCD) using a multiphase flow model in porous media subdomains coupled with a forced-convection heat-transfer model in an external hot air subdomain. The models were solved by using COMSOL Multiphysics was applied at the pulse ratio (PR) of 3. Based on drying characteristics of porous media and the distribution of the evaporation interface, IMCD was compared with convection drying (CD). Drying uniformity K, velocity difference, temperature difference, and humidity difference were introduced to evaluate the performance of three models with different inlets and outlet wall curvature. The numerical results show that as the moisture content of slices was reduced to 3 kg/kg, the drying rate in IMCD was 0.0166–0.02 m/s higher than that in CD, and the total drying time of the former was 81.35% shorter than that of the latter. In the late drying stage of IMCD, the core of the sample still had a high vapor concentration and temperature, which led to the evaporation interface remaining on the surface. The vapor evaporated from the slices can diffuse rapidly to the outside, which is why IMCD is superior to traditional convection drying. Through the comprehensive analysis of the models with different inlet and outlet wall curvatures, the drying uniformity K of the type III was the highest, reaching 89.28%. Optimizing flow-field distribution can improve uniform of airflow distribution.

1. Introduction

As the main drying method of apple slices, convection drying (CD) has the disadvantages of uneven quality of dried products and high energy consumption and time [1,2,3,4]. To overcome this problem, combined microwave convection drying is practiced. However, continuous use of microwave heating may cause the sample to overheat, reducing product quality. The use of intermittent microwave convection drying (IMCD) can overcome this disadvantage by using pulse ratio (PR) to control the evaporation rate [5,6].
Due to the coupling effect of heat and mass transfer between internal materials and drying environment, the mechanism in IMCD is complex. As a recent drying method, there are few models available to describe this process. It is essential to understand the mechanisms of microwave drying behavior to propose optimization strategies for better product quality and less energy consumption. In the present work, apple slices were used as the dried material and regarded as a porous media for research. Through theoretical and numerical analysis, the IMCD model of hygroscopic porous media was derived by volume average approach.
At present, the research on the porous media microwave drying process can be divided into two categories: the empirical model based on experiment [7,8,9] and the theoretical model [6,10,11,12]. IMCD is a multivariable, nonlinear, and time-varying process [13]. Predictive capability of empirical models is limited, and it cannot provide physical insight into the heat- and mass-transfer process inside materials (especially during tempering period). Theoretical models can be classified into the single-phase model [10,14] and multiphase model according to the phase form and transmission mechanism of moisture. The single-phase model only considers moisture diffusion and cannot provide other transport mechanisms such as capillary-driven flow, convection, and evaporation inside the porous media. To understand the IMCD process in greater depth, it is necessary to establish a multiphase drying model considering liquid water, gas transport, and solid matrix.
Compared with the single-phase model, the multiphase model accounts for the change of gas–liquid flow, which can describe the trend of moisture and heat migration during IMCD comprehensively. Tushar et al. [15] developed the multiphase model of potato spheres to study the microwave focusing caused by sample size. However, the microwave intermittency was not considered. Based on Lambert’s law and the intermittence of the microwave, Kumar et al. [16] developed the multiphase model for apple drying. Zhang et al. [17] established the multiphase model to study the sensitivity of parameters such as temperature and effective diffusion coefficient during IMCD. However, the above research neglected the effect of flow field on the drying process. Defraeye et al. [18] developed the CD model based on an apple slice, which proved that the internal drying kinetics were significantly affected by the flow field around the slices, resulting in the spatial variation of surface convective heat and mass-transfer coefficients. Recently, Khan et al. [19] developed the IMCD model for the apple slice considering the effect of flow field, which found that the lack of applying CFD would lead to excessive prediction of drying kinetics and uneven temperature distribution in the sample. However, the above studies lack the effect of evaporation interface movement on drying as described below.
In recent years, in order to obtain information about the drying characteristics and the internal moisture transport mechanism, the discussion about the evaporation interface movement inside the material has been widely undertaken in relevant studies. Zhao et al. [20] developed the one-dimensional heat-mass coupling model for wood drying and investigated the evaporation interface movement under different fiber saturation points. However, this model only considers CD. As a drying technology that can directly heat the inside of the product and provide additional driving force for moisture migration, the discussion of evaporation interface movement in IMCD is indispensable. Chen et al. [21] conducted an experimental study on microwave drying of apples and proposed that under continuous microwave power, the internal pressure gradient provides a driving force, resulting in outward moisture migration. The evaporation interface is maintained at the surface, thereby maintaining a high drying rate. However, the relationship between the movement of evaporation interface and the drying kinetics is rarely investigated in the existing IMCD numerical simulation studies.
Based on the above literature, there are some models for microwave drying materials. Nevertheless, few examples in the literature consider the influence of intermittency and flow-field distribution to discuss the migration of internal evaporation interface. Therefore, the aim of the present study was to describe coupling heat and mass transfer during IMCD by introducing a multiphase model while quantitatively characterizing the moving interface. The specific aims of this work are as follows:
  • To acquire the drying characteristics of apple slices during IMCD and compare those with CD;
  • To investigate the mechanism of evaporation interface movement under intermittent microwave in multi-physics fields and analyze its migration effect;
  • To explore the effect of flow-field distribution on IMCD through different curvatures of the inlet and outlet.

2. Model Development

In this section, the multiphase flow equation describing mass, momentum, and heat transfer during IMCD is developed. The arrangement of samples in the oven and the transport mechanism involved in the drying process are given in Figure 1. Due to the different heat- and mass-transfer mechanisms inside and outside the material, the calculation domain to be solved is decomposed into porous media subdomain and forced-flow subdomain, establishing governing equations, respectively, as illustrated in Figure 1.

2.1. Problem Description and Assumptions

In our hypothesis, the movement of liquid water and its vapor through rigid porous media is considered. The analysis is not restricted by the particular liquid water distribution shown in Figure 1. Apple slices are considered as a porous media consisting of three phases: solid skeletons (s), liquid water, and gas (g). The liquid water is constituted by free water (w). The gas is formed by air (a) and vapor (v), which are insoluble in both the solid and the liquid phase. All phases (s, w, and g) are continuous, and the local heat balance is effective, which means that the temperatures of all three phases are equal. In particular, the equation takes into consideration the influence of Darcy flow, pressure gradient, capillary diffusion, and molecular diffusion. The energy equation includes the latent heat of evaporation and a microwave heat generation term using Lambert’s law. Considering the complexity and computational cost of the intermittency model, the following assumptions are applied [22]:
  • The medium is regarded as continuous and homogeneous, based on the definition of a representative elementary volume (REV);
  • Thermophysical properties of air during drying are constants. The airflow in oven is laminar and steady;
  • No shrinkage and other deformation occur during drying;
  • The initial temperature and moisture distribution inside the material are uniform.

2.2. Governing Equations

2.2.1. Calculation of Forced-Flow Subdomain

The free medium flow of gas (air and vapor) in forced-flow subdomain follows the basic equation of fluid mechanics. The equations are as follows:
ρ g t + · ( ρ g u g ) = 0
ρ g u g t + ρ g u g · u g = p + · μ g u g + u g T 2 3 μ g · u g I
where ρ g is the density of binary gas mixtures (kg/m3), u g is the average velocity of binary gas mixtures (m/s), and p is the pressure (Pa). μ g is the dynamic viscosity of binary gas mixtures (Pa·s), and t represents time (s).
Exchange and accumulation of energy are due to heat transfer by conduction and convection. The temperature distribution in the hot air subdomain can be described by the energy equation below:
ρ g c p , g T t + ρ g c p , g u g · T = · ( λ g T ) + Q
where c p . g is the gas-specific heat (J/kg·K), λg is the gas thermal conductivity (W/m·K), and Q is the internal heat source caused by microwave heat generation and latent heat (W/m3). T is absolute temperature (K).
For vapor transmission in forced-flow subdomain, assuming that the diffusion phenomenon obeys Fick’s law, and based on the mass-conservation law, the following governing equation can be established:
c v t + u g · c v · ( D v a c v ) = 0
where cv is the vapor concentration (mol/m3); Dva is vapor–air diffusivity, 2.6 × 10⁻⁵ m2/s.

2.2.2. Calculation of Porous Media Subdomain

The calculation equation of flow field in the porous media subdomain is obtained by treating Equations (1) and (2) with the idea of volume average [23], which can be written as follows:
ε ρ g t + · ( ρ g u g ) = 0
Because the pore portion contains liquid water, the space to accommodate the vapor depends on initial equivalent porosity ε 0 and gas saturation S g by ε = ε 0 S g .
Considering the permeation effect in porous media, momentum transfer needs to be modified by Darcy’s law. Equation (5) is extended to Navier–Stokes equation form in order to solve the equations with CFD solver. Darcy’s modification leads to the following:
ρ g ε u g t + ρ g ( u g ε · ) u g ε = p + · 1 ε μ g ( u g + ( u g ) T ) 2 3 μ g ( · u g ) I μ g k g u g
Equations (5) and (6) can be utilized to describe the gas movement in porous subdomain. Here, k g represents permeability for gas phase (m2).
Considering that air is compressible, and its density is affected by temperature, the density ρ g in Equations (1)–(3), (5), and (6) needs to be recalculated. According to the gas state equation, the following equation can be derived [24]:
ρ g = 1.293 p T 0 p 0 T
where p0 is atmospheric pressure (Pa). Studies have shown that aerodynamic viscosity has a significant relationship with temperature, and it is nearly independent of pressure [25], namely
μ g = 0.017 × 10 3 T 273 0.65
The governing equations of energy calculation in the porous media subdomain are given below:
( ρ c p ) s , w , g T t + ( ρ c p ) w u w · T + ( ρ c p ) g u g · T = · ( λ s , w , g T ) γ m ˙ evap + Q m f ( t )
( ρ c p ) s , w , g = ( 1 φ ) ( ρ c p ) s + S w φ ( ρ c p ) w + S g φ ( ρ c p ) g
λ s , w , g = ( 1 φ ) λ s + φ S w λ w + φ S g λ g
where ρs and ρw are the density of liquid water and apple slice solid, respectively (kg/m3); cp,s and cp,w are the specific heat capacities of solid and liquid water, respectively (J/kg·K); λs and λw are the thermal conductivity of solid and liquid water, respectively (W/m·K). m ˙ evap is the mass rate of evaporation per unit volume (kg/m3·s); γ is the latent heat of evaporation (J/kg). Qm is the microwave heat generation (W/m3), and f(t) is the intermittency function as discussed in a later section. Due to the density, specific heat capacity and thermal conductivity in porous media vary with the mass and volume fraction of each phase. Therefore, Equations (10) and (11) are calculated for the internal thermophysical properties using the volume-weighted average method. The set of equations are often solved by transforming the concentration in terms of saturation. Vapor, air, and liquid water concentrations are related to liquid water saturation Sw and gas saturation Sg by c v = p v S g ε 0 M v R T , c a = ( p p v ) S g ε 0 M a R T , and c w = ρ w ε 0 S w , respectively. Here, M is the molecular weight (kg/mol).
According to Halder [26],the sum of the saturations of each component in the porous medium is 1:
S w + S g = 1
Lambert’s law is used for the calculation of electromagnetic heat generation. At present, Lambert’s law has been widely used in microwave heating models [6,14,27]. This law takes into account the exponential decay of microwave absorption within the sample as follows:
P m = P 0 exp ( 2 α ( y z ) )
where Pm is the microwave absorption power (W), P0 is the incident power at the surface (W), and α the attenuation constant (1/m); y the thickness of the sample (m); yz represents the distance from surface (m).
The incident power at the surface, P0, can be determined by solving for the heat absorbed by water of the same volume and the heat loss caused by latent heat of evaporation:
P 0 = m w C p , w Δ T Δ t γ m ˙ evap
where mw is the evaporated mass of water (kg).
The attenuation constant α is represent by Equation (15):
α = 2 π λ ε 2 1 + ε ε 2 1
where λ is the wavelength of microwave in free space, and λ is 0.1224 m at microwave frequency of 2450 MHz and air temperature of 20 °C. ε and ε are the dielectric constant and dielectric loss for the apple slice, respectively, which can be calculated using the following expressions [28]:
ε = 36.638 M w b 2 + 30.289 M w b + 0.1
ε = 13.543 M w b 2 + 26.815 M w b + 0.1
Here, M w b is the moisture content on wet basis and can be calculated from following expression:
M w b = 1 M d b = 1 c w + c v 1 ε 0 ρ s
where M d b is dry basis moisture content.
The volumetric heat generation, Qm is calculated by
Q m = P m V
where V is the volume of apple slice sample (m3).
The mass-transfer equation of vapor in porous media subdomain can be calculated from the following expression:
c v t + u g ε · c v · ( D eff c v ) = m ˙ evap
where Deff is the effective diffusion coefficient of vapor (m2/s), D eff = D v a φ 4 / 3 S g 10 / 3 .
The m ˙ evap is proportional to the concentration gradient and related to the moisture content inside the porous media, which is given by
m ˙ evap = K evap ( a w c v , s a t c v )
where Kevap is evaporation rate (1/s), and c v , s a t is vapor concentration at saturation (kg/m3). a w is water activity, which can be represented by the ratio p v / p v s T [29].
The liquid phase velocity u w can also be called the Darcy velocity, defined as the volume flow rate per unit cross-section of the medium. The liquid-water-transfer equation is as follows:
c w t + u w S w ε 0 · c w · ( D cap c w ) = m ˙ evap
where D cap is capillary diffusivity (m2/s) based on Ni [30] and is related to moisture content as D cap = 1.0 × 10 8 exp 6.88 + 8 M w b .
Specific heat capacity and thermal conductivity of apple can be expressed as a function of moisture content. The moisture-dependent data for the specific heat capacity and thermal conductivity of apple have been published previously [31]:
c p , s = 1000 × ( 1.4 + 3.22 M w b )
λ s = 0.49 0.433 exp ( 0.206 M w b )

2.2.3. Intermittency Function

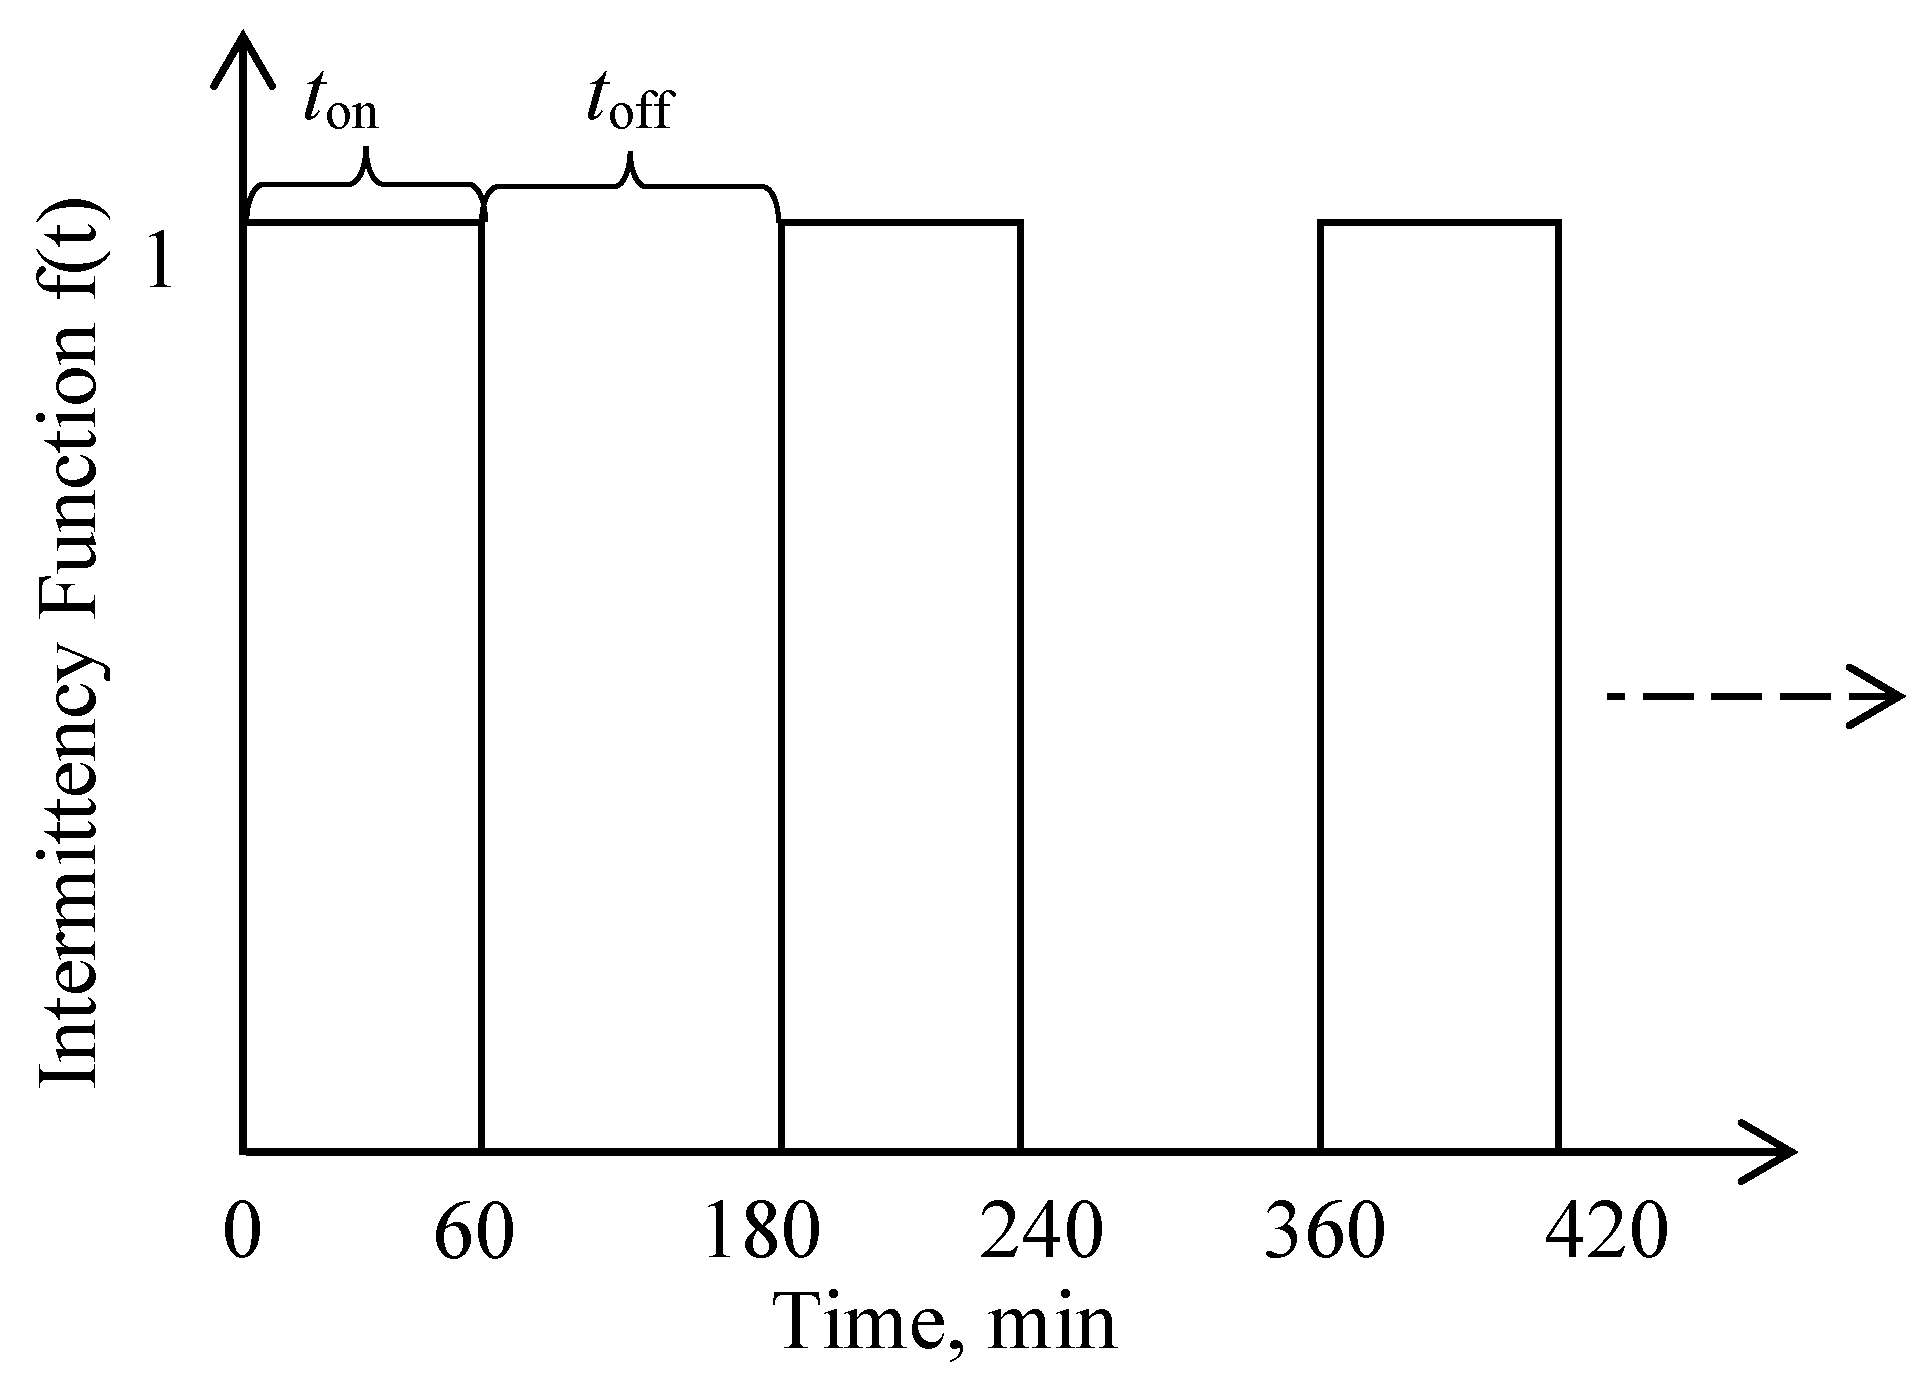
The intermittency function f(t) is developed using a combination of function from COMSOL and multiplied with the microwave heat generation Qm in Equation (18) to achieve microwave intermittency. The intermittency function f(t) is 1 during the heating period (when the microwave is on) and 0 during the tempering period (when the microwave is off). Previous publications by Khan [19] and Pham [32] demonstrated that a pulse ratio of 3 provides better nutritional and sensory quality compared to other pulse ratios. Thus, this simulation uses a pulse ratio (PR) of 3 (intermittency microwave 60 s on and 120 s off), as shown in Figure 2.
P R = t on t total = t on + t off t on

2.2.4. Boundary Conditions

The inlet velocity and inlet air temperature are set according to the operating table (Table 1). The outlet boundary condition is pressure outlet, and the anti-reflux condition is added. The boundary condition between the free fluid domain and the porous media domain is that the gas velocity u g and pressure ρ g are equal, which means that the component of the velocity vector is continuous at the interface between the free flow region and the porous region. The pressure is also continuous at the interface. Through the internal boundary conditions, the N-S equation and the Brinkman equation are coupled.

2.2.5. Initial Condition

The input parameters for solving the multiphase model during IMCD are presented in Table 1.

2.3. Grid Sensitivity and Model Validation

The relative differences of the outlet velocity with different grid element numbers are presented in Table 2. It can be seen from Table 2 that between the 102,784 grid element number and 120,683 grid element number, the relative difference in outlet velocity is less than 1%. Grid sensitivity is met beyond 102,784 grid elements. Hence, the present study uses this number of elements to perform throughout simulation.
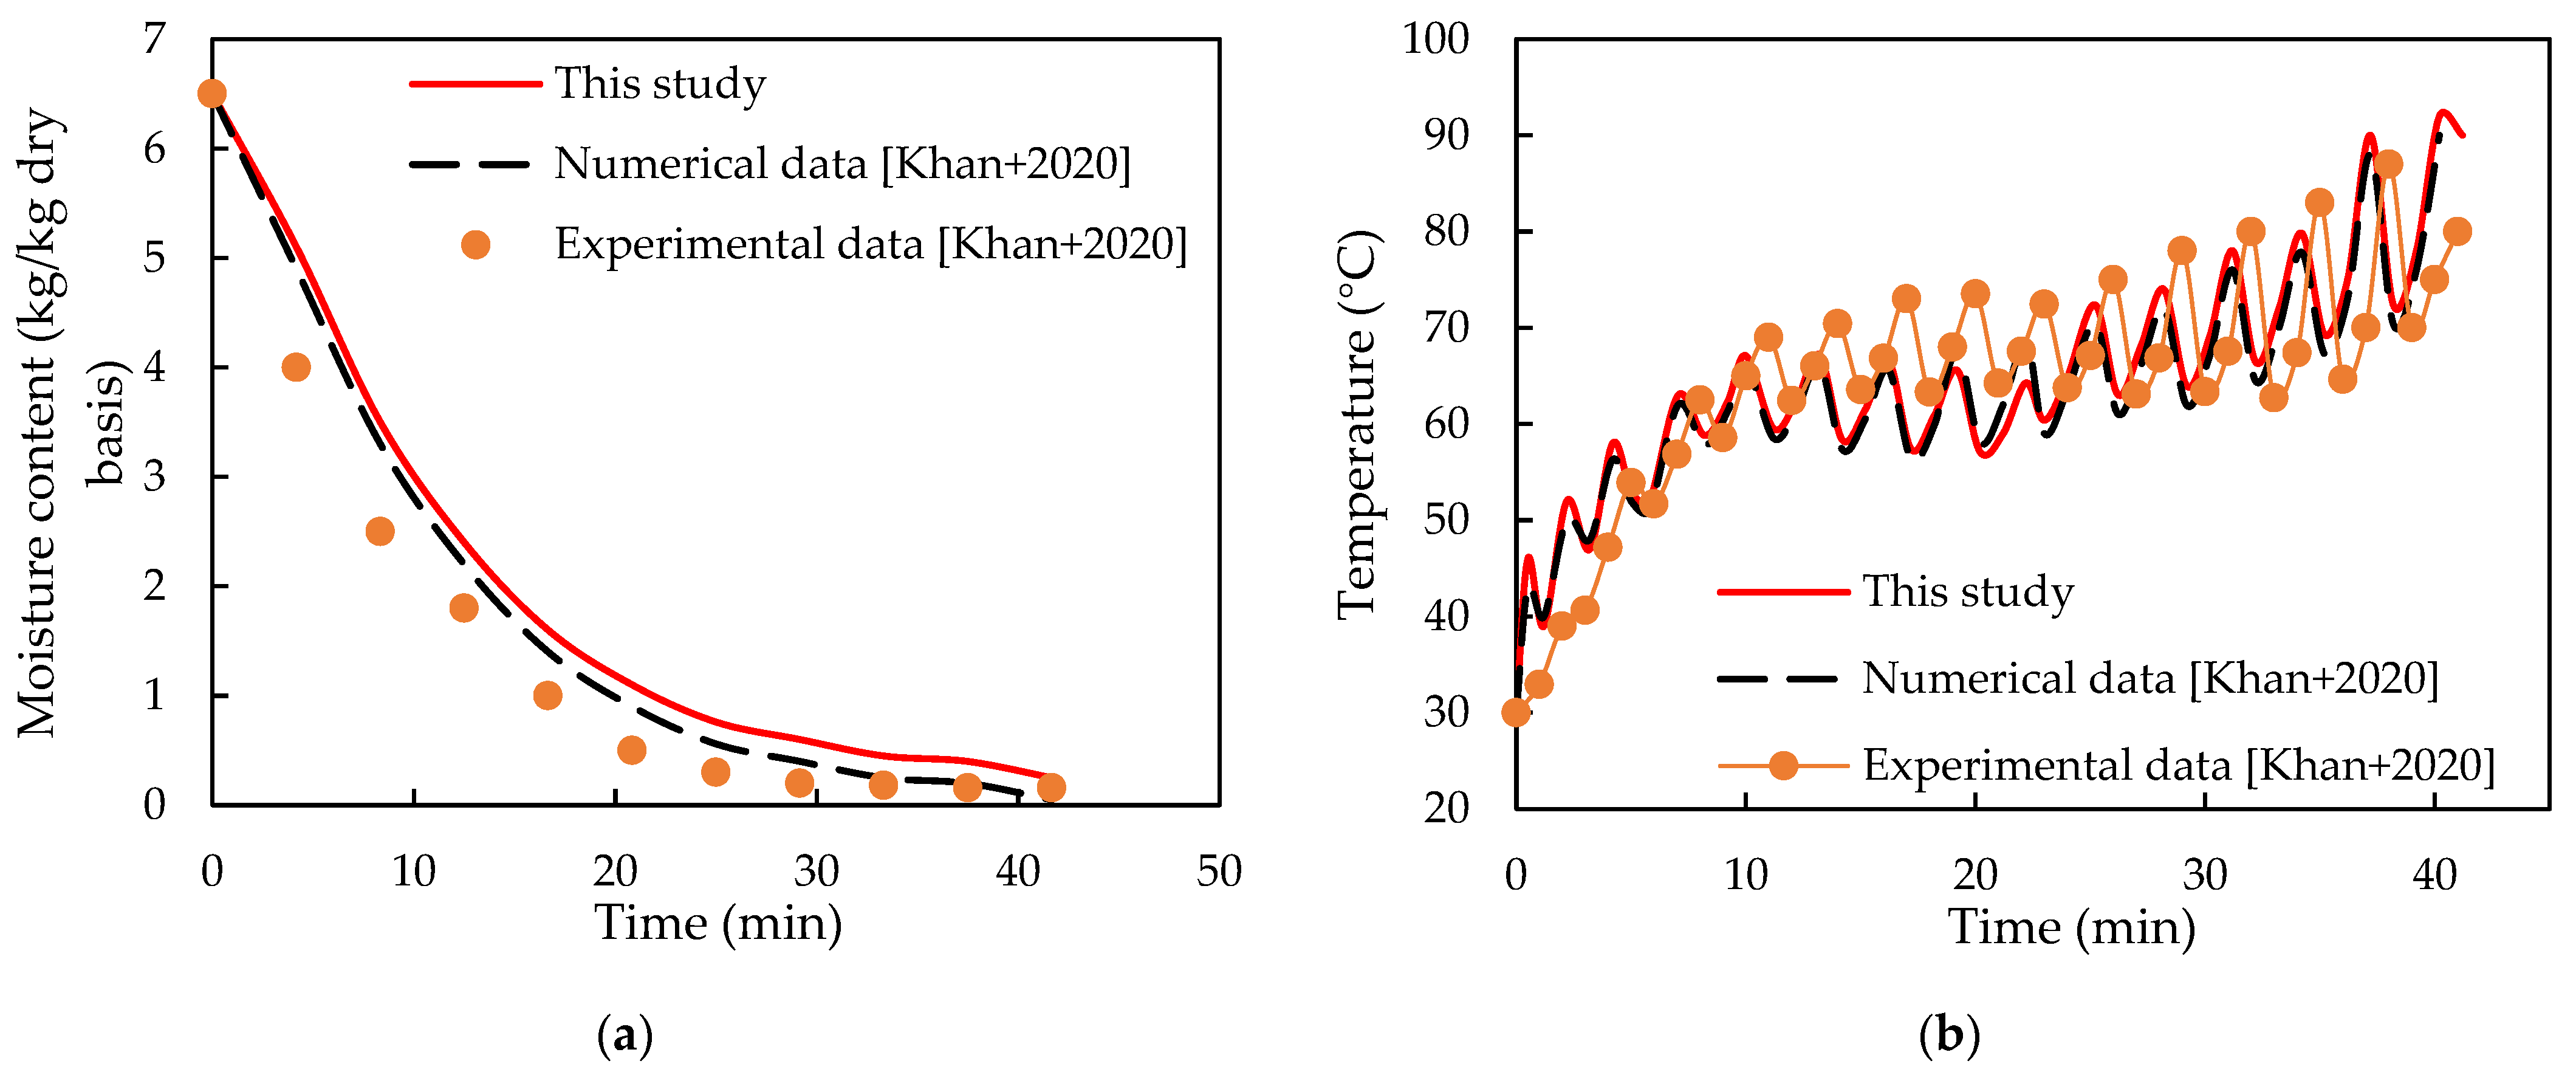
In this study, the model was verified by using the experimental and simulation values of a single 50 mm × 20 mm apple slice given in the literature [19] under the same intermittent period (30 s microwave on, 60 s microwave off), as shown in Figure 3. According to the results in Figure 3a, it was found that the overall trend of the simulation results and the results in the literature are consistent, which reflect that the moisture content decreases with time. The determination coefficient R2 between the simulated data (this study) and the simulated data from [19] is 0.976. As shown in Figure 3b, the predicted temperature values in this study are in good agreement with the results reported in the literature [19]. Both of them show that the temperature fluctuates in the intermittent period, and the deviation value is in the range of 0.2–10 °C. It has been found that the results obtained are compatible with each other.

3. Results and Discussions

3.1. Drying Characteristics of IMCD

For mathematical modeling of the drying curves, the moisture ratio (MR) and drying rate (DR) of samples during drying are calculated by using Equations (26) and (27), respectively:
M R = M t M e M 0 M e
D R = M t M t + d t d t
where Mt is the moisture content of the sample at a certain time during drying (kg·kg−1), Me is the equilibrium moisture content of samples (kg·kg−1), and M0 is the initial moisture content of samples (kg·kg−1); DR is the drying rate (kg water·kg dry matter−1·min−1), and Mt+dt is the moisture content at t + dt.
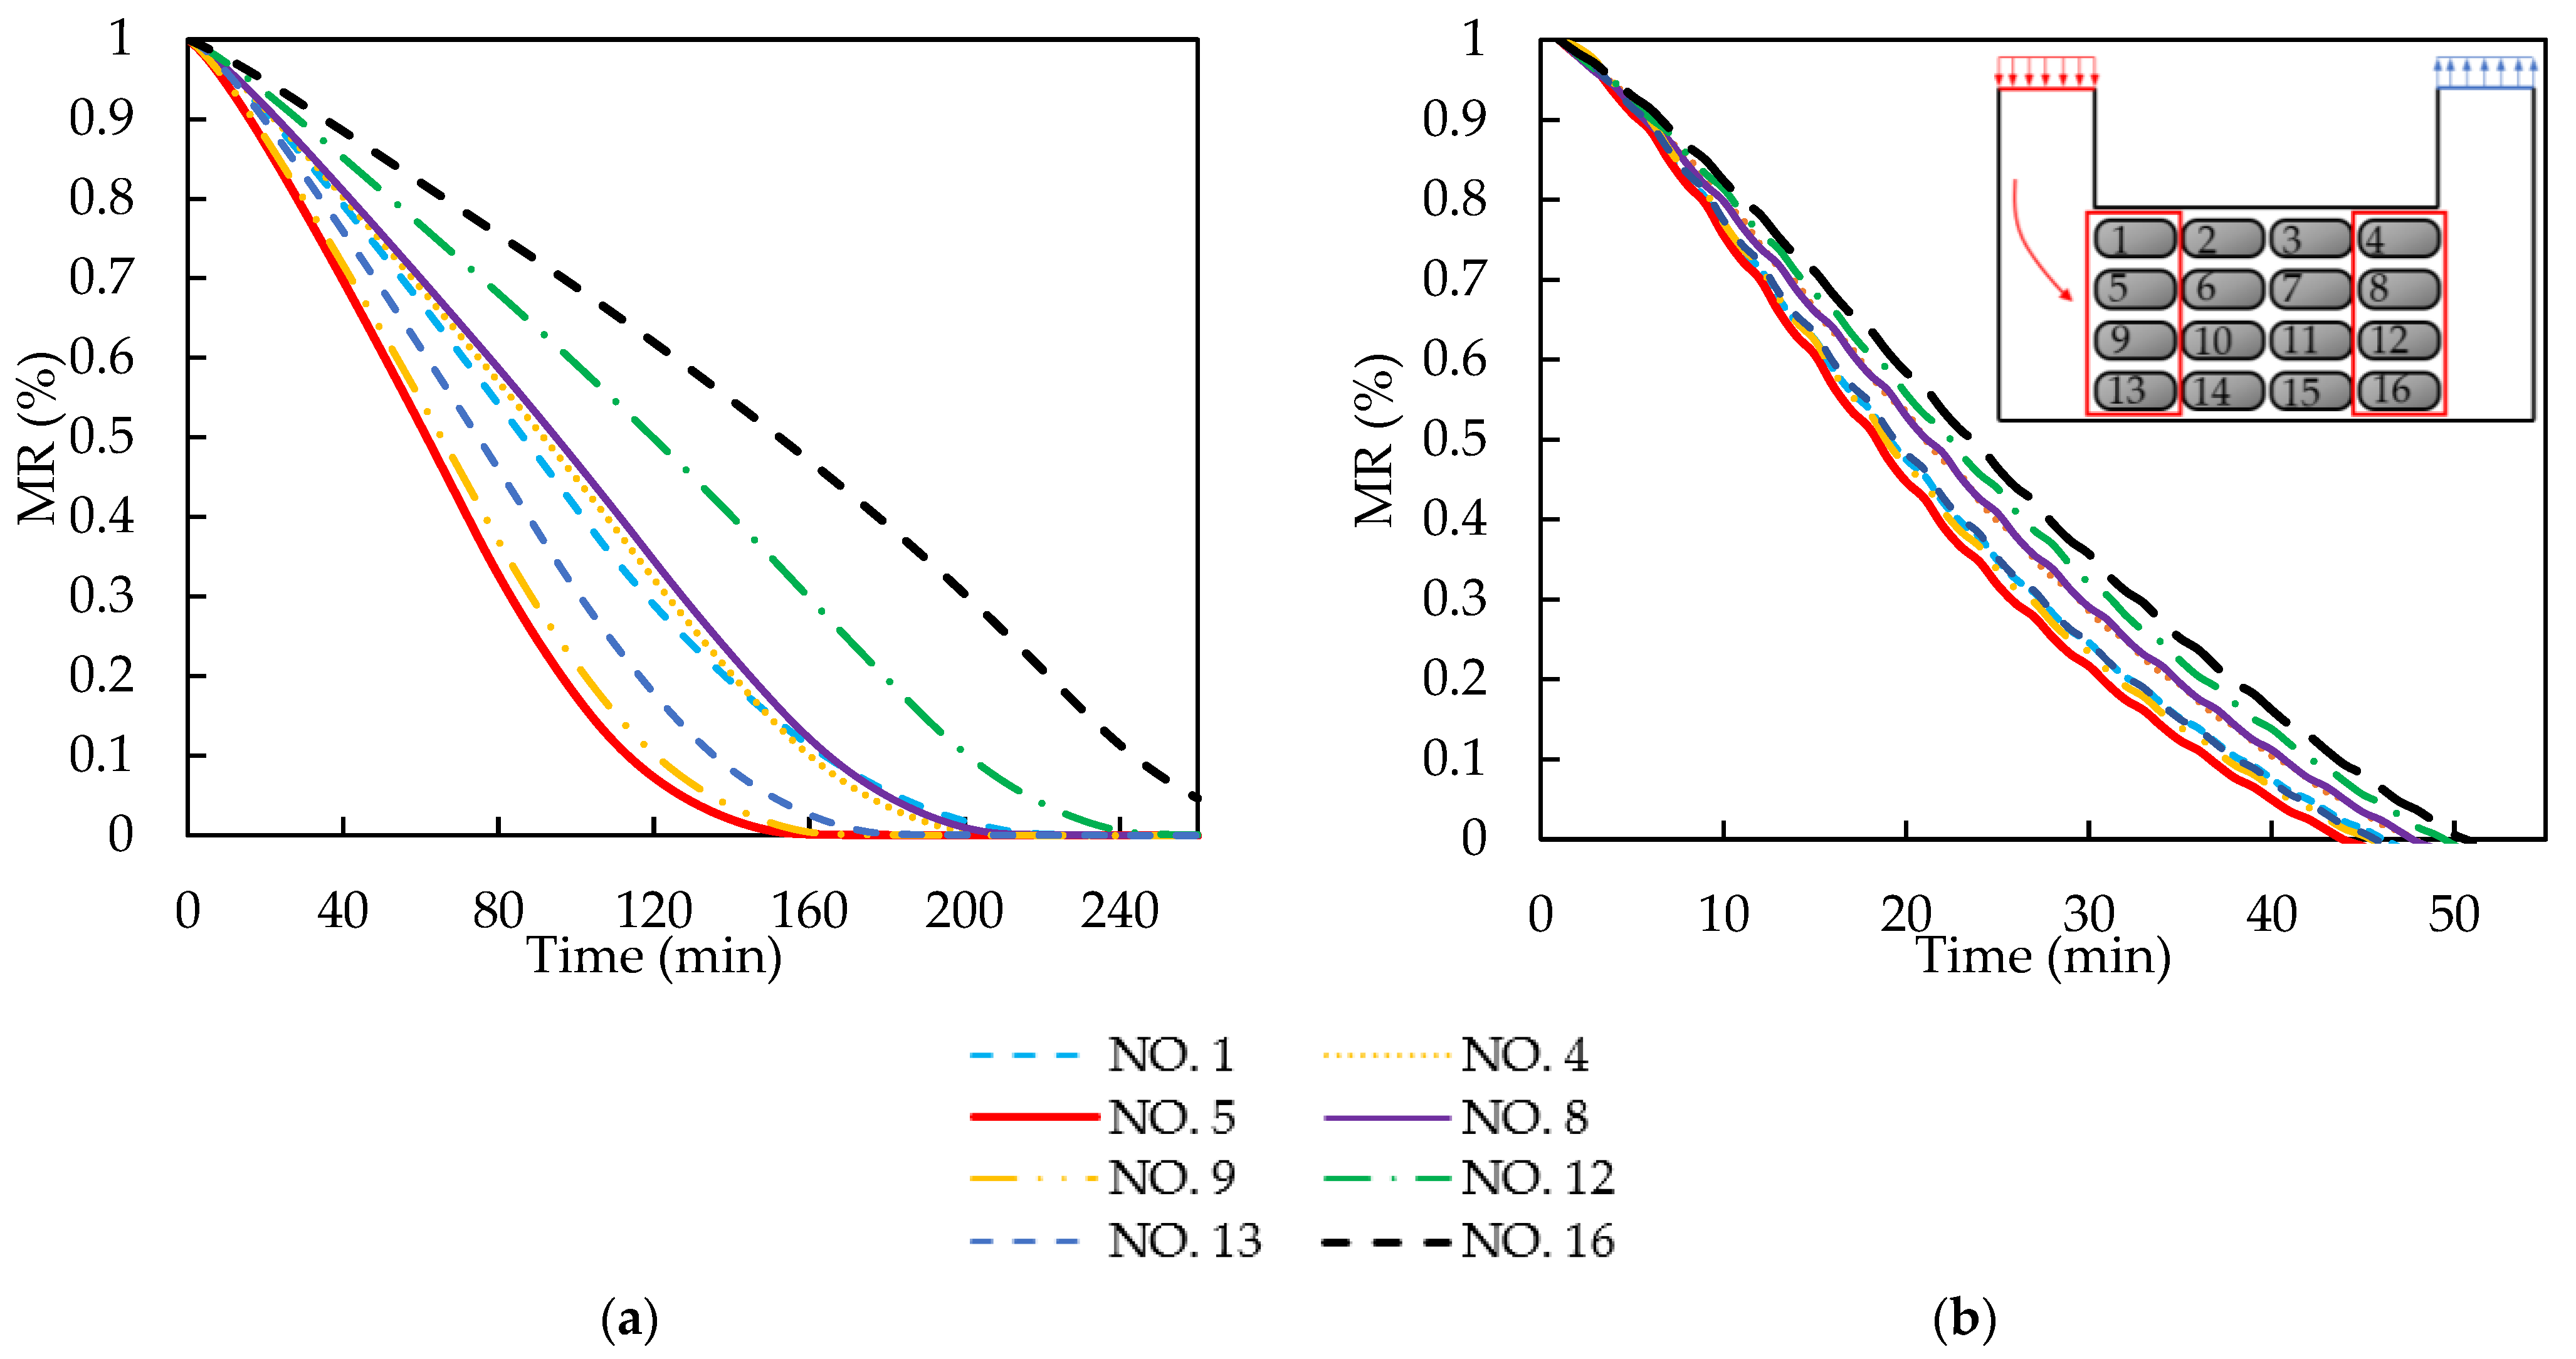
Figure 4 represents the time required for the inlet and outlet slices in the oven to dry to the specified moisture ratio (MR < 0.01) under conditions of CD and IMCD at the same drying air velocity and temperature (u0 = 1 m/s, T0 = 60 °C). It can be seen that the time required for sample 5 is the least under both drying processes, while sample 16 showed the opposite. This is because the airflow sweeps from the front stagnation point of sample 5 to the side wall so as to obtain the maximum convective heat and the maximum drying rate. Sample 16 is affected by the front slice’s wake range, which caused part of the hot air not to be swept across the side wall from the forward stagnation point of the materials, resulting in a decrease in the surface’s velocity. For the internal drying characteristics of apple slices in a multi-materials oven, the following is analyzed by taking samples 5 and 16 as examples.
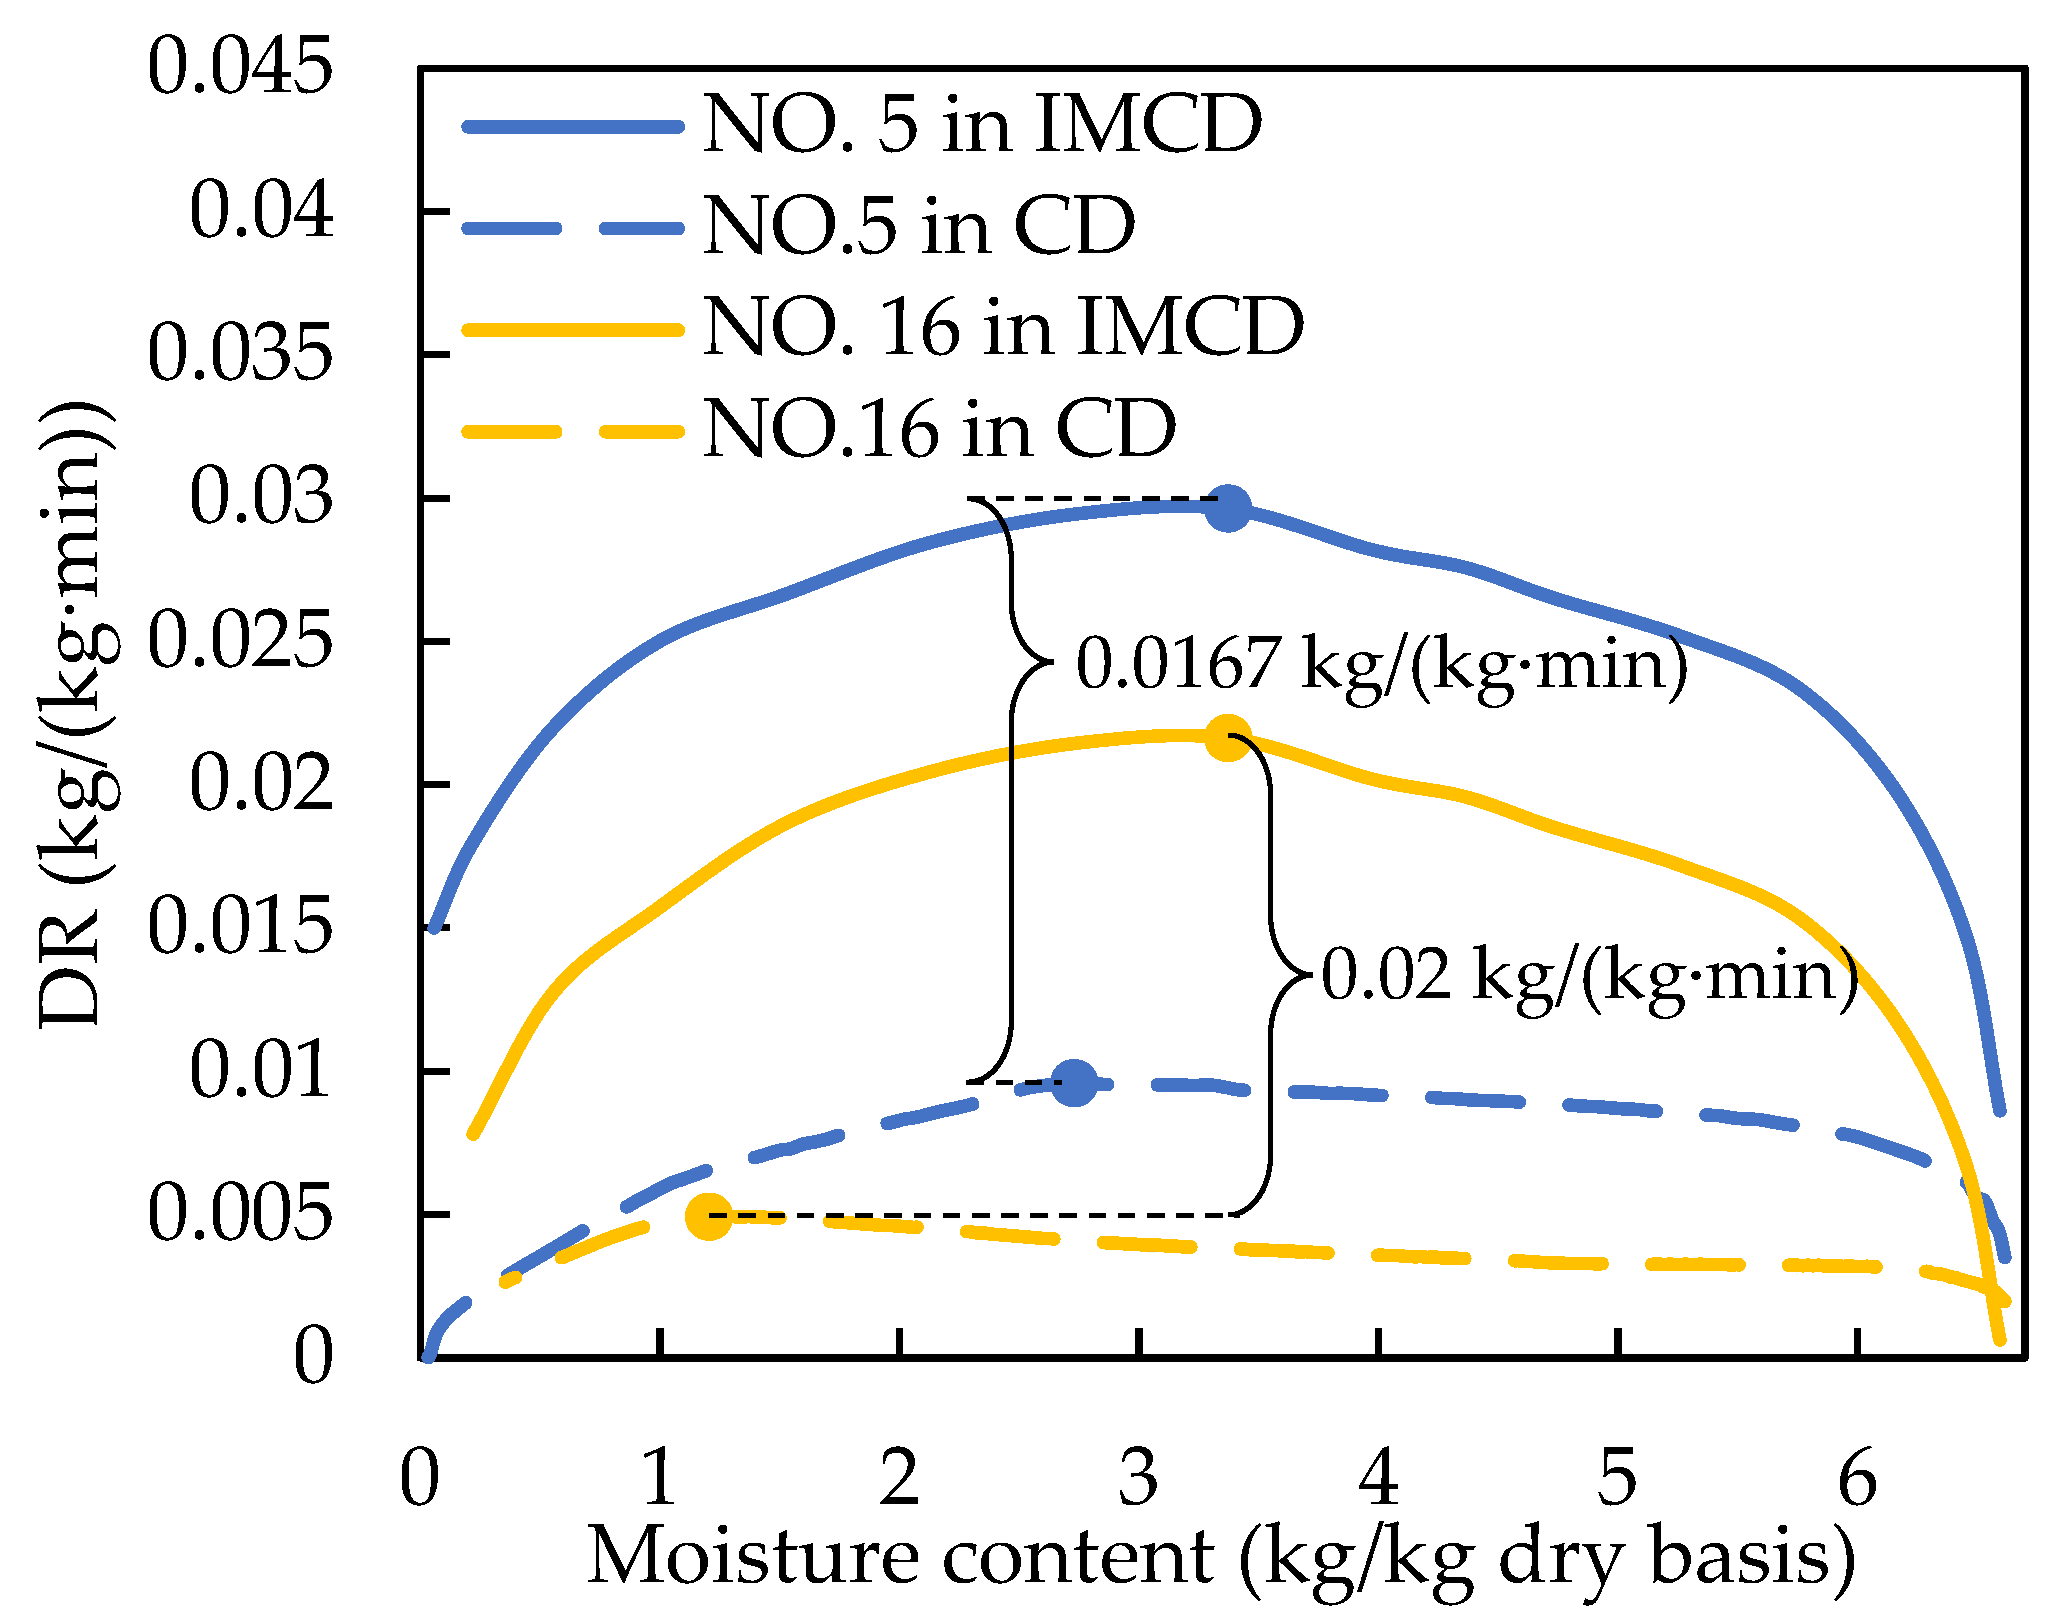
Figure 5 shows the curves of the drying rate of samples 5 and 16 with dry basis moisture content. It can be observed in Figure 5 that the drying rate of apple slices can be divided into a high-speed stage and deceleration stage. The maximum drying rates of samples 5 and 16 in IMCD are 0.0167–0.02 kg/(kg·min) higher than those in CD, respectively. It can be seen from Figure 4 and Figure 5 that the drying process of intermittent microwave convection drying is faster than that of convective drying under the same drying initial conditions (u0 = 1 m/s, T0 = 60 °C). After drying for 51 min, the apple slices’ moisture ratio is reduced to 0.625–0.859 by convection drying, while the apple slices are dehydrated (moisture ratio < 0.038) after using IMCD with PR = 3. The time required to reduce the moisture ratio of the apple slices to 0 in IMCD is much less (51 min) compared to that of the convection drying (260 min), proving that IMCD significantly shortens the drying time. The inside of that slice can be dehydrated by volume heating, as microwaves propagate in space through time-varying electric and magnetic fields. This volumetric heating results in an increase in temperature-dependent parameters (diffusivity, pressure gradient, and flux). In the later drying stages, a drying front is formed on the material surface, and the path of internal moisture migration to the surface for evaporation increases. As the microwave energy penetrates directly into the internal moisture and migrates rapidly, setting an intermittent microwave energy in convection drying can achieve drying optimization.
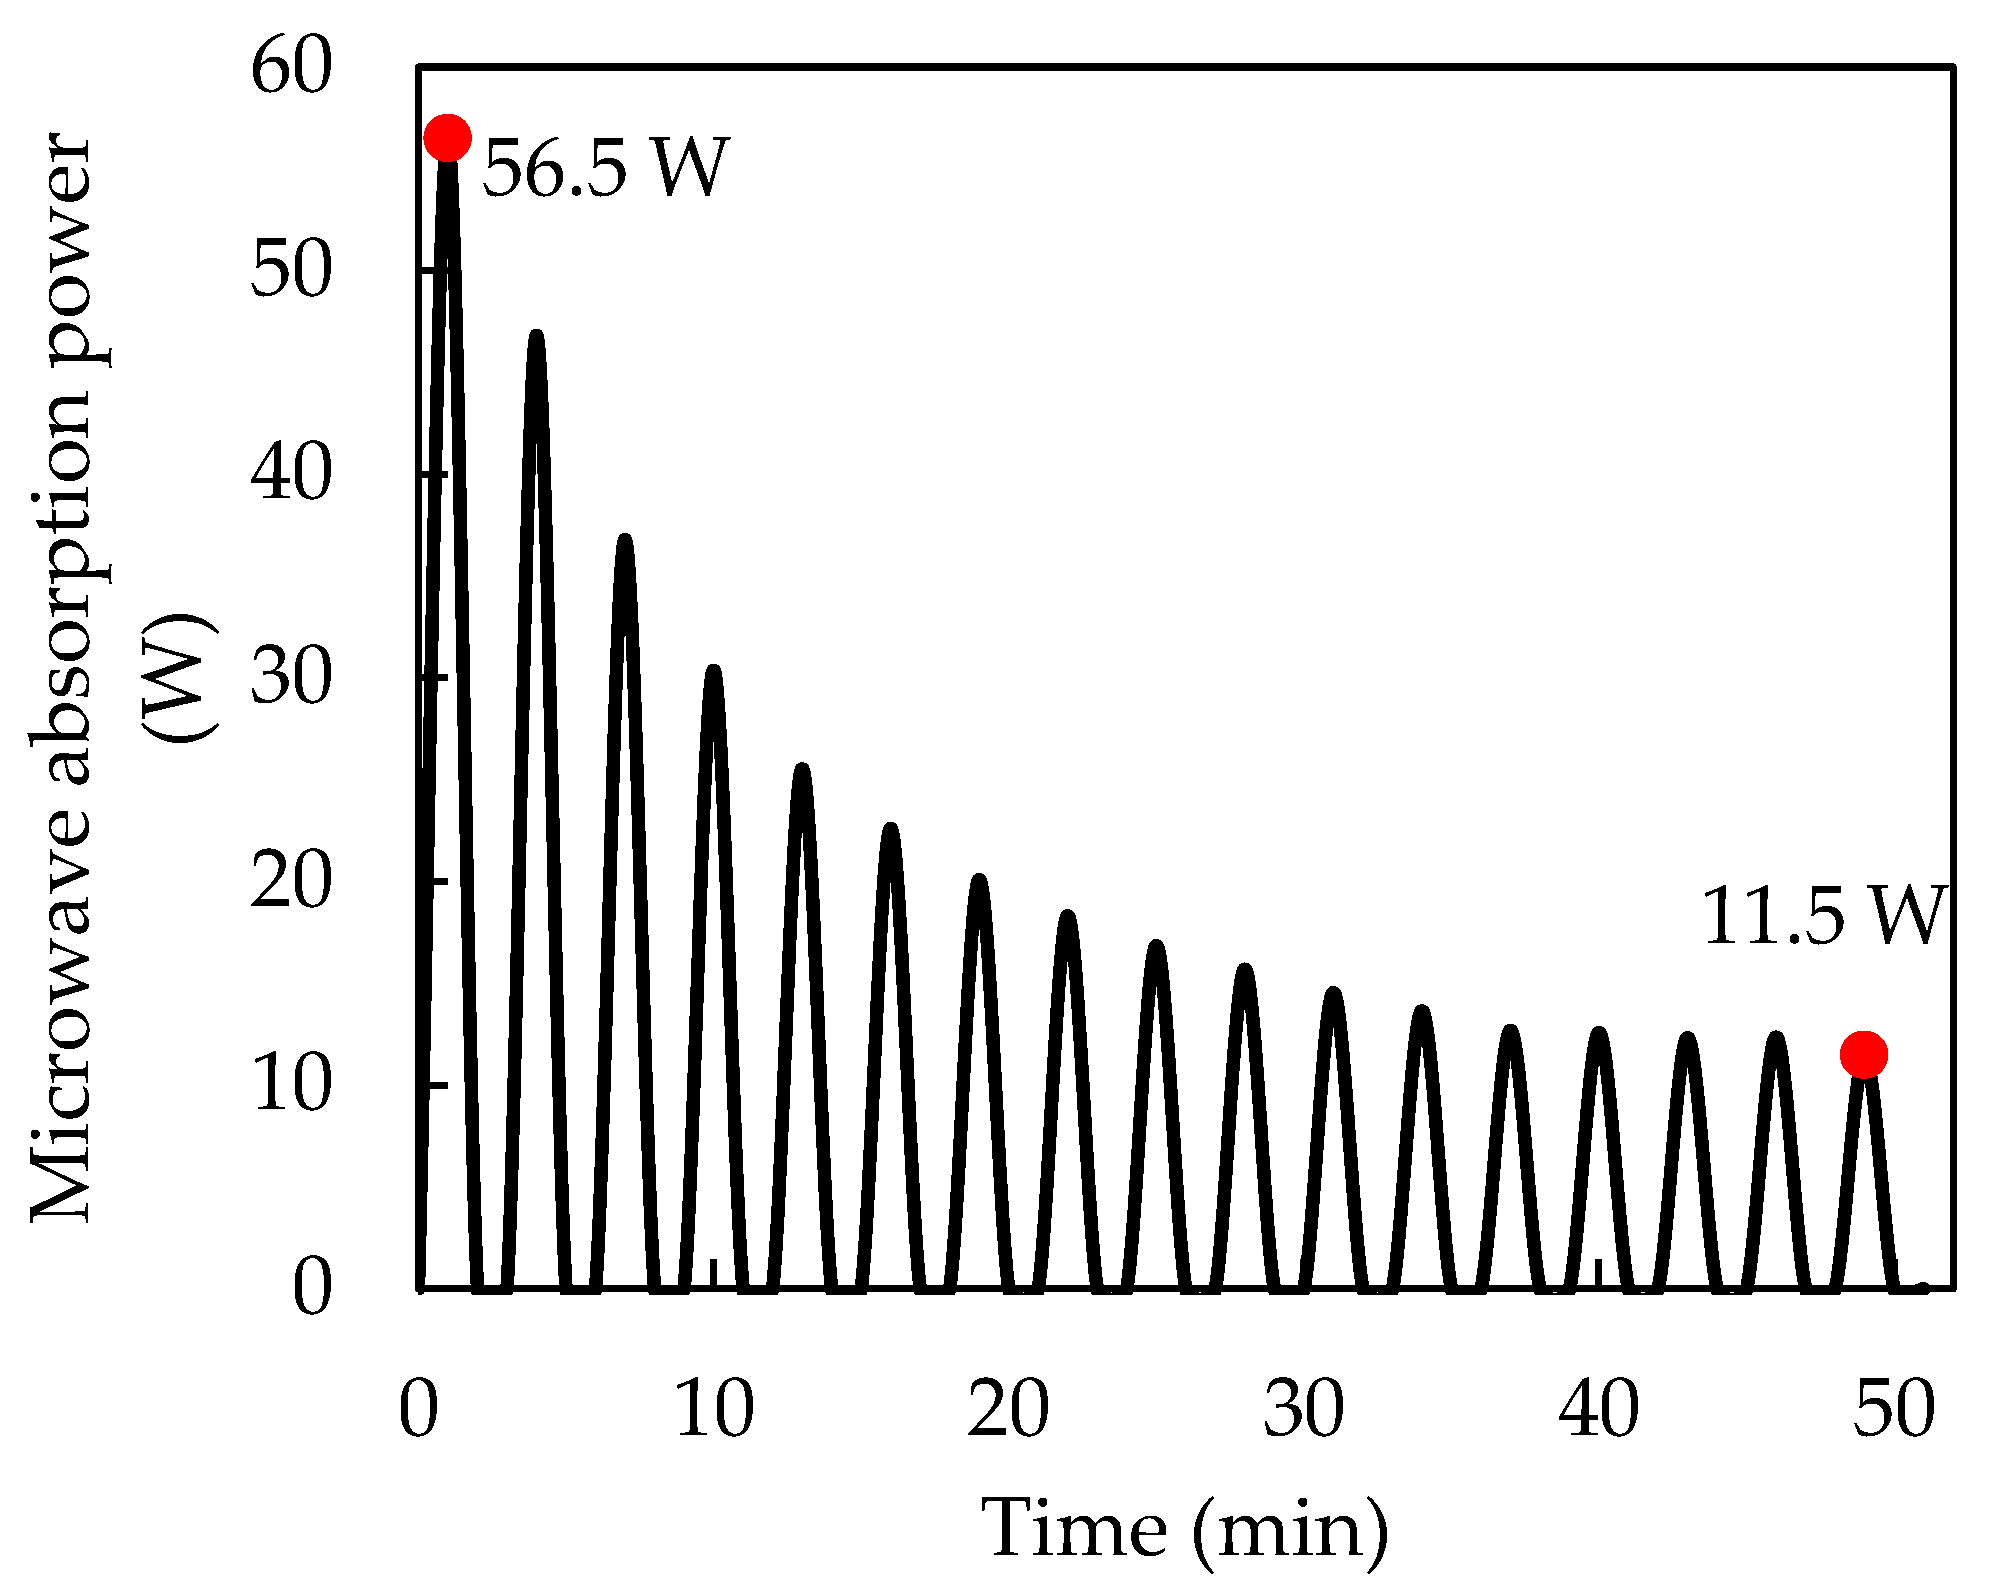
Figure 6 illustrates the change in microwave absorption power over time during the IMCD process. According to Lambert’s law, absorption power is at its maximum at the beginning of drying and decreases exponentially with the decrease of moisture content of the material. Therefore, Figure 6 shows that the absorption power at the start of drying (56.5 W) is higher than that at the end (11.5 W).

3.2. Distribution of Evaporation Interface

In order to obtain the moisture migration trend and distribution within the material during IMCD, dynamic demonstration processes of vapor concentration and liquid water flux along the centerline of sample 16 were plotted, respectively, as shown in Figure 7.
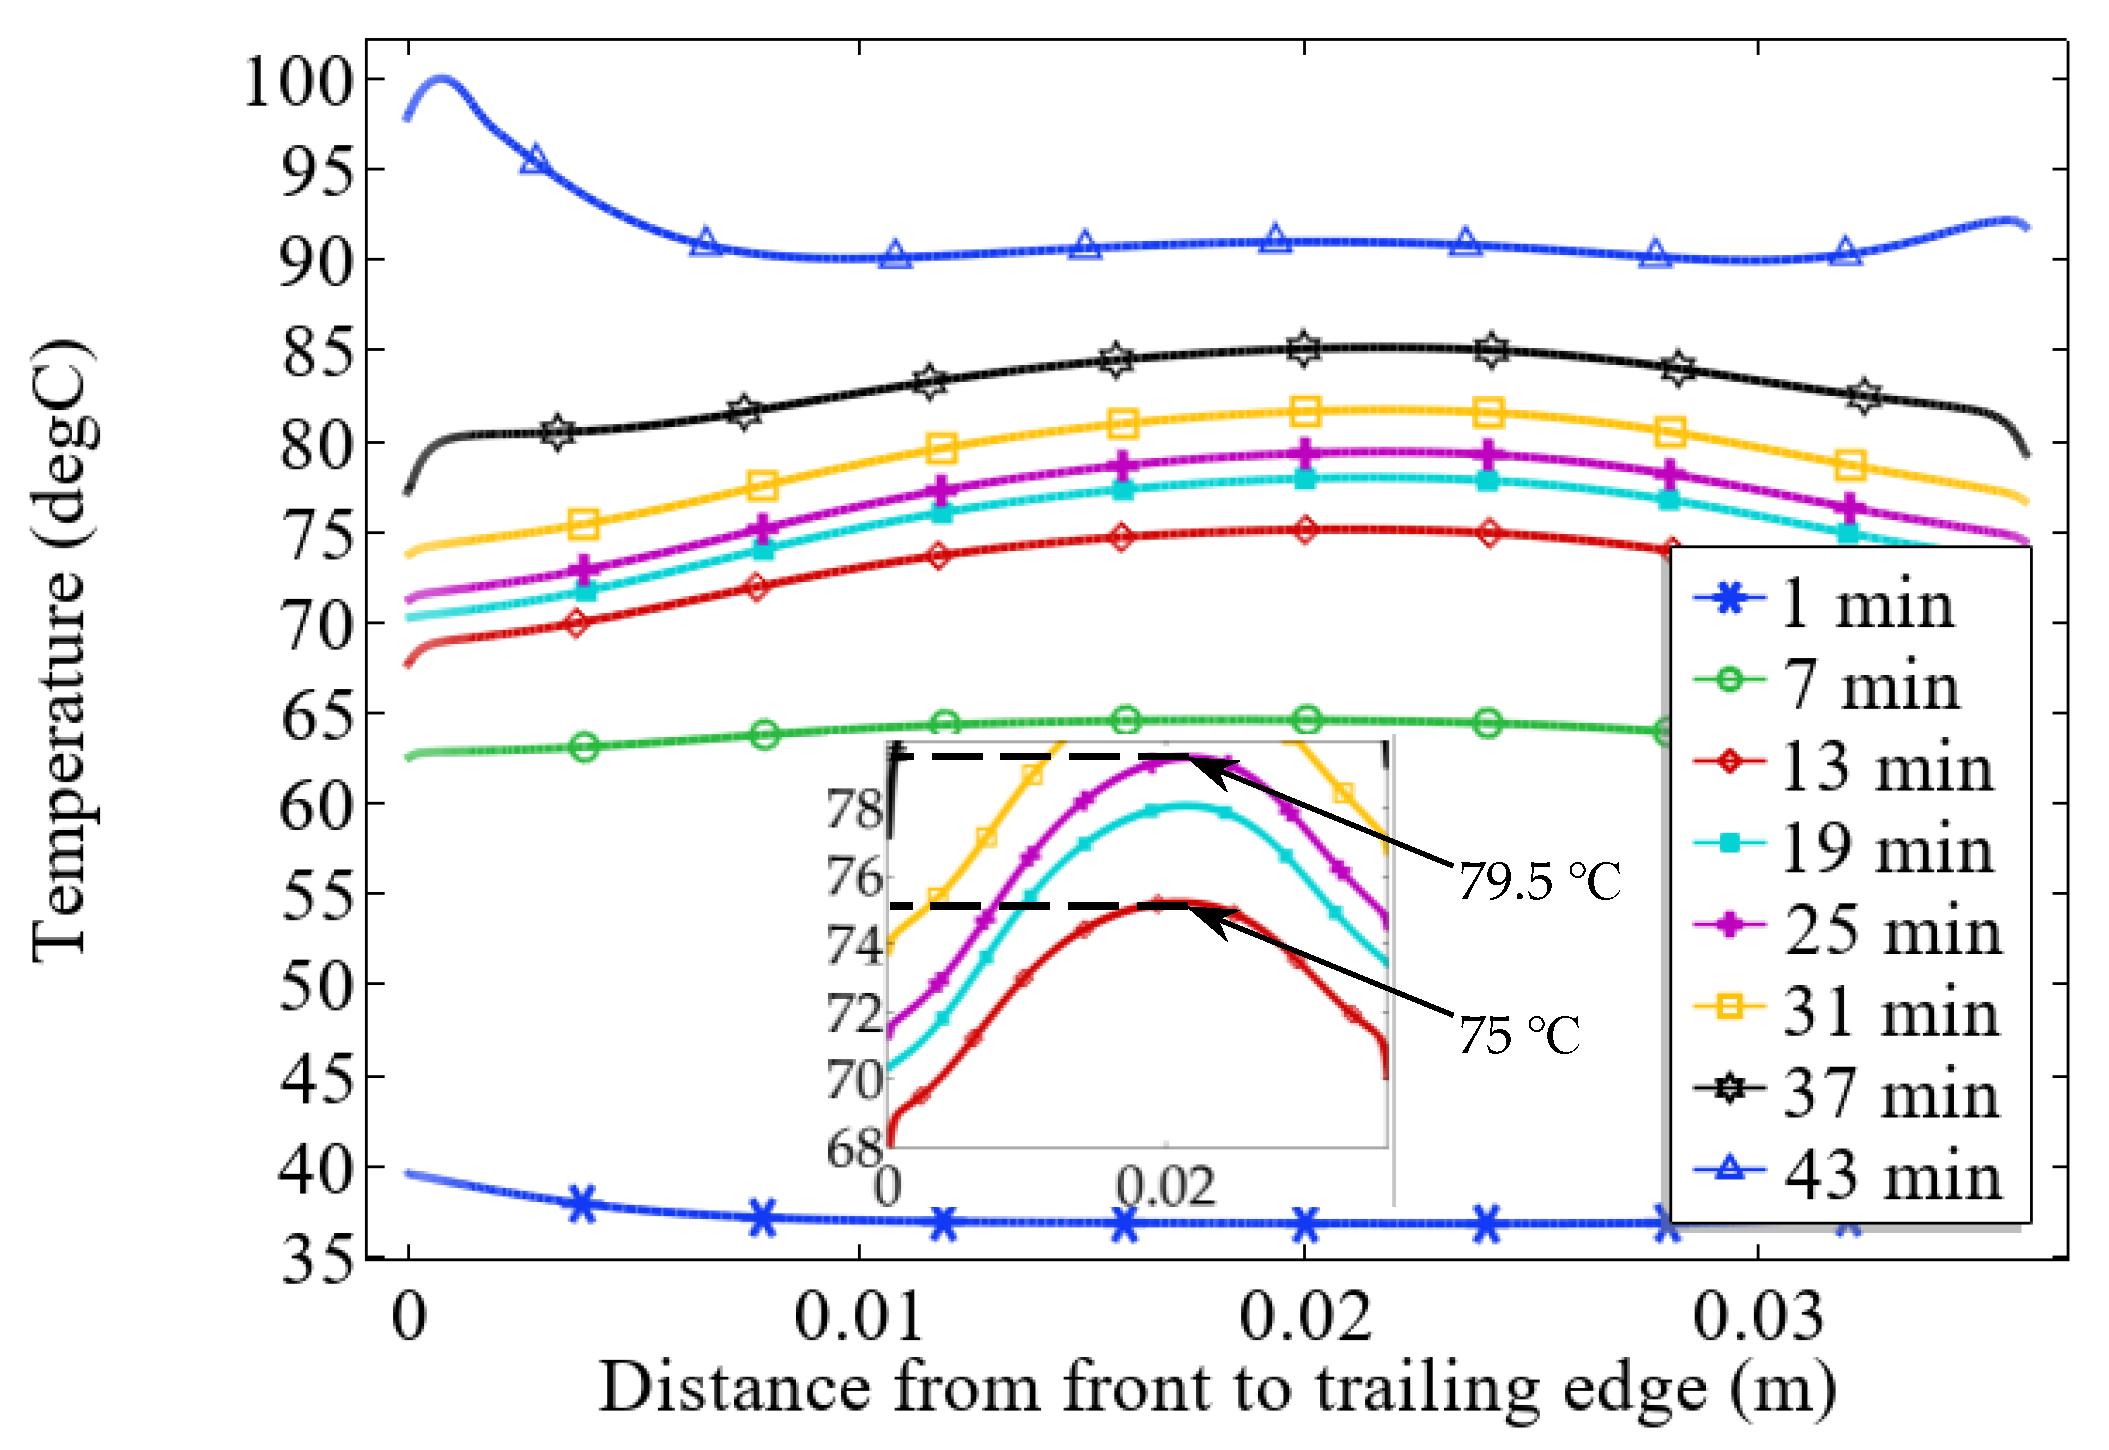
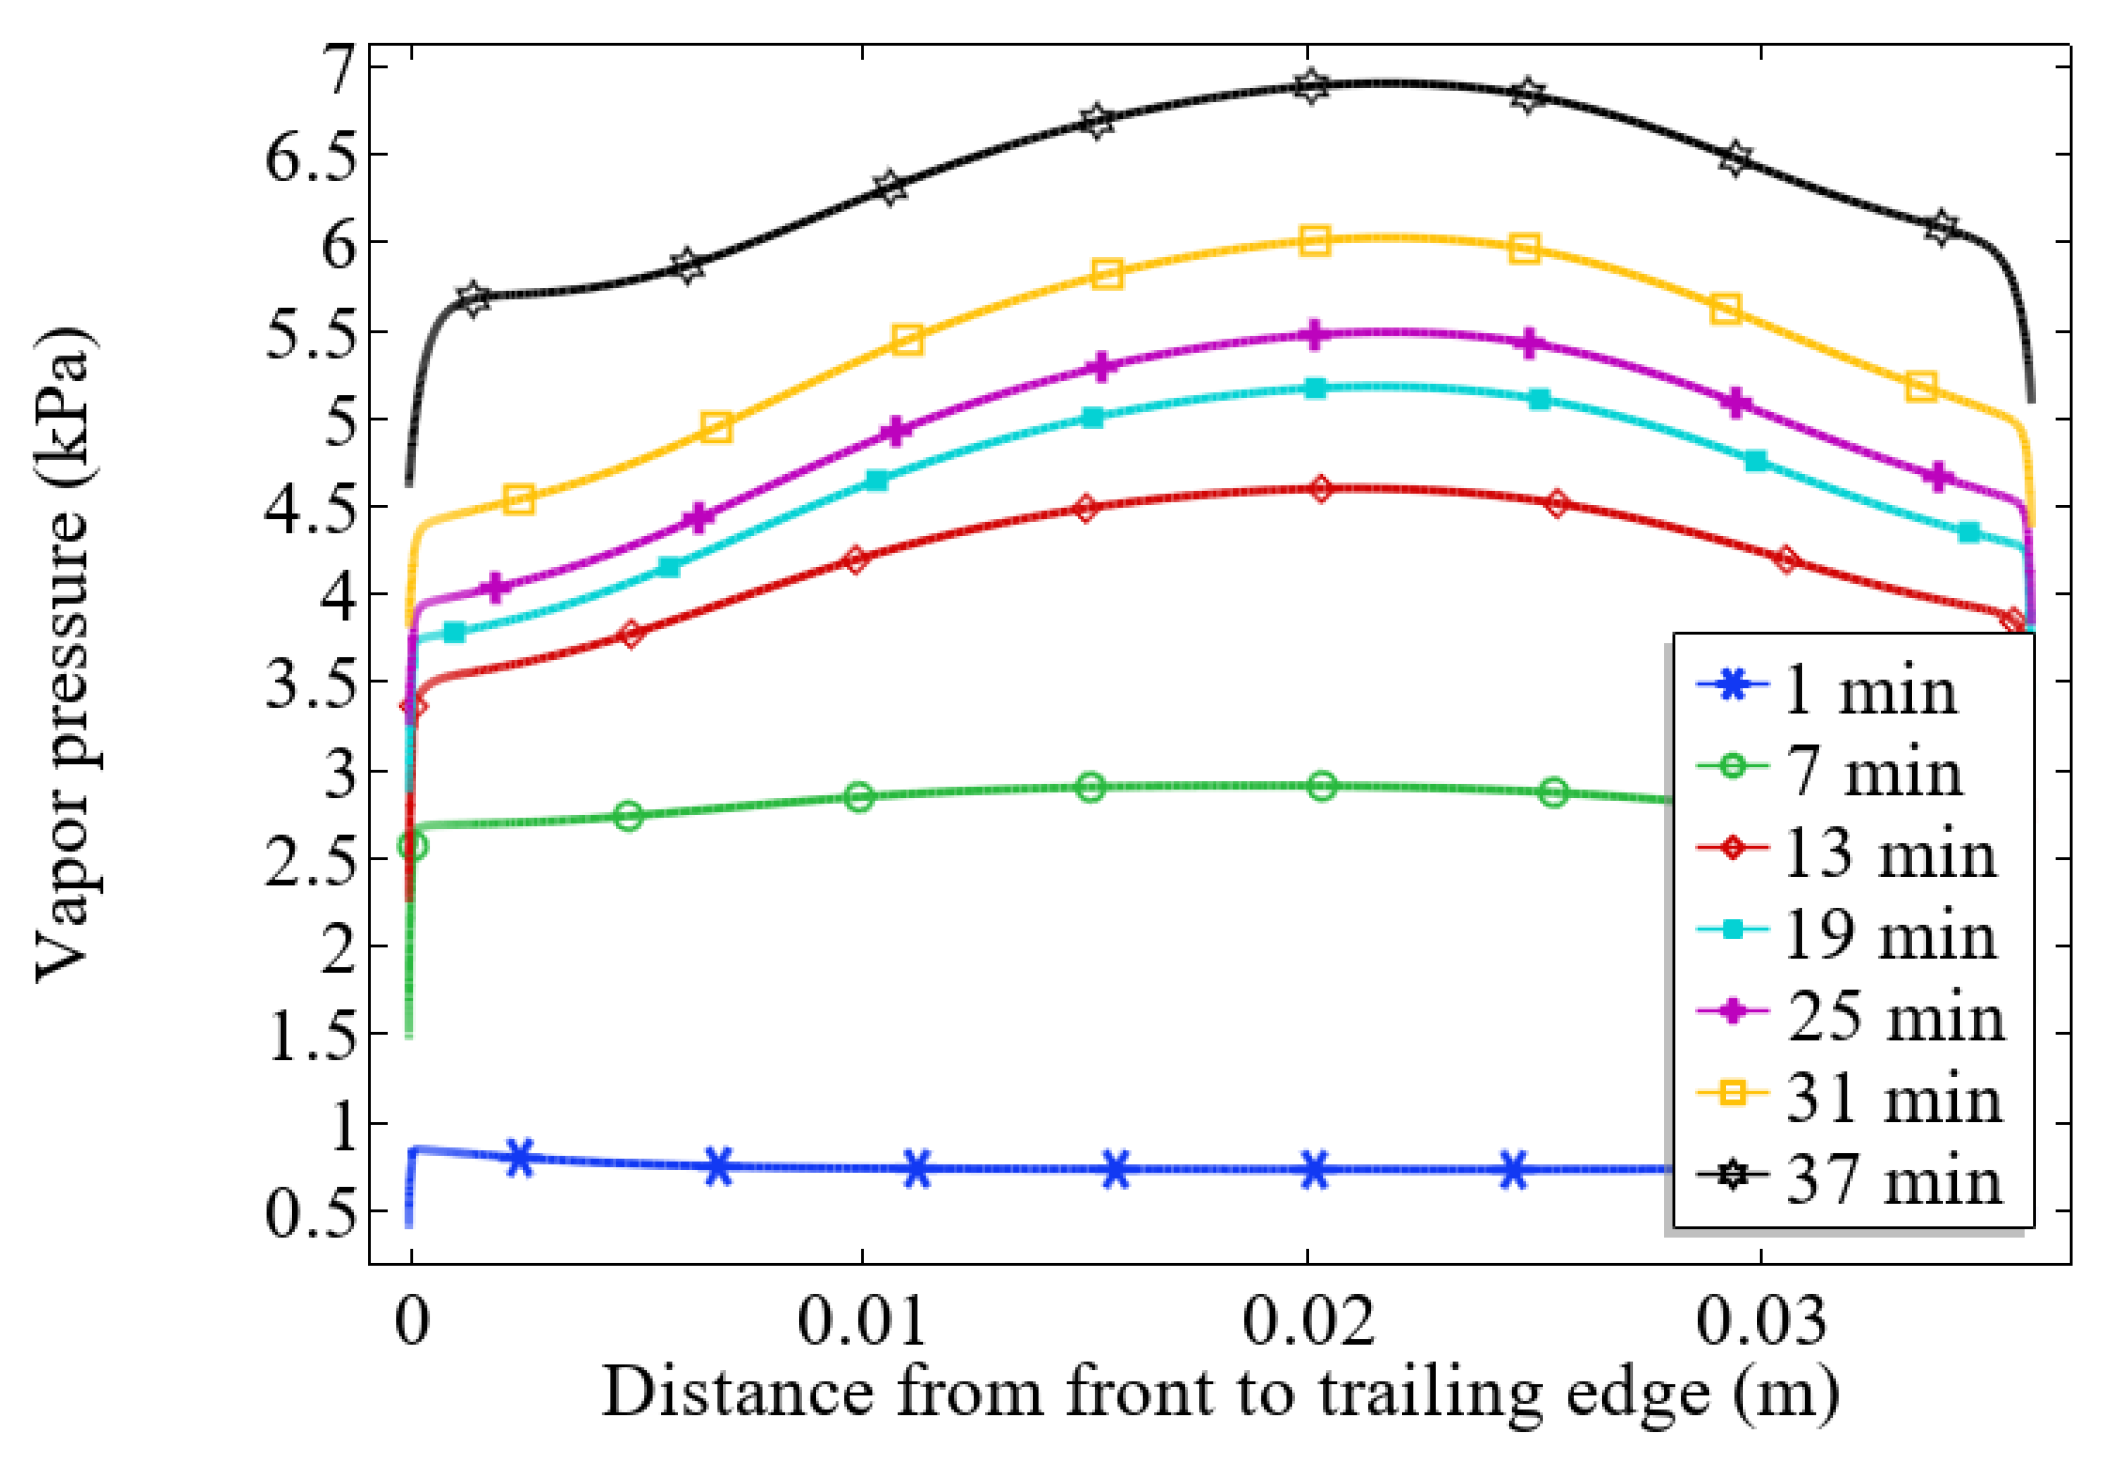
Figure 7a shows vapor concentration and the liquid water flux show a gradient trend of high front and low edge, which is due to hot air forming a convective heat transfer with the surface of the slice in the early stage of IMCD. Figure 8 shows the spatial distribution of the temperature inside the slice, from which it can be seen that the transferred energy first causes moisture on the surface to evaporate. As hot air and intermittent microwaves act on porous media synchronously for 7 min, the vapor concentration of the slice increases from 3.7 mol/m3 to 8.95 mol/m3 (Figure 7a,b). The vapor concentration inside the slice still showed a trend of high front and low edge, and the vapor concentration at the core of the slice is a little higher than the boundary. Figure 9 illustrates the spatial distribution of vapor pressure inside the slice, which shows that the vapor pressure at the core of the sample is higher than that at the periphery (0.005 m from the surface) within 37 min of IMCD process. In combination with Figure 7c–e, Figure 8, and Figure 9, it is indicated that during high-speed stage, due to the intermittent microwave energy, the temperature of the core is higher than the boundary (7–8 °C, as shown in detail in Figure 8) so that a large amount of vapor is evaporated from the core, resulting in an increase in pressure gradient. The surface of the material has a high liquid water concentration due to less evaporation. Liquid water in the boundary region prevents the generated vapor from escaping directly to the external environment, and the pressure gradient provides a driving force that causes the moisture to migrate outward. Therefore, the liquid water flux on the sample surface is large, and the moisture content is rapidly replenished to the surface. The evaporation interface does not migrate inwardly, thus maintaining a high drying rate.
After drying for 31 min, the vapor concentration and liquid water flux of the sample decreased (Figure 7f–h). Low water concentration points began to appear on the surface of porous media and gradually spread to the inside, forming a low-moisture-saturation region. The internal moisture content is reduced so that liquid water cannot diffuse and replenish rapidly to the surface. Corresponding to Figure 7f, the evaporation interface retreats below the surface by reestablishing the balance between capillary pressure and the moisture flux caused by evaporation, and the drying rate begins to decrease. In the later stage of convection drying, in order to further dehydrate, moisture must be transferred from the inside of the material to the surface through diffusion. Since the concentrations of both liquid water and vapor are light in the low-moisture-saturation region, this region is a major obstacle to the transfer of hot air inside and the diffuse vapor outside. During IMCD, the moisture from the product is localized, and the material is heated volumetrically due to the microwave. Even if a low-moisture-concentration region occurs, the microwave can directly penetrate into the internal moisture and promote rapid migration, so the IMCD performs better in the later drying stage. Particularly, in multi-materials arrangement ovens, the materials in the back row are affected by the wake range in the front row, causing part of the hot air not to sweep across the side wall from the forward stagnation point of the materials. Materials in the back row have varying degrees of surfaces convective velocity reduction, leading to a drying time gap between the materials and the overall drying uniformity being low (Section 3.3). The increase of intermittent microwave energy improves the heat energy of the back-row materials and realizes the optimization of the oven.

3.3. Flow-Field Distribution and Its Effect on Drying Kinetics

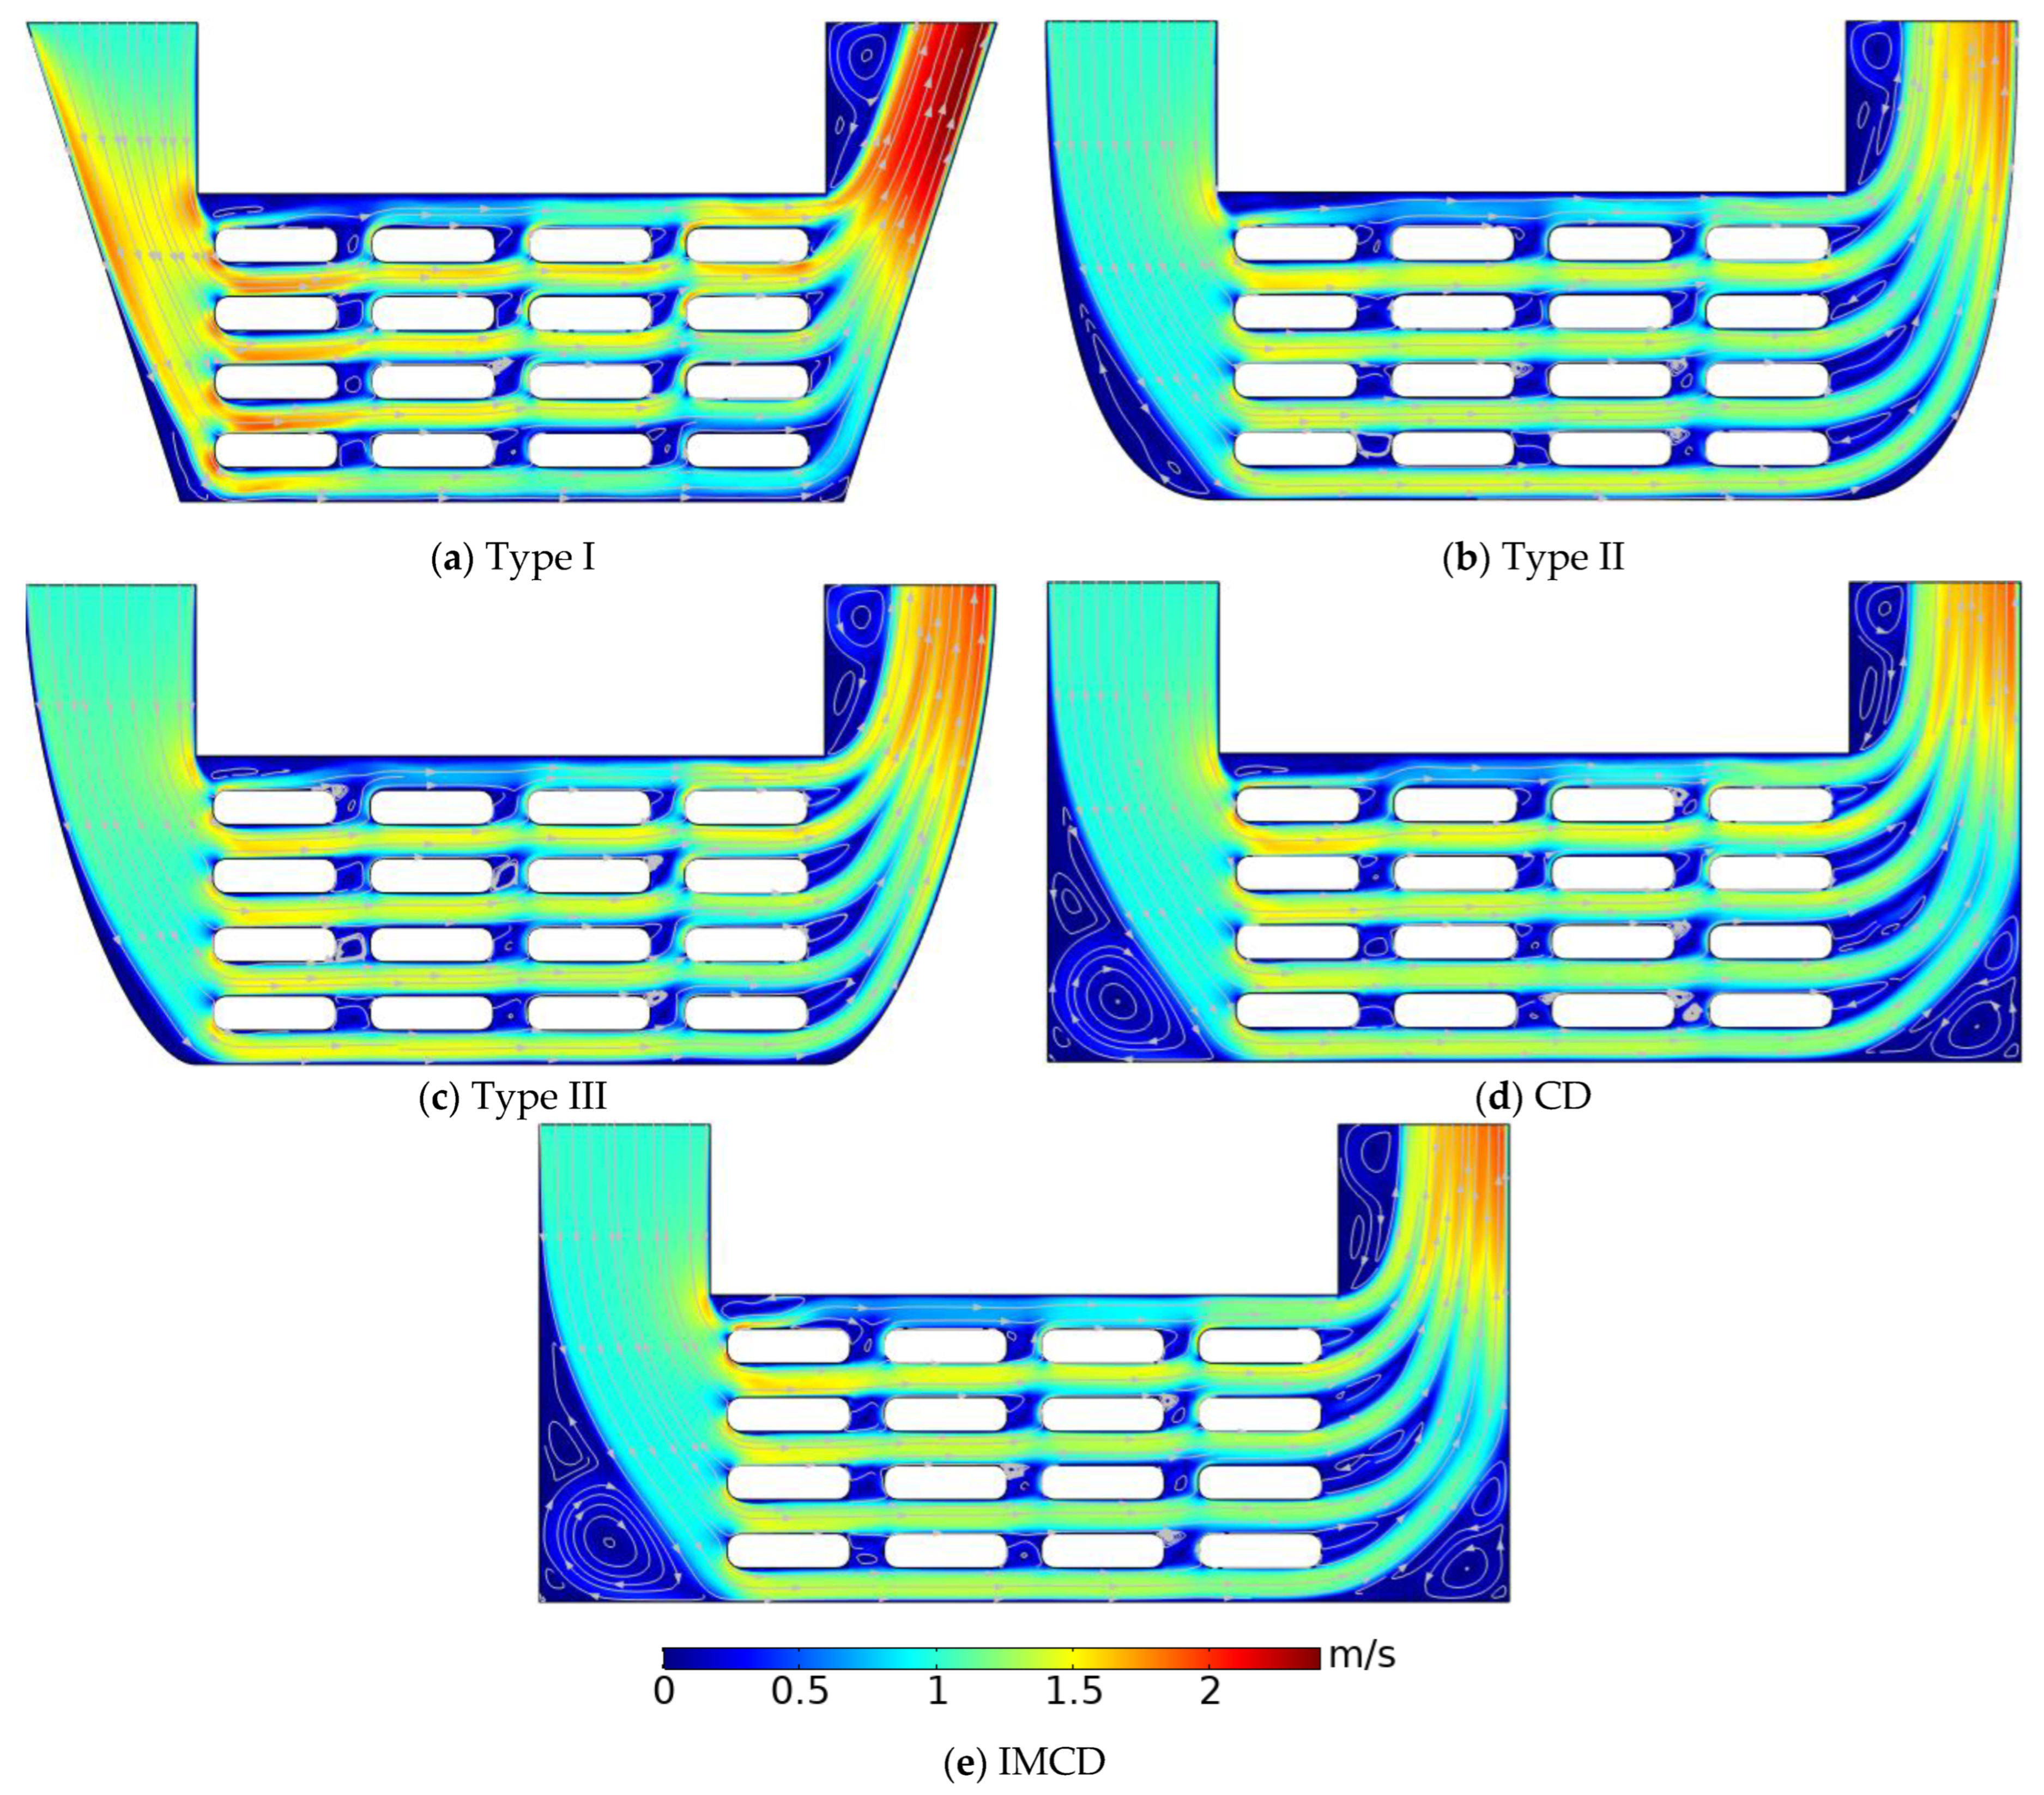
The effect of IMCD flow-field distribution on apple slices was investigated in this section. Under the condition of pulse ratio PR = 3, three models with increasing curvature of inlet and outlet walls were established and solved and compared with the CD model and IMCD model without changing the flow field. The structure and velocity-field distribution of the type I, type II, and type III drying oven are shown in Figure 10. The drying uniformity K of the apple slices is calculated by Equation (28):
K = ( ( M ¯ Δ M ) / M ¯ ) × 100 %
where M ¯ is the average moisture content of each material in the oven. Δ M is the standard deviation of moisture content of each material in the oven (reflecting the discrete degree of each data). The K value is close to 100%, indicating that the drying is more uniform. Through numerical analysis, the drying uniformity, temperature difference, humidity difference, and velocity difference at the end of drying under different airflow distribution and drying processes are shown in Table 3. The greater the temperature difference, the better the heat-transfer effect between the airflows and the apple slices [35]. The humidity difference corresponds to the moisture discharged from the oven. The more significant the humidity difference, the greater the moisture-removal performance. The higher velocity difference between the inlet and outlet of the oven, the greater the energy consumption needed for the fan to maintain the required hot air circulation volume.
It can be seen from Table 3 that compared with CD, the intermittent microwave power improved the overall drying uniformity from 40.06% to 68.16%, and the temperature difference between inlet and outlet increased by 4.69 °C. The heat-transfer effect between the airflow inside oven and the apple slices is optimized, and the moisture-removal performance in the oven is improved by using the intermittent microwave energy. From Figure 10d,e, it can be seen that different degrees of vortexes are formed in the region below the inlet and outlet, respectively. The vortexes in this region caused uneven distribution of airflow, resulting in convection air energy loss and uneven heat distribution inside the oven. In order to overcome the negative influence of the vortex in the dead zone, type I, type II, and type III drying chambers are introduced. The inlet and outlet walls of type I are oblique straight lines, and the curvature is 0. Table 3 and Figure 10a–c illustrate that the vortex volume below the inlet and outlet of type I, type II, and type III is reduced. Among them, the dead zone of type I contained the smallest vortex, and the velocity difference is the largest. Type I, type II, and type III drying ovens achieved performance optimization compared with the IMCD oven without changing. The drying uniformity K value of type III is the highest, reaching 89.28%, and the drying uniformity value of type II is the lowest. Figure 10a–c show that there are still vortexes in the material placement region of the type I, II, and III drying ovens. Among them, the vortex amount of type III is the highest in the region, which led to the increase of the airflow-winding time between the slices and the increase of the convective drying times, thereby improving the convection heat transfer and drying uniformity. The difference of enhanced convection heat transfer between type I and type III is small (0.12 °C). Furthermore, the velocity difference of type I is larger, and the energy consumption is higher than that of other types. Combined with its moisture-removal performance, type III is better. Therefore, the optimization effect of type III drying oven is the best. It can be concluded that changing the inlet and outlet walls to form a reasonable flow-field distribution can improve the porous media drying dynamics, but the degree of improvement is limited.

4. Conclusions

In this research, the multiphase porous media model was established to study the effect of intermittent microwave energy on the drying characteristics of 36 mm × 10 mm apple slices compared with the convection drying. The results showed the following:
  • Compared with convection drying, intermittent microwave convection drying can shorten the drying time by 81.35% and enhance the drying uniformity by 28.1%, thus realizing drying optimization;
  • In the later stage of drying, most of the moisture needs to migrate outside the material for evaporation. Because intermittent microwave energy directly penetrates into water and promotes its rapid migration, IMCD performs better in the later stage of drying. In particular, application of intermittency microwaves provides additional drying energy to the back-row samples, and the optimization effect is more pronounced in a multi-materials oven;
  • Through comprehensive analysis of the drying uniformity, heat transfer, and energy consumption of the ovens with different inlet and outlet wall curvatures, it is concluded that the drying uniformity is significantly improved by reducing the vortex below the inlet and outlet. Type III provides the greatest improvement in IMCD uniformity and drying performance.

Author Contributions

Conceptualization, Y.M.; methodology, Y.M.; validation, Y.M.; investigation, Y.M.; resources, Y.M. and J.T.; data curation, Y.M.; writing—original draft preparation, Y.M.; writing—review and editing, Y.M., J.T., T.W., S.W. and H.X.; visualization, Y.M.; supervision, J.T., T.W., S.W. and H.X.; project administration, J.T., T.W. and H.X.; funding acquisition, J.T., T.W. and H.X. All authors have read and agreed to the published version of the manuscript.

Funding

This research was funded by Research Ability Improvement Project of Key Construction Subjects in Guangdong Province (grant number 2021ZDJS061), Young Talent Research Project of Guangzhou Education Bureau College Research Project (grant number 202234600), Young Talent Research Project of Guangzhou Education Bureau College Research Project (grant number J20210208), Discipline Construction Project of Guangzhou Jiaotong University (grant number K52022007).

Data Availability Statement

Not applicable.

Conflicts of Interest

The authors declare no conflict of interest.

References

  1. Zhang, D.; Jia, B.; Liu, F.; Yuan, S. Study on optimization of hot air drying temperature for apple slices. J. Shandong Jianzhu Univ. 2021, 36, 67–74. [Google Scholar]
  2. Kahveci, K. Modeling and Numerical Simulation of Simultaneous Heat and Mass Transfer during Convective Drying of Porous Materials. Text. Res. J. 2016, 87, 617–630. [Google Scholar] [CrossRef]
  3. Tepe, T.K.; Begüm, T. The comparison of drying and rehydration characteristics of intermittent-microwave and hot-air dried-apple slices. Heat Mass Transf. 2020, 56, 3047–3057. [Google Scholar] [CrossRef]
  4. Shokri, N.; Or, D. What determines drying rates at the onset of diffusion controlled stage-2 evaporation from porous media? Water Resour. Res. 2011, 47, W09513. [Google Scholar] [CrossRef]
  5. Kumar, C.; Karim, M.A.; Joardder, M.U.H. Intermittent drying of food products: A critical review. J. Food Eng. 2014, 121, 48–57. [Google Scholar] [CrossRef] [Green Version]
  6. Kumar, C.; Joardder, M.U.H.; Farrell, T.W.; Karim, M.A. Multiphase porous media model for intermittent microwave convective drying (IMCD) of food. Int. J. Therm. Sci. 2016, 104, 304–314. [Google Scholar] [CrossRef]
  7. Omolola, A.O.; Jideani, A.; Kapila, P.F. Modeling microwave drying kinetics and moisture diffusivity of Mabonde banana variety. Int. J. Agric. Biol. Eng. 2014, 7, 107–113. [Google Scholar]
  8. Wang, Z.; Sun, J.; Chen, F.; Liao, X.; Hu, X. Mathematical modelling on thin layer microwave drying of apple pomace with and without hot air pre-drying. J. Food Eng. 2007, 80, 536–544. [Google Scholar] [CrossRef]
  9. Wang, Q.; Li, S.; Han, X.; Ni, Y.; Zhao, D.; Hao, J. Quality evaluation and drying kinetics of shitake mushrooms dried by hot air, infrared and intermittent microwave–assisted drying methods. Lwt Food Sci. Technol. 2019, 107, 236–242. [Google Scholar] [CrossRef]
  10. Kumar, C.; Joardder, M.U.H.; Farrell, T.W.; Millar, G.J.; Karim, M.A. Mathematical model for intermittent microwave convective drying of food materials. Dry. Technol. 2016, 34, 962–973. [Google Scholar] [CrossRef] [Green Version]
  11. Szadzińska, J.; Kowalski, S.J.; Stasiak, M. Microwave and ultrasound enhancement of convective drying of strawberries: Experimental and modeling efficiency. Int. J. Heat Mass Transf. 2016, 103, 1065–1074. [Google Scholar] [CrossRef]
  12. Chen, J.; Pitchai, K.; Birla, S.; Negahban, M.; Jones, D.; Subbiah, J. Heat and mass transport during microwave heating of mashed potato in domestic ovendmodel development, validation, and sensitivity analysis. J. Food Sci. 2014, 79, E1991–E2004. [Google Scholar] [CrossRef] [PubMed]
  13. Jumah, R.; Mujumdar, A.S. Modeling intermittent drying using an adaptive neuro-fuzzy inference system. Dry. Technol. 2005, 23, 1075–1092. [Google Scholar] [CrossRef]
  14. Arballo, J.R.; Campañone, L.A.; Mascheroni, R.H. Modeling of Microwave Drying of Fruits. Part II: Effect of Osmotic Pretreatment on the Microwave Dehydration Process. Dry. Technol. 2012, 30, 404–415. [Google Scholar] [CrossRef]
  15. Gulati, T.; Zhu, H.; Datta, A.K.; Huang, K. Microwave drying of spheres: Coupled electromagnetics-multiphase transport modeling with experimentation. Part II: Model validation and simulation results. Food Bioprod. Process. 2015, 96, 326–337. [Google Scholar] [CrossRef]
  16. Kumar, C.; Joardder, M.U.H.; Farrell, T.W.; Karim, M.A. Investigation of intermittent microwave convective drying (IMCD) of food materials by a coupled 3D electromagnetics and multiphase model. Dry. Technol. 2018, 36, 736–750. [Google Scholar] [CrossRef]
  17. Zhang, Z.; Qin, W.; Shi, B.; Gao, J.; Zhang, S. Modelling of intermittent microwave convective drying: Parameter sensitivity. Open Phys. 2017, 15, 405–419. [Google Scholar] [CrossRef]
  18. Defraeye, T.; Radu, A. Insights in convective drying of fruit by coupled modeling of fruit drying, deformation, quality evolution and convective exchange with the airflow. Appl. Therm. Eng. 2018, 129, 1026–1038. [Google Scholar] [CrossRef]
  19. Khan, M.I.H.; Welsh, Z.; Gu, Y.; Karim, M.A.; Bhandari, B. Modelling of simultaneous heat and mass transfer considering the spatial distribution of air velocity during intermittent microwave convective drying. Int. J. Heat Mass Transf. 2020, 153, 119668. [Google Scholar] [CrossRef]
  20. Zhao, J.; Fu, Z.; Jia, X.; Cai, Y. Modeling conventional drying of wood: Inclusion of a moving evaporation interface. Dry. Technol. 2016, 34, 530–538. [Google Scholar] [CrossRef]
  21. Chen, A.; Achkar, G.E.L.; Liu, B.; Bennacer, R. Experimental study on moisture kinetics and microstructure evolution in apples during high power microwave drying process. J. Food Eng. 2021, 292, 110362. [Google Scholar] [CrossRef]
  22. Purlis, E. Modelling convective drying of foods: A multiphase porous media model considering heat of sorption. J. Food Eng. 2019, 263, 132–146. [Google Scholar] [CrossRef]
  23. Whitaker, S. Simultaneous heat, mass, and momentum transfer in porous media: A theory of drying. In Advances in Heat Transfer; Elsevier: Amsterdam, The Netherlands, 1977; Volume 13, pp. 119–203. [Google Scholar]
  24. Hu, Z.; Yang, M.; Yang, Z.; Yang, L. Hot air drying model based on multi-physical field coupling and its verification. J. Southwest Univ. Nat. Sci. Ed. 2020, 42, 118–128. [Google Scholar]
  25. Gulati, T.; Datta, A.K. Enabling computer-aided food process engineering: Property estimation equations for transport phenomena-based models. J. Food Eng. 2013, 116, 483–504. [Google Scholar] [CrossRef]
  26. Halder, A.; Dhall, A.; Datta, A.K. Modeling Transport in Porous Media with Phase Change: Applications to Food Processing. J. Heat Transf. 2011, 133, 031010. [Google Scholar] [CrossRef]
  27. Hemis, M.; Choudhary, R.; Watson, D.G. A coupled mathematical model for simultaneous microwave and convective drying of wheat seeds. Biosyst. Eng. 2012, 112, 202–209. [Google Scholar] [CrossRef] [Green Version]
  28. Martín-Esparza, M.; Martínez-Navarrete, N.; Chiralt, A.; Fito, P. Dielectric behavior of apple (var. Granny Smith) at different moisture contents. J. Food Eng. 2006, 77, 51–56. [Google Scholar] [CrossRef]
  29. Datta, A.K. Porous media approaches to studying simultaneous heat and mass transfer in food processes. II: Property data and representative results. J. Food Eng. 2007, 80, 96–110. [Google Scholar] [CrossRef]
  30. Ni, H. Multiphase Moisture Transport in Porous Media under Intensive Microwave Heating; Cornell University: Ithaca, NY, USA, 1997. [Google Scholar]
  31. Białobrzewski, I. Simulation of changes in the density of an apple slab during drying. Int. Commun. Heat Mass Transf. 2006, 33, 880–888. [Google Scholar] [CrossRef]
  32. Pham, N.D.; Martens, W.; Karim, M.A.; Joardder, M. Nutritional quality of heat-sensitive food materials in intermittent microwave convective drying. Food Nutr. Res. 2018, 62, 1292–1303. [Google Scholar] [CrossRef] [Green Version]
  33. Rakesh, V.; Datta, A.; Walton, J.; McCarthy, K.; McCarthy, M. Microwave combination heating: Coupled electromagnetics e multiphase porous media modeling and MRI experimentation. AIChE J. 2012, 58, 1262–1278. [Google Scholar] [CrossRef]
  34. Cengel, Y.; Boles, M. Thermodynamics: An engineering approach. Sea 2002, 1000, 8862. [Google Scholar]
  35. Luo, W.J.; Lin, C.Y.; Wu, N.F.; Xu, Z.Q. Performance Enhancement of a Sludge Continuous Feed Heat Pump Drying System by Air Deflectors and Auxiliary Cooling Subsystems. Energies 2020, 13, 6651. [Google Scholar] [CrossRef]
Figure 1. Schematic showing the arrangement of the intermittent microwave oven and representative elementary volume with the transport mechanism of different phases.
Energies 16 00441 g001
Figure 2. Intermittency function.
Energies 16 00441 g002
Figure 3. Comparison of the model prediction with the given results in literature [19]: (a) moisture content (dry basis) during IMCD; (b) temperature during IMCD.
Energies 16 00441 g003
Figure 4. Comparison of moisture ratio (MR) of inlet and outlet slices under different drying processes: (a) CD; (b) IMCD.
Energies 16 00441 g004
Figure 5. Variation curves of drying rate of sample 5 and 16 slices with moisture content (dry basis).
Energies 16 00441 g005
Figure 6. Variation curves of microwave absorption power of sample 16.
Energies 16 00441 g006
Figure 7. Spatial distribution of vapor concentration and total liquid water flux in sample 16.
Energies 16 00441 g007
Figure 8. Spatial distribution of temperature in sample 16.
Energies 16 00441 g008
Figure 9. Spatial distribution of vapor pressure in sample 16.
Energies 16 00441 g009
Figure 10. Flow-field distribution in drying oven under different inlet and outlet walls and two drying methods.
Energies 16 00441 g010
Table 1. Input properties for the model.
ParameterValue (Unit)Reference
Initial temperature, T0293.15 (K)This work
Drying air temperature, Tin333 (K)This work
Drying air velocity, u01 (m/s)This work
Specific heat of air, cp,a1005.68 (J/kg·K)[6]
Specific heat of vapor, cp,v1.9 × 103 (J/kg·K)[6]
Specific heat of water, cp,w4.184 × 103 (J/kg·K)[19]
Air density, ρ01.073 (kg/m3)This work
Relative humidity, RH0.15This work
Initial equivalent porosity, ε00.922[6]
Initial moisture content (dry basis), Md06.5 (kg/kg)[19]
Thermal conductivity of water, λw0.644 (W/(m·K))[33]
Thermal conductivity of gas (air), λg0.026 (W/(m·K))[33]
Molecular weight of air, Ma0.029 (kg/mol)[34]
Molecular weight of water, Mw0.018 (kg/mol)[34]
Density of water, ρw1000 (kg/m3)This work
Evaporation constant, Kevap1000 (1/s)[6]
Latent heat of water evaporation, γ2.3586 × 10⁶ (J/kg)[19]
Table 2. Influence of mesh size on model’s stability.
Number of Grid Elements46,08880,66590,084102,784120,683140,630
Relative error15.68%11.83%2.1%0.45%0.16%0%
Table 3. Flow-field data (drying completed) under different operating conditions.
Type IType IIType IIICDIMCD
Drying uniformity87.94%86.68%89.28%40.06%68.16%
Temperature difference55.18 °C54.46 °C55.06 °C39.46 °C44.15 °C
Humidity difference0.00360.00470.0040.00290.018
Velocity difference0.234 m/s0.0992 m/s0.1069 m/s0.0596 m/s0.0535 m/s
Disclaimer/Publisher’s Note: The statements, opinions and data contained in all publications are solely those of the individual author(s) and contributor(s) and not of MDPI and/or the editor(s). MDPI and/or the editor(s) disclaim responsibility for any injury to people or property resulting from any ideas, methods, instructions or products referred to in the content.