1. Introduction
In many countries electrified railway transportation systems have experienced significant development for the last decade due to grow of passenger and goods flow and the number of their advantages. Electrified railway transport is energy efficient and low operation cost comparing to other type of transportation systems.
Particularly in Poland, national and region authorities have carried out a number of investments of new electrification of railway lines and modernization of an existing infrastructure due to its significant age and wear. A great part of the costs are related to traction power facilities [
1]. Especially significant cost must be spent on building a new traction substations and adaptation of AC power supply grid. Traction substations are oversized in terms of rated power; hence, they should meet the N-1 conditions regarding substation and transformer rectifier units’ outages. In many cases new supplying lines with significant length must be built to ensure a required value of short circuit power.
At the same time, growing passenger and goods flow, along with an increase of the operational speed, cause an increase of energy and power demand by railway transportation. In power system with dominant generation part based on fossil fuels the significant part of CO2 emission is still related with railway transportation; e.g., in Poland traction energy consumption in railway is ~2.7 TWh, representing 1.7% of total annual energy consumption and, respectively, in the current structure of the generation sector ~2.16 × 10⁶ tons of CO2 emissions. Thus, the significant cost is spent on CO2 allowances. At the same time traction substations are the loads with a relatively high-power demand. Due to the specifics of the traction load the ratio of power demand to energy consumption is one of the highest in the whole power system. Therefore, significant costs are spent to ensure the feasibility of transport tasks.
At the same time, due to the climate changes, a significant effort has been put towards reducing the CO
2 emission by increasing renewable generation in power systems and improving the energy efficiency of the loads. The biggest problem of systems with renewable energy sources (especially in island operation) is low correlation between generation and load time profiles. In DC electrification systems the problem of integration of the renewable power sources is the most significant obstacle to make the electrified transportation zero-emission. That obstacle could be overcome by the application of physical energy storage. Stationary energy storage systems are also an effective means to improve the utilization of regenerative energy of braking trains [
2] as well as peak shaving [
3].
In recent years much research effort has been spent on the issue of integration of renewable energy sources with traction load in both DC and AC supplying system.
In the work [
4] Boudoudouh et al. present the conception of the system consisting of 1500 V DC traction substation, renewable energy sources and battery energy storage. The energy management strategy is proposed based on multi agent system. The system meets the requirements of self-adaptation and autonomy. Perez et al. in [
5] analyze the stability aspects including power balance and voltage level in a DC microgrid including traction load with regenerative braking, photovoltaic panels, supercapacitor and battery energy storage, as well as AC load connected via inverter. In [
6] Ciccarelli et al. proposed the integration of photovoltaic plant with tramway line with supercapacitor energy storage system. The integration of renewable power sources and traction load has also been considered in AC electrification systems. Particularly in [
7] Chen et al. proposed of AC catenary section in double sided power supply system fed with two static frequency converters, where DC busbars are connected to PV source and hybrid energy storage system. The solution provides benefits such as: decreasing of energy and power demand, minimizing the negative sequence current and voltage, increasing the distance between adjacent substations.
González-Gil et al. in [
8] propose 22 key indicators of energy efficiency in urban rail system.
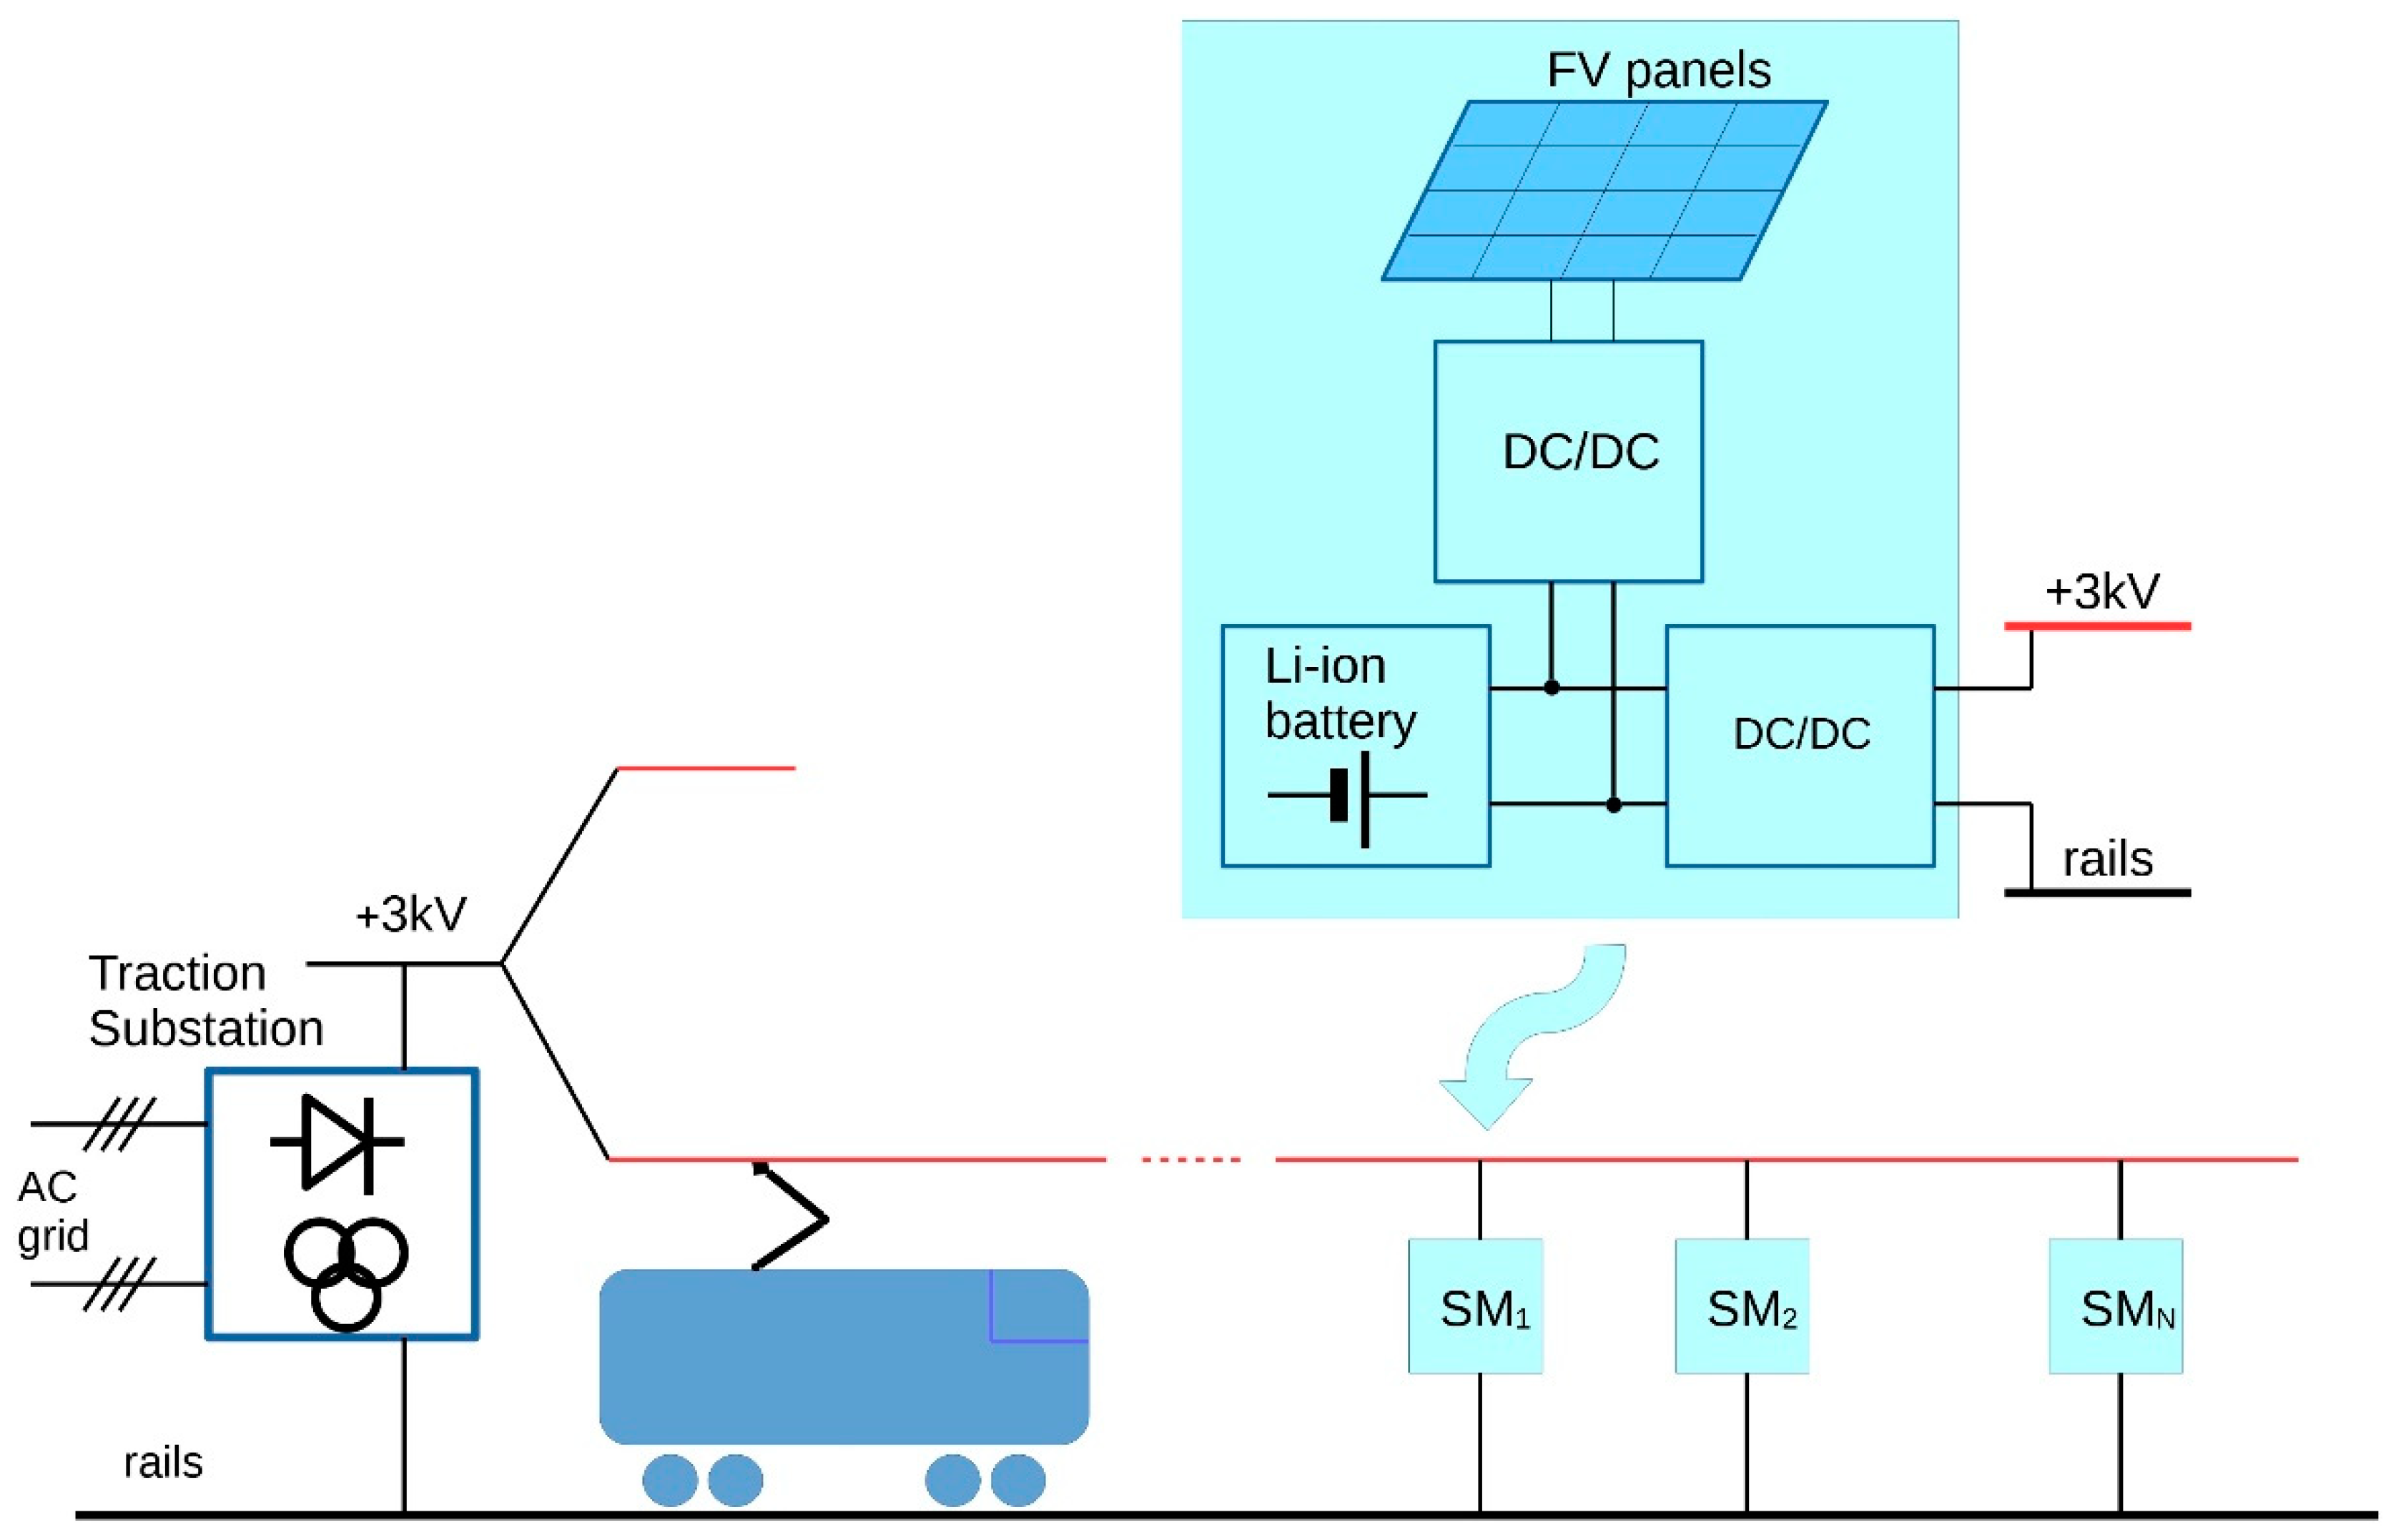
This article presents the concept of supplying a 3 kV DC overhead catenary system with number of supplying modules (SM) of relatively low power, replacing the traditional traction substation with transformer rectifier units. The conception is presented in
Figure 1. The proposed system is based on the following assumptions:
The installation of the supplying modules (SM) along the track with the relatively low distance between the modules (2–7 km).
The number of modules could be adjusted so that to meet the demand of power supply, pantograph voltage and reliability conditions and to adapt the supplying system for changing train operation conditions.
Each module consists of battery energy storage and DC/DC converters.
Modules are equipped with an interface enabling supplying them from PV sources installed along the track or alternatively from low voltage grid; modules are also able to operate without being connected to external energy sources, as it is possible to provide the energy from adjacent traditional traction substations via catenary as well as by recuperating trains.
The potencial advantages of the proposed concept, comparing to the traditional-only solution, are as follows:
Lower costs of power demand.
Decrease of energy consumption and CO2 emission.
Increase of the reliability level of the supplying system.
Improvement of pantograph voltage conditions.
Increase of reliability of traction power supplying system.
Enabling of integration of significant amount of the renewable energy sources, especially PV panels, which could be located along the track.
Improve catenary system receptivity for recuperating trains, ensuring use of recuperative energy effective.
The scheme of proposed topology of a single supplying module dedicated for double track line is presented in
Figure 2. It could be assumed that the most beneficial topology of SM for double track lines, which are the most widespread situation, is the installation of single battery pack and two separate DC/DC converters, each connected to dedicated catenary section of each track. Each catenary section should be switched off during fault separately, which is enabled by equipping it with two high speed breakers at each side of a section in traditional 3 kV DC configuration. The proposed solution of SM enables short circuit currents switching off with use of power electronic. DC/DC converters should be interlocked with adjacent traditional traction substation to enable switching of the metallic and ground faults. Due to the cost factors, there are more advantages ininstalling single battery pack for both tracks, rather than for each section separately.
The charging current of the battery pack should be approximately 5–10 times lower than the maximum discharge current. There are a few possible modes of battery charging in the proposed system and concepts of connection of SMs to power sources. The proposed system flexibility enables the implementation of different conceptions of battery charging for adjacent SMs in the same railway line. In the basic configuration SMs could be charged from adjacent traction substations through catenary wires and rails. Assuming low charging currents the power losses could be minimized. The solution could be effective only if the headway times between trains are sufficiently long enough to enable achieving the required state of charge with minimal energy losses and batteries degradation. The second way of supplying energy to SMs is connecting them to MV supplying lines (4 in
Figure 2). As the charging power is low, the non-traction load MV lines, which are usually routed along railway lines, could be used for this purpose. We assume that for the charging mode, the system could be equipped with 63 kVA transformer (5 in
Figure 2). MV lines are usually supplied in double end configuration, which ensures a relatively high reliability level. The third solution of supplying the energy to SMs is connecting them to renewable power source (3 in
Figure 2). The most preferable type of renewable power source for the proposed purpose is solar panel, due to their decreasing prices in long term perspective, as well as due to the available numerous terrains along the track, belonging to railway operators, which could be used for these purposes. In addition, prosumers located near to the railway line could be engaged [
9]. The presented modes of providing the energy to supplying points could complement each other in the same railway line, as solar generation during winter is minimum. SMs could also be charged by the regenerative currents of braking trains, which is effective in suburban traffic. The regenerative currents are relatively high (close to the current values during start up mode), but the parallel operation of multiple SM makes it possible to share the regenerative current between SMs ensuring high catenary receptivity and regeneration power utilization.
In the case study presented in
Section 3, only the mechanism of charging SMs by adjacent MV line has been considered.
The arrangement of the article is the following.
Section 2 presents the simulation model of the proposed power supply configuration. The case study, including aspects of energy and power demand, costs, as well as reliability analysis is presented in
Section 3.
Section 4 presents the concept of determination of number of supplying modules number.
Section 5 provides the conclusions and directions of future work.
2. Simulation Model
The simulation model is based on the model of the train performance calculation, enabling parallel multiple trains operation as well as power flow algorithm based on the instantaneous scheme analysis. The simulation model used in the study has been presented in details in [
10,
11].
The train performance calculation is based on the Equation (1) [
10]:
where:
vi(t), si(t)—transients of speed and distance as the function of time [km/h, km],
Wpi(vi(t))—basic rolling resistance as the function of speed [kN],
Wdi(si(t))—additional rolling resistances as the function of train location (distance), depending on vertical and horizontal profile [kN],
mi—mass of the given train [t],
αi—rolling mass coefficient, depending on the given train type [%].
Basic rolling resistances approximated by Davis formula, given by Equation (2),
Additional rolling resistances consist of the component depending on the vertical profile and the component depending on the horizontal profile, and are expressed by Equation (3)
Train performance calculation is being realized in parallel for the trains under operation. Trains run according to the timetable, in which the locations of the trains stop and the corresponding departure times are provided.
Power flow algorithm is being realized based on the equivalent instantaneous scheme method. An instantaneous scheme is obtained in each time step of the simulation based on train performance calculation results—the location and power of each train and infrastructure data—along with the location of traction substations, section cabins (track paralleling huts) and catenary data. Each instantaneous scheme consists of single train, represented by current source and infrastructure. The analysis of the equivalent scheme is carried out based on the mesh method. The equivalent matrix representation is presented in Equation (4), and is also presented in [
9].
The total current values (for all active trains) in the infrastructure elements are being calculated using superposition method, based on the current values obtained for each train by Equation (4). As the current sources standing for trains are non-linear elements (characterized by constant power), an iterative method is used. Calculations are being repeated in iterations, until the pantograph voltage achieves the quasi-constant value.
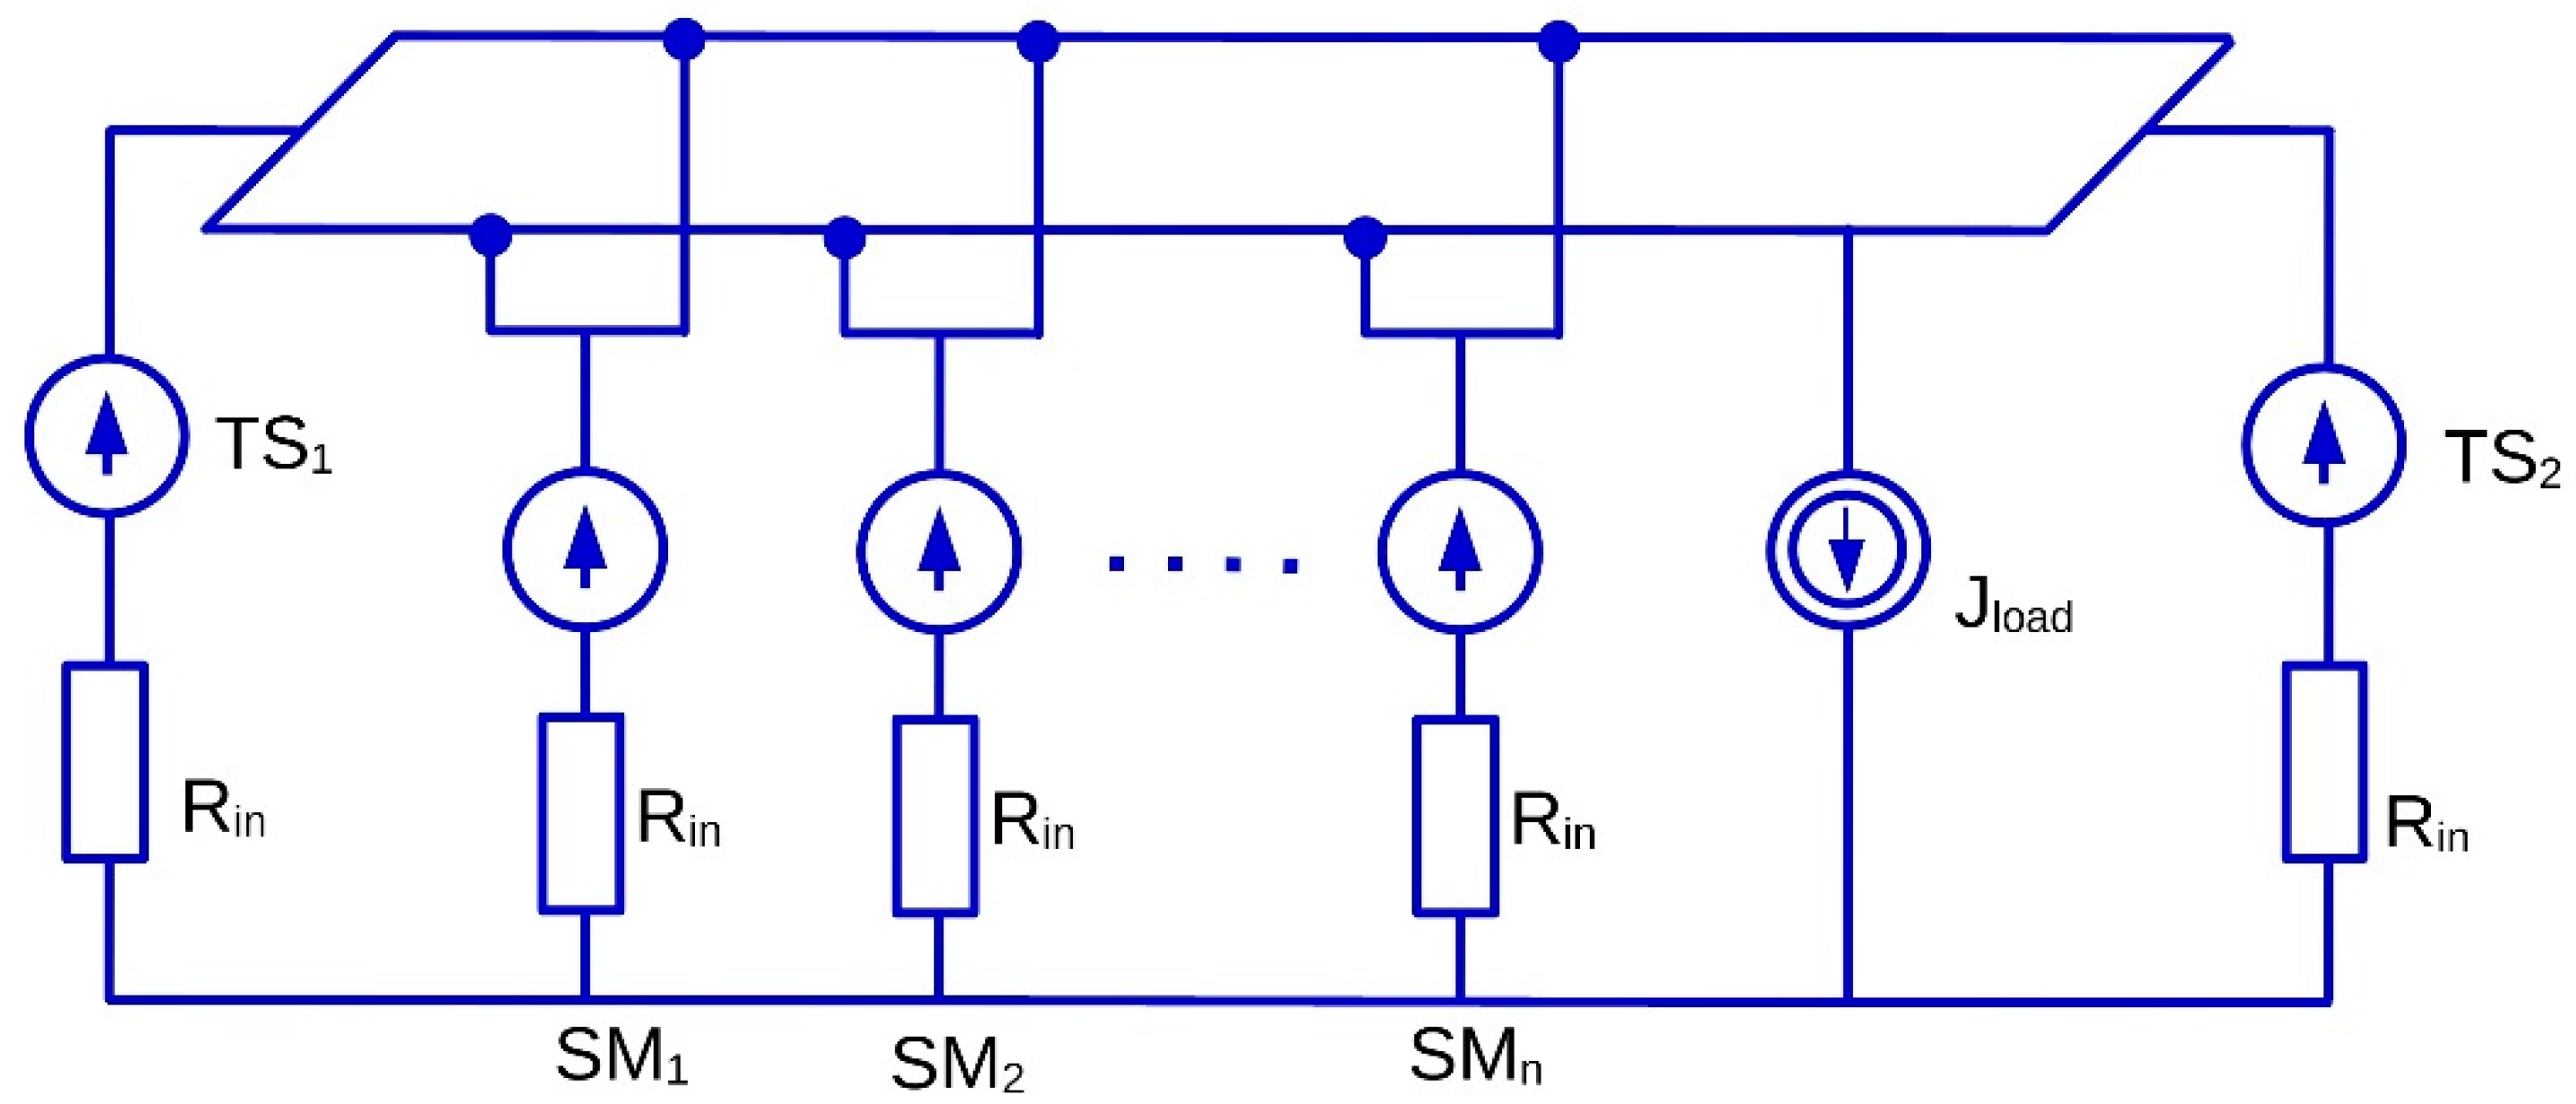
An equivalent instantaneous scheme of the proposed distribution supply system is presented in
Figure 3. The traditional traction substation is represented by a real voltage source with a voltage value equal to the idle voltage of traction substation and internal resistance. Loads are represented by ideal current sources. Supplying modules are represented by the voltage sources with the voltage values equal to average idle voltage of the adjacent traction substations and internal resistance equal to 1 Ω.
In practical application, the current value of each SM is determined by an appropriate energy management strategy (EMS). The strategy should be centralized for a group of SMs operating in a given area of catenary sections [
9]. In the first place, EMS should ensure a sufficient state of charge of ESS in each SM to ensure the train operation power supply. The energy management strategy should also ensure minimal power losses in catenary. The proposed simplification is acceptable for achieving the purposes of this study. The currents of SMs determined using the proposed model are close to optimal in terms of catenary losses, as the current value of each SM is a result of current distribution into parallel resistors (consisting of catenary, rails and equivalent internal SMs resistances R
in), according to Ohm’s law.
Based on waveforms of currents plots, it can be stated that the current of each SM is approximately inversely proportional to the distance between train and SM; however, the order of magnitude of the SMs current values is the same. In real implementation, the MS currents could be adjusted by EMS in different proportion, optimizing them based on minimum power losses or other factors. Based on the assumption that EMS could improve the effect of system operation by adjusting the currents and slightly decrease the power losses peak power demand and voltage drops, in comparison to the situation obtained in the proposed model. We assume that the proposed model is appropriate for the conception research, as the presented results show a slightly worse case scenario.
In a future model dedicated to development of EMS for proposed enhancement systems, SM should be replaced by equivalent controlled current sources, with current values that should be determined by EMS in a real time mode.
3. Case Study
The infrastructure scheme being analyzed is presented in
Figure 4. The case study has been conducted for the newly planned electrification of the railway line between two existing already electrified railway lines, which is a typical case of railway investment. The newly electrified railway line with new power supply elements is presented in red, while existing electrification system elements are presented in black. New catenary and supplying elements should be connected with existing supplying systems. High speed breakers of the existing and new traction substations/section cabins should be interlocked. The railway line planed for electrification is 31.9 km long. There is an existing traction substation at 0 km of the line, in a junction with electrified line. At the end of the analyzed line, there is a section cabin (B), which is connected to existing traction substations via catenary.
The internal resistance of TS A is assumed to be 0.085 Ω. The cross-section area of overhead catenary is assumed to be 420 mm2 with a unit resistance of 0.049 Ohm/km, assuming 15% wear of contact wire. The unit resistance of running rails is assumed to be 0.0075 Ohm/km.
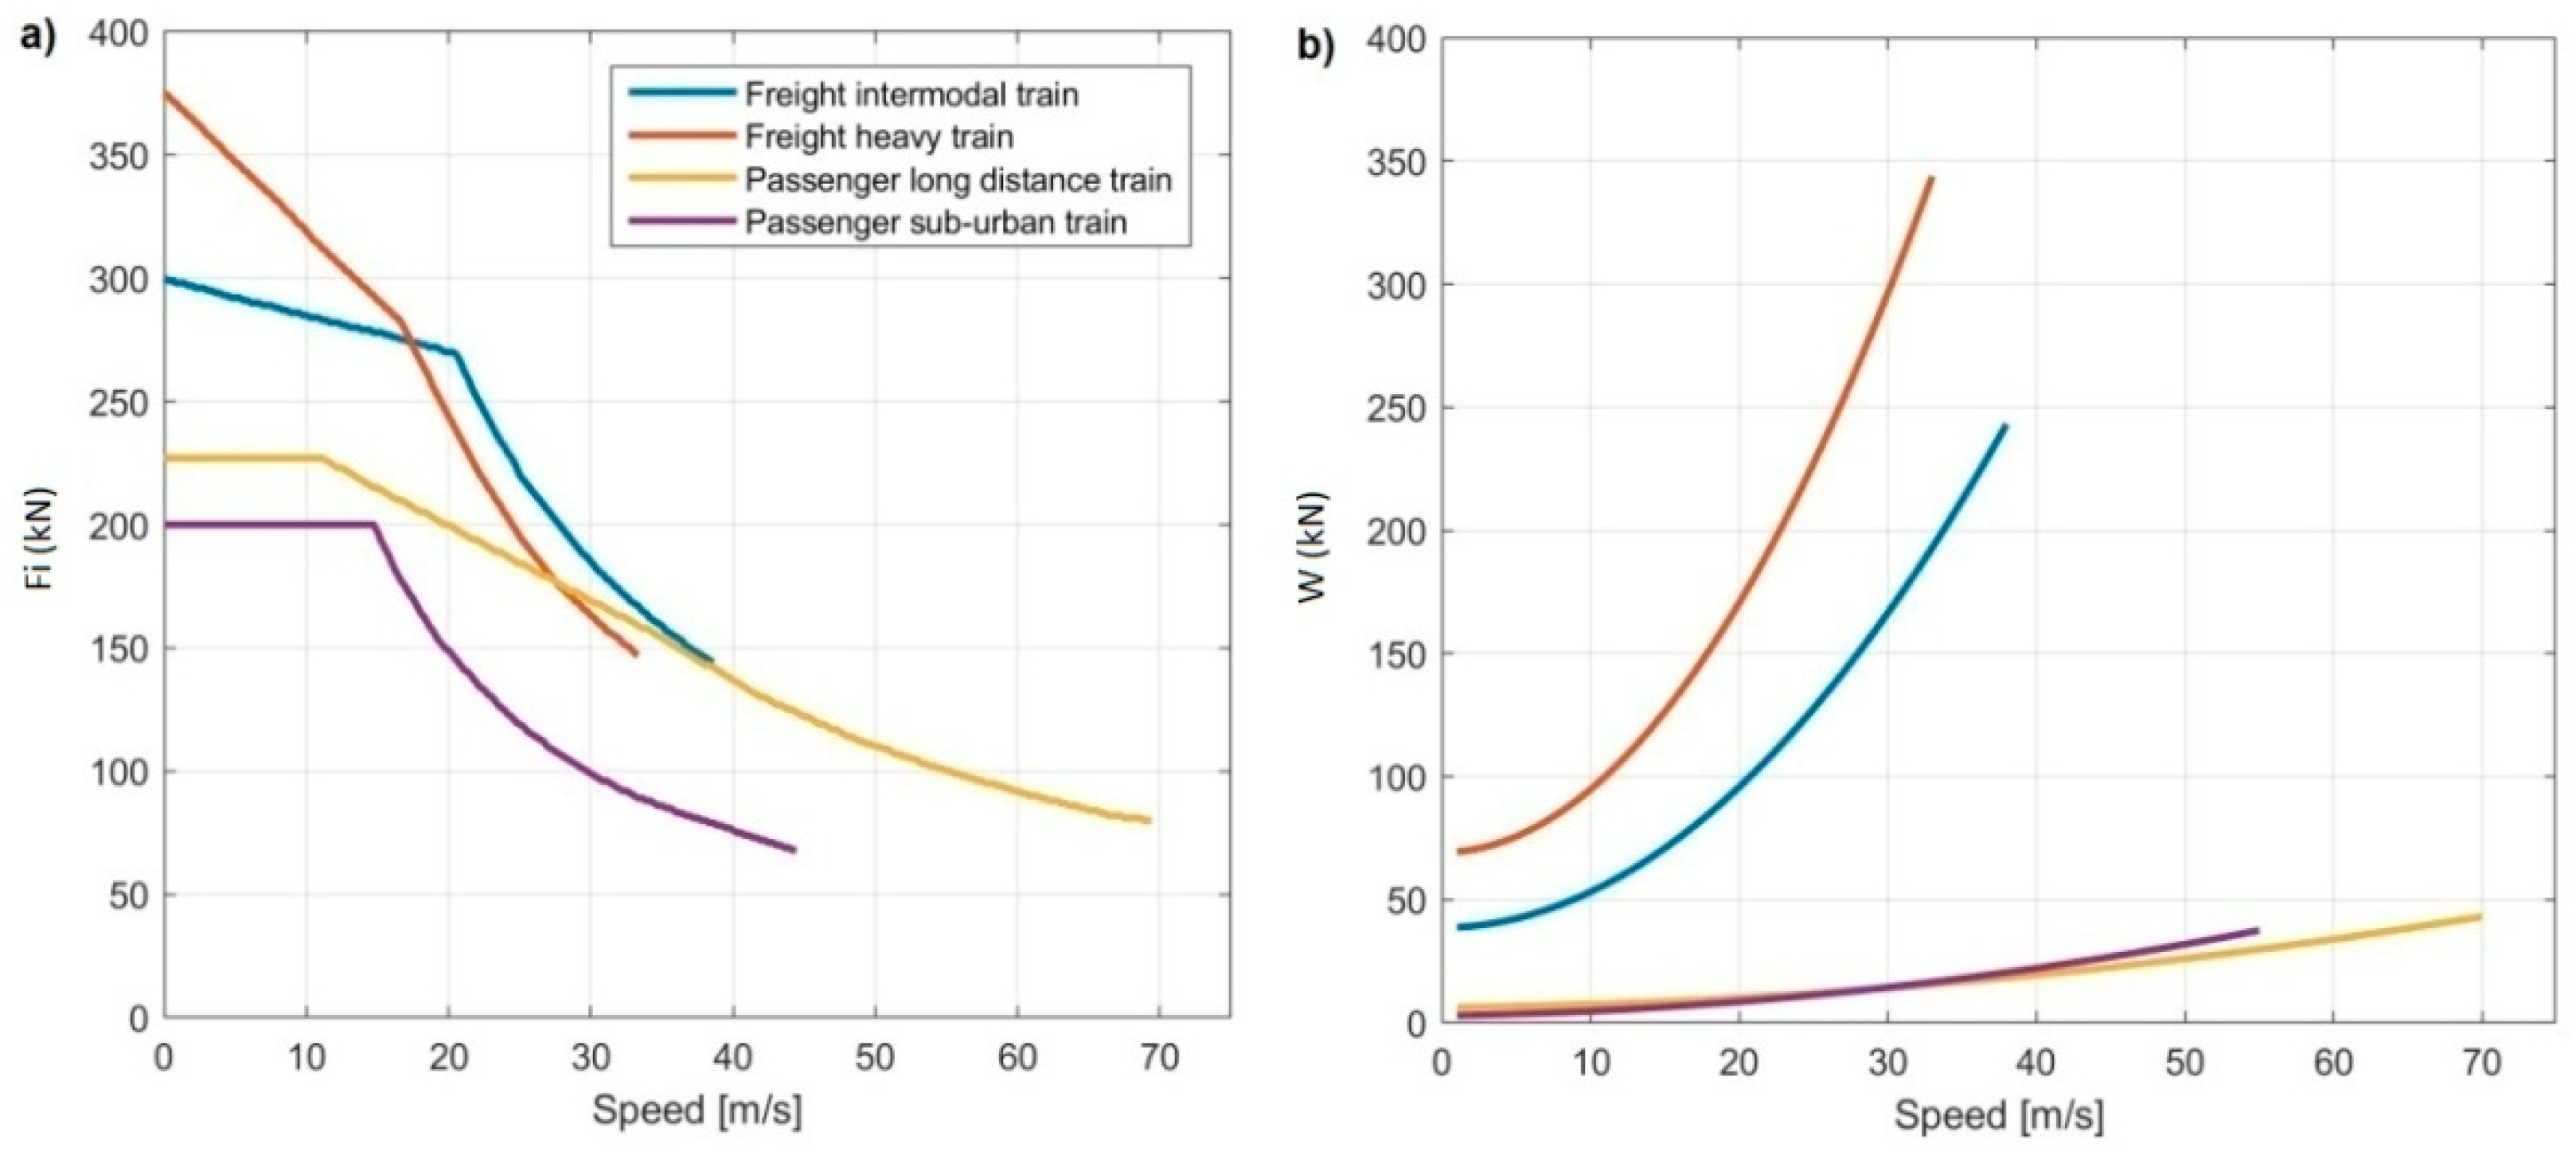
The newly electrified railway line is dedicated to freight and passenger trains operation. It is assumed that four types of rolling stock run on the newly electrified line. Two types of freight trains (intermodal and freight trains) and two types of passenger trains (long distance and sub-urban electric multiple units—EMU) are assumed. The traction characteristics and rolling resistance approximation are presented in
Figure 5 and the main parameters are depicted in
Table 1.
The rolling resistances have been approximated with Davis formula, expressed by Equation (2), where the coefficients a, b and c are presented in
Table 1.
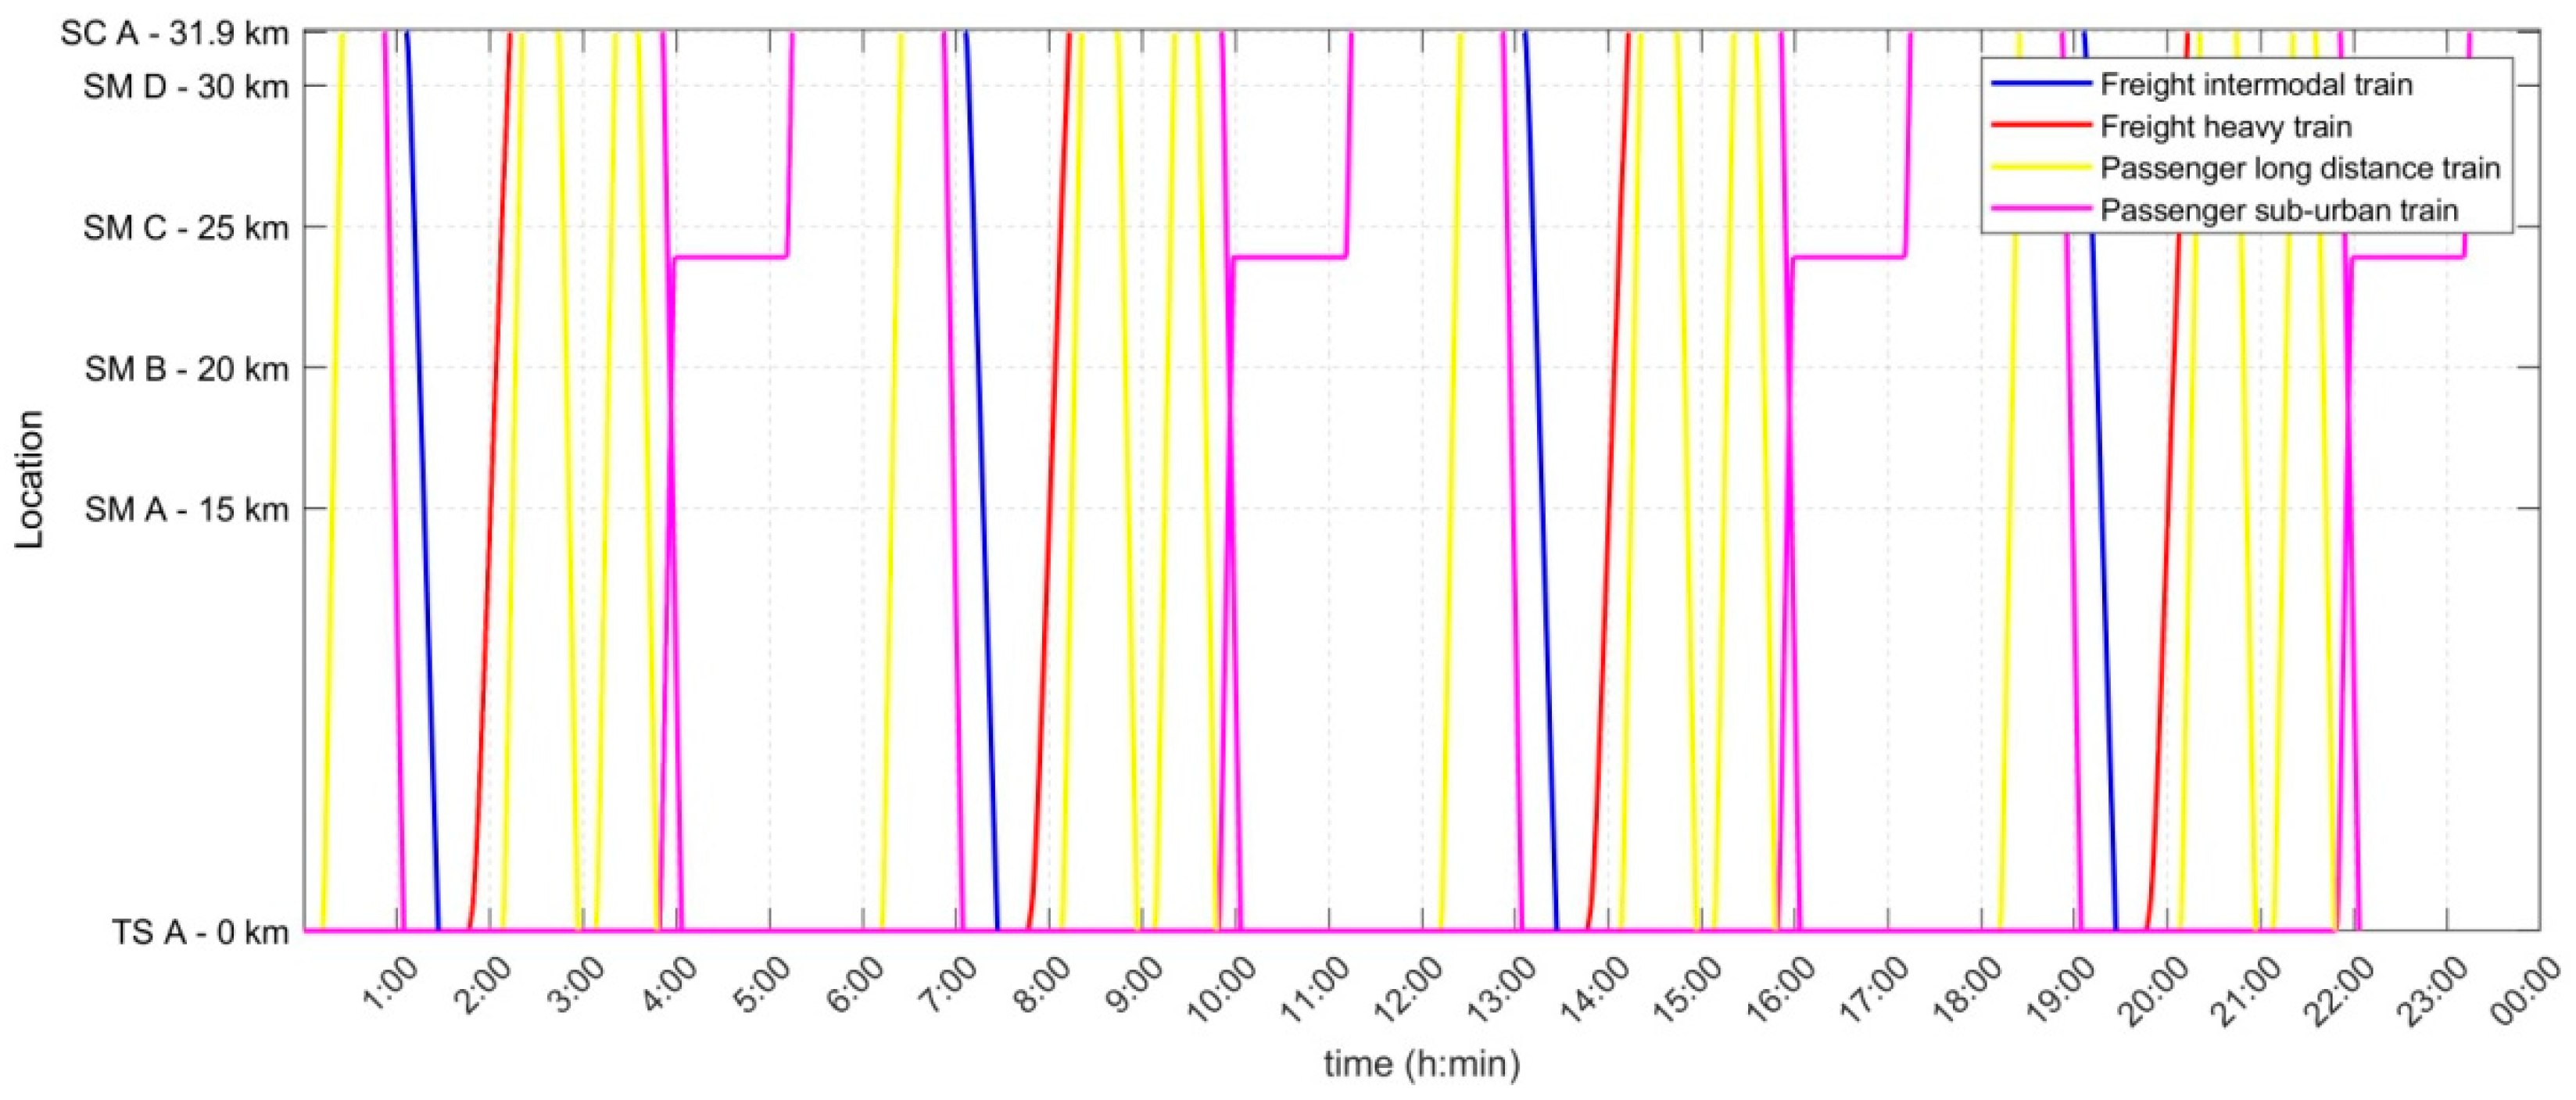
The train timetable is presented in
Figure 6. It is assumed that the train traffic in the analyzed railway line is relatively not intensive. During 24-h operation cycle, the total number of trains is equal to 40.
3.1. Energy Consumption
The proposed solution could enable decrease of energy consumption by decreasing energy losses in catenary. The dominant power losses in railway/tram lines with energy storage systems are generated in catenary [
9]. In distributed power supply system traction currents are flowing through the catenary shorter distances of catenary wires. The energy losses depend on the average current and distance between the sources (traction substation, MS) and the loads (train). If the power demand is covered locally, the energy losses are the lowest, if some power is transferred on the long distance, the losses are higher. The energy consumption values for both concentrated and distributed power supply system have been presented in
Table 2.
The above results show that the energy consumption of traction substation TS A is higher, in the case of a distributed power supply system of the proposed number and location of supplying modules. In addition, the total energy consumption is higher in case without traction substation, which is related with energy losses in catenary. Both of the aforementioned facts appear due to the limited current performance of SMs; according to that, more energy should be transferred from substation TS A and cabin SC B in the case with a distributed system, rather than with traditional traction substation. For example, for system with 10 SMs the total energy consumption is 29.63 MWh and for substation TS A is 12.85 MWh. Apart from energy losses in catenary, the assumed number of SMs should also meet other criteria, which are analyzed in following chapters.
The above analysis has been made for the assumption that any renewable energy source does not supply a railway line.
3.2. Peak Power Demand
The proposed power supply system enables the decrease of the power demand as the energy storage systems installed in supplying modules cumulate the energy from renewable sources or/and MV lines when it is available, and give it back when there is a demand for traction power. Among other methods using energy storage systems for peak shaving, it is one of the most perspective [
3,
12]. If the supplying points are only equipped with renewable sources RES (element 3 in
Figure 2), such a system could supply trains with energy only in the case of traffic of a low frequency. In this case, adjacent substations charge storage systems through catenary. In this case study, we present the conception in which supplying modules (SM) are connected to medium voltage supplying line.
For the evaluation of peak power demand, an average of 15-min power has been considered. The results compared for traditional and proposed power supply configuration have been presented in
Table 3.
The results show that the total power demand of the supplying system is close to each other in case of distributed power supply system and with traditional traction substation. However, the peak power demand of substation TS A is higher in case with distributed power supply, according to the limitations of current performance of SMs.
3.3. Cost Comparison
The concentrated and proposed distribution systems were compared in terms of total investment costs. In the concentrated system, the total costs include the construction of a new traction substation with supplying lines. It is assumed that conventional 3 kV DC traction substation is supplied by two 15 kV cable lines of total length 8 km. The new conventional traction substation contains two transformer-rectifier units. In addition, the costs of building, AC and DC switchgear and auxiliary supply are assumed in total substation installation cost. The cost assumptions for conventional a 3 kV DC substation have been presented in
Table 4.
The estimated total price of a traditional 3 kV DC traction substation is 3.47M USD.
The total cost of single supplying point is assumed to be following:
where the costs of DC/DC converter, AC/DC converter and transformer are estimated on the basis of unit price [USD/kW] and a constant cost related to manufacture of the converter.
The cost of a battery pack is estimated according to the relationship which assumes the prices of a single cell and coefficients related with the battery management system.
where
n is number of cells connected in series and m is number of branches connected in parallel. The cost assumptions for supply module (SM) have been presented in
Table 5.
In
Table 6, the assumed parameters of a single supply module (SM) are depicted.
The total cost of single supply point according to the method presented above is equal to 656,288 USD. The cost of 4 supplying points is equal to 2.63 M USD.
The presented results show that the cost of installation of 4 supplying modules is 25% lower than installation of traction substation. In presented costs of SMs, the installation development of technology—preparing and implementing of the prototype—was not considered.
3.4. Pantograph Voltage
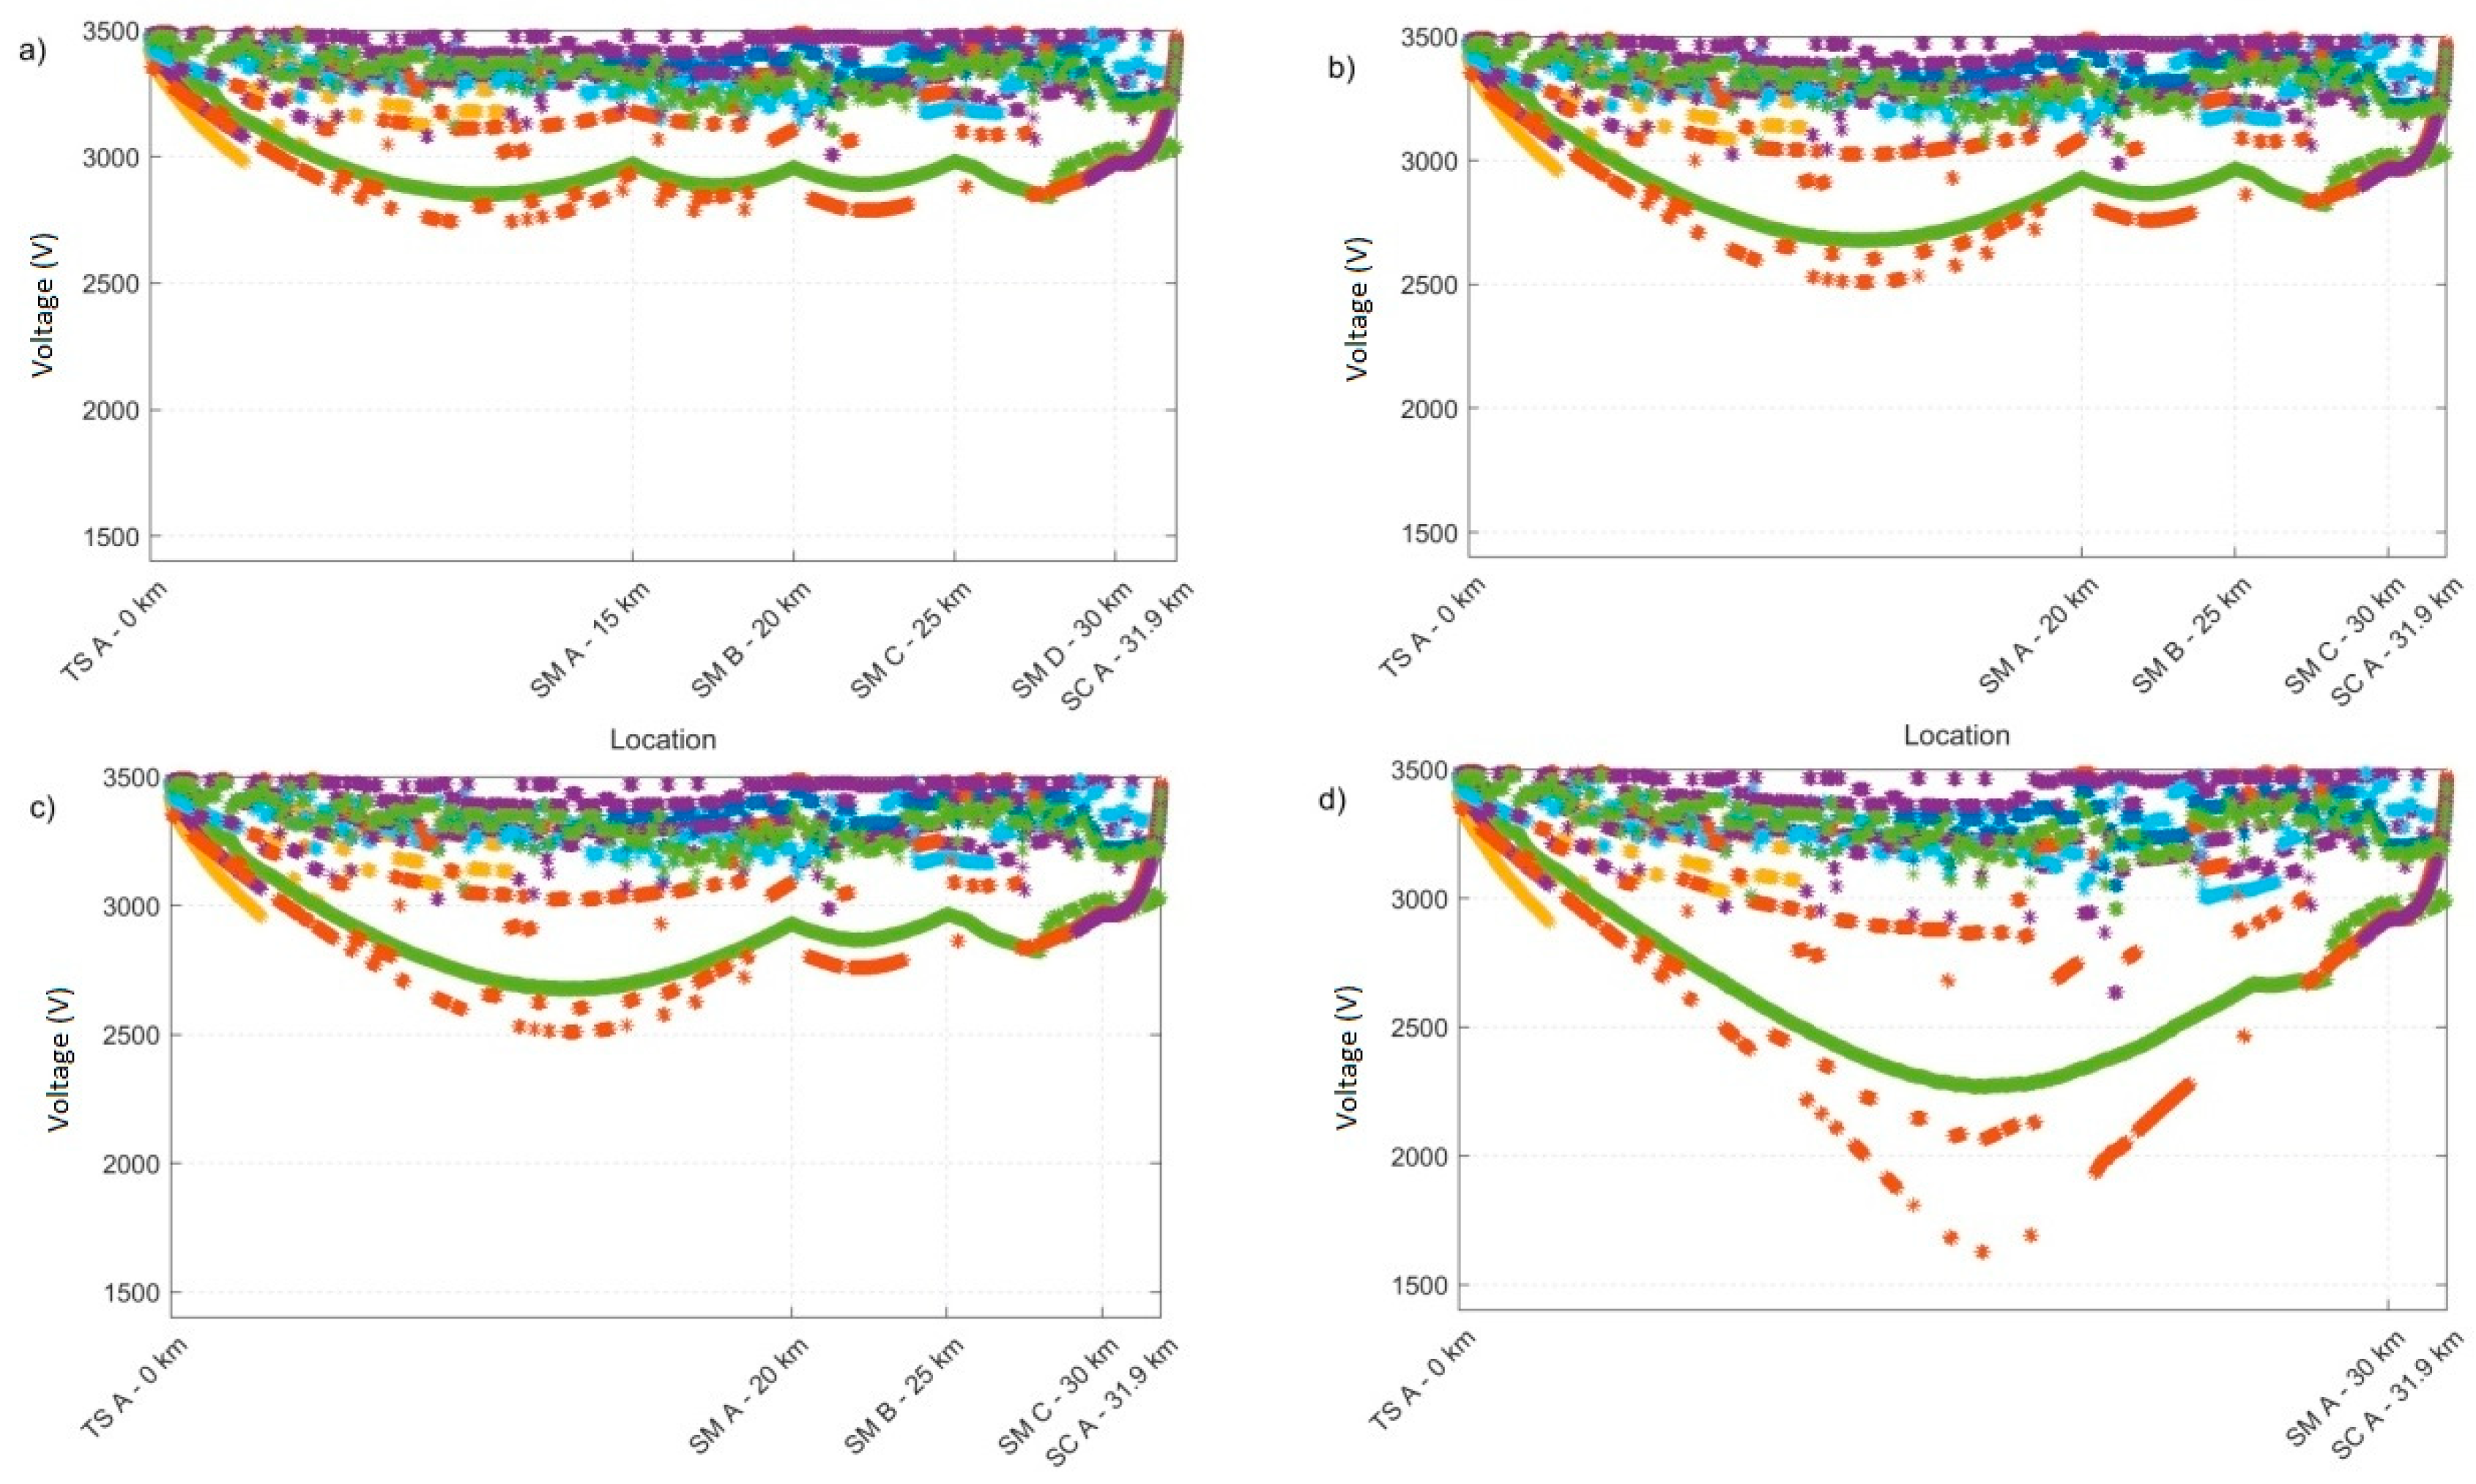
One of the significant advantages of the proposed distributed supply system is the enhancement of power supply system in terms of pantograph voltage conditions. Due to the shorter distances between adjacent power sources, the average voltage drops between sources and pantographs are lower than those in conventional system with traditional traction substations. In
Figure 7 1-s (semi-instantaneous) values of pantograph voltage have been presented in case of the proposed system with 4 SM, as well as for 3 SM, 2 SM and single SM. Assuming that pantograph voltage levels are decisive criteria for determining the number and location of SMs, the figures could depict the final number of SMs, especially the N-1 and N-2 conditions that could be analyzed, based on the pantograph level for the different number of SMs installed in the system in adifferent location.
3.5. Reliability Analysis
The reliability level has been evaluated for the proposed enhanced system and compared with the reliability of traditional diode-rectifier traction substation. The methodology of reliability evaluation, as well as the reliability level of traditional traction substation, have been taken from [
13].
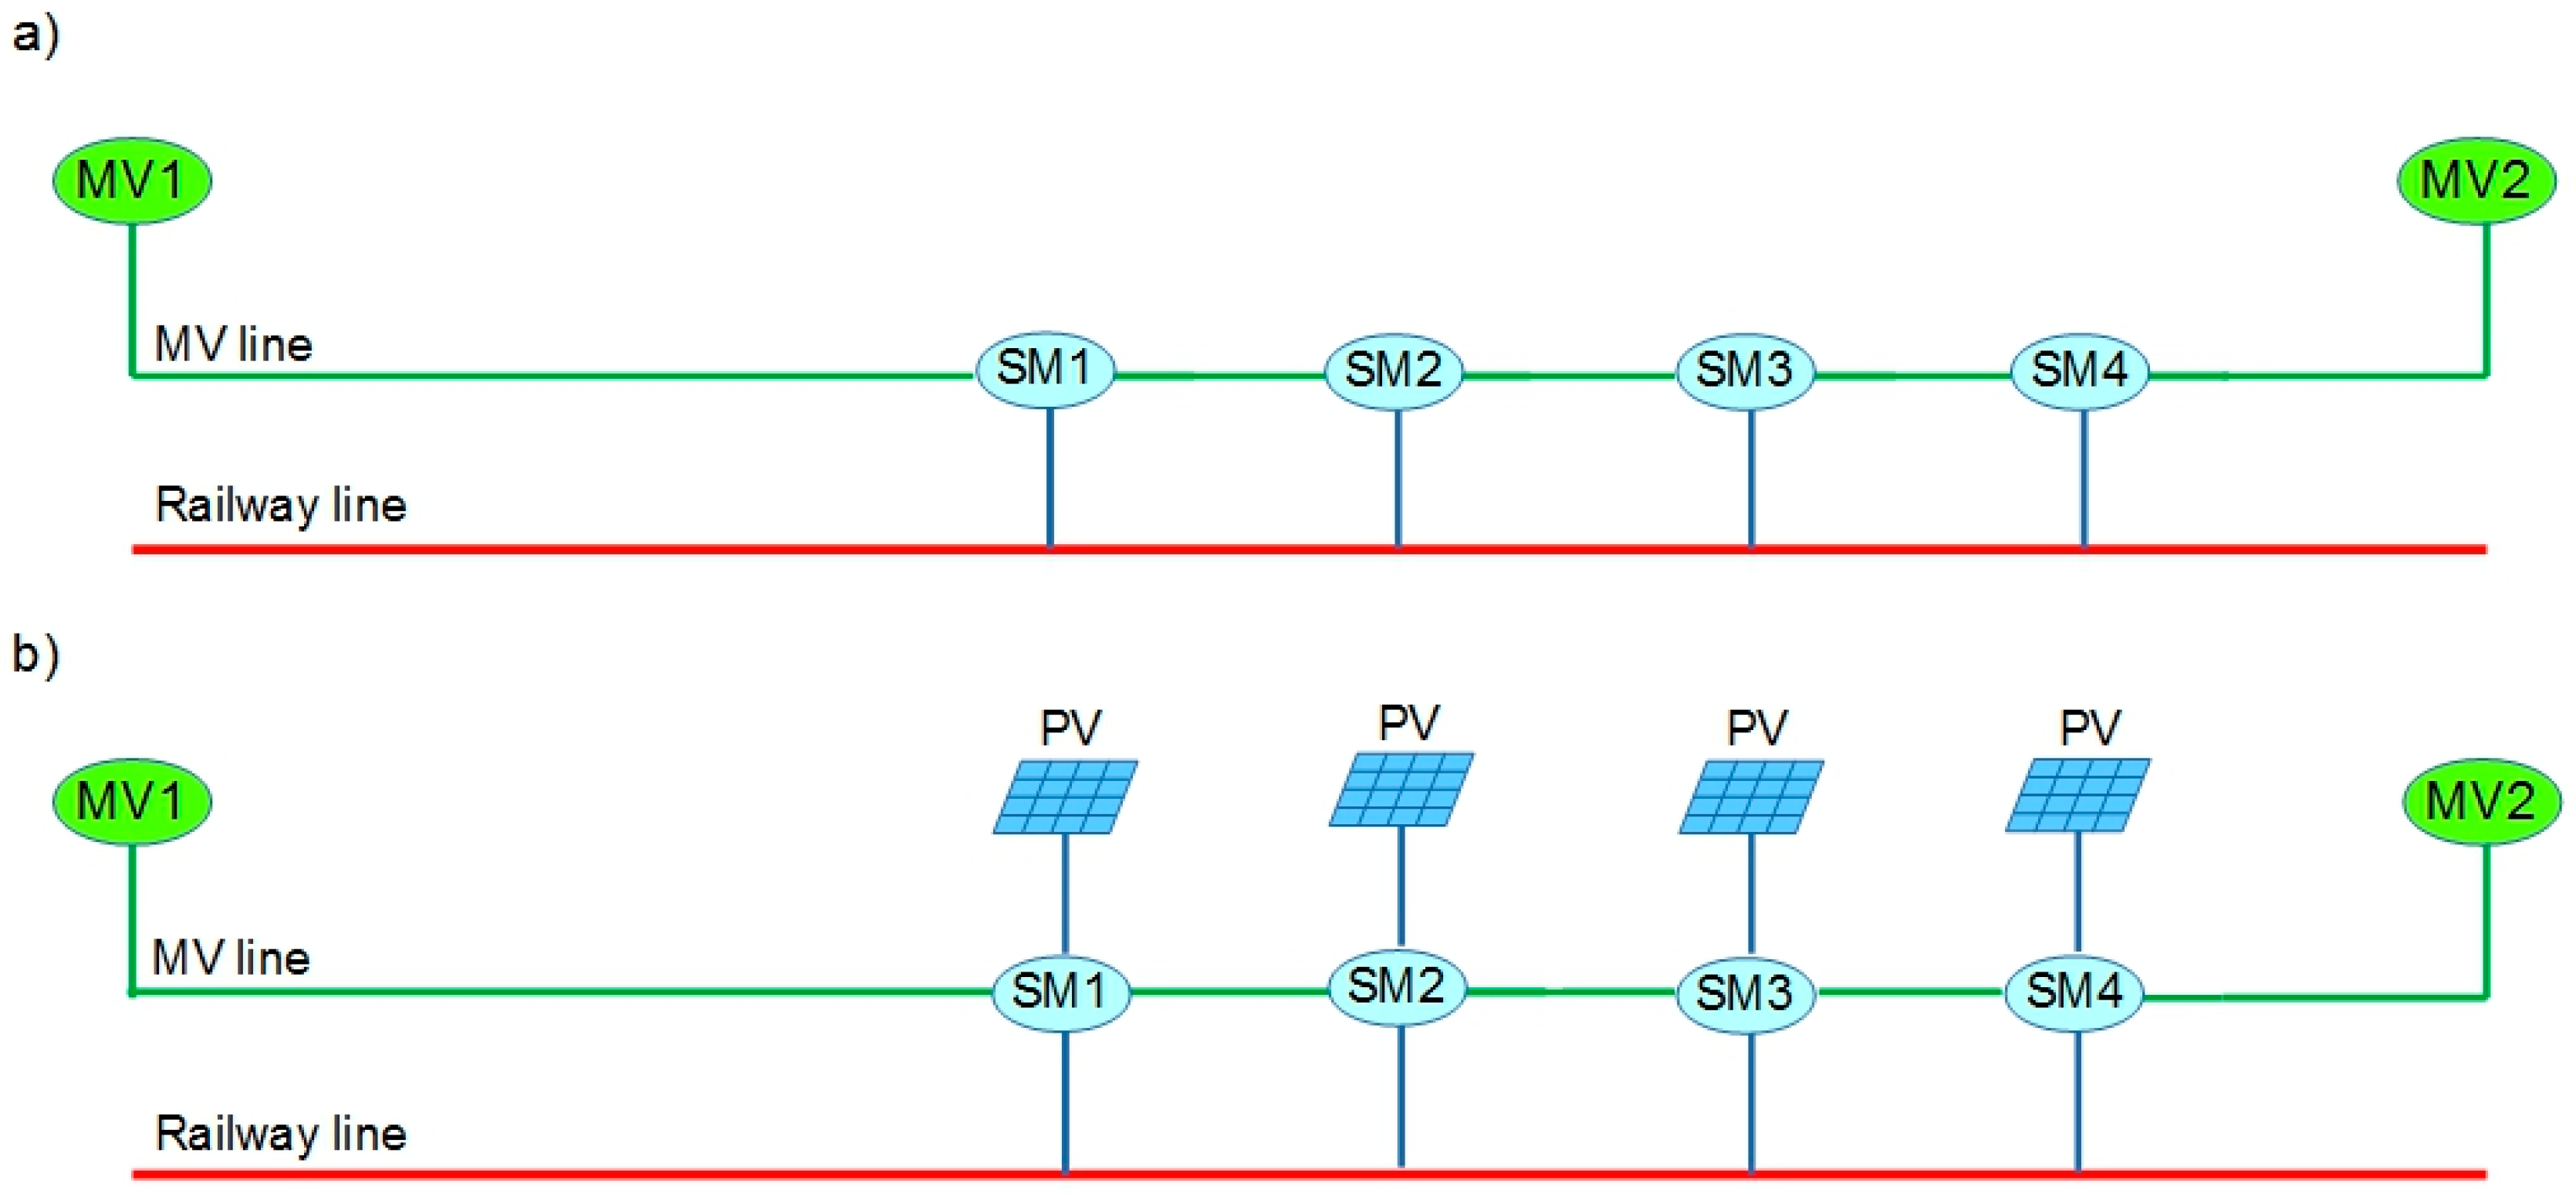
The reliability analysis for proposed solution has been conducted for two variants of system functionality:
- (a)
SMs batteries are charged by double sided MV supplying line only;
- (b)
SMs batteries are charged by double sided MV supplying line and photovoltaic sources.
The failure rate has been obtained based on the logical models including the failure rate of each element of the system. The structure of the power supply system for analyzed variants has been shown in
Figure 8.
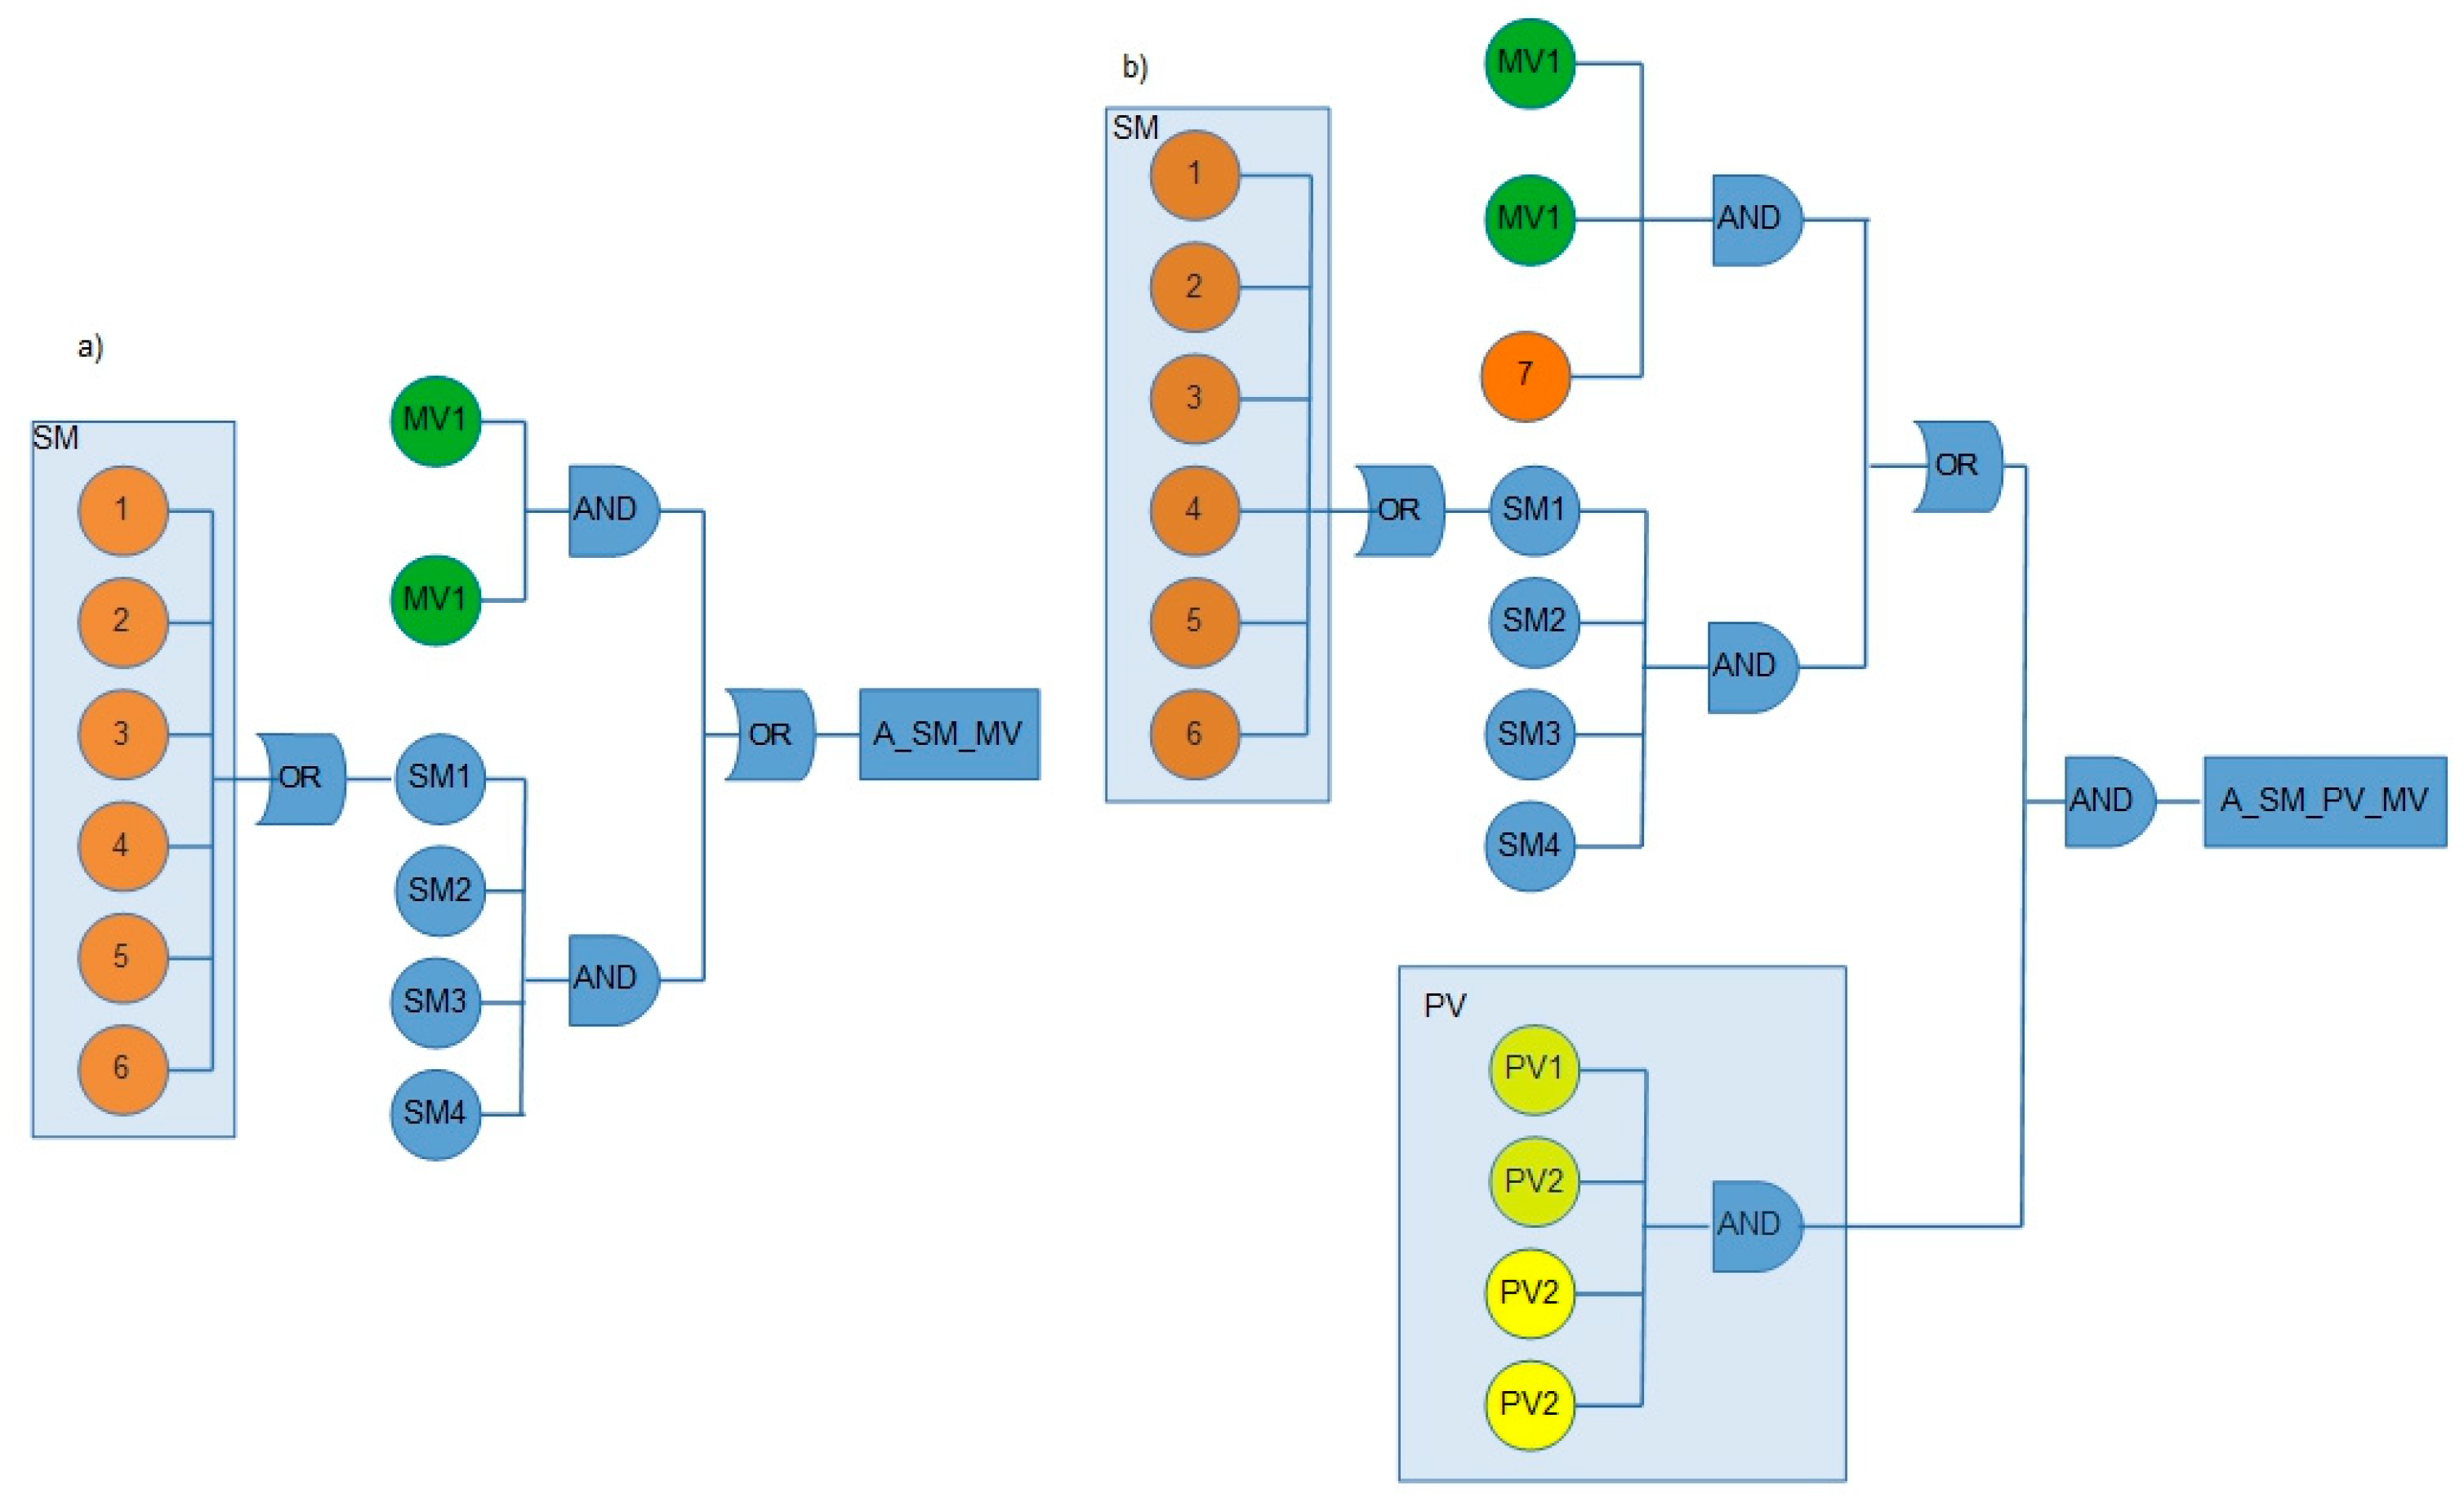
Based on the functionality diagrams, the logical diagrams of failure rate have been built. The logical diagrams have been presented in
Figure 9. The values of failure rate of each element of the systems have been taken from literature. The assumptions are presented below.
The failure rate of overhead transmission lines strongly depends on its nominal voltage and weather/climate conditions [
14,
15]. The failure rate of the medium voltage overhead line has been taken from the literature [
14], assuming that the failure rate of the medium voltage line is on average 10 times higher than 110 kV line for the same weather/climate conditions [
15]. In addition, a lightning level density and maximum wind speed has been assumed on an average level within the values range presented in [
14], 0.54 times/km
2.a and 8.4 m/s, respectively.
The failure rate of MV cable line strongly depends on the cable age [
16]. For the estimation of failure level of medium voltage cable line, approximately 25 years of cable age has been assumed, as an average value of cable lifetime (around 50 years).
The transformer’s reliability level has been taken from [
17], where the failure rates for medium voltage transformers have been presented based on statistical data.
The failure rate of DC/DC converter has been taken from [
18]. The reliability of a DC/DC converter depends mainly on its age. The failure rate of an AC/DC converter for battery charging has been assumed to be on the same level as for DC/DC converter.
The failure rate of battery management strategy depends on the accuracy of the algorithm development and implementation. We have assumed that the failure rate of EMS is equal to 5 × 10⁻⁶.
The failure rate of photovoltaic system connected has been estimated based on [
19], calculating the resulting failure rate based on each element of the PV installation element. For the calculation of precise reliability of PV farm, the number of panels should be considered, which in the analyzed installation is relatively large. The reasonable value power of the photovoltaic system running with SM could vary between 10 and 40 kW.
The failure rate values of the analyzed system particular elements are depicted in
Table 7.
In variant (a) of system configuration, the EMS failure rate is assumed as being 10 times higher than in variant (b), as the algorithm is more complex than in the case of a charging battery with medium voltage line only. The results of failure rate for both concentrated and distributed power supply system are presented in
Table 8.
The results show that the reliability of power supply system enhanced with SMs is around 10 times higher, than the reliability of traditional traction substation. It is assumed that SMs are supplied only by a medium voltage line.
In the case of SMs additionally supplied with photovoltaic sources, the total system failure rate is marginal. In this case it is assumed that 24-h energy consumption responding to single SM is significantly lower than solar generation in PV panels connected to given SM. However, in such analysis it has to be taken under account that during winter most European countries PV generation is marginal.
4. Determination of Number and Location of SMs
Estimating the number and location of the supplying modules, the following criteria should be considered simultaneously:
The pantograph voltage level on the analyzed railway line should be according with the proper standards, ensuring reliable operation of the trains with given parameters and according with the given timetable.
The loading of existing adjacent substations should not exceed the nominal parameters of traction rectifier unit, considering the transformers rectifier duty cycle, according to proper standards.
The installation and operation cost of the installed system should be minimized.
The power demand and energy costs should be minimized.
It should be highlighted that in the proposed solution, supplying modules do not supply trains in off-grid way. Instead, trains are supplied by the traditional adjacent traction substation in parallel with SMs. The load share between SMs and the adjacent traction substation should ensure meeting the conditions mentioned above, and therefore the number and location of SMs are dependent on the parameters and structure of the power supply system, along with train traffic.
Regarding the location of the supply points, the decisive criterion should be the pantograph voltage values for the system without the supply points given as a function of distance. For the case study, such values are presented in
Figure 8. In addition, the train current values, including available regenerative braking currents, given as the function of distance could be additionally taken into account, choosing the locations and the distances between SMs.
5. Conclusions
The presented results show significant potential benefits resulting for the installation of the proposed solution of 3 kV DC enhancement. The results presented in a case study show that the main advantage of the proposed solution of supplying system enhancement, compared to the traditional traction substation solution, is a possibility to decrease the investment costs. It also enables to integrate a renewable energy sources reduction of energy consumption from the power grid.
The proposed solution also enables the decrease of a peak power demand and power losses in catenary. It should be noted that to decrease energy losses in a catenary, it is necessary to install a proper number and total power of SMs along the railway line to supply the trains locally. In order to decrease the total peak power demand, it is necessary to install SMs of a sufficient number, in order to ensure minimum total power and energy capacity. Therefore, the number of SMs should be adjusted above all in order to ensure an appropriate voltage level in a train pantograph with a high reliability. The criteria of peak power demand and power losses minimization are contradictory with the criteria of cost minimization, therefore a compromise scenario should be found in each individual situation. In the case study, the basic solution has been shown, ensuring only reliable train energy supply.
In future works the operation costs should be considered, where the aging effect of the batteries play a key role. As an alternative, due to high peak-power demand, a HESS- hybrid energy storage system (battery with supercapacitor) could be taken into account. The solution is important in terms of the integration of renewable energy sources and traction power 3 kV DC system, with the significant role of energy storage systems installed in supplying modules. The implemented system also ensures a more effective recuperation energy utilization, especially when taking into account that in the railway line with proposed solution the train traffic is sparse, and therefore the average catenary receptivity is low. The solution also enables a significant increase of the system reliability. In future work, the most significant is to prepare the proper energy management strategy. The centralized energy management strategy should ensure reliable railway traffic power supply. The number of aspects of system operation should be taken under consideration as a criteria of EMS operation. Especially in the case of the aging effect of lithium-ion batteries, peak power demand and other operations possibly serve on the electric energy market.


