Article

The Effect of Electrospinning Parameters on Piezoelectric PVDF-TrFE Nanofibers: Experimental and Simulation Study

by
Mehdi Pourbafrani
1,
Sara Azimi
1,
Narges Yaghoobi Nia
2,*,
Mahmoud Zendehdel
2 and
Mohammad Mahdi Abolhasani
1,*
1
Chemical Engineering Department, University of Kashan, Kashan 8731753153, Iran
2
Department of Electronics Engineering, University of Rome Tor Vergata, 00133 Rome, Italy
*
Authors to whom correspondence should be addressed.
Energies 2023, 16(1), 37; https://doi.org/10.3390/en16010037
Submission received: 22 October 2022 / Revised: 1 December 2022 / Accepted: 14 December 2022 / Published: 21 December 2022

Abstract

:
Polyvinylidene fluoride and its copolymers can be used as active materials for energy harvesting and environmental sensing. Energy harvesting is one of the most recent research techniques for producing stable electrical energy from mechanical sources. Polyvinylidene fluoride–trifluoroethylene (PVDF-TrFE) is applicable for sensors and self-powered devices such as medical implants and wearable electronic devices. The preparation of electrospun P(VDF-TrFE) nanofibers is of great interest for the fabrication of sensors and self-powered devices, nanogenerators, and sensors. In this regard, it is necessary to investigate the effects of various parameters on the morphology and piezoelectric output voltage of such nanofibers. In this study, we have examined the effect of concentration and feed rate on the nanofiber diameter. It has been found that by increasing the concentration and feed rate of the polymer solution, the diameter of the nanofibers increases. The experimental results and the finite element method (FEM) simulation have also shown consistency; when the nanofiber diameter increases, the output voltage of the nanofibers decreases. This behavior can be related to the strain reduction in the deformed nanofibers.

1. Introduction

Nowadays, the requirement to replace non-renewable sources with clean energy sources has increased. Fossil fuels cause the highest levels of greenhouse gas emissions and environmental pollution [1]. Thus, natural resources such as sunlight and wind have been used to replace fossil fuels. Piezoelectric materials are a new source of clean energy that can be used in self-powered systems to extract mechanical energy and convert it into electrical energy [2,3,4,5,6,7].
Among piezoelectric materials, polymers can withstand more loads [8]. Polyvinylidene fluoride (PVDF) and its copolymers such as polyvinylidene fluoride-trifluoroethylene P(VDF-TrFE), as piezoelectric polymers, are chemically stable and flexible, and they are employed in various applications such as memory devices [9,10], pressure sensors [11,12,13,14,15]; actuators [16,17,18]; and nanogenerators [2,19,20,21,22,23,24]. PVDF has five different polymorphs, namely, the α, β, γ, δ, and ε phases. The piezoelectric property of semi crystalline PVDF arises from the β phase [25,26]. One of the most common techniques to create transitions from the non-polar α phase to the β polar phase is electrospinning [27,28].
Having used PVDF nanofibers, various devices such as LEDs, health-monitoring devices, smartwatches, and other electronic devices have been powered [15,29,30,31,32]. We have employed porous PVDF/graphene nanofibers in pressure sensors that enabled the detection of body movements such as walking, as well as wrist bending and elbow bending [14]. The PVDF/graphene nanogenerator has also shown the ability to fully synchronize finger movement [2]. Azimi et al. have developed a traffic sensor on the basis of a PVDF/TiO2–ZnO piezoelectric nanogenerator coupled with a circuit and a microcontroller for vehicle-passage monitoring [21]. We have also introduced a self-powered pacemaker that is powered by the biomechanical energy harvesting of an animal model using PVDF/rGO–ZnO nanofibers [23].
It has been shown that processing parameters of electrospinning and solution properties can affect the morphology of nanofibers [33,34]. Increasing the concentration of the PVDF solution and the molecular weight of polymers has resulted in the formation of PVDF nanofibers with thicker diameters [35]. Decreasing the feed rate of the PVDF solution has made the resultant PVDF nanofibers thinner [36,37,38]. Increasing the tip-to-collector distance has slightly reduced the average diameter of PVDF nanofibers and increased the uniformity of the nanofiber [39,40,41].
It is well understood that changes in the aforementioned parameters also affect crystallinity, β phase content, and the piezoelectric voltage response [41,42,43,44]. For instance, nanofibers prepared at higher electrospinning voltages have shown higher β-phase content and piezoelectric output voltage [41,45,46,47]. The piezoelectric output voltage of PVDF nanofibers has improved with the increase in the feeding rate up to a certain limitation, and then it decreased [43,48]. Increasing the molecular weight of PVDF has led to a rise in the β-phase content of nanofibers [49,50]. The high value of the relative humidity of the environment has resulted in the formation of PVDF nanofibers with higher β-phase content [51,52,53]. On the other hand, the β-phase content and piezoelectric output voltage of the PVDF nanofibers have been reduced by increasing the electrospinning temperature and tip-to-collector distance [54].
In this study, we aim to investigate the effects of concentration and feed rate on the diameter of P(VDF-TrFE) nanofibers and shed light on the origin of the diameter to piezoelectric voltage interrelationship. In the following, we have employed the finite element method (FEM) to study the effect of the nanofiber diameter on the piezoelectric output voltage of the PVDF-TrFE nanofibers. It has been confirmed that by increasing the concentration and feed rate of polymer solution, the diameter of nanofibers increases. The experimental results and finite element method (FEM) simulation have also shown consistency; when the nanofiber diameter decreases, the piezoelectric output voltage of the nanofibers increases. Additionally, the simulation results show that with increasing nanofiber thickness, the strain of the deformed fibers decreases, which leads to a reduction in output voltage.

2. Materials and Methods

2.1. Materials

P(VDF-TrFE) (70/30) was purchased from Piezotech Arkema. Dimethylformamide (DMF) was supplied from Sigma-Aldrich, St. Louis, MO, USA.

2.2. Preparation of P(VDF-TrFE) Nanofibers

P(VDF-TrFE) solutions with two concentrations (10% and 15% wt.) were prepared by stirring the polymer in DMF at 75 °C for 24 h. The as-prepared solutions were then transferred into a plastic syringe and used for electrospinning under the adjusted operating conditions of 20 kV and 15 cm for spinning voltage and working distance, respectively. The feed rate was also set to 0.5, 1, and 1.5 mL/h. The description of electrospun samples is given in Table 1.

2.3. Fourier Transform Infrared Spectroscopy (FTIR)

To obtain FTIR spectra of the samples, a Bruker 70 device was used. In total, 64 scans were taken from 600 to 2000 cm−1, Tehran, Iran.

2.4. Differential Scanning Calorimetry (DSC)

The crystallinity of the samples was determined by heating the samples from 25 to 220 °C with a heating rate of 10 °C/min using a TA Instrument Q200 DSC method on a Mettler Toledo calorimeter. Tehran, Iran.

2.5. Scanning Electron Microscope (SEM)

The morphology of the nanofibers was observed using a Zeiss Supra TM 55VP SEM after being sputter-coated with gold. ImageJ software was also used to calculate the mean diameters of the nanofibers.

2.6. Piezoelectric Measurements

To study the piezoelectric performance of P(VDF-TrFE) nanogenerators (NGs), samples 20 × 20 × 0.050 mm in size were placed between two aluminum foils. Then, NGs were impacted using a custom-built cyclic impacting device with a frequency of 1 Hz and an impact force of 20 N. The output voltage was measured using an oscilloscope.

2.7. Simulation

It is shown that a poled piezoelectric structure under mechanical impact generates voltage, VOC, which can be calculated using the following equation:
V OC = d 33 ε 0 ε 33 × F A × h
where d33 and ε33 are, respectively, the piezoelectric coefficient and relative permittivity in the direction of the applied force. F is the force, which acts on a piezoelectric. A and h are the area and thickness of the material, respectively [6,32,55,56].
The piezoelectric response of PVDF and PVDF-TrFE is related to the polarization of certain dielectrics in a specific direction under an external force [57,58]. Piezoelectric materials have unique mechanical and electrical coupling characteristics, including a direct piezoelectric effect of charge generated under the action of external mechanical stress and the converse piezoelectric effect of mechanical strain caused by an external electric field, which is usually expressed by the following piezoelectric coupling equation [59]:
S D = S E d t d ε T T E  
where D is electric displacement of charge, E is the electric field strength, S is the mechanical strain, T is the mechanical stress, ε T is permittivity of material under constant stress, S E is the compliance under a constant electrical field, d is the matrix for direct piezoelectric effect, d t is the matrix for reverse piezoelectric effect, and t is the matrix transposition. For the direct piezoelectric effect, electric displacement (D) is caused by stress (T) based on the piezoelectric effect and the internal electric field (E) based on the material’s dielectric permittivity. For the converse piezoelectric effect, strain (S) is caused by stress (T) and the internal electric field based on the converse piezoelectric effect [60]. The matrix form of Equation (2) for the stress-charge form can be depicted as below:
S = S E T   d t E
D = dT + ε T E
E and D are defined as electrical quantities with a vector nature, whereas T and S are mechanical quantities with a tensor nature of six components. The constants in a piezoelectric material referred as d, ε depend on the directions of the electrical field and the displacement, respectively. Different piezoelectric materials exhibit a range of piezoelectric responses. The piezoelectric charge coefficient dij (matrix arrays of d) is a key component of defining a material’s piezoelectric response and represents the amount of charge that is generated in response to applied mechanical stress [60]. In addition to the piezoelectric coupled constitutive equations, the Poisson equations for solving the model have also been used; they are depicted as follows:
. T = F V
. D = ρ V
where F is force, ρ is density, and T is mechanical stress. The potential profile can be extracted with solving elastic, electric, and piezoelectric equations [22,56].
In our study, the simulation geometry systems are cylinders. Such cylinders are the approximation of real nanofibers that have been cut from length. In the following, more details are provided on how to choose the diameter and length of such cylinders.
The finite element method (FEM) has been used to calculate the output voltage of nanofibers under force. FEM is a famous method for numerically solving differential equations arising in engineering and mathematical simulation in two or three space variables [61]. The cylinders have been discretized to very tiny elements (Figure 1a) since the FEM subdivides the large system into smaller, simpler parts that are called finite elements for solving the model. Figure 1b shows the direction of applied force. The lower electrode has been fixed, and the bottom of the P(VDF-TrFE) nanofiber has been electrically grounded. After the structural setup, stress has been defined as an external force equal to a quarter of top of the cylinder. It should be noted that the force applied to the upper part of the cylinder was considered as a pressure equal to 250 kPa.
Under force, the cylinder generates output voltage, which has been simulated with FEM.

3. Results

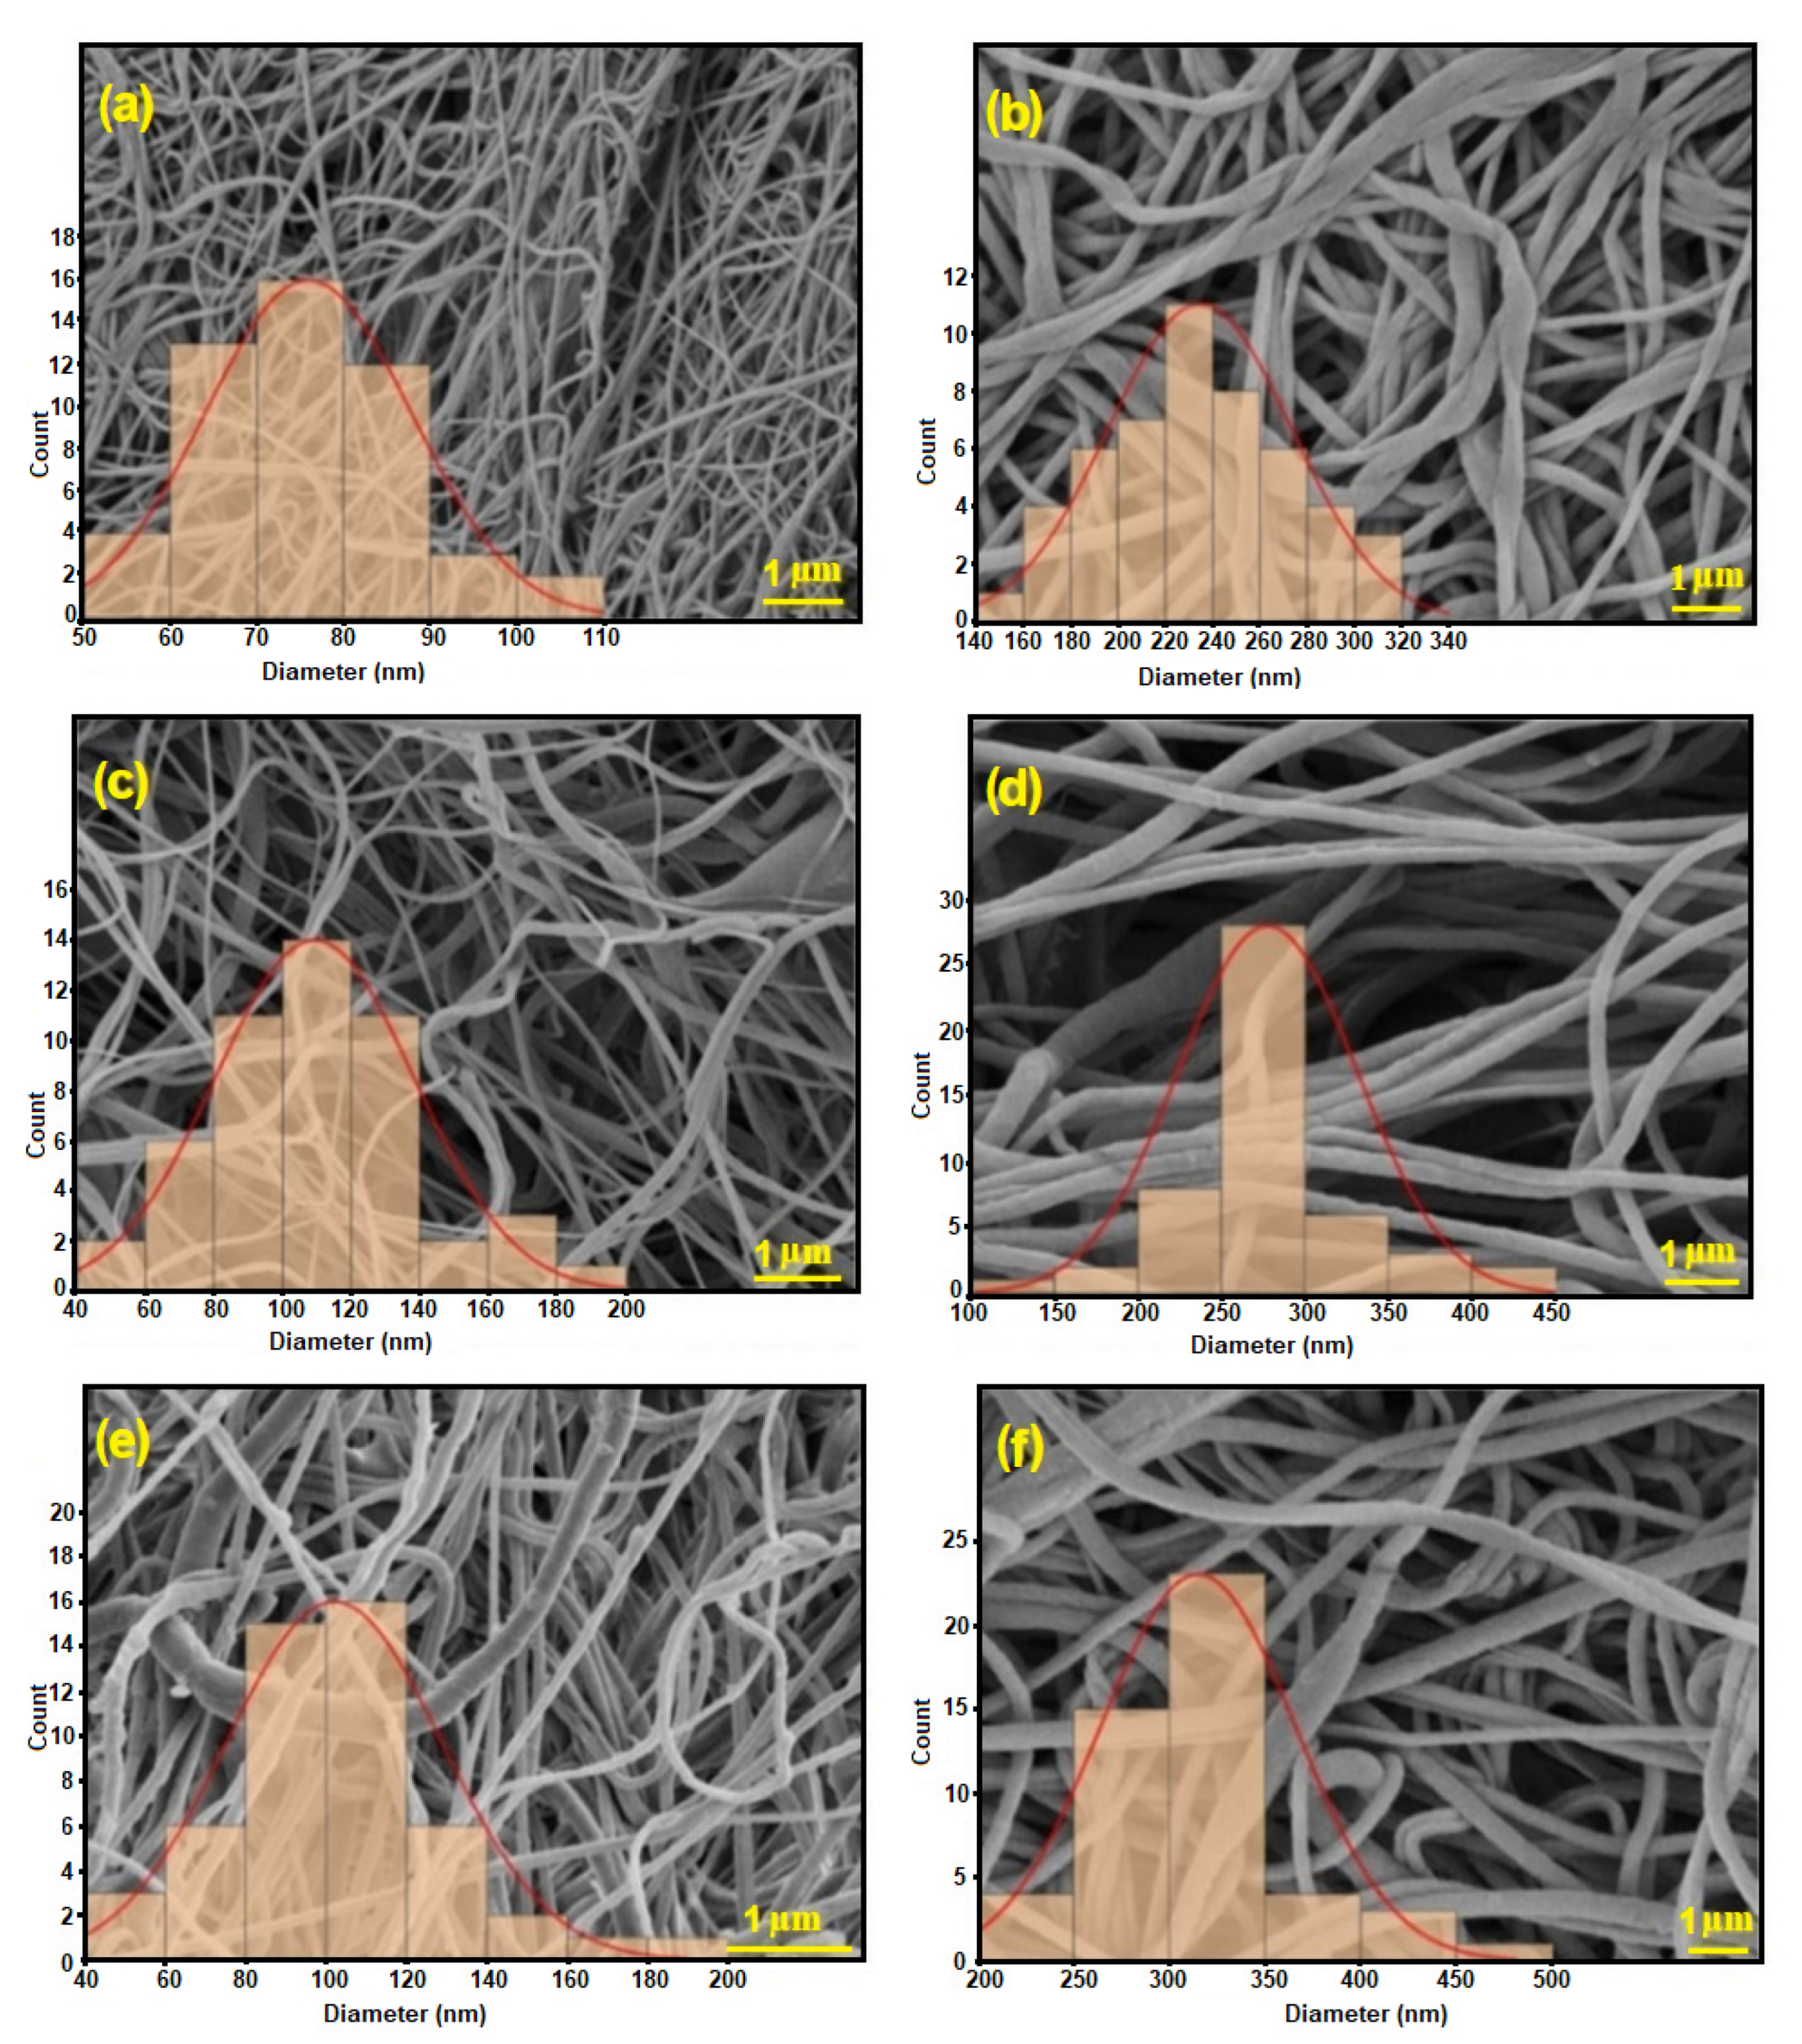
Figure 2 shows histograms and SEM images of bead-free nanofibers related to all cases. As shown in Table 2, at a constant feed rate, applied voltage, and working distance, the nanofiber diameter has increased with an increment in the polymer solution concentration. For instance, the nanofiber diameter has increased from 75 nm for case number 1 to 235 nm for case number 2. Increasing the concentration of the PVDF results in an increase in the viscosity of solution; thus, stretching the solution will be harder due to stronger macromolecular chain entanglement, and thicker nanofibers will be obtained [41]. Furthermore, it is observed that at a constant concentration, applied voltage, and working distance, the nanofiber diameter increases when the feed rate increases due to the lower stretching of the solution jet [54].
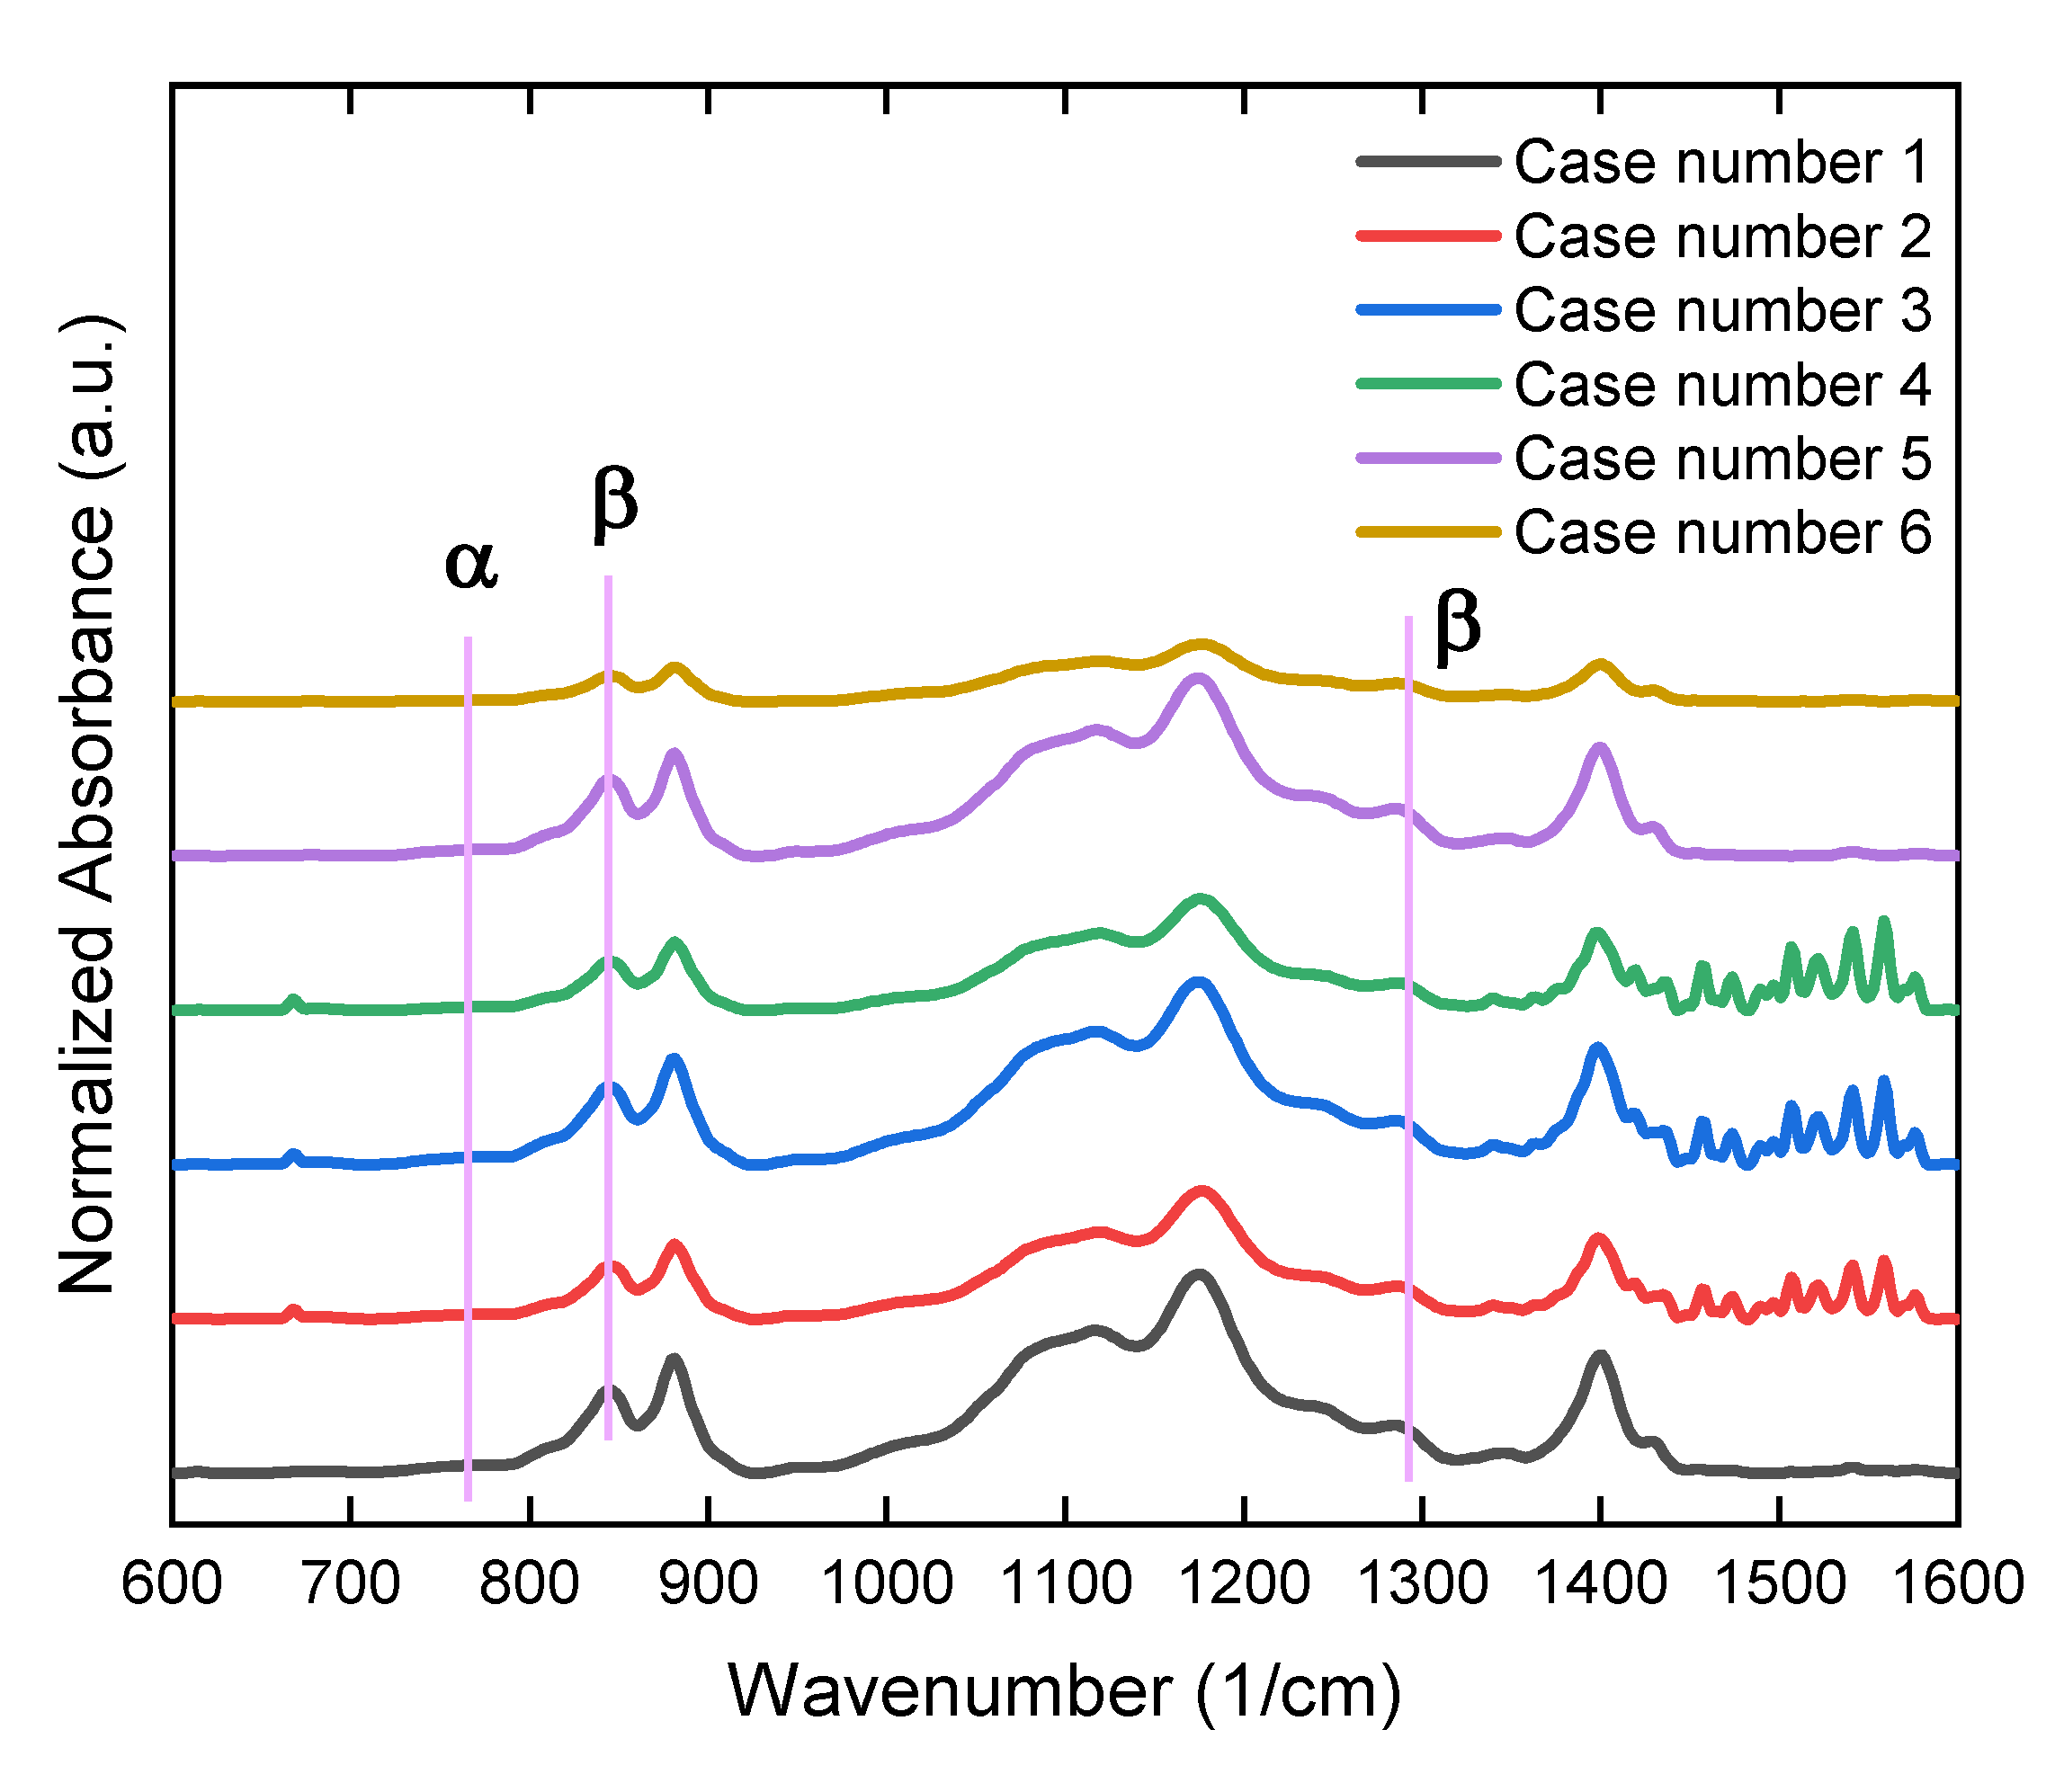
The FTIR spectrums of all of the samples (Figure 3) reveal an α characteristic peak at 763 cm−1 and β characteristic peaks at 840 cm−1 and 1275 cm−1 [62]. To calculate the amount of β phase in the PVDF/TrFE nanofibers, the following equation has been employed [63,64]:
F β = A β 1.26 A α + A β  
where A α and A β are absorption peaks of the α and β polymorphs, respectively. The amount of polar β-phase content of the samples is shown in Table 2. Increasing the concentration causes an increase in the amount of β-phase [65,66]. For instance, at a feed rate of 0.5 mL/h, with an increase in the concentration from 10 to 15%, F(β) increased from 0.9448 to 0.9621. As the concentration of the polymer solution increases, the entanglement between the macromolecular chains increases, which leads to a rise in the viscosity of the solution, and consequently the stretching effect of the electric field on the polymer solution increases and F(β) increases [41,65]. On the other hand, reducing the feed rate increases the β-phase content [54]. Lowering the flow rate causes higher stretching of the solution jet, allowing for the formation of β-phase nuclei [43].
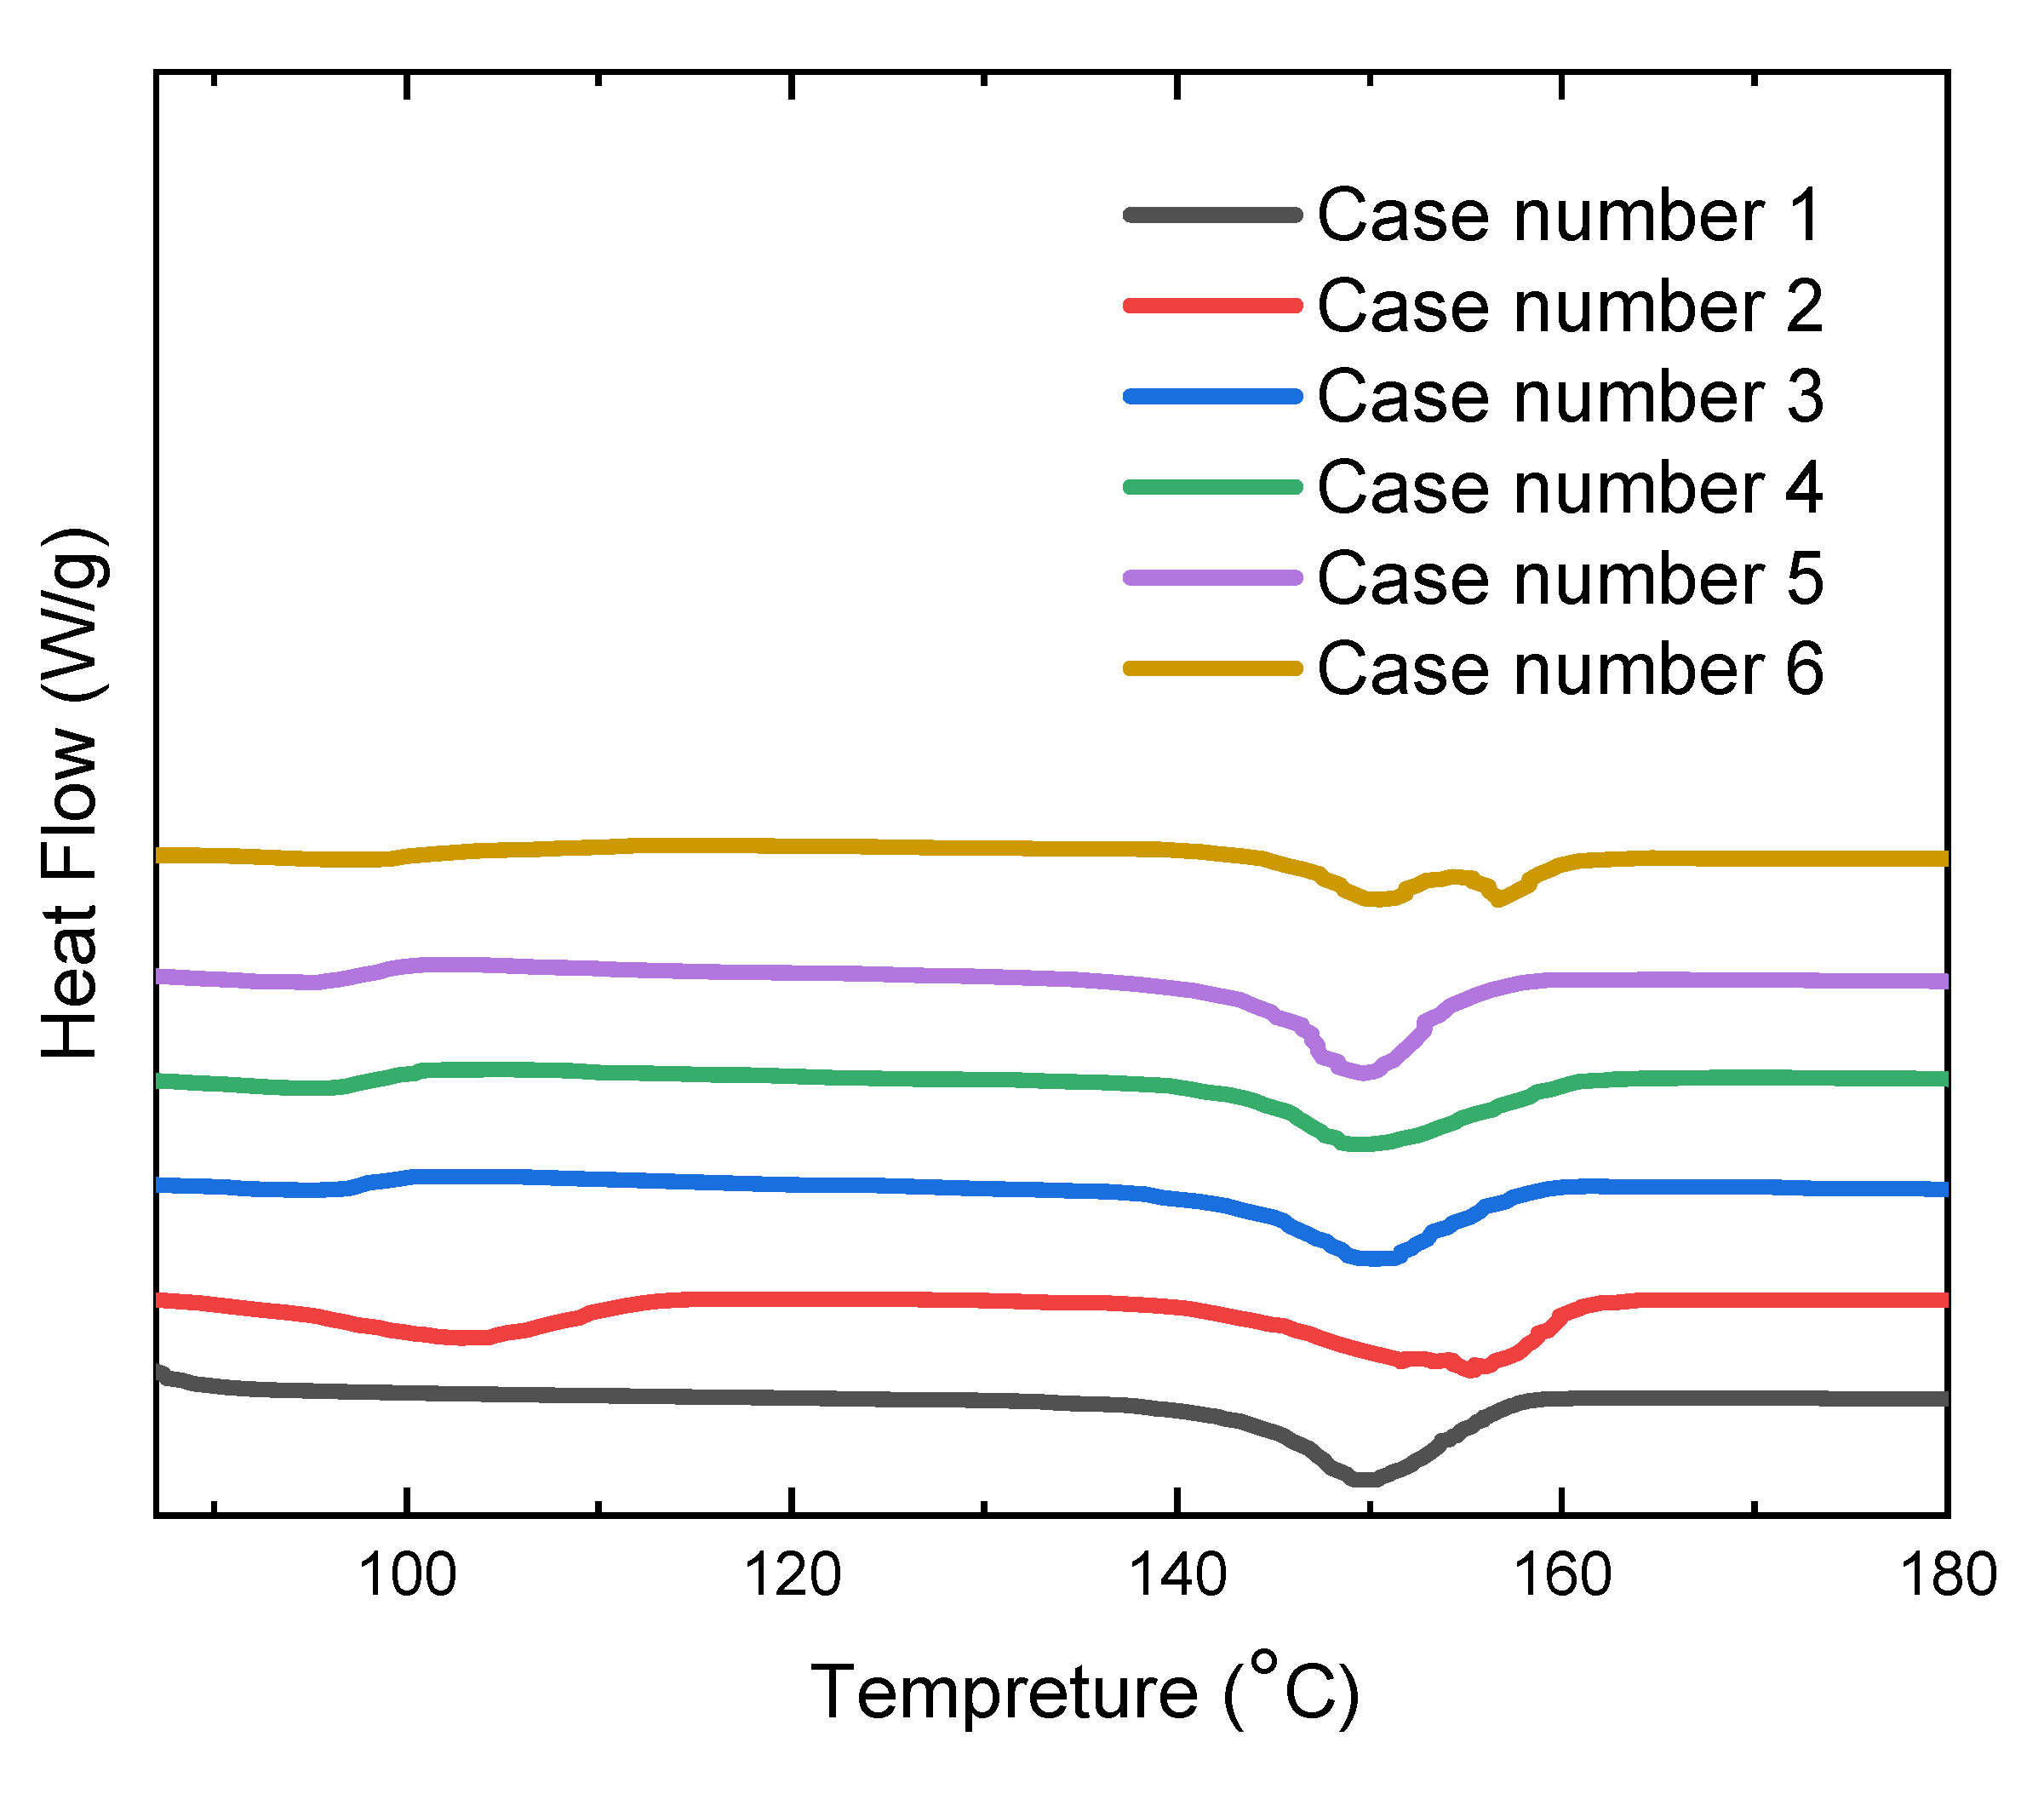
Figure 4 shows the DSC thermograms of P(VDF-TrFE) nanofibers; it can be seen that the melting temperatures of the samples are in the range of 149−155 °C [12,67,68]. To assess the number of crystals in all the samples, the following equation has been used:
Xc = H x α H α + x β H β
where ∆H is the melting enthalpy, and x α and x β are the α and β-phase content, respectively. H α and H β are the melting enthalpies of the 100% crystalline α and β-phases, respectively. Increasing the concentration causes an increase in the amount of crystallinity (Table 2). For instance, at a feed rate of 0.5 mL/h, with an increase in the concentration from 10 to 15%, the crystallinity percentage increased from 0.2152 to 0.2393. When the polymer concentration is increased, the driving force for crystallization increases [69]. Moreover, increasing the feed rate decreases the crystallinity. For instance, at a concentration of 10%, with an increase in the feed rate from 0.5 to 1.0 mL/h, the crystallinity percentage decreases from 0.2152 to 0.2097. Increasing the feed rate leads to the rapid collection of nanofibers on the collector. This rapid collection causes some solvent in the fiber to remain, and the residual solvent in the fiber limits the crystallization process [65,70].
Table 2 also reveals that an increase in the diameter of the nanofibers leads to a decrease in the output voltage under mechanical impacting, which is in agreement with the outcome of previous studies [41,42]. Having compared case number 1 and case number 2, it is found that the output voltage has decreased from 9.3 to 2.3 V with an increase in the nanofiber diameter from 75 to 235 nm. Similarly, such a trend is observed for case number 3 and case number 4, as well as for the case number 5 and case number 6 results.
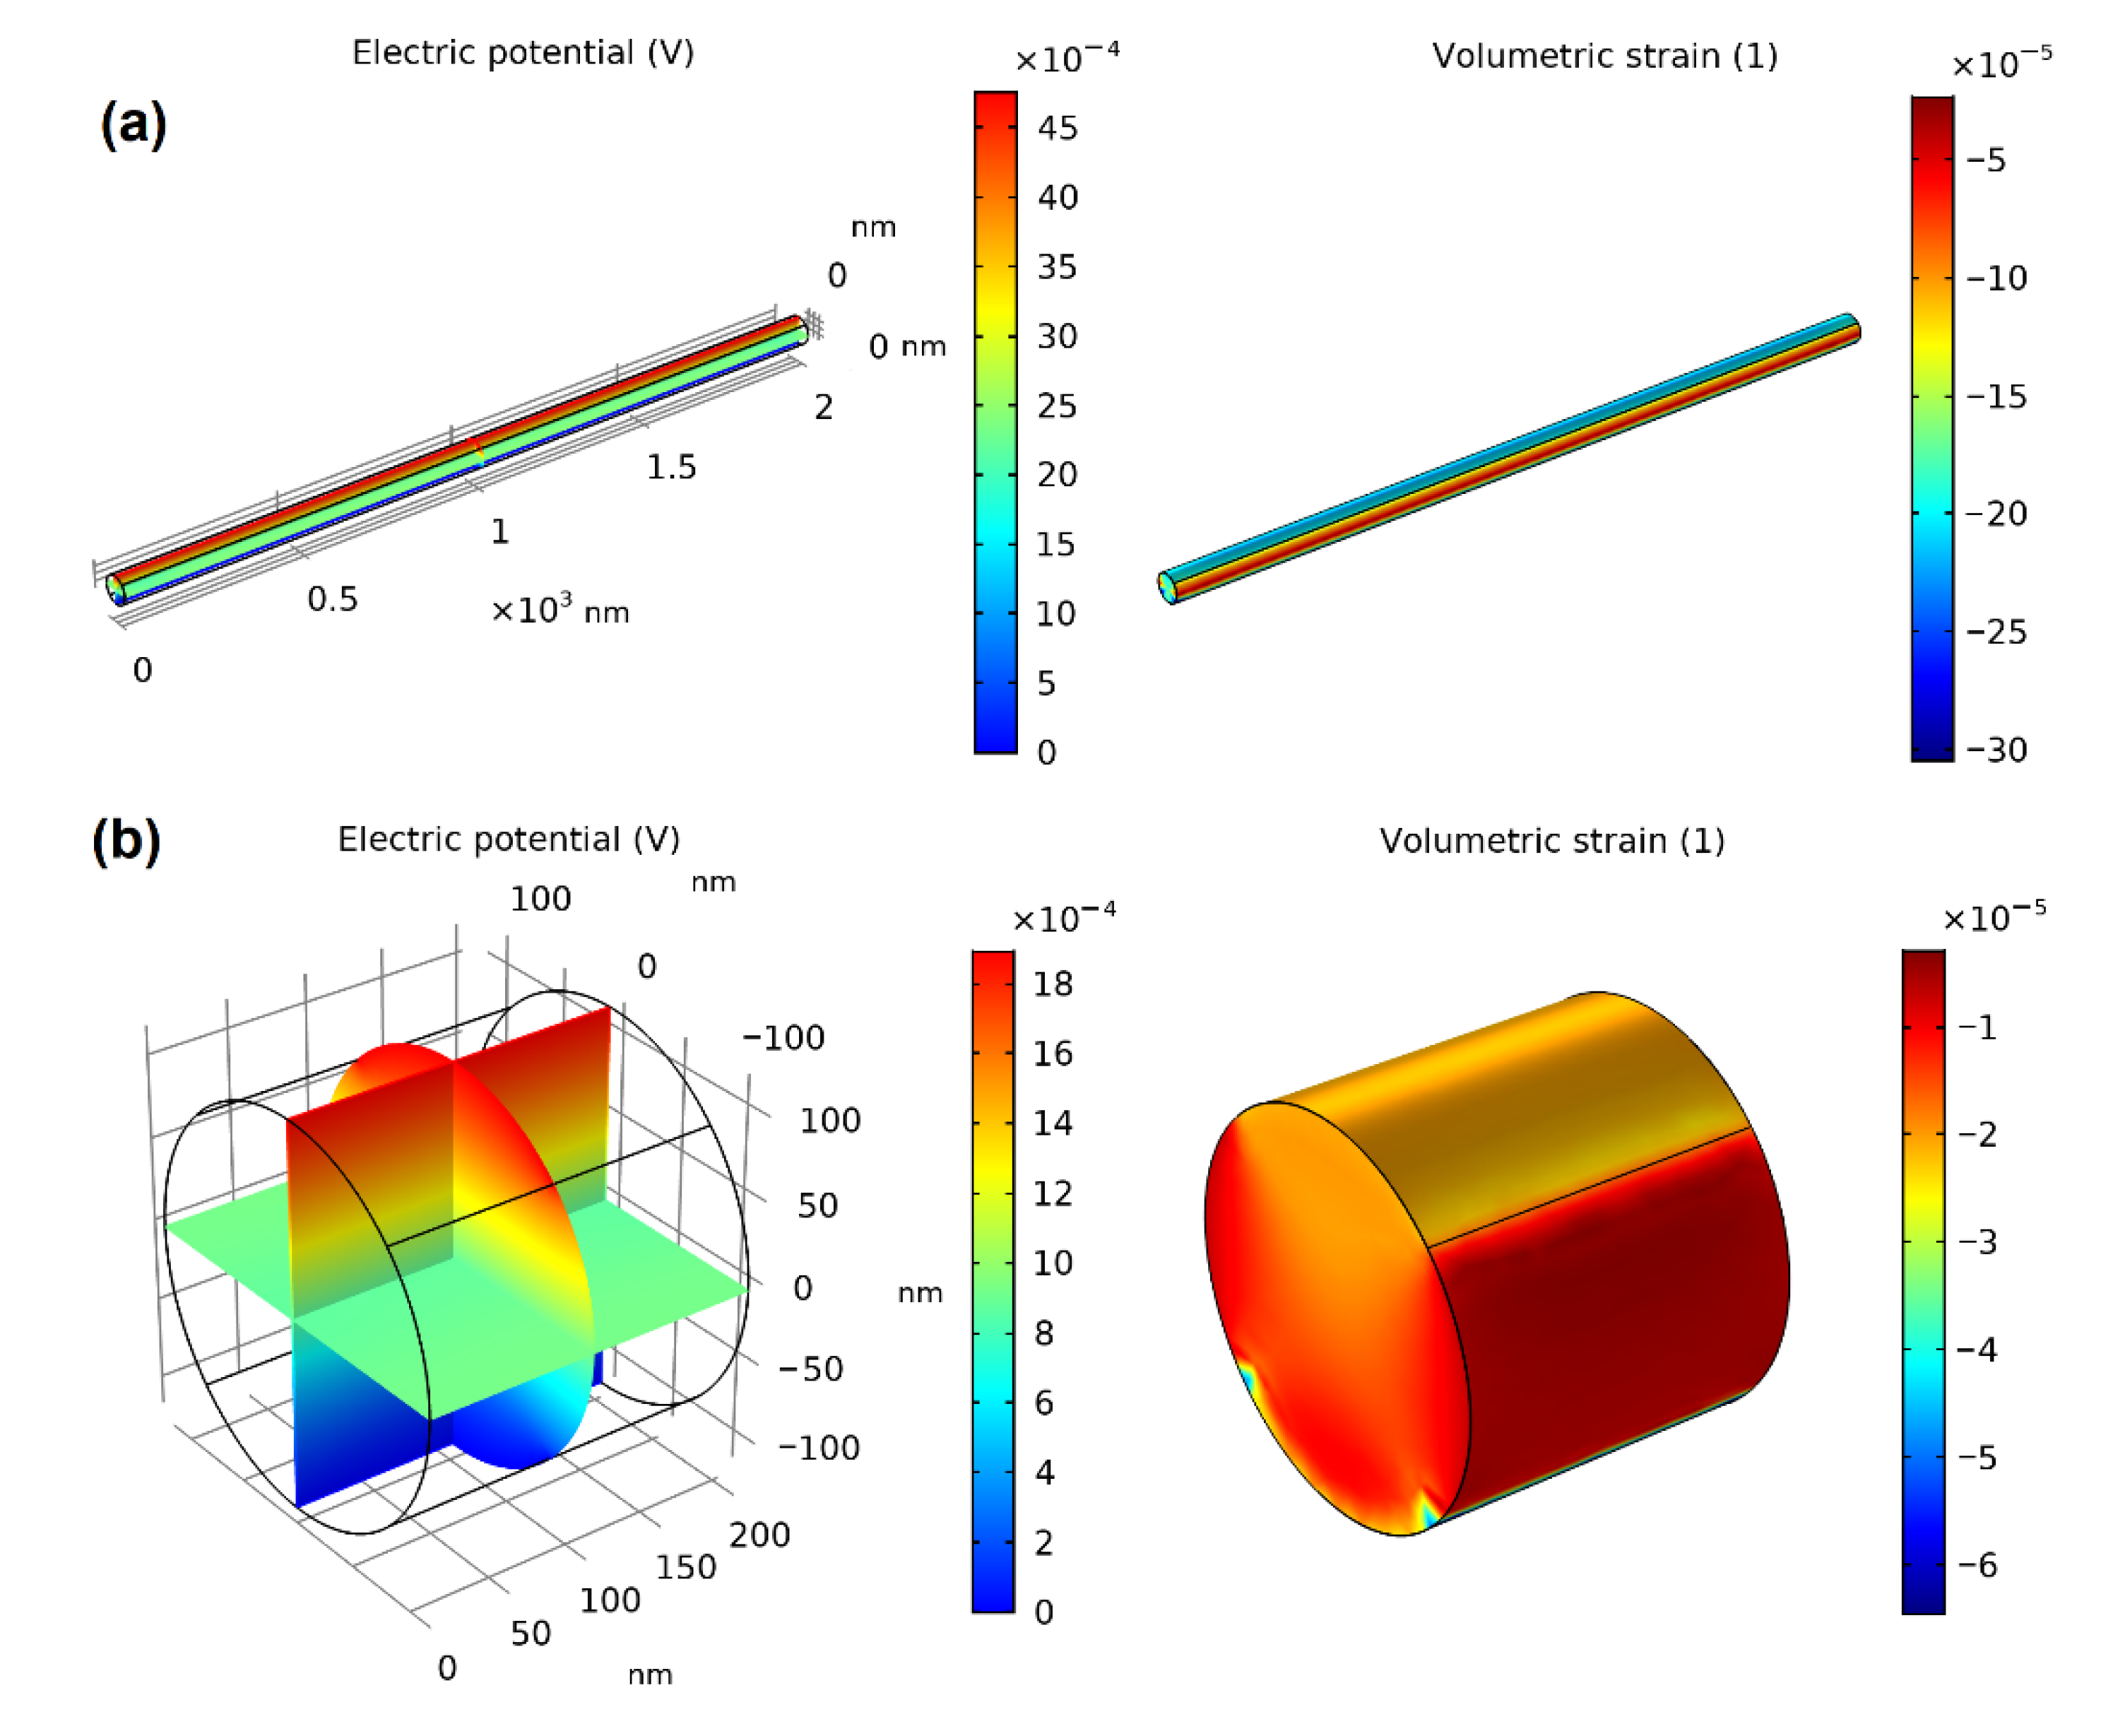
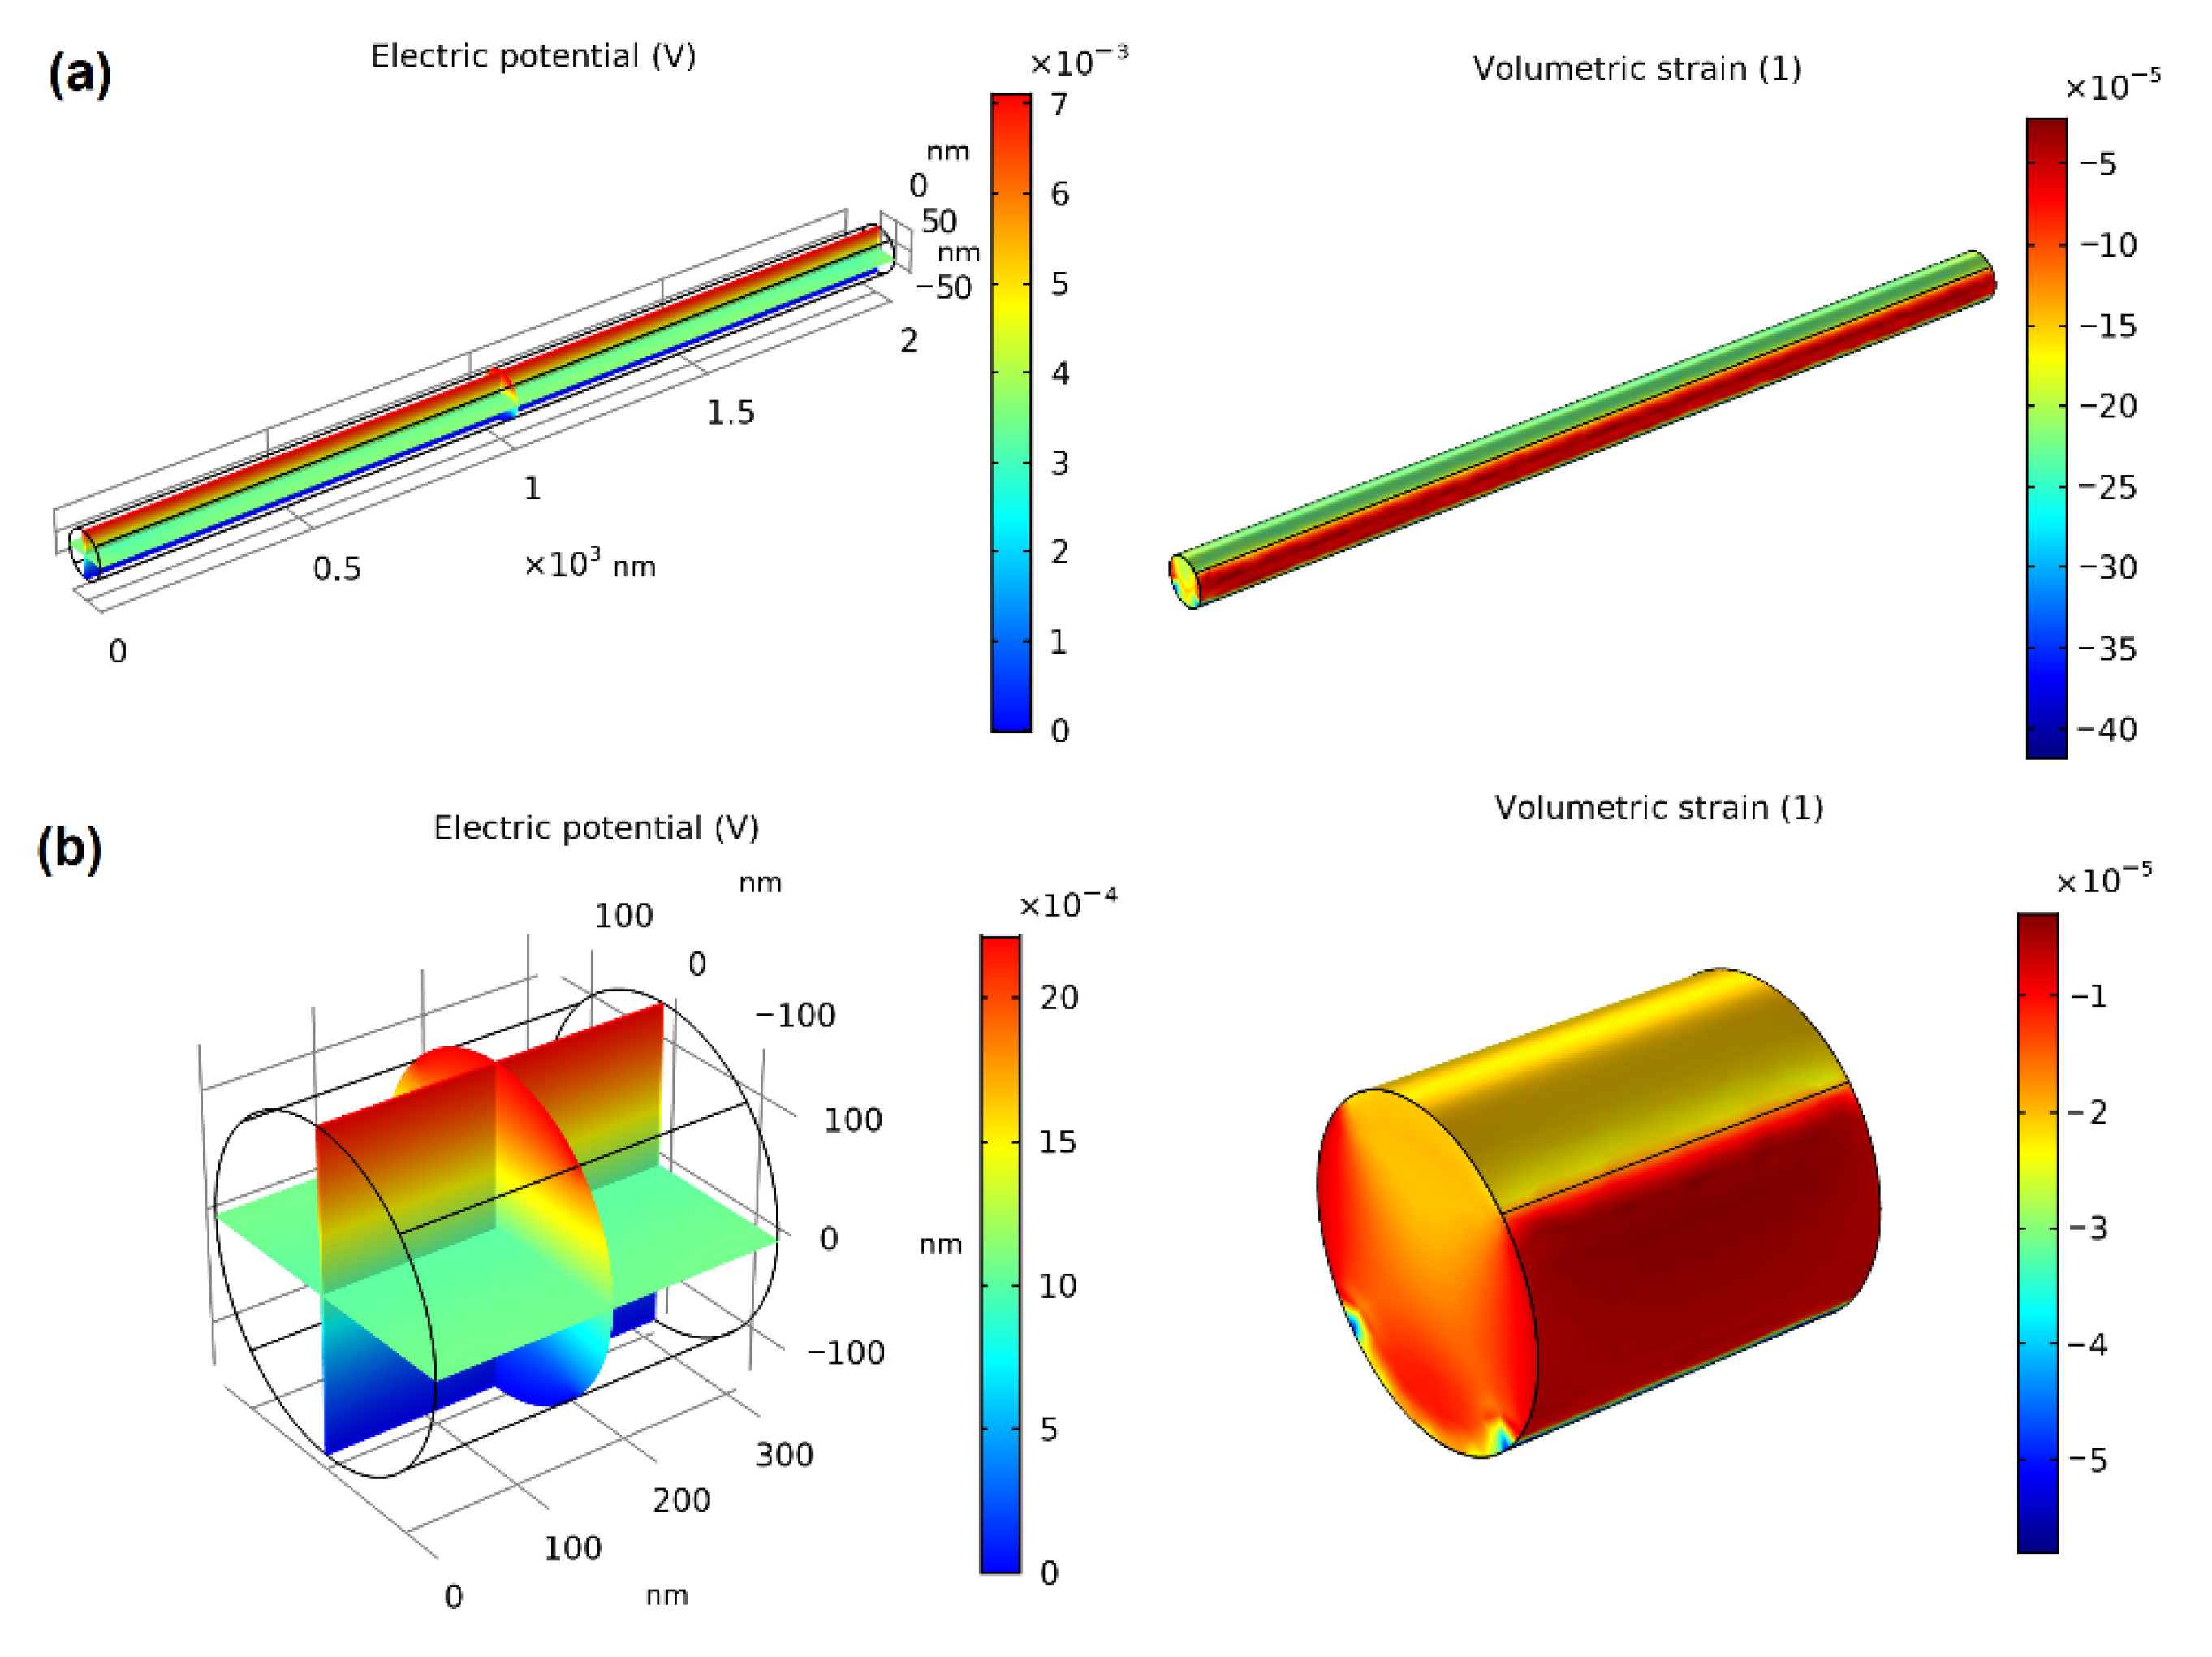
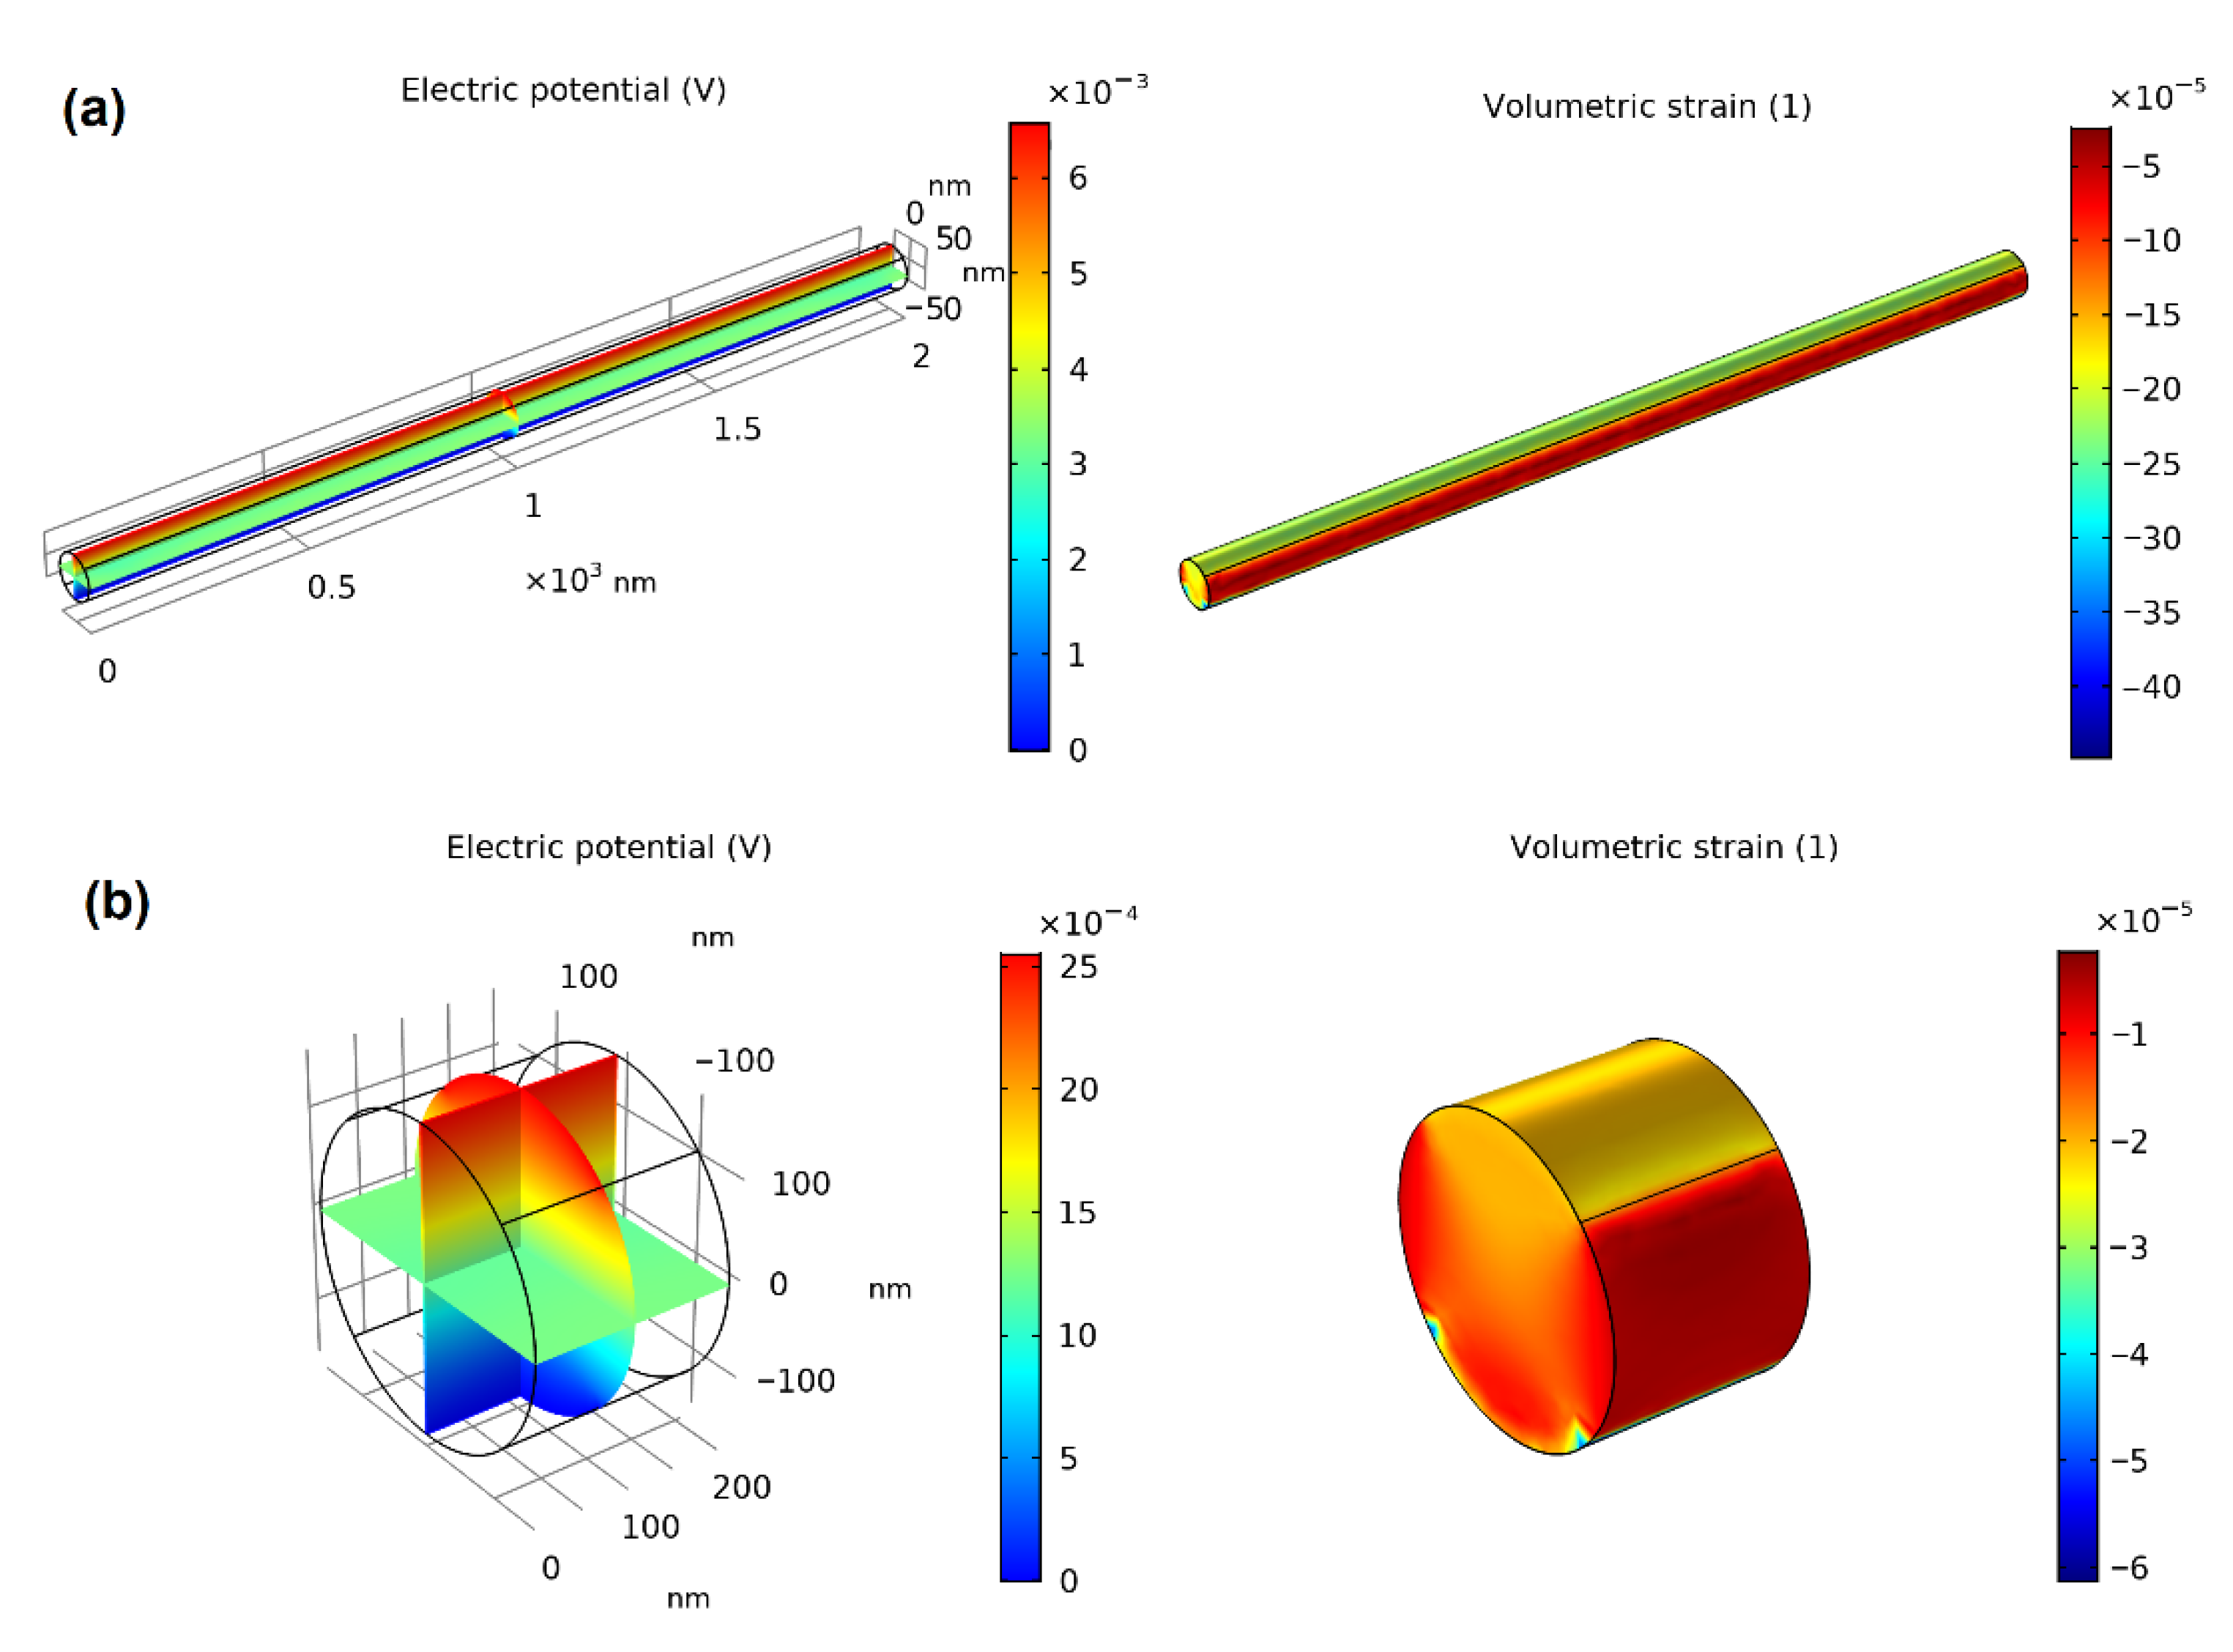
To investigate the effect of the diameter on the output voltage of the nanofibers, all of the samples have been modeled using FEM. To simulate case numbers 1 and 2, two nanofibers with average diameters of 75 and 235 nm and corresponding lengths of 2000 and 204 nm have been designed. It is to be noted that the length adjustment has been carried out for the nanofibers to provide an equal amount of piezoelectric material for the two cases. As can be seen in Figure 5a,b left, simulated voltages for case numbers 1 and 2 are 4.6 × 10⁻³ and 1.8 × 10⁻³ V, respectively. Similarly, case numbers 3 and 4 have been simulated using FEM. For this purpose, two nanofibers with average diameters of 109 and 277 nm and related lengths of 2000 and 310 nm have been designed. It is observed that the simulated voltages for case number 3 and case number 4 are 7.1 × 10⁻³ and 2.2 × 10⁻³ V, respectively (Figure 6a,b left). Furthermore, two nanofibers with average diameters of 101 and 315 nm and corresponding lengths of 2000 and 206 nm have been designed to simulate case numbers 5 and 6, respectively. The simulated results are depicted in Figure 7a,b left, confirming that the output voltage for case number 5 and case number 6 are 6.5 × 10⁻³ and 2.5 × 10⁻³ V, respectively.
The simulation results demonstrate that nanofibers with a lower diameter show higher output voltage, which is in agreement with experimental tests. Therefore, the simulation output results with acceptable approximation provide us with useful information about the effect of the nanofiber diameter on the output voltage. To investigate the origin of the increase in output voltage due to the diameter reduction, the volumetric strains of the fibers have also been simulated (Figure 5, Figure 6 and Figure 7). The increase in diameter in all cases has led to a decrease in volumetric strain. Theoretically, in piezoelectric material, piezoelectric charge coefficient d33 can be explained by the following equation:
d 33 = P ln μ σ 3 lnz σ 3
where μ ,   z ,   and   P are total dipole, thickness, and polarization, respectively. In this equation, ln μ σ 3 is related to the dipole moment of the fiber at constant thickness and lnz σ 3 is related to volumetric strain [71]. It seems that a higher output voltage of thinner nanofibers is related to higher flexibility and higher deformation of nanofibers under force. Increasing the nanofiber diameter could decrease the strain level of the deformed fibers under the same compressive force (Figure 5, Figure 6 and Figure 7), which leads to a decrease in piezoelectric output voltage.

4. Conclusions

In this study, P(VDF-TrFE) nanofibers with different diameters have been prepared under various processing parameters. We have shown that changes in the process parameters and solution properties affect the fiber diameter and piezoelectric output voltage of the related nanogeneartors. It has been revealed that at a constant feed rate, applied voltage, and working distance, by increasing the concentration of the polymer solution, the diameter of the nanofibers increases. Besides constant concentration, applied voltage, and working distance, when the feed rate is increased, the nanofiber diameter increases. Additionally, the piezoelectric measurements show that nanofibers with lower diameters have generated a higher output voltage under mechanical impacting, which is further confirmed by our finite element method (FEM) simulation. Further investigation of the modeling shows that the effect of voltage reduction due to diameter increase can be explained by relating it to strain reduction.

Author Contributions

Conceptualization, S.A., M.Z. and M.M.A.; Methodology, M.M.A.; Formal analysis, S.A.; Investigation, M.P.; Data curation, M.P.; Writing—original draft, M.P. and S.A.; Writing—review & editing, N.Y.N., M.Z. and M.M.A.; Visualization, N.Y.N.; Supervision, M.M.A.; Project administration, M.M.A.; Funding acquisition, M.M.A. All authors have read and agreed to the published version of the manuscript.

Funding

This research received no external funding.

Acknowledgments

M.P., S.A. and M.M.A would like to thank University of Kashan for the support.

Conflicts of Interest

The authors declare no conflict of interest.

References

  1. Ritchie, H.; Roser, M.; Rosado, P. CO2 and Greenhouse Gas Emissions; Our World in Data: Oxford, UK, 2020. [Google Scholar]
  2. Abolhasani, M.M.; Shirvanimoghaddam, K.; Naebe, M. PVDF/graphene composite nanofibers with enhanced piezoelectric performance for development of robust nanogenerators. Compos. Sci. Technol. 2017, 138, 49–56. [Google Scholar] [CrossRef] [Green Version]
  3. Anwar, S.; Hassanpour Amiri, M.; Jiang, S.; Abolhasani, M.M.; Rocha, P.R.; Asadi, K. Piezoelectric nylon-11 fibers for electronic textiles, energy harvesting and sensing. Adv. Funct. Mater. 2021, 31, 2004326. [Google Scholar] [CrossRef]
  4. Shirvanimoghaddam, M.; Abolhasani, M.M.; Farhangi, M.; Barsari, V.Z.; Liu, H.; Dohler, M.; Naebe, M. Towards a green and self-powered Internet of Things using piezoelectric energy harvesting. IEEE Access 2019, 7, 94533–94556. [Google Scholar] [CrossRef]
  5. Kan, J.; Fan, C.; Wang, S.; Zhang, Z.; Wen, J.; Huang, L. Study on a piezo-windmill for energy harvesting. Renew. Energy 2016, 97, 210–217. [Google Scholar] [CrossRef]
  6. Liu, H.; Zhong, J.; Lee, C.; Lee, S.-W.; Lin, L. A comprehensive review on piezoelectric energy harvesting technology: Materials, mechanisms, and applications. Appl. Phys. Rev. 2018, 5, 041306. [Google Scholar] [CrossRef] [Green Version]
  7. Ali, F.; Raza, W.; Li, X.; Gul, H.; Kim, K.-H. Piezoelectric energy harvesters for biomedical applications. Nano Energy 2019, 57, 879–902. [Google Scholar] [CrossRef]
  8. Anton, S.R.; Sodano, H.A. A review of power harvesting using piezoelectric materials (2003–2006). Smart Mater. Struct. 2007, 16, R1. [Google Scholar] [CrossRef]
  9. Youn Jung, P.; In-sung, B.; Seok, J.K.; Jiyoun, C.; Cheolmin, P. Control of thin ferroelectric polymer films for non-volatile memory applications. IEEE Trans. Dielectr. Electr. Insul. 2010, 17, 1135–1163. [Google Scholar]
  10. Lee, G.-G.; Tokumitsu, E.; Yoon, S.M.; Fujisaki, Y.; Yoon, J.W.; Ishiwara, H. The flexible non-volatile memory devices using oxide semiconductors and ferroelectric polymer poly (vinylidene fluoride-trifluoroethylene). Appl. Phys. Lett. 2011, 99, 012901. [Google Scholar] [CrossRef]
  11. Sharma, T.; Je, S.-S.; Gill, B.; Zhang, J.X. Patterning piezoelectric thin film PVDF–TrFE based pressure sensor for catheter application. Sens. Actuators A Phys. 2012, 177, 87–92. [Google Scholar] [CrossRef]
  12. Zhu, M.; Chng, S.S.; Cai, W.; Liu, C.; Du, Z. Piezoelectric polymer nanofibers for pressure sensors and their applications in human activity monitoring. RSC Adv. 2020, 10, 21887–21894. [Google Scholar] [CrossRef] [PubMed]
  13. Yuan, X.; Yan, A.; Lai, Z.; Liu, Z.; Yu, Z.; Li, Z.; Cao, Y.; Dong, S. A poling-free PVDF nanocomposite via mechanically directional stress field for self-powered pressure sensor application. Nano Energy 2022, 98, 107340. [Google Scholar]
  14. Abolhasani, M.M.; Azimi, S.; Mousavi, M.; Anwar, S.; Amiri, M.H.; Shirvanimoghaddam, K.; Naebe, M.; Michels, J.; Asadi, K. Porous graphene/poly (vinylidene fluoride) nanofibers for pressure sensing. J. Appl. Polym. Sci. 2022, 139, 51907. [Google Scholar] [CrossRef]
  15. Wang, Z.; Tan, L.; Pan, X.; Liu, G.; He, Y.; Jin, W.; Li, M.; Hu, Y.; Gu, H. Self-powered viscosity and pressure sensing in microfluidic systems based on the piezoelectric energy harvesting of flowing droplets. ACS Appl. Mater. Interfaces 2017, 9, 28586–28595. [Google Scholar] [CrossRef] [PubMed]
  16. Pérez, R.; Král, M.; Bleuler, H. Study of polyvinylidene fluoride (PVDF) based bimorph actuators for laser scanning actuation at kHz frequency range. Sens. Actuators A Phys. 2012, 183, 84–94. [Google Scholar] [CrossRef]
  17. Merry, R.J.; de Kleijn, N.C.T.; van de Molengraft, M.J.G.; Steinbuch, M. Using a walking piezo actuator to drive and control a high-precision stage. IEEE ASME Trans. Mechatron. 2009, 14, 21–31. [Google Scholar] [CrossRef]
  18. Ushijima, T.; Kumakawa, S. Active Engine Mount with Piezo-Actuator for Vibration Control; SAE Technical Paper; SAE: Warrendale, PA, USA, 1993. [Google Scholar]
  19. Chang, C.; Tran, V.H.; Wang, J.; Fuh, Y.-K.; Lin, L. Direct-write piezoelectric polymeric nanogenerator with high energy conversion efficiency. Nano Lett. 2010, 10, 726–731. [Google Scholar] [CrossRef]
  20. Abolhasani, M.M.; Naebe, M.; Amiri, M.H.; Shirvanimoghaddam, K.; Anwar, S.; Michels, J.J.; Asadi, K. Hierarchically structured porous piezoelectric polymer nanofibers for energy harvesting. Adv. Sci. 2020, 7, 2000517. [Google Scholar]
  21. Azimi, S.; Abolhasani, A.; Moosavi, S.M.; Vanaei, F.; Jafari, A.; Samimi-Sohrforozani, E.; Rayati, M.T.; Noori, E.; Rafiee, E.; Javadi, A.; et al. Development of a Vehicle Passage Sensor Based on a PVDF Nanogenerator. ACS Appl. Electron. Mater. 2021, 3, 4689–4698. [Google Scholar] [CrossRef]
  22. Chen, X.; Tian, H.; Li, X.; Shao, J.; Ding, Y.; An, N.; Zhou, Y. A high performance P (VDF-TrFE) nanogenerator with self-connected and vertically integrated fibers by patterned EHD pulling. Nanoscale 2015, 7, 11536–11544. [Google Scholar] [CrossRef]
  23. Azimi, S.; Golabchi, A.; Nekookar, A.; Rabbani, S.; Amiri, M.H.; Asadi, K.; Abolhasani, M.M. Self-powered cardiac pacemaker by piezoelectric polymer nanogenerator implant. Nano Energy 2021, 83, 105781. [Google Scholar] [CrossRef]
  24. Abolhasani, M.M.; Naebe, M.; Shirvanimoghaddam, K.; Fashandi, H.; Khayyam, H.; Joordens, M.; Pipertzis, A.; Anwar, S.; Berger, R.; Floudas, G.; et al. Thermodynamic approach to tailor porosity in piezoelectric polymer fibers for application in nanogenerators. Nano Energy 2019, 62, 594–600. [Google Scholar] [CrossRef]
  25. Lovinger, A.J. Poly (vinylidene fluoride). In Developments in Crystalline Polymers—1; Springer: Dordrecht, The Netherlands, 1982; pp. 195–273. [Google Scholar]
  26. Ribeiro, C.; Sencadas, V.; Ribelles, J.L.G.; Lanceros-Méndez, S. Influence of processing conditions on polymorphism and nanofiber morphology of electroactive poly (vinylidene fluoride) electrospun membranes. Soft Mater. 2010, 8, 274–287. [Google Scholar] [CrossRef]
  27. Li, D.; Xia, Y. Electrospinning of nanofibers: Reinventing the wheel? Adv. Mater. 2004, 16, 1151–1170. [Google Scholar] [CrossRef]
  28. Al-Dhahebi, A.M.; Gopinath, S.C.B.; Saheed, M.S.M. Graphene impregnated electrospun nanofiber sensing materials: A comprehensive overview on bridging laboratory set-up to industry. Nano Converg. 2020, 7, 27. [Google Scholar] [CrossRef]
  29. Oğuzcan, H.Ç.; Beyaz, M.İ. Design and experimental validation of a stress-controlled pressure sensor for wearable pulse monitoring. In Proceedings of the 2021 IEEE International Symposium on Applications of Ferroelectrics (ISAF), Sydney, Australia, 16–21 May 2021. [Google Scholar]
  30. Iqbal, M.; Nauman, M.M.; Khan, F.U.; Abas, P.E.; Cheok, Q.; Iqbal, A.; Aissa, B. Multimodal hybrid piezoelectric-electromagnetic insole energy harvester using PVDF generators. Electronics 2020, 9, 635. [Google Scholar] [CrossRef] [Green Version]
  31. Gu, H.; Zhao, Y.; Wang, M.L. A wireless smart PVDF sensor for structural health monitoring. Struct. Control Health Monit. Off. J. Int. Assoc. Struct. Control Monit. Eur. Assoc. Control Struct. 2005, 12, 329–343. [Google Scholar] [CrossRef]
  32. Sezer, N.; Koç, M. A comprehensive review on the state-of-the-art of piezoelectric energy harvesting. Nano Energy 2021, 80, 105567. [Google Scholar] [CrossRef]
  33. Yin, J.-Y.; Boaretti, C.; Lorenzetti, A.; Martucci, A.; Roso, M.; Modesti, M. Effects of Solvent and Electrospinning Parameters on the Morphology and Piezoelectric Properties of PVDF Nanofibrous Membrane. Nanomaterials 2022, 12, 962. [Google Scholar] [CrossRef]
  34. Samimi-Sohrforozani, E.; Azimi, S.; Abolhasani, A.; Malekian, S.; Arbab, S.; Zendehdel, M.; Abolhasani, M.M.; Nia, N.Y. Development of Porous Polyacrylonitrile Composite Fibers: New Precursor Fibers with High Thermal Stability. Electron. Mater. 2021, 2, 454–465. [Google Scholar] [CrossRef]
  35. Mitchell, G.R. Electrospinning: Principles, Practice and Possibilities; Royal Society of Chemistry: London, UK, 2015. [Google Scholar]
  36. Fang, J.; Niu, H.; Wang, H.; Wang, X.; Lin, T. Enhanced mechanical energy harvesting using needleless electrospun poly (vinylidene fluoride) nanofibre webs. Energy Environ. Sci. 2013, 6, 2196–2202. [Google Scholar] [CrossRef]
  37. Nasir, M.; Matsumoto, H.; Danno, T.; Minagawa, M.; Irisawa, T.; Shioya, M.; Tanioka, A. Control of diameter, morphology, and structure of PVDF nanofiber fabricated by electrospray deposition. J. Polym. Sci. Part B Polym. Phys. 2006, 44, 779–786. [Google Scholar] [CrossRef]
  38. Pise, D.D.; Ahuja, B.; Shendokar, S. Study of process parameters affecting the diameter and morphology of electrospun polyvinylidene fluoride (PVDF) nanofibers. Int. J. Sci. Res. 2015, 4, 155–160. [Google Scholar]
  39. Motamedi, A.S.; Mirzadeh, H.; Hajiesmaeilbaigi, F.; Bagheri-Khoulenjani, S.; Shokrgozar, M. Effect of electrospinning parameters on morphological properties of PVDF nanofibrous scaffolds. Prog. Biomater. 2017, 6, 113–123. [Google Scholar] [CrossRef]
  40. Zulfikar, M.; Afrianingsih, I.; Nasir, M.; Alni, A. Effect of processing parameters on the morphology of PVDF electrospun nanofiber. J. Phys. Conf. Ser. 2018, 987, 012011. [Google Scholar] [CrossRef]
  41. Shao, H.; Fang, J.; Wang, H.; Lin, T. Effect of electrospinning parameters and polymer concentrations on mechanical-to-electrical energy conversion of randomly-oriented electrospun poly (vinylidene fluoride) nanofiber mats. RSC Adv. 2015, 5, 14345–14350. [Google Scholar] [CrossRef]
  42. Andrew, J.; Clarke, D. Effect of electrospinning on the ferroelectric phase content of polyvinylidene difluoride fibers. Langmuir 2008, 24, 670–672. [Google Scholar] [CrossRef]
  43. Jiyong, H.; Yuanyuan, G.; Hele, Z.; Yinda, Z.; Xudong, Y. Effect of electrospinning parameters on piezoelectric properties of electrospun PVDF nanofibrous mats under cyclic compression. J. Text. Inst. 2018, 109, 843–850. [Google Scholar] [CrossRef]
  44. Huang, F.; Wei, Q.; Wang, J.; Cai, Y.; Huang, Y. Effect of temperature on structure, morphology and crystallinity of PVDF nanofibers via electrospinning. e-Polymers 2008, 8, 1758–1765. [Google Scholar] [CrossRef]
  45. Mokhtari, F.; Latifi, M.; Shamshirsaz, M. Electrospinning/electrospray of polyvinylidene fluoride (PVDF): Piezoelectric nanofibers. J. Text. Inst. 2016, 107, 1037–1055. [Google Scholar] [CrossRef]
  46. Wang, X.; Ding, X.; Lang, C.; Hu, J.; Yang, X.; Pan, H. Signal responses of PVDF electrospun fiber web under dynamic compression. Tech. Text. 2015, 33, 16–19. [Google Scholar]
  47. Damaraju, S.M.; Wu, S.; Jaffe, M.; Arinzeh, T.L. Structural changes in PVDF fibers due to electrospinning and its effect on biological function. Biomed. Mater. 2013, 8, 045007. [Google Scholar] [CrossRef]
  48. Wang, Y.; Zheng, J.M.; Ren, G.Y.; Zhang, P.H.; Xu, C. A flexible piezoelectric force sensor based on PVDF fabrics. Smart Mater. Struct. 2011, 20, 045009. [Google Scholar] [CrossRef]
  49. Magniez, K.; De Lavigne, C.; Fox, B. The effects of molecular weight and polymorphism on the fracture and thermo-mechanical properties of a carbon-fibre composite modified by electrospun poly (vinylidene fluoride) membranes. Polymer 2010, 51, 2585–2596. [Google Scholar] [CrossRef]
  50. Zaarour, B.; Zhu, L.; Jin, X. Controlling the surface structure, mechanical properties, crystallinity, and piezoelectric properties of electrospun PVDF nanofibers by maneuvering molecular weight. Soft Mater. 2019, 17, 181–189. [Google Scholar] [CrossRef]
  51. Cozza, E.S.; Monticelli, O.; Marsano, E.; Cebe, P. On the electrospinning of PVDF: Influence of the experimental conditions on the nanofiber properties. Polym. Int. 2013, 62, 41–48. [Google Scholar] [CrossRef]
  52. Zaarour, B.; Zhu, L.; Huang, C.; Jin, X. Fabrication of a polyvinylidene fluoride cactus-like nanofiber through one-step electrospinning. RSC Adv. 2018, 8, 42353–42360. [Google Scholar] [CrossRef] [Green Version]
  53. Slack, J.J.; Brodt, M.; Cullen, D.A.; Reeves, K.S.; More, K.L.; Pintauro, P.N. Impact of polyvinylidene fluoride on nanofiber cathode structure and durability in proton exchange membrane fuel cells. J. Electrochem. Soc. 2020, 167, 054517. [Google Scholar] [CrossRef]
  54. Zheng, J.; He, A.; Li, J.; Han, C.C. Polymorphism control of poly (vinylidene fluoride) through electrospinning. Macromol. Rapid Commun. 2007, 28, 2159–2162. [Google Scholar] [CrossRef]
  55. He, F.; Lau, S.; Chan, H.L.; Fan, J. High dielectric permittivity and low percolation threshold in nanocomposites based on poly (vinylidene fluoride) and exfoliated graphite nanoplates. Adv. Mater. 2009, 21, 710–715. [Google Scholar] [CrossRef]
  56. Lefki, K.; Dormans, G. Measurement of piezoelectric coefficients of ferroelectric thin films. J. Appl. Phys. 1994, 76, 1764–1767. [Google Scholar] [CrossRef]
  57. Murayama, N.; Nakamura, K.; Obara, H.; Segawa, M. The strong piezoelectricity in polyvinylidene fluroide (PVDF). Ultrasonics 1976, 14, 15–24. [Google Scholar] [CrossRef]
  58. Bera, B.; Sarkar, M.D. Piezoelectricity in PVDF and PVDF based piezoelectric nanogenerator: A concept. IOSR J. Appl. Phys. 2017, 9, 95–99. [Google Scholar] [CrossRef]
  59. Singh, S.; Singh, I.V. Analysis of cracked functionally graded piezoelectric material using XIGA. Eng. Fract. Mech. 2020, 230, 107015. [Google Scholar] [CrossRef]
  60. Kepler, R.; Anderson, R. Piezoelectricity in polymers. Crit. Rev. Solid State Mater. Sci. 1980, 9, 399–447. [Google Scholar] [CrossRef]
  61. Logan, D.L. A First Course in the Finite Element Method; Cengage Learning: Boston, MA, USA, 2016. [Google Scholar]
  62. Cai, X.; Lei, T.; Sun, D.; Lin, L. A critical analysis of the α, β and γ phases in poly (vinylidene fluoride) using FTIR. RSC Adv. 2017, 7, 15382–15389. [Google Scholar] [CrossRef] [Green Version]
  63. Baqeri, M.; Abolhasani, M.M.; Mozdianfard, M.R.; Guo, Q.; Oroumei, A.; Naebe, M. Influence of processing conditions on polymorphic behavior, crystallinity, and morphology of electrospun poly (VInylidene fluoride) nanofibers. J. Appl. Polym. Sci. 2015, 132, 42304. [Google Scholar] [CrossRef]
  64. Martins, P.; Lopes, A.; Lanceros-Mendez, S. Electroactive phases of poly (vinylidene fluoride): Determination, processing and applications. Prog. Polym. Sci. 2014, 39, 683–706. [Google Scholar] [CrossRef]
  65. He, Z.; Rault, F.; Lewandowski, M.; Mohsenzadeh, E.; Salaün, F. Electrospun PVDF nanofibers for piezoelectric applications: A review of the influence of electrospinning parameters on the β phase and crystallinity enhancement. Polymers 2021, 13, 174. [Google Scholar] [CrossRef]
  66. Baji, A.; Mai, Y.-W.; Li, Q.; Liu, Y. Electrospinning induced ferroelectricity in poly (vinylidene fluoride) fibers. Nanoscale 2011, 3, 3068–3071. [Google Scholar] [CrossRef]
  67. Li, Z.; Wang, J.; Wang, X.; Yang, Q.; Zhang, Z. Ferro-and piezo-electric properties of a poly (vinyl fluoride) film with high ferro-to para-electric phase transition temperature. RSC Adv. 2015, 5, 80950–80955. [Google Scholar] [CrossRef]
  68. Whiter, R.A.; Calahorra, Y.; Ou, C.; Kar-Narayan, S. Observation of confinement-induced self-poling effects in ferroelectric polymer nanowires grown by template wetting. Macromol. Mater. Eng. 2016, 301, 1016–1025. [Google Scholar] [CrossRef] [Green Version]
  69. Ma, W.; Zhang, J.; Wang, X. Effect of initial polymer concentration on the crystallization of poly (vinylidene fluoride)/poly (methyl methacrylate) blend from solution casting. J. Macromol. Sci. Part B 2007, 47, 139–149. [Google Scholar] [CrossRef]
  70. Jiyong, H.; Yinda, Z.; Hele, Z.; Yuanyuan, G.; Xudong, Y. Mixed effect of main electrospinning parameters on the β-phase crystallinity of electrospun PVDF nanofibers. Smart Mater. Struct. 2017, 26, 085019. [Google Scholar] [CrossRef]
  71. Mandal, D.; Yoon, S.; Kim, K.J. Origin of Piezoelectricity in an Electrospun Poly(vinylidene fluoride-trifluoroethylene) Nanofiber Web-Based Nanogenerator and Nano-Pressure Sensor. Macromol. Rapid Commun. 2011, 32, 831. [Google Scholar] [CrossRef]
Figure 1. (a) Finite elements in a cylinder with length of 1000 nm and diameter of 75 nm; (b) direction of applied force.
Energies 16 00037 g001
Figure 2. SEM image and corresponding histograms of (a) case number 1, (b) case number 2, (c) case number 3, (d) case number 4, (e) case number 5, and (f) case number 6.
Energies 16 00037 g002
Figure 3. FTIR spectra of P(VDF-TrFE) nanofibers.
Energies 16 00037 g003
Figure 4. DSC thermograms of P(VDF-TrFE) nanofibers.
Energies 16 00037 g004
Figure 5. Simulated output voltage (left) and volumetric strain (right) of (a) nanofiber with average diameter of 75 nm and length of 2000 nm and (b) nanofiber with average diameter of 235 nm and length of 204 nm.
Energies 16 00037 g005
Figure 6. Simulated output voltage (left) and volumetric strain (right) of (a) nanofiber with average diameter of 109 nm and length of 2000 nm and (b) nanofiber with average diameter of 277 nm and length of 310 nm.
Energies 16 00037 g006
Figure 7. Simulated output voltage (left) and volumetric strain (right) of (a) a nanofiber with average diameter of 101 nm and length of 2000 nm and (b) nanofiber with average diameter of 315 nm and length of 206 nm.
Energies 16 00037 g007
Table 1. Description of electrospun samples.
Case NumberFeed Rate (mL/h)Concentration (%)Voltage (kV)Working Distance (cm)
10.5102015
20.5152015
31102015
41152015
51.5102015
61.5152015
Table 2. SEM, FTIR, DSC, and piezoelectric output voltage results of samples.
Case NumberConcentration
(%)
Feed Rate (mL/h)Mean Diameter (nm)β-Phase Content (%)Output Voltage (V)Crystallinity (%)
1100.5750.94489.30.2152
2150.52350.96212.30.2393
31011090.927760.2097
41512770.93462.10.2240
5101.51010.88949.90.1981
6151.53150.90931.720.2101
Disclaimer/Publisher’s Note: The statements, opinions and data contained in all publications are solely those of the individual author(s) and contributor(s) and not of MDPI and/or the editor(s). MDPI and/or the editor(s) disclaim responsibility for any injury to people or property resulting from any ideas, methods, instructions or products referred to in the content.