1. Introduction
As environmental problems accelerate, carbon neutrality policies established through international cooperation have been developed across all industry sectors worldwide. In particular, the use of conventional fossil-fuel-burning internal combustion engines in the automobile industry is being rapidly replaced with eco-friendly electric alternatives. In the EU, the proportion of eco-friendly vehicles is already as high as 30.7% owing to effective policies [
1]. Furthermore, the United States is aggressively attempting to increase the proportion of zero-emission vehicles to 50% by 2030 to promote the eco-friendly vehicle industry [
2]. In Korea, policies such as the “Hydrogen Economy Activation Roadmap” have been implemented to stimulate the relevant industries, secure technological process, and increase market penetration [
3]. As a result, the number of hydrogen vehicles in Korea has gradually increased by 17 times over the period from 2018 to 2021 [
4]. However, the transition to hydrogen fuel cell electric vehicles (FCEVs) is expected to pose different risks on the road. The characteristics of hydrogen mean that vehicles using it as their primary fuel could cause significant damage owing to hydrogen cloud explosions or jet fires caused by tank leakage, or even hydrogen tank explosions in the worst-case scenario. Such risks are further increased in semi-enclosed underground parking garages and road tunnels, potentially requiring technical mitigation measures.
LaFleur presented hydrogen FCEV accident scenarios by analyzing various risk factors, such as hydrogen leakage, jet fire, and fire explosion. According to their risk assessment for each accident scenario, the risk of a general fire or jet fire caused by hydrogen leakage was not high, whereas the explosion of hydrogen gas exhibited the highest risk [
5].
Glover used a quantitative risk analysis of a road tunnel scenario to determine that the probability of explosion in the event of a hydrogen vehicle accident was 0.092%. These studies reported that hydrogen was relatively safe in the event of a general fire, but extremely dangerous when an explosion occurs [
6]. Since the risk of hydrogen explosion increases in a semi-enclosed space, such as a tunnel or underground parking garage, studies have been conducted to predict and prevent accidents in these conditions.
To date, studies predicting the overpressure during a hydrogen explosion have generally been conducted using experimental and analytical methods.
In terms of experimental methods, Zalosh and Weyandt heated a 72 L Type II hydrogen tank pressurized to 34.3 MPa after removing the thermal pressure relief device (TPRD), detonated it through thermal deterioration, and measured the overpressure [
7]. The hydrogen tank exploded after 6 min 27 s of heating with approximately 370 kW of energy, and at the moment of explosion, its internal pressure and temperature were 35.7 MPa and 39 °C, respectively. The maximum overpressures were measured to be 300, 83, 61, and 41 kPa at distances of 1.9, 4.2, and 6.5 m, respectively.
The Southwest Research Institute performed a hydrogen tank explosion experiment using propane to heat an 88 L sport utility vehicle-mounted hydrogen tank pressurized to 34.5 MPa. The tank exploded after 12 min 18 s of heating; the overpressures were measured to be 140, 56, 30, 14, and 5.5 kPa at 1.22, 2.5, 5, 9.75, and 24.38 m behind the vehicle, respectively, and 80 and 69 kPa at 2.5 and 5.0 m from the side of the vehicle, respectively [
8]. Notably, when the above two experiments were performed by Weyandt, the overpressure decreased by half when the hydrogen tank mounted on a vehicle exploded compared to when the hydrogen tank was detonated alone. Furthermore, when the tank was mounted on a vehicle, there were significant differences depending on the measurement direction.
The equivalent TNT model and numerical analysis represent typical analytical methods applied to predict overpressure. Yoon applied the TNT equivalent method to evaluate the maximum overpressure and impulse produced by the detonation of explosive materials in solid and gaseous states, derived regression equations by fitting the maximum overpressure–converted distance curve, converted the impulse–converted distance curves obtained by a previous experiment under explosion yield conditions (0.01, 0.05, and 0.1), and compared them using the Kingery–Bulmash polynomial [
9].
Kwon and Park investigated the TNT equivalent method to evaluate the energy produced by a gas explosion and reported a conservative prediction of overpressure [
10].
Representative studies on the analytical prediction of overpressure in the event of a hydrogen explosion in a tunnel include work by Molkov, Shentsov, and Dery [
11,
12,
13]. These researchers compared the results obtained using the equivalent TNT model and numerical analyses with experimental results, reporting that the blast pressure wave in a tunnel exhibited hemispherical propagation characteristics, similar to those observed in the atmosphere; this propagation wave was transformed into a plane wave when it reached a certain distance. The blast pressure wave also exhibited complex patterns as it transformed into a plane wave. These studies also summarized simulation results to present dimensionless correlations that can be used to predict the overpressure in tunnels.
The experiments reported in most previous studies were typically performed in an open space under conditions different from the specifications of hydrogen FCEVs currently available in the market. Therefore, in this study, an explosion experiment was performed to detonate the hydrogen tank of an actual FCEV and account for the conditions inside a semi-enclosed space. The experiment results were then analyzed to verify a computational fluid dynamics (CFD) numerical model, which was subsequently employed to simulate the damage owing to pressure wave propagation when a hydrogen tank explosion occurs in an underground parking garage or and road tunnel.
3. CFD Analysis of Hydrogen Tank Explosion
The experiment results were used as basic data to construct a CFD model capable of analyzing the hydrogen FCEV explosion phenomenon under various conditions that cannot be easily performed in actual experiments owing to safety and budget constraints. First, the CFD analysis model was verified against the results of this and previous studies. Then, the CFD model was applied to simulate the effects of a hydrogen tank explosion in an underground parking garage and a tunnel.
3.1. CFD Analysis Model Verification
3.1.1. TNT Equivalent Model
The equivalent TNT model converts the target explosive material into an equivalent mass of TNT to predict the overpressure using empirical equations based on TNT and scaled distance as follows [
16,
17]:
where
MTNT is the equivalent mass of TNT,
E is the explosion energy (kJ),
HTNT is the heat of combustion of TNT (1100 kcal/kg),
Ze is the scaled distance at which the TNT equivalent model is applied,
R is universal gas constant, and
MTNT is molecular mass of TNT. The value of
E comprises the mechanical energy
EM and chemical energy
ECH considering the energy conversion efficiency as follows:
where
α is mechanical energy coefficient, and
β is chemical energy coefficient.
During the explosion of a high-pressure hydrogen tank, combustion occurs only after the mechanical energy developed by the expansion pressure has formed into overpressure and been released. Therefore, this study assumed that the contribution of
ECH to the explosion energy was insignificant, and
EM was assumed to comprise the entire explosion energy when calculating the equivalent TNT mass in Equation (1); the value of
EM was determined using the following equation proposed by Molkov [
11]:
where
is the hydrogen pressure,
Patm is the atmospheric pressure,
is the volume of the hydrogen tank (m
3), parameter
b is a co-volume constant, and 7.69 × 10
−3 m
3/kg was applied as a constant to correct the abnormal gas equation when calculating the actual gas volume, and
is calculated using:
where
R is the gas constant (8.314 J/mol‧K),
is the internal temperature of the hydrogen tank (K), and
is the molecular weight of hydrogen molecules (2.016 g/mol).
The overpressure PEX, which spreads in all directions in the form of explosion energy, can then be obtained according to MTNT and Ze using an empirical equation or diagram.
3.1.2. Verification of the Equivalent TNT Model
In this section, the overpressure produced by the explosion of a hydrogen tank in the open atmosphere was obtained using a CFD numerical analysis performed according to, and verified through, comparison with previously obtained experimental data from Weyandt (2005) [
7]. In the numerical analysis model, a 0.576 m diameter hydrogen tank (72 L volume) was located in the center of a 124.6 m diameter hemispherical space (modeled assuming 3D-axis-symmetric conditions) for consistency with the Weyandt experiment, as shown in
Figure 9a. The hydrogen in the fuel tank was assumed to be an ideal gas, and the pressure and temperature immediately before the explosion were set to 35.8 MPa and 312 K, respectively, as measured during the Weyandt experiment. The hydrogen was set to be released simultaneously with the start of the simulation, which was performed in the unsteady state using time increments of 2 × 10
−5 s. the simulation was performed using ANSYS Fluent V12 based code and numerical analysis was performed by applying the Spalart–Allmaras model with 3D-axis-symmetric conditions applied for the analysis model. For the sensitivity analysis of the mesh, a sufficient size was set (basic base lattice size: 0.012 m) considering the size of the source of the hydrogen tank explosion, and an appropriate ratio was applied to generate the mesh, considering that the propagation pattern was radioactive.
Figure 9b shows the simulated and experimental overpressures at distances of 1.9, 4.2, and 6.5 m from the explosion point over time. The errors between the maximum overpressures obtained by the numerical analysis and those obtained in the experiment ranged from 0.2 to 5.0% up to a distance of 4.2 m; at a distance of 6.5 m, the error was 31.2%. This is believed to have been affected by the pressure wave generated by the hydrogen tank’s scattering during the hydrogen explosion, but in the case of simulation, it is analyzed that the expansion of the pressure wave into the analysis area was simply numerical analysis.
3.2. Verification of Hydrogen Explosion in a Semi-Enclosed Space
A semi-enclosed space with a floor area of 400 m
2 and height of 15 m was set as the analysis model space to verify the accuracy of the hydrogen tank explosion simulation in a semi-enclosed space. For comparison with the results of the experiment, domains of the same size as the experiment were selected and shown in
Figure 10. The hydrogen tank was located in the center of the space, where the initial temperature and pressure of the air were set to 300 K and 101,325 Pa (atmospheric pressure), respectively. Immediately before the explosion, the hydrogen tank was filled with hydrogen with an initial temperature and pressure of 395 K and 70 MPa, respectively. The explosion energy was described using the equivalent TNT model derived in
Section 3.1.1, and the hydrogen was set to be released simultaneously with the start of the simulation. The simulation was performed in the unsteady state using a time increment of 2 × 10
−5 s. The numerical analysis method was performed in the same manner as the method presented in
Section 3.1.2.
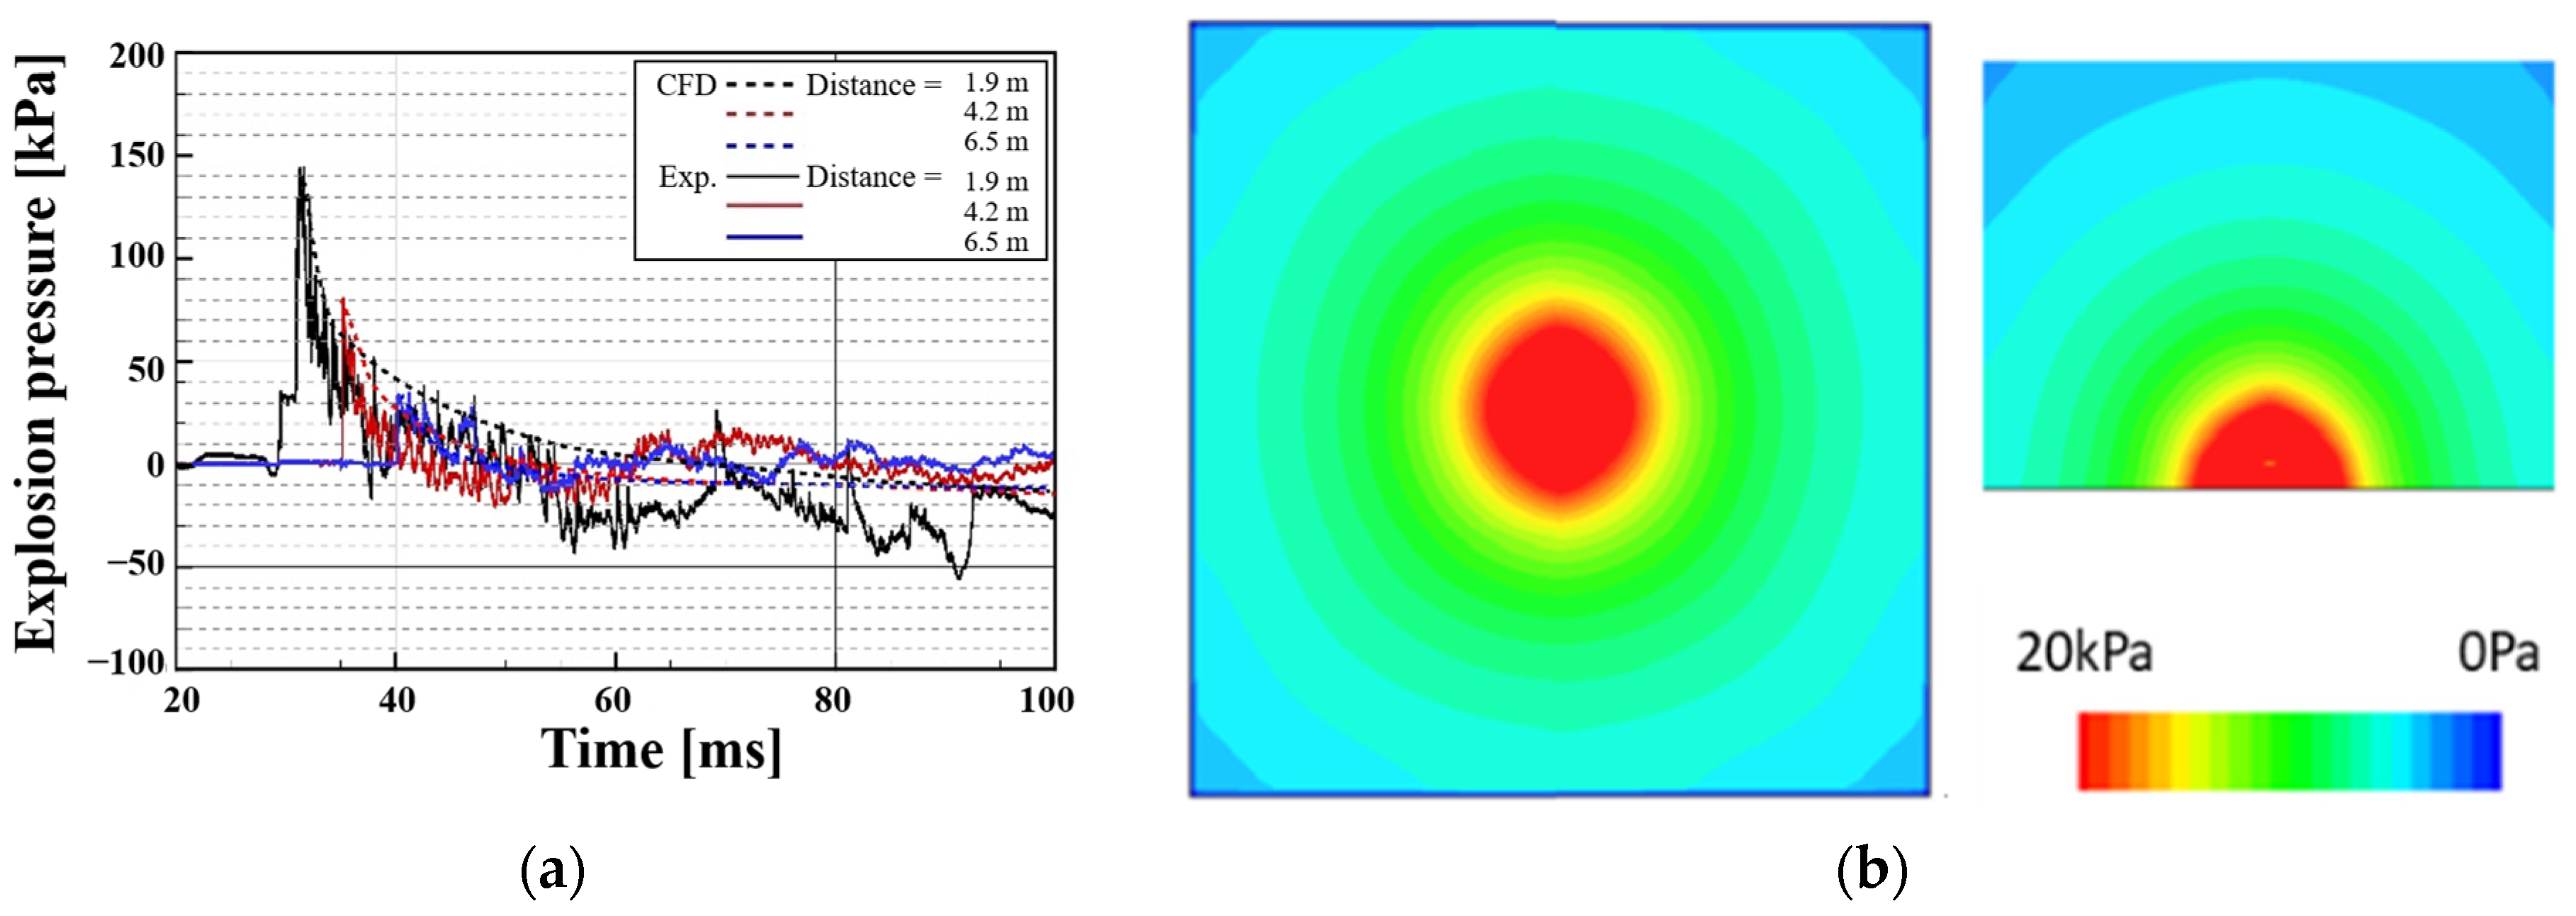
Figure 11a shows the hydrogen explosion pressure obtained by the numerical analysis for the semi-enclosed space condition. The highest pressure wave can be observed at distance of 1.9 m from the hydrogen tank, where a maximum pressure of 172 kPa was observed, followed by the waves at 4.2 and 6.5 m, where the maximum pressure was 78 kPa and 42 kPa, respectively. Furthermore, the generated pressure distribution contours along the horizontal plane and vertical height of the space at the detonation point are shown in
Figure 11b.
Figure 11a compares the results of the hydrogen tank explosion test conducted in the semi-enclosed space in this study with those of the CFD numerical analysis when the incident pressure reached a specific location. The figure indicates that the simulated pressure wave propagating to the east slightly exceeded the experimental values, but similar results were predicted within an average error of 10%. There were larger differences in the results for the pressure wave propagating to the west, where the strongest shock wave was observed (average error: 57%), and to the north (average error: 20%). These errors appear to be the result of the explosion occurring after the internal pressure was increased by approximately 10 MPa owing to heating during the experiment, as well as the fact that pressure waves with different intensities were propagated in each direction owing to the non-uniform tank rupture. Indeed, as discussed in
Section 2, two large fragments of the tank were thrown to the north and south of the explosion, with the larger fragment moving approximately 30° east of north. This observation suggests that cracking developed from the western side of the tank to the eastern side upon the release of pressure, causing the tank to be completely separated. As a result, the shock waves to the west and north were generated at an overpressure of approximately 80 MPa, a somewhat different result from that obtained by CFD simulation, which induced shock wave propagation using the pressure difference between the tank and the atmosphere (70 Mpa). In addition, the simulated overpressure exhibited an extremely small interval that converged to zero as its propagation was completed within 0.1 s of its generation. Therefore, a comparison of the maximum overpressure rather than the propagation pattern was determined to be more appropriate for this study.
Table 2 shows the maximum generating pressure between the numerical analysis and the experiment accordingly. If the distance is 6.5 m apart, the error between the numerical analysis and the experiment occurs up to 24%, which is believed to be because of the pressure generated by the scattering of the hydrogen tank container in the experiment, but only the expansion of the pressure wave in the simulation was analyzed.
As such, the maximum overpressure induced by the tank explosion was compared with the CFD analysis results and the results of previous studies as shown in
Figure 12; the experimental conditions for each case shown in the figure are described in
Table 3. The previous studies considered in this comparison comprise open-space explosion tests of different tank types filled to a pressure of 70 MPa conducted by Molcov et al. (2019) (Ref. Tests A and B) and the explosion test of a tank filled to a pressure of 35 MPa conducted by Molcov et al. (2015) (Ref. West and North) [
11,
18,
19].
For Ref. Tests A and B, the initial tank pressure was the same, but the rupture pressure was approximately 14.5–19.5 MPa higher than the experiment results obtained in this study. In the Ref. West and North experiments, the initial tank pressure was 34.3 MPa and the tank rupture pressure was measured to be 35.7 MPa. At a distance of 1.9 m, the overpressure predicted by the simulation was somewhat underestimated compared to the experimental value for the north (PN) but was similar to the experimental value for the east (PE). At distances of 4.2 and 6.5 m, the pressure decreased following a similar slope in all three directions. When the overall errors were compared, the experimental values for PE were found to be in suitable agreement with the Ref. Test B (Type III tank) results.
3.3. CFD Analysis Model Verification
The CFD-based hydrogen tank explosion simulation employing the previously verified TNT equivalent model was applied to analyze the behavior of a hydrogen tank explosion in an underground parking garage and road tunnel, where actual hydrogen vehicles will travel, and the risk of hydrogen explosion exists.
3.3.1. Hydrogen Tank Explosion in an Underground Parking Garage
- (1)
Analysis target and method
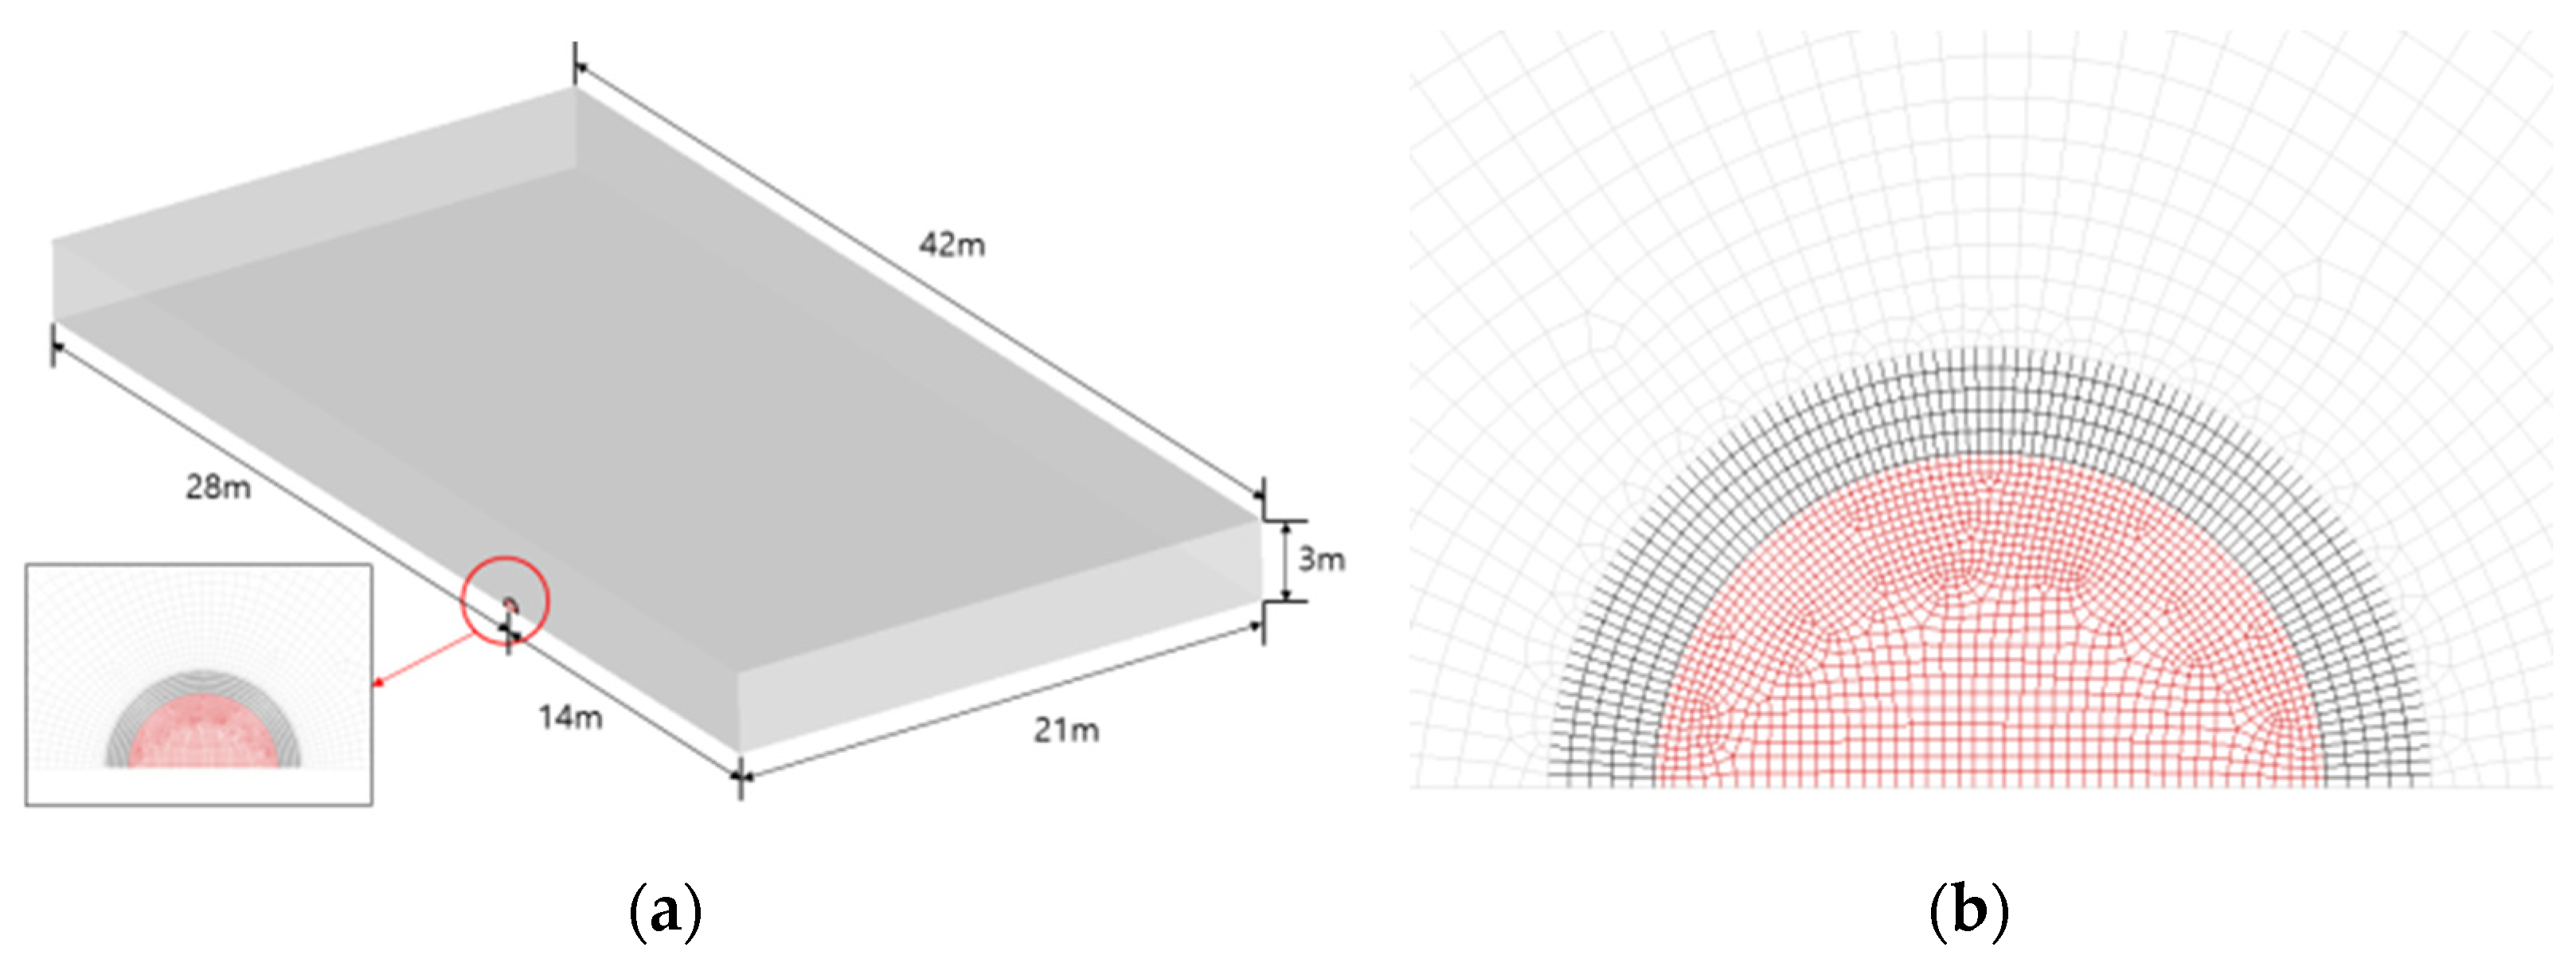
The pressure wave and overpressure propagation characteristics following a hydrogen tank explosion were analyzed in a 42 m × 42 m × 3 m (width × length × height) underground parking garage space, with the hydrogen tank placed at 21 m (center) in the width direction and 28 m (2/3 point) in the length direction. The capacity of the hydrogen tank was set to 52, 72, or 156 L. Immediately before the explosion, the hydrogen tank was filled with hydrogen at an assumed initial temperature of 395 K and pressure of 70 MPa. The initial temperature and pressure of the underground parking garage were set to 300 K and 101,325 Pa, respectively. In the analysis model, only half of the underground parking garage space was simulated by applying the symmetrical condition along the centerline in the width direction, as shown in
Figure 13a. The fluid flow was assumed to be in the unsteady state and the time increment was set to 2 × 10
−5 s for the numerical analysis. The numerical analysis method was performed in the same manner as the method presented in
Section 3.1.2.
- (2)
Analysis results
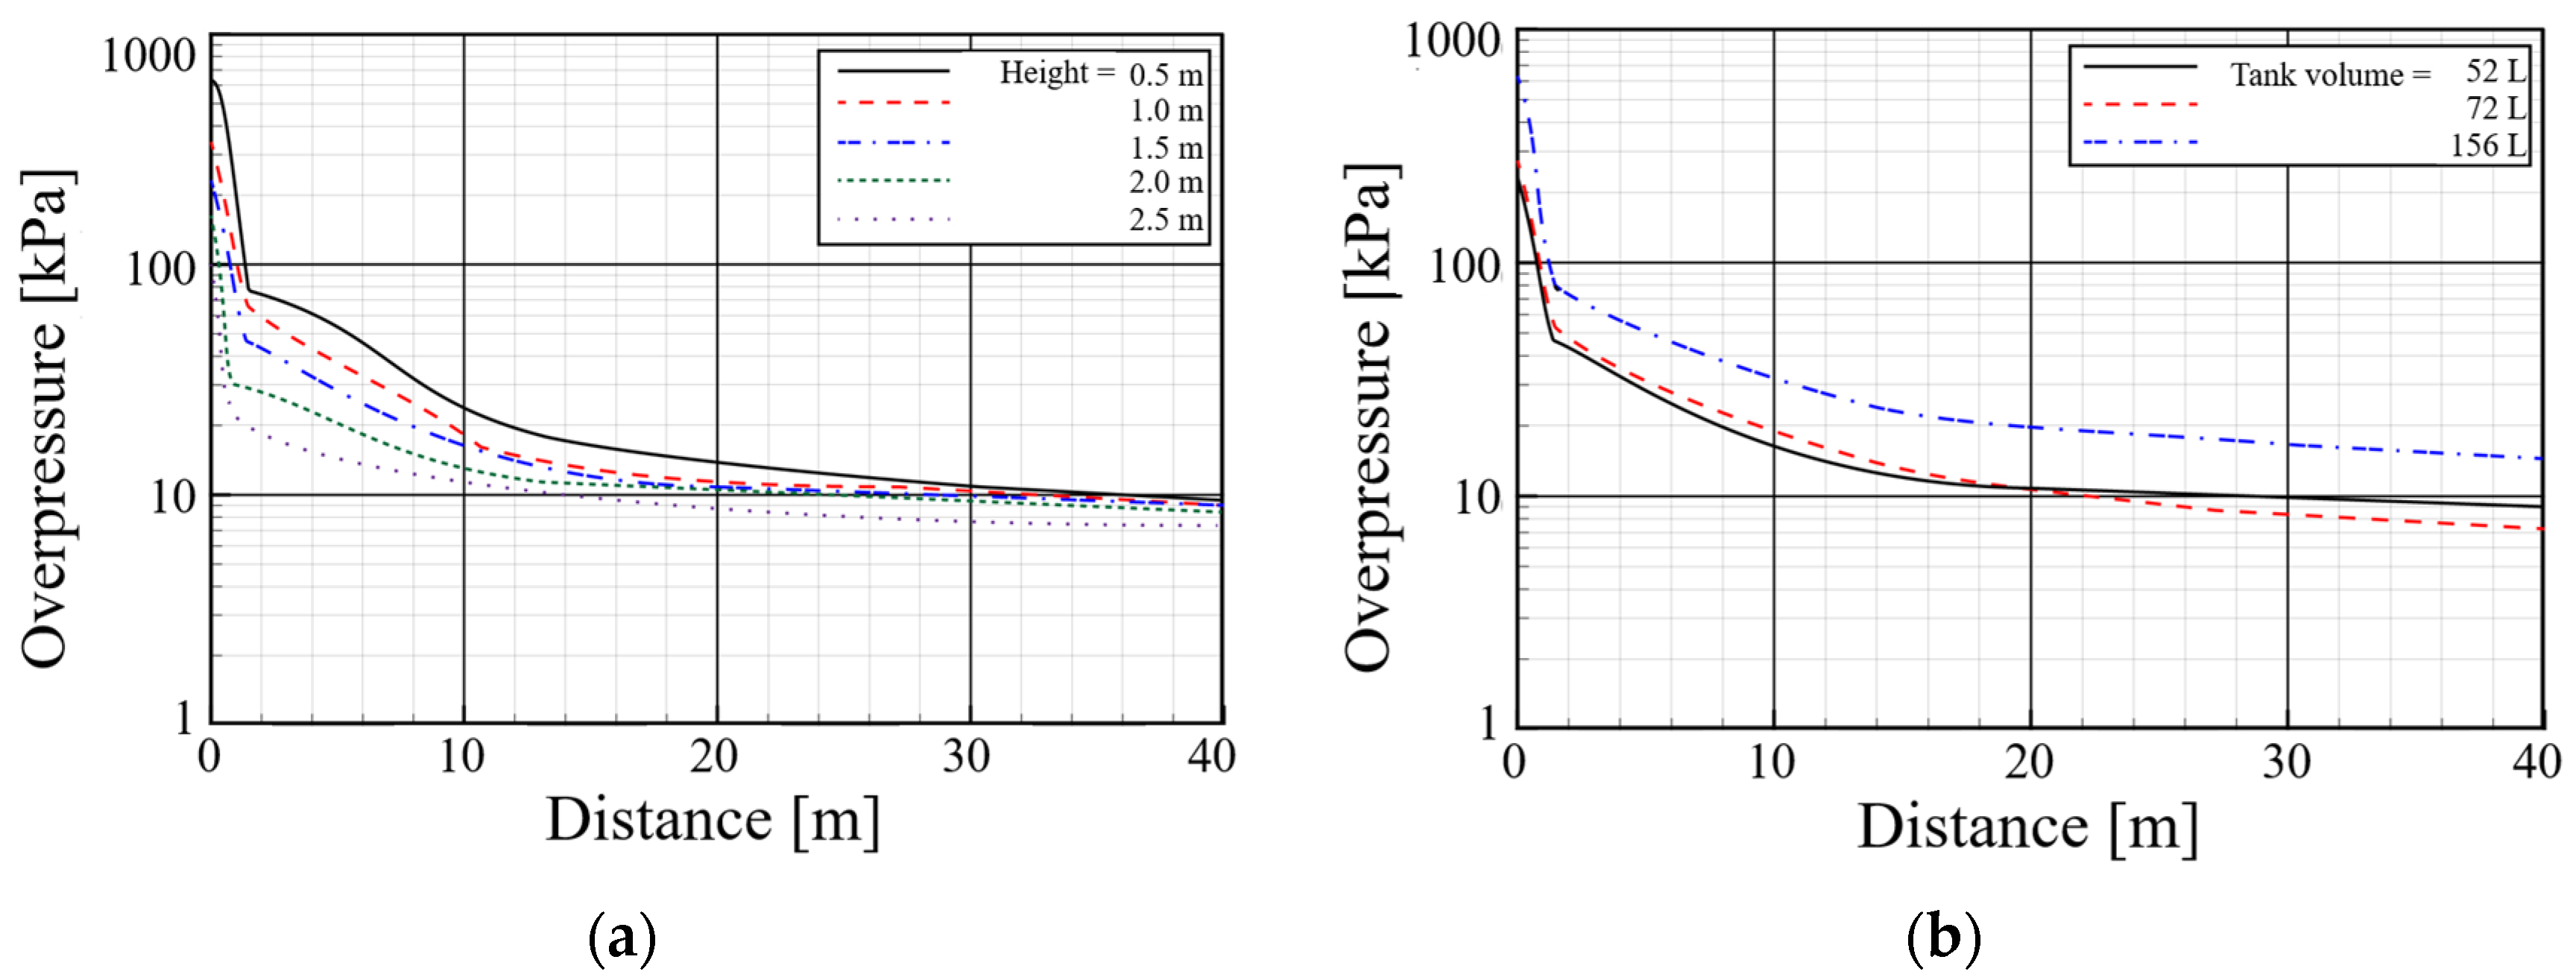
Figure 14a shows the maximum overpressure according to height (0.5, 1.0, 1.5, 2.0, and 2.5 m) and distance from the center of the underground parking garage when simulating the 52 L hydrogen tank explosion. The overpressure decreased as the horizontal distance from the tank increased and as the height above the floor increased. The maximum overpressures at 0.5, 1.0, 1.5, 2.0, and 2.5 m were 624, 323, 225, 173, and 88 kPa, respectively. The overpressure reduction rate according to the horizontal distance was 81% on average up to a distance of 3 m from the hydrogen tank and 58% from 3 to 10 m. The significant change in reduction rate at 3 m appears to have been caused by the interfering of the pressure wave with the reflected wave generated when the overpressure, radiated in hemispherical form, reached the ceiling (at a height of 3 m), resulting in a complex wave form.
Figure 14b shows the overpressure according to distance from the center of the parking garage at a height of 1.5 m for each hydrogen tank capacity. The maximum overpressure for the 52, 72, and 156 L tanks was found to be 225, 252, and 517 kPa, respectively, indicating that the maximum overpressure for the 72 and 156 L tanks was approximately 1.12 and 2.3 times higher than for the 52 L tank, respectively. When the tank capacity was 52 L, the overpressure sharply decreased up to a distance of 3 m and then gradually decreased.
3.3.2. Hydrogen Tank Explosion in a Road Tunnel
- (1)
Analysis target and method
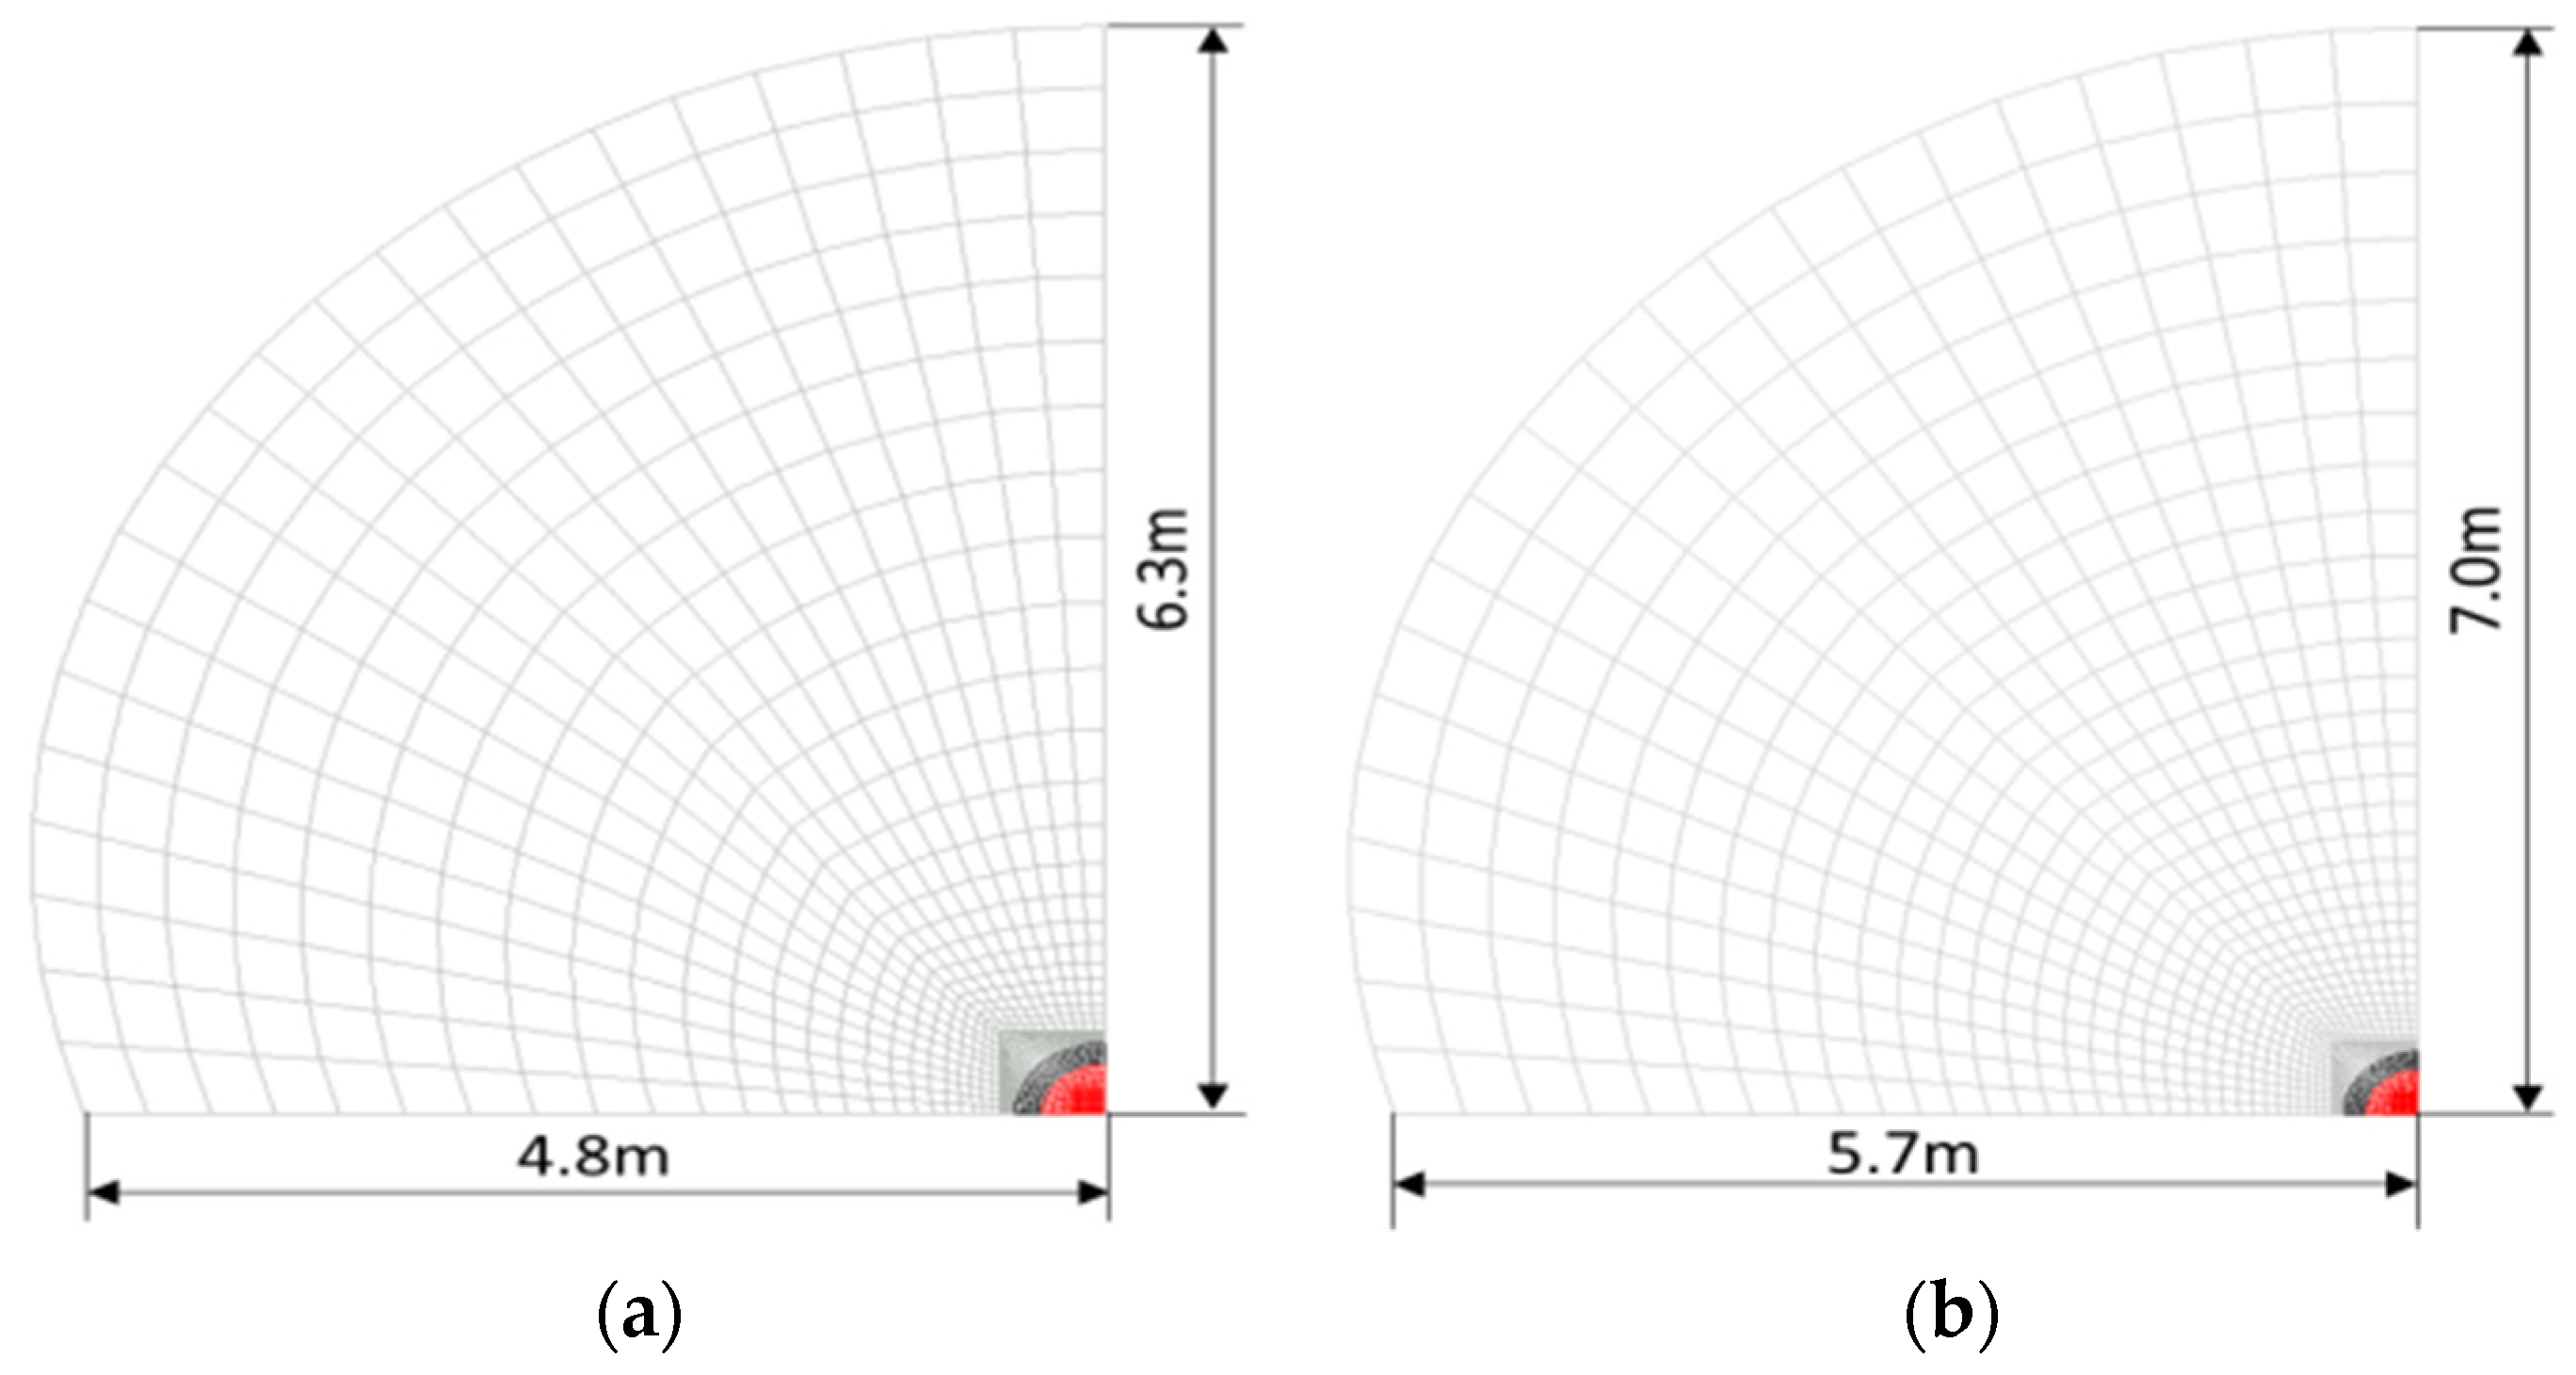
The pressure wave and overpressure propagation characteristics following a hydrogen tank explosion were analyzed using the verified CFD analysis model according to the cross-sectional area of the tunnel and hydrogen tank capacity. The length of the analyzed tunnel was set to 500 m. The tunnel cross section was horseshoe in shape, with an area of either 54 or 72 m
2, modeled assuming symmetry about the central plane of the tunnel, as shown in
Figure 15. The hydrogen tank was located in the bottom center of the tunnel and evaluated using capacities of 52, 72, or 156 L. The initial temperature and pressure of the air in the tunnel were set to 300 K and 101,325 Pa, respectively. The hydrogen tank was filled with hydrogen immediately before the explosion; its initial temperature and pressure were set to 395 K and 70 MPa, respectively. Once again, the fluid flow was assumed to be in the unsteady state and the time increment was set to 2 × 10
−5 s for the numerical analysis. The grid used for analysis was set to a sufficiently small grid size (basic base grid size: 0.012 m) so that the periphery of the hydrogen fuel tank did not affect the quantitative analysis results, and was set in consideration of the analysis economy according to the relationship with the analysis time.
- (2)
Analysis results
Figure 16a shows the overpressures along the tunnel length according to the hydrogen tank capacity at a height of 1.8 m when the tunnel cross-sectional area was 54 m
2. Over the first approximately 16 m, the overpressures sharply decreased from their maximum values of 259, 348, and 680 kPa to 15.7, 20, and 47.5 kPa for hydrogen tank capacities of 52, 72, and 156 L, respectively. At distances beyond 16 m, the overpressure reduction rate was approximately −0.048 kPa/m on average regardless of tank capacity. Generally, the overpressures for the 72 and 152 L tanks were, respectively, 1.3 and 2.5 times higher than for 52 L tank.
Figure 16b compares the overpressures alone the tunnel length according to the hydrogen tank capacity when the tunnel cross-sectional area was 72 m
2. Over the first approximately 18 m, the overpressures sharply decreased from their maximum values of 298, 404, and 752 kPa to 16, 19.5, and 35.4 kPa for hydrogen tank capacities of 52, 72, and 152 L, respectively. Beyond 18 m, the overpressures gradually decreased following nearly the same slope, corresponding to an average reduction rate of −0.035 kPa/m, where the overpressures for the 72 and 152 L tanks were approximately 1.3 and 2.5 times higher, respectively, than for the 52 L tank.
4. Analyzing the Risk Posed by a Hydrogen Tank Explosion in a Semi-Enclosed Space
Using the CFD-obtained pressure wave propagation characteristics presented in
Section 3, the damage caused by a hydrogen tank explosion in an underground parking garage or road tunnel was analyzed according to the limit distances for harm to the human body. Many studies have been conducted on the impact of overpressure on the human body. Notably, Kashkarov defined the limit distance owing to a hydrogen tank explosion in an open space, estimating the damage to the human body by dividing the limit distance into four harm stages according to the degree of exposure, as shown in
Table 4 [
19]. The lower limit of slight injury was defined at 1.35 kPa from a conservative perspective to ensure safety.
Figure 17 shows the limit distances for each harm stage according to the capacity of a hydrogen tank exploding in an underground parking garage. When the tank capacity was 52 L, the fatality limit distance was 0.8 m, and the serious injury limit distance was 10.4 m. As the tank capacity increased to 72 and 156 L, the fatality limit distance increased to 1.0 and 3.2 m, respectively, and the serious injury limit distance increased to 11.2 and greater than 40 m, respectively. Indeed, the serious injury limit distance significantly increased for a 156 L hydrogen tank.
Figure 18 shows the limit distance results for each harm stage according to the capacity of a hydrogen tank exploding in a road tunnel. When the cross-sectional area of the tunnel was 54 m
2, the fatality limit distances were 3.0, 3.5, and 9.5 m and the serious injury limit distances were 15.6, 27.3, and 240.5 m for hydrogen tank capacities of 52, 72, and 156 L, respectively. A similar tendency was also observed when the cross-sectional area was 72 m
2, with fatality limit distances of 2.9, 3.5, and 10.1 m and serious injury limit distances of 17.6, 24.5, and 71.4 m for hydrogen tank capacities of 52, 72, and 156 L, respectively.
The results in the underground parking garage and road tunnel all demonstrated that the fatality limit distance increased linearly in proportion to the quantity of hydrogen in the tank, but the serious injury limit distance sharply increased when using 156 L of hydrogen. This result reflects the unique characteristics of the semi-enclosed space; the reflected wave generated when the overpressure wave created by the hydrogen explosion reaches the wall (or ceiling) overlaps with the pressure wave to exhibit a complex propagation pattern. The pressure reduction rate significantly decreases beyond the point where this overlap occurs according to the propagation distance. The serious injury limit distance significantly increases for a 156 L hydrogen tank because a large section of relatively high overpressure affected by the reflected wave is generated in which the pressure exceeds the value that determines the limit distance.
Figure 19 shows the limit distance according to the space condition for the explosion of a 52 L hydrogen tank. For the road tunnel, the fatality limit distance was determined to be approximately 3.0 m and the serious injury limit distance was 18.6–20.5 m regardless of the cross-sectional area. The limit distances for the underground parking garage were quite different, indicating a fatality limit distance of 0.8 m and a serious injury limit distance of 10.4 m. This difference appears to be influenced by the significantly lower ceiling height of the parking garage, but these results also differed considerably from those of previous experiments; therefore, detailed additional research is required.
Kashkarov and several other previous studies estimated damage using incident pressure–impulse diagrams [
19]. Based only on the limit distance analysis presented above, nearly all human beings will die when exposed to an incident pressure of 200 kPa because lung hemorrhaging will occur with a 99% probability. However, if the impulse, which captures the concept of exposure time to the pressure waves, is used for analysis, more accurate and flexible damage prediction and engineering designs are possible.
Figure 20 therefore examines harm using the incident pressure–impulse diagrams for the experiment and CFD results. In this diagram, the CFD results were compared at distances of 1.9, 4.2, and 6.5 m from the hydrogen tank to match the experimental conditions. All the CFD results for the underground parking garage and road tunnel were determined to be higher than the limit indicating death by lung hemorrhage. Among the experiment data, the lung hemorrhage threshold occurred at a distance of 4.2 m regardless of tank capacity, whereas serious injury was found to occur at 6.5 m. This result indicates that the impulse has a larger impact on the degree of damage than the generated incident pressure.


