Abstract
After the Paris Agreement was signed in 2015, many countries worldwide focused on the hydrogen economy, aiming for eco-friendly and renewable energy by moving away from the existing carbon economy, which has been the primary source of global warming. Hydrogen is the most common element on Earth. As a light substance, hydrogen can diffuse quickly; however, it also has a small risk of explosion. Representative explosion accidents have included the Muskingum River Power Plant Vapor Cloud Explosion accident in 2007 and the Silver Eagle Refinery Vapor Cloud Explosion accident in 2009. In addition, there was an explosion in a hydrogen tank in Gangneung, Korea, in May 2019, and a hydrogen refueling station (HRS) in Norway exploded in 2018. Despite this risk, Korea is promoting the establishment of HRSs in major urban centers, including downtown areas and public buildings, by using the Regulatory Sandbox to install HRSs. This paper employed the Hydrogen Risk Assessment Model (HyRAM) of Sandia National Laboratories (SNL), a quantitative risk assessment (QRA) program specialized in hydrogen energy for HRSs installed in major urban hubs. A feasibility evaluation of the site conditions of an HRS was conducted using the French land use planning method based on the results obtained through evaluation using the HyRAM and the overpressure results of PHAST 8.0. After a risk assessment, we confirmed that an HRS would be considered safe, even if it was installed in the city center within a radius of influence of jet fires and overpressure.
1. Introduction
Since the Paris Agreement in 2015, the importance of climate change and renewable energy has increased globally. Hydrogen has recently been focused on as a potential environmentally friendly energy source because of its high energy density and low energy loss. Further, when hydrogen is used in mobility, power generation, or combustion, there is no emission of global warming gases. Hence, hydrogen is referred to as “future energy” [1]. Major countries worldwide, including the United States, Germany, Japan, the United Kingdom, and Australia, have announced roadmaps for hydrogen energy. These also include various strategies from hydrogen production to usage.
South Korea announced a hydrogen economy roadmap in 2019 and the first hydrogen economy basic plan in 2021, with updated strategies for an all-hydrogen value chain. One strategy presented was a hydrogen refueling station (HRS) propagation strategy to be conducted between 2022 and 2050. The HRS building plan suggested by South Korea is presented in Table 1.

Table 1.
Hydrogen refueling station (HRS) forecast from 2022 to 2050 [2].
The South Korean government plans to build new HRSs or convert existing fuel stations into HRSs, with the HRSs being either single or combined fueling stations. Ultimately, this plan means that HRSs could be built everywhere, including in urban areas. However, an HRS cannot be built in an urban area because of the High-Pressure Gas Safety Management Act.
In Korea, a policy system called the Regulatory Sandbox exists for the deregulation of new products or technology during a specific period. The ultimate purpose of the Regulatory Sandbox is to create an innovative industrial ecosystem by revising laws and regulations on new technologies or services that are difficult to apply to existing regulations. For this, several prerequisites are required. First, in order to prepare a win–win strategy for new and old industries, it is necessary to establish a safety net for existing industries and strengthen industrial competitiveness. Building an integrated control tower that can create issues of interest and conflict between ministries is also necessary. The convenience of administrative procedures should be improved by increasing the efficiency of the project operating system. With the establishment of a partnership between the central and local governments, the powers should be delegated to local governments step by step, and the project’s impact should be maximized by including the metropolitan area in the “Regional Special Zone Act”. Some business owners participate in the Regulatory Sandbox system and have submitted letters of application to build an HRS in an urban area [2].
On 11 February 2019, the South Korean government approved the installation of an urban HRS beside the Korea National Assembly, which was the first Regulatory Sandbox project to build an HRS. The Korea National Assembly HRS was built on 10 September 2019, and is still being operated safely. Thus far, there has been no information regarding hydrogen accidents or incidents in an HRS. Hence, on 11 March 2021, the second Regulatory Sandbox HRS near Seosomun was approved to be built beside the Seoul City Hall Annex. However, in principle, the HRS will not be built next to the Seoul City Hall Annex because the safety separation distance required by protection facilities is not met according to the High-Pressure Gas Safety Management Act.
With the completion of the HRSs at the National Assembly and Seoul City Hall through the Regulatory Sandbox, the installation of HRSs in downtown areas and public buildings in each region of Korea could be accelerated. However, safety accidents related to hydrogen energy could occur at any time; thus, it is necessary to analyze the safety of HRSs.
The hydrogen storage equipment in hydrogen refueling stations mainly includes long tube trailers, hydrogen storage cylinders, and fuel cell vehicles. The working pressures of the equipment are mainly 20 MPa, 35 MPa, and 70 MPa [3]. In the case of damage to hydrogen storage equipment, leakage of large amounts of hydrogen generates critical fire and explosion hazards, presenting a tremendous risk to humans and equipment.
Many previous studies on HRSs with CA (consequence analysis) and QRA (quantitative risk assessment) have been conducted [4]; however, these studies differed to those on installed HRSs in some aspects. An installed HRS is in the form of a surrounded box, and many previous studies have been conducted based on an open type; therefore, differences may exist between the types and causes of accidents.
Therefore, this study used the Hydrogen Risk Assessment Model (HyRAM) of Sandia National Laboratories (SNL), which is a quantitative risk assessment (QRA) program specializing in hydrogen energy, to assess HRSs installed in downtown areas and public buildings to (i) confirm their safety through CA and QRA; (ii) make more rational decisions regarding the siting of HRSs; and (iii) improve stakeholder awareness. The main aim of this study was to improve the understanding of safety and HRSs.
2. Methodology
This study employed the necessary information to establish an accident scenario and then quantitatively evaluated this using CA and QRA in order to evaluate the safety of an HRS.
The accident scenario was selected based on the following.
2.1. Scenario
2.1.1. Selection of the Location
The location of the accident scenario was selected based on the type of hydrogen filling station currently installed in Korea, the pressure of the tank at the filling station, and the hydrogen production method. Table 2 shows how many stations existed in the country as of September 2022 depending on the supply type, i.e., onsite or offsite. The location is very important for a full QRA since the populations around the facility affect the shape of the FN curve—the so-called societal risk. In this study, the population density of the location (Yeoui-doing, Seoul) in 2022 was 3919 persons/km2 according to a government reference [5].

Table 2.
Hydrogen supply type [6].
Table 3 shows the pressures of the tube trailer and storage tank that HRSs currently use and Figure 1 shows the PFD of a typical HRS.

Table 3.
Scenario locations.
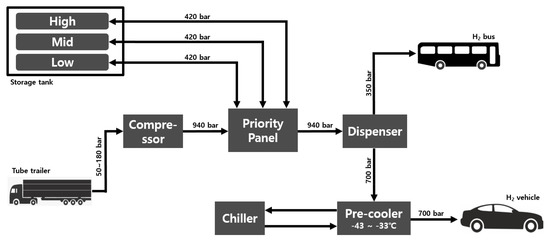
Figure 1.
Process flow diagram (PFD) of a typical HRS.
Figure 2 shows the map of the HRS location near the capitol and in Figure 2, “A” is the location of the HRS, and Residential 1, 2, and 3 are the buildings occupied by people. Its location is near the parliament capitol; the northeast section is a park, and the fueling station is surrounded by wide roads.
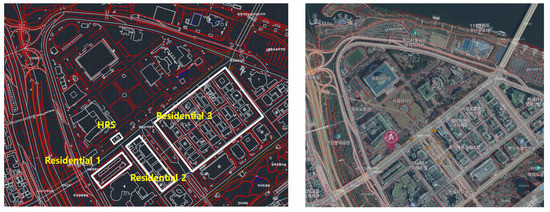
Figure 2.
HRS location in Seoul.
2.1.2. Selection of Weather Conditions
The weather conditions for the accident scenario were selected based on the content of the Occupational Safety and Health Agency’s “Technical Guidelines for Selection of Worst and Alternative Leakage Scenarios”. In addition, hydrogen is a combustible gas, and thus the analysis conditions for combustible gases (not toxic gases) in the guidelines were utilized. The conditions are shown in Table 4.

Table 4.
Guideline for analysis conditions for combustible gases [7].
Wind speed, atmospheric stability, atmospheric temperature, and humidity are essential weather conditions in the accident scenario and were selected based on the contents of 2–3 and 2–4 in the published guidelines.
For the accident scenario of this study, the values of the wind speed, atmospheric stability, atmospheric temperature, and humidity corresponding to the worst-case scenario are shown in Table 5.

Table 5.
Wind speed, air stability, air temperature, and humidity conditions [7].
2.1.3. Selection of Accident Scenario
Hydrogen filling stations are operated by using by-product hydrogen generated in the petroleum refining process and filling the tube trailers with by-product hydrogen, which is then sent to compressors. It is then compressed under high pressure and sent to priority panels, moving from the priority panels to the storage tank and dispenser. The hydrogen bath is charged at 35 Mpa from the dispenser. In addition, the dispenser sends hydrogen for pre-cooling at 70 Mpa, following the format whereby the hydrogen vehicle is charged at 70 MPa.
Accident frequency data for HRSs from the SNL report are presented in Table 6 [7]. In the current study, these accident scenario data were based on the hydrogen storage tank and tube trailer, which have the largest amount of hydrogen storage and are advanced in terms of technology based on the result values for jet fire and overpressure risk effects according to each leak scenario. The conditions for the accident frequency data are shown In Table 6.

Table 6.
Accident scenario data of hydrogen charging station [8].
The hydrogen storage data are provided in Table 7. In accordance with the SNL report, the volume was selected with reference to 700 bar, i.e., the system volumetric capacity [9]. Further, the orifice diameter was selected based on the values below in Table 7.

Table 7.
Input range for NFPA 2 and NFPA 55 separation distance tables and related system characteristic pipe diameters [8].
2.2. Hydrogen Risk Assessment Model (HyRAM)
The program used in this study, the HyRAM, is hydrogen-energy-specialized and functions as a QRA program. In addition, the hydrogen gas leak and jet fire models used in the HyRAM have already been widely used in previous studies [10].
The scenario model used in this study is as follows.
2.2.1. Scenario Model
Jet Fire
A jet fire is the most likely accident when hydrogen gas leaks. Therefore, a jet fire was selected as a scenario model in this study. As models for a jet fire, two models proposed by Houf and Schefer [11] and Ekoto et al. [12] were considered, and the model proposed by Ekoto et al. was used in this study.
The main difference between the jet/plume model and the flame model is that the mixture fraction, not the mole fraction, is a scalar that is preserved, and in the case of hydrogen flames, it is defined as Equation (1) below.
where f is the mixture fraction, MW is the molecular weight, and the variables x and y represent each type of mole and mass fraction.
Additionally, the value of the notional nozzle is essential when analyzing a jet fire. The nozzle is used to calculate the effective diameter, velocity, and thermodynamic state after the complex impact structure of the low-expansion jet, which conserve mass or momentum, and in some cases, other properties are used across the impact so that the jet pressure determines the conditions when returning to the surroundings again.
Among the five nozzle models provided by the HyRAM, the formula proposed by Birch et al. was used [13]. First, the expression of the conservation of mass is shown in Equation (2) below.
The momentum is equal to Equation (3):
Through Equation (4), the effective speed (veff) can be calculated:
In addition, the effective area (Aeff) is calculated through Equation (5):
where is the density; is the velocity; A is the cross-sectional area; CD is the discharge coefficient, which would be calculated as 1.0; P is the pressure; the subscript throat represents the choke point (calculated as ) in the orifice; and the subscript eff represents the effect of pressure returning to the atmosphere after the impact structure.
The shape of a jet fire through buoyancy correction according to the above equation is shown in Figure 3 below.
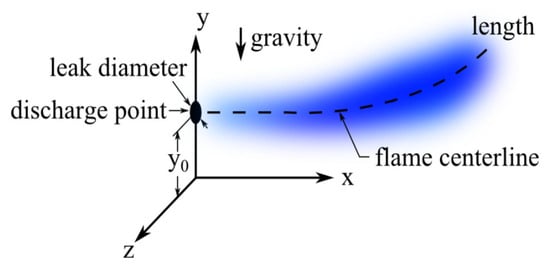
Figure 3.
Jet fire with buoyancy correction.
The range of influence of a jet fire is determined based on the heat flux of radiant heat after determining the jet fire and the type of damage that would be caused if a person is exposed to radiant heat of 5 kW/m2, 12.5 kW/m2, or 35 kW/m2.
Among the contents of the KGS Code [14] for HRSs produced and announced by the Gas Technology Standards Committee, the safety distance from the protection facility was also checked and comparatively analyzed to determine the optimal safety distance in case of a jet fire.
Overpressure
The advantage of the HyRAM is that, unlike other risk assessment programs, the risk assessment for hydrogen facilities can be carrided out easily. The HyRAM’s analysis of the risk effects of overpressure allows for the assumption that hydrogen leaked in a closed state explodes in response to an unknown ignition source. As a result, the HyRAM can help to conduct a more thorough risk assessment of HRSs than the risk assessment simulation program that has been widely used in the past. Figure 4 shows a general description of the HyRAM.
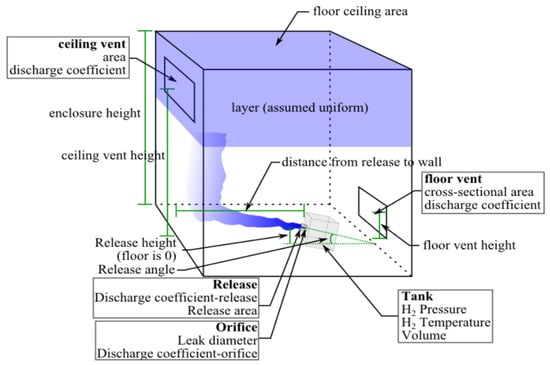
Figure 4.
HyRAM.
Significant overpressure can occur if a limited mixture is ignited inside an enclosed HRS. The overpressure was calculated assuming that the cause of overpressure is the volume change during combustion, which pressurizes the enclosure. However, this assumption is different from the overpressure calculation based on the blast wave of the available mixture, and it is assumed that all hydrogen above the LFL reacts [15], as in Equation (6).
where p0 is the initial pressure, VT is the total volume of the enclosure, VH2 is the volume of expansion of pure hydrogen after leakage, Vstoich is the volume of the stoichiometric mixture of hydrogen consumed, σ is the expansion ratio of the stoichiometric hydrogen–air mixture, and γ is the specific heat ratio of air. The expanded volume is given by , where is the hydrogen consumption mass, and is the hydrogen density at ambient conditions. Vstoich divides VH2 by the stoichiometric mole fraction of hydrogen.
In addition, explosion overpressure was calculated through the TNT mass equivalent, and the equation is as follows (Equation (7)):
where mfuel represents the flammable vapor release mass, Y represents the explosive energy yield, ∆HC represents the combustion heat, and hydrogen amounts to 118,830 kJ/kg.
Method of French Land Use Planning
French land use planning investigates all possible accident scenarios in hazardous installations and estimates their likelihood of achieving acceptable safety. Individual risk and societal risk were evaluated. Individual risk was determined using an alert level map, and societal risk was evaluated through a risk matrix. The risk assessment was investigated based on the following factors.
In this study, the French land use planning technique was converted to meet the domestic standards. As a domestic standard, the Korea Occupational Safety and Health Agency’s “Technical Guidelines for Selection of Worst and Alternative Leakage Scenarios” were referred to. The information converted to meet the domestic standards is shown in Table 8. In addition, because an evaluation of the effects on toxicity among the information was not performed in this study, only information on radiant heat and explosion overpressure was converted.

Table 8.
Intensity of impact on population converted to domestic standards [6] and human harm [7].
The range of influence of explosion overpressure was tested using PHAST 8.0 from DNV GL, instead of the HyRAM. The French land use planning method was used to approach the damaging effect conservatively using PHAST.
Through PHAST, the French land use planning method was applied to qualitatively evaluate the risk in the downtown area of Seoul.
3. Results and Discussion
3.1. Results of HyRAM Simulation
The HyRAM simulation results are as follows.
3.1.1. Results for Jet Fire
The risk effect of a jet fire was modeled using the HyRAM, and ten heat flux points were designated.
Ten heat flux points were analyzed for each X-axis, Y-axis, and Z-axis, and the results of the jet fire modeling simulation for small, medium, and large leaks of tube trailers were as follows.
Figure 5, Figure 6 and Figure 7 present three 2D plots of radiative heat flux that correspond to the jet flame: side view (top left), front view (top right), and top view (bottom left). Analyzing the results shown in Figure 5, radiant heat does not appear to significantly affect people, except for at X—0.01 m, where a jet fire will ensue when a small leak occurs in the tube trailer.
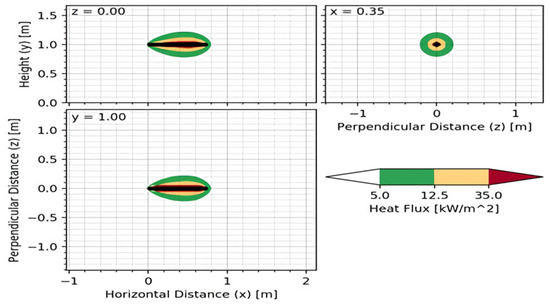
Figure 5.
Heat flux and temperature of a jet fire in a small-leak scenario of the tube trailer. Tube trailer—small leak (heat flux).
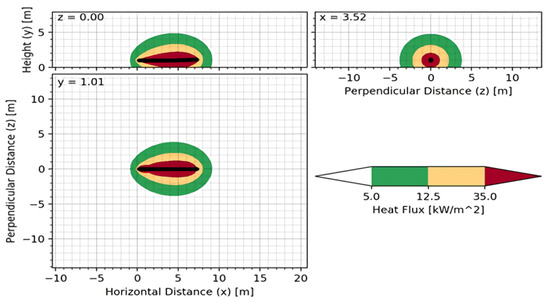
Figure 6.
Heat flux of a jet fire in a medium-leak scenario of the tube trailer. Tube trailer—medium leak (heat flux).
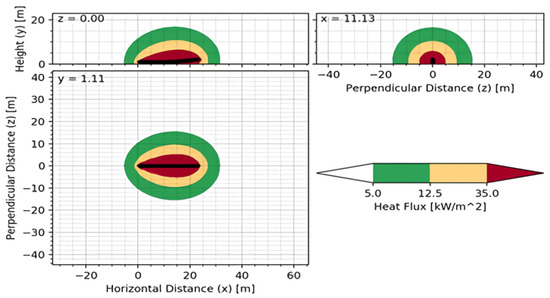
Figure 7.
Heat flux of a jet fire in a large-leak scenario of the tube trailer. Tube trailer—large leak (heat flux).
Analyzing the results shown in Figure 6, it is indicated that a jet fire will occur due to a medium leak in the tube trailer, and heat flux points 1 to 6 can be exposed to radiant heat of up to 29.20 kW/m2, which can be dangerous. However, the radiant heat reduces to 3 kW/m2 at point 7, which is 10 m from the X-axis. Thus, the safety distance recommended in KGS Code FP 217 is sufficiently achieved.
Analyzing the results shown in Figure 7, it is shown that all values from heat flux points 1 to 9 are valid when a jet fire occurs due to a large leak in the tube trailer. In particular, since the maximum heat flux of a jet fire due to a large leak is 373.71 kW/m2, there is damage due to the radiant heat. Up to 15 m from the X-axis, the risk effect of the radiant heat is very large, but it decreases sharply at 25 m, and the effect is insignificant at 40 m.
The jet fire modeling simulation results for small, medium, and large leaks in the hydrogen storage tank were as follows.
Radiant heat will not significantly affect people, except for at 0.01 m, where a jet fire will ensue when a small leak occurs in the hydrogen storage tank (Figure 8) and a medium leak occurs (Figure 9). The dangerous distances from both leak sizes would be in the boundary of the station.
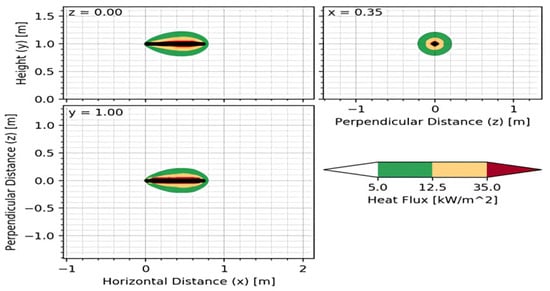
Figure 8.
Heat flux of a jet fire in a small-leak scenario of the H2 storage tank. Hydrogen storage tank—small leak (heat flux).
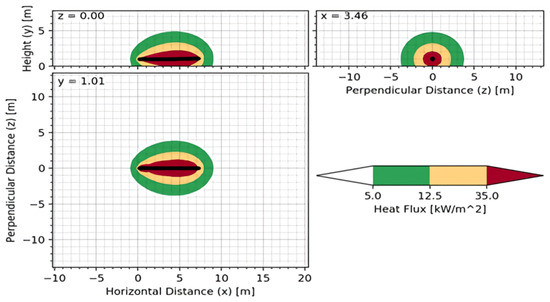
Figure 9.
Heat flux of a jet fire in a medium-leak scenario of the H2 storage tank. Hydrogen storage tank—medium leak (heat flux).
If a medium leak occurs in the hydrogen storage tank, resulting in a jet fire, heat flux points 1 to 6 will be exposed to radiant heat of up to 29.93 kW/m2, which can be dangerous (Figure 7). However, the radiant heat reduces to 3 kW/m2 at point 7, which is 10 m from the X-axis. Hence, the safety distance recommended in KGS Code FP 217 is sufficiently achieved. Figure 10 below show the result with the large leak.
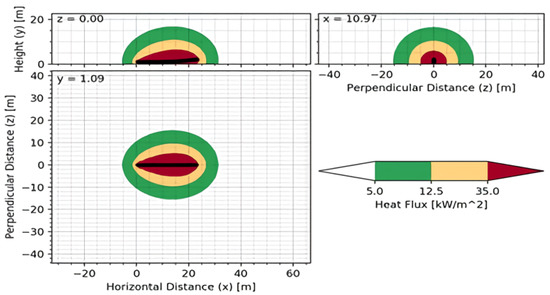
Figure 10.
Heat flux of a jet fire in a large-leak scenario of the H2 storage tank. Hydrogen storage tank—large leak (heat flux).
Analyzing the results shown in Figure 8, it is indicated that all values from heat flux points 1 to 9 are valid when a jet fire occurs as a result of a large leak in the hydrogen storage tank. In particular, since the maximum heat flux of a jet fire due to a large leak is 369.52 kW/m2, there would be damage from the radiant heat. Up to 15 m from the X-axis, the risk effect due to the radiant heat is very high; however, it declines sharply at 25 m, and the effect is insignificant at 40 m.
The results of the radiant heat for each heat flux point of the tube trailer and the hydrogen storage tank are shown in Figure 11 and Figure 12. Similar results were obtained, as the leak size difference offset the pressure difference (20 Mpa vs. 80 Mpa), and the discharge rates for both scenarios were similar. In both the small- and medium-leak scenarios, it is indicated that radiant heat rapidly increases at 10 m. This reduces further, and in the case of a large leak, it rapidly increases at the point of 5 m, and the highest radiant heat is measured at 15 m. It was confirmed that it rapidly decreases at the point of 25 m.
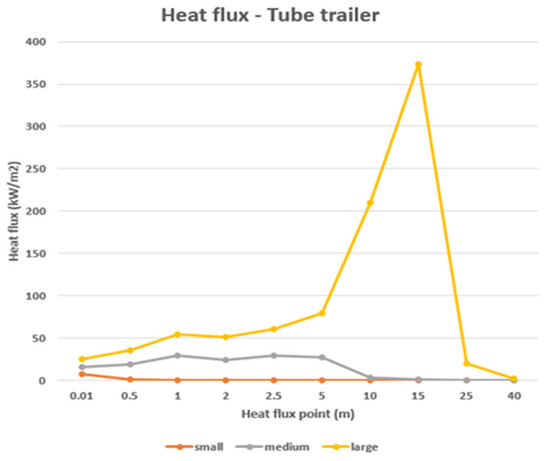
Figure 11.
Variation in radiant heat according to the heat flux points of the tube trailer.
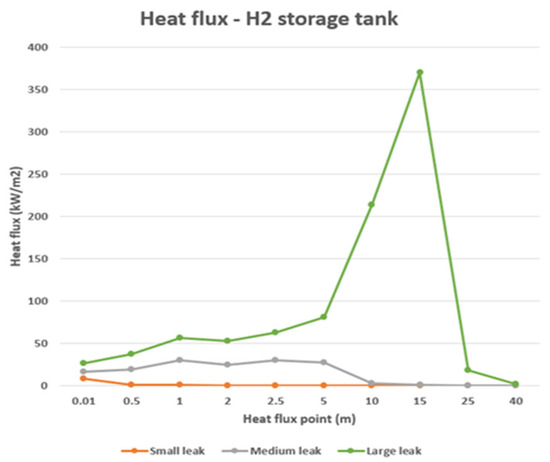
Figure 12.
Variation in radiant heat according to the heat flux points of the storage tank.
In both scenarios, if a jet fire occurs as a result of a small or medium leak and a person within 5 m is exposed for more than 1 min, 100% death can occur. However, it is still considered safe because there is a mitigation wall at the point where the facility and people in both scenarios are expected to be located. Also from the risk assessment perspective, this area is regards as no population zone. Outside of the site, serious heat flux is not observed. Thus, this also meets the jet fire safety distance recommended in KGS Code FP 217.
In the case of a large leak, if a jet fire occurs, it can result in a considerable risk; however, as the leak diameter of a large leak is larger than the orifice diameter of the actual pipe, the probability of a large leak is very small. Though SNL suggests a frequency of 1.80 × 10⁻⁴/year for large leaks of a tube trailer and 1.02 × 10⁻⁴/year for those of a hydrogen storage tank, the frequency in this case should be lower than these due to the size matter. Therefore, potential damage caused by a jet fire at an HRS installed in a downtown area is expected to be minimal, and these installations can be deemed safe.
3.1.2. Overpressure Result Value
The results of the tube trailer overpressure measured through HyRAM simulation are shown in Table 9. The HyRAM’s results demonstrate the overpressure when the ignition point is reached according to the time since the hydrogen leak.

Table 9.
Tube trailer—overpressure for a small and a medium leak.
Overpressure resulting from the large leak of a tube trailer could not be determined due to a HyRAM error. As explained in Table 8, the orifice diameter is 7.92 mm for storage tanks over 20 Mpa. However, in each leak scenario of the tube trailer presented by SNL, the leak diameter of the large leak is 12.7 mm. In this case, the orifice diameter was calculated to be smaller than the leak diameter. Therefore, when the orifice diameter size exceeds the leak diameter, the calculation is correct.
The overpressure values for each leak of the hydrogen storage tank are shown in Table 10.

Table 10.
Overpressure values for a small and a medium leak.
Similar to the tube trailer, the large-leak scenario of the hydrogen storage tank also has a larger leak diameter than the orifice diameter; therefore, the HyRAM simulation results could not be obtained.
When both the tube trailer and the hydrogen storage tank reach the ignition point and explode after 4–5 s, the overpressure value increases rapidly. Additionally, in both scenarios, the overpressure value rises similarly after five seconds.
3.2. Results of French Land Use Planning Method
In order to evaluate the HRS using the French land use planning technique, the results obtained using PHAST 8.0 from DNV GL were used. The results obtained using PHAST 8.0 were simulated on the basis that there was no mitigation wall in the HRS. In the case of PHAST, the risk effect diameter for the damage radius is shown for an explosion compared to the leak diameter, regardless of the leakage time.
Among the scenarios, small and medium leaks did not exceed the area of the HRS; thus, a large leak was added, and a catastrophic rupture that was not simulated in the HyRAM was also simulated. The results are shown in Figure 13 and Figure 14.
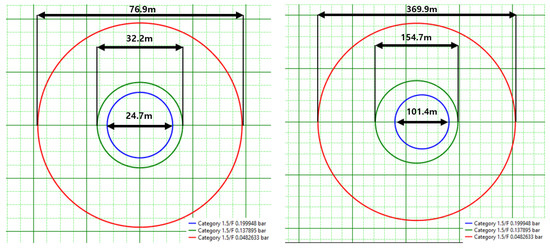
Figure 13.
Large leak of the tube trailer and overpressure of a catastrophic rupture.
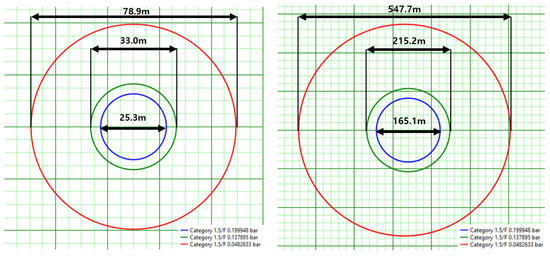
Figure 14.
Large leak of the storage tank and overpressure of a catastrophic rupture.
The French land use planning technique was implemented using the results of the catastrophic ruptures among the risk effect diameters of the tube trailer and hydrogen storage tank.
Briefly, 200 mbar is suggested for the overpressure value of “5% lethality”, 140 mbar is suggested for the value of 1%, and 50 mbar is suggested for “irreversible effects” [16]. Using the population density and the impact diameters in Figure 13 and Figure 14, populations of 1% and 5% lethality were calculated, as shown in Table 11 and Table 12. The area of the HRS itself (https://www.h2news.kr/news/article.html?no=7555, accessed on 1 November 2022), 1236 m2, was used to calculate the number of impacted people (for vacancy) [17].

Table 11.
Number of people in the potential impacted areas of large-leak scenarios.

Table 12.
Number of people in the potential impacted areas of catastrophic rupture scenarios.
Fatal overpressure does not touch any of the residential sectors. In fact, the HRS is surrounded by wide roads that are inhabitable. As for the irreversible effects as defined in French LUP (50 mbar), the area is enormous, but the impacted population is less than 1000 when using the population density of Yeoui-dong, which is 3919 persons/km2. We subtracted the area of the HRS itself, i.e., 1236 m2 [5,17]. For large leaks, the number of impacted people is between 10 and 100, which is regarded as “Major”. For catastrophic ruptures, the numbers are high enough to correspond to “Disastrous” overall. Table 13 shows the gravity levels expressed in relation to the number of people exposed in French LUP.

Table 13.
Gravity levels expressed in relation to the number of people exposed (courtesy copied from UNEC [16]).
The large-leak frequencies for a tube trailer and an HP storage tank are 1.8 × 10⁻⁴/yr and 1.03 × 10⁻⁴/yr, respectively. Additionally, the catastrophic rupture frequency is equal to or less than 1 × 10⁻⁶/yr in general QRAs [18]. Thus, in Table 14 below, “C” is chosen for large leaks and “E” is chosen for catastrophic ruptures.

Table 14.
French national risk acceptability matrix for land use planning evaluations and restrictions in relation to the presence of hazardous activities (courtesy copied from UNEC [16]).
For large leaks, “Major” and “C” are chosen, corresponding to the “MMR2” grade in Table 15.

Table 15.
Zoning criteria in the national guide for technological risk prevention plans (courtesy copied from UNEC [16]).
Catastrophic ruptures are categorized as “Disastrous” and “E”, corresponding to NO MMR2, which means “(NO for the future/MMR2 for the existing buildings): no more than five dangerous phenomena can be placed in these cells after the operator has taken all measures to reduce the risk”.
Since the HRS already exists and there are less than five dangerous phenomena under MMR2, it is appropriate to be operated with the current status.
3.3. Discussion
There have been many QRA studies on actual HRSs recently. The following are two representative studies that used individual risk curves to calculate the safety distances. We attempt to compare and discuss the results.
Gye et al. used a full QRA methodology to obtain the individual risk (IR) contours and societal risk for the population around an HRS, and verified that leaks from the tube trailer and dispenser, as well as potential explosions of the tube trailer, were the main risks [19]. Park et al. also used a LOPA technique to take active and passive safety devices into account [20]. In their study, the population was also used for the decision making of the HRS.
The process conditions as well as accident scenarios used in these studies were obviously different from one another, and the conclusions drawn regarding the acceptable location are arguable when considering different populations around the facilities.
Unlike other studies, this study presents an approach that uses the CA matrix and frequency of LUP. However, the results from LUP and CA in this study have drawbacks: for example, they do not consider safety measures to decrease the distances of potential fatality contours. This demonstrates the limitation in using only the consequences without the safety measures, which needs to be improved in the future.
The HRS was already located where it is now, which means it was an existing plant. The condition of “no more than five dangerous phenomena can be placed in these cells” has been achieved, since only two catastrophic rupture scenarios and two large-leak scenarios can be found under the MMR2 cells.
On the other hand, there can be issues with HyRAM and PHAST simulations, which use a 2D layout. As hydrogen is released, it will easily rise due to its low density. Therefore, 3D modeling using CFD (computational fluid dynamics) for dispersion and jet fires can be utilized as an alternative method. However, a limitation of CFD programs is that they are very expensive and time-consuming. In the near future, with the continuous advancement of computer techniques, these limitations are expected to be overcome.
4. Conclusions
This study confirmed the safety against jet fires and overpressure via simulations based on modeling close to an actual HRS through the HyRAM and PHAST 8.0. Using the French land use planning technique, the adequacy of the site location was analyzed. The results are as follows.
- As a result of the analysis based on the HyRAM’s jet fire modeling, the risk effect distance of a jet fire that occurs after hydrogen leakage due to small and medium leaks is small enough to comply with the jet fire safety distance suggested in the KGS Code. Large leaks are less likely, since the leak diameter is larger than the pipe diameter. Therefore, we conclude that installation would be safe even if a jet fire occurs in the tube trailer and hydrogen storage tank, which stores the largest quantity of hydrogen.
- Based on the HyRAM’s overpressure modeling, if an explosion occurs after a long-term leakage, which indicates a later ignition point, the damage will be considerable; however, hydrogen cannot stay in one place for a long time. Therefore, by analyzing the graph of the change in overpressure of the tube trailer and hydrogen storage tank, if the hydrogen remains for approximately five seconds after the leak and then explodes, the explosion impact would be considerable.
- As a result of analyzing the overpressure results obtained through PHAST 8.0, the risk impact distance of the scenarios for small and medium leaks did not exceed the range of the HRS; therefore, no effect on the outside area of the HRS was identified. Large-leak scenarios would impact the outside of the HRS. Using the French land use planning technique, all scenarios correspond to MMR2, which is the extent to which hazardous facility permits can be issued after implementing all possible safety measures.
- According to the accident frequency data, the probability that a catastrophic rupture will occur at an HRS is very low. In the LUP matrix, the catastrophic rupture scenarios correspond to MMR2. Only two scenarios correspond to this category and are appropriate for the existing plant.
To summarize, the risk of HRSs appears to be acceptable; however, all feasible safety measures should be implemented when HRSs are installed in this area. Comprehensive management is also essential to prevent accidents. Incident frequencies due to car accidents, power loss, and natural disasters were not discussed in this study but may be a topic of future works on hydrogen fueling station safety.
Author Contributions
Conceptualization, J.K.; methodology, J.P.; software, J.K.; validation, H.L.; formal analysis, J.K.; investigation, H.L.; resources, H.L.; data curation, S.P.; writing—original draft preparation, J.K.; writing—review and editing, S.J.; supervision, S.J.; project administration, S.J.; funding acquisition, S.J. All authors have read and agreed to the published version of the manuscript.
Funding
This work was supported by the National Research Foundation of Korea (NRF) grant funded by the Korean government (MSIT) (No. 2022R1F1A106546111).
Informed Consent Statement
Not applicable.
Data Availability Statement
Not applicable.
Conflicts of Interest
The authors declare no conflict of interest.
References
- Kim, H.C. Domestic and Foreign Policy Trends and Convergence Research Policy Center for the Preparation of Hydrogen Economy and Society; Convergence Research Center: Seoul, Republic of Korea, 2017. [Google Scholar]
- Bae, Y.I. Recommendations for Successful Settlement of Regulatory Sandbox; Gyunggi Research Center: Suwon, Republic of Korea, 2019. [Google Scholar]
- Bauer, A.; Mayer, T.; Semmel, M.; Morales, M.A.G.; Wind, J. Energetic evaluation of hydrogen refueling stations with liquid or gaseous stored hydrogen. Int. J. Hydrog. Energy 2019, 44, 6795–6812. [Google Scholar] [CrossRef]
- Kang, S.K.; Huh, Y.S.; Moon, J.S. A Study on Safety Improvement for Packaged Hydrogen Refueling Station by Risk Assessment; The Transactions of the Korean Hydrogen and New Energy Society: Seoul, Republic of Korea, 2017. [Google Scholar]
- National Population Density of South Korea. Available online: https://www.index.go.kr/unity/potal/main/EachDtlPageDetail.do?idx_cd=1007 (accessed on 4 March 2023).
- Korean Hydrogen Distribution Institution. Available online: https://www.h2nbiz.or.kr/index.do (accessed on 18 September 2022).
- Korea Occupational Safety and Health Agency. Technical Guidelines on Selection of Worst-and-Alternative Leakage Scenarios (P-107-2016); Korea Occupational Safety and Health Agency: Ulsan, Republic of Korea, 2016. [Google Scholar]
- Lachance, J.; Houf, W.; Fluer, L.; Middleton, B. Analyses to Support Development of Risk-Informed Separation Distances for Hydrogen Codes and Standards. 2009. Available online: https://energy.sandia.gov/wp-content/uploads/2018/05/SAND2009-0874-Analyses-to-Support-Development-of-Risk-Informed-Separation-Distances-for-Hydrogen-Codes-and-Standards.pdf (accessed on 4 March 2023).
- Hua, T.Q.; Ahluwalia, R.K.; Peng, J.; Kromer, M.; Lasher, S.; McKenney, K.; Law, K.; Sinha, J. Technical assessment of compressed hydrogen storage tank systems for automotive applications. Int. J. Hydrog. Energy 2011, 36, 3037–3049. [Google Scholar] [CrossRef]
- Wang, T.; Yang, F.; Hu, Q.; Hu, S.; Li, Y.; Ouyang, M. Experimental and simulation research on hydrogen leakage of double ferrule joints. Process Saf. Environ. Prot. 2022, 160, 839–846. [Google Scholar] [CrossRef]
- Houf, W.; Schefer, R. Predicting radiative heat fluxes and flammability envelopes from unintended releases of hydrogen. Int. J. Hydrog. Energy 2007, 32, 136–151. [Google Scholar] [CrossRef]
- Ekoto, I.; Ruggles, A.; Creitz, L.; Li, J. Updated jet flame radiation modeling with buoyancy corrections. Int. J. Hydrog. Energy 2014, 39, 20570–20577. [Google Scholar] [CrossRef]
- Birch, A.D.; Hughes, D.J.; Swaffield, F. Velocity Decay of High Pressure Jets. Combust. Sci. Technol. 1987, 52, 161–171. [Google Scholar] [CrossRef]
- KGS. Code Facilities, Technology, and Inspection Standards for Charging Storage-Type Hydrogen Vehicles. 2017. Available online: https://cyber.kgs.or.kr/codesrc/kgscode_pdf/2020/FP217_200318_E_V.PDF;cyberJSESSIONID=G-L0bJg5zgdW8Q3U85tWLLOwYXH3ky_rmcdF7w2Vl0hBA98Y1a25!686221879!NONE (accessed on 4 March 2023).
- Bauwens, C.; Dorofeev, S. CFD modeling and consequence analysis of an accidental hydrogen release in a large scale facility. Int. J. Hydrog. Energy 2014, 39, 20447–20454. [Google Scholar] [CrossRef]
- UNECE. Guidance on Land-Use Planning, the Siting of Hazardous Activities and related Safety Aspects; United Nations Economic Commission for Europe: Geneva, Switzerland, 2018. [Google Scholar]
- HRS Area. Available online: https://www.h2news.kr/news/article.html?no=7555 (accessed on 1 November 2022).
- Kim, C.; Lee, Y.; Kim, K. Comparative Risk Assessment of a Hydrogen Refueling Station Using Gaseous Hydrogen and Formic Acid as the Hydrogen Carrier. Energies 2023, 16, 2613. [Google Scholar] [CrossRef]
- Gye, H.-R.; Seo, S.-K.; Bach, Q.-V.; Ha, D.; Lee, C.-J. Quantitative risk assessment of an urban hydrogen refueling station. Int. J. Hydrog. Energy 2019, 44, 1288–1298. [Google Scholar] [CrossRef]
- Park, B.; Kim, Y.; Lee, K.; Paik, S.; Kang, C. Risk Assessment Method Combining Independent Protection Layers (IPL) of Layer of Protection Analysis (LOPA) and RISKCURVES Software: Case Study of Hydrogen Refueling Stations in Urban Areas. Energies 2021, 14, 4043. [Google Scholar] [CrossRef]
Disclaimer/Publisher’s Note: The statements, opinions and data contained in all publications are solely those of the individual author(s) and contributor(s) and not of MDPI and/or the editor(s). MDPI and/or the editor(s) disclaim responsibility for any injury to people or property resulting from any ideas, methods, instructions or products referred to in the content. |
© 2023 by the authors. Licensee MDPI, Basel, Switzerland. This article is an open access article distributed under the terms and conditions of the Creative Commons Attribution (CC BY) license (https://creativecommons.org/licenses/by/4.0/).