
Investigation of Energy and Economic Balance and GHG Emissions in the Production of Different Cultivars of Buckwheat (Fagopyrum esculentum Moench): A Case Study in Northeastern Poland


Abstract
1. Introduction
2. Materials and Methods
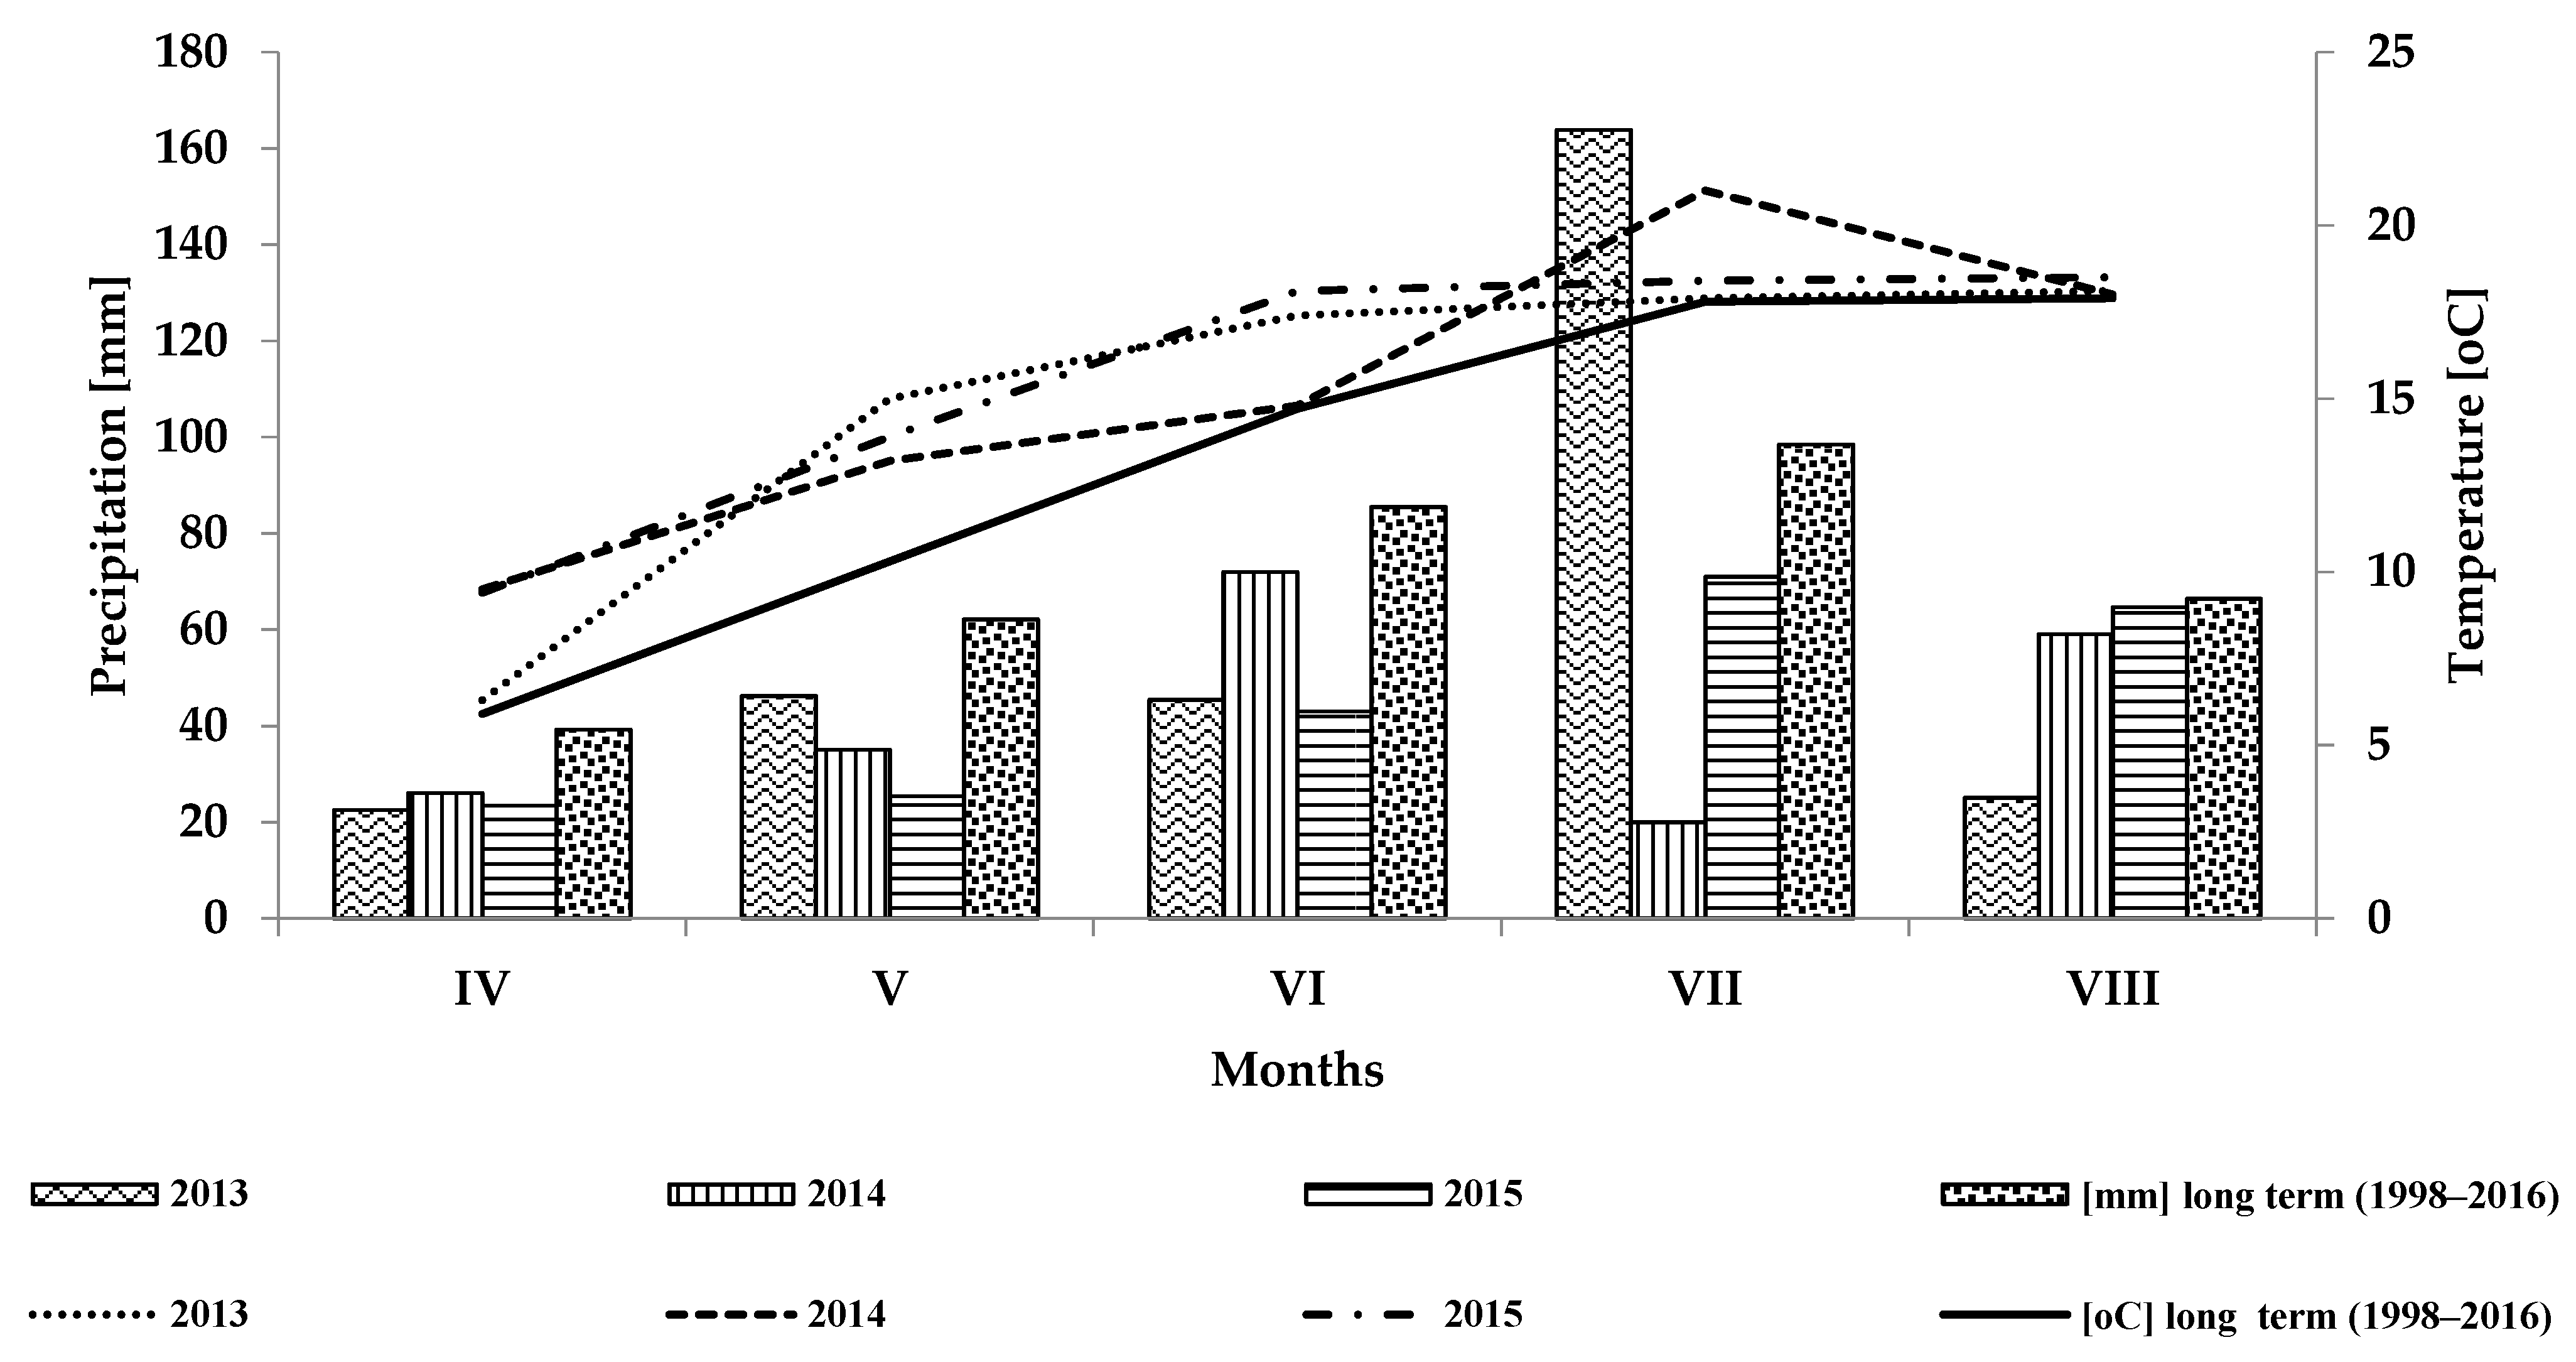
2.1. Experimental Site
2.2. Energy Efficiency
2.3. GHG Emission
2.4. Economic Efficiency
3. Results
3.1. Input–Output Analysis of Energy Use in Buckwheat Production
3.2. Energy Efficiency Indicators
3.2.1. Net Energy Gain
3.2.2. Specific Energy
3.2.3. Energy Productivity
3.2.4. Energy Use Efficiency
3.2.5. Direct and Indirect Energy
3.2.6. Renewable and Nonrenewable Energy
3.3. GHG Emission
3.4. Economic Analysis
4. Discussion
4.1. Input–Output Analysis of Energy Use in Buckwheat Production
4.2. Energy Efficiency Indicators
4.2.1. Energy Efficiency Indicators
4.2.2. Specific Energy
4.2.3. Energy Productivity
4.2.4. Energy Use Efficiency
4.2.5. Direct and Indirect Energy
4.2.6. Renewable and Nonrenewable Energy
4.3. GHG Emission
4.4. Economic Analysis
5. Conclusions
Author Contributions
Funding
Data Availability Statement
Conflicts of Interest
Nomenclature, Symbols and Abbreviations
| GHG | greenhouse gas emissions |
| E | energy |
| J | joule |
| GJ | gigajoule |
| MJ | megajoule |
| CO2 | carbon dioxide |
| NO2 | nitrous oxide |
| N | nitrogen |
| P2O5 | superphosphate |
| K2O | potash salt |
| NH4NO3 | ammonium nitrate |
| MgO | magnesium oxide |
| SO3 | sulphur trioxide |
| Mg | magnesium |
| S | sulphur |
| flurochloridon | the active substance of the weed control preparation |
| triadimenol, triadimenol, fuberizadol | the active substances of the fungal preparation |
| trinexapac-ethyl | the active substances of the growth regulator preparation |
| dimetipin | the active substances of the accelerates ripening preparation |
| GNOC | Global Nitrous Oxide Calculator |
| IPCC | Intergovernmental Panel on Climate Change |
| FAO | Food and Agricultural Organisation |
| KOBiZE | The National Centre for Emissions Management |
| Ei total | the total energy input for buckwheat production (GJ ha−1): |
| Ei human labour | the energy input for human labour (GJ ha−1); |
| Ei fixed assets | the energy input for fixed assets (GJ ha−1); |
| Ei diesel | the energy input for diesel fuel consumption (GJ ha−1); |
| Ei materials | the energy input for materials (GJ ha−1). |
| eec | the GHG emissions from buckwheat production: |
| eseed | the emissions from the use of seed; |
| echem | the emissions from production and transport of fertilisers and agrichemicals; |
| eirr | the emissions from irrigation; |
| efield | the emissions from tillage (soil emissions); |
| emm | the emissions from agricultural and forestry machinery and other mobile or stationary equipment; |
| echem | the emissions from production and transport of fertilisers and agrichemicals. |
| Qchem | the amount of fertilisers or plant protection products |
| Fchem | the GHG emissions factor for production and transport of mineral fertilisers or plant protection products |
| emm | the emissions from agricultural and forestry machinery and other mobile or stationary equipment |
| Qmmf | the fuel consumption by agricultural and forestry machinery |
| Ef | the emission factor for fuel production and use |
References
- Campbell, C.G. Buckwheat: Fagopyrum esculentum Moench. In Promoting the Conservation and Use of Underutilized and Neglected Crops, 19; International Plant Genetic Resources Institute: Rome, Italy, 1997. [Google Scholar]
- Jacquemart, A.L.; Cawoy, V.; Kinet, J.M.; Ledent, J.F.; Quinet, M. Is buckwheat (Fagopyrum Esculentum Moench) Still a Valuable Crop Today? Eur. J. Plant. Sci. Biotechnol. 2012, 6, 1–10. Available online: http://www.globalsciencebooks.info/Online/GSBOnline/images/2012/EJPSB_6%28SI2%29/EJPSB_6%28SI2%291-10o.pdf (accessed on 4 November 2021).
- Small, E. Buckwheat—The world’s most biodiversity-friendly crop? Biodiversity 2017, 18, 108–123. [Google Scholar] [CrossRef]
- Bekkering, C.S.; Tian, L. Thinking outside of the cereal box: Breeding underutilized (pseudo) cereals for improved human nutrition. Front. Genet. 2019, 10, 1289. [Google Scholar] [CrossRef] [PubMed]
- Koval, D.; Plocková, M.; Kyselka, J.; Skřivan, P.; Sluková, M.; Horáčková, Š. Buckwheat secondary metabolites: Potential antifungal agents. J. Agric. Food Chem. 2020, 68, 11631–11643. [Google Scholar] [CrossRef] [PubMed]
- Martínez-Villaluenga, C.; Peñas, E.; Hernández-Ledesma, B. Pseudocereal grains: Nutritional value, health benefits and current applications for the development of gluten-free foods. Food Chem. Toxicol. 2020, 137, 111178. [Google Scholar] [CrossRef]
- Kumar, V.; Brainard, D.C.; Bellinder, R.R. Suppression of Powell amaranth (Amaranthus powellii), shepherd’spurse (Capsella bursa-pastoris), and corn chamomile (Anthemis arvensis) by buckwheat residues: Role of nitrogen and fungal pathogens. Weed Sci. 2008, 56, 271–280. [Google Scholar] [CrossRef]
- Arcand, M.A.; Lynch, D.H.; Voroney, R.P.; Straaten, P. Residues from a buckwheat (Fagopyrum esculentum) green manure crop grown with phosphate rock influence bioavailability of soil phosphorus. Can. J. Soil Sci. 2010, 90, 257–266. [Google Scholar] [CrossRef]
- FAOSTAT 2016-1018. Available online: http://www.fao.org/food-agriculture-statistics/en/ (accessed on 4 November 2021).
- Rana, J.C.; Chauhan, R.C.; Sharma, T.R.; Gupta, N. Analyzing problems and prospects of buckwheat cultivation in India. Eur. J. Plant Sci. Biotechnol. 2012, 2, 50–56. Available online: http://www.globalsciencebooks.info/Online/GSBOnline/images/2012/EJPSB_6(SI2)/EJPSB_6(SI2)50-56o.pdf (accessed on 4 November 2021).
- Luitel, D.R.; Siwakoti, M.; Jha, P.K.; Jha, A.K.; Krakauer, N. An overview: Distribution, production, and diversity of local landraces of buckwheat in Nepal. Adv. Agric. 2017, 2, 2738045. [Google Scholar] [CrossRef]
- Ferraro, D.O. Energy use in cropping systems: A regional long-term exploratory analysis of energy allocation and efficiency in the Inland Pampa (Argentina). Energy 2010, 44, 490–497. [Google Scholar] [CrossRef]
- Wang, Y.W. Sustainable Agricultural Practices: Energy Inputs and Outputs, Pesticide, Fertilizer and Greenhouse Gas Management. Asia Pac. J. Clin. Nutr. 2009, 18, 498–500. Available online: https://apjcn.nhri.org.tw/server/APJCN/18/4/498.pdf (accessed on 4 November 2021).
- Erdal, G.; Esengün, K.; Erdal, H.; Gündüz, O. Energy use and economical analysis of sugar beet production in Tokat province of Turkey. Energy 2007, 1, 35–41. [Google Scholar] [CrossRef]
- Wise, M.; Dooley, J.; Luckow, P.; Calvin, K.; Kyle, P. Agriculture, land use, energy and carbon emission impacts of global biofuel mandates to midcentury. Appl. Energy 2014, 114, 763–773. [Google Scholar] [CrossRef]
- Lal, B.; Rajput, D.S.; Tamhankar, M.B.; Agarwal, I.; Sharma, M.S. Energy use and output assessment of food-forage production systems. J. Agron. Crop Sci. 2003, 189, 57–62. [Google Scholar] [CrossRef]
- Falcone, G.; Stillitano, T.; De Luca, A.I.; Di Vita, G.; Iofrida, N.; Strano, A.; Gulisano, G.; Pecorino, B.; D’Amico, M. Energetic and economic analyses for agricultural management models: The Calabria PGI Clementine case study. Energies 2020, 13, 1289. [Google Scholar] [CrossRef]
- López-Vázquez, A.; Cadena-Zapata, M.; Campos-Magaña, S.; Zermeño-Gonzalez, A.; Mendez-Dorado, M. Comparison of energy used and effects on bulk density and yield by tillage systems in a semiarid condition of Mexico. Agronomy 2019, 9, 189. [Google Scholar] [CrossRef]
- Ilyas, H.M.A.; Safa, M.; Bailey, A.; Rauf, S.; Khan, A. Energy efficiency outlook of New Zealand dairy farming systems: An application of data envelopment analysis (DEA) Approach. Energies 2020, 13, 251. [Google Scholar] [CrossRef]
- Uhlin, H.E. Why energy productivity is increasing: An I-O analysis of Swedish agriculture. Agric. Syst. 1998, 56, 443–465. [Google Scholar] [CrossRef]
- Kondratieva, N.P.; Vladykin, I.R.; Litvinova, V.M.; Krasnolutskaya, M.G.; Bolshin, R.G. Energy-saving technologies and electric equipment applied in agriculture. Res. Agric. Electr. Eng. 2016, 2, 62–68. [Google Scholar] [CrossRef]
- Mushtaq, K.; Abbas, F.; Ghafoor, A. Energy use for economic growth: Cointegration and causality analysis from the agriculture sector of Pakistan. Pak. Dev. Rev. 2007, 46, 1065–1073. [Google Scholar] [CrossRef]
- Qiao, F. Increasing wage, mechanization, and agriculture production in China. China Econ. Rev. 2017, 46, 249–260. [Google Scholar] [CrossRef]
- Kalita, A. Changes in labor pattern and agricultural mechanization. J. Manag. Res. Anal. 2019, 6, 9–13. [Google Scholar] [CrossRef]
- Perea, R.G.; Poyato, E.C.; Montesinos, P.; Díaz, J.R. Prediction of irrigation event occurrence at farm level using optimal decision trees. Comput. Electron. Agric. 2018, 157, 173–180. [Google Scholar] [CrossRef]
- Haberl, H.; Fischer-Kowalski, M.; Krausmann, F.; Weisz, H.; Winiwarter, V. Progress towards sustainability? What the conceptual framework of material and energy flow accounting (MEFA) can offer. Land Use Policy 2004, 21, 199–213. [Google Scholar] [CrossRef]
- Ballarin, A.; Vecchiato, D.; Tempesta, T.; Marangon, F.; Troiano, S. Biomass energy production in agriculture: A weighted goal programming analysis. Energy Policy 2011, 39, 1123–1131. [Google Scholar] [CrossRef]
- Gabrielle, B.; Bamière, L.; Caldes, N.; De Cara, S.; Decocq, G.; Ferchaud, F.; Richard, G. Paving the way for sustainable bioenergy in Europe: Technological options and research avenues for large-scale biomass feedstock supply. Renew. Sustain. Energy Rev. 2014, 33, 11–25. [Google Scholar] [CrossRef]
- Jasinskas, A.; Sakalauskas, A.; Domeika, R. Evaluation of physical-mechanical properties of herbaceous bioenergy plants. Biomass Bioenergy 2008, 32, 952–958. [Google Scholar] [CrossRef]
- Jasinskas, A.; Ulozevičiūtė, I.; Rutkauskas, G. Plant Biomass Production and Use as an Environmentally-Friendly Local Fuel. Pol. J. Environ. Stud. 2012, 21, 89–94. Available online: http://www.pjoes.com/pdf-88728-22587?filename=Plant%20Biomass%20Production.pdf (accessed on 4 November 2021).
- Godard, C.; Boissy, J.; Gabrielle, B. Life-cycle assessment of local feedstock supply scenarios to compare candidate biomass sources. Gcb Bioenergy 2013, 5, 16–29. [Google Scholar] [CrossRef]
- Popp, J.; Lakner, Z.; Harangi-Rakos, M.; Fari, M. The effect of bioenergy expansion: Food, energy, and environment. Renew. Sustain. Energy Rev. 2014, 32, 559–578. [Google Scholar] [CrossRef]
- Bilgen, S.; Keleş, S.; Sarıkaya, I.; Kaygusuz, K. A perspective for potential and technology of bioenergy in Turkey: Present case and future view. Renew. Sustain. Energy Rev. 2015, 48, 228–239. [Google Scholar] [CrossRef]
- Araújo, K.; Mahajan, D.; Kerr, R.; Silva, M.D. Global biofuels at the crossroads: An overview of technical, policy, and investment complexities in the sustainability of biofuel development. Agriculture 2017, 7, 32. [Google Scholar] [CrossRef]
- Öztürk, M.; Saba, N.; Altay, V.; Iqbal, R.; Hakeem, K.R.; Jawaid, M.; Ibrahim, F.H. Biomass and bioenergy: An overview of the development potential in Turkey and Malaysia. Renew. Sustain. Energy Rev. 2017, 79, 1285–1302. [Google Scholar] [CrossRef]
- Collotta, M.; Champagne, P.; Tomasoni, G.; Alberti, M.; Busi, L.; Mabee, W. Critical indicators of sustainability for biofuels: An analysis through a life cycle sustainability assessment perspective. Renew. Sustain. Energy Rev. 2019, 115, 109358. [Google Scholar] [CrossRef]
- Jasinskas, A.; Streikus, D.; Vonžodas, T. Fibrous hemp (Felina 32, USO 31, Finola) and fibrous nettle processing and usage of pressed biofuel for energy purposes. Renew. Energy 2020, 149, 11–21. [Google Scholar] [CrossRef]
- Chang, J.; Leung, D.Y.; Wu, C.Z.; Yuan, Z.H. A review on the energy production, consumption, and prospect of renewable energy in China. Renew. Sustain. Energy Rev. 2003, 7, 453–468. [Google Scholar] [CrossRef]
- Inumula, K.M.; Singh, S.; Solanki, S. Energy consumption and agricultural economic growth nexus: Evidence from India. Int. J. Energy Econ. Policy 2020, 10, 545. [Google Scholar] [CrossRef]
- Pamučar, D.; Behzad, M.; Božanić, D.; Behzad, M. Decision making to support sustainable energy policies corresponding to agriculture sector: Case study in Iran’s Caspian Sea coastline. J. Clean. Prod. 2020, 292, 125302. [Google Scholar] [CrossRef]
- Pelletier, N.; Audsley, E.; Brodt, S.; Garnett, T.; Henriksson, P.; Kendall, A.; Kramer, K.J.; Murphy, D.; Nemecek, T.; Troell, M. Energy intensity of agriculture and food systems. Annu. Rev. Environ. Resour. 2011, 36, 223–246. [Google Scholar] [CrossRef]
- Chen, P.-C.; Yu, M.-M.; Chang, C.C.; Hsu, S.-H. Total factor productivity growth in China’s agricultural sector. China. Econ. Rev. 2008, 19, 580–593. [Google Scholar] [CrossRef]
- Ghisellini, P.; Setti, M.; Ulgiati, S. Energy and land use in worldwide agriculture: An application of life cycle energy and cluster analysis. Environ. Dev. Sustain. 2016, 18, 799–837. [Google Scholar] [CrossRef]
- Pellegrini, P.; Fernández, R.J. Crop intensification, land use, and on-farm energy-use efficiency during the worldwide spread of the green revolution. Proc. Natl. Acad. Sci. USA 2018, 115, 2335–2340. [Google Scholar] [CrossRef] [PubMed]
- Arodudu, O.T.; Helming, K.; Voinov, A.; Wiggering, H. Integrating agronomic factors into energy efficiency assessment of agro-bioenergy production. A case study of ethanol and biogas production from maize feedstock. Appl. Energy 2017, 198, 426–439. [Google Scholar] [CrossRef]
- Tilley, D.R.; Martin, J.F. Environmental accounting of agricultural sustainability using energy analysis. In Systems Analysis Modeling in Food Agriculture Encyclopedia of Life Support Systems; Ting, K.C., Fleisher, D.H., Rodriguez, L.F., Eds.; United Nations Educational, Scientific and Cultural Organisation, Eolss Publisher: Oxford, UK, 2006. [Google Scholar]
- Gündoğmuş, M.E. Energy use on organic farming: A comparative analysis on organic versus conventional apricot production on small holdings in Turkey. Energy Convers. Manag. 2006, 47, 3351–3359. [Google Scholar] [CrossRef]
- Esengün, K.; Gündüz, O.; Erdal, G. Input–output energy analysis in dry apricot production of Turkey. Energy Convers. Manag. 2007, 48, 592–598. [Google Scholar] [CrossRef]
- Rathke, G.W.; Diepenbrock, W. Energy balance of winter oilseed rape (Brassica napus L.) cropping as related to nitrogen supply and preceding crop. Eur. J. Agron. 2006, 24, 35–44. [Google Scholar] [CrossRef]
- Unakitan, G.; Hurma, H.; Yilmaz, F. An analysis of energy use efficiency of canola production in Turkey. Energy 2010, 35, 3623–3627. [Google Scholar] [CrossRef]
- Budzyński, W.S.; Jankowski, K.J.; Jarocki, M. An analysis of the energy efficiency of winter rapeseed biomass under different farming technologies. A case study of a large-scale farm in Poland. Energy 2015, 90, 1272–1279. [Google Scholar] [CrossRef]
- Groth, D.A.; Sokólski, M.; Jankowski, K.J. A multi-criteria evaluation of the effectiveness of nitrogen and sulfur fertilization in different cultivars of winter rapeseed productivity, economic and energy balance. Energies 2020, 13, 4654. [Google Scholar] [CrossRef]
- Banaeian, N.; Zangeneh, M. Study on energy efficiency in corn production of Iran. Energy 2011, 36, 5394–5402. [Google Scholar] [CrossRef]
- Šarauskis, E.; Buragienė, S.; Masilionytė, L.; Romaneckas, K.; Avižienytė, D.; Sakalauskasa, A. Energy balance, costs and CO2 analysis of tillage technologies in maize cultivation. Energy 2014, 69, 227–235. [Google Scholar] [CrossRef]
- Konieczna, A.; Roman, K.; Roman, M.; Śliwiński, D.; Roman, M. Energy efficiency of maize production technology: Evidence from Polish farms. Energies 2021, 14, 170. [Google Scholar] [CrossRef]
- Yilmaz, I.; Akcaoz, H.; Özkan, B. An analysis of energy use and input costs for cotton production in Turkey. Renew. Energy 2005, 30, 145–155. [Google Scholar] [CrossRef]
- Demircan, V.; Ekinci, K.; Keenar, H.M.; Akbotat, D.; Ekinic, C. Energy and economic analysis of sweet cherry production in Turkey: A case study from Isparta Province. Energy Convers. Manag. 2006, 47, 1761–1769. [Google Scholar] [CrossRef]
- Asgharipour, M.; Mondani, F.; Riahinia, S. Energy use efficiency and economic analysis of sugar beet production system in Iran: A case study in Khorasan Razavi province. Energy 2012, 44, 1078–1084. [Google Scholar] [CrossRef]
- Šarauskis, E.; Romaneckas, K.; Kumhála, F.; Kriaučiūnienė, Z. Energy use and carbon emission of conventional and organic sugar beet farming. J. Clean. Prod. 2018, 201, 428–438. [Google Scholar] [CrossRef]
- Özkan, B.; Akcaoz, H.; Fert, C. Energy input–output analysis in Turkish agriculture. Renew. Energy 2004, 29, 39–51. [Google Scholar] [CrossRef]
- Mohammadi, A.; Rafiee, S.; Mohtasebi, S.S.; Rafiee, H. Energy inputs-yield relationship and cost analysis of kiwifruit production in Iran. Renew. Energy 2010, 35, 1071–1075. [Google Scholar] [CrossRef]
- Mohammadi, A.; Tabatabaeefar, A.; Shahin, S.; Rafiee, S.; Keyhani, A. Energy use and economical analysis of potato production in Iran a case study: Ardabil province. Energy Convers. Manag. 2008, 49, 3566–3570. [Google Scholar] [CrossRef]
- Pahlavan, R.; Omid, M.; Akram, A. Energy input–output analysis and application of artificial neural networks for predicting greenhouse basil production. Energy 2012, 37, 171–176. [Google Scholar] [CrossRef]
- Özkan, B.; Kurklu, A.; Akcaoz, H. An input-output energy analysis in greenhouse vegetable production: A case study for Antalya region of Turkey. Biomass Bioenergy 2004, 26, 189–195. [Google Scholar] [CrossRef]
- Mohammadi, A.; Omid, M. Economical analysis and relation between energy inputs and yield of greenhouse cucumber production in Iran. Appl. Energy 2010, 87, 191–196. [Google Scholar] [CrossRef]
- Mobtaker, H.G.; Keyhani, A.; Mohammadi, A.; Rafiee, S.; Akram, A. Sensitivity analysis of energy inputs for barley production in Hamedan Province of Iran. Agric. Ecosyst. Environ. 2010, 137, 367–372. [Google Scholar] [CrossRef]
- Szwejkowska, B.; Bielski, S. Comparison of Energetical and Economical Effectiveness of Different Technologies of Pea Production. Pol. J. Nat. Sc. 2007, 3, 373–382. Available online: https://www.infona.pl/resource/bwmeta1.element.agro-article-eadbabe5-ccde-4e29-b0b7-8238fed5d332 (accessed on 4 November 2021). [CrossRef]
- Salimi, P.; Ahmadi, H. Energy Inputs and Outputs in a Chickpea Production System in Kurdistan, Iran. Afr. Crop Sci. J. 2010, 18, 51–57. [Google Scholar] [CrossRef]
- Bielski, S. Energy balance evaluation of winter triticale production. Engineering for Rural Development. Proceedings 2015, 4, 552–557. Available online: http://www.tf.llu.lv/conference/proceedings2015/Papers/090_Bielski.pdf (accessed on 4 November 2021).
- Šarauskis, E.; Romaneckas, K.; Jasinskas, A.; Kimbirauskienė, R.; Naujokienė, V. Improving energy efficiency and environmental mitigation through tillage management in faba bean production. Energy 2020, 209, 118453. [Google Scholar] [CrossRef]
- Jankowski, K.J.; Sokólski, M. Spring camelina: Effect of mineral fertilization on the energy efficiency of biomass production. Energy 2020, 220, 119731. [Google Scholar] [CrossRef]
- Alluvione, F.; Moretti, B.; Sacco, D.; Grignani, C. EUE (energy use efficiency) of cropping systems for a sustainable agriculture. Energy 2011, 36, 4468–4481. [Google Scholar] [CrossRef]
- Singh, H.; Mishra, D.; Nahar, N.M. Energy use pattern in production agriculture of a typical village in arid zone, Indiae part-I. Energy Convers. Manag. 2002, 43, 2275–2286. [Google Scholar] [CrossRef]
- Olabi, A.G. Energy quadrilemma and the future of renewable energy. Energy 2016, 108, 1–6. [Google Scholar] [CrossRef]
- Hülsbergen, K.J.; Feil, B.; Biermann, S.; Rathke, G.W.; Kalk, W.D.; Diepenbrock, W. A method of energy balancing in crop production and its application in a long-term fertilizer trial. Agric. Ecosyst. Environ. 2001, 86, 303–321. [Google Scholar] [CrossRef]
- Beheshti Tabar, I.; Keyhani, A.; Rafiee, S. Energy balance in Iran’s agronomy (1990–2006). Renew. Sust. Energ. Rev. 2010, 14, 849–855. [Google Scholar] [CrossRef]
- Wójcicki, Z. Poszanowanie Energii i Środowiska w Rolnictwie i na Obszarach Wiejskich; IBMER: Warszawa, Poland, 2007. (In Polish) [Google Scholar]
- Zentner, R.P.; Lafond, G.P.; Derksen, D.A.; Nagy, C.N.; Wall, D.D.; May, W.E. Effects of tillage method and crop rotation on non-renewable energy use efficiency for a thin Black Chernozem in the Canadian prairies. Soil Tillage Res. 2004, 77, 125–136. [Google Scholar] [CrossRef]
- Mandal, K.G.; Saha, K.P.; Ghosh, P.K.; Hati, K.M.; Bandyopadhyay, K.K. Bioenergy and economic analysis of soybean based crop production systems in central India. Biomass Bioenergy 2002, 23, 337–345. [Google Scholar] [CrossRef]
- Heidari, M.D.; Omid, M.; Mohammadi, A. Measuring productive efficiency of horticultural greenhouses in Iran: A data envelopment analysis approach. Expert Syst. Appl. 2011, 39, 1040–1045. [Google Scholar] [CrossRef]
- Pishgar-Komleh, S.H.; Omid, M.; Heidari, M.D. On the study of energy use and GHG (greenhouse gas) emissions in greenhouse cucumber production in Yazd province. Energy 2013, 59, 63–71. [Google Scholar] [CrossRef]
- Naderi, S.A.; Dehkordi, A.L.; Morteza, T. Energy and environmental evaluation of greenhouse bell pepper production with life cycle assessment approach. Environ. Sustain. Indic. 2019, 3–4, 100011. [Google Scholar] [CrossRef]
- Kizilaslan, H. Input–output energy analysis of cherries production in Tokat province of Turkey. Appl. Energy 2009, 86, 1354–1358. [Google Scholar] [CrossRef]
- Maraseni, T.; Chen, G.; Banhazi, T.; Bundschuh, J.; Yusaf, T. An Assessment of direct on-farm energy use for high value grain crops grown under different farming practices in Australia. Energies 2015, 8, 13033–13046. [Google Scholar] [CrossRef]
- Singh, H.; Mishra, D.; Nahar, N.M.; Ranjan, M. Energy use pattern in production agriculture of a typical village in Arid Zone India (Part II). Energy Convers. Manag. 2003, 44, 1053–1067. [Google Scholar] [CrossRef]
- Oil and Gas Institute—National Research Institute (INiG-PIB). Guidelines for the Determination of the Life Cycle per Unit Values of GHG Emissions for Biofuels, Biomass Fuels and Bioliquids; Oil and Gas Institute-National Research Institute: Cracow, Poland, 2021. [Google Scholar]
- Wiśniewski, P.; Kistowski, M. Greenhouse gas emissions from cultivation of plants used for biofuel production in Poland. Atmosphere 2020, 11, 394. [Google Scholar] [CrossRef]
- European Union. Directive (EU) 2018/2001 of the European Parliament and of the Council of 11 December 2018 on the promotion of the use of energy from renewable sources. Off. J. Eur. Union 2018, L328, 82–209. [Google Scholar]
- Intergovernmental Panel on Climate Change (IPCC). Good Practice Guidance and Uncertainty Management in National Greenhouse Gas Inventories; IPCC: Hayama, Japan, 2000. [Google Scholar]
- Intergovernmental Panel on Climate Change (IPCC). 2006 IPCC Guidelines for National Greenhouse Gas Inventories; IPCC: Hayama, Japan, 2006. [Google Scholar]
- National Centre for Emission Management (KOBiZE). Poland’s National Inventory Report 2021. Greenhouse Gas Inventory for 1988–2019: Submission under the UN Framework Convention on Climate Change and Its Kyoto Protocol; KOBiZE: Warsaw, Poland, 2021. [Google Scholar]
- CarbonCloud, 2022. ClimateHub. Available online: https://apps.carboncloud.com/climatehub/ (accessed on 13 August 2022).
- Intergovernmental Panel on Climate Change (IPCC). Climate Change 2021: The Physical Science Basis. Contribution of Working Group I to the Sixth Assessment Report of the Intergovernmental Panel on Climate Change; IPCC: Cambridge, UK; New York, NY, USA, 2021. [Google Scholar]
- BioGrace-II 2022. The BioGrace-II GHG Calculation Tool for Electricity, Heating and Cooling. Available online: https://www.biograce.net/biograce2/content/ghgcalculationtool_electricityheatingcooling/overview (accessed on 13 August 2022).
- Commission Implementing Regulation (EU) 2022/996 of 14 June 2022 on Rules to Verify Sustainability and Greenhouse Gas Emissions Saving Criteria and Low Indirect Land-Use Change-Risk Criteria (Text with EEA Relevance). Available online: https://eur-lex.europa.eu/eli/reg_impl/2022/996/oj (accessed on 13 August 2022).
- Köble, R. The Global Nitrous Oxide Calculator—GNOC—Online Tool Manual. Version 1.2.4; European Commission Joint Research Centre: Brussels, Belgium, 2014. [Google Scholar]
- European Union. Communication from the Commission on the Practical Implementation of the EU Biofuels and Bioliquids Sustainability Scheme and on Counting Rules for Biofuels (2010/C 160/02). Off. J. Eur. Union. 2010. Available online: https://eur-lex.europa.eu/LexUriServ/LexUriServ.do?uri=OJ:C:2010:160:0008:0016:EN:PDF (accessed on 13 August 2022).
- Syp, A.; Faber, A.; Kozak, M. Assessment of N2O emissions from rapeseed cultivation in Poland by various approaches. Int. Agrophys. 2016, 30, 501–507. [Google Scholar] [CrossRef]
- Stehfest, E.; Bouwman, L. N2O and NO emission from agricultural fields and soils under natural vegetation: Summarizing available measurement data and modeling of global annual emissions. Nutr. Cycl. Agroecosyst. 2006, 74, 207–228. [Google Scholar] [CrossRef]
- Edwards, R.; Mulligan, D.; Giuntoli, J.; Agostini, A.; Boulamanti, A.; Koeble, R.; Marelli, L.; Moro, A.; Padella, M. Assessing GHG Default Emissions from Biofuels in EU Legislation. Review of Input Database to Calculate Default GHG Emissions, Following Expert Consultation 22–23 November 2011, Ispra (Italy). EUR 25595EN; Publication Office of the European Union: Luxembourg, 2012; JRC76057. [Google Scholar]
- Ruser, R.; Fuß, R.; Andres, M.; Hegewald, H.; Kesenheimer, K.; Köbke, S.; Räbiger, T.; Suarez Quinones, T.; Augustin, J.; Christen, O.; et al. Nitrous oxide emissions from winter oilseed rape cultivation. Agric. Ecosyst. Environ. 2017, 249, 57–69. [Google Scholar] [CrossRef]
- Ghorbani, R.; Mondani, F.; Amirmoradi, S.; Feizi, H.; Khorramdel, S.; Teimouri, M. A case study of energy use and economical analysis of irrigated and dry land wheat production systems. Appl. Energy 2011, 88, 283–288. [Google Scholar] [CrossRef]
- Woods, J.; Williams, A.; Hughes, J.K.; Black, M.; Murphy, R. Energy and the food system. Philos. Trans. R. Soc. B. 2010, 365, 2991–3006. [Google Scholar] [CrossRef]
- Pimentel, D.; Hepperly, P.; Hanson, J.; Douds, D.; Seidel, R. Environmental, energetic, and economic comparisons of organic and conventional farming systems. Bioscience 2005, 55, 573–582. [Google Scholar] [CrossRef]
- Fischer, T.; Byerlee, D.; Edmeades, G. Crop Yields and Global Food Security: Will Yield Increase Continue to Feed the World? 1st ed.; Twofoot Consulting Group: Canberra, Australia, 2014. [Google Scholar]
- Shannon, K.L.; Kim, B.F.; McKenzie, S.E.; Lawrence, R.S. Food system policy, public health and human rights in the United States. Annu. Rev. Public Health 2015, 36, 151–173. [Google Scholar] [CrossRef]
- Pereira, V.J. Energy consumption across European Union farms: Efficiency in terms of farming output and utilized agricultural area. Energy 2016, 103, 543–556. [Google Scholar] [CrossRef]
- Lu, H.; Bai, Y.; Ren, H.; Campbell, D.E. Integrated emergy, energy and economic evaluation of rice and vegetable production systems in alluvial paddy fields: Implications for agricultural policy in China. J. Environ. Manag. 2010, 91, 2727–2735. [Google Scholar] [CrossRef]
- Elsoragaby, S.; Yahya, A.; Mahadi, M.R.; Nawi, N.M.; Mairghany, M. Energy utilization in major crop cultivation. Energy 2019, 173, 1285–1303. [Google Scholar] [CrossRef]
- Kuczuk, A.; Pospolita, J. Sustainable agriculture—Energy and emergy aspects of agricultural production. Eur. Res. Stud. 2020, 4, 1000–1018. [Google Scholar] [CrossRef]
- Elsoragaby, S.; Yahya, A.; Mahadi, M.R.; Nawi, N.M.; Mairghany, M.; Elhassan, S.M.; Kheiralla, A.F. Applying multi-objective genetic algorithm (MOGA) to optimize the energy inputs and greenhouse gas emissions (GHG) in wetland rice production. Energy Rep. 2020, 6, 2988–2998. [Google Scholar] [CrossRef]
- Sławiński, K.; Grieger, A.; Sadowski, W. Energetyczna Ocena Konwencjonalnej i Ekologicznej Technologii Uprawy Gryki. Inżynieria Rol. 2009, 1, 297–302. Available online: http://yadda.icm.edu.pl/yadda/element/bwmeta1.element.baztech-article-BAR0-0044-0095/c/httpir_ptir_orgartykulypl110ir1102447pl.pdf (accessed on 4 November 2021).
- Kuczuk, A. Cumulative Energy Intensity and Energy Account in Cultivation of Buckwheat (Fagopyrum Esculentum Moench). J. Res. Appl. Agric. Eng. 2016, 61, 6–14. Available online: https://www.pimr.eu/wp-content/uploads/2019/05/2016_4_AK1.pdf (accessed on 4 November 2021).
- Lotfalian Dehkordi, A.; Forootan, M. Estimation of energy flow and environmental impacts of quinoa cultivation through life cycle assessment methodology. Environ. Sci. Pollut. 2020, 27, 21836–21846. [Google Scholar] [CrossRef]
- Sławiński, K.; Bujaczek, R. The Analysis of Energy Consumption in Link of Rotation: Winter Rye—Potato in System of Organic and Conventional Farming. Pol. J. Nat. Sci. 2012, 27, 353–358. Available online: http://www.uwm.edu.pl/polish-journal/sites/default/files/issues/articles/slawinski_and_bujaczek.pdf (accessed on 4 November 2021).
- Majchrzak, L.; Piskier, T. Energy efficiency of hybrid rye cultivation in relation to the manner of soil cultivation. Agric. Eng. 2014, 3, 85–91. [Google Scholar] [CrossRef]
- Moitzi, G.; Neugschwandtner, R.W.; Kaul, H.P.; Wagentristl, H. Energy efficiency of continuous rye, rotational rye and barley in different fertilization systems in a long-term field experiment. Agronomy 2021, 11, 229. [Google Scholar] [CrossRef]
- Sahabi, H.; Feizi, H.; Amirmoradi, S. Which crop production system is more efficient in energy use: Wheat or barley? Environ. Dev. Sustain. 2013, 15, 711–721. [Google Scholar] [CrossRef]
- Stern, P.; Janda, K.; Brown, M.; Steg, L.; Vine, E.; Lutzenhiser, L. Opportunities and insights for reducing fossil fuel consumption by households and organizations. Nat. Energy 2016, 1, 16043. [Google Scholar] [CrossRef]
- Brosch, T.; Sander, D.; Patel, M.K. Editorial: Behavioral insights for a sustainable energy transition. Front. Energy Res. 2016, 4, 15. [Google Scholar] [CrossRef]
- Baran, M.F.; Gokdogan, O. Determination of energy balance of sugar beet production in Turkey: A case study of Kırklareli Province. Energy Effic. 2016, 9, 487–494. [Google Scholar] [CrossRef]
- Canakci, M.; Topakci, M.; Akinci, I.; Ozmerzi, A. Energy use pattern of some field crops and vegetable production: Case study for Antalya region, Turkey. Energy Convers. Manag. 2005, 46, 655–666. [Google Scholar] [CrossRef]
- Cociu, A.I. Tillage System Effects on Input Efficiency of Winter Wheat, Maize and Soybean in Rotation. Rom. Agric. Res. 2010, 27, 81–87. Available online: https://www.incda-fundulea.ro/rar/nr27/rar27.11.pdf (accessed on 4 November 2021).
- Ryan, J. A Perspective on Balanced Fertilization in the Mediterranean Region. Turk. J. Agric. For. 2008, 32, 79–89. Available online: https://citeseerx.ist.psu.edu/viewdoc/download?doi=10.1.1.1012.6100&rep=rep1&type=pdf (accessed on 4 November 2021).
- Buttel, F.H. Internalizing the societal costs of agricultural production. Plant Physiol. 2003, 133, 1656–1665. [Google Scholar] [CrossRef]
- Summers, R.; Weaver, D. Environmental Impact of Nitrogen and Phosphorus Fertilisers in High Rainfall Areas. In Agriculture and Food; 2020. Available online: https://www.agric.wa.gov.au/high-rainfall-pastures/environmental-impact-nitrogen-andphosphorus-fertilisers-high-rainfall-areas (accessed on 4 November 2021).
- Savci, S. Investigation of effect of chemical fertilizers on environment. APCBEE Procedia 2012, 1, 287–292. [Google Scholar] [CrossRef]
- Liu, L.; Zhang, T.; Gilliam, F.S.; Gundersen, P.; Zhang, W.; Chen, H.; Mo, J. Interactive effects of nitrogen and phosphorus on soil microbial communities in a tropical forest. PLoS ONE 2013, 8, e61188. [Google Scholar] [CrossRef]
- Keeler, B.L.; Gourevitch, J.D.; Polasky, S.; Isbell, F.; Tessum, C.W.; Hill, J.D.; Marshall, J.D. The social costs of nitrogen. Sci. Adv. 2016, 2, e1600219. [Google Scholar] [CrossRef]
- Tegtmeier, E.M.; Duffy, M.D. External costs of agricultural production in the United States. Int. J. Agric. Sustain. 2004, 2, 1473–5903. [Google Scholar] [CrossRef]
- Rathke, G.W.; Körschens, M.; Diepenbrock, W. Substance and energy balances in the “Static fertilisation experiment bad Lauchstädt”. Arch. Agron. Soil. Sci. 2002, 48, 423–433. [Google Scholar] [CrossRef]
- Stolarski, M.J.; Krzyżaniak, M.; Tworkowski, J.; Załuski, D.; Kwiatkowski, J.; Szczukowski, S. Camelina and crambe production—Energy efficiency indices depending on nitrogen fertilizer application. Ind. Crop Prod. 2019, 137, 386–395. [Google Scholar] [CrossRef]
- Green, M.B.; McCulloch, A. Energy considerations in the use of herbicides. J. Sci. Food Agric. 1976, 15, 641–646. [Google Scholar] [CrossRef]
- Chauhan, N.S.; Mohapatra, P.K.J.; Pandey, K.P. Improving energy productivity in paddy production through benchmarking—An application of data envelopment analysis. Energy Convers. Manag. 2006, 47, 1063–1085. [Google Scholar] [CrossRef]
- Mohammadi, A.; Rafiee, S.H.; Mohtasebi, S.S.; Mousavi-Avval, S.H.; Rafiee, H. Energy efficiency improvement and input cost saving in kiwifruit production using Data Envelopment Analysis approach. Renew. Energy 2011, 36, 2573–2579. [Google Scholar] [CrossRef]
- Mousavi-Avval, S.H.; Rafiee, S.H.; Mohammadi, A. Optimization of energy consumption and input costs for apple production in Iran using data envelopment analysis. Energy 2011, 36, 909–916. [Google Scholar] [CrossRef]
- Mousavi-Avval, S.H.; Rafiee, S.H.; Jafari, A.; Mohammadi, A. Improving energy use efficiency of canola production using data envelopment analysis (DEA) approach. Energy 2011, 36, 2765–2772. [Google Scholar] [CrossRef]
- Choobin, S.; Hosseinzadeh Samani, B.; Esmaeili, Z. Lifecycle assessment of environmental effects on rapeseed production. J. Renew. Energy Environ. 2016, 3, 10–19. [Google Scholar] [CrossRef]
- Berardi, G.M. Organic and conventional wheat production: Examination of energy and economics. Agro-Ecosyst. 1978, 4, 367–376. [Google Scholar] [CrossRef]
- Pimentel, D.; Berardi, G.; Fast, S. Energy efficiency of farming systems: Organic and conventional agriculture. Agric. Ecosyst. Environ. 1983, 9, 359–372. [Google Scholar] [CrossRef]
- Dalgaard, T.; Halberg, N.; Porter, J.R. A model for fossil energy use in Danish agriculture used to compare organic and conventional farming. Agric. Ecosyst. Environ. 2001, 87, 51–65. [Google Scholar] [CrossRef]
- Hoeppner, J.; Entz, M.; McConkey, B.; Zentner, R.; Nagy, C. Energy use and efficiency in two Canadian organic and conventional crop production systems. Renew. Agric. Food Syst. 2006, 21, 60–67. [Google Scholar] [CrossRef]
- Guzmán, G.I.; Alonso, A.M. A comparison of energy use in conventional and organic olive oil production in Spain. Agric. Syst. 2008, 98, 167–176. [Google Scholar] [CrossRef]
- Cruse, M.J.; Liebman, M.; Raj Raman, D.; Wiedenhoeft, M. Fossil energy use in conventional and low-external-input cropping systems. Agron. J. 2010, 102, 934–941. [Google Scholar] [CrossRef]
- Gündoğmuş, E. Energy input use in environmentally friendly farming systems: A comparative analysis between organic and conventional dried fig production. J. Sustain. Agric. 2010, 34, 744–757. [Google Scholar] [CrossRef]
- MacRae, R.J.; Lynch, D.; Martin, R.C. Improving energy efficiency and GHG mitigation potentials in Canadian organic farming systems. J. Sustain. Agric. 2010, 34, 549–580. [Google Scholar] [CrossRef]
- Zentner, R.P.; Basnyat, P.; Brandt, S.A.; Thomas, A.G.; Ulrich, D.; Campbell, C.A.; Nagy, C.N.; Frick, B. Effects of input management and crop diversity on non-renewable energy use efficiency of cropping systems in the Canadian prairie. Eur. J. Agron. 2011, 34, 113–123. [Google Scholar] [CrossRef]
- Foster, C.; Green, K.; Bleda, M.; Dewick, P.; Evans, B.; Flynn, A.; Mylan, J. Environmental Impacts of Food Production and Consumption. A Report to the Department for Environment, Food and Rural Affairs; Manchester Business School DEFRA: London, UK, 2006. Available online: http://randd.defra.gov.uk/Document.aspx?Document=EV02007_4601_FRP.pdf (accessed on 4 November 2021).
- Ziaei, S.M.; Mazloumzadeh, S.M.; Jabbary, M. A comparison of energy use and productivity of wheat and barley (case study). J. Saudi Soc. Agric. Sci. 2015, 14, 19–25. [Google Scholar] [CrossRef]
- Kuesters, J.; Lammel, J. Investigations of the energy efficiency of the production of winter wheat and sugar beet in Europe. Eur. J. Agron. 1999, 11, 35–43. [Google Scholar] [CrossRef]
- Hülsbergen, K.J.; Feil, B.; Diepenbrock, W. Rates of nitrogen application required to achieve maximum energy efficiency for various crops: Results of a long-term experiment. Field Crop Res. 2002, 77, 61–76. [Google Scholar] [CrossRef]
- Zaman, K.; Khan, M.M.; Ahmad, M.; Rustam, R. The relationship between agricultural technology and energy demand in Pakistan. Energy Policy 2012, 44, 268–279. [Google Scholar] [CrossRef]
- Sebri, M.; Abid, M. Energy use for economic growth: A trivariate analysis from Tunisian agriculture sector. Energy Policy 2012, 48, 711–716. [Google Scholar] [CrossRef]
- Wesołowski, M.; Juszczak, D. Plonowanie gryki w plonie głównym i wtórym. Agron. Sci. 2006, 61, 9–18. [Google Scholar] [CrossRef]
- Brock, P.; Madden, P.; Schwenke, G.; Herridge, D. Greenhouse gas emissions profile for 1 tonne of wheat produced in Central Zone (East) New South Wales: A life cycle assessment approach. Crop Pasture Sci. 2012, 63, 319–329. [Google Scholar] [CrossRef]
- Skowrońska, M.; Filipek, T. Life cycle assessment of fertilizers: A review. Int. Agrophys. 2014, 28, 101–110. [Google Scholar] [CrossRef]
- Jarosz, Z.; Księżak, J.; Faber, A. Assessment of greenhouse gas emissions in systems used in cropping maize for bioethanol production. Annals PAAAE 2017, 19, 60–65. [Google Scholar] [CrossRef]
- Fiedor, B. Theoretical foundations of managing natural resources. In Fundamentals of the Economics of the Environment and Natural Resources; Fiedor, B., Ed.; C.H. Beck: Warszawa, Poland, 2002. (In Polish) [Google Scholar]
- Ansari, R.; Liaqat, M.U.; Khan, H.I.; Mushtaq, S. Energy efficiency analysis of wheat crop under different climate- and soil-based irrigation schedules. Proceedings 2018, 2, 184. [Google Scholar] [CrossRef]
- Pervanchon, F.; Bockstaller, C.; Girardin, P. Assessment of energy use in arable farming systems by means of an agro-ecological indicator: The energy indicator. Agric. Syst. 2002, 72, 149–172. [Google Scholar] [CrossRef]
- Bharti, A.; Kujur, P. Economics of buckwheat cultivation in the Mainpat Block of Chhattisgarh. Int. J. Curr. Microbiol. Appl. Sci. 2019, 8, 743–751. [Google Scholar] [CrossRef]
- Sredojević, Z.; Kljajić, N.; Arsić, S. Economic Profitability and Ecological Justification of Buckwheat Cultivation in the Republic of Serbia. Manag. Econ. Eng. Agric. Rural Dev. 2020, 20, 571–578. Available online: http://managementjournal.usamv.ro/pdf/vol.20_3/Art61.pdf (accessed on 4 November 2021).
- Chhetri, B.; Satpute, S.B.; Das, T.; Surje, D.T.; Mahato, S.K. Production potential and economics feasibility of buckwheat (Fagopyrum esculentum Moench) as influenced by integrated weed management practices under Terai rgion of West Bengal. Adv. Res. J. Crop Improv. 2015, 6, 144–150. [Google Scholar] [CrossRef]
- Dhakal, S.C.; Regmi, P.P.; Thapa, R.B.; Sah, S.K.; Khatri-Chhetr, D.B. Profitability and resource use efficiency of buckwheat (Fagopyrum esculentum Moench) production in Chitwan district, Nepal. J. Agric. Environ. 2015, 16, 120–131. [Google Scholar] [CrossRef]
- De, D.; Singh, R.S.; Chandra, H. Technological impact on energy consumption in rainfed soybean cultivation in Madhya Pradesh. Appl. Energy 2001, 70, 193–213. [Google Scholar] [CrossRef]
- Schulte auf’m Erley, G.; Kaul, H.P.; Kruse, M.; Aufhammer, W. Yield and nitrogen utilization efficiency of the pseudocereals amaranth, quinoa, and buckwheat under differing nitrogen fertilization. Eur. J. Agron. 2005, 22, 95–100. [Google Scholar] [CrossRef]


| Item | Production Systems | |
|---|---|---|
| Low-Input | High-Input | |
| soil tillage | before winter: discing, harrowing, ploughing; spring: harrowing, presowing tillary aggregate | |
| sowing (kg ha−1) | 50 | 90 |
| mineral fertilisation (kg ha−1) | autumn: 30 P2O5 (superphosphate), 40 K2O (potash salt) | |
| spring: 30 NH4NO3 | spring: 60 + 30 NH4NO3 before blooming Kizeryt 80 kg (20 kg MgO—12 kg Mg i 40 kg SO3—16 kg S) | |
| weed control | mechanical x2: at plant height 5–7 cm and before flower budding | spring: chemicals after sowing flurochloridon—375 g ha−1 |
| fungal protection | seed treatment: triadimenol—15.0 g, imazalil—2.0 g, fuberizadol—1.8 g | seed treatment: triadimenol—27.0 g, imazalil—3.6 g, fuberizadol—3.2 g |
| growth regulator | - | plant height approx. 15–20 cm: trinexapac-ethyl—75 g |
| desiccant | dimetipin—375 g ha−1 | dimetipin—375 g ha−1 |
| Specification | Unit | Energy Equivalent |
|---|---|---|
| 1. Human labour | MJ h−1 | 80 |
| 2. Tractors and machines | MJ kg−1 | 110 |
| 3. Diesel fuel (includes cost of lubricants) | MJ kg−1 | 48 |
| 4. Mineral fertilisers: | ||
| a. Nitrogen (N) | MJ kg−1 | 77 |
| b. Phosphorus (P2O5) | MJ kg−1 | 15 |
| c. Potassium (K2O) | MJ kg−1 | 10 |
| 5. Pesticides | MJ kg−1 a.i. * | 300 |
| 6. Seeds | MJ kg−1 | 14.36 |
| Outputs | ||
| 1. Buckwheat grain | MJ kg−1 | 14.36 |
| Quantity Inputs | Production System | ||||
|---|---|---|---|---|---|
| Low-Input | High-Input | ||||
| Total Energy Equivalent (MJ ha−1) | Percentage of the Total Energy Input (%) | Total Energy Equivalent (MJ ha−1) | Percentage of the Total Energy Input (%) | ||
| 1. | Human labour | 473.5 | 6.29 | 398.8 | 3.04 |
| 2. | Tractors and machinery | 851.5 | 11.30 | 747.3 | 5.70 |
| 3. | Diesel fuel | 1928.8 | 25.61 | 1712.4 | 13.06 |
| 4. | Materials, including | 4279.0 | 56.81 | 10,248.4 | 78.19 |
| a. | Sowing seeds | 725.0 | 9.62 | 1305.0 | 9.96 |
| 4.1 | Chemical fertilisers, including | 3160.0 | 41.95 | 8084.4 | 61.68 |
| a. | Nitrogen | 2310.0 | 30.67 | 6930.0 | 52.87 |
| b. | Phosphate | 450.0 | 5.97 | 450.0 | 3.43 |
| c. | Potassium | 400.0 | 5.31 | 400.0 | 3.05 |
| d. | Magnesium | 0.0 | 0.0 | 80.4 | 0.61 |
| e. | Sulphur | 0.0 | 0.0 | 224.0 | 1.71 |
| 4.2. | Herbicides | 0.0 | 0.0 | 375.0 | 2.86 |
| 4.3. | Fungicides | 19.0 | 0.25 | 34.0 | 0.26 |
| 4.4. | Growth regulator | 0.0 | 0.0 | 75.0 | 0.57 |
| 4.5. | Desiccant | 375.0 | 4.98 | 375.0 | 2.86 |
| Total energy input | 7532.7 | - | 13106.9 | - | |
| Items | Unit | Production System | |||||
|---|---|---|---|---|---|---|---|
| Low-Input | High-Input | ||||||
| Panda | Volma | Mancan | Panda | Volma | Mancan | ||
| Energy input | MJ ha−1 | 7532.7 | 7532.7 | 7532.7 | 13,106.9 | 13,106.9 | 13,106.9 |
| Energy output | MJ ha−1 | 11,165.0 | 12,571.5 | 10,498.0 | 17,110.0 | 20,459.5 | 15,341.0 |
| Net energy gain | MJ ha−1 | 3632.3 | 5038.8 | 2965.3 | 4003.1 | 7352.6 | 2234.1 |
| Specific energy | MJ kg−1 | 9.78 | 8.69 | 10.40 | 11.11 | 9.29 | 12.39 |
| Energy productivity | kg MJ−1 | 0.102 | 0.115 | 0.096 | 0.090 | 0.108 | 0.081 |
| Energy use efficiency | - | 1.48 | 1.67 | 1.39 | 1.31 | 1.56 | 1.17 |
| Form of Energy (MJ ha−1) | Production System | |||
|---|---|---|---|---|
| Low-Input | High-Input | |||
| Value | % | Value | % | |
| Total energy | 7532.7 | - | 13,106.9 | - |
| Direct energy a | 2402.2 | 31.89 | 2111.2 | 16.11 |
| Indirect energy b | 5130.5 | 68.11 | 10,995.7 | 83.89 |
| Renewable energy c | 1198.5 | 15.91 | 1703.8 | 13.00 |
| Nonrenewable energy d | 6334.2 | 84.09 | 11,403.1 | 87.00 |
| Item | Production System | |||||
|---|---|---|---|---|---|---|
| Low-Input | High-Input | |||||
| Panda | Volma | Mancan | Panda | Volma | Mancan | |
| Soil emission (kg N2O-N ha−1) | 0.1345 | 0.1417 | 0.1312 | 0.2890 | 0.3051 | 0.2804 |
| Total production emissions (kg CO2eq t−1) | 178.2 | 160.9 | 187.9 | 255.6 | 216.4 | 281.4 |
| Percentage emission from sowing seed (eseed) in the total production emissions | 21.7 | 21.3 | 21.8 | 17.9 | 17.6 | 18.1 |
| Percentage emission from production and transport of fertilisers and agrichemicals (echem) in the total production emissions | 43.8 | 43.1 | 44.2 | 50.0 | 49.2 | 50.5 |
| Percentage soil emission (efield) in the total production emissions | 31.2 | 32.4 | 30.7 | 30.8 | 31.9 | 30.2 |
| Percentage emission from machinery operation (emm) in the total production emissions | 3.2 | 3.2 | 3.3 | 1.3 | 1.3 | 1.3 |
| Items | Unit | Price | Production Systems | ||||||
|---|---|---|---|---|---|---|---|---|---|
| Low-Input | High-Input | ||||||||
| Amount | Value (EUR) | Share of the Costs (%) | Amount | Value (EUR) | Share of the Costs (%) | ||||
| 1. | Seeds | (EUR kg−1) | 0.8 | 50 | 38.5 | 10.26 | 90 | 69.2 | 13.53 |
| 2. | Mineral fertilisers | ||||||||
| a | nitrogen | (EUR kg−1) | 0.9 | 30 | 25.7 | 6.86 | 90 | 77.1 | 15.08 |
| b | phosphorus | (EUR kg−1) | 1.0 | 30 | 25.7 | 6.86 | 30 | 29.7 | 5.80 |
| c | potassium | (EUR kg−1) | 0.5 | 40 | 34.3 | 9.15 | 40 | 19.3 | 3.78 |
| d | magnesium–sulphur | (EUR kg−1) | 0.3 | 0 | 0.0 | 0.0 | 80 | 25.5 | 4.98 |
| 2. | Total fertiliser costs | (EUR kg−1) | - | - | 85.7 | 22.86 | - | 151.6 | 29.64 |
| 3. | Chemical agents | ||||||||
| a | herbicides | (EUR l−1) | 21.3 | - | - | 0.0 | 1.50 | 32.0 | 6.25 |
| b | fungicides | (EUR l−1) | 22.0 | 0.20 | 4.4 | 1.17 | 0.36 | 7.9 | 1.55 |
| c | growth regulator | (EUR l−1) | 37.4 | 0.25 | 9.3 | 2.49 | 0.25 | 9.3 | 1.83 |
| d | desiccant | (EUR l−1) | 42.2 | 0.40 | 16.9 | 4.50 | 0.40 | 16.9 | 3.30 |
| 3. | Total chemical agents | - | - | - | 26.2 | 8.17 | - | 66.1 | 12.92 |
| Total variable costs | - | - | - | 154.8 | 41.29 | - | 278.6 | 56.10 | |
| 4. | Machinery operations | ||||||||
| a | discing | (h) | 40.2 | 0.33 | 13.3 | 3.54 | 0.33 | 13.3 | 2.59 |
| b | harrowing x2 | (h) | 25.7 | 0.32 | 16.5 | 4.39 | 0.32 | 16.5 | 3.22 |
| c | fertilisers application P i K | (h) | 31.0 | 0.20 | 6.2 | 1.65 | 0.20 | 6.2 | 1.21 |
| d | ploughing | (h) | 64.0 | 0.66 | 42.2 | 11.26 | 0.66 | 42.2 | 8.25 |
| e | presowing tillary aggregate | (h) | 30.3 | 0.50 | 15.2 | 4.04 | 0.50 | 15.2 | 2.96 |
| f | sowing | (h) | 38.7 | 0.50 | 19.3 | 5.16 | 0.50 | 19.3 | 3.78 |
| g | fertilisers application N | (h) | 26.6 | 0.20 | 5.3 | 1.42 | 0.20 | 5.3 | 1.04 |
| h | fertilisers application N | (h) | 26.6 | - | - | 0.00 | 0.20 | 5.3 | 1.04 |
| i | weed control (mech.) | (h) | 18.9 | 0.36 | 6.8 | 1.81 | - | 0.0 | 0.00 |
| j | weed control (mech.) | (h) | 18.9 | 0.36 | 6.8 | 1.81 | - | 0.0 | 0.00 |
| k | weed control (chem.) | (h) | 25.7 | - | - | 0.00 | 0.50 | 12.9 | 2.51 |
| l | desiccation | (h) | 25.7 | 0.50 | 12.9 | 3.43 | 0.50 | 12.9 | 2.51 |
| m | harvest | (h) | 134.9 | 0.20 | 27.0 | 7.20 | 0.20 | 27.0 | 5.28 |
| 4. | Total machinery operation | - | - | - | 171.4 | 45.72 | - | 176.0 | 34.40 |
| 5. | Labour * | (h) | 4.0 | 4.13 | 16.6 | 4.43 | 4.11 | 16.5 | 3.23 |
| 6. | Land tax | (ha) | 32.1 | 1 | 32.1 | 8.56 | 1 | 32.1 | 6.27 |
| Items | Unit | Production System | |||||
|---|---|---|---|---|---|---|---|
| Low-Input | High-Input | ||||||
| Panda | Volma | Mancan | Panda | Volma | Mancan | ||
| Yield of nuts | (Mg ha−1) | 0.770 | 0.867 | 0.724 | 1.180 | 1.411 | 1.058 |
| Sale price | (EUR Mg−1) | 484.0 | 484.0 | 484.0 | 484.0 | 484.0 | 484.0 |
| Single area and greening payment | (EUR ha−1) | 178.6 | 178.6 | 178.6 | 178.6 | 178.6 | 178.6 |
| Gross production value (without EU payment) | (EUR ha−1) | 372.3 | 419.2 | 350.1 | 570.5 | 682.2 | 511.6 |
| Gross production value (with EU payment) | (EUR ha−1) | 550.9 | 597.8 | 528.7 | 749.1 | 860.8 | 690.2 |
| Variable cost of production | (EUR ha−1) | 154.8 | 154.8 | 154.8 | 287.0 | 287.0 | 287.0 |
| Agrotechnical operation cost | (EUR ha−1) | 171.4 | 171.4 | 171.4 | 176.0 | 176.0 | 176.0 |
| Total production cost | (EUR ha−1) | 374.9 | 374.9 | 374.9 | 511.6 | 511.6 | 511.6 |
| Unit cost | (EUR dt−1) | 48.7 | 43.2 | 51.8 | 43.4 | 36.3 | 48.4 |
| Gross return without EU payment | (EUR ha−1) | −2.6 | 44.3 | −24.8 | 59.0 | 170.6 | 0.0 |
| Gross return with EU payment | (EUR ha−1) | 176.0 | 222.9 | 153.8 | 237.6 | 349.2 | 178.6 |
| Benefit to cost ratio (without EU payment) | - | 0.99 | 1.12 | 0.93 | 1.12 | 1.33 | 1.00 |
| Benefit to cost ratio (with EU payment) | - | 1.47 | 1.59 | 1.41 | 1.46 | 1.68 | 1.35 |
Disclaimer/Publisher’s Note: The statements, opinions and data contained in all publications are solely those of the individual author(s) and contributor(s) and not of MDPI and/or the editor(s). MDPI and/or the editor(s) disclaim responsibility for any injury to people or property resulting from any ideas, methods, instructions or products referred to in the content. |
© 2022 by the authors. Licensee MDPI, Basel, Switzerland. This article is an open access article distributed under the terms and conditions of the Creative Commons Attribution (CC BY) license (https://creativecommons.org/licenses/by/4.0/).
Share and Cite
Bielski, S.; Marks-Bielska, R.; Wiśniewski, P. Investigation of Energy and Economic Balance and GHG Emissions in the Production of Different Cultivars of Buckwheat (Fagopyrum esculentum Moench): A Case Study in Northeastern Poland. Energies 2023, 16, 17. https://doi.org/10.3390/en16010017
Bielski S, Marks-Bielska R, Wiśniewski P. Investigation of Energy and Economic Balance and GHG Emissions in the Production of Different Cultivars of Buckwheat (Fagopyrum esculentum Moench): A Case Study in Northeastern Poland. Energies. 2023; 16(1):17. https://doi.org/10.3390/en16010017
Chicago/Turabian StyleBielski, Stanisław, Renata Marks-Bielska, and Paweł Wiśniewski. 2023. "Investigation of Energy and Economic Balance and GHG Emissions in the Production of Different Cultivars of Buckwheat (Fagopyrum esculentum Moench): A Case Study in Northeastern Poland" Energies 16, no. 1: 17. https://doi.org/10.3390/en16010017
APA StyleBielski, S., Marks-Bielska, R., & Wiśniewski, P. (2023). Investigation of Energy and Economic Balance and GHG Emissions in the Production of Different Cultivars of Buckwheat (Fagopyrum esculentum Moench): A Case Study in Northeastern Poland. Energies, 16(1), 17. https://doi.org/10.3390/en16010017