Article

Impact of Solar Energy Integration on the Rheological and Chemical Properties of Bitumen

1
LERMA Lab, College of Engineering & Architecture, International University of Rabat, Sala al Jadida 11103, Morocco
2
Laboratory of Chemical Engineering and Resources Valorization UAE/L01, Faculty of Science and Technology of Tangier (FSTT), Abdelmalek Essaâdi University (UAE), Tangier 90040, Morocco
3
Centre d’Etudes et de Recherches des Infrastructures de Transport (CERIT), Laboratoire Public d’Essais et d’Etudes (LPEE), Casablanca 20103, Morocco
*
Author to whom correspondence should be addressed.
Energies 2023, 16(1), 14; https://doi.org/10.3390/en16010014
Submission received: 26 October 2022 / Revised: 8 December 2022 / Accepted: 9 December 2022 / Published: 20 December 2022

Abstract

:
The use of solar energy to partially satisfy the demand for heat in the bitumen industry constitutes an enormous step towards industrial decarbonization. This paper investigates the effect of thermal fluctuations caused by solar energy usage in bitumen storage in the region of Rabat, Morocco. We studied different temperature ranges and storage periods, covering the most common scenarios in this region. This work inspected the impact of these studied conditions on the performance of 35/50 bitumen. After the simulation of fluctuations through thermal storage, we simulated short-term and long-term aging using RTFO and PAV tests, respectively. In addition to the needle penetration at 25 °C and the determination of softening point tests, we used a dynamic shear rheometer (DSR) and Fourier-transform infrared spectroscopy (FTIR) to assess the rheological and chemical evolutions of the samples. We found that thermal fluctuations enhanced the rheological performance of the binders by improving their rutting and fatigue cracking resistance. We observed that longer storage durations (three months) under thermal fluctuations made bitumen more prone to oxidation in the long term. We conclude that solar energy usage in bitumen storage is not detrimental as long as we avoid long storage periods (more than one month), especially when the maximum storage temperature is higher than 165 °C.

1. Introduction

The increasing rate of harmful environmental effects related to fossil fuel use has induced a growing interest in sustainable development issues [1]. The energy generation from the consumption of fossil fuel resources has led to air pollution, greenhouse gas emissions, natural resource decay, climate change, and global warming [2,3,4]. One of the main contributors to global warming is carbon dioxide (CO2), which absorbs the outgoing heat radiated from Earth’s surface and traps it within the atmosphere [2]. The overall temperature of the atmosphere then increases and negatively affects both the environment and humankind [4]. The fluctuation in fuel prices is a primary concern faced by developing countries that mainly rely on conventional power generation to meet load demands, especially with the increase in energy demand in these countries [3,5]. Thus, alternative resource use is crucial to mitigate fossil fuel dependency [5]. Several sectors are witnessing transitions towards cleaner, safer, and more sustainable energy systems, such as renewable energy resources, to generate energy. Numerous attempts have been made to adopt technologies that rely on renewable resources. However, the spread of these technologies is still limited compared to fossil fuels. It could be because most new technologies usually entail large investments and untested performance [2,3,4].
The industry’s overall energy usage has increased over the last two decades. The industrial sector, which is heavily dependent on fossil fuels, accounts for about one third of global energy-related carbon dioxide (CO2) emissions, and it was responsible for almost one third of the total energy consumption in the world (TFEC) in 2017 [2,6]. Since heating and cooling represent up to 75% of the energy used in industry, the sector will play an essential role in the energy transition to 100% renewables [6,7]. Besides making local industries resilient over time and improving their financial performance, switching from fossil fuels to renewables will bring much-needed health, climate, and environmental benefits [6]. Nevertheless, the transition to renewable heating is slow due to its context-specific and decentralized nature, fossil fuel lock-in, the cost superiority of conventional fuels, and less government support for renewable technology for thermal requirements [6,7]. Today, only 13% of the sector’s total final energy consumption comes from renewable sources; the remaining consumption is the result of burning coal, natural gas, and oil [2,6].
Emerging technologies, such as solar thermal, could provide a solution for supplying the industrial sector with clean thermal energy, especially with its minimal maintenance effort and high reliability [4]. This technology uses solar collectors that harvest solar radiation and transfer it to the HTF, which circulates between the collectors and the process that requires heating. The HTF can be air, water, oil, or another medium; it carries the thermal energy to be utilized directly or stored in storage tanks for later use. Thermal energy storage can be divided into three distinct categories: sensible heat storage (heating/cooling cycles), latent heat storage (heating/cooling cycles), and thermo-chemical heat storage (involves reversible exothermic/endothermic chemical reactions with thermo-chemical materials). Many research works have been conducted to study potential storage techniques based on latent heat storage systems and on sensible heat storage. In 2022, Fragnito et al. investigated the thermal performance of a vertical shell-and-tube heat exchanger containing a biological phase-change material (PCM) and connected to a water-chiller system for cold thermal energy storage [8]. Liu et al. conducted a numerical investigation of a concrete thermal energy storage (CTES) system using air as a heat transfer fluid (HTF) [9]. The same year, Boquera et al. studied the thermo-mechanical stability of supplementary cementitious materials to be incorporated in concrete as thermal energy storage materials at high temperatures [10].
While it has the potential to contribute to industrial sector decarbonization, solar thermal technology is still not used on a wide scale [2,4,11,12,13]. Advanced solar process heat technologies can provide temperatures of up to 400 °C. With this wide range, it can fulfill almost all industrial process heat demands [11]. Industrial heating needs can be categorized into three main temperature ranges. The lowest temperature range consists of everything below 80 °C; solar collectors are capable of meeting these temperatures. The medium temperature category is between 80 °C and 250 °C. The highest range includes everything over 250 °C and requires concentrated solar power (CSP) to achieve such temperatures [12]. A wide variety of industrial operations within different industries require a considerable amount of heat energy. Such industries include food and beverages, dairy, chemicals, pharmaceuticals, rubber, pulp and paper, wood products, fabricated metals, mining, textiles, agriculture, and other industrial sectors. All of the mentioned industries include processes that require heat energy in the range between 7 and 300 °C, which is a suitable operating range for the SHIP technology (solar heat for industrial processes) [2,6,7,12].
Many studies have been conducted to assess the feasibility, either on a technical or an economic level, of integrating SHIP in different industries. To cite a few, in 2000, Schweiger et al. [14] examined the feasibility of solar energy technology in Spain and Portugal, with examples in the paper, textile, malting, milk, and brewing industries, in which solar energy was incorporated into a centralized utility system with a simulation of various solar collector types [4]. In 2015, Sharma et al. studied the possibility of solar energy usage for process heating in the paper industry in India [15]. In 2016, Al-Hasnawi conducted three case studies in dairy and pharmaceutical plants in Sweden to review the most promising integration points for parabolic trough solar collectors in terms of annual heat demand, temperature level, and integration effort [16]. In 2017, Sharma et al. studied the potential of SHIP in the dairy industry in India and its consequent carbon mitigation [17]. In 2017, Allouhi et al. inspected the use of a centralized solar water-heating system in the milk processing industry in Casablanca, Morocco, based on economic viability [18]. In 2021, Shah conducted a techno-economic analysis of the integration of solar thermal collectors in the dairy industry in Dubai. The load profile, thermal demand, and fuel expenses of a specific plant were analyzed [7]. In 2022, Korkua et al. studied the drying of standard Thai rubber (STR) in Thailand using solar-powered microwave technology. They used solar energy as the only energy source for the drying process, which was converted into thermal energy and electricity [19]. Pérez et al. proposed an S4 framework to educate small- and medium-sized companies on the sensing, smart, sustainable, and social elements they must take into account when installing, running, and disposing of PV systems in Mexico [20]. In 2022, Ahmed et al. realized an energy, exergy, environmental, and economic analysis of a flat-plate solar collector based process heating system designed to supply low- to moderate-temperature process heat [21].
Furthermore, numerous companies in different industries have already implemented solar heating in their processes. In the pharmaceutical industry, a pharmaceutical plant in Egypt receives 1.3 t/h of saturated steam from a solar thermal plant based on 1.900 m2 of parabolic trough collectors, which is located just outside of Cairo [22,23]. In India, Synthokem Labs–Sanath Nagar rely on a solar water-heating system for preheating the water that feeds the steam boiler used in industrial processes [24]. In the paper industry, B.S. paper mill in India uses solar heat for various process operations, using different collectors merged into the system, which reaches a maximum temperature of 98 °C [23]. In the automobile industry, Spain, India, and South Africa are using solar process heating systems in their production systems. The maximum temperature achieved is 130 °C [23,24]. Textile industries are equipped with solar process heating systems in countries such as the USA, Vietnam, Spain, and Germany, but Greece, China, and India are the dominant countries in this field [23,24]. In the brewing industry, numerous European countries, the USA, South Africa, and China are contributing to the reduction in carbon dioxide emission by including solar process heating in operations that use a maximum temperature of 120 °C [6,23]. The dominant industrial sector for solar process heating systems nowadays is said to be the food industry, which includes the dairy industry. In their industries, the majority of the nations in Europe, North America, South America, and Asia use industrial process heating systems. Mexico, the United States, Greece, India, Spain, and Austria are the dominant countries. Currently, the highest temperature for the food industry is 243 °C, with the majority of applications using low-temperature process heat. [6,23,24].
The bitumen industry is not an exception to this transition towards SHIP. In 2008, Luminossu et al. [25,26] investigated solar energy usage in passive mode to preheat D80/100-type bitumen and achieved a temperature increase to 63 °C. In 2010, COLAS Suisse equipped its bitumen process plant in Geneva with solar thermal collectors featuring ultrahigh vacuum, which were capable of providing the needed process heat at temperatures from 150 to 190 °C [27,28]. In 2014, Colas Suisse equipped another bitumen plant in Yverdon-les-Bains with solar thermal collectors to maintain bitumen storage tanks at a temperature higher than 160 °C [28]. In 2015, Bayerische Bitumen-Chemie in Germany started using flat plate collectors to heat the process water that goes into making bitumen emulsions up to 70 °C [28]. In 2020, Ghazouani et al. [29] worked on the optimization of the thermal energy management of a solar thermal energy system used to maintain bitumen on process heat. This study was conducted in the framework of the Bituma project, the main purpose of which is to realize an industrial demonstrator to maintain a 40-ton bitumen storage tank at a temperature of 160 °C using SPTCs (solar parabolic trough collectors).
Bitumen is a viscoelastic material used mainly in pavement construction, amongst other applications. Its viscoelastic nature makes it very sensitive to temperature changes [30,31], which impacts its rheological performance and chemical properties (oxidation). Many studies have been conducted to evaluate the effect of climate change on bitumen’s performance during its in-service life. In 2012, Merbouh [32] investigated the impact of thermal cycling on the creep–recovery behavior of 40/50 paving-grade bitumen; he used heating/cooling and freezing/thawing cycles to simulate climate changes in various regions and during different seasons. He found that heating/cooling cycles lessened bitumen’s susceptibility and caused its hardening, which decreased rutting but increased the risk of thermal cracking at low temperatures. The freezing/thawing cycles augmented bitumen’s susceptibility and the risk of rutting at high temperatures. In 2013, Glaoui et al. [33] examined the effect of thermal fatigue cycles on the rheological behavior of polymer-modified bitumen. They subjected the modified binder to 100 cycles of freezing/thawing between −10 °C and 25 °C, and they discovered that these cycles made the binder softer and more deformable, increased the susceptibility and the risk of rutting, and caused a loss of consistency. In 2020, Abdulkadir et al. [30] investigated the impact of climate change in Nigeria on the rheological properties of 60/70 penetration-grade bitumen. On the other hand, studies on the impact of thermal fluctuations during the storage phase of bitumen on the binder’s performance are almost nonexistent. In 2021, Tahri et al. [34] studied the influence of the temperature fluctuations that occur while storing 35/50 penetration-grade bitumen between 140 °C and 160 °C. The study was limited to 100 cycles and one range of temperature.
The present paper aims to investigate the impact of solar energy usage for 35/50 bitumen tank heating by evaluating bitumen’s chemical and rheological properties under different “temperature ranges/number of cycles”. Hence, the novelty of this study is that it examines the feasibility of using SHIP in the bitumen industry from a bitumen performance point of view. It is divided into four sections: the first section accurately depicts the studied problem; the materials and methods used in the study are thoroughly described in the second section, along with data and specifications; the study’s results are discussed in the third section, and the fourth section summarizes the conclusions.

2. Materials and Methods

2.1. Solar Implant

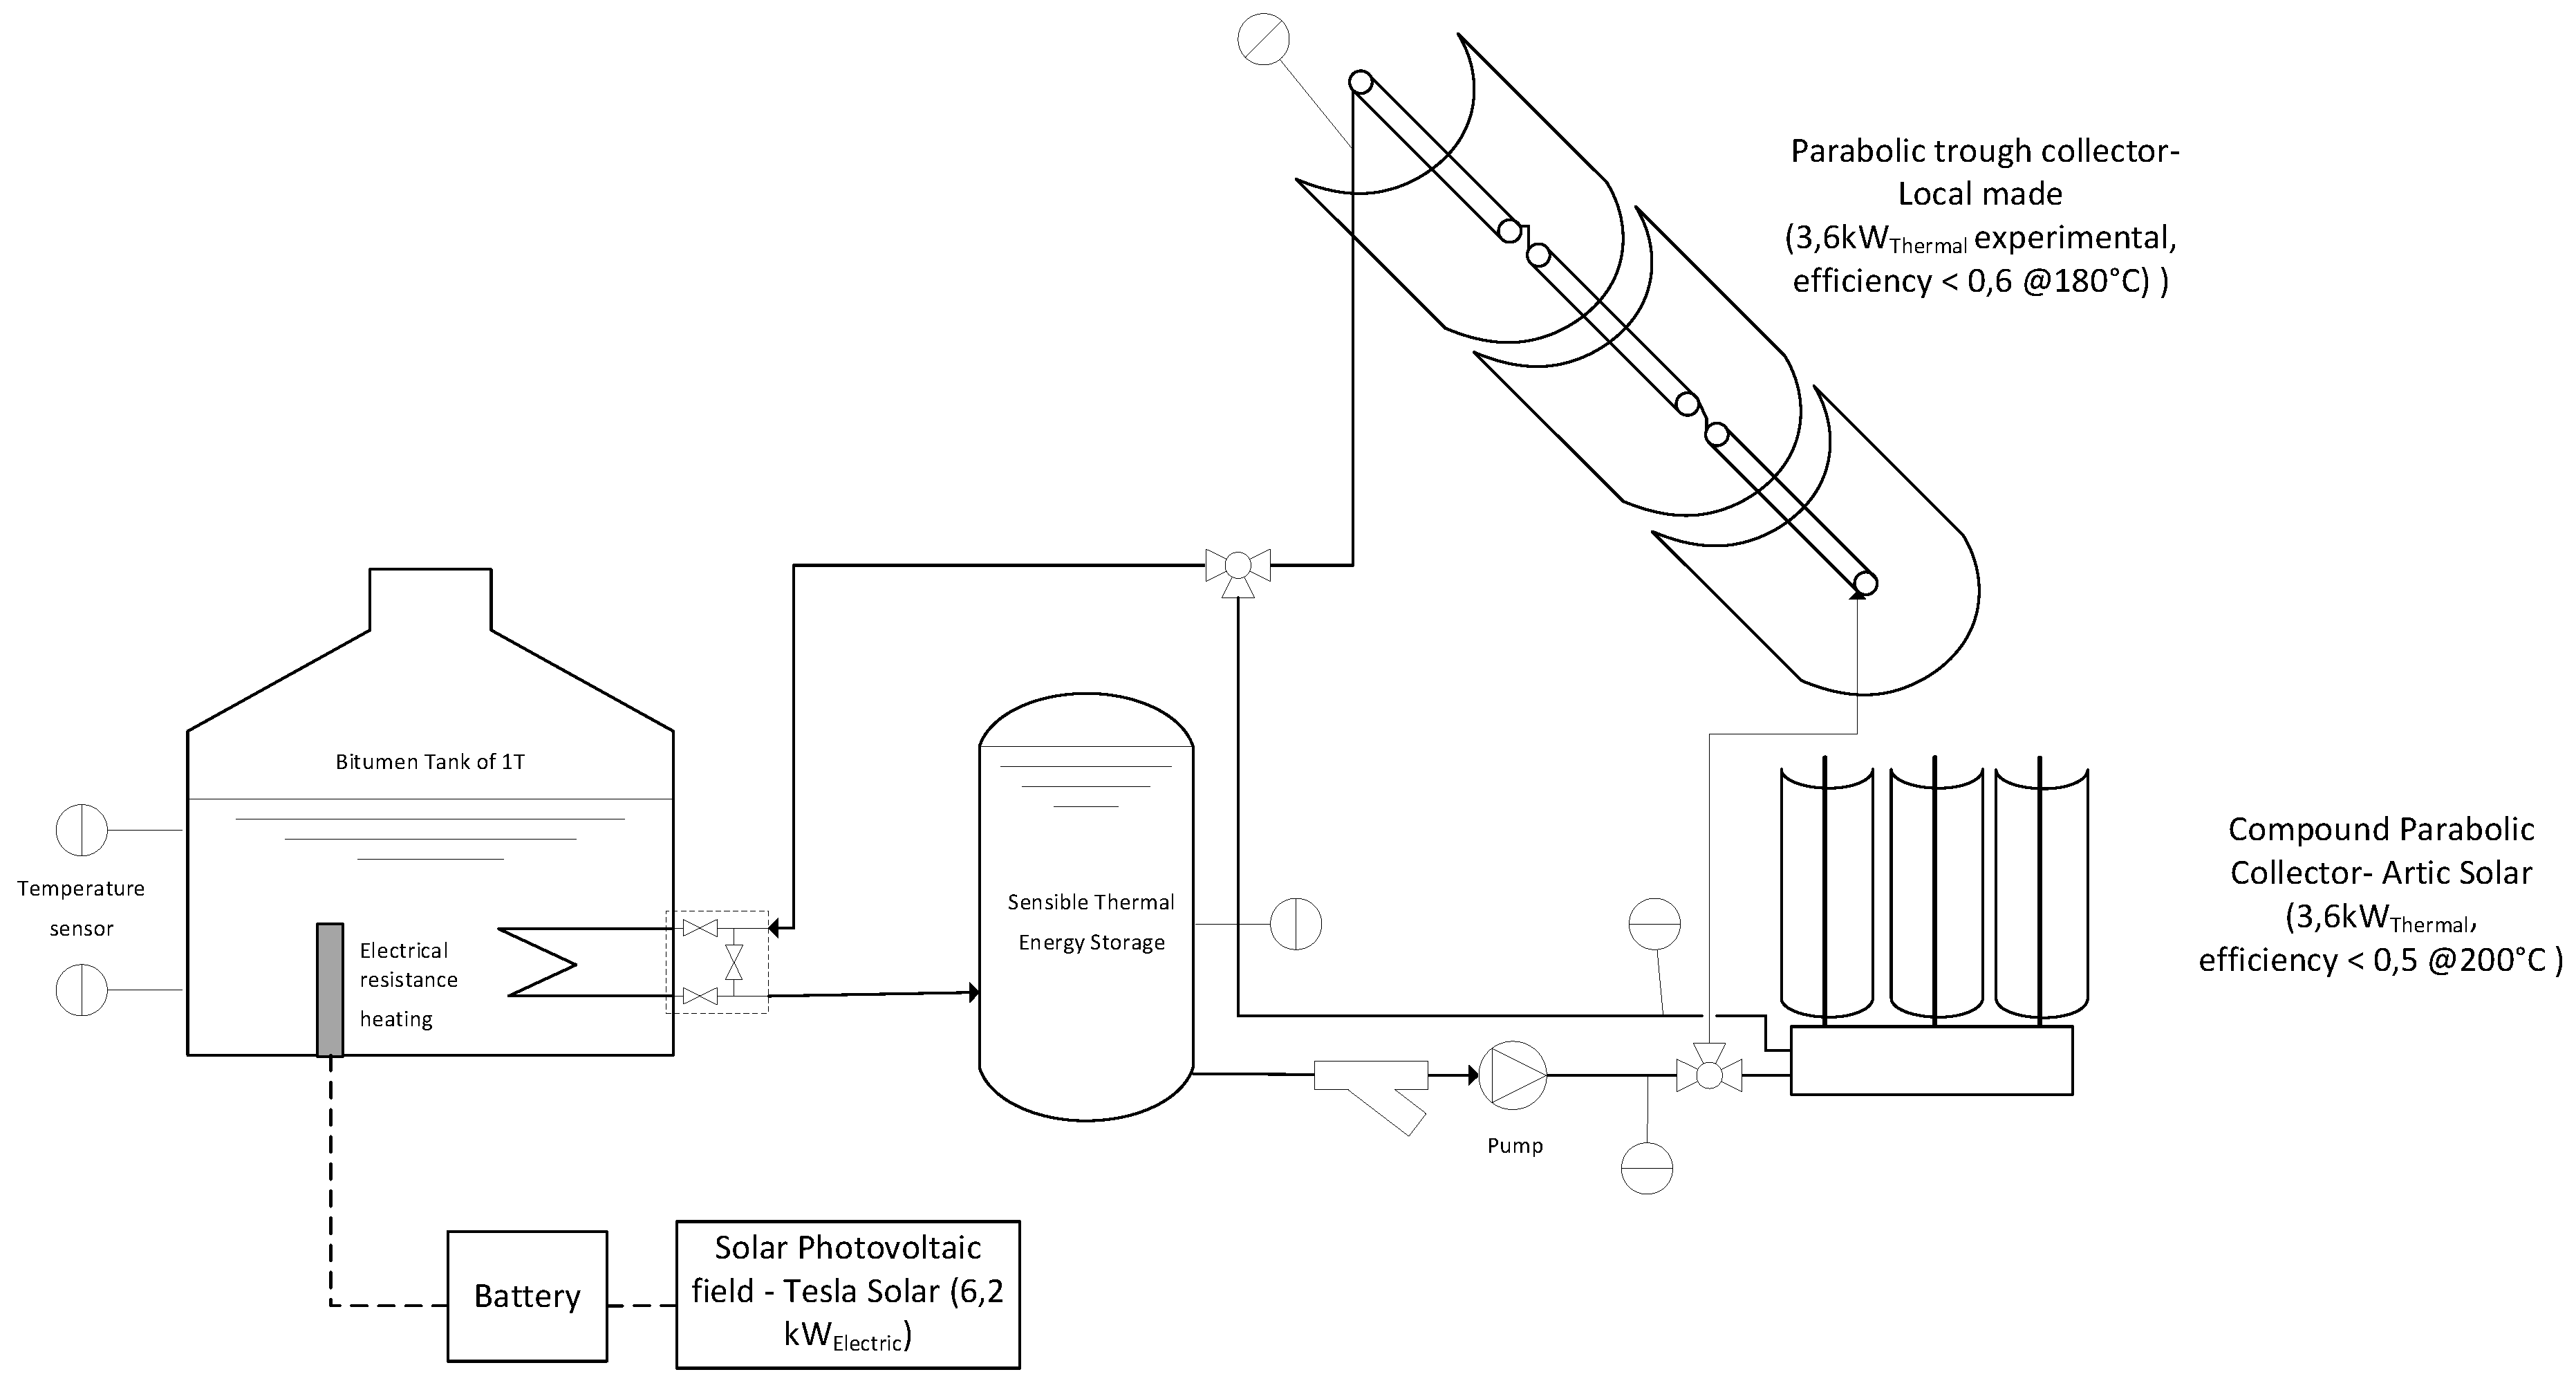
This study is a part of the MSC Bituma project, which aims to integrate solar energy in the heating process of two 40-ton bitumen storage tanks and then study the feasibility of a scale-up for bigger industrial tanks. An experimental setup was designed and deployed to assess the energy output of the renewable hybrid system; this experimental setup was composed of a small parabolic trough collector (SPTC) developed at the UIR (Université Internationale de Rabat) campus [35], a compound parabolic collector of artic solar [36], a PV panel, and batteries. Renewable energy sources aim to satisfy the heat need to compensate for the heat losses from a 1-ton “35/50 bitumen” tank and maintain its temperature (Figure 1). Figure 2 is a representation of the piping and instrumentation diagram of the 1-ton prototype.
The purpose of the presented experiment was to determine the actual temperature that the solar panel can reach in the conditions in Rabat, Morocco. In addition, we aimed to calculate the efficiency, which was determined by measuring the solar radiation to determine the possible power input of the system against the actual temperature gained by the heat transfer fluid, which in this case was Green THERM oil. Finally, this experiment sought to provide real data and predictions on the power produced by our solar field (XCPC, PTC, and PV solar) and the real power consumed by bitumen heating.

2.1.1. Test Device—Major Components

This system included a number of major components that were essential for operation and data measurement.
This system operated from a three-phase pump capable of producing a flow rate from 180 L/h to 230 L/h. This was the perfect flow rate for these panels, as higher flow rates will erode the piping before the product has reached its expected life. The pump had a pressure regulator to maintain a stable operating pressure of 10 bar.
The system came with an analog pressure gauge that could be visually inspected for pressure switch failure.

Measuring Equipment

Temperatures were measured by attaching a Type K PT100s to piping with high-insulation thermowells. These were placed before and after the solar field, thermal energy storage, and bitumen tank.
A Kimo SAM 110 pyranometer was used to profile the incident radiation on site.
A Chauveau Arnoux Electrical Network analyzer was also used.

XCPC Collector

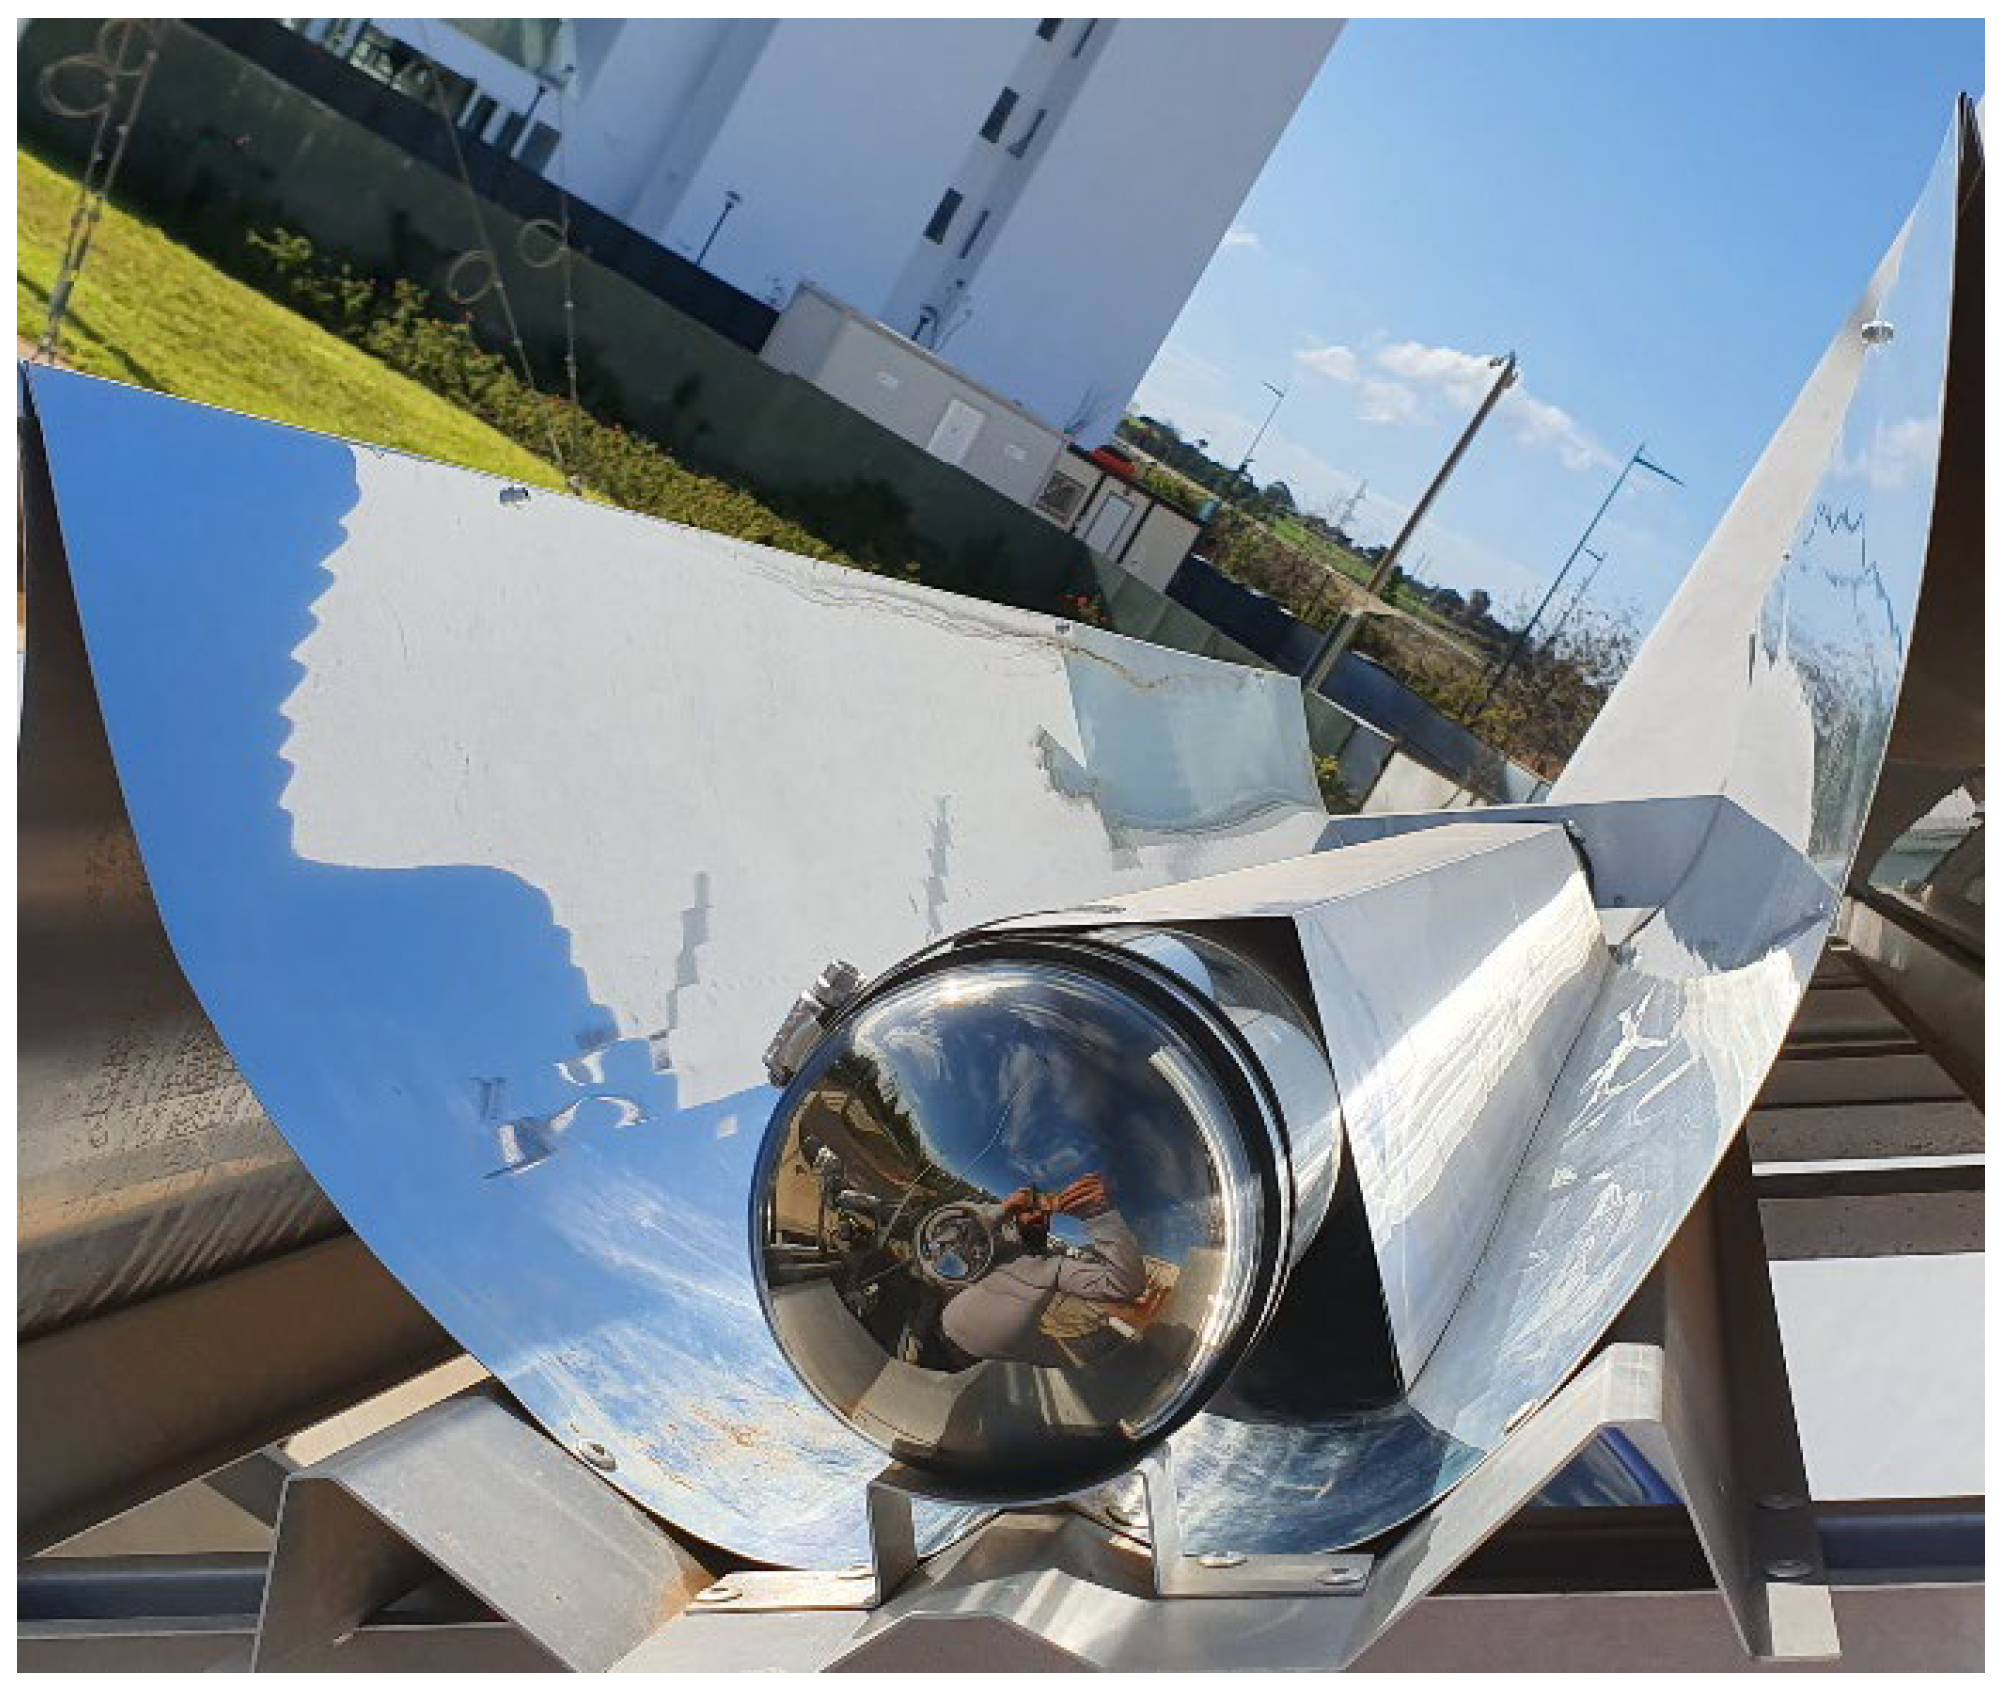
The XCPC collector had a total area of 2.7 m2 with an actual opening of approximately 2.4 m2. Using evacuated tubes of DN100 diameter (Figure 3), this system maintained a concentration ratio of 1.49. Thanks to these evacuated tubes, this system was able to retain a large amount of absorbed energy and lose almost no energy to convection or conduction. At 200 °C, this system was able to absorb the energy that was dissipated by radiation.

Parabolic Trough Collector

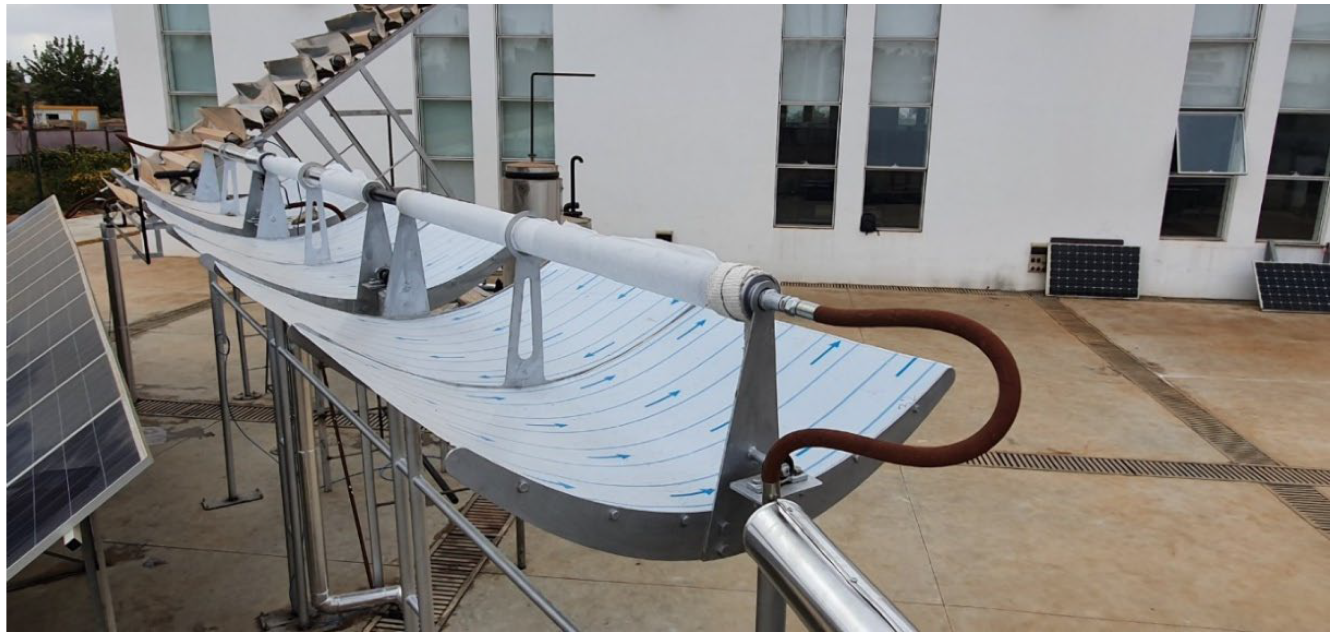
Before moving on to the construction of the PTC (Figure 4), we modeled, studied, and optimized the effect of the parameters considered for the thermal and economic performance of the collector [35]. The optimized design parameters of the parabolic microcylinder were a 5 m length, a 2 m width, a 0.02 m absorber diameter, and a 0.1 m glass cover diameter.

PV Solar Field

Tesla Solar TS260P-60 Polycrystalline panels were chosen as the PV panels of the laboratory prototype. The photovoltaic filed was composed of 24 modules of 260 Wp, which gave an installed power peak of 6240 Wp. These photovoltaic panels were characterized by international certifications of quality, safety, and performance. Many criteria were required for the metal structure to support 24 PV panels (990 mm × 1590 mm), including the ideally adjustable tilt (32°) for the city of Rabat, Morocco, and the natural ventilation of the photovoltaic module (See Figure 1).

2.2. Simulation Scenarios

Bituminous materials are usually stored at high temperatures to keep their viscosity at an appropriate level for pumping. That is why their storage process requires a large energy supply. Solar energy integration in the process of bitumen heating can solve the large energy issue. A performing solar energy system can allow 35/50 penetration-grade bitumen to attain high temperatures (≤180 °C).
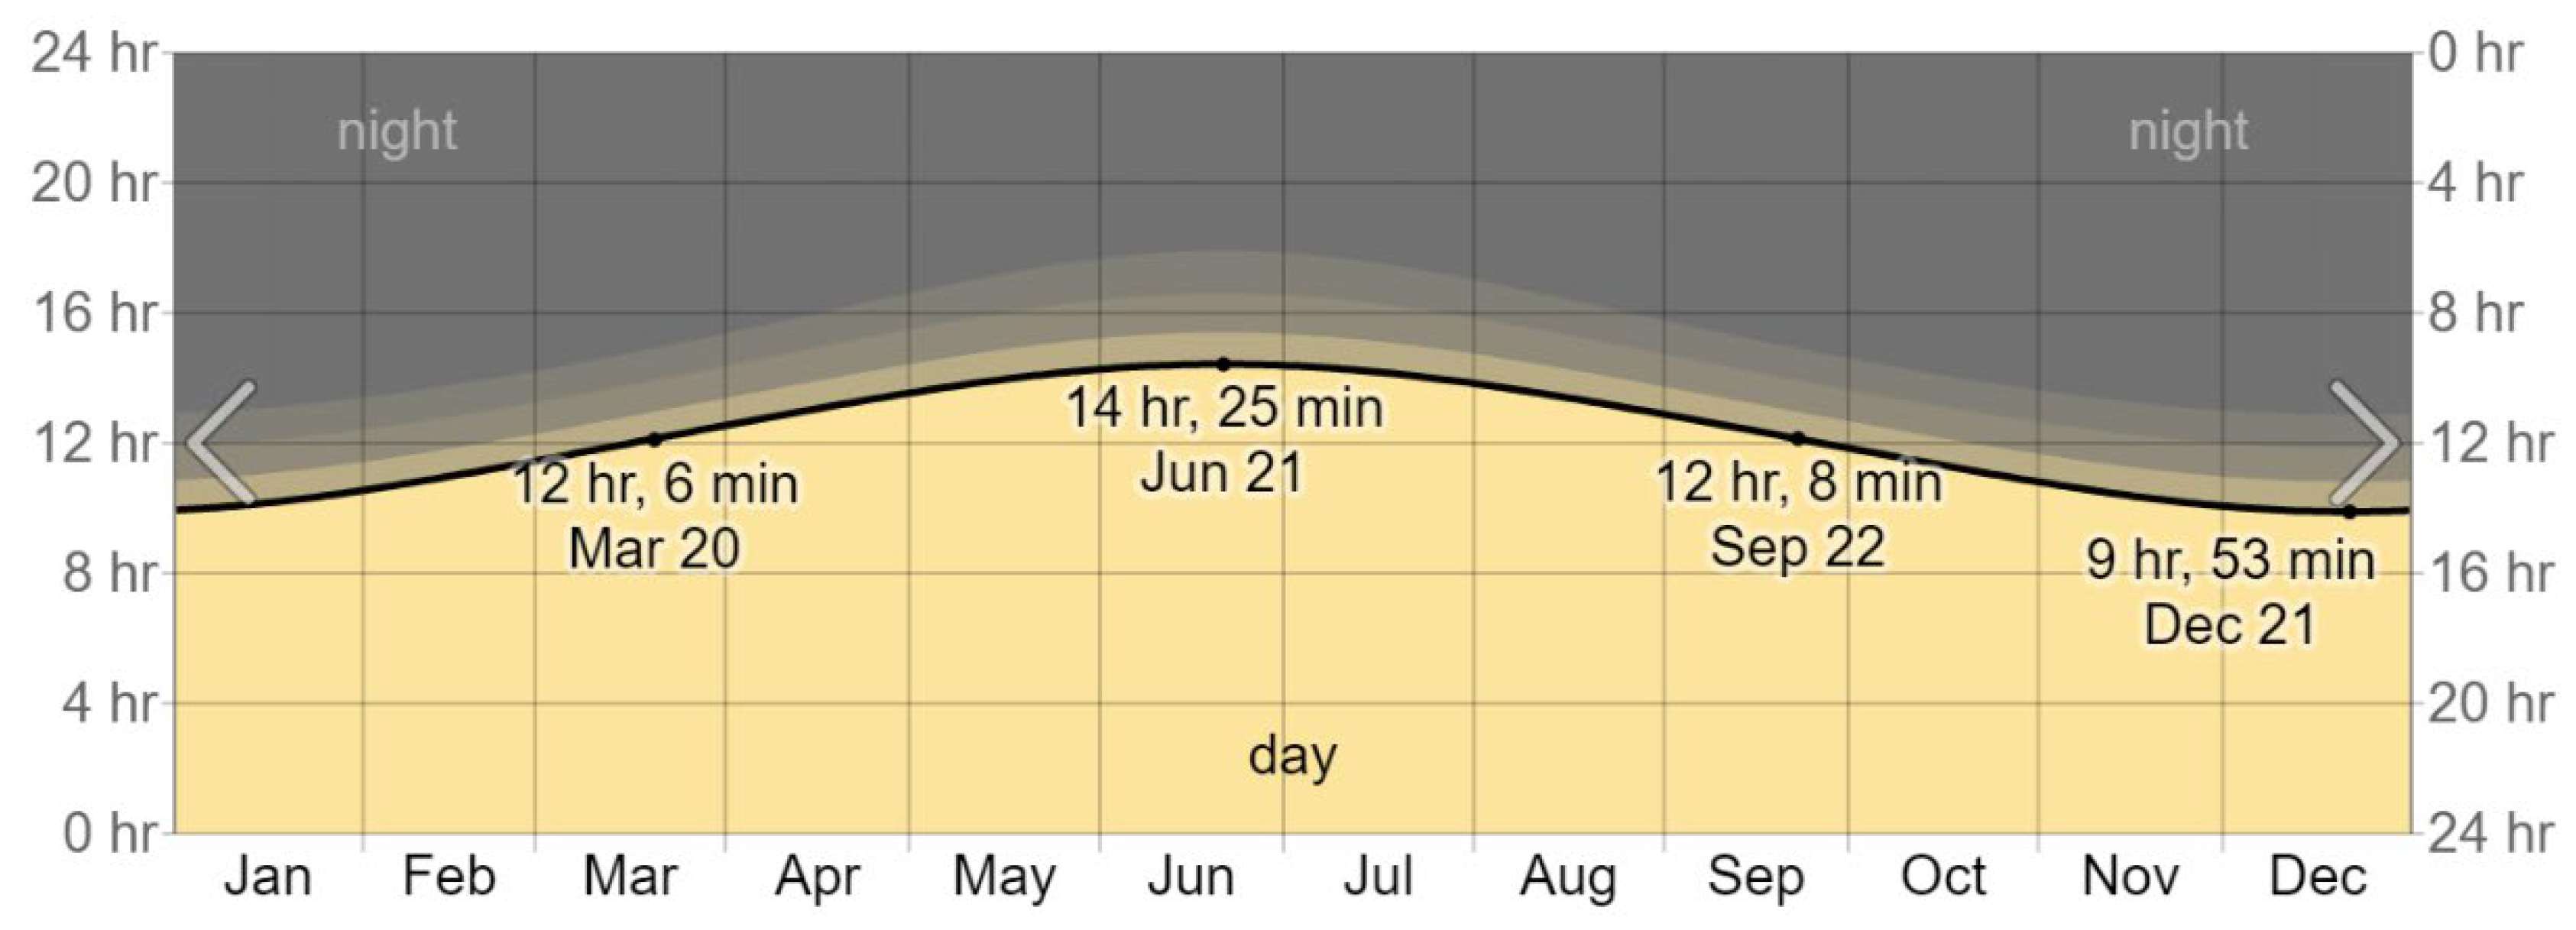
The experimental setup allowed us to determine the temperatures we could attain with our solar system in the 1-ton bitumen tank. We studied the temperature variations resulting from the climate change in Rabat, Morocco, during a whole year (2021) (Figure 5). We found out that during the coldest months, from November to February, the bitumen temperature we could usually attain was 155 °C. During September, October, March, and April, we could attain a bitumen temperature of 165 °C most of the time. Between May and August, we could attain 175 °C more often than not.
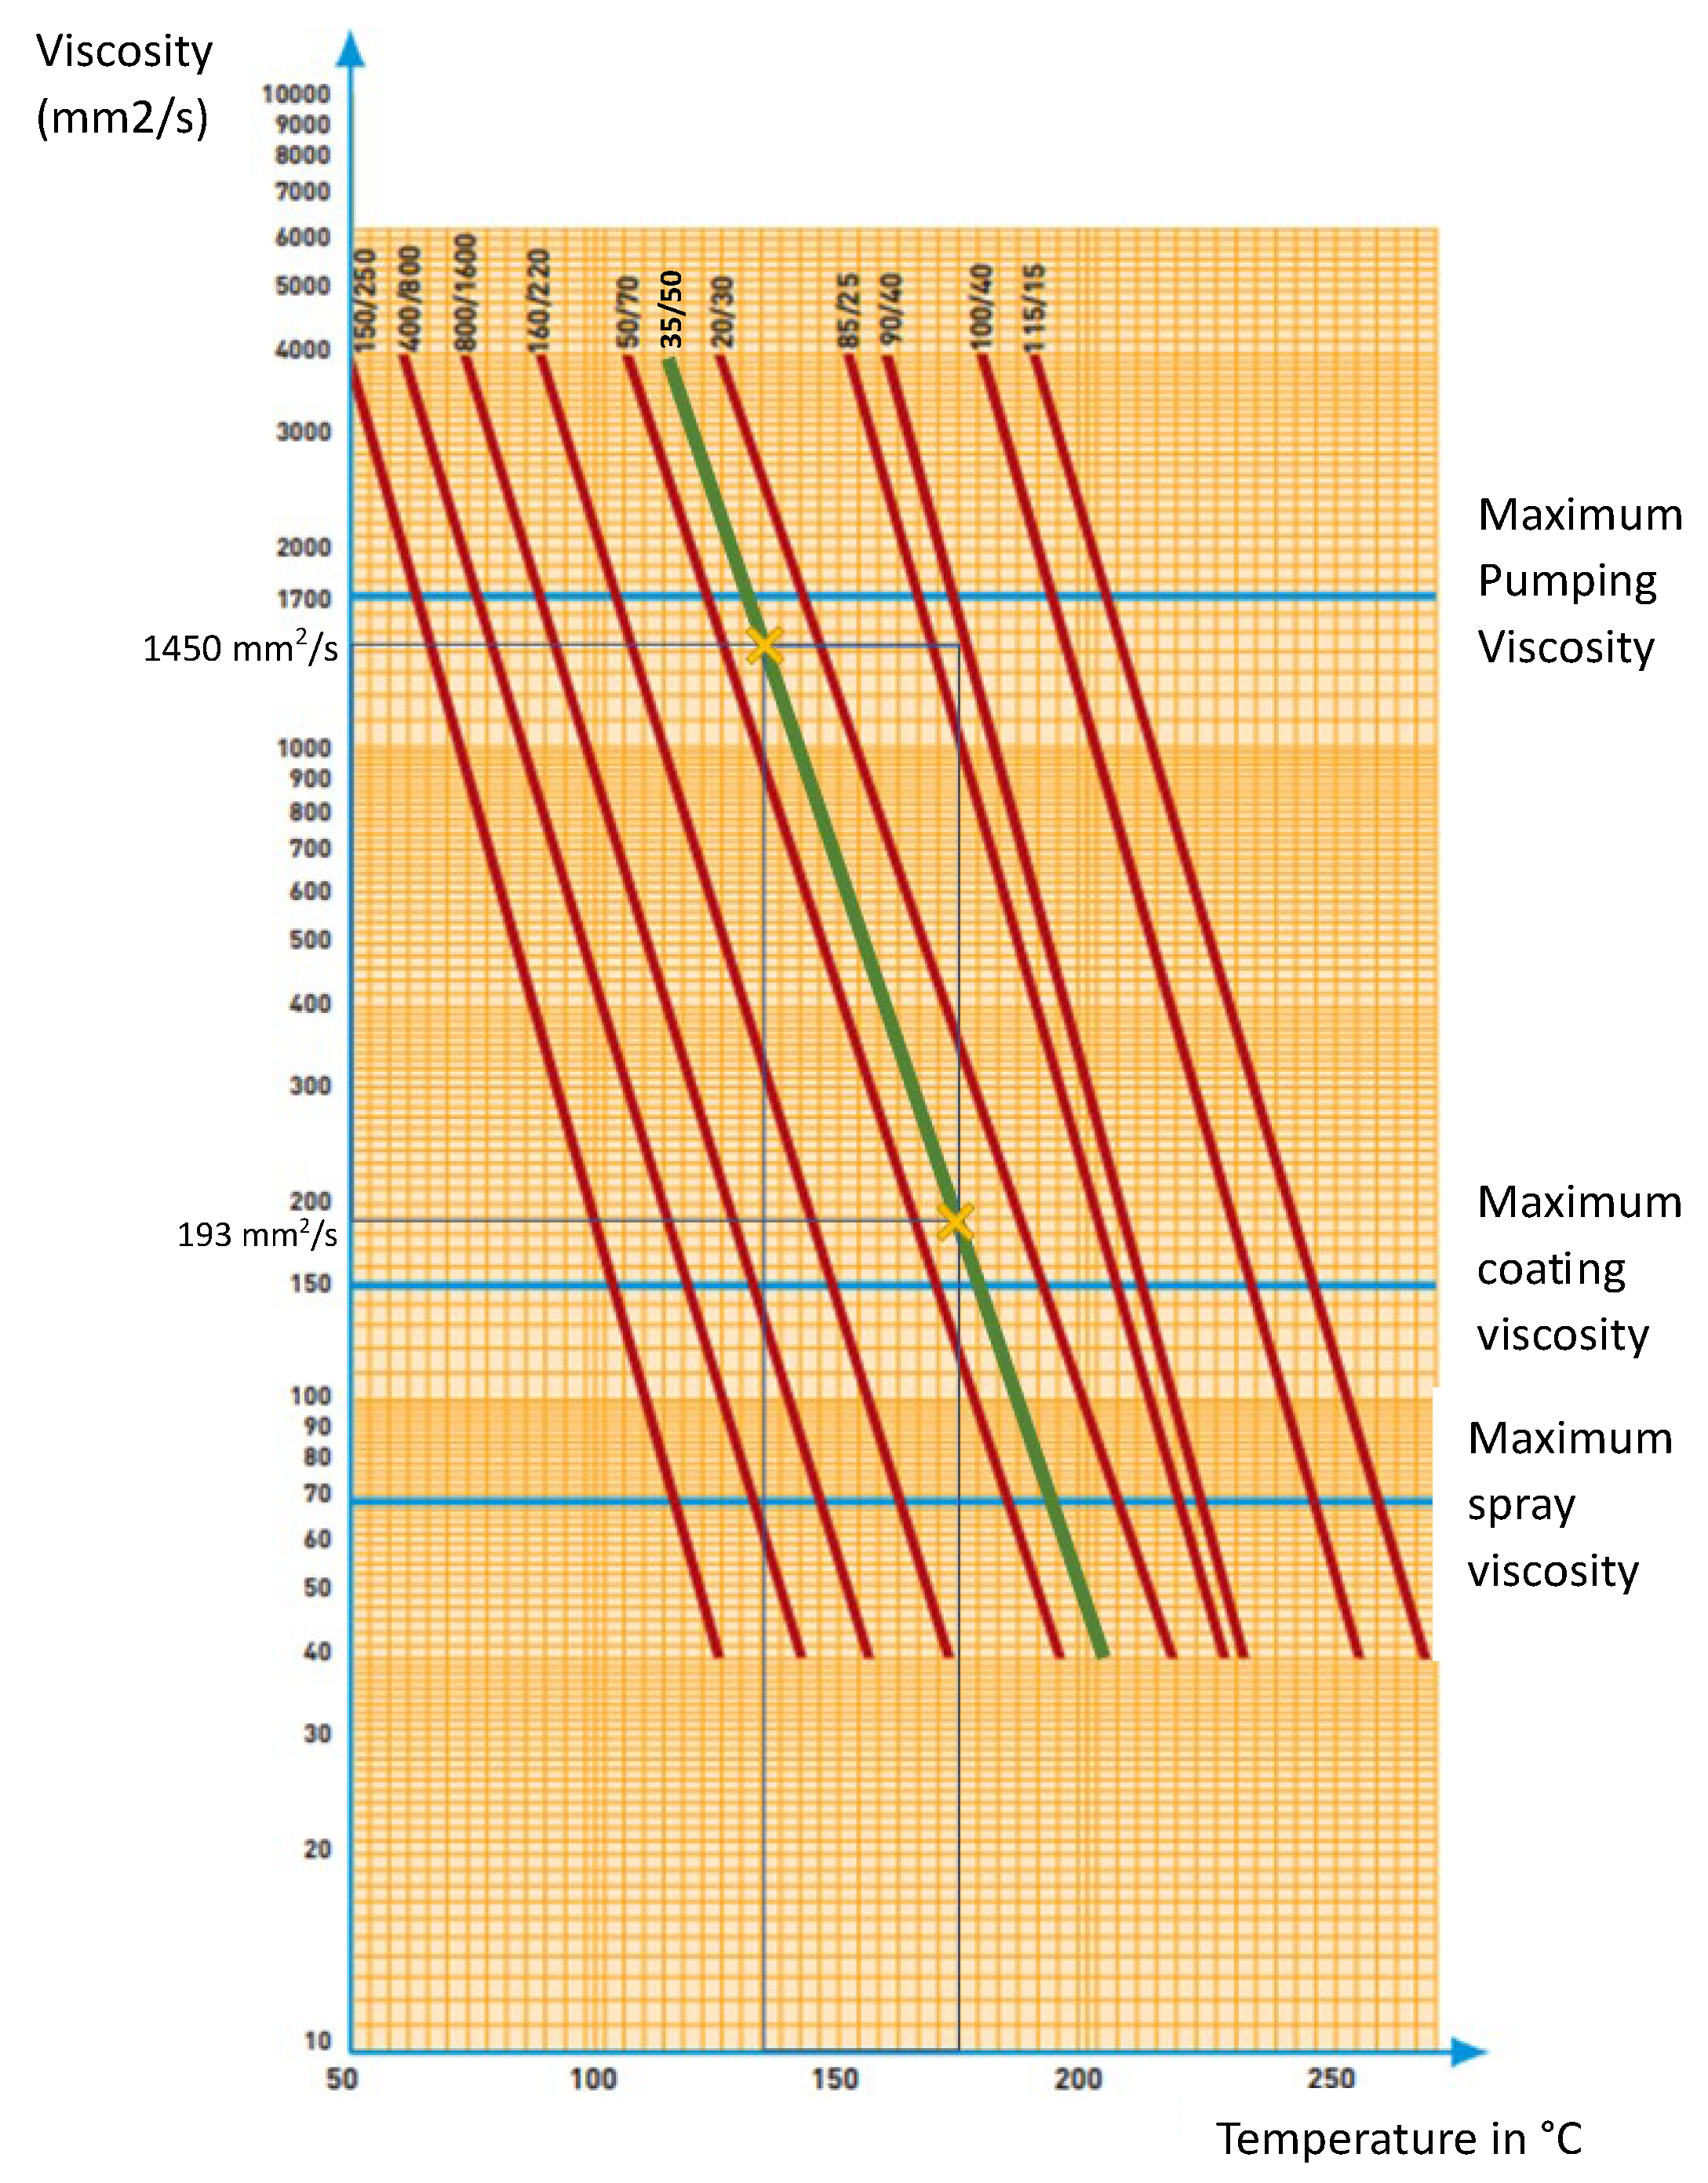
The 35/50 penetration-grade bitumen storage can be performed in a wide span of temperatures, with an average storage temperature of 155–175 °C, an extended storage temperature of 125–135 °C, and a minimum pumping temperature of 130 °C [38,39]. Storing 35/50 penetration-grade bitumen at any temperature between 135 and 175 °C does not compromise its pumpability. As shown in Figure 6, the maximum pumping viscosity of 35/50 paving-grade bitumen is equal to 1700 mm2/s, and at 135 °C the viscosity is equal to 1450 mm2/s. In Appendix A, we investigated the impact of bitumen viscosity on the pumping power by calculating the linear pressure drops at different pumping temperatures. We found that storing 35/50 bitumen at high temperatures reduces the linear pressure drop, hence reducing the amount of energy used in pumping.
Thus, we chose Tmin = 135 °C as the minimum temperature our bitumen could reach and Tmax = 155 °C, 165 °C, and 175 °C as the maximum temperatures our bitumen could attain, depending on the season. Consequently, the idea was to heat the bitumen tank to any attainable temperature between 155 and 175 °C during the sun hours and let it cool to 135 °C during the night. After calculating the bitumen cooling time during each season, and since the minimum temperature was set at 135 °C, we decided to adjust the heating program:
In the scenario where bitumen reaches 175 °C, the cooling time from 175 °C to 135 °C is long and the nighttime is short. Therefore, while bitumen is still cooling down during the next day’s sun hours, we opt for occasional energy storage, using the batteries that already exist in the experimental setup, and use that stored energy to start the heating if our bitumen hits 135 °C at night.
In the scenario where bitumen attains 155 °C, bitumen might cool down to 135 °C before the sun hours of the next day, so we might need an energy supply to prevent it from reaching temperatures <135 °C, thus the need for a fossil fuel heater.
Considering all the above parameters, Table 1 summarizes the temperature ranges and the storage durations we decided to study and the number of cycles for each temperature range/storage duration.
The temperature that bitumen can attain using solar energy and the time of heating/cooling are highly dependent on the weather conditions, the solar system efficiency, the quantity of bitumen, and the isolation system efficiency. Hence, every case will be different, and our study is just an example based on the specific state of these parameters: the weather in Rabat, Morocco; the 1-ton bitumen tank; and 100 mm rock wool isolation. Furthermore, the temperatures our system could reach were quite unpredictable, as they depended on the weather conditions of each day. Thus, the scenarios we simulated are ideal scenarios that were chosen for research purposes.
In order to evaluate the effect of the thermal fluctuations caused by solar energy usage on the performance of 35/50 penetration-grade bitumen, we conditioned our binders at a laboratory scale to reproduce those thermal fluctuations. A quantity of bitumen from one source was divided into thirty 1 kg samples; three bitumen samples were not thermally cycled and were used as our reference. To each temperature range/storage time, we assigned three bitumen samples. The thermal storage was conducted in a Votsch 7012S3 temperature shock test chamber.

2.3. Aging Simulation

Short-term aging is the aging that happens during the storage, mixing, transport, and placing of bitumen. We used the rolling thin film oven test (RTFOT), following EN 12607-1, to simulate the short-term aging of our samples [40]. The RTFOT was conducted at 163 °C for 75 min with a rotation frequency of 15 rpm and a hot air flow equal to 4000 [34].
Long-term aging is the aging that happens during the in-service phase of the binder’s lifetime. We used a pressure aging vessel (PAV), as per EN 14769, to simulate the long-term aging of our samples [41]. The PAV test was conducted at 100 °C under a pressure of 2.1 MPa for 20 h. These conditions represented 5 to 7 years of in-service aging. We performed the PAV test after subjecting the samples to the RTFOT [34].

2.4. Characterization Tests

We used predetermined procedures to assess the samples’ physical, chemical, and rheological characteristics after each aging stage (unaged, short-term aged, and long-term aged).
We applied the penetration at 25 °C and the determination of softening point R and B tests to evaluate the change in the samples’ consistency and viscoelastic consistency, respectively. The aim of the penetration test was to determine the bitumen consistency at 25 °C, and we realized it as per the procedure described in EN 1426 [42]. The softening point R and B test specifies bitumen properties at a high service temperature, and its results represents a conventional approximate upper limit of the viscoelastic consistency. We realized this test following the procedure described in EN 1427 [43].
We used attenuated total reflectance Fourier-transformed infrared (ATR-FTIR) spectroscopy to determine the bitumen functional groups that appeared or increased with aging. Research throughout the years has proven that carbonyl and sulfoxide chemical functional group formation is indicative of bitumen oxidation [44]. In the FTIR spectrum, if a significant increment in absorption is observed in the carbonyl and sulfoxide regions, then oxidation has occurred. In this study, bitumen oxidative aging was characterized using UATR-FTIR measurements at 23 °C in a Perkin Elmer Two Fourier-Transformed Infrared Spectrometer in the attenuated total reflectance mode with a diamond crystal. The collected spectra were acquired with 8 repetitive scans and ranged from 400 to 4000 cm−1 with a 4 cm−1 resolution [34]. The functional groups that can be found in a pure bitumen FTIR spectrum, as well as the bond vibrations and wavenumbers associated with them, are displayed in Table 2. We concentrated on the carbonyl and sulfoxide groups that are byproducts of oxidation. It is known that the sulfoxide group peaks at about 1030 cm−1 and the carbonyl group peaks at about 1700 cm−1.
To evaluate the change in the rheological properties of 35/50 bitumen, we used a dynamic shear rheometer (DSR). We performed this test following the procedure described in AASHTO T 315 [45]. A temperature sweep test, in strain-controlled mode, was applied to a specimen held between the temperature-controlled plates at a frequency of 10 rad/s. The strain was determined at 12.06%, 10.05%, and 1.01% for the unaged binders, the RTFOT-aged binders, and the PAV-aged binders, respectively. The testing temperatures were set at 52 °C, 58 °C, 64 °C, and 70 °C for the unaged and RTFOT-aged samples and at 34 °C, 31 °C, 28 °C, 25 °C, and 22 °C for the PAV-aged samples. The data were collected at 6 °C intervals (unaged and RTFOT) or at 3 °C intervals (PAV). The measuring device used was an MCR 302 (Anton Paar Company). For the unaged and RTFOT-aged samples, we used the 25 mm plate with a 1 mm gap between the parallel plates. For the PAV-aged samples, we used the 8 mm plate with a 2 mm gap between the parallel plates.
We respected the repeatability standards for the penetration test, the determination of softening point test, and the DSR test that are mentioned in their respective standard test methods, and measurements that were not in agreement with these standards were removed:
  • For the penetration test, the difference between two results should not—in a long series of tests carried out with a normal and correct application of the test method—exceed r = 2 (0.1 mm) more than one in twenty times [42];
  • For the determination of softening point test, the difference between two results should not exceed r = 1.0 °C more than one in twenty times [43];
  • For the DSR test, two results obtained in the same laboratory by the same operator using the same equipment in the shortest practical period of time should not be considered suspect unless the difference in the two results, expressed as a percent of their mean, exceeds the values given in Table 3 [45]:
Throughout the paper, the tested binders are coded as follows:
  • Neat: control sample = has not been exposed to any thermal cycles;
  • 135–155 °C 1 M, 135–155 °C 2 M, and 135–155 °C 3 M: the samples stored between 135 and 155 °C for one month, two months, and three months, respectively;
  • 135–165 °C 1 M, 135–165 °C 2 M, and 135–165 °C 3 M: the samples stored between 135 and 165 °C for one month, two months, and three months, respectively;
  • 135–175 °C 1 M, 135–175 °C 2 M, and 135–175 °C 3 M: the samples stored between 135 and 175 °C for one month, two months, and three months, respectively.

3. Results and Discussion

3.1. Meteorological Data of Test Month (June 2021)

The results presented in this section were collected in June 2021. Figure 7 shows the meteorological data of the solar implant during the test period.

3.2. Solar System Performance

Based on calculations of heat transfer, the heat losses from the bitumen storage tank to the surroundings were assessed. In this case, the tank’s configuration, the isolation quality, the wind speed, the ambient temperature, and the temperature difference between the tank and the air or the ground all had significant impacts on the rate of heat transfer. For this reason, the tank’s surface area was divided into four parts: the dry sidewall, the wet sidewall, the tank bottom, and the tank roof. The equations used to calculate the total heat loss were detailed in our previous work [34].
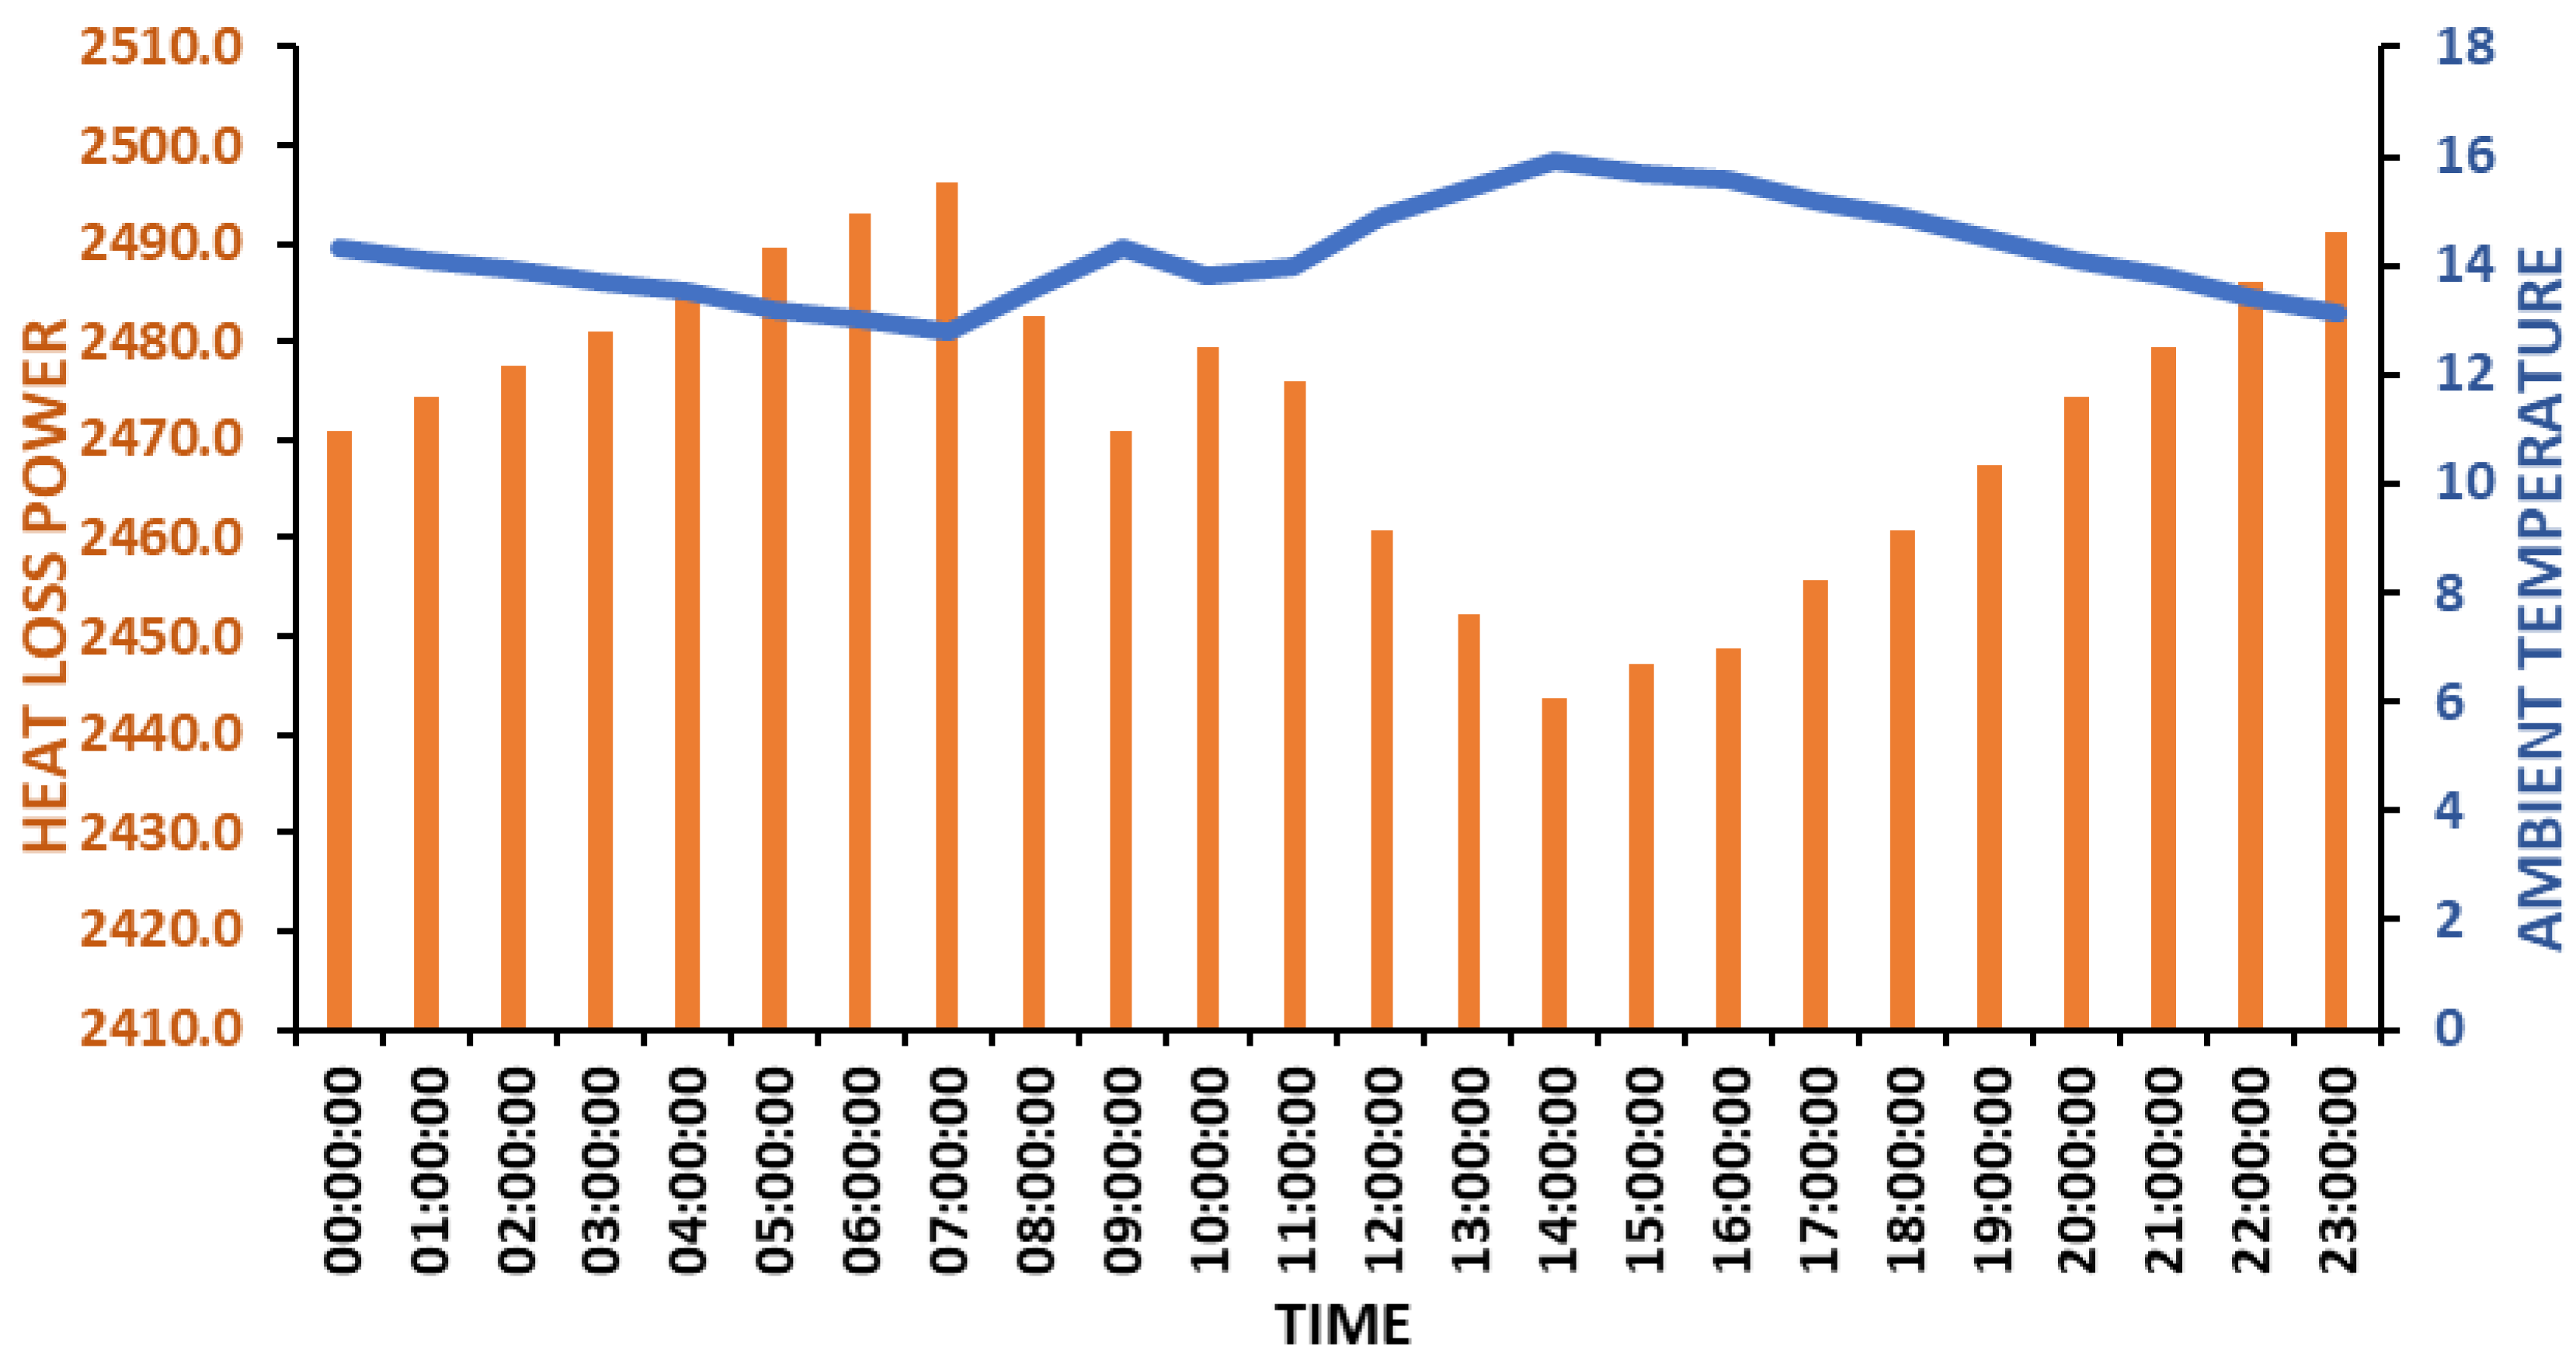
Figure 8 shows the variation in the heat loss flows as well as the variation in the ambient temperature during the day in Rabat. We noticed that during the day the variation in the power did not exceed 1%. Thus, we considered 2450 W as a constant heat loss power.

3.2.1. XCPC Collector

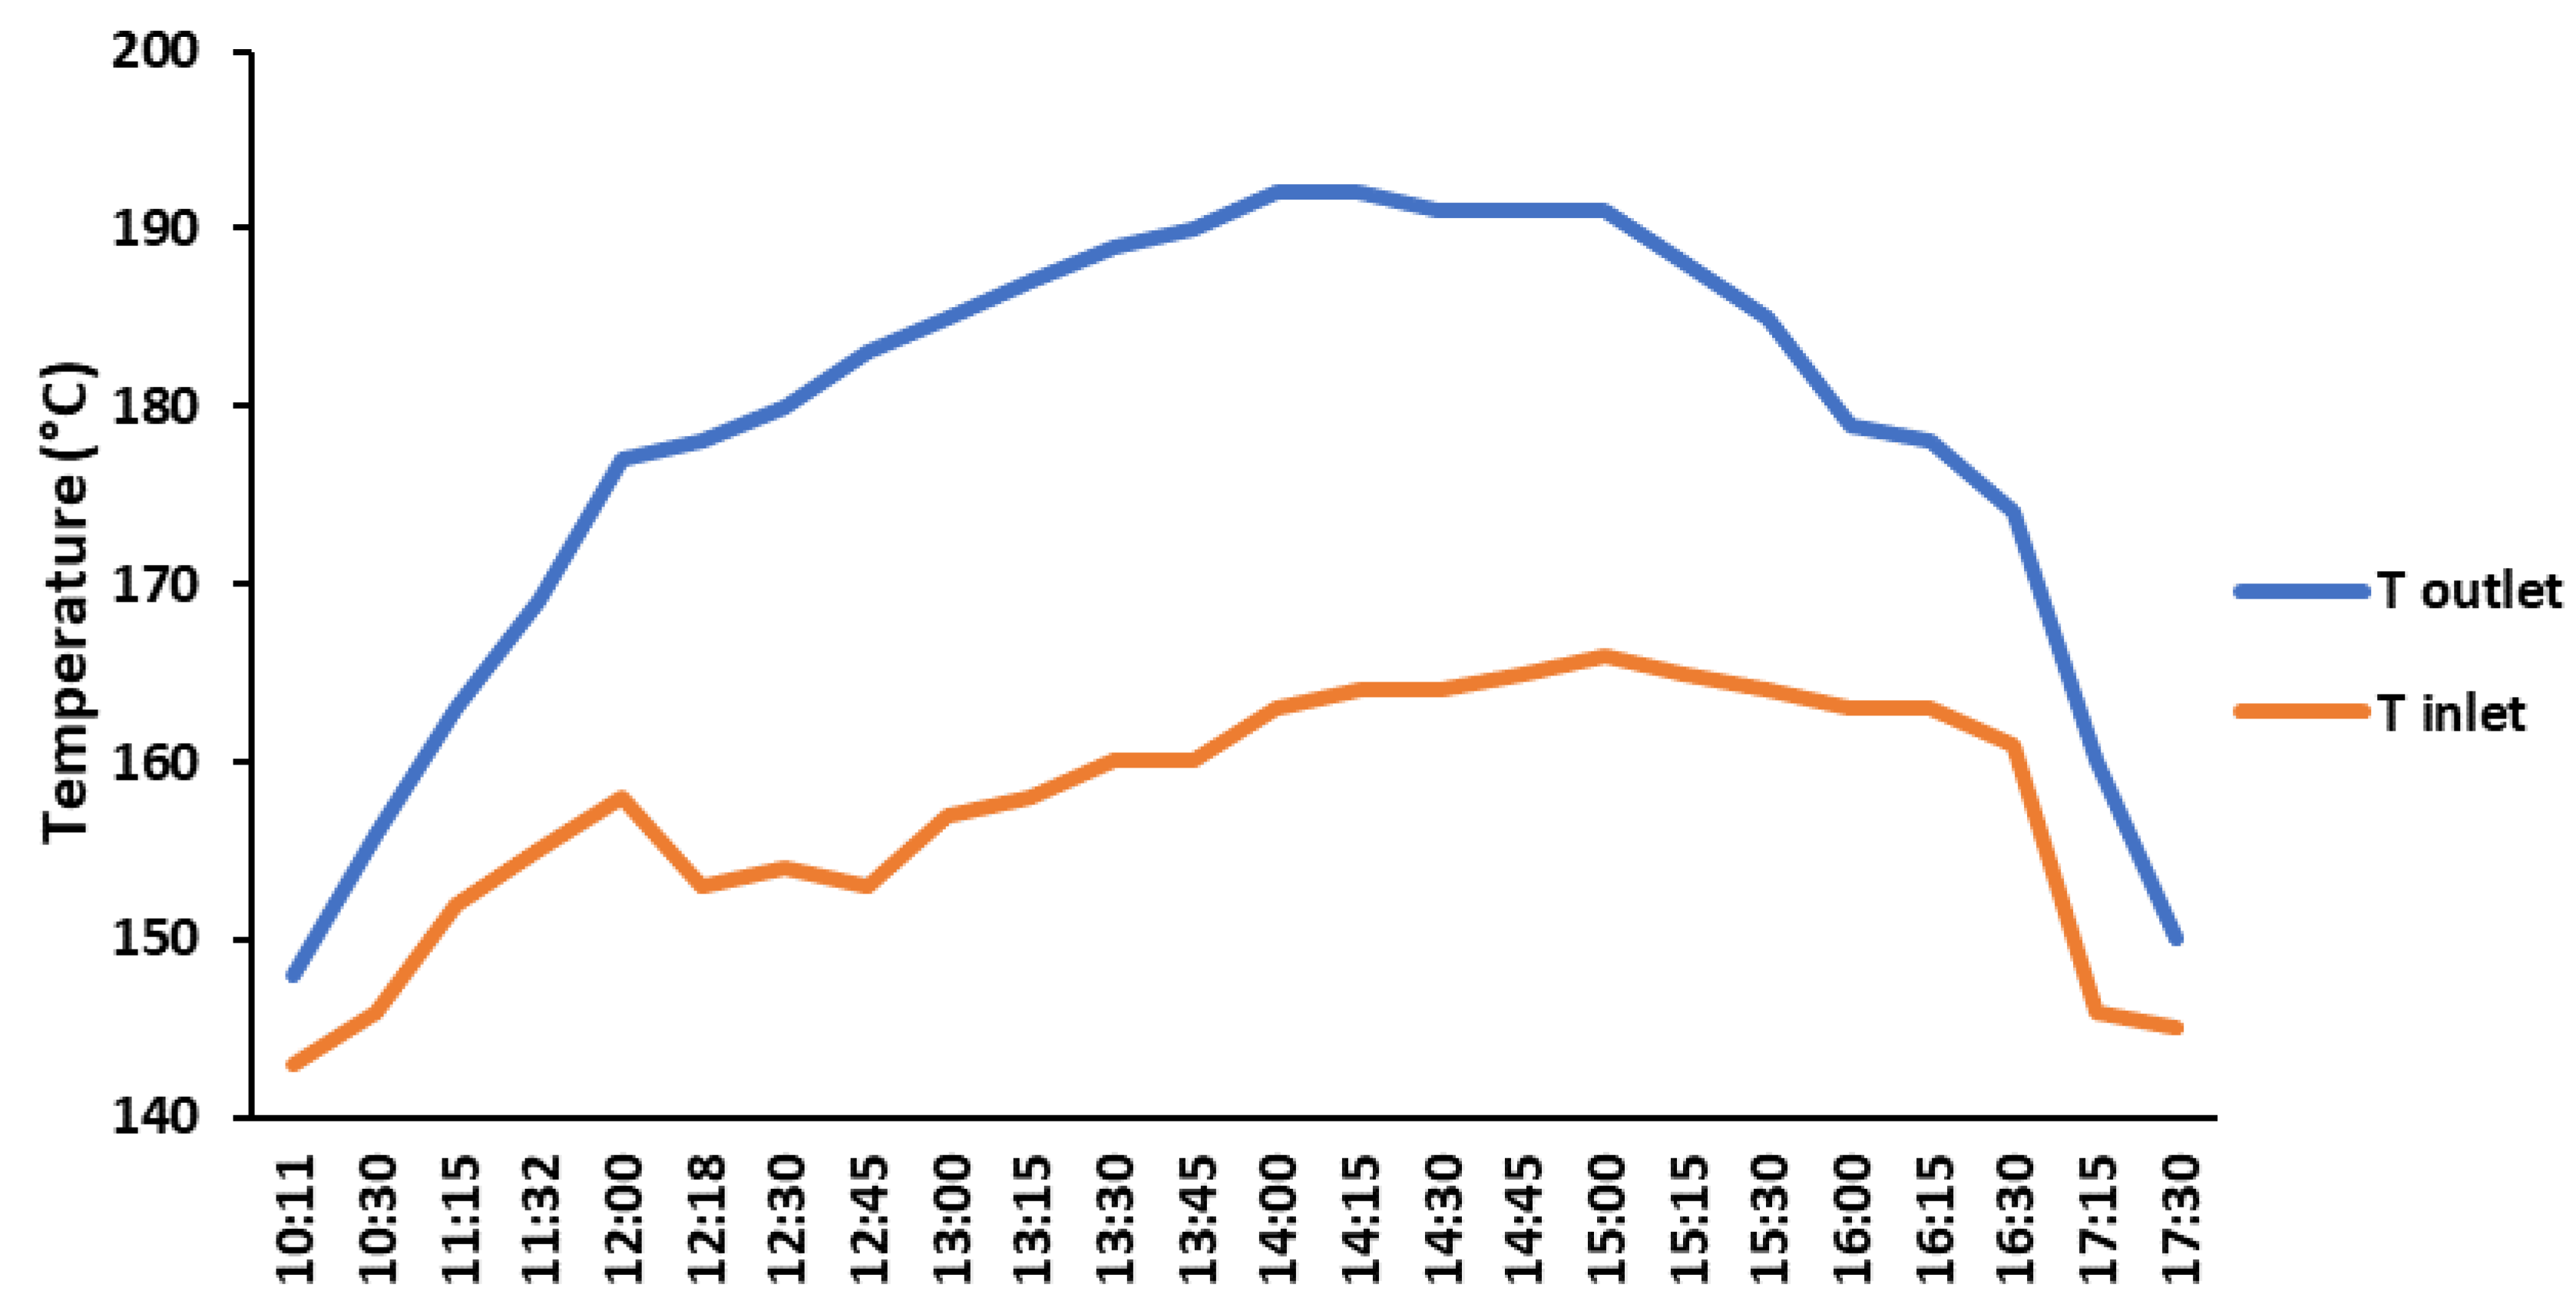
Figure 9 shows the evolution of the temperature upstream and downstream of the XCPC solar field for one day. We can see that the solar field could provide an output temperature higher than 180 °C in the period between 12 p.m. and 4 p.m.
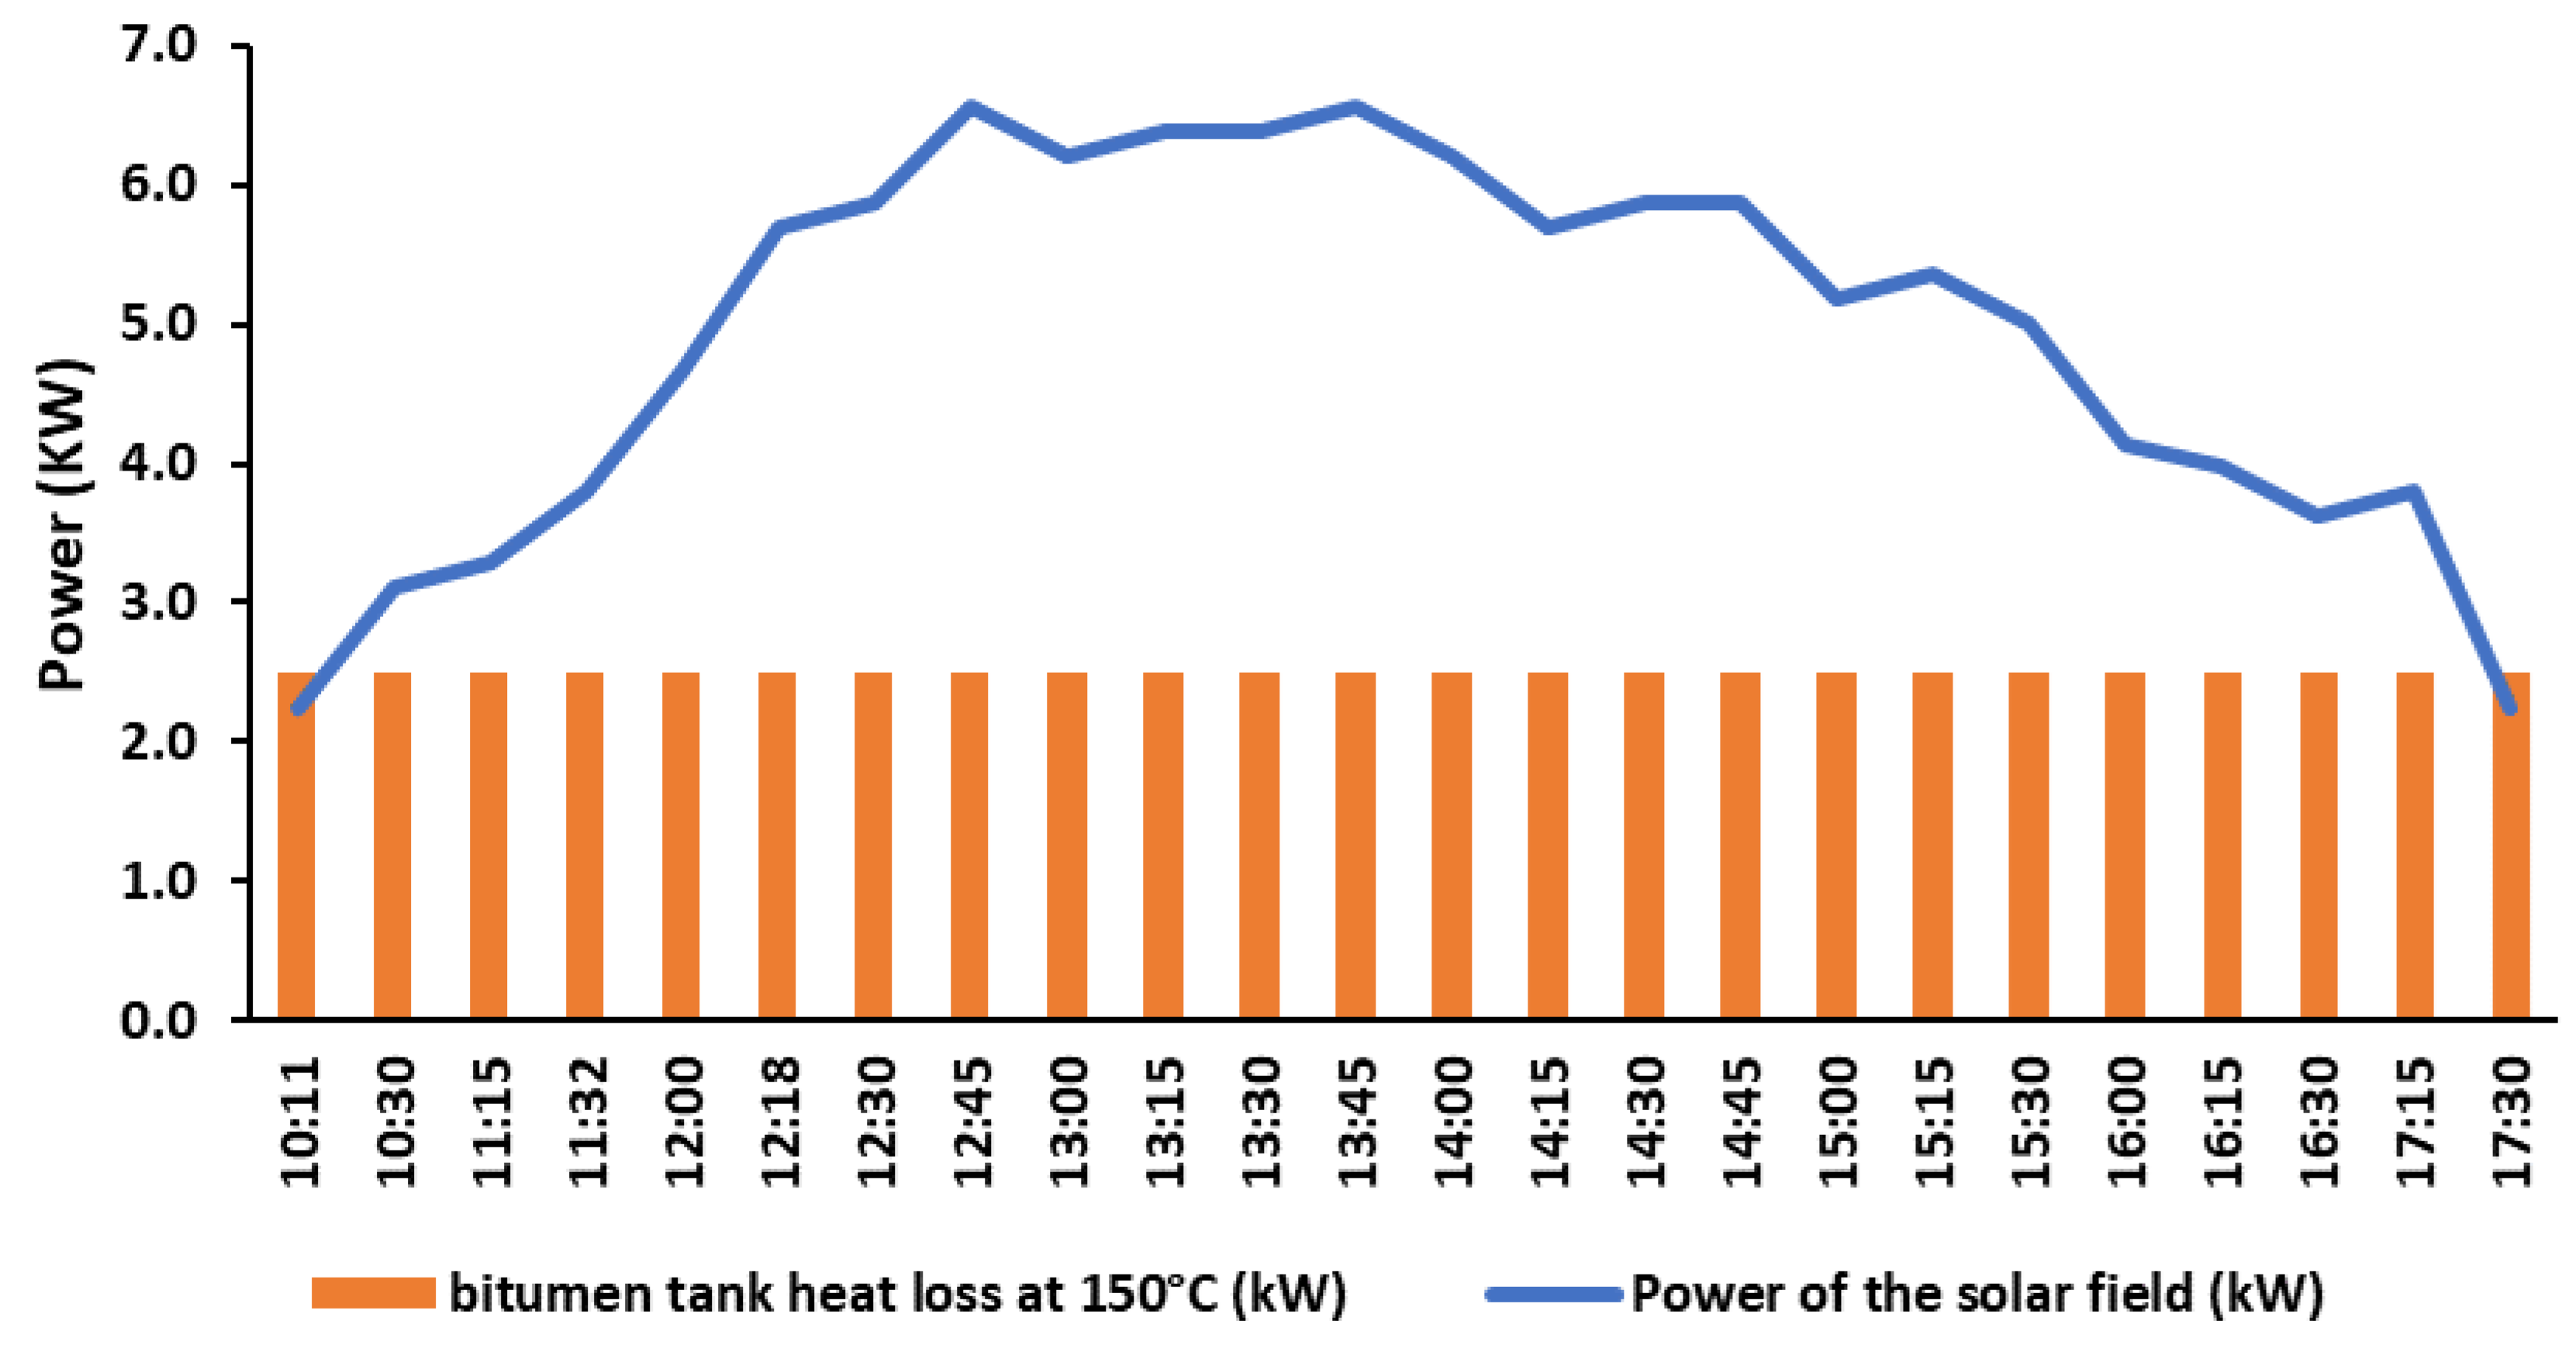
Figure 10 shows the evolution of the power supplied by the XCPC solar field vs. the heat loss power of the bitumen reservoir. The excess energy produced was stored in the form of sensible energy in the storage tank to cover part of the night.

3.2.2. Parabolic Trough Collector

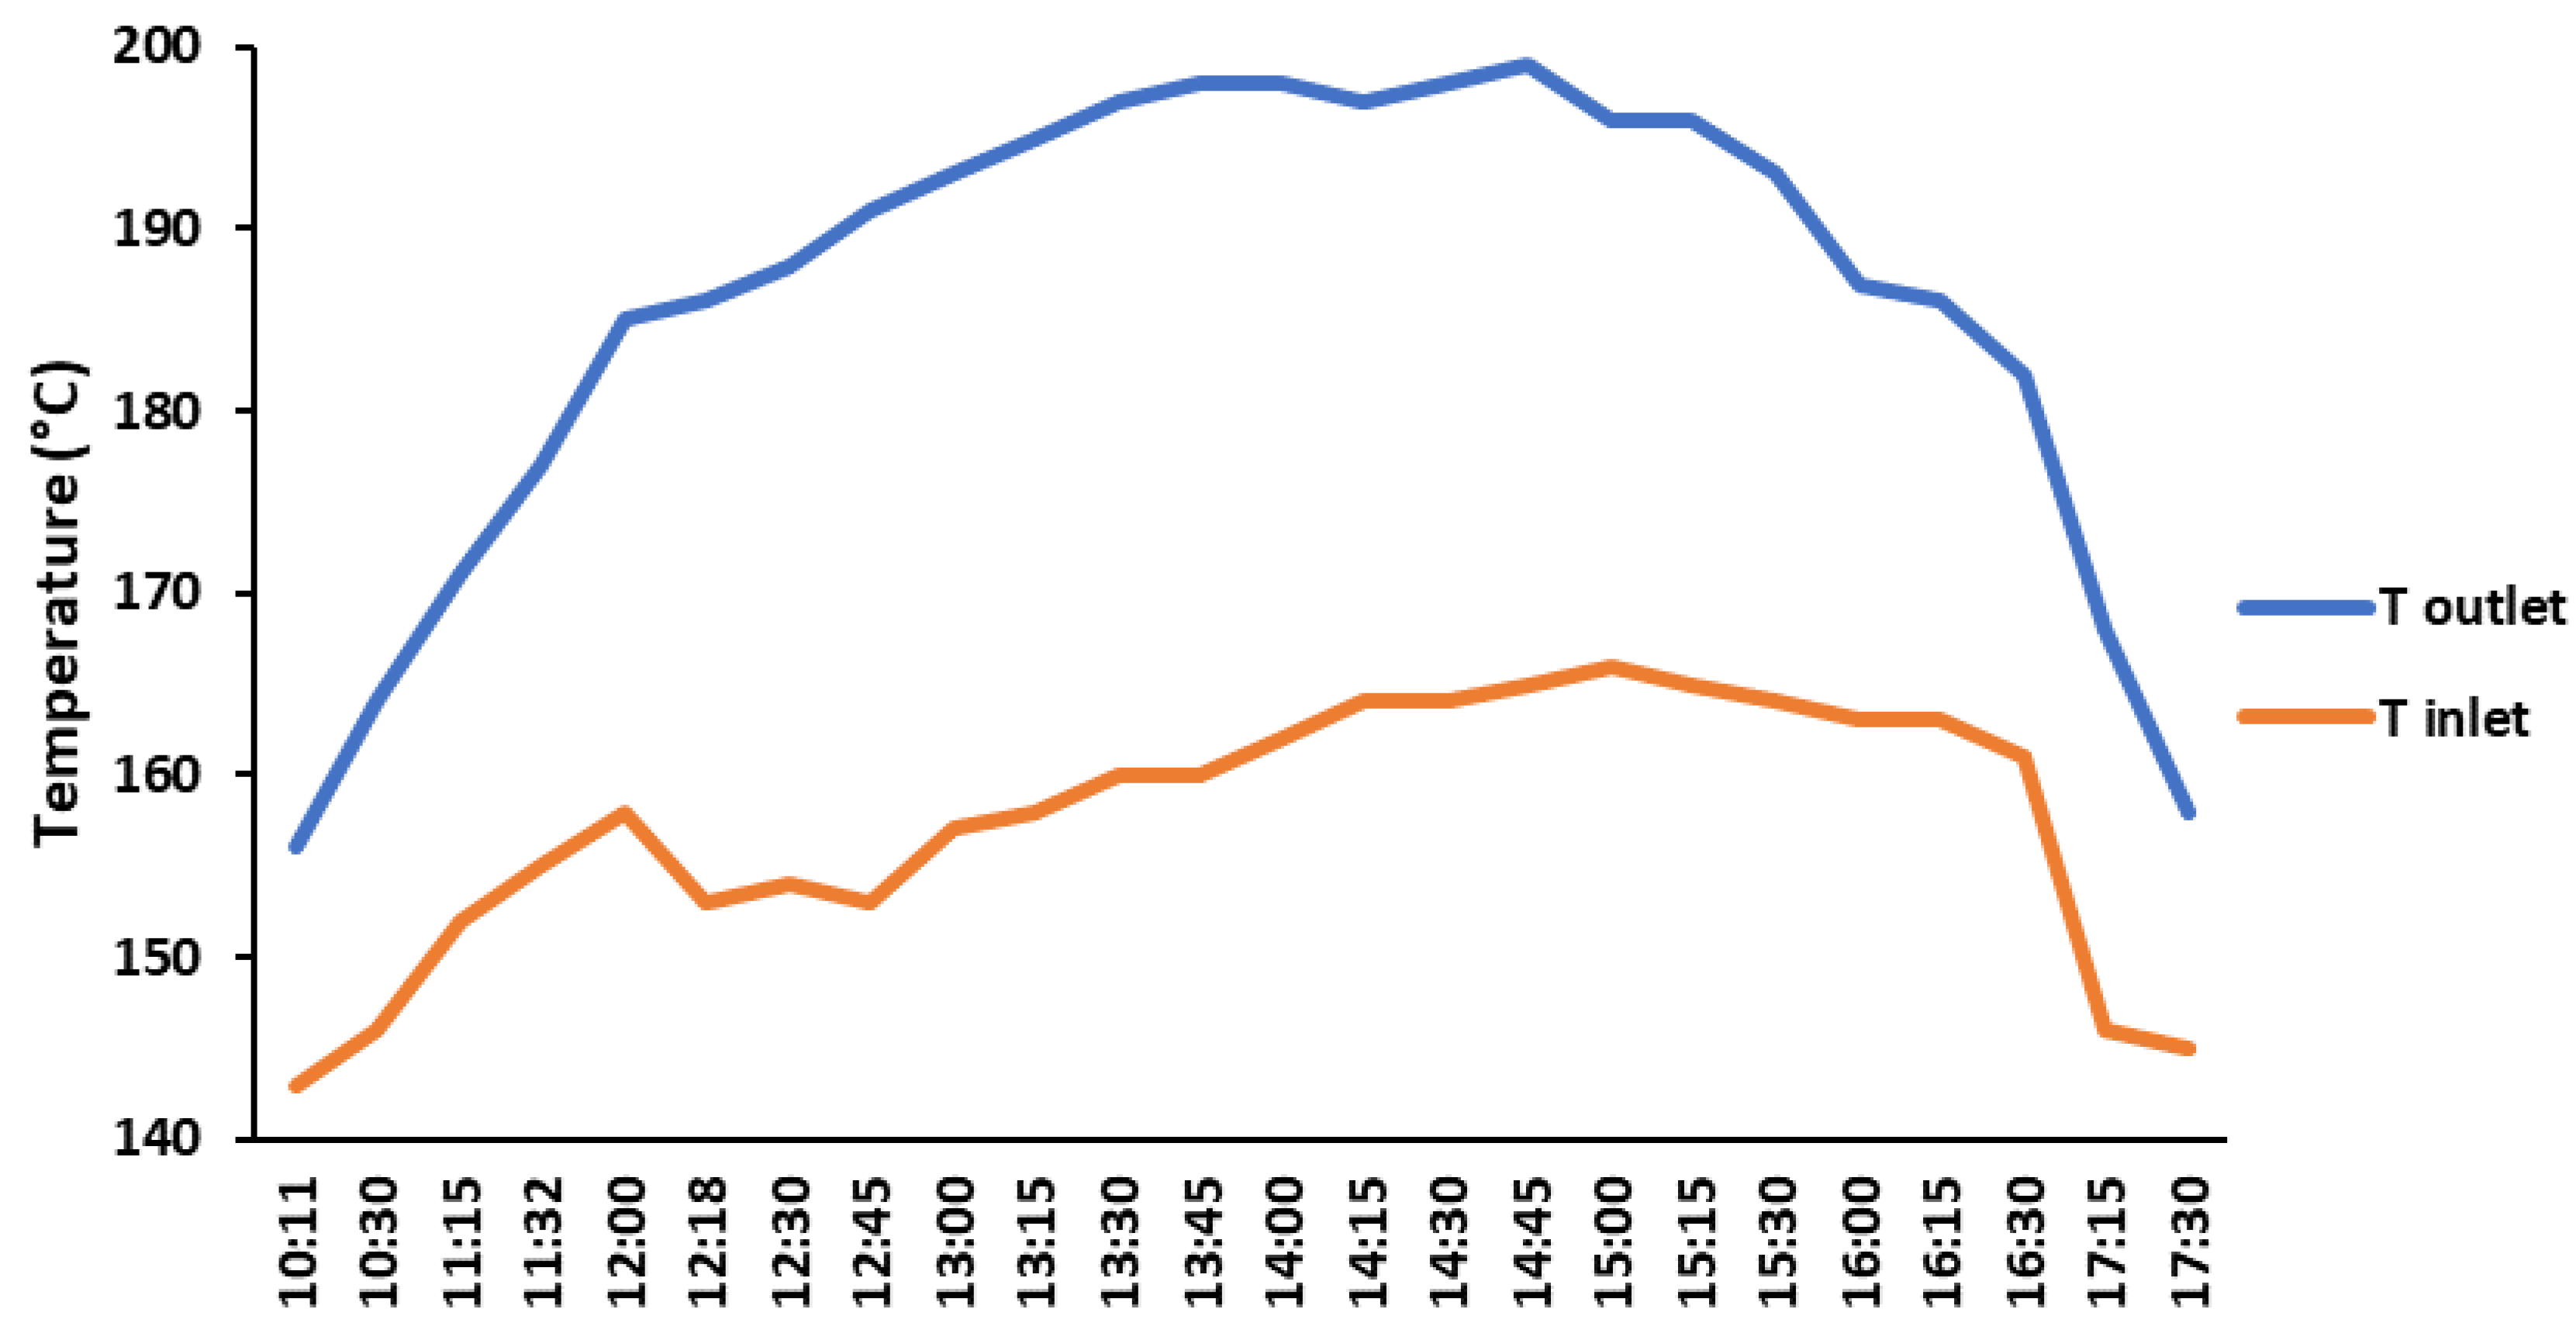
Figure 11 shows the evolution of the temperature upstream and downstream of the PTC solar field. We can say that the solar field could provide an output temperature higher than 180 °C in the period between 12 p.m. and 4 p.m. In addition, this collector could reach 200 °C during a summer day.
Figure 12 shows the evolution of the power supplied by the PTC solar field vs. the heat loss power of the bitumen reservoir. Unlike the XCPC, this collector could cover the heat demand very early. The excess energy produced was stored in the form of sensible energy in the storage tank to cover part of the night and could be stored in the bitumen by increasing its temperature.

3.2.3. PV Solar Field

The measured output energy illustrated in Figure 13 shows that the impact of cloudy hours and the incidence angle of radiation, which considerably diminished the radiation received on the surface of the PV panels, caused each day’s energy coverage to vary [46]. The daily average of this solar field was 30 Kwh per day.
The experimental setup showed the feasibility of heating up a bitumen storage tank with solar energy. A sizing study taking in consideration the meteorological conditions and the available area in the bitumen plant has to be performed to identify the solar fraction that could be covered by solar energy. Mokhtar et al. [29] conducted a sizing study with the main objective of providing an optimized design and management to minimize the energy cost (EC) and maximize the renewable energy utilization fraction (REF).

3.3. Physical Property Evaluation

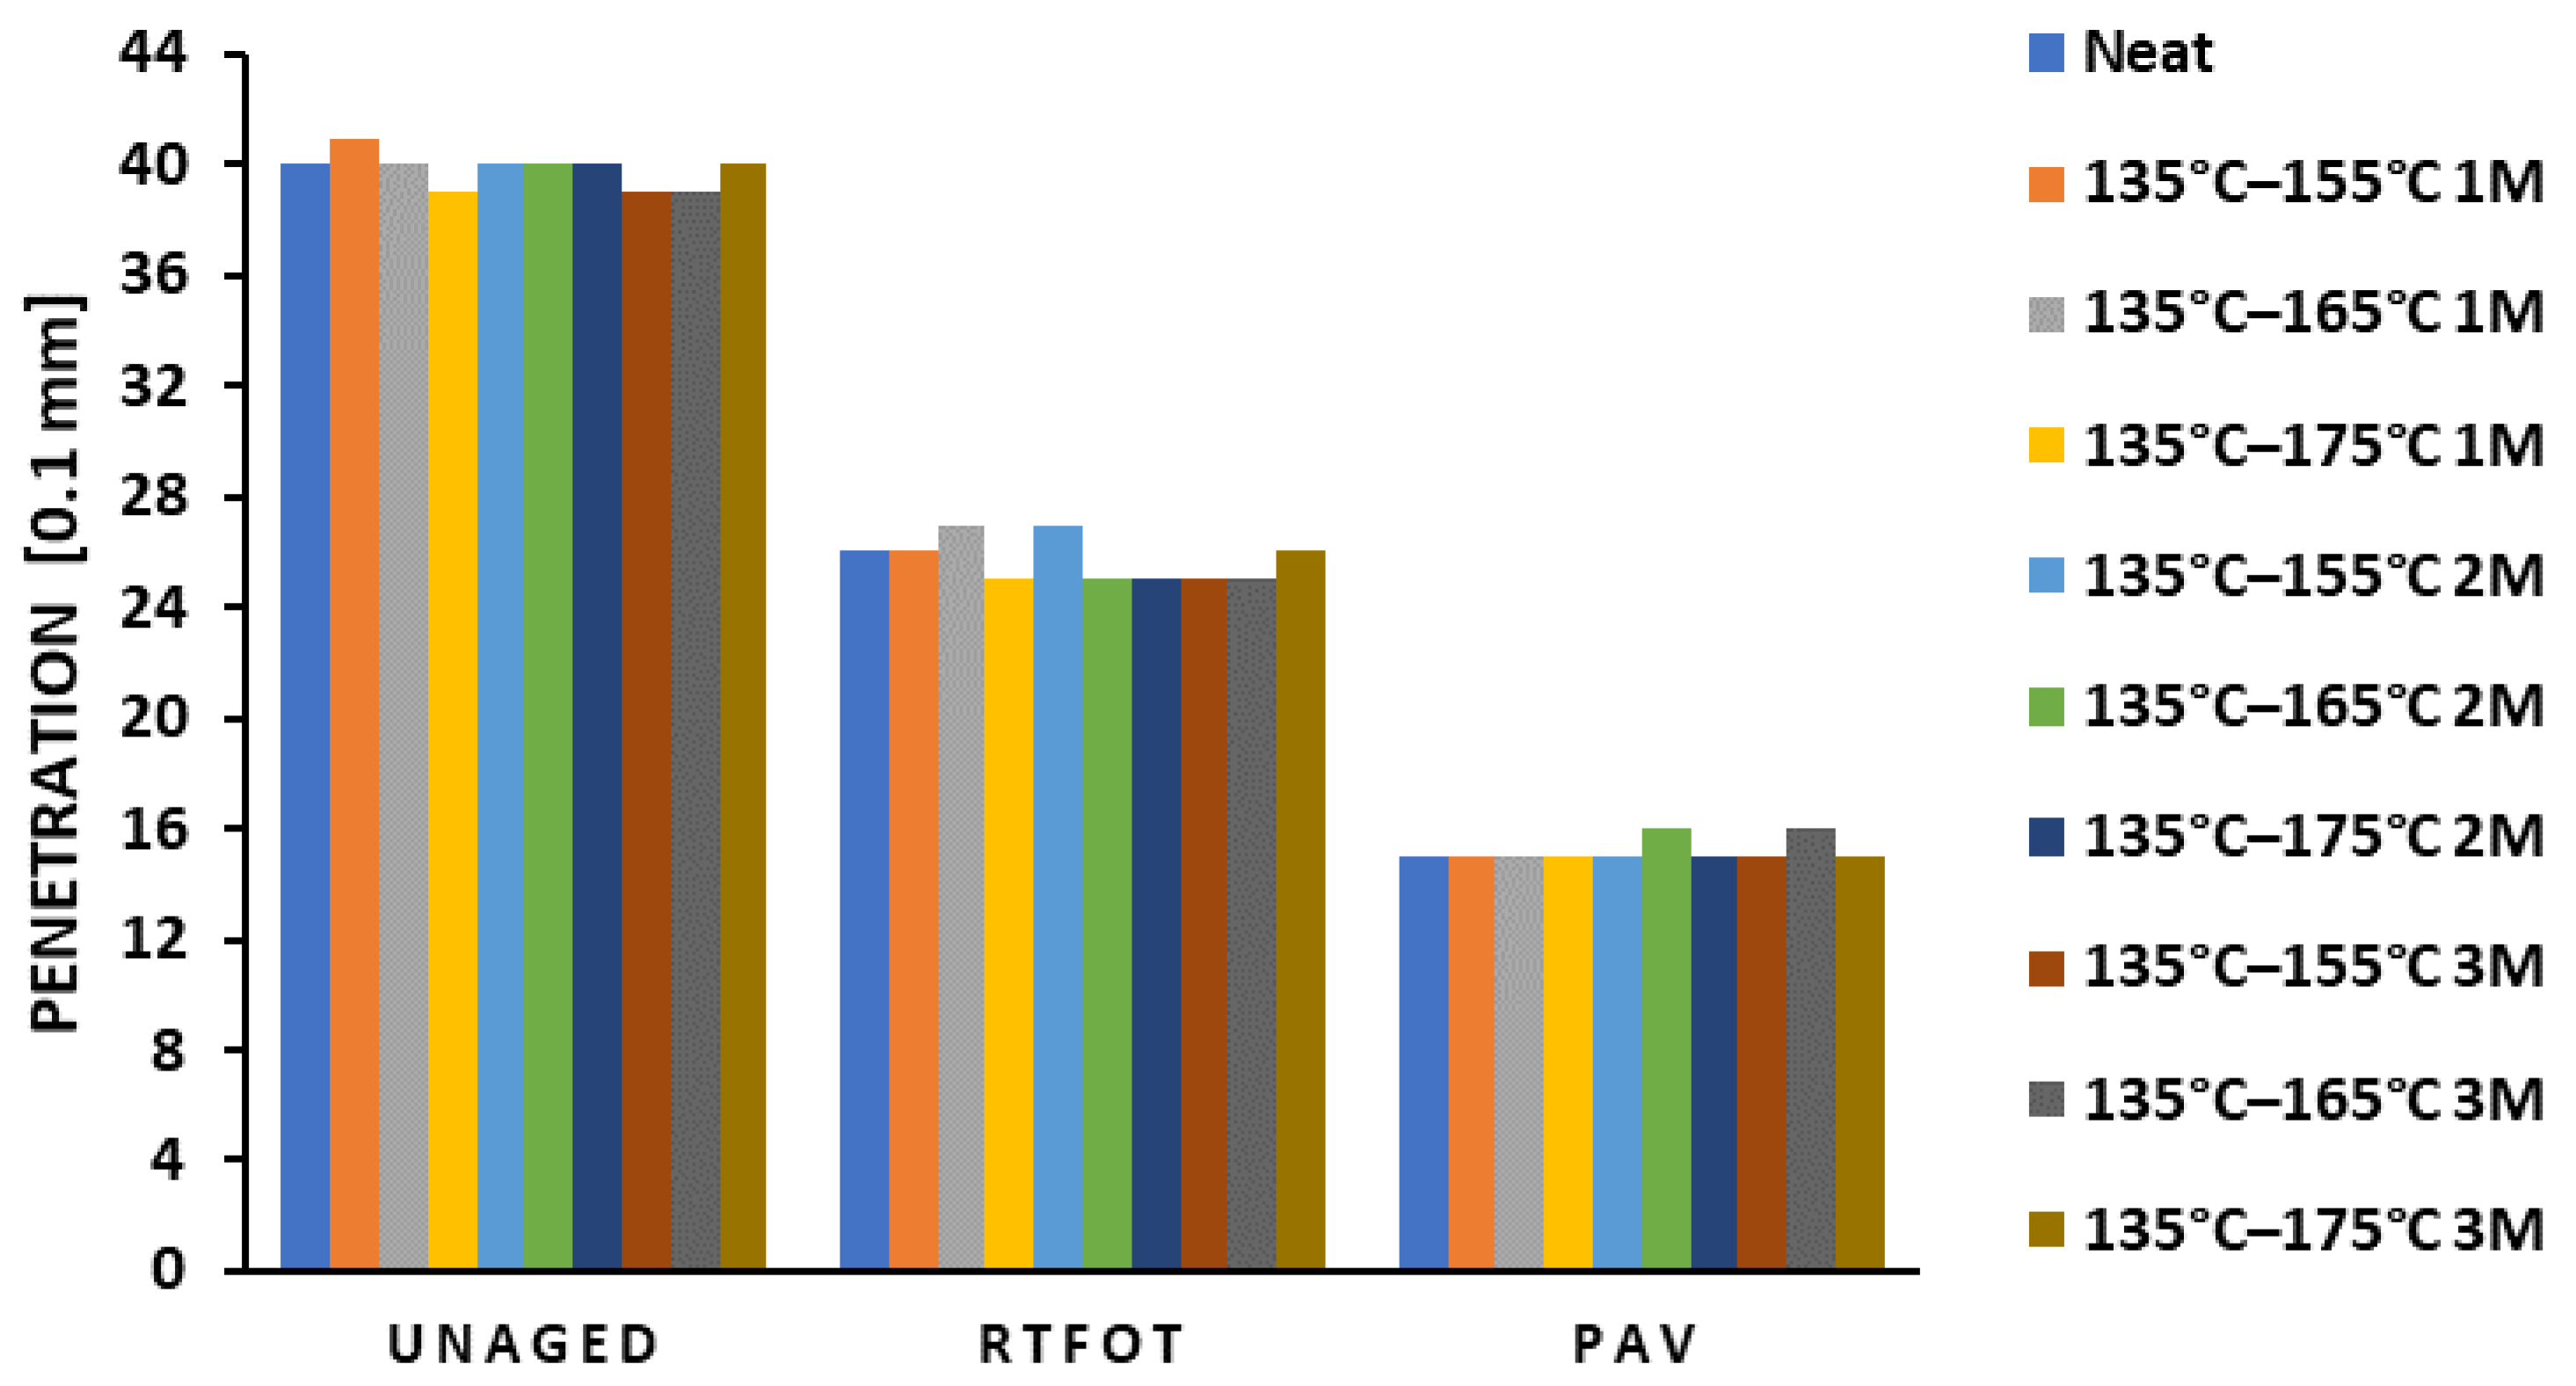
An examination of Figure 14 revealed that no remarkable change occurred in the penetration values after any thermal treatment. At the unaged stage, the neat bitumen’s penetration was 40 (0.1 mm), and the thermally cycled samples had values between 39 and 41 (0.1 mm). After short-term aging, the neat bitumen had a value of 26 (0.1 mm), and the other samples had values between 25 and 27 (0.1 mm). After long-term aging, almost all the samples had values of 15 (0.1 mm). The difference of 1 (0.1 mm) was a negligible change in the penetration values since the repeatability limit for penetrations <50 (0.1 mm) is r ≤ 2 [42].
We can observe from Figure 15 that thermal cycles during storage led to increases in softening point values compared to neat bitumen. At the unaged stage, the neat bitumen’s softening point was 51 °C, while the thermally cycled binders had values between 51.6 and 52.2 °C, which indicated 0.6 to 1.2 °C increments, which was quite insignificant. After short-term aging, the neat bitumen had a value of 56 °C, and the other samples had values between 56 and 57.6 °C, which indicated 0 to 1.6 °C increments. After long-term aging, the neat bitumen had a value of 62.8 °C, and the other samples had values between 63 and 64.8 °C, which indicated 0.2 to 2 °C increments. We noticed that the longer the samples were aged, the larger the difference in softening point values; nevertheless, the change was still minor at every aging stage.
Since no noticeable change was observed in the penetration and softening point results, we could make no conclusions. That is why we needed ATR-FTIR and DSR tests to further investigate the evolution of 35/50 bitumen’s performance under different storage temperature ranges.

3.4. ATR-FTIR Analysis

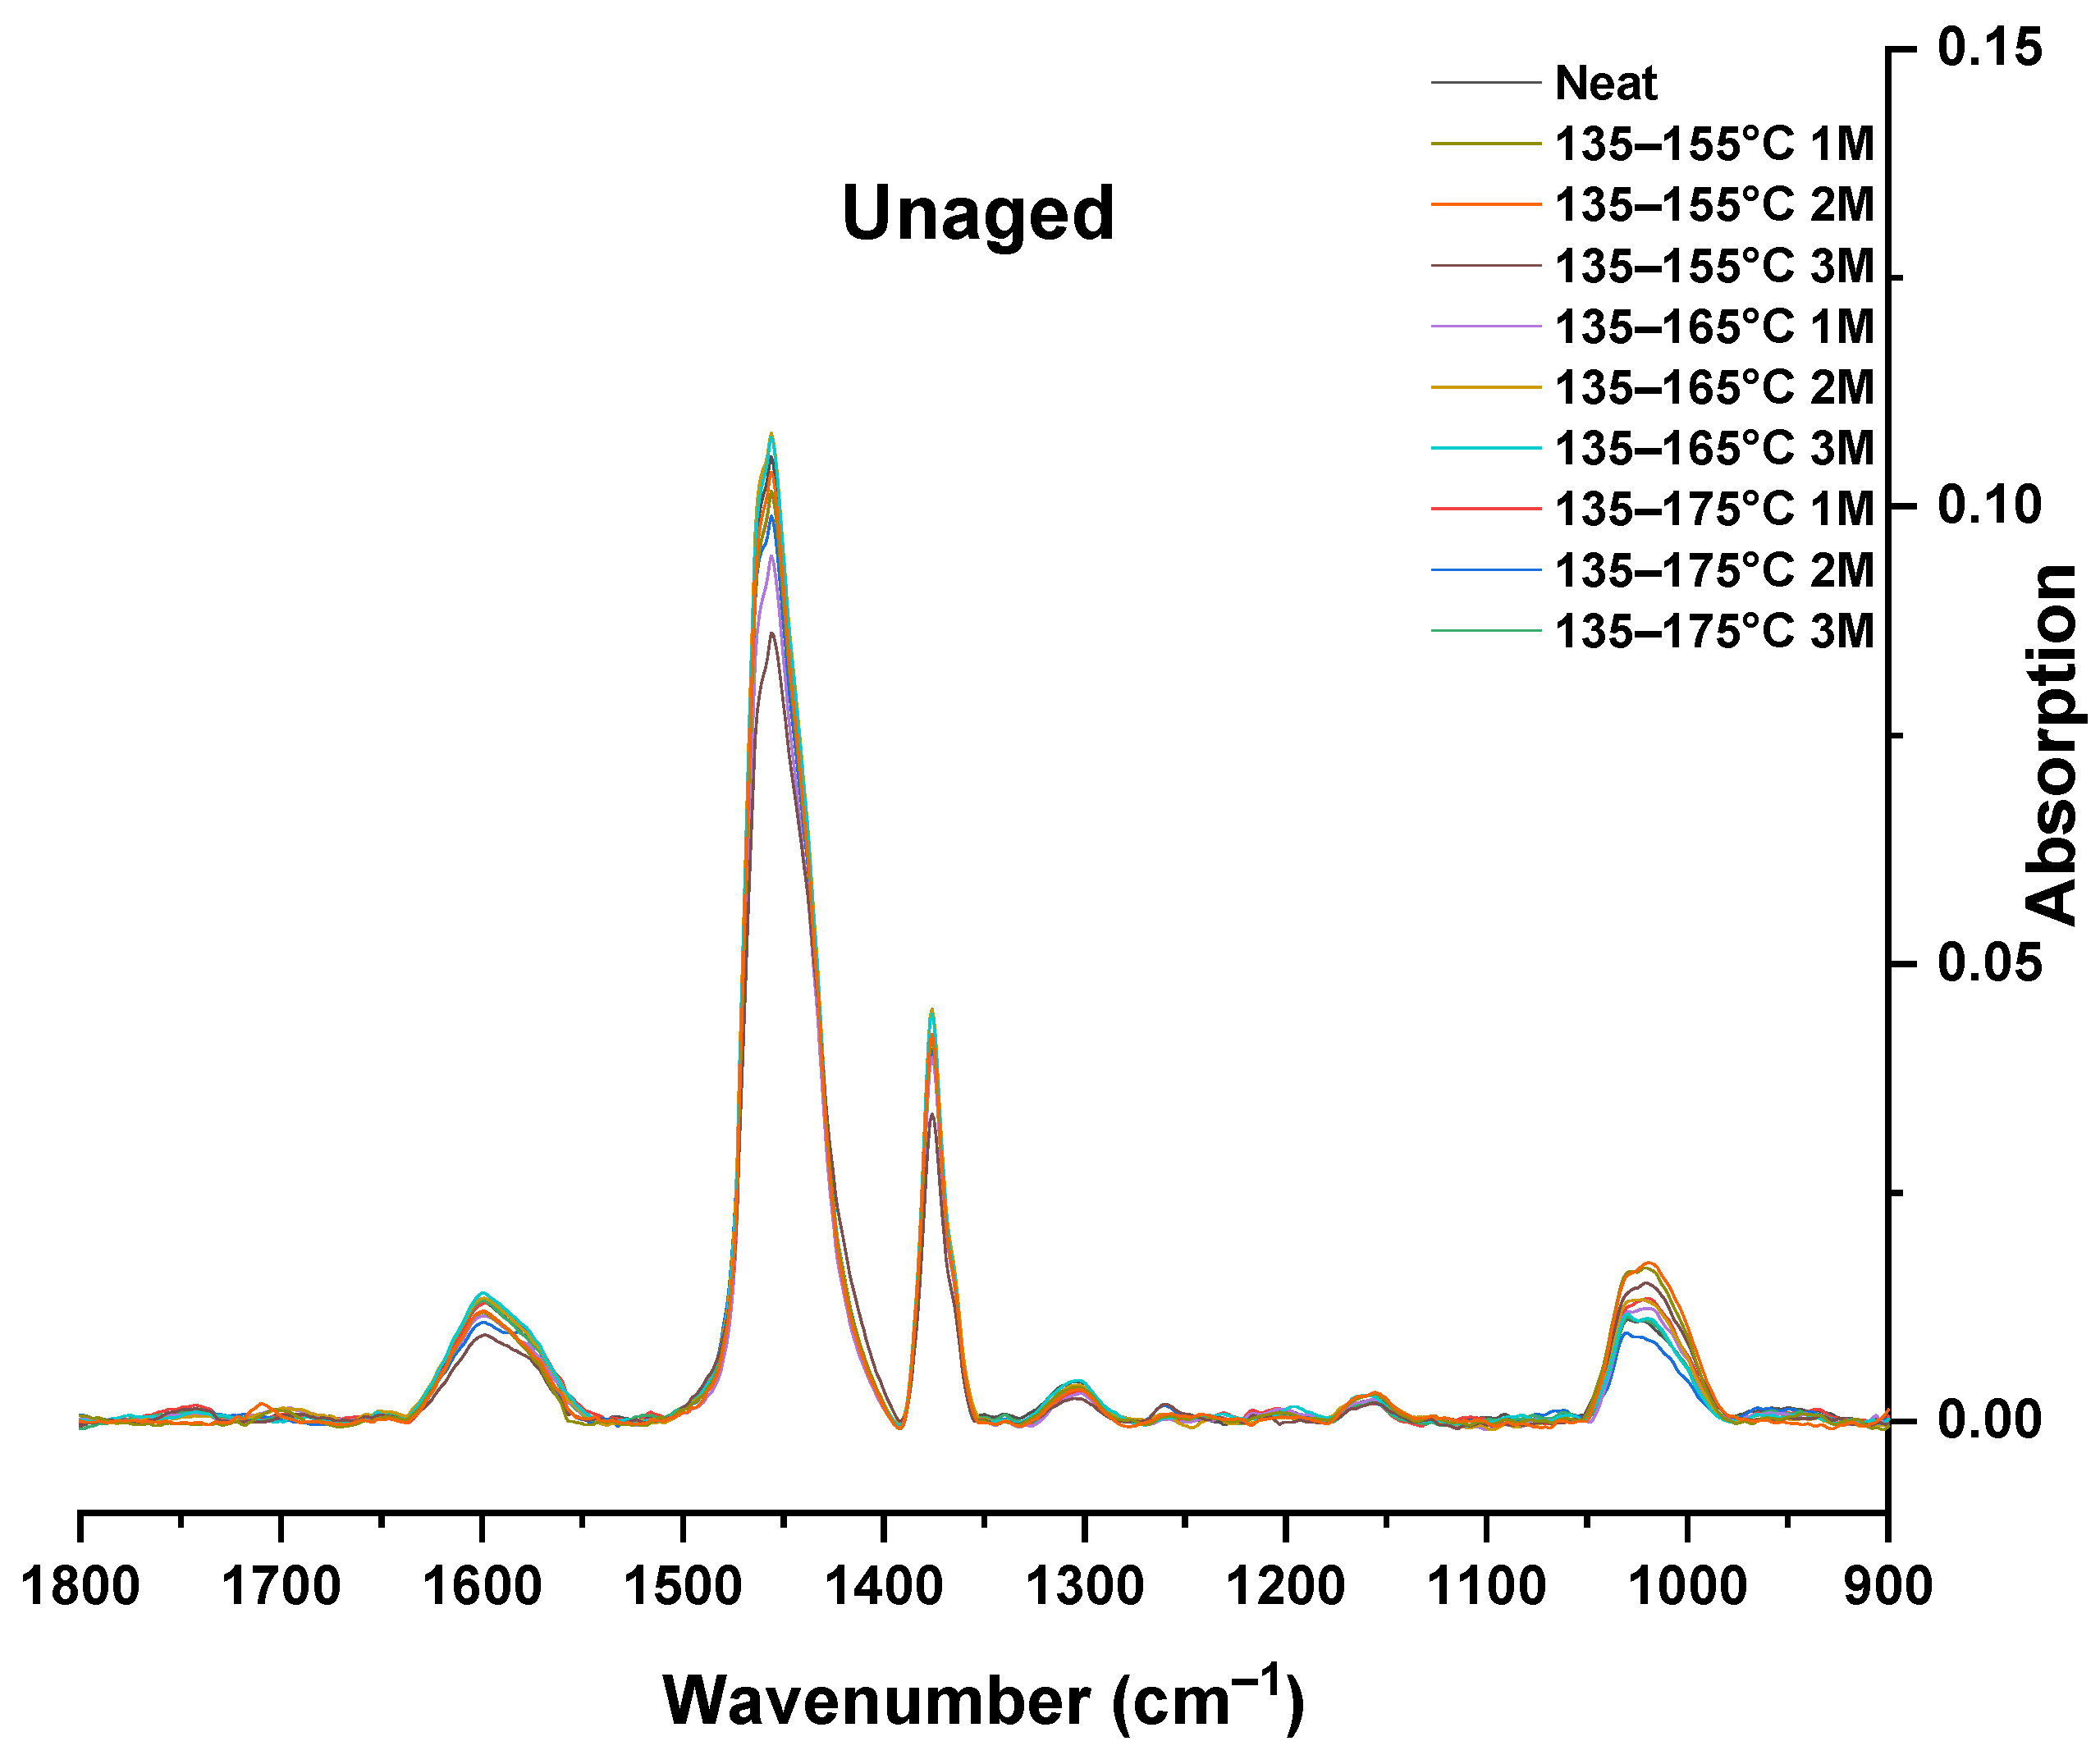
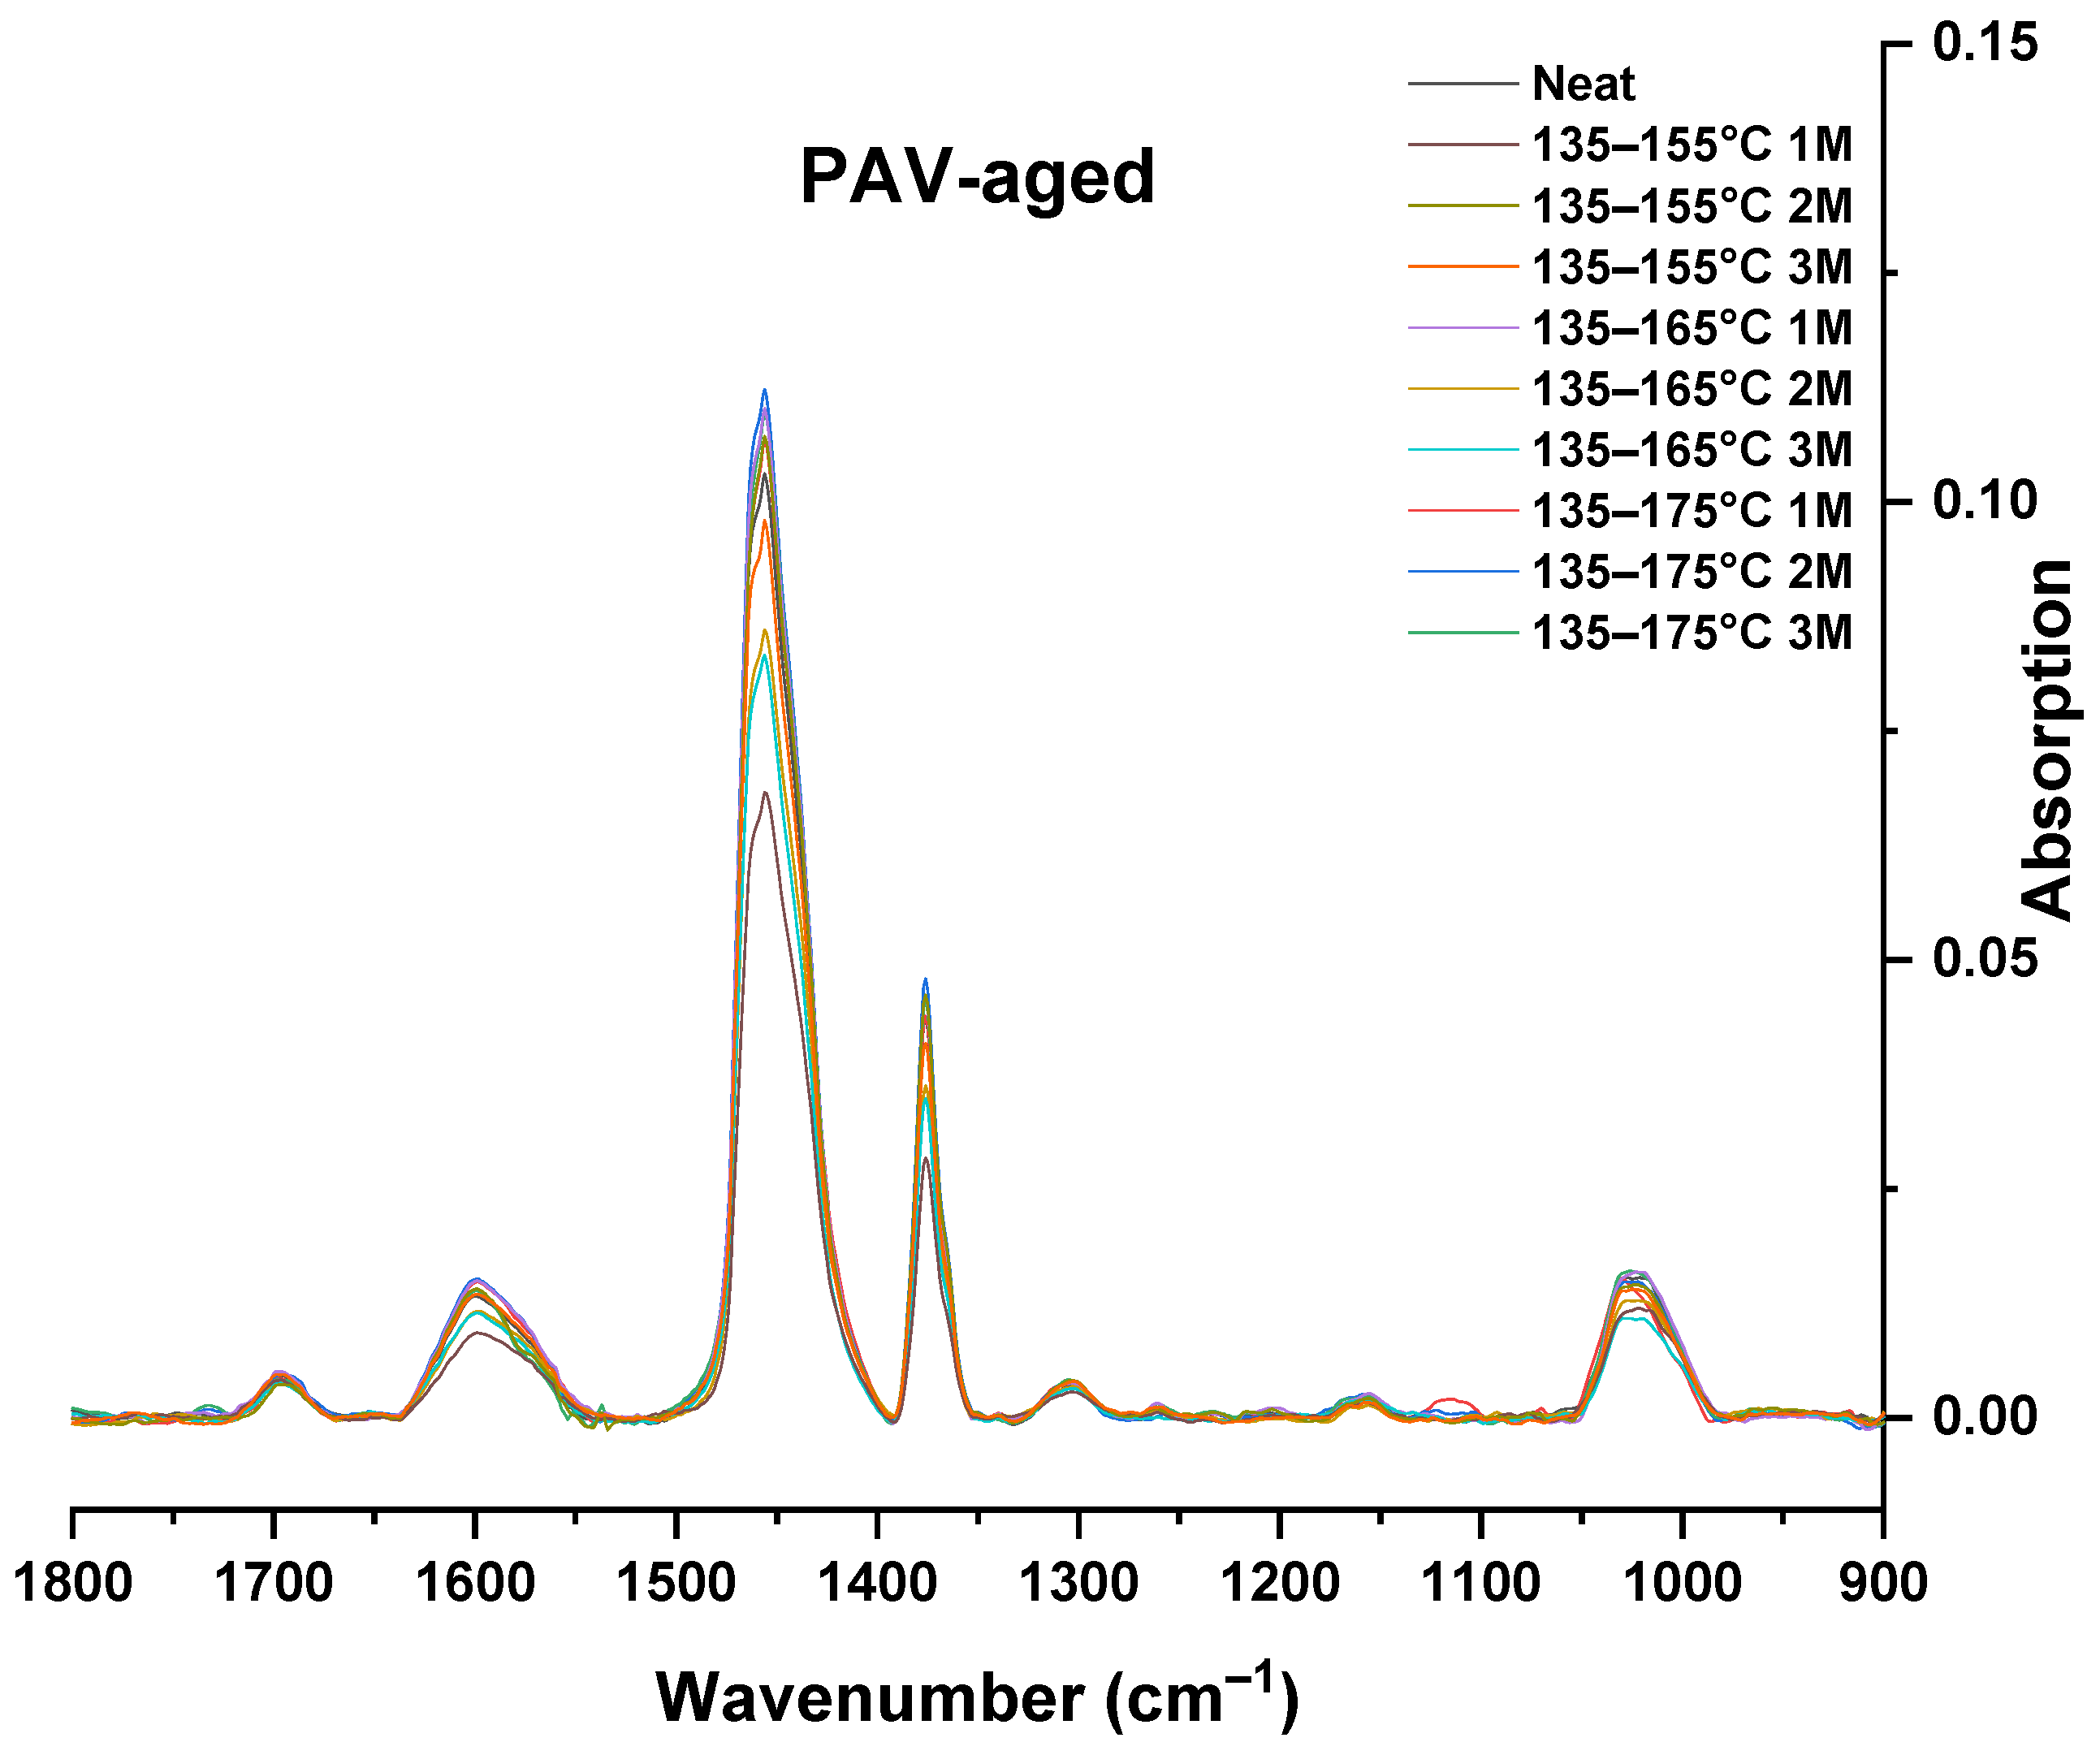
We present the spectra only between 1800 and 900 cm−1, which is the part that contains the peaks that interest us. To achieve an accurate presentation of the peaks, we used OriginPro software to perform a baseline correction. Figure 16 and Figure 17 show the absorption spectra (after the baseline correction) for all the samples at the unaged and the PAV-aged stages, respectively.
Observing the FTIR spectra at the unaged stage in Figure 16, the carbonyl peaks are weak and broad, almost unnoticed though they exist. The sulfoxide peaks, on the other hand, are strong. This means that the bitumen used in our study was rich in sulfoxide; we do not know why, but every bitumen is different, depending on its source, amongst other factors. What matters is evaluating the effect of each storage temperature/duration on the evolution of the oxidation products.
In Figure 17, after long-term aging, both the carbonyl and the sulfoxide peaks became stronger, which indicated the formation of more oxidation products. This was expected since it is well known that aging induces the oxidation of bitumen, resulting in more sulfoxide and carbonyl production [44].
We estimated the amount of evolution using the carbonyl and sulfoxide indices that we calculated afterwards according to the French MLPC method No. 69 for binders “Identification et dosage des fonctions oxygénées présentes dans les liants bitumineux—analyse par spectrométrie infrarouge à transformée de Fourier” [47]. This method allowed us to calculate the carbonyl and sulfoxide indices (Ico and Iso) based on the peak areas of these functional groups in the FTIR spectrum using Equations (1) and (2), respectively, and thus provided an accurate idea of the changes in oxidation levels.
ICO = ACO/Ar
ISO = ASO/Ar
where ACO and ASO are the areas centered around 1700 cm-1 and 1030 cm−1, respectively, and Ar is the area centered around 1460 cm−1 + the area centered around 1375 cm−1.
We performed the integration of the peaks using the OriginPro software, and the results are presented in Figure 18 and Figure 19.
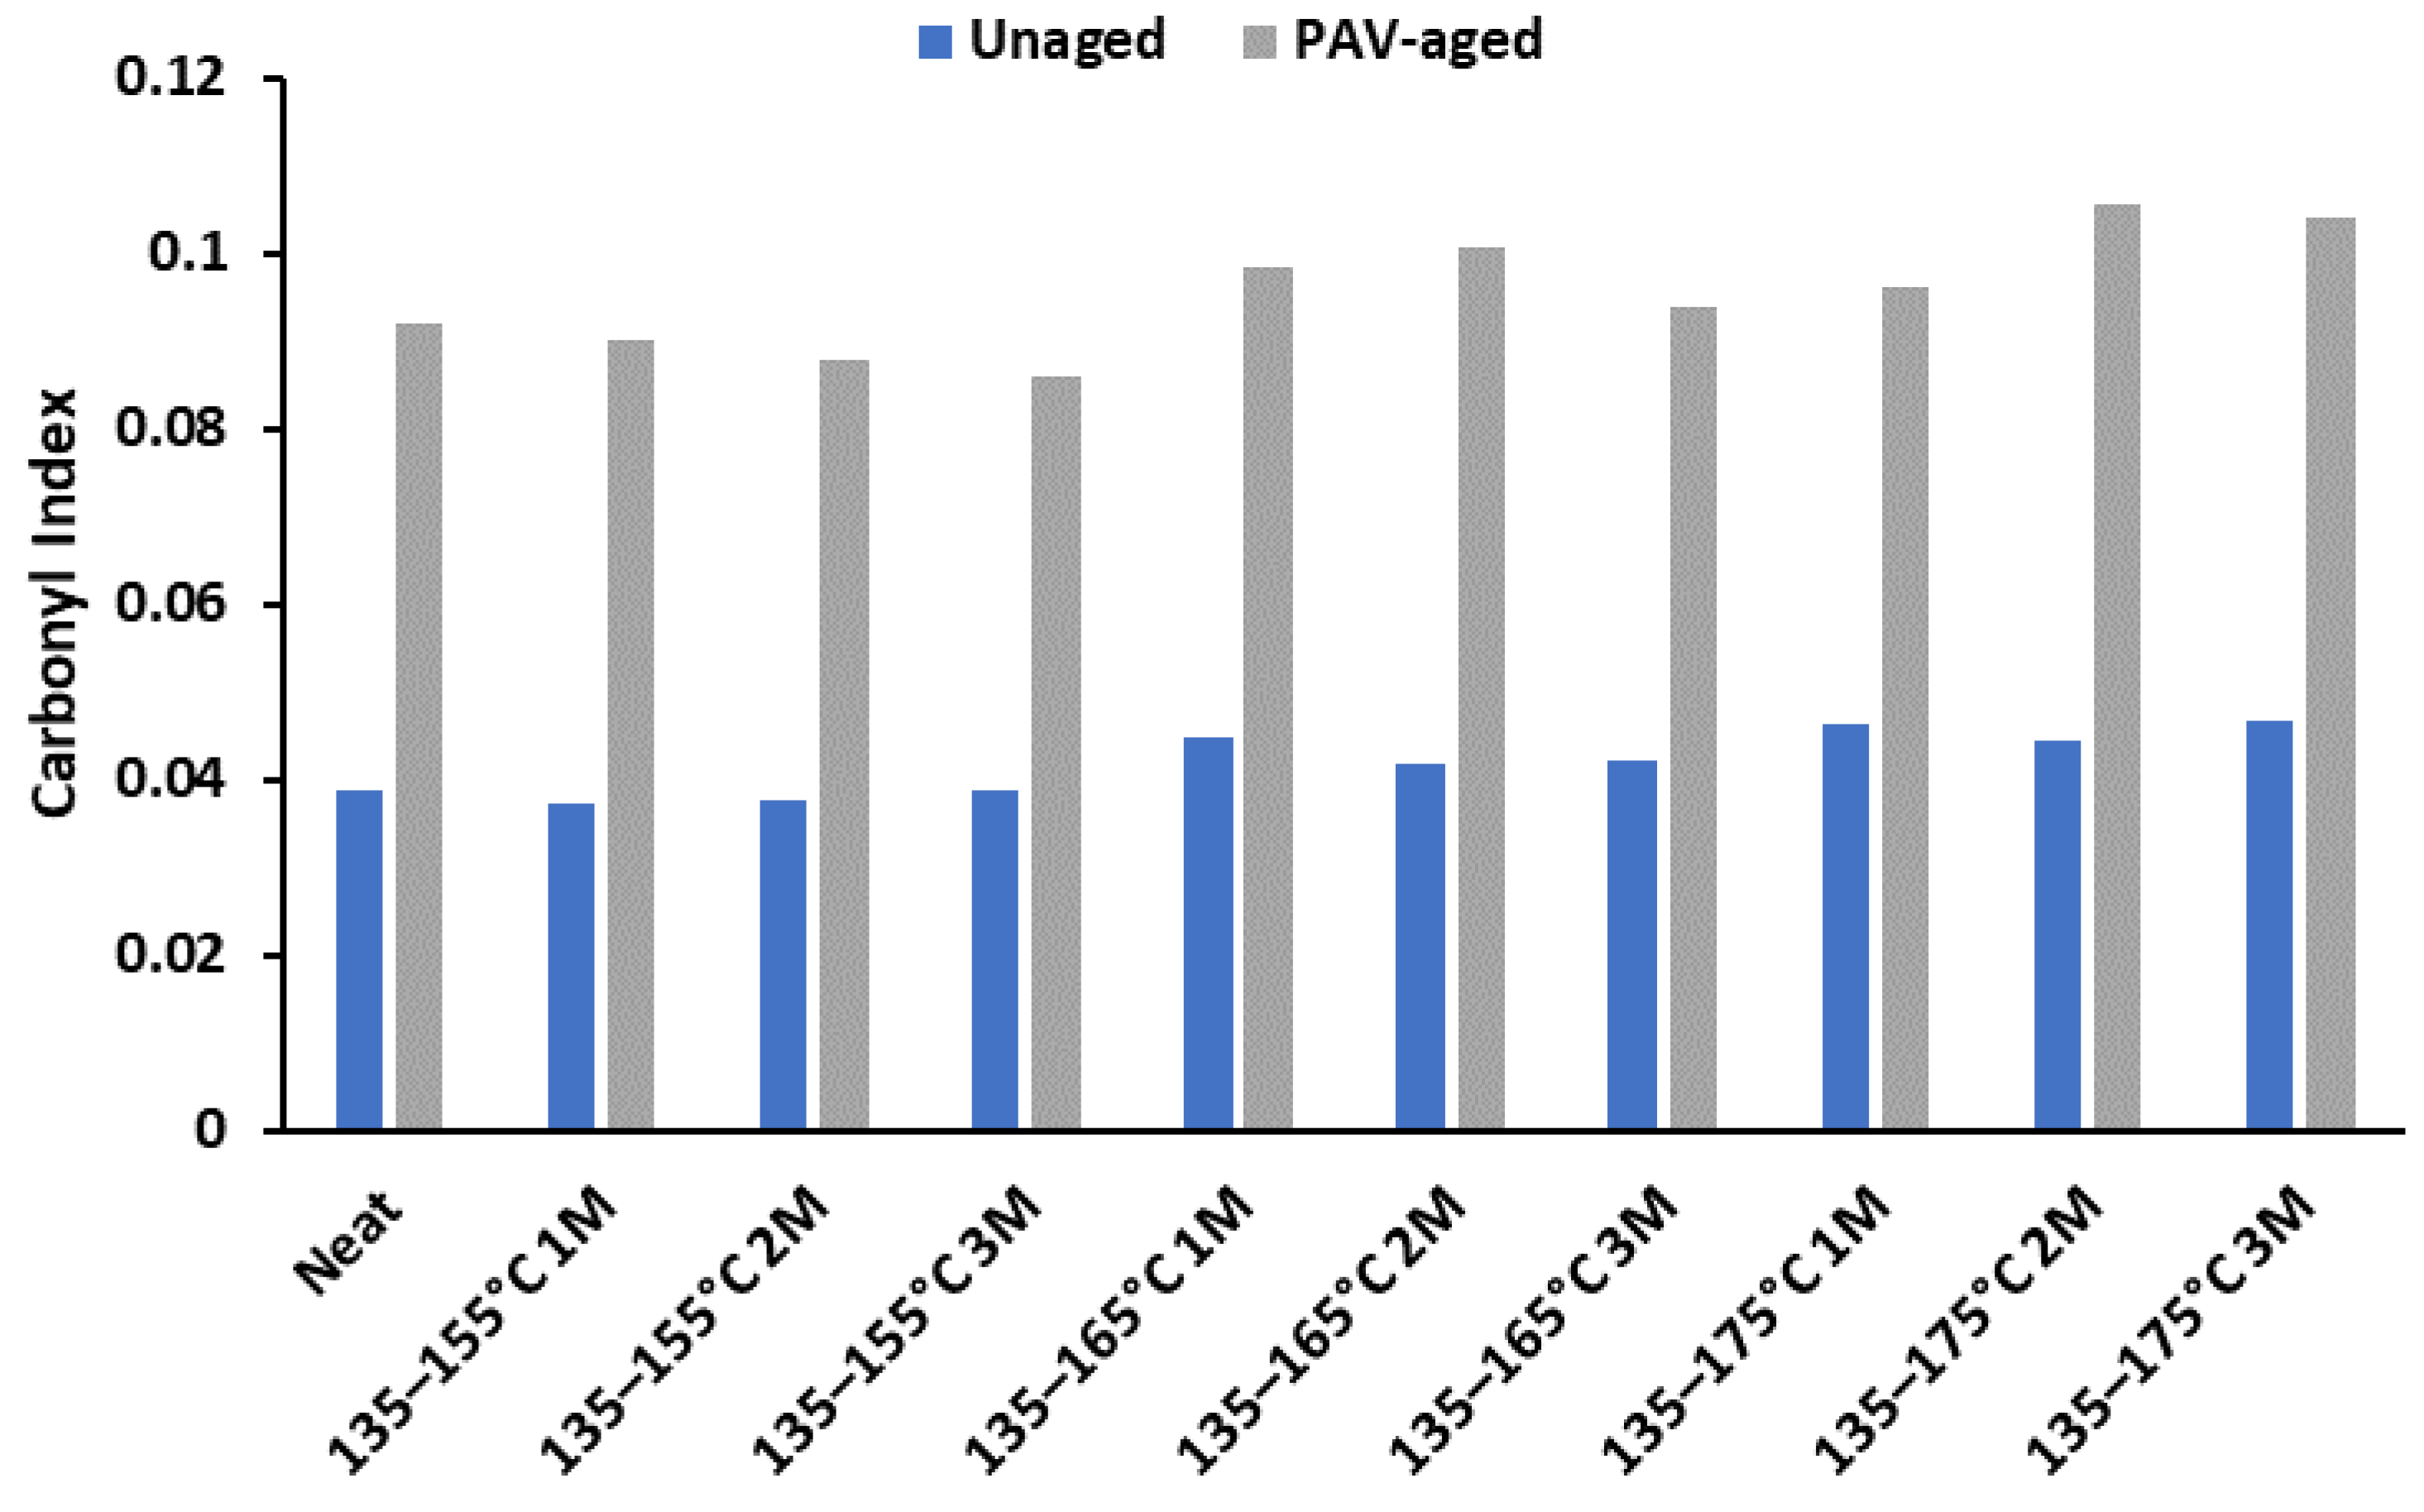
The observation of Figure 18 shows that at both the unaged and PAV-aged stages, as the temperature increased, the carbonyl index increased. We conclude that carbonyl was produced more at high temperatures. At the unaged stage, the carbonyl index was the highest for the three-month storage duration (135–155 °C and 135–175 °C) This means that the longer the storage period, the higher the oxidation level during the storage phase of the bitumen’s lifetime. At the PAV-aged stage, the carbonyl index was the highest for the two-month storage duration (135–165 °C and 135–175 °C). This means that two months is a critical storage period for CO production in the long term.
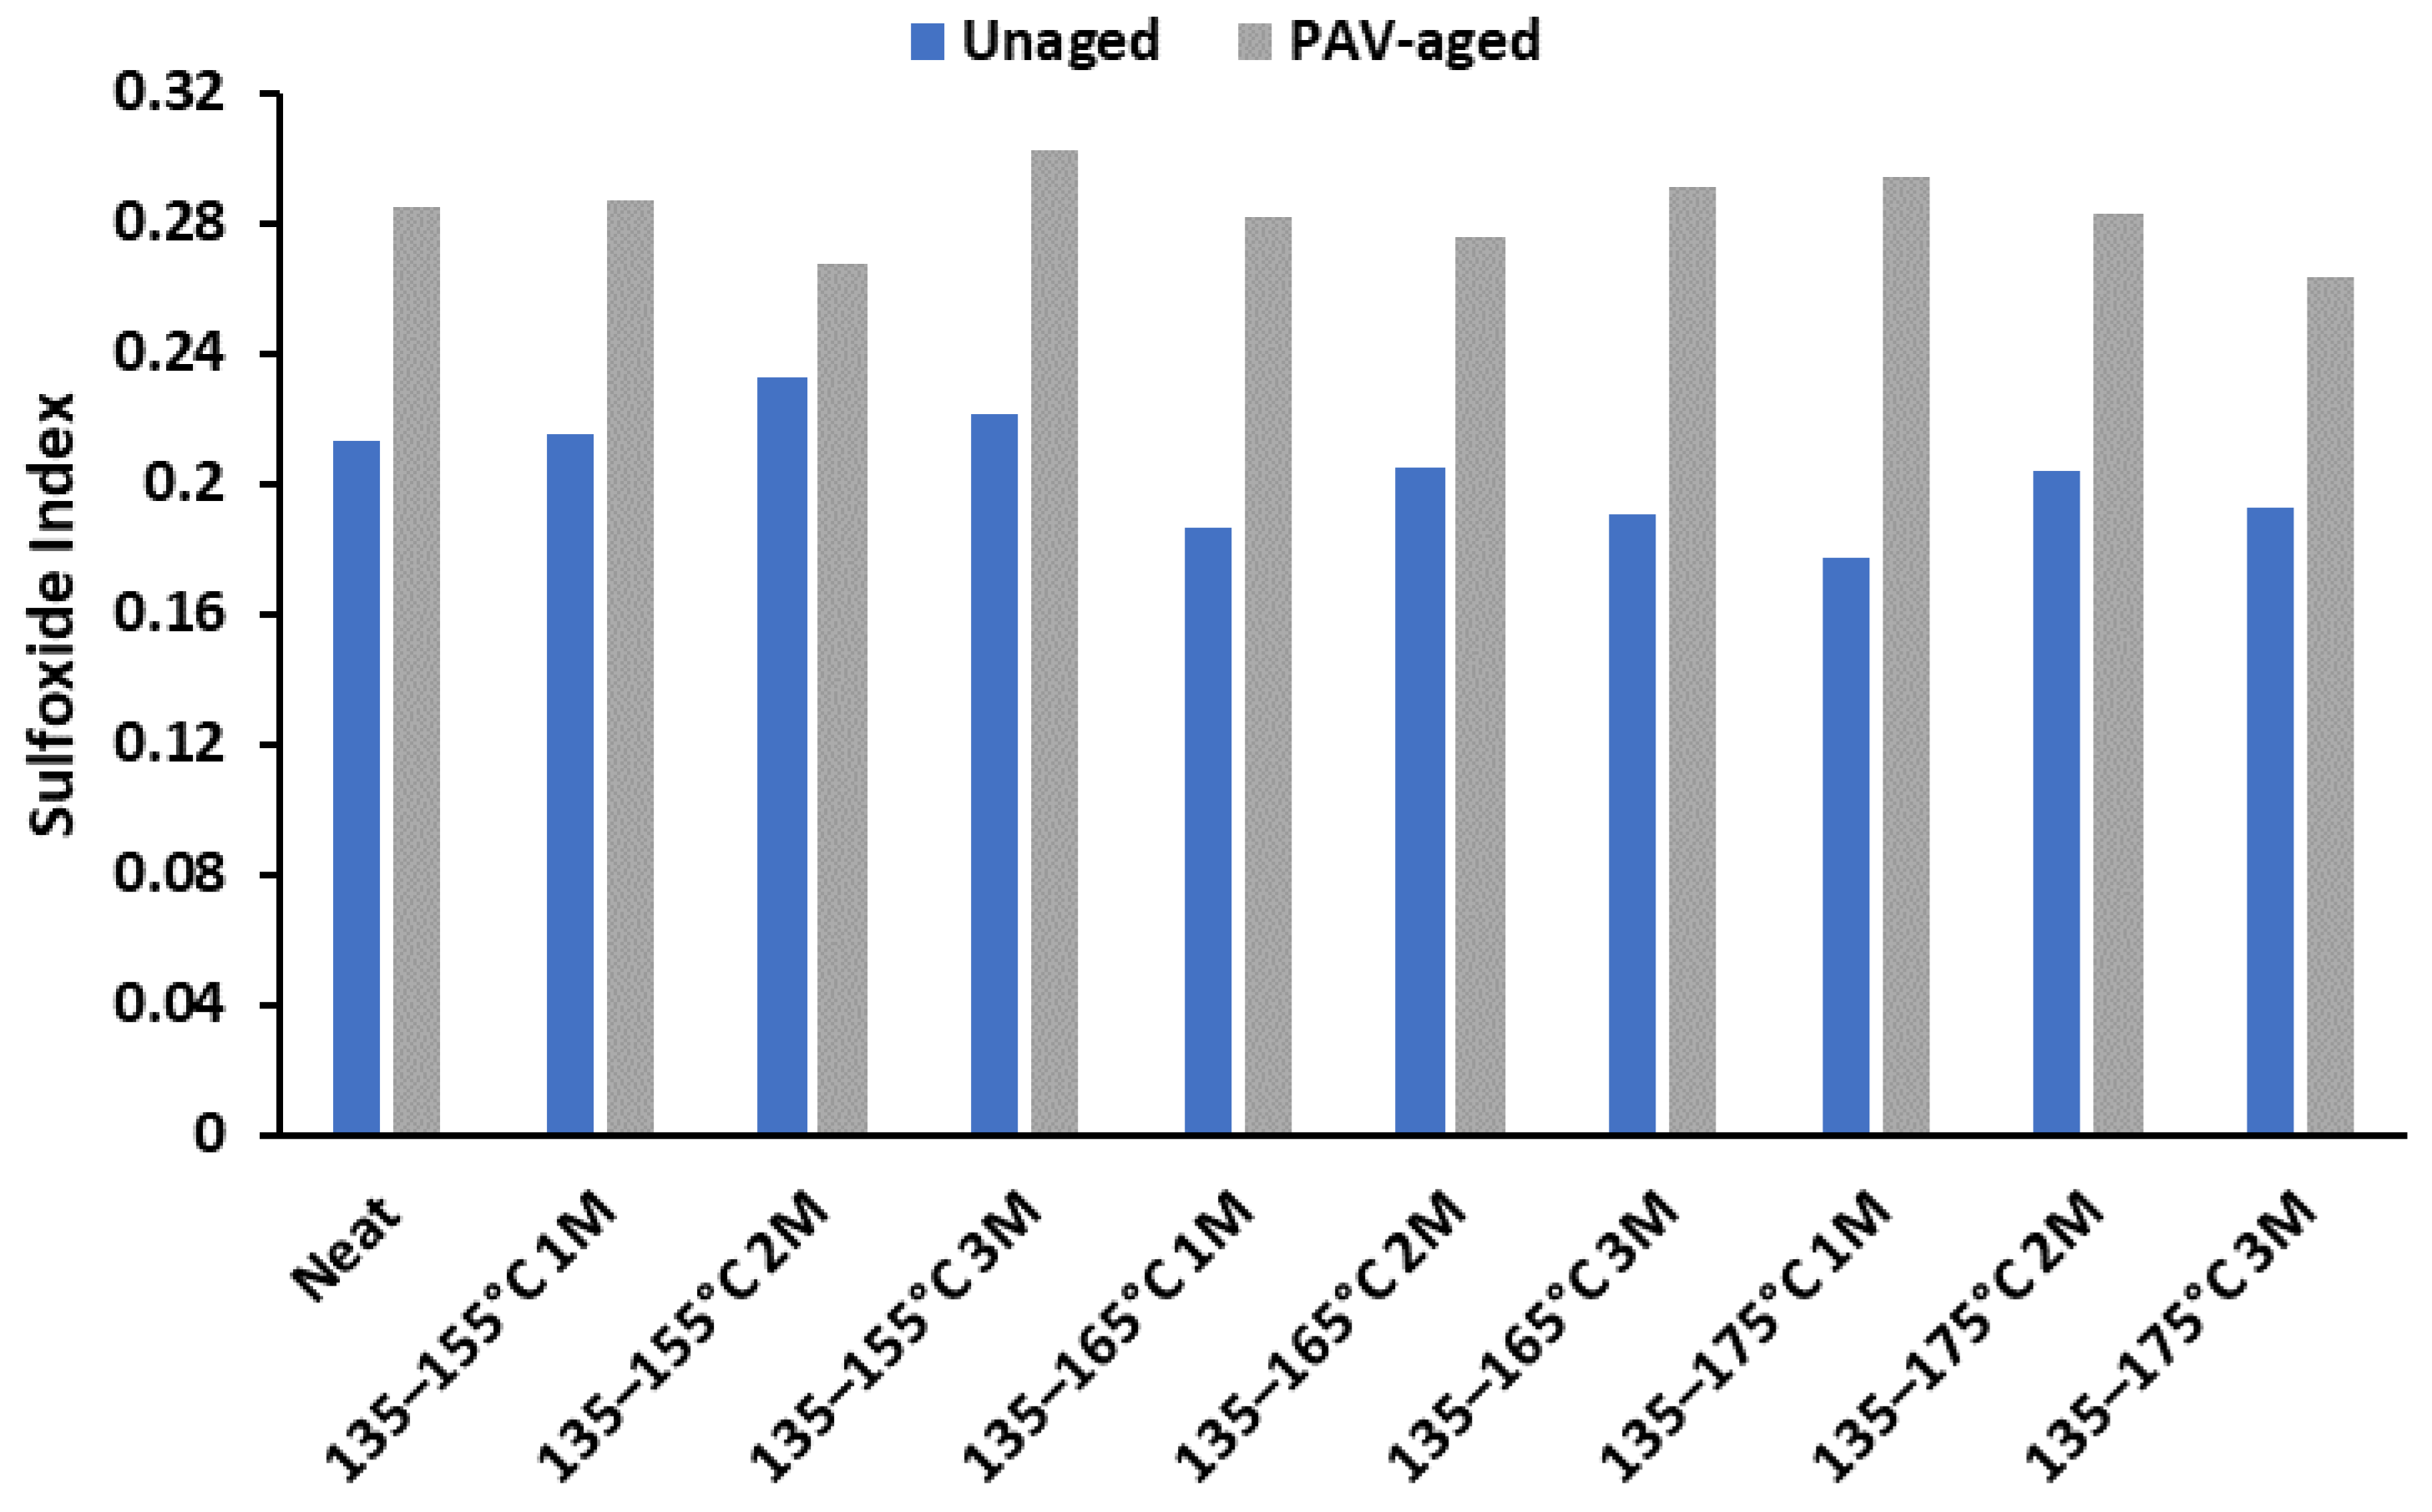
Figure 19 reveals that the sulfoxide index decreased as the temperature rose. This means that sulfoxide was produced more at lower storage temperatures. At the unaged stage, the sulfoxide index was the highest for the two-month storage duration. This means that the two-month storage duration was critical for SO production during the storage phase. At the PAV-aged stage, the sulfoxide index was the highest for the three-month storage duration (135–155 °C and 135–165 °C). This means that longer storage durations made the bitumen more prone to oxidation in the long term.

3.5. DSR Analysis

3.5.1. Complex Modulus and Phase Angle

As a viscoelastic substance, bitumen can exhibit either elastic or viscous behaviors, depending on the temperature and the loading conditions [48]. We used DSR to depict the viscous and elastic behaviors of bitumen. The complex modulus (G*) is the ratio of shear stress to the corresponding strain, and the phase angle (δ) is the delay between the applied shear stress and the resulting shear strain [49]; these two parameters are indicators of the viscous and elastic behaviors of bitumen. A smaller phase angle signifies a more elastic behavior, while a greater phase angle indicates a more viscous behavior [50].
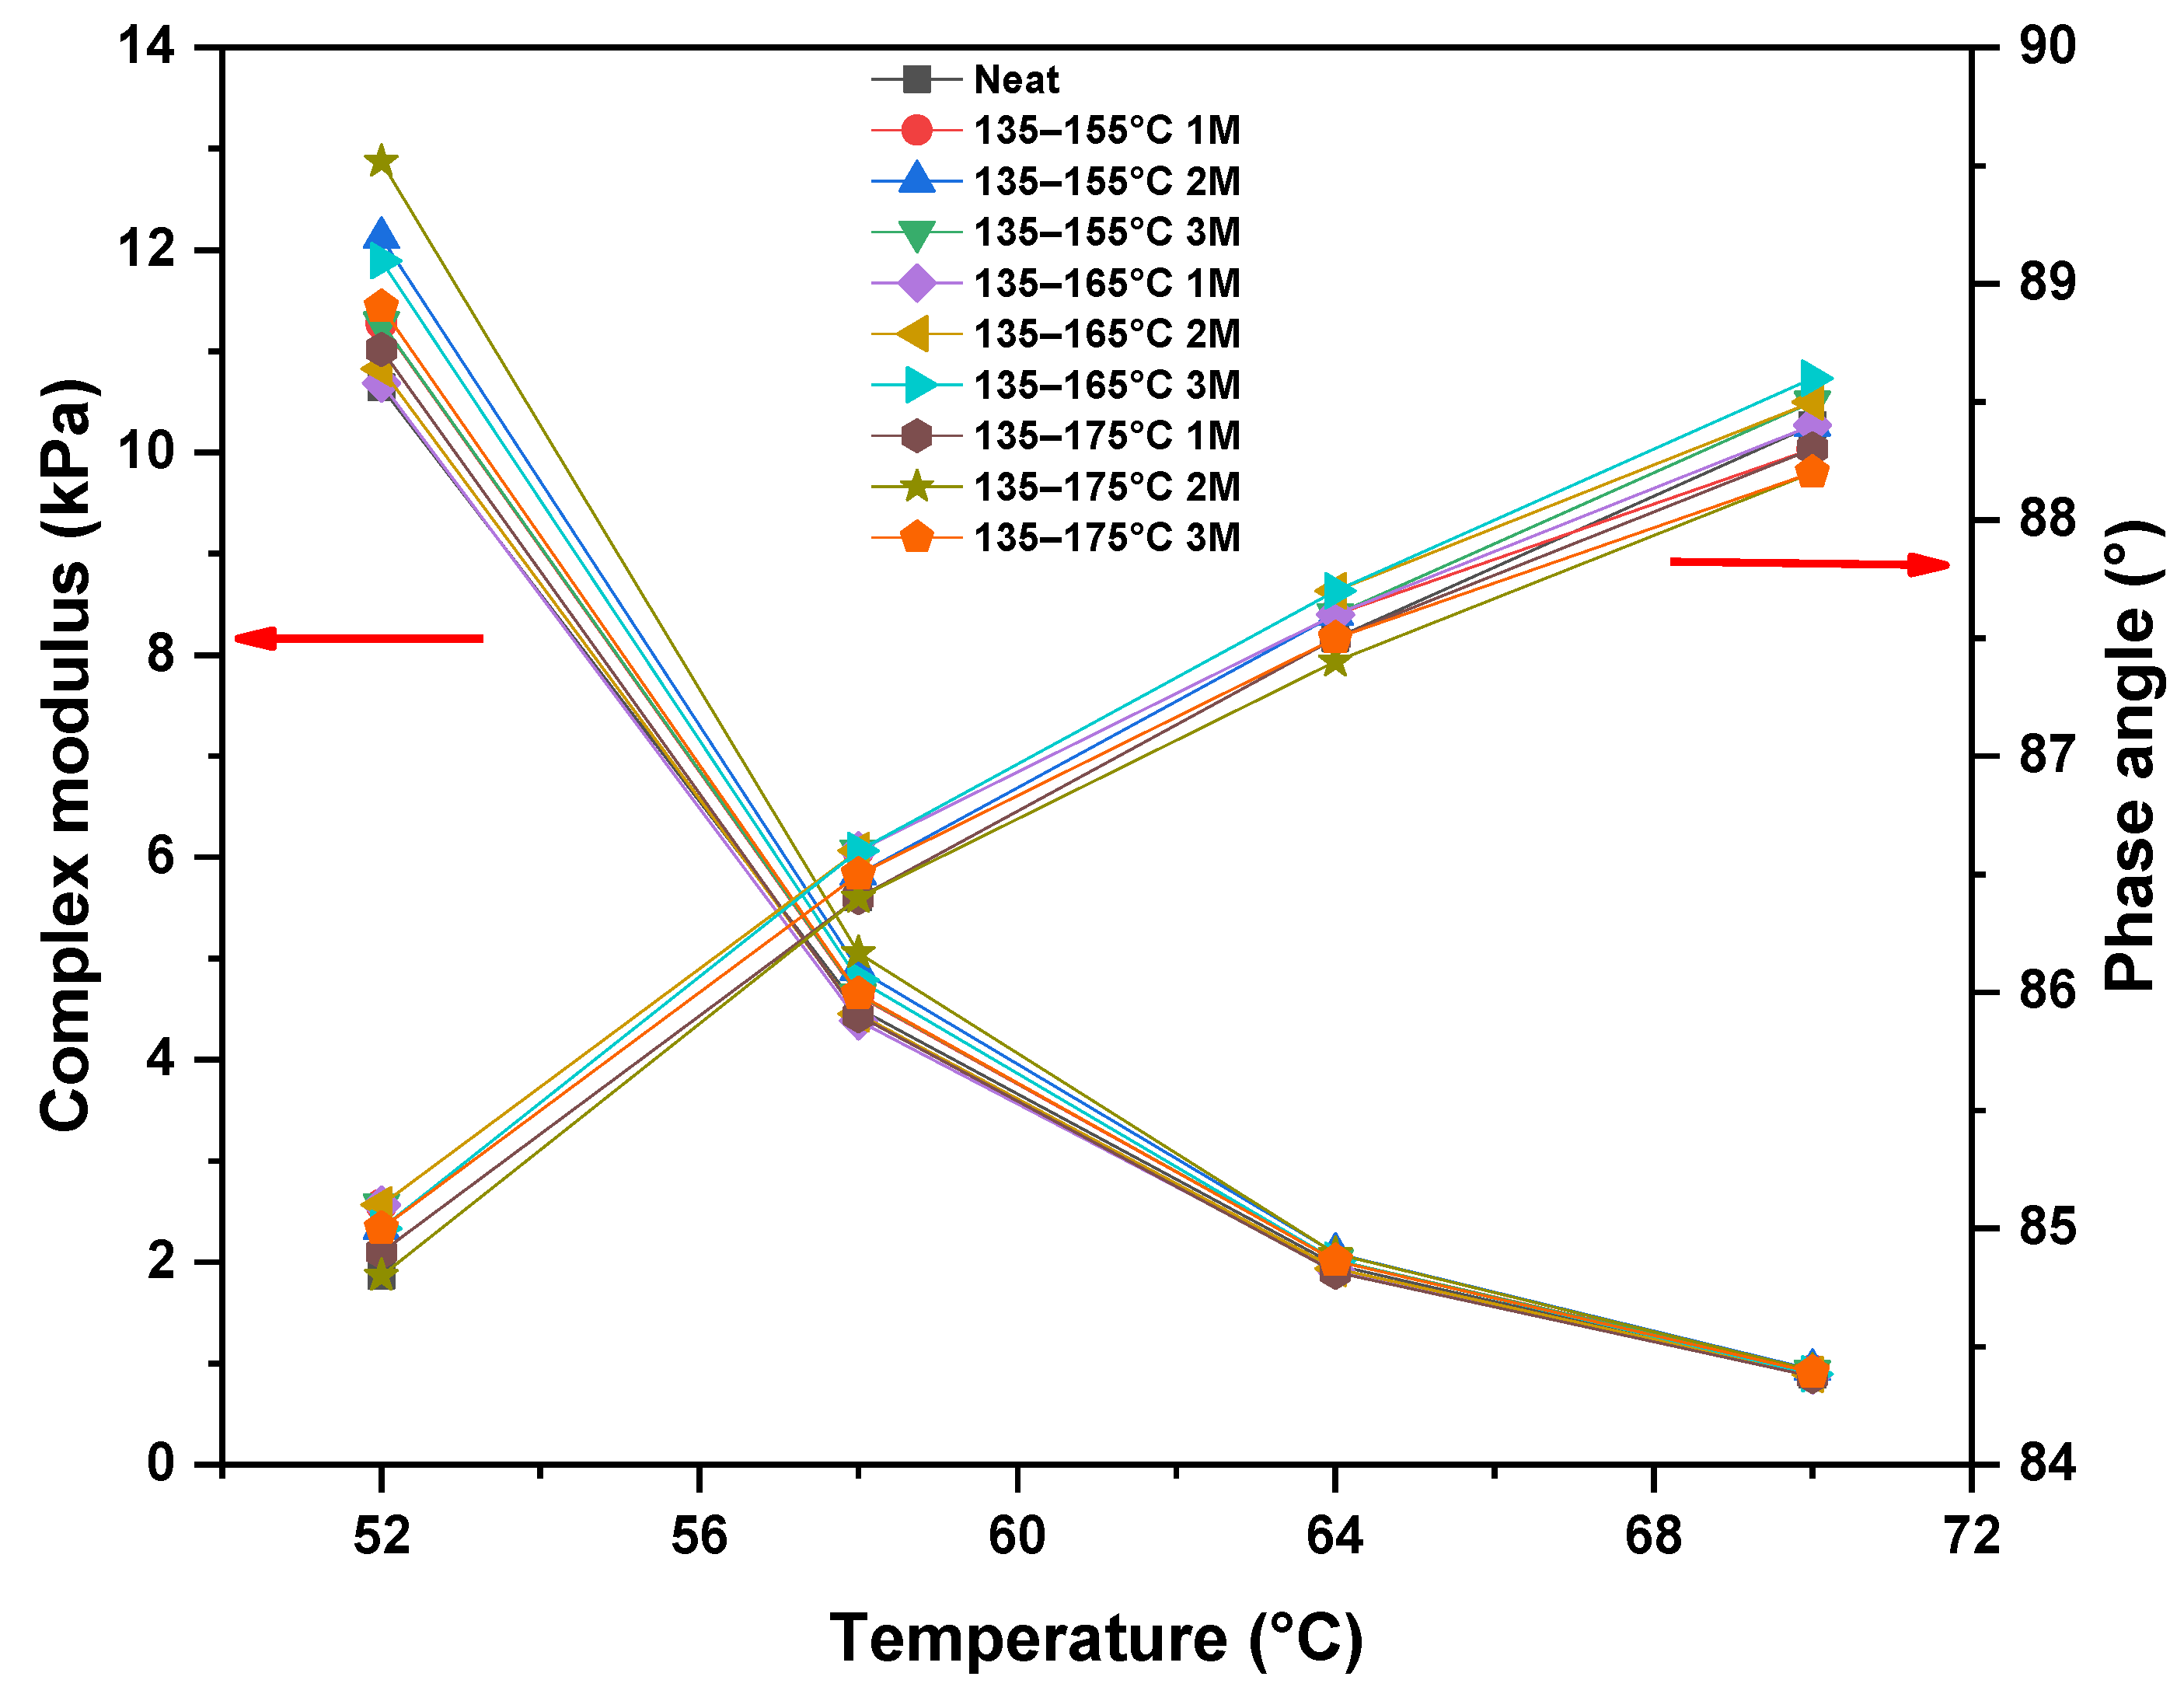
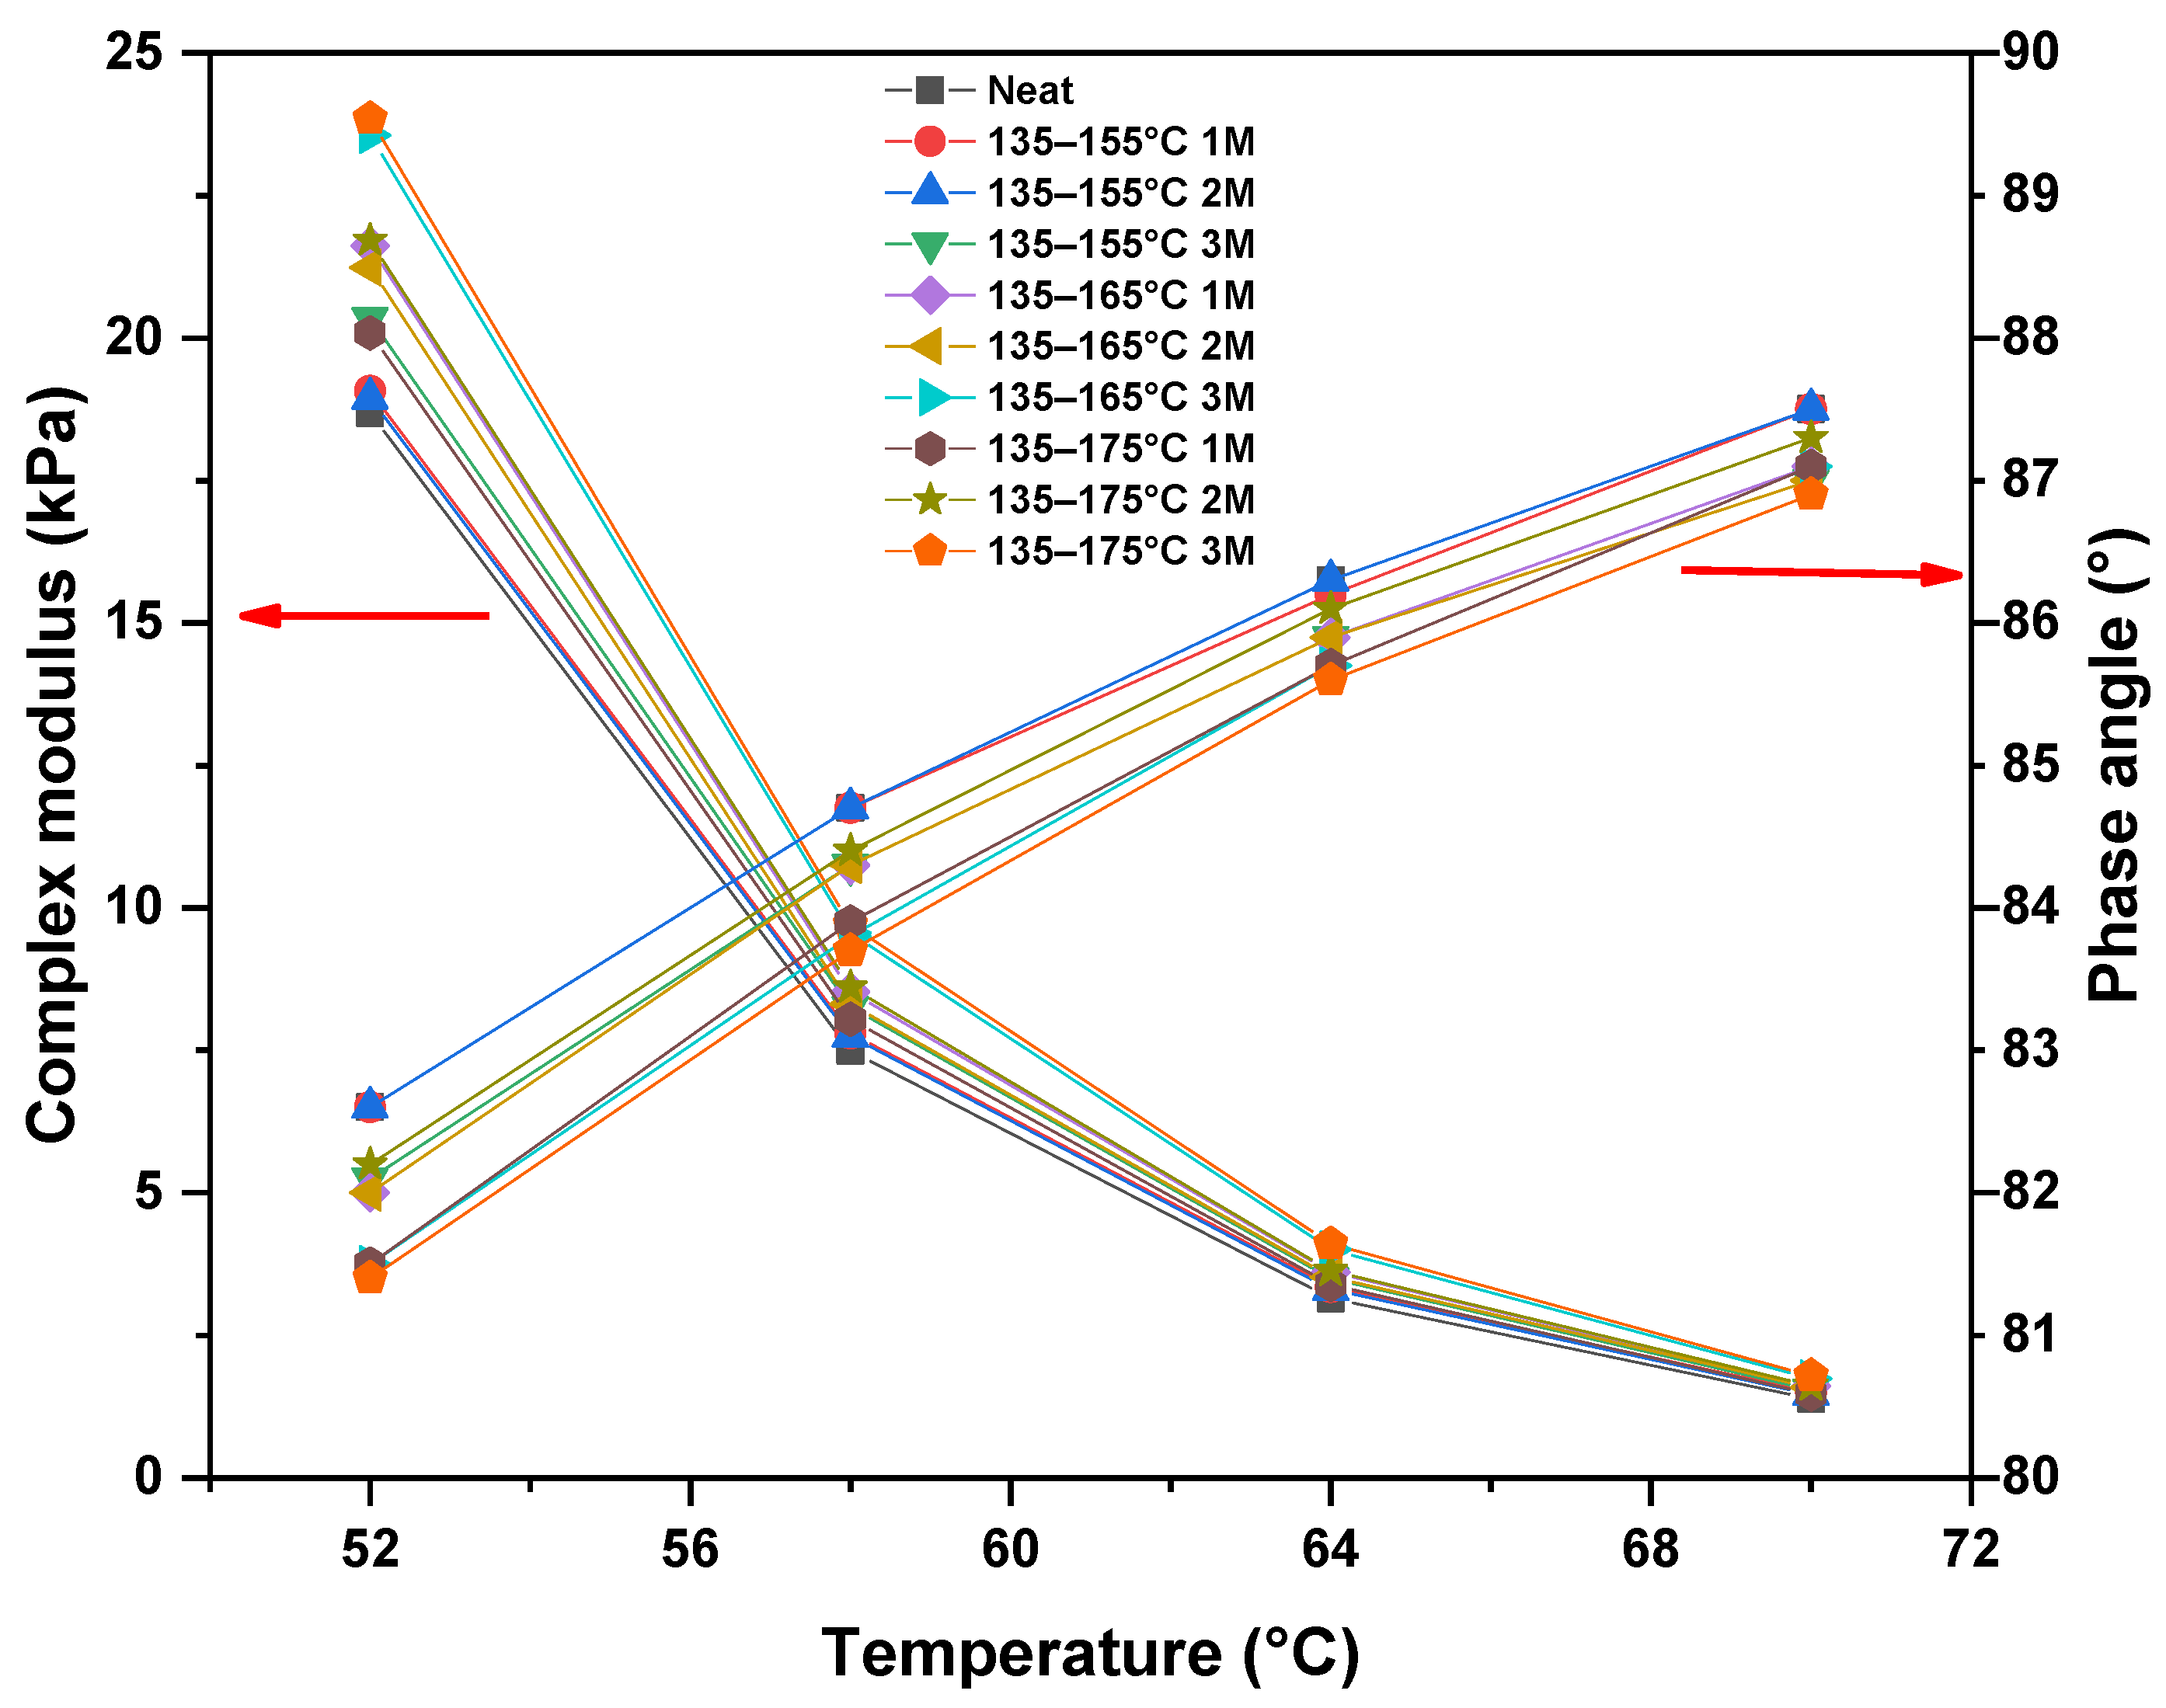
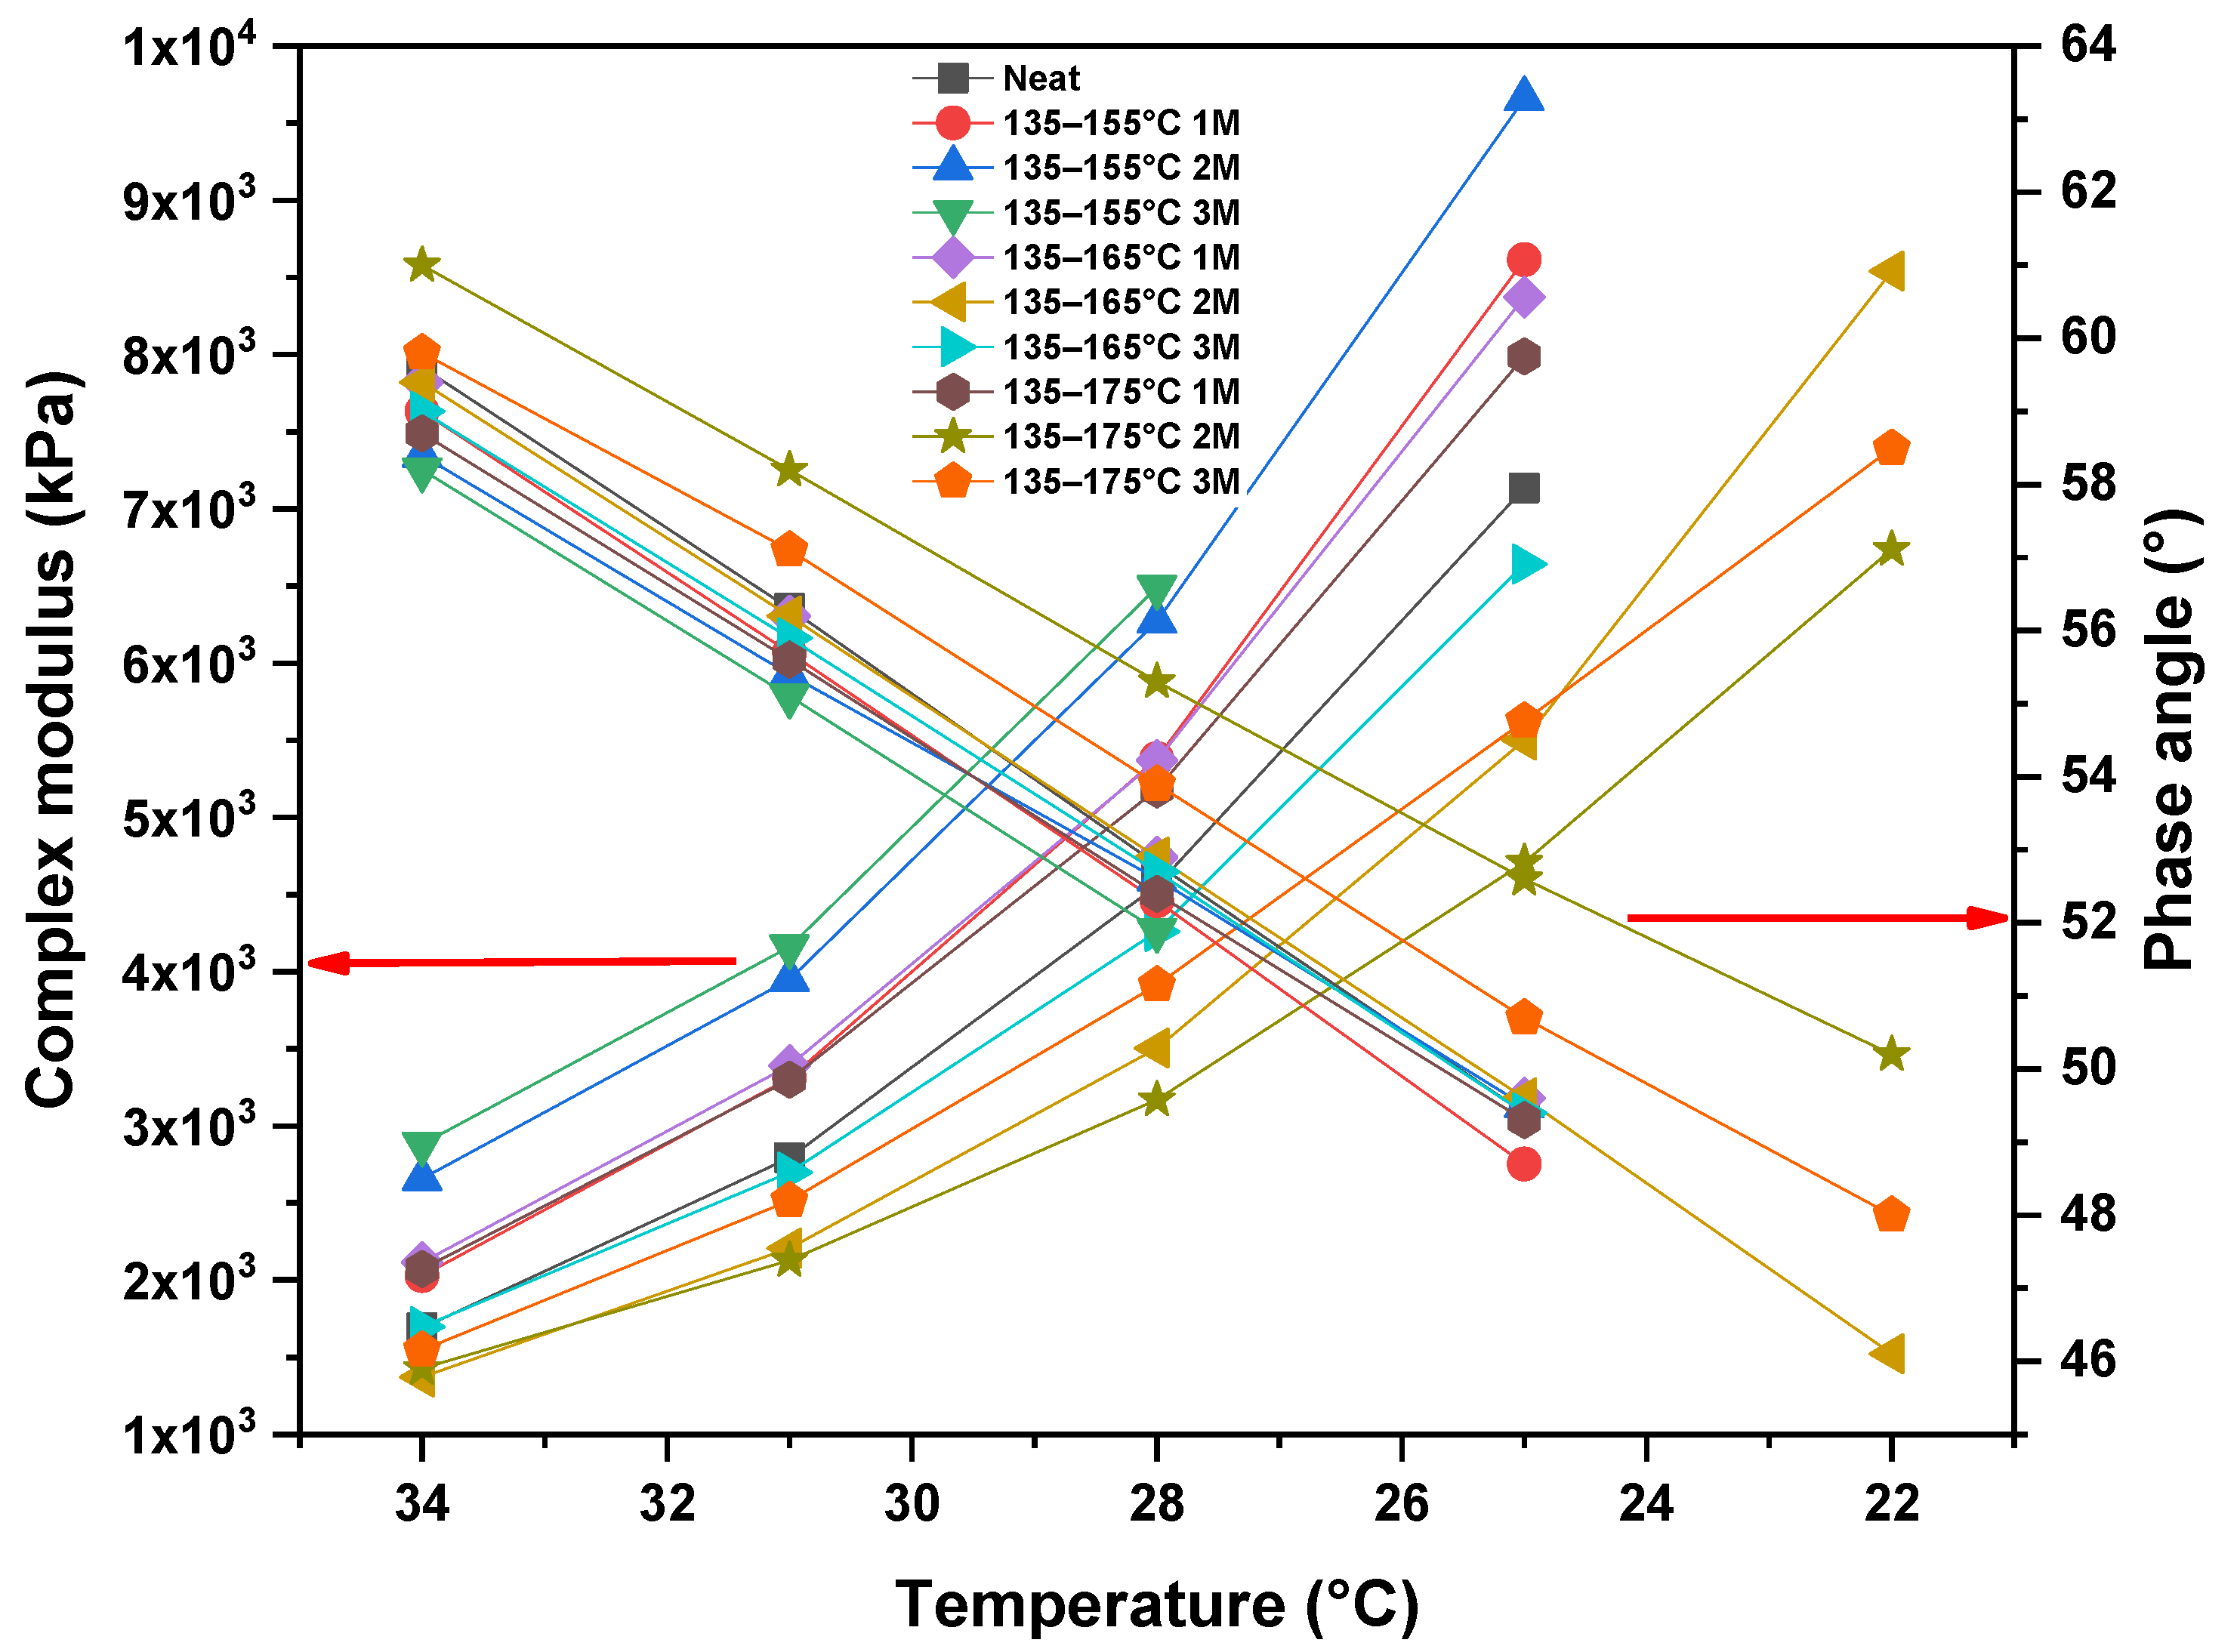
The examination of Figure 20 and Figure 21 reveals that with an increase in temperature we observed a decrement in the complex modulus (G*) and an increment in the phase angle (δ). This means that the proportion of elastic deformation was reduced, whereas the contribution of the viscous portion to the complex modulus was increased with the temperature rising [51]. The decrease in the complex modulus means that bitumen became softer at higher temperatures [50].
We can see from Figure 20 that, at the unaged stage, at 52 °C, the neat bitumen had the smallest complex modulus and that the bitumen became stiffer with thermal fluctuations. The samples stored for one month had complex modulus values that were smaller than the other storage durations, which means that one month of storage has the smallest effect on the bitumen’s rheology. As the temperature rose, the complex modulus values became closer to each other, and at 64 °C and 70 °C the complex moduli were almost the same for all samples. At 52 °C, the phase angle values were between 84.8° and 85.1°, and at 70 °C the values were between 88.2° and 88.6°, which means that the change in the viscoelastic behavior of the unaged bitumen between the different temperature storage ranges was unimportant.
Figure 21 shows the evolution of the complex modulus and the phase angle after short-term aging. The results show that with aging the complex modulus (G*) increased (higher values than at the unaged stage) and the phase angle (δ) decreased, which means that aging enhances the rigidity of bitumen [48]. As in the unaged stage, the neat bitumen was the softest, with the smallest complex modulus, and the thermally cycled samples were stiffer. We can see that the stiffest samples were those stored at 135–175 °C and 135–165 °C for three months, while those stored at 135–155 °C had complex modulus values very close to the neat bitumen. Again, at a high temperature (70 °C) all samples showed very similar stiffness levels.
The evolution of the phase angle after short-term aging was consistent with the change in the complex modulus, with the samples stored at 135–175 °C and 135–165 °C for three months having the lowest phase angle values and the neat bitumen, along with the samples stored at 135–155 °C, having the highest phase angle values.
From the unaged and short-term-aged stages’ results, we can say that thermal fluctuations boosted the stiffness of the bitumen, which was advantageous for rutting resistance, though we should keep in mind that excessively stiff bitumen is more prone to cracking.
After long-term aging, the DSR test was conducted at lower temperatures, starting in this case from 34 °C down to 22 °C. We observe in Figure 22 that with the decline in test temperature, the complex modulus values became higher and the phase angle values became lower, indicating a more elastic behavior. Comparing the results, we can see that the samples that were stored at 135–175 °C and 135–165 °C for two or three months had the smallest complex modulus values. This means that at lower temperatures these samples were softer than the others, which made them more resistant to cracking. The phase angle results revealed that the higher the storage temperature and duration, the higher the phase angle values; thus, the samples stored at 135–175 °C and 135–165 °C for two or three months displayed more viscous behavior after long-term aging. Since bituminous materials should ideally be more viscous at low temperatures to resist cracking and more elastic at high temperatures to resist rutting [49], we conclude that the thermal fluctuations positively affected the rheological performance of our 35/50 penetration-grade bitumen.
The following sections’ results provide a clearer idea about the limit of stiffness that we should not exceed.

3.5.2. Rutting Factor

Rutting is the term used to describe the gradual accumulation of permanent deformation or consolidation in an asphalt pavement surface. There are many causes of rutting: a lack of compaction; a lack of internal strength; and if excess bitumen is contained in the mixture, the mixture will be more prone to rutting. Stiffer asphalt binders play a role in resisting rutting during high temperatures [52]. Therefore, the rutting and fatigue cracking phenomena are easier to study in an asphalt mixture than in bitumen itself, although we could reach some conclusions through the binder stiffness assessment.
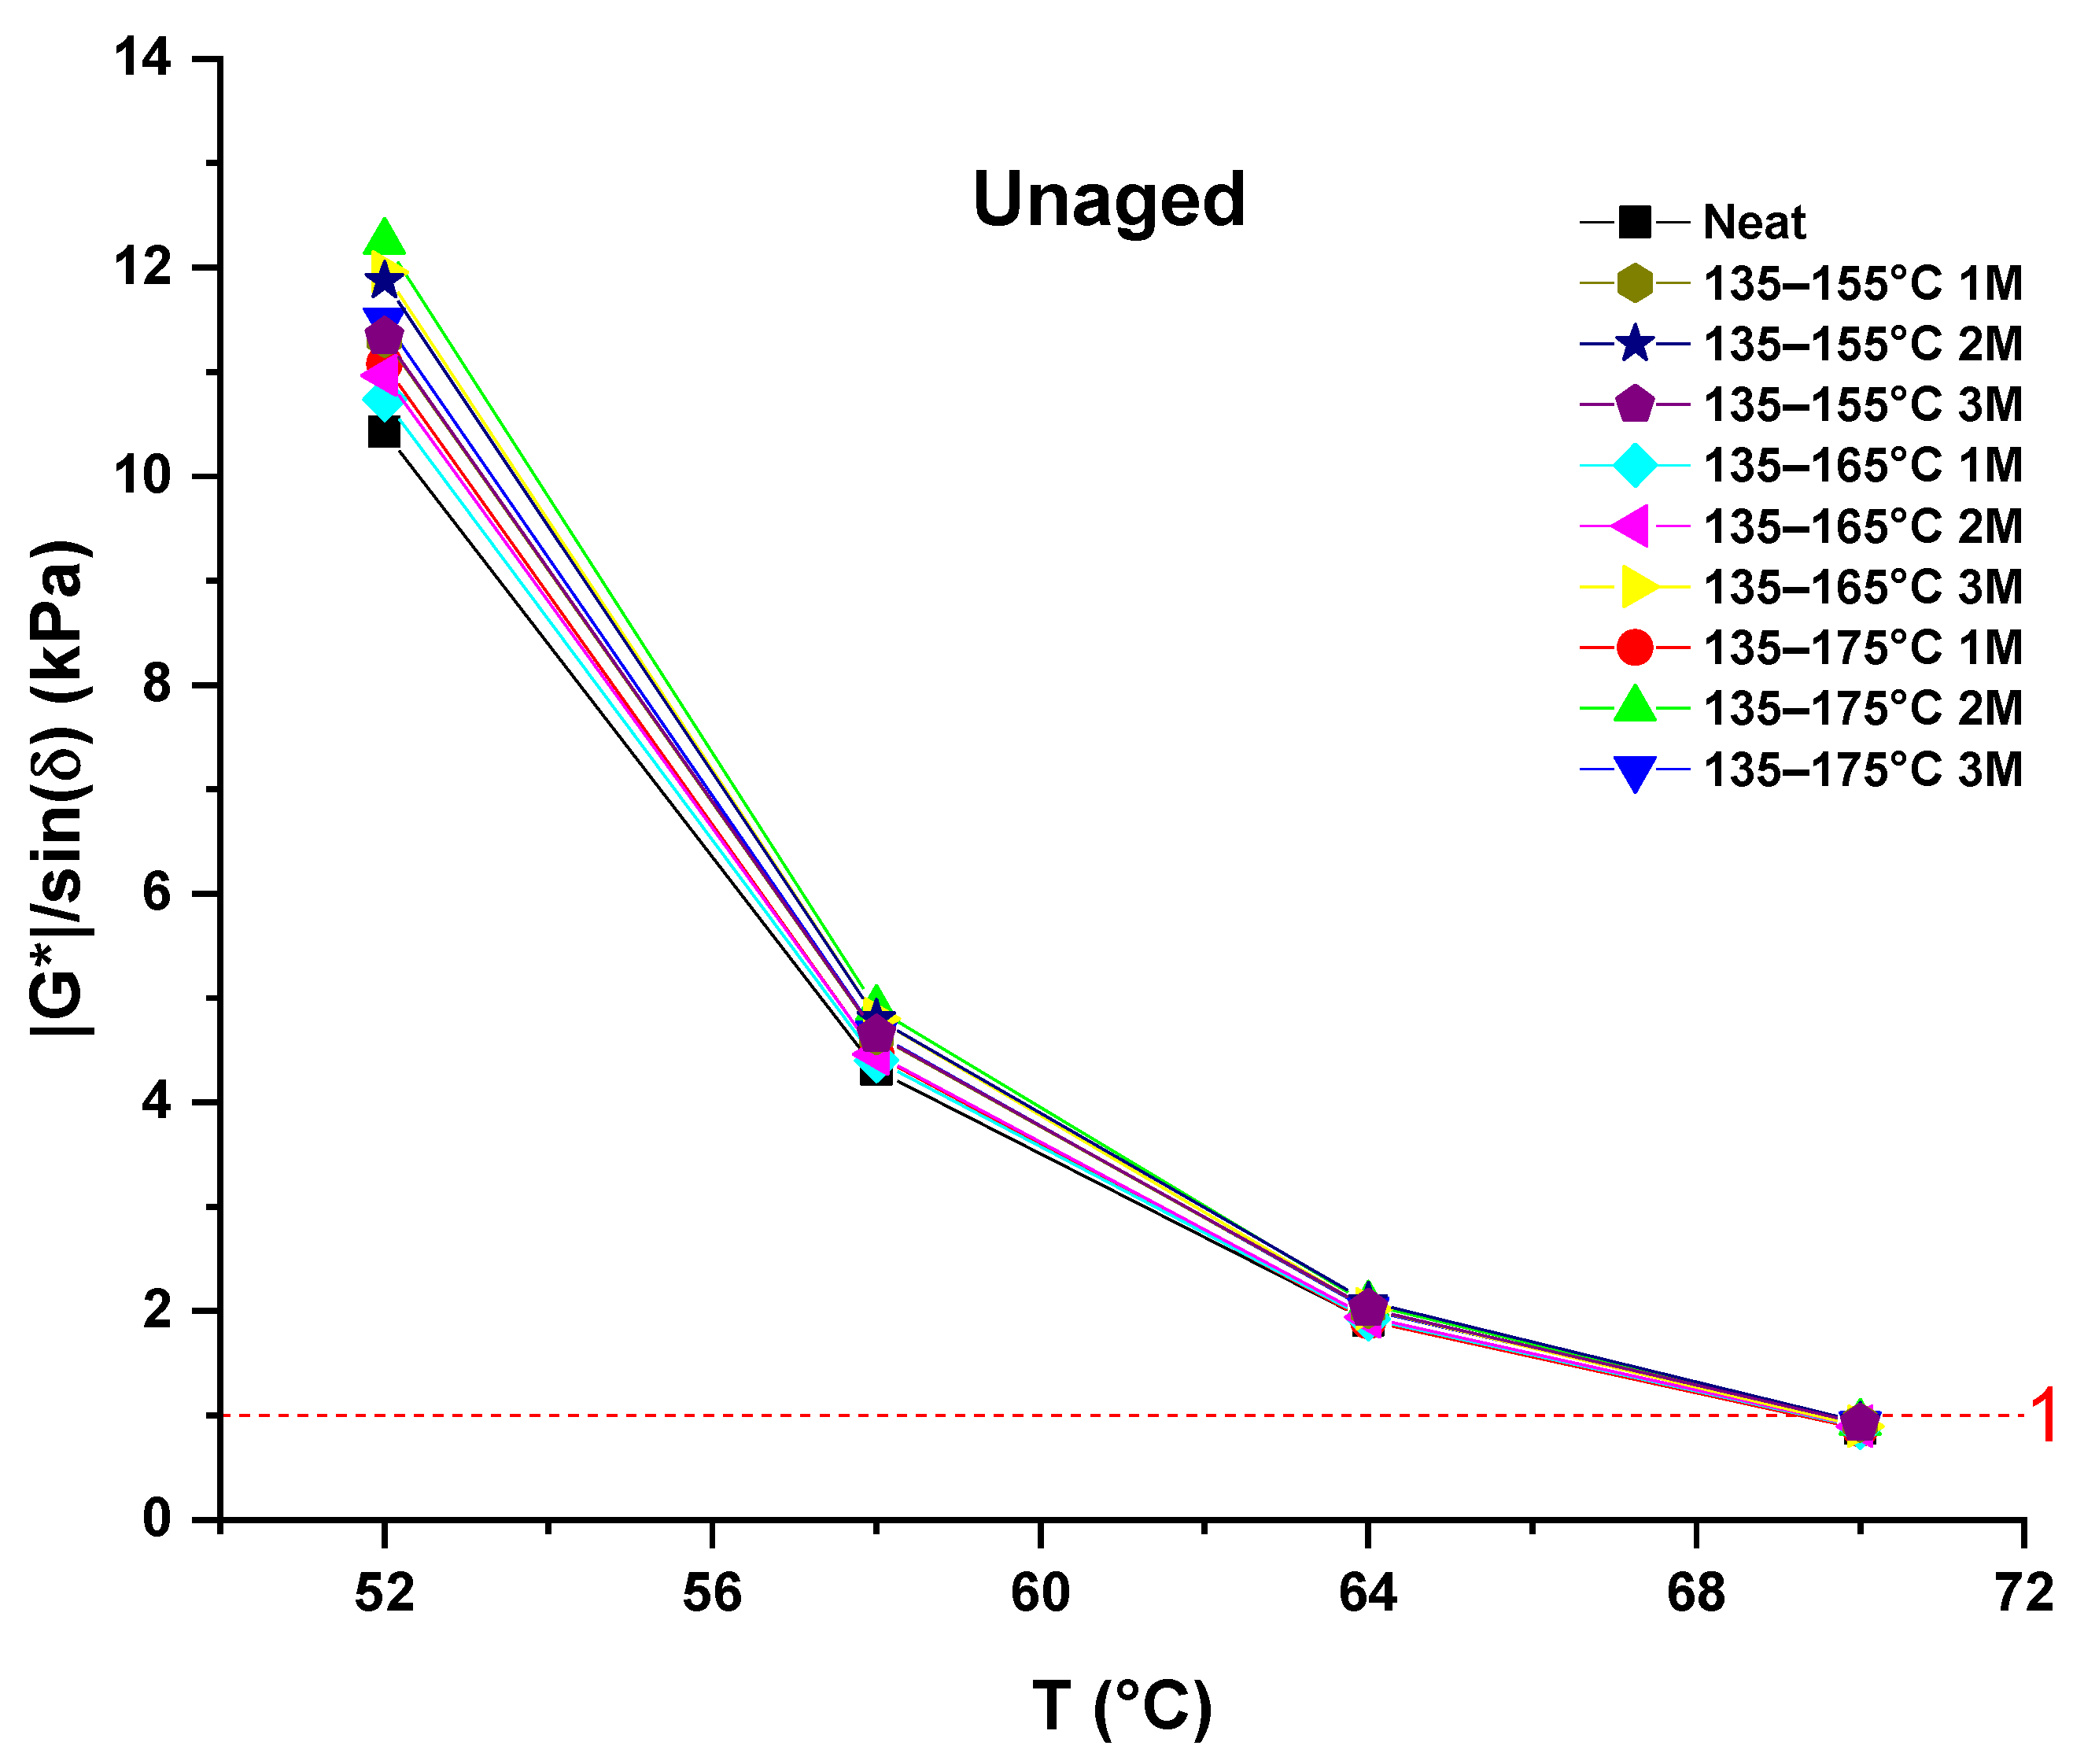
From Figure 23 and Figure 24, we observe that at the unaged and the short-term-aged stages, as the testing temperature increased, the rutting factor (|G*|/sin(δ)) declined, which indicates that the property of the bitumen’s rutting resistance at a high temperature decreased.
In order to reduce rutting, the amount of work expended during each loading cycle should be kept to a minimum, which means that |G*|/sin(δ) should be maximized. This is why minimum values for |G*|/sin(δ) are specified for unaged and RTFOT-aged binders in DSR analysis.
For unaged binders, |G*|/sin(δ) should be ≥ 1.000 kPa. We can see from Figure 23 that all the samples attained the rutting factor (|G*|/sin(δ)) limit at the same temperature (69.3–69.7 °C). In addition, the differences between the samples’ rutting resistance factor values became smaller with the increase in the testing temperature.
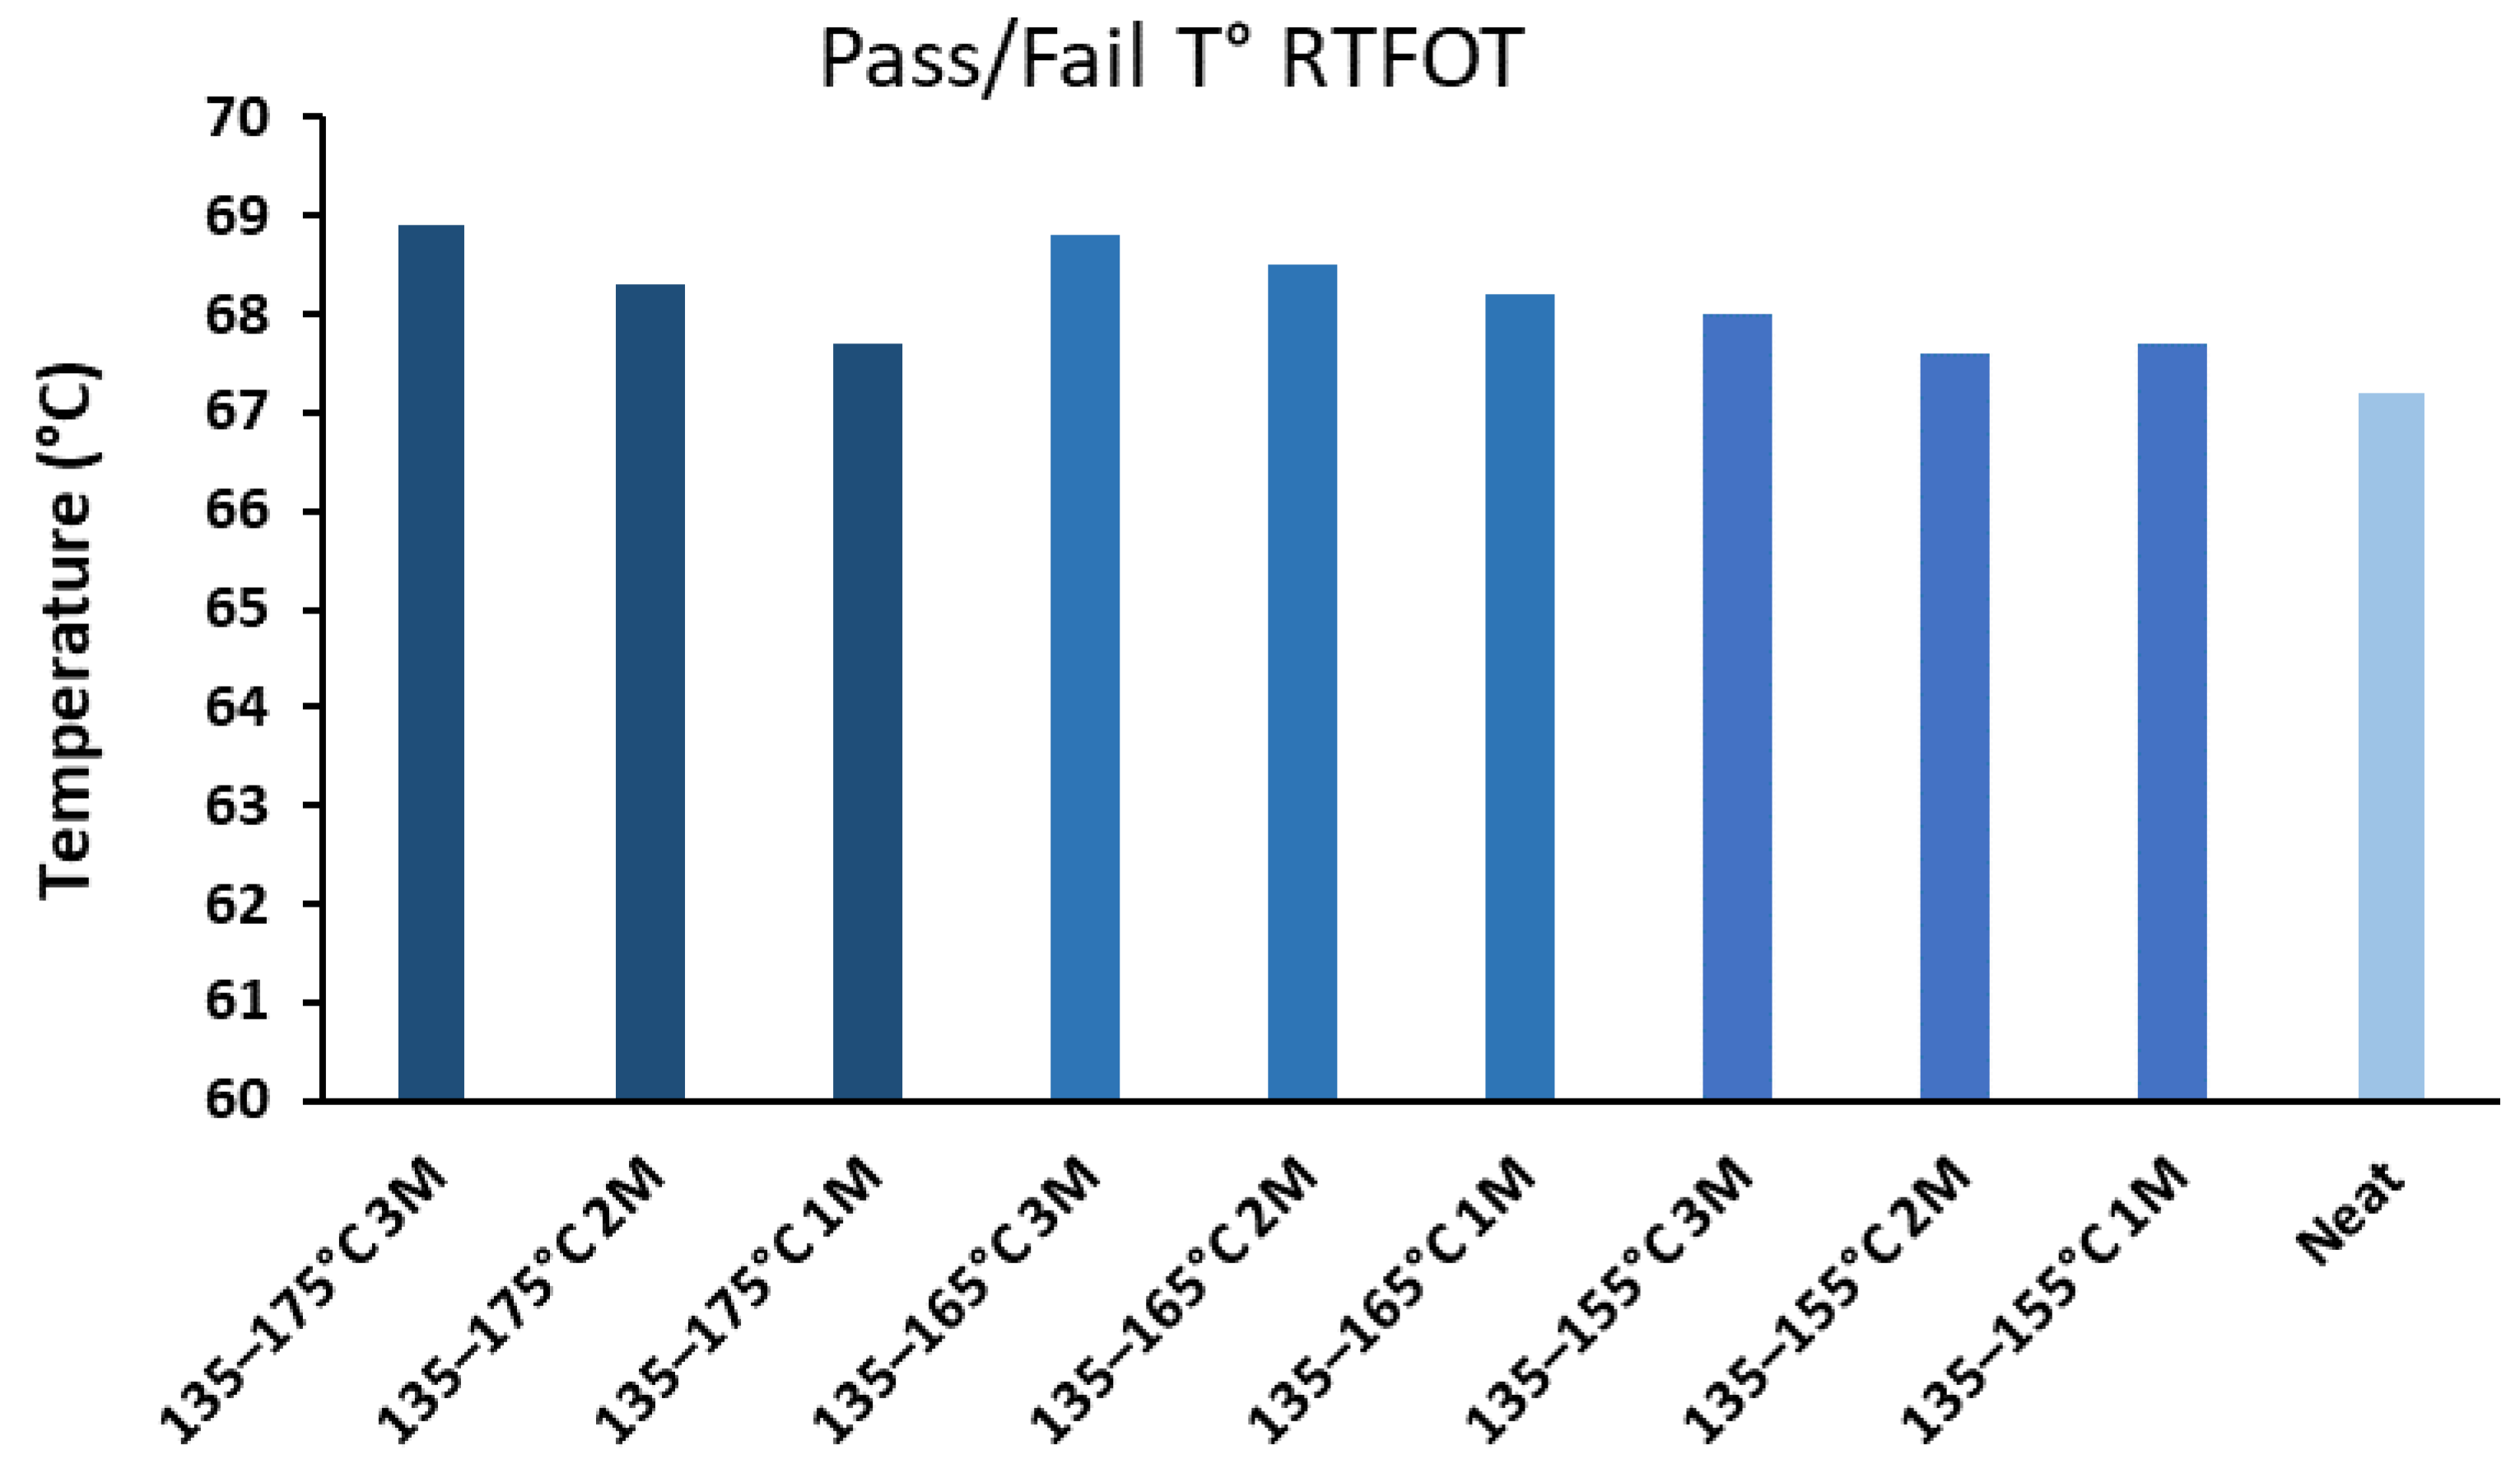
For short-term-aged binders, |G*|/sin(δ) should be ≥ 2.200 kPa. In this case, as we can see from Figure 24, the samples hit the rutting factor limit at different temperatures, ranging from 67.2 to 68.9 °C. Figure 25 details the upper critical temperature—the temperature at which the binder becomes prone to rutting (also called the pass/fail temperature)—of each RTFOT-aged sample. We made the bars’ colors in the histogram become darker with the increment in the maximum storage temperature (augmentation of ΔT) to provide a clearer representation. As we can see, the upper critical temperature became lower with a decrease in ΔT. Samples that were stored at 135–155 °C had the lowest pass/fail temperatures; this means that the resistance to rutting increased with the increase in ΔT in the storage temperature range. In addition, we can see that, for each storage temperature range, the three-month storage duration led to higher pass/fail temperatures than the two-month and one-month storage durations; this means that the resistance to rutting increased with the augmentation of the storage duration.

3.5.3. Fatigue Cracking Factor

Rutting usually takes place in an early stage in pavement, whereas cracking happens after the pavement ages and becomes stiffer. In general, stiffer asphalt pavements are more resistant to rutting, while softer pavements are better at resisting cracking. Achieving a balanced asphalt mixture with both rutting and cracking resistance is crucial [53].
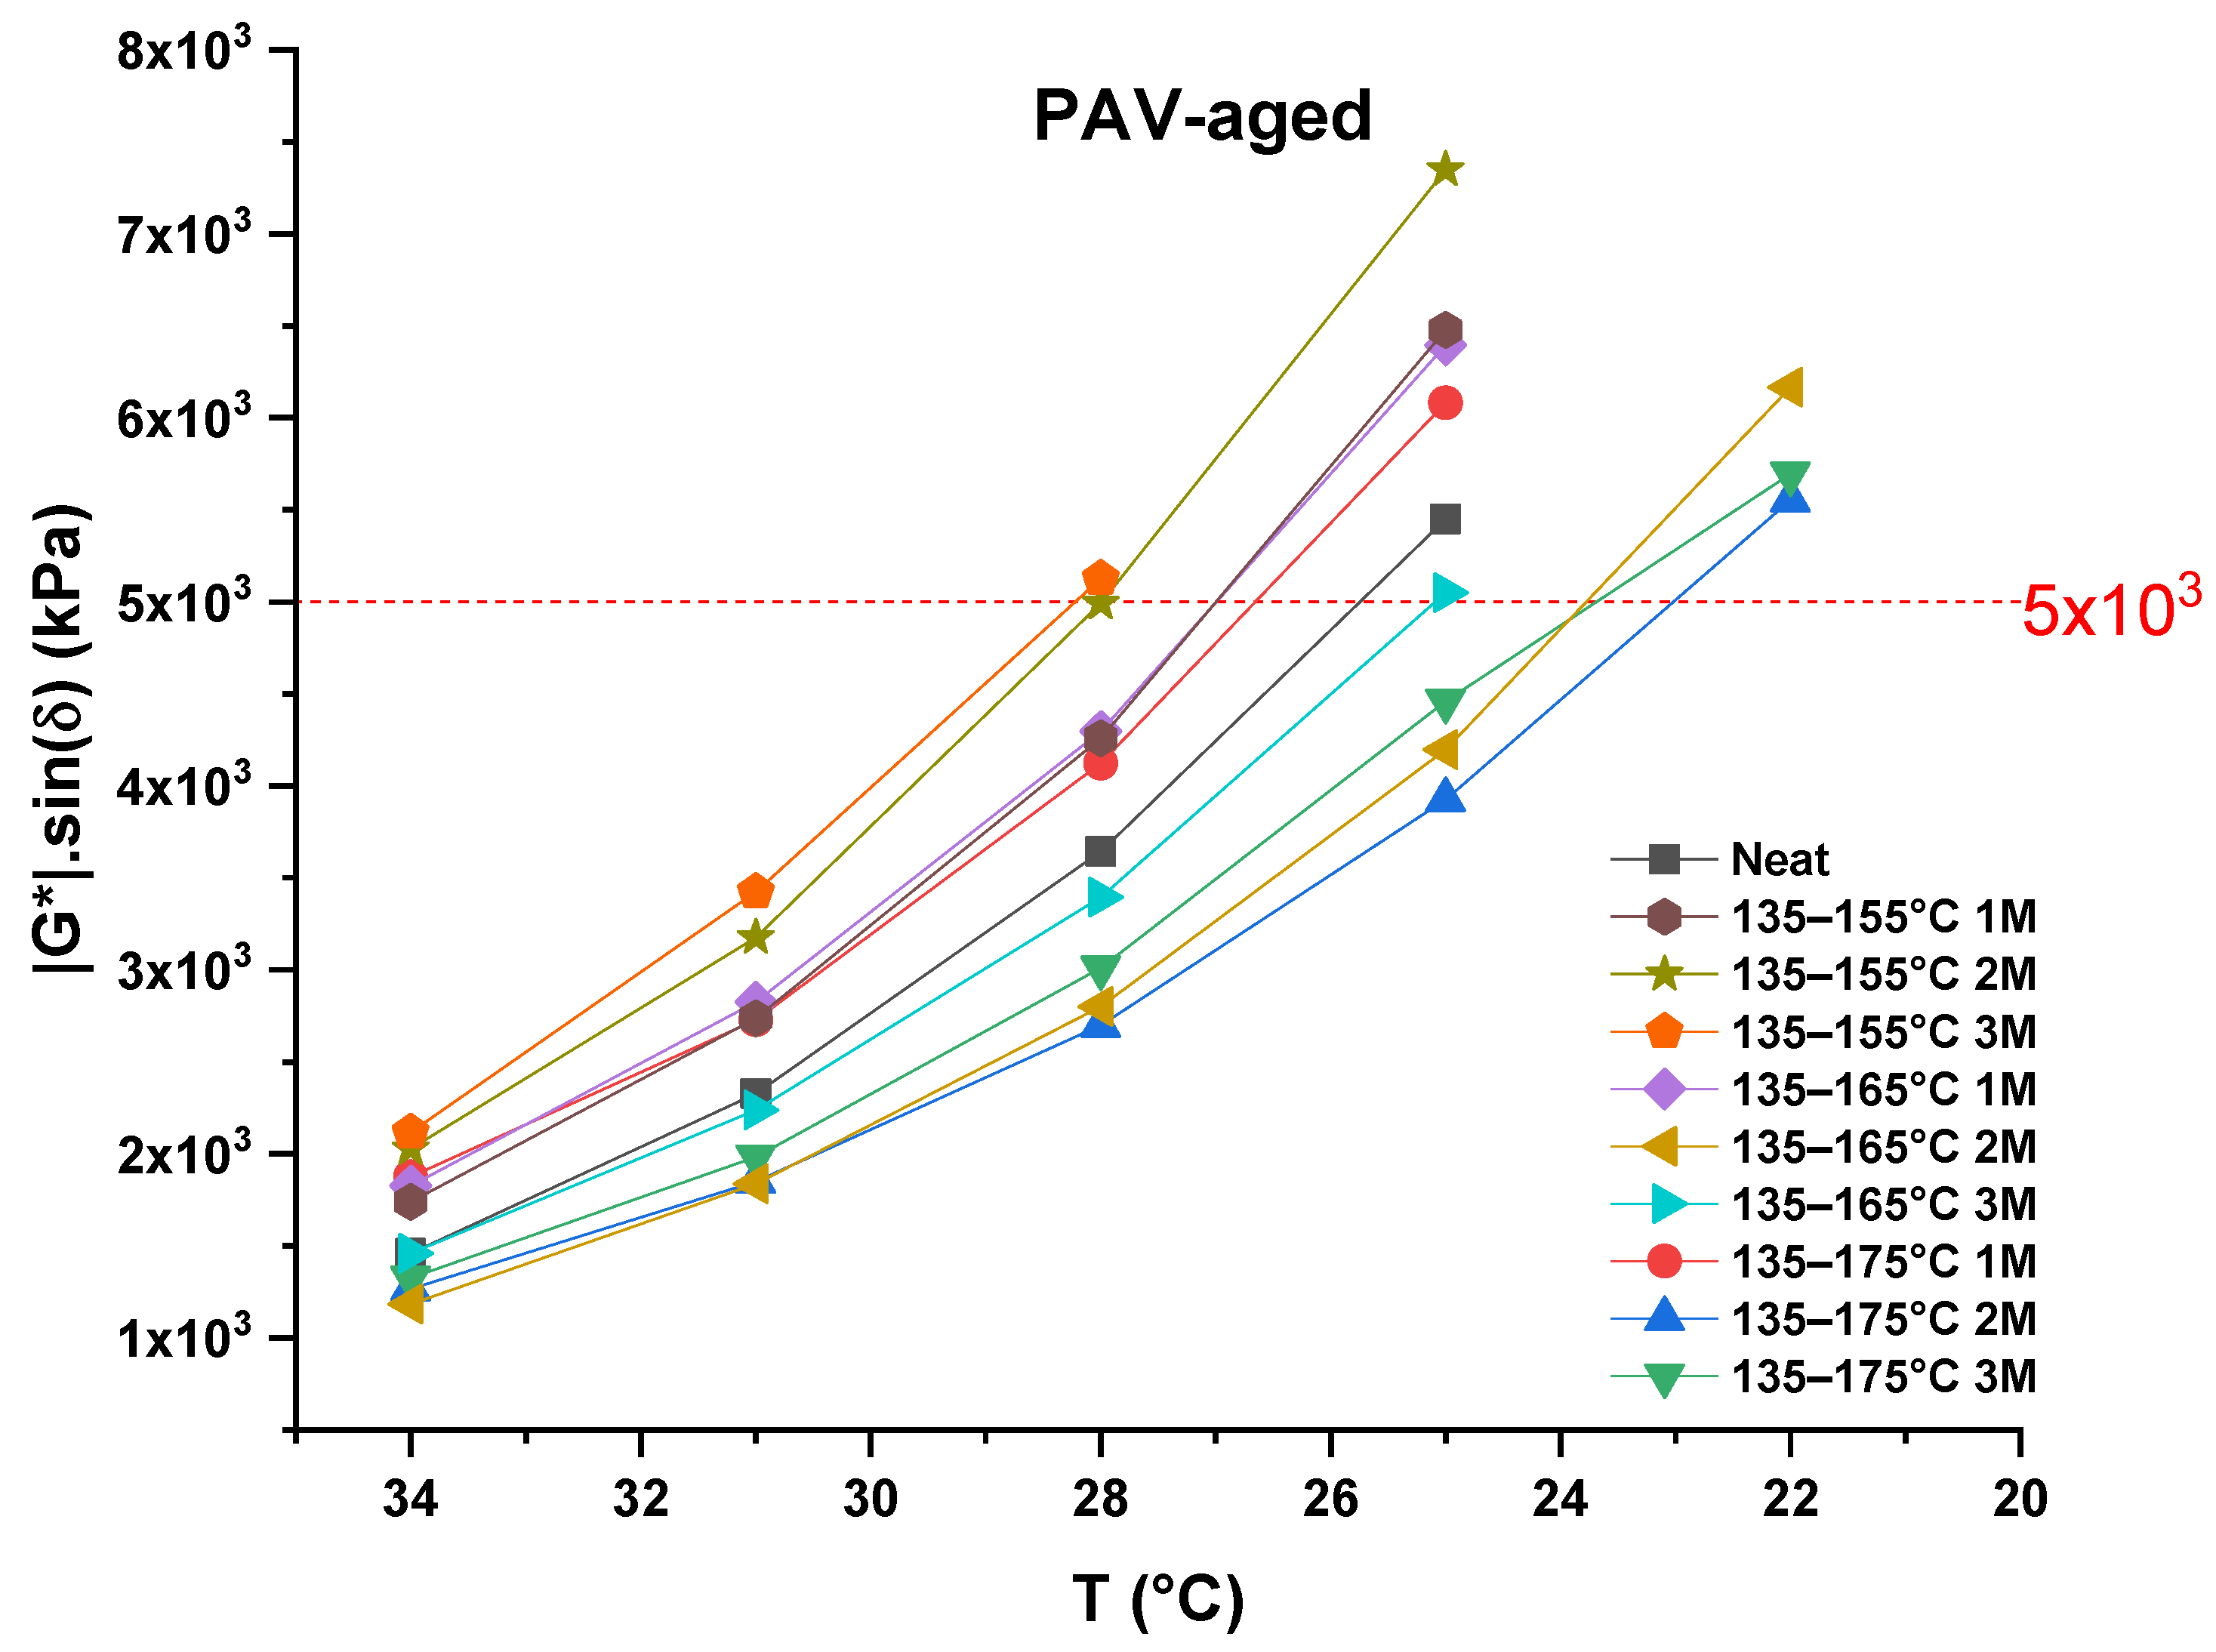
At the long-term aging stage, as the temperature declined, the factor of fatigue cracking (|G*|sin(δ)) increased, which indicates that the property of bitumen’s fatigue cracking resistance at lower temperatures decreased.
In order to reduce fatigue cracking, the amount of work dissipated during each loading cycle should be reduced, which means that |G*|sin(δ) should be minimized. That is why a maximum value for |G*|sin(δ) is specified for PAV-aged binders in DSR analysis; |G*|sin(δ) should be ≤5000.000 kPa.
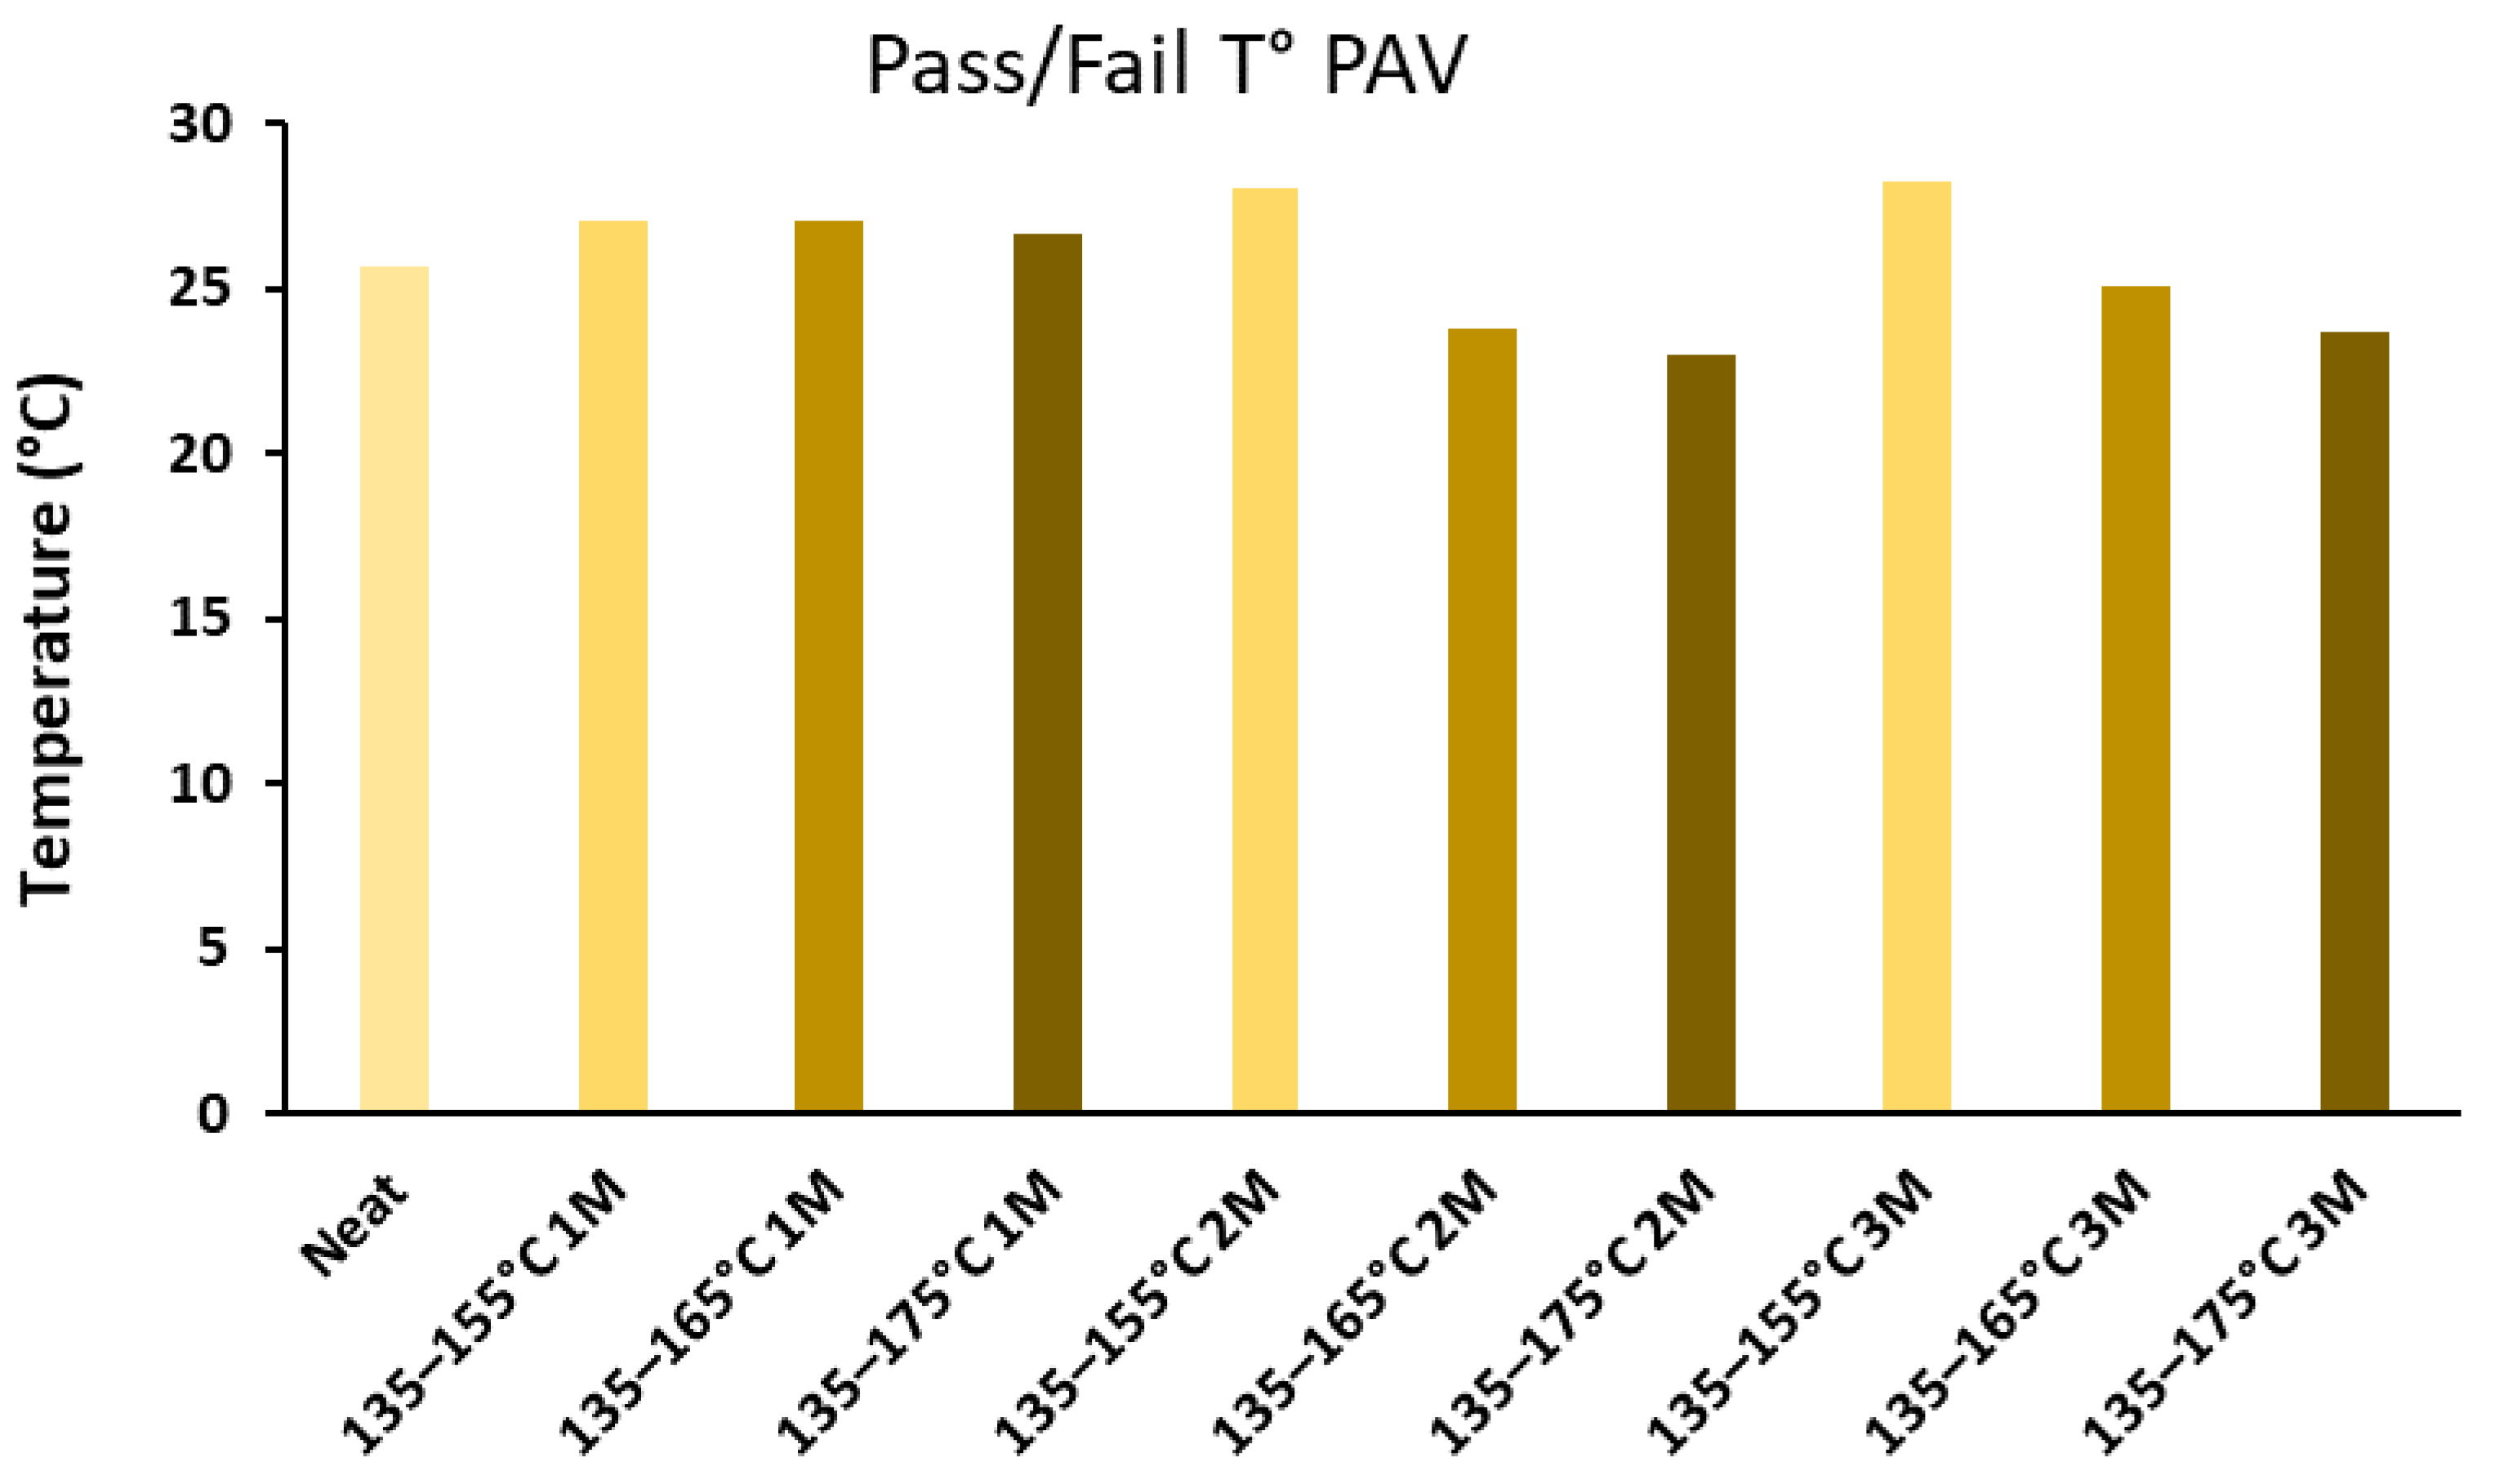
In this case, the samples hit the fatigue cracking factor limit at different temperatures (Figure 26) ranging from 23 to 28.2 °C. Figure 27 details the upper critical temperature—the temperature at which the binder becomes prone to fatigue cracking—of each PAV-aged sample. We made the bars’ colors in the histogram become darker with the increment in the maximum storage temperature (the augmentation of ΔT) to provide a clearer representation. As we can see, samples stored at 135–165 °C and at 135–175 °C had lower pass/fail temperatures than those stored at 135–155 °C. This means that the resistance to fatigue cracking at lower temperatures increased with the increase in ΔT. In addition, we can see that, for both the 135–165 °C and 135–175 °C storage temperature ranges, a one-month storage duration led to higher pass/fail temperatures than the other storage durations; this means the resistance to fatigue cracking became better with the augmentation of the storage duration. The results show (Figure 26) that storing 35/50 bitumen for one month at 135–155 °C or 135–165 °C resulted in almost the same |G*|sin(δ) at every test temperature and the same upper critical temperature (27 °C). One month of storage at 135–175 °C was similar, with a 26.6 °C upper critical temperature and very close values for the fatigue cracking resistance factor. We conclude that, in the long term, storing 35/50 bitumen for one month at any tested temperature range will result in the same rheological performance.
We observed that the two-month storage in the 135–165 °C and 135–175 °C temperature ranges resulted in lower pass/fail temperatures and lower |G*|sin(δ) values between testing temperatures of 34 °C and 25 °C than the three-month storage. This confirms the carbonyl index results that showed that two months is a critical storage period for 35/50 bitumen in the long term for these two storage temperature ranges. These findings are fairly consistent with those mentioned in the literature, as Ge et al. reported in their work on the correlation of DSR results and FTIR carbonyl and sulfoxide indices that strong correlations occurred between DSR and FTIR test results for both of the asphalt binders they investigated [54].

4. Conclusions

Opting for solar energy to achieve bitumen tank heating can minimize CO2 emissions and energy costs. Nevertheless, we need to be sure that the temperature fluctuations that result from a solar energy system do not negatively affect the bitumen’s performance. Hence, this paper provides a study of the evolution of the most significant bitumen properties under thermal fluctuations. We investigated 35/50 penetration-grade bitumen storage heated by solar energy in different thermal scenarios that usually occur in the region of Rabat, Morocco. The main findings can be summarized as follows:
  • The FTIR results showed that the higher the storage temperature and the longer the storage duration, the greater the occurrence of oxidation.
  • The DSR results showed that thermal fluctuations improved bitumen’s rutting resistance and fatigue cracking resistance. In addition, we found that storing 35/50 bitumen for one month at any tested temperature range (135–155 °C, 135–165 °C, or 135–175 °C) resulted in the same rheological performance in the long term. Moreover, longer storage periods led to more viscous behavior after long-term aging.
  • We reached the following conclusions:
  • The temperature fluctuations during bitumen heating have a positive impact on the rheological properties of 35/50 bitumen. This could be because the binder stays at lower temperatures most of the time (down to 135 °C) instead of being stored at a high temperature during the whole storage duration.
  • However, high storage temperatures (>165 °C) with long storage periods augment the risk of oxidation. Hence, we recommend limiting the storage duration to a maximum of two months for storage temperatures lower than 165 °C and a maximum of one month for storage temperatures higher than 165 °C.
  • Consequently, solar energy usage to maintain bitumen storage heat has proved to be a promising solution, resulting in impressive economic and environmental gains without compromising the quality of the stored binder.
This study is limited to specific parameters; thus, further studies should be conducted to investigate more storage temperature ranges, depending on different weather conditions.
Finally, exposing bitumen to thermal fluctuations in reality using the one-ton prototype could be interesting to study in the future.

Author Contributions

Conceptualization, A.T. and M.B.; methodology, A.T. and M.G.; validation, A.T. and M.G.; formal analysis, A.T. and M.G.; investigation, A.T. and M.G.; resources, K.E.A. and S.B.; data curation, A.T. and M.G.; writing—original draft preparation, A.T. and M.G.; writing—review and editing, M.B., O.A. and T.C.; visualization, A.T. and M.G.; supervision, M.B., O.A. and T.C.; project administration, M.B.; funding acquisition, M.B. All authors have read and agreed to the published version of the manuscript.

Funding

This research was funded by IRESEN (grant number INNOPROJET-2014, “Maintain the bitumen storage heat by using the solar thermal collector”).

Institutional Review Board Statement

Not applicable.

Informed Consent Statement

Not applicable.

Data Availability Statement

The data presented in this study are available upon request from the corresponding author.

Acknowledgments

The authors would like to thank Mohamed Lizoul for his advice and Mohamed Ghazi for his help with the “pumping power” part (Appendix A). We thank Nora Mbirkat, technician at CERIT/LPEE, for her tremendous help with the RTFOT, PAV, penetration, softening point, and DSR tests. We would like to thank Ilham Bouzida, QA engineer at MAScIR, for thermal storage services and for her patience and Rachid Bouhfid, senior researcher at MAScIR, for ATR-FTIR spectroscopy services. The authors also want to thank “Bituma SA” for the collaboration and the information shared to complete this study.

Conflicts of Interest

The authors declare no conflict of interest. The funders had no role in the design of the study; in the collection, analyses, or interpretation of data; in the writing of the manuscript; or in the decision to publish the results.

Appendix A

Impact of Bitumen Viscosity on the Pumping Power

The bitumen density at 15 °C, as per EN 15326 [55], for 35/50 bitumen is 1.030 g/cm3. Referring to [39], if bitumen is to be used at other temperatures, the density at the application temperature is calculated using Equation (A1):
ρ x = ρ 15 0 , 00061 . Δ t
where:
  • 𝜌x: density at application temperature X;
  • 𝜌15: density at 15 °C in g/cm3;
  • Δt: temperature difference (X-15), X ∈ (15,16…200).
The pump used to fill the track with bitumen turns at 1.5 m/s in a pipeline of DN 150. By calculating the Reynolds number using Equation (A2) and calculating the linear pressure drop in a pipeline due to friction ( H f L ) using the Darcy–Weisbach Equation (Equation (A3)), we can represent the variation in the linear pressure drop as a function of the pumping temperature (Figure A1).
Re = ρ UD μ
where:
  • ρ is the density of the fluid (SI units: kg/m3);
  • U is the flow speed (m/s);
  • D is a characteristic linear dimension (m);
  • μ is the dynamic viscosity of the fluid (Pa·s).
H f L = f D   . ρ U 2 2
where:
  • H f L is the linear pressure drop in Pa/m;
  • f is the head loss factor;
  • D is the internal diameter of the pipe in m;
  • ρ U 2 2 is the volume kinetic energy of the flow in Pa.
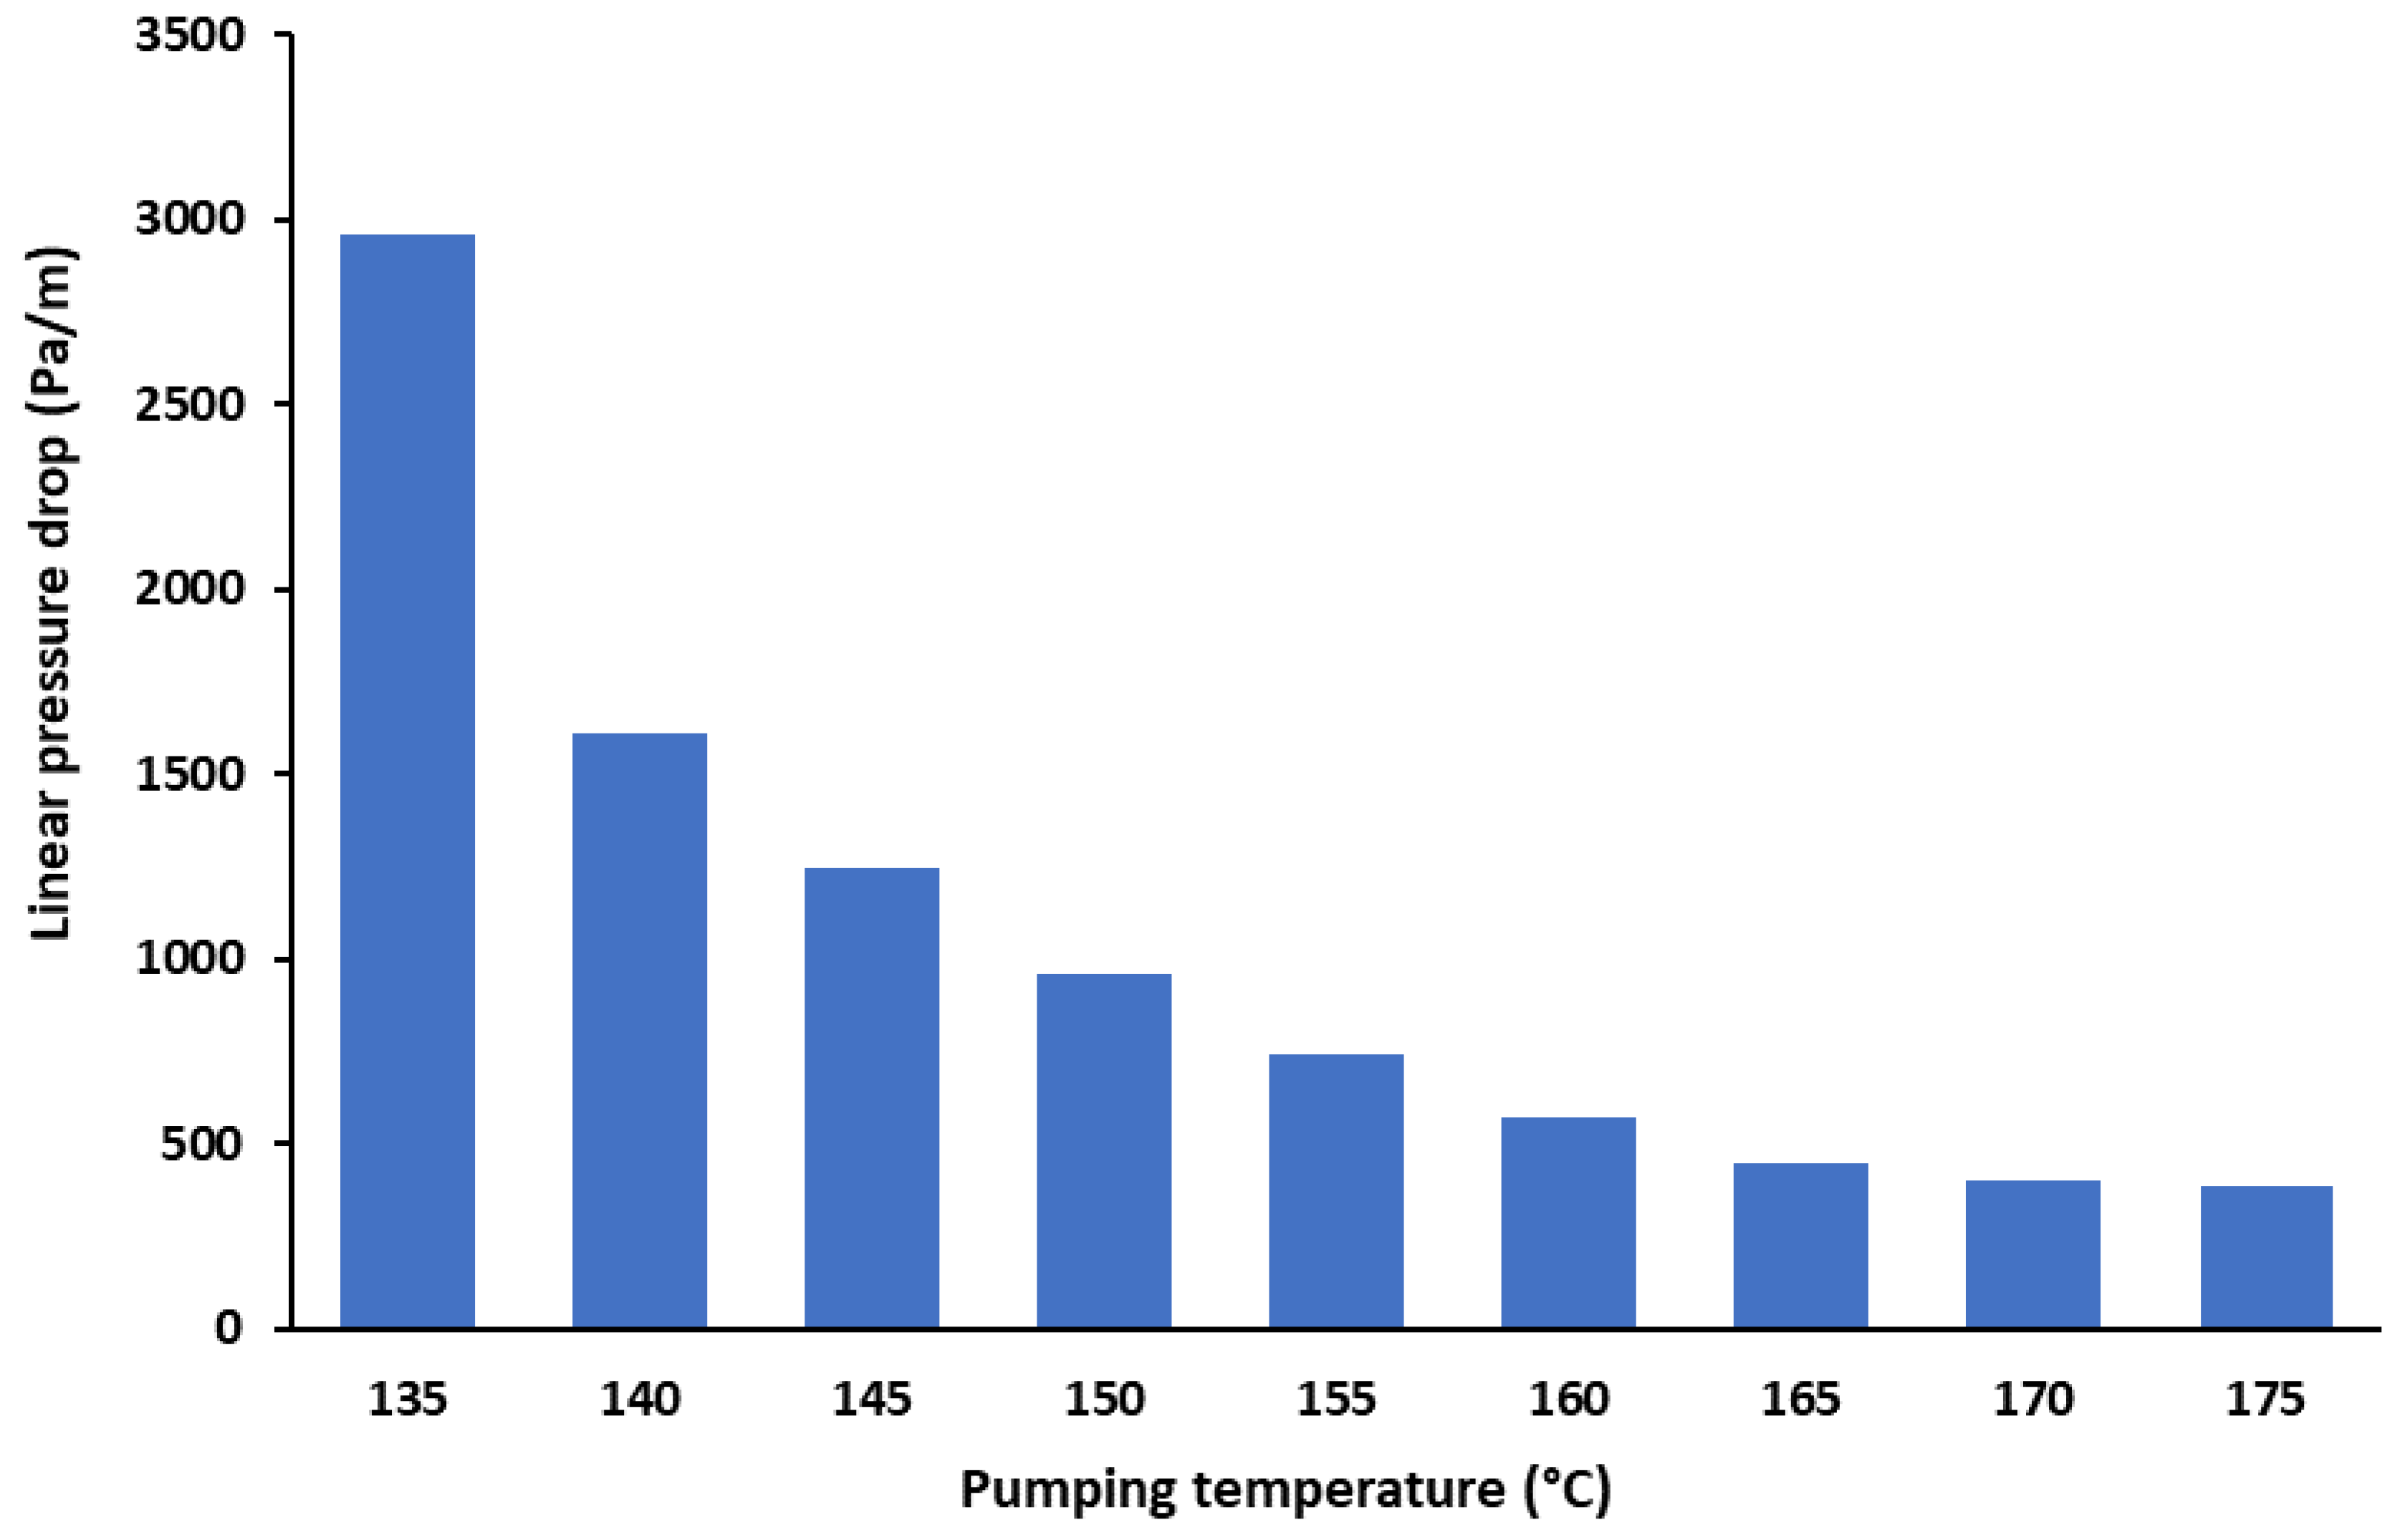
Figure A1. Linear pressure drop as a function of pumping temperature.
Energies 16 00014 g0a1
We can conclude that increasing the pumping temperature decreases the linear pressure drop, and the latter decreases by 87% if we pump bitumen at 175 °C instead of 135 °C. Hence, it is advisable for process managers in bitumen plants to plan bitumen pumping at temperatures that are higher than 150 °C in order to minimize the energy consumed by the pumping operation.

References

  1. Apeaning, R.W. Energy Efficiency and Management in Industries—A Case Study of Ghana’s Largest Industrial Area. Master’s Thesis, Linköping University, Linköping, Sweden, 2012. [Google Scholar]
  2. Turk, M. Substituting Natural Gas with Solar Energy in Industrial Heating Applications—A Multiple Case Study in Italy and Spain. Master’s Thesis, Uppsala University, Uppsala, Sweden, 2021. [Google Scholar]
  3. Arachchige, U.; Wellwaththage, S.R.G. Solar Energy Technology. J. Res. Technol. Eng. 2020, 1, 67–75. [Google Scholar]
  4. Sing, C.K.L.; Lim, J.S.; Walmsley, T.G.; Liew, P.Y.; Goto, M.; Bin Shaikh Salim, S.A.Z. Time-Dependent Integration of Solar Thermal Technology in Industrial Processes. Sustainability 2020, 12, 2322. [Google Scholar] [CrossRef] [Green Version]
  5. Zahraoui, Y.; Basir Khan, M.R.; AlHamrouni, I.; Mekhilef, S.; Ahmed, M. Current Status, Scenario, and Prospective of Renewable Energy in Algeria: A Review. Energies 2021, 14, 2354. [Google Scholar] [CrossRef]
  6. IRENA Coalition for Action. Companies in Transition towards 100% Renewables: Focus on Heating and Cooling; International Renewable Energy Agency: Abu Dhabi, United Arab Emirates, 2021. [Google Scholar]
  7. Shah, H. Integration of Solar Thermal Collectors in the Dairy Industry: A Techno-Economic Assessment. Master’s Thesis, Uppsala University, Uppsala, Sweden, 2021. [Google Scholar]
  8. Fragnito, A.; Bianco, N.; Iasiello, M.; Mauro, G.M.; Mongibello, L. Experimental and numerical analysis of a phase change material-based shell-and-tube heat exchanger for cold thermal energy storage. J. Energy Storage 2022, 56, 105975. [Google Scholar] [CrossRef]
  9. Liu, C.; Yang, H. Multi-objective optimization of a concrete thermal energy storage system based on response surface methodology. Appl. Therm. Eng. 2022, 202, 117847. [Google Scholar] [CrossRef]
  10. Boquera, L.; Castro, J.R.; Pisello, A.L.; Fabiani, C.; D’Alessandro, A.; Ubertini, F.; Cabeza, L.F. Thermo-mechanical stability of supplementary cementitious materials in cement paste to be incorporated in concrete as thermal energy storage material at high temperatures. J. Energy Storage 2022, 54, 105370. [Google Scholar] [CrossRef]
  11. Kempener, R. Solar Heat for Industrial Processes. IEA-ETSAP and IRENA Technology Brief E21. 2015. Available online: etsap.org/web/Supply.asp,www.irena.org/Publications (accessed on 1 December 2022).
  12. Gosselar, J.; Johnson, M. Solar Thermal Energy for Industrial Uses, Issue Brief. Environmental and Energy Study Institute. 2011. Available online: www.eesi.org (accessed on 1 December 2022).
  13. Akar, S.; Kurup, P.; McTigue, J.; Boyd, M. Renewable Thermal Hybridization Framework for Industrial Process Heat Applications. In Proceedings of the 26th Annual SolarPACES Conference, Online, 28 September–2 October 2020. [Google Scholar]
  14. Schweiger, H.; Mendes, J.F.; Benz, N.; Hennecke, K.; Prieto, G.; Cusi, M.; Goncalves, H. The Potential of Solar Heat in Industrial Processes. A State of the Art Review for Spain and Portugal. In Proceedings of the EuroSun, Copenhagen, Denmark, 19–20 June 2000. [Google Scholar]
  15. Sharma, A.K.; Sharma, C.; Mullick, S.C.; Kandpal, T.C. Potential of Solar Energy Utilization for Process Heating in Paper Industry in India: A Preliminary Assessment; Energy Procedia. In Proceedings of the International Conference on Alternative Energy in Developing Countries and Emerging Economies, Bangkok, Thailand, 28–29 May 2015. [Google Scholar]
  16. Al-Hasnawi, H. Solar Heat in Industrial Processes—Integration of Parabolic Trough Solar Collectors in Dairy Plants and Pharmaceutical Plants. Master’s Thesis, Umeå University, Umeå, Sweden, 2016. [Google Scholar]
  17. Sharma, A.K.; Sharma, C.; Mullick, S.C.; Kandpal, T.C. Potential of Solar Industrial Process Heating in Dairy Industry in India and Consequent Carbon Mitigation. J. Clean. Prod. 2017, 140, 714–724. [Google Scholar] [CrossRef]
  18. Allouhi, A.; Agrouaz, Y.; Amine, M.B.; Rehman, S.; Buker, M.S.; Kousksou, T.; Jamil, A.; Benbassou, A. Design optimization of a multi-temperature solar thermal heating system for an industrial process. Appl. Energy 2017, 206, 382–392. [Google Scholar] [CrossRef]
  19. Korkua, S.K.; Khongtong, S.; Ray, P.K.; Thinsurat, K. Cleaner Potential for Natural Rubber Drying Process Using Microwave Technology Powered by Solar Energy. Energies 2022, 15, 6564. [Google Scholar] [CrossRef]
  20. Pérez, C.; Ponce, P.; Meier, A.; Dorantes, L.; Sandoval, J.O.; Palma, J.; Molina, A. S4 Framework for the Integration of Solar Energy Systems in Small and Medium-Sized Manufacturing Companies in Mexico. Energies 2022, 15, 6882. [Google Scholar] [CrossRef]
  21. Ahmed, J.; Kumar, L.; Abbasi, A.F.; El Haj Assad, M. Energy, Exergy, Environmental and Economic Analysis (4e) of a Solar Thermal System for Process Heating in Jamshoro, Pakistan. Energies 2022, 15, 8617. [Google Scholar] [CrossRef]
  22. ESTIF. Solar Industrial Process Heat—State of the Art, Key Issues for Renewable Heat in Europe; ESTIF: Brussels, Belgium, 2006. [Google Scholar]
  23. Farjana, S.H.; Huda, N.; Mahmud, M.A.P.; Saidur, R. Solar process heat in industrial systems—A global review. Renew. Sustain. Energy Rev. 2018, 82, 2270–2286. [Google Scholar] [CrossRef] [Green Version]
  24. Ramaiah, R.; Shekar, K.S.S. Solar Thermal Energy Utilization for Medium Temperature Industrial Process Heat Applications—A Review. In Proceedings of the International Conference on Advances in Manufacturing, Karnataka, India, 2–3 March 2018; IOP Conference Series: Materials, Science, and Engineering; IOP Publishing: Bristol, UK, 2018; Volume 376, p. 012035. [Google Scholar] [CrossRef] [Green Version]
  25. Luminosu, I.; Fara, L. Experimental research on bitumen preheating (fluidization) by using solar energy in passive mode. Int. J. Therm. Sci. 2009, 48, 209–217. [Google Scholar] [CrossRef]
  26. Luminosu, I.V.; De Sabata, C.T.; De Sabata, A.I. Solar Energy Based Industrial Applications at the “Politehnica” University of Timisoara. Thermal Sci. 2011, 15, 587–598. [Google Scholar] [CrossRef]
  27. Benvenuti, C.; Maranzana, M.; Pauletta, S. Bitumen Heating up to 180 °C by the SRB Solar Panel. In Proceedings of the 23rd International Conference on Efficiency, Cost, Optimization, Simulation and Environmental Impact of Energy Systems, Lausanne, Switzerland, 14–17 June 2010; Favrat, D., Maréchal, F., Eds.; CreateSpace: Scotts Valley, CA, USA, 2011. [Google Scholar]
  28. Ship Plants. Available online: http://ship-plants.info/solar-thermal-plants (accessed on 1 December 2022).
  29. Ghazouani, M.; Bouya, M.; Benaissa, M.; Anoune, K.; Ghazi, M. Thermal energy management optimization of solar thermal energy system based on small parabolic trough collectors for bitumen maintaining on heat process. Sol. Energy 2020, 211, 1403–1421. [Google Scholar] [CrossRef]
  30. Abdulkadir, I.; Alhasssan, H. Impact of Climate Change on Rheological Properties of Bitumen. Open J. Civ. Eng. 2020, 10, 93–104. [Google Scholar] [CrossRef] [Green Version]
  31. Brown, S.F. Creep of Bituminous Aggregates. In Encyclopedia of Materials: Science and Technology; Buschow, K.H.J., Cahn, R.W., Flemings, M.C., Ilschner, B., Kramer, E.J., Mahajan, S., Veyssière, P., Eds.; Elsevier: Amsterdam, The Netherlands, 2001; pp. 1795–1796. [Google Scholar] [CrossRef]
  32. Merbouh, M. Effect of thermal cycling on the creep-recovery behavior of road bitumen. Energy Procedia 2012, 18, 1106–1114. [Google Scholar] [CrossRef] [Green Version]
  33. Glaoui, B.; Merbouh, M.; Ven, M.; Chialleux, E.; Youcefi, A. How Thermal Fatigue Cycles Change the Rheological Behavior of Polymer-Modified Bitumen. Energy Procedia 2013, 36, 844–851, In Proceedings of the TerraGreen 13 International Conference 2013—Advancements in Renewable Energy and Clean Envi-ronment, Beirut, Lebanon, 15–17 February 2013. [Google Scholar] [CrossRef] [Green Version]
  34. Tahri, A.; Bouya, M.; Ghazouani, M.; Achak, O.; Chafik, T. Methodology for Efficient Bitumen Storage with Reduced Energy Consumption. Appl. Sci. 2021, 11, 9319. [Google Scholar] [CrossRef]
  35. Ghazouani, M.; Bouya, M.; Benaissa, M. Thermo-Economic and Exergy Analysis and Optimization of Small PTC Collectors for Solar Heat Integration in Industrial Processes. Renew. Energy 2020, 152, 984–998. [Google Scholar] [CrossRef]
  36. Articsolar. Available online: https://articsolar.com (accessed on 1 December 2022).
  37. Weather Spark. Available online: https://fr.weatherspark.com (accessed on 1 December 2022).
  38. Lombardi, B.; Kazziha, S. Bitume.Info: Aménager, Construire, Innover; Special Issue-1; Groupement Professionnel des Bitumes (GPB): Paris, France, 2005; p. 33. [Google Scholar]
  39. Błażejowski, K.; Olszacki, J.; Peciakowski, H. Bitumen Handbook, 6th ed.; ORLEN Asfalt: Płock, Poland, 2014. [Google Scholar]
  40. EN 12607-1:2014; Bitumen and Bituminous Binders—Determination of the Resistance to Hardening under the Influence of Heat and Air. European Committee for Standardization: Brussels, Belgium, 2014. Available online: https://standards.iteh.ai/catalog/standards/cen/5e1f0c0a-99bc-4c99-a191-cf07c1482527/en-12607-1-2014 (accessed on 1 December 2022).
  41. EN 14769:2013; Bitumen and Bituminous Binders—Accelerated Long-Term Ageing Simulated by a Pressure Ageing Vessel (PAV), AFNOR, France. European Committee for Standardization: Brussels, Belgium, 2013. Available online: https://infostore.saiglobal.com/en-au/standards/nf-en-14769-2013-36667_saig_afnor_afnor_82014/ (accessed on 1 December 2022).
  42. EN 1426:2015; Bitumen and Bituminous Binders—Determination of Needle Penetration. European Committee for Standardization: Brussels, Belgium, 2015. Available online: https://standards.iteh.ai/catalog/standards/cen/853455a7-1455-4f3e-a2b8-60d17bfdf3df/en-1426-2015 (accessed on 1 December 2022).
  43. EN 1427:2015; Bitumen and Bituminous Binders—Determination of the Softening Point. Ring and Ball Method. European Committee for Standardization: Brussels, Belgium, 2015. Available online: https://standards.iteh.ai/catalog/standards/cen/0edd2612-e3e1-43b4-b533-8debe5c55040/en-1427-2015 (accessed on 1 December 2022).
  44. Petersen, J.C.; Glacer, R. Asphalt oxidation mechanisms and the role of oxidation products on age hardening revisited. Road Mater. Pavement Des. 2011, 12, 795–819. [Google Scholar] [CrossRef]
  45. American Association of State Highway and Transportation Officials. AASHTO T 315. Determining the Rheological Properties of Asphalt Binder Using a Dynamic Shear Rheometer (DSR); American Association of State Highway and Transportation Officials: Washington, DC, USA, 2012. [Google Scholar]
  46. Anoune, K.; Laknizi, A.; Bouya, M.; Astito, A.; Ben Abdellah, A. Sizing a PV-Wind hybrid system using deterministic approach. Energy Convers. Manag. 2018, 169, 137–148. [Google Scholar] [CrossRef]
  47. Institut Français des Sciences et Techniques des Réseaux, de l’Aménagement et des Transports (IFSTTAR). French MLPC Method, No. 69 for Binders: Identification et Dosage des Fonctions Oxygénées Présentes dans les Liants Bitumineux—Analyse par Spectrométrie Infrarouge à Transformée de Fourier. 2010. Available online: https://www.ifsttar.fr/fileadmin/user_upload/editions/lcpc/MethodeDEssai/MethodeDEssai-LCPC-ME69.pdf (accessed on 1 December 2022).
  48. Lu, X.; Isacsson, U. Effect of ageing on bitumen chemistry and rheology. Constr. Build. Mater. 2002, 16, 15–22. [Google Scholar] [CrossRef]
  49. Liu, Q.; Wu, J.; Qu, X.; Wang, C.; Oeser, M. Investigation of Bitumen Rheological Properties Measured at Different Rheometer Gap Sizes. Constr. Build. Mater. 2020, 265, 120287. [Google Scholar] [CrossRef]
  50. Gao, Y.; Zhang, Y.; Omairey, E.L.; Al-Malaika, S.; Sheena, H. Influence of Anti-ageing Compounds on Rheological Properties of Bitumen. J. Clean. Prod. 2021, 318, 128559. [Google Scholar] [CrossRef]
  51. Wang, C.; Wang, P.; Li, Y.; Zhao, Y. Laboratory Investigation of Dynamic Rheological Properties of Tourmaline Modified Bitumen. Constr. Build. Mater. 2015, 80, 195–199. [Google Scholar] [CrossRef]
  52. Liley, C. Rutting: Causes, Prevention, and Repairs; Illinois Asphalt Pavement Association: Springfield, IL, USA, 2018. [Google Scholar]
  53. Moe, A.L.; Lee, Y.P.K.; Ho, N.Y.; Wang, X. Rutting and Cracking Performance of Asphalt Concrete Incorporating Plastic Waste and Crumb Rubber. In Road and Airfield Pavement Technology. In Proceedings of the 12th International Conference on Road and Airfield Pavement Technology, Colombo, Sri Lanka, 14–16 July 2021. [Google Scholar] [CrossRef]
  54. Ge, D.; Chen, S.; You, Z.; Yang, X.; Yao, H.; Ye, M.; Yap, Y.K. Correlation of DSR Results and FTIR’s Carbonyl and Sulfoxide Indexes: Effect of Aging Temperature on Asphalt Rheology. J. Mater. Civ. Eng. 2019, 31, 04019115. [Google Scholar] [CrossRef]
  55. EN 15326:2007; Bituminous Binders—Measurement of Density and Specific Gravity Capillary-Stoppered Pyknometer Method. European Committee for Standardization: Brussels, Belgium, 2007.
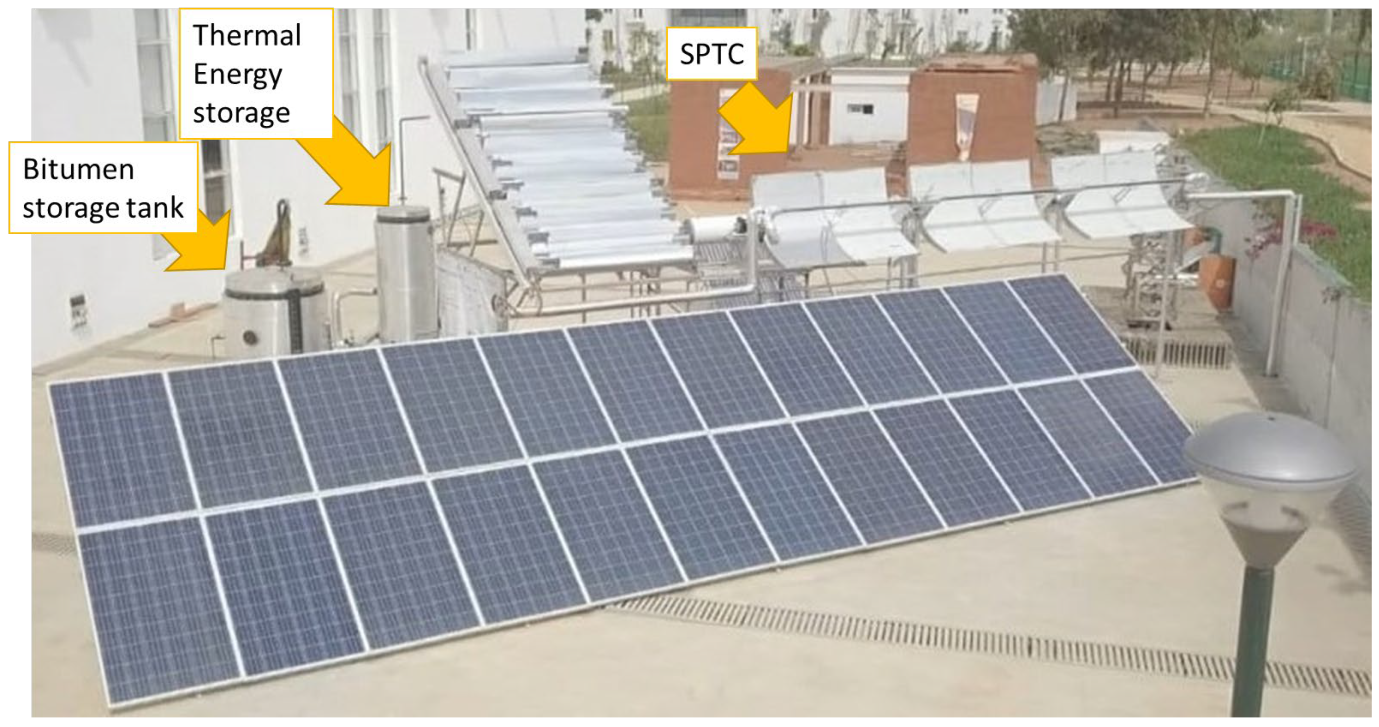
Figure 1. Experimental setup of the industrial process plant at the UIR campus.
Energies 16 00014 g001
Figure 2. Piping and instrumentation diagram of the one-ton prototype.
Energies 16 00014 g002
Figure 3. XCPC collector evacuated tube.
Energies 16 00014 g003
Figure 4. Parabolic trough collector.
Energies 16 00014 g004
Figure 5. Sun hours in Rabat, Morocco, during the year 2021 [37].
Energies 16 00014 g005
Figure 6. Bitumen viscosity variation as a function of temperature [38].
Energies 16 00014 g006
Figure 7. Average of daily radiation (left) and ambient temperature (right) of the location of the solar implant during June 2021.
Energies 16 00014 g007
Figure 8. Heat loss power to maintain the tank at a temperature of 150 °C, depending on the ambient temperature.
Energies 16 00014 g008
Figure 9. Evolution of temperature upstream and downstream of the XCPC solar field for one day.
Energies 16 00014 g009
Figure 10. Evolution of the power supplied by the XCPC solar field vs. the bitumen tank heat loss.
Energies 16 00014 g010
Figure 11. Evolution of temperature upstream and downstream of the PTC solar field for one day.
Energies 16 00014 g011
Figure 12. Evolution of the power supplied by the PTC solar field vs. the bitumen tank heat loss.
Energies 16 00014 g012
Figure 13. The measured energy flow from the PV panel (6.24 kWp) [46].
Energies 16 00014 g013
Figure 14. Penetration results of all samples at every aging stage.
Energies 16 00014 g014
Figure 15. Softening point results of all samples at every aging stage.
Energies 16 00014 g015
Figure 16. FTIR spectra of all samples at the unaged stage.
Energies 16 00014 g016
Figure 17. FTIR spectra of all samples at the PAV-aged stage.
Energies 16 00014 g017
Figure 18. Carbonyl index results at the unaged and PAV-aged stages.
Energies 16 00014 g018
Figure 19. Sulfoxide index results at the unaged and PAV-aged stages.
Energies 16 00014 g019
Figure 20. Complex modulus and phase angle under different temperatures at the unaged stage.
Energies 16 00014 g020
Figure 21. Complex modulus and phase angle under different temperatures at the RTFOT-aged stage.
Energies 16 00014 g021
Figure 22. Complex modulus and phase angle under different temperatures at the PAV-aged stage.
Energies 16 00014 g022
Figure 23. Rutting factor (|G*|/sin(δ)) at the unaged stage under different temperatures.
Energies 16 00014 g023
Figure 24. Rutting factor (|G*|/sin(δ)) at the RTFOT-aged stage under different temperatures.
Energies 16 00014 g024
Figure 25. Pass/fail temperature of all samples at the RTFOT-aged stage.
Energies 16 00014 g025
Figure 26. Fatigue cracking factor (|G*|sin(δ)) at the PAV-aged stage under different temperatures.
Energies 16 00014 g026
Figure 27. Pass/fail temperatures of all samples at the PAV-aged stage.
Energies 16 00014 g027
Table 1. Number of cycles for every temperature range/duration.
Temperature RangeΔT aNumber of Cycles
One MonthTwo MonthsThree Months
135–155 °C20 °C306090
135–165 °C30 °C204060
135–175 °C40 °C153045
a ΔT = Tmax − Tmin.
Table 2. Absorption wavenumbers of functional groups.
Functional GroupBond VibrationAbsorption Wave Number (cm−1)
CarbonylsC=O stretching1740–1690
Aliphatic structures (Methyl)CH3 asymmetric bending1460
Branched aliphatic structures (Methylene)CH3 symmetric bending1375
SulfoxidesS=O stretching1055–1030
Table 3. Repeatability of dynamic shear results.
ConditionAcceptable Range of Two Test Results (d2s%)
Original Binder: G*/sinδ (kPa)6.4
RTFO Residue: G*/sinδ (kPa)9.0
PAV Residue: G*·sinδ (kPa)13.8
Disclaimer/Publisher’s Note: The statements, opinions and data contained in all publications are solely those of the individual author(s) and contributor(s) and not of MDPI and/or the editor(s). MDPI and/or the editor(s) disclaim responsibility for any injury to people or property resulting from any ideas, methods, instructions or products referred to in the content.