


Abstract
SOx and NOx emissions originating from the combustion of fuels during the operation of industrial boilers are one of the primary contributors to regional and local air pollution, which have major effects on human well-being and ecosystems. As governmental bodies attempt to regulate and enforce emission norms, the industries operating the boilers are presented with an opportunity to optimise their fuel mix configurations to achieve a reduction in SOx, NOx, and CO2 emissions while ensuring the financial sustainability of plant operations. In this study, a System Dynamic simulation model is constructed from the perspective of an individual plant to facilitate the analysis of SOx, NOx, and CO2 emissions and the expenditure incurred through energy use and pollution control systems under different fuel-mix configurations, market conditions, and policy scenarios. The model facilitates the identification of alternative fuel-mix configurations to replace existing single-fuel firing systems while also reducing both emissions and expenditure. To demonstrate the model, exemplar data based on prevalent market and policy conditions in India are used to identify alternative fuel-mixes for typical 40TPH boiler. The experiments additionally highlight the significance of having an appropriate penalty or tax on emissions to foster compliance with emission norms in the industry without adversely impacting their financial sustainability.
1. Introduction
Industrial boilers are closed vessels in which liquids such as water are heated to generate vapour or steam, which is then utilised in various physiochemical processes. For supplying the required thermal energy for the conversion of liquid into vapour, fuels such as coal, natural gas, fuel oil, etc. are combusted through a fuel burner system attached to the boiler. The combustion of these fuels leads to generation of several compounds including carbon-di-oxide (CO2), Nitrous Oxides (NOX), and Sulphur Oxides (SOX), which have an adverse impact on the environment either through the greenhouse effect or through acid rain. Industrial boilers with their fuel combustion system are one of the leading sources of anthropogenic SOx and NOx emissions. As a result of which, governmental bodies across the globe have been introducing norms and penalties to persuade industries to take measures for reducing SOx and NOx emissions. Developing countries such as China and India have introduced new norms for restricting SOx and NOx emissions to 100 mg/NM3 in 2012 and 2015 respectively [1,2]. As the new norms are being enforced across the various industrial domains, the plants are exploring various mitigation strategies to meet the emission standards including Flue Gas Desulphurisation (FGD) systems and Selective Non-Catalytic Reduction (SNCR) systems. As the majority of these emissions in the plants are from the combustion of fuels in the fuel burner system, the amount of emissions varies depending on the fuel used. Typically, the majority of the burner systems are designed to utilise a single type of fuel, but they can be upgraded to a multi-fuel burner system which allows them to combust multiple fuels simultaneously. This presents the plants with an opportunity to choose a fuel mix to optimise their SOx, NOx, and CO2 emissions, thereby improving their compliance with local emission norms as well as financial sustainability. While there are existing calculation methods to determine the spot SOx emissions for different fuel mixes, many firing systems attached to boilers continue to operate on a single fuel, typically coal in developing countries such as India and China. As an alternative, simulation, modelling can be employed to determine the cumulative performance of various fuel mixes, both in terms of emission reduction and plant expenditure, which could act as an effective decision-making tool for the plant stakeholders. Such a tool could enable the stakeholders to quickly determine the performance of different fuel mixes specific to their plant and the local market conditions and compare them to choose the optimal option that would aid them to comply with emission norms while ensuring the financial sustainability of the pathway.
The benefits of co-firing systems has been previously explored in studies such as by Milićević et al. [3], in which the SOx and NOx emissions are analysed when co-firing coal and biomass, with 10% of thermal energy derived from biomass. Wils et al. [4] studied the improvement in fuel-side costs when co-firing woody biomass alongside coal, in which it was determined that co-firing could lead to a sizeable reduction in plant expenditure on fuels. McIlveen-Wright et al. [5] assessed the reduction of CO2 emissions when co-firing biomass with coal, as well as the associated economic benefits under various carbon trading schemes. Lintunen et al. [6] studied the impact of subsidy policies on biomass as a co-combustion fuel in the electricity sector. While the aforementioned studies analyse the effects of co-firing systems under specific conditions, the findings are not universally applicable to all the plants operating a boiler due to differences in boiler size, fuel characteristics and availability, local market tariffs, and policy conditions. As such, there is a utilitarian need for a decision support tool that would assist the plant stakeholders to assess the long-term impacts of using various combinations of fuel-mix under varying market and policy conditions on cumulative emissions (SOx, NOx, and CO2) and as well as the plant expenditure.
System Dynamics (SD) is a computer-aided simulation modelling technique, which is suitable for studying the long-term consequences of decision-making related to fuel-mix choice and emission compliance in holistic systems with complex interconnections and cause-and-effect relationships between the various parameters within the system [7]. In the domain of electricity generation, Mwanza and Ulgen [8] have utilised the SD approach to determine the optimal electricity generation mix in Zambia based on parameters such as CO2 emissions, air pollution reduction, capital expenditure, etc. Similarly, the impact of the electricity generation mix in captive power plants in the cement domain was explored using the SD modelling approach [7]. Romagnoli et al. [9] utilised the SD approach to determine the impact of replacing a portion of fossil fuels used for district heating in Latvia with biomass sourced locally in terms of CO2 emissions and expenditure under various policy schemes. Pamik et al. [10] studied the impact of various SOx and NOx emission reduction technologies applicable to marine diesel engines using the SD modelling approach.
Taking into consideration the above-mentioned gaps, the following study aims to utilise the SD modelling approach to build a simulation model to aid in determining the optimal fuel mix for individual boiler and fuel-burner systems to improve emission compliance while minimising expenditure from the perspective of plant stakeholders. The study also aims to build the model targeting individual plants that are operating a boiler since the fuel availability and tariffs of raw materials in the local markets varies from plant to plant. Additionally, the model aims to allow policymakers to determine appropriate penalties for non-compliant industrial plants while ensuring the cost of compliance through either optimising fuel-mix or implementing emission reduction systems such as FGD and SNCR is lower than the afflicted penalties. This would be relevant in countries such as India where the penalties for non-compliance are significantly lower than the cost of compliance [11].
2. Methodology
For achieving the objectives described in the previous section, an SD model would be built encompassing three additional sub-modules focusing on SOx, NOx, and CO2 emissions respectively, which are further described in Section 2.1 and Section 2.2. The SD models are typically represented in either Causal Loop Diagrams (CLD) or stock-and-flow diagrams. The causal loop diagrams consist of varying combinations of reinforcing and corrective loops which facilitate the description of complex systems with interrelated variables and the causal relationships between them. The stock-and-flow diagrams are the integral equations that are used to represent the accumulation and movement of resources between the various entities of a complex system over a period of time.
2.1. Model Conceptualisation
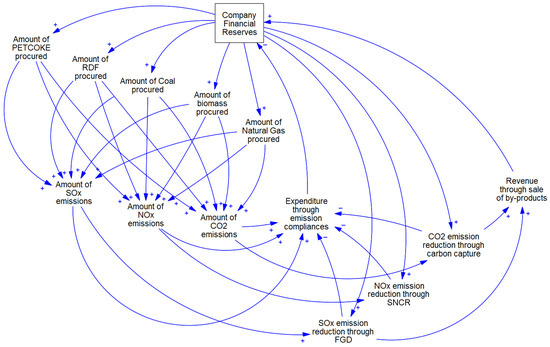
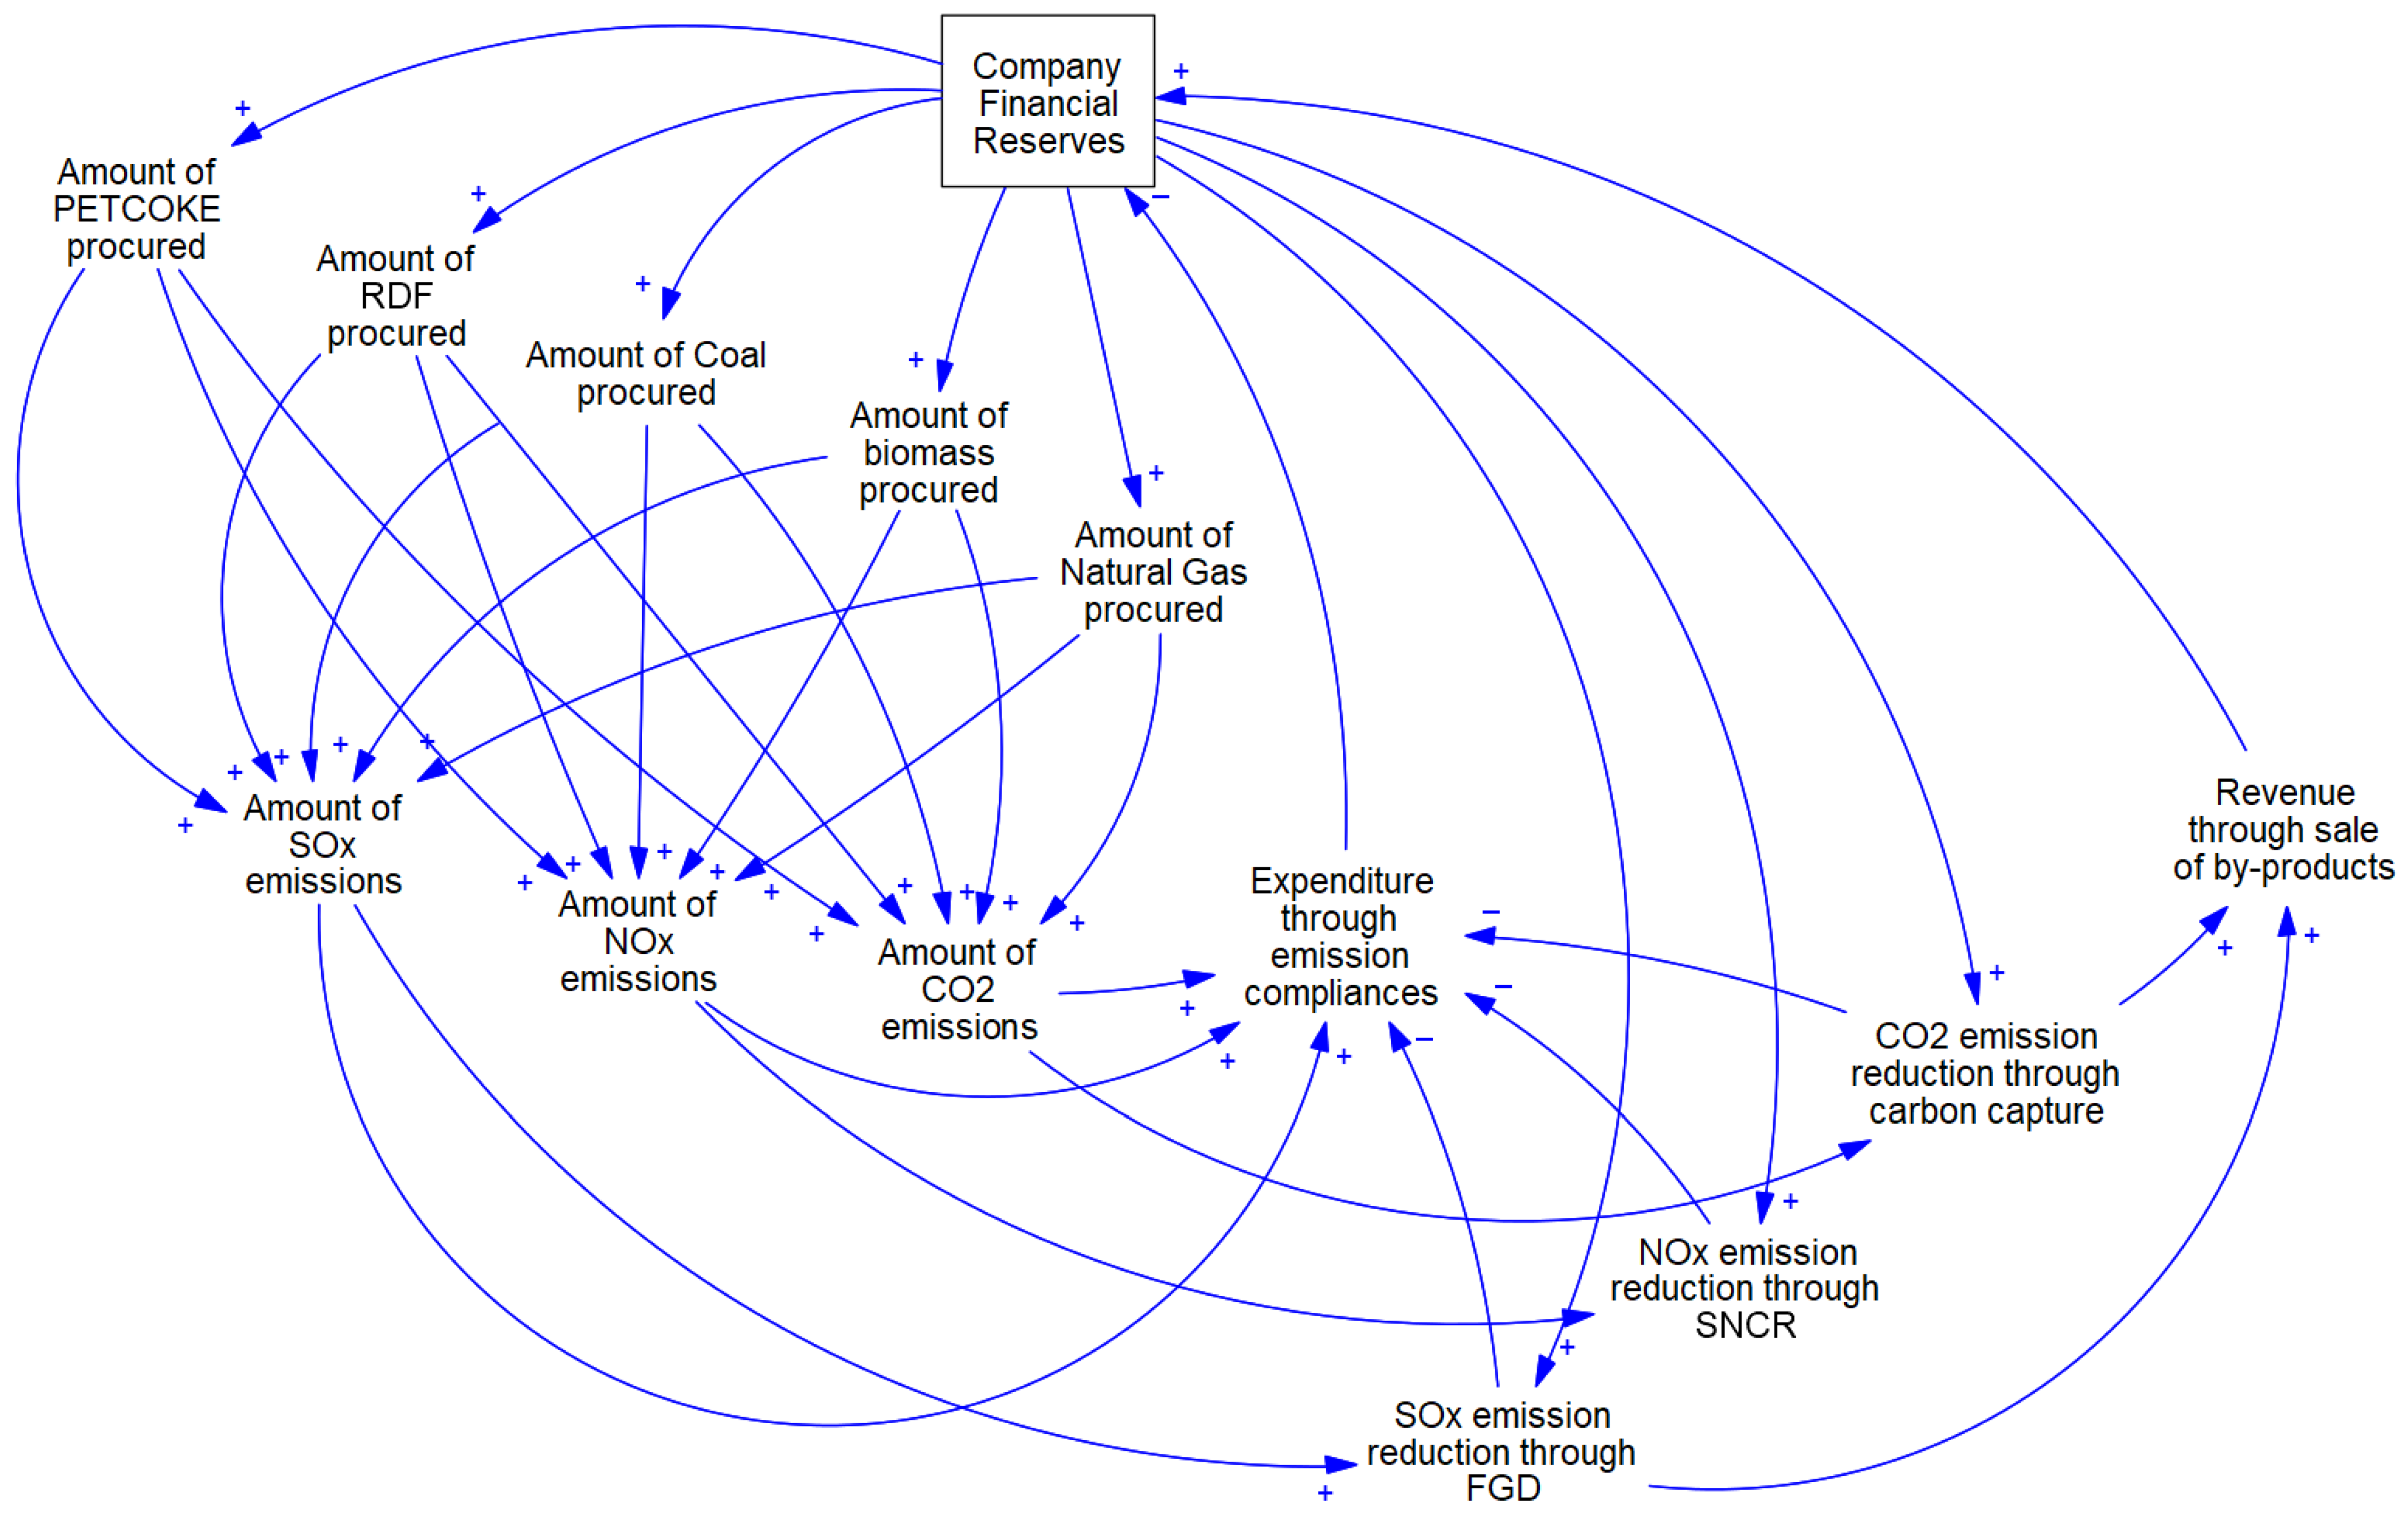
The emissions from the burner system are dependent on the type of fuel mix utilised for meeting the thermal energy requirement of the boiler for converting liquid to vapour. The SOx emissions are calculated on the basis of the sulphur content of the fuel, which further varies depending on the procurement source. The calculation of NOx emissions is more nuanced as it depends on multiple factors, such as (i) the nitrogen content of the fuel mix and (ii) the chemical formation of NO in the boiler from nitrogen and oxygen present in the air at temperatures over 1400 °C [12]. The carbon emissions are calculated on the basis of the carbon intensity of the fuel, i.e., the amount of CO2 generated per unit of fuel combusted. Figure 1 depicts the causal loop diagram of the proposed model, in which the plant would procure the raw materials needed for the fuel mix depending on the available financial reserves, from which the amount of SOx, NOx, and CO2 emissions are calculated. Depending on the calculated emissions, the expenditure through emission compliances is calculated based on the (i) penalties incurred due to excess emissions released over permissible limits and (ii) capital and operational costs incurred through the use of pollution control systems such as FGD, SNCR, and carbon capture. Additionally, the revenue through the sale of by-products generated during the process of FGD and carbon capture systems is appended back into the available plant financial reserves, thus completing the feedback loop.
Figure 1.
CLD of the proposed model.
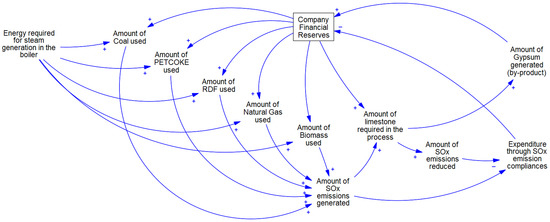
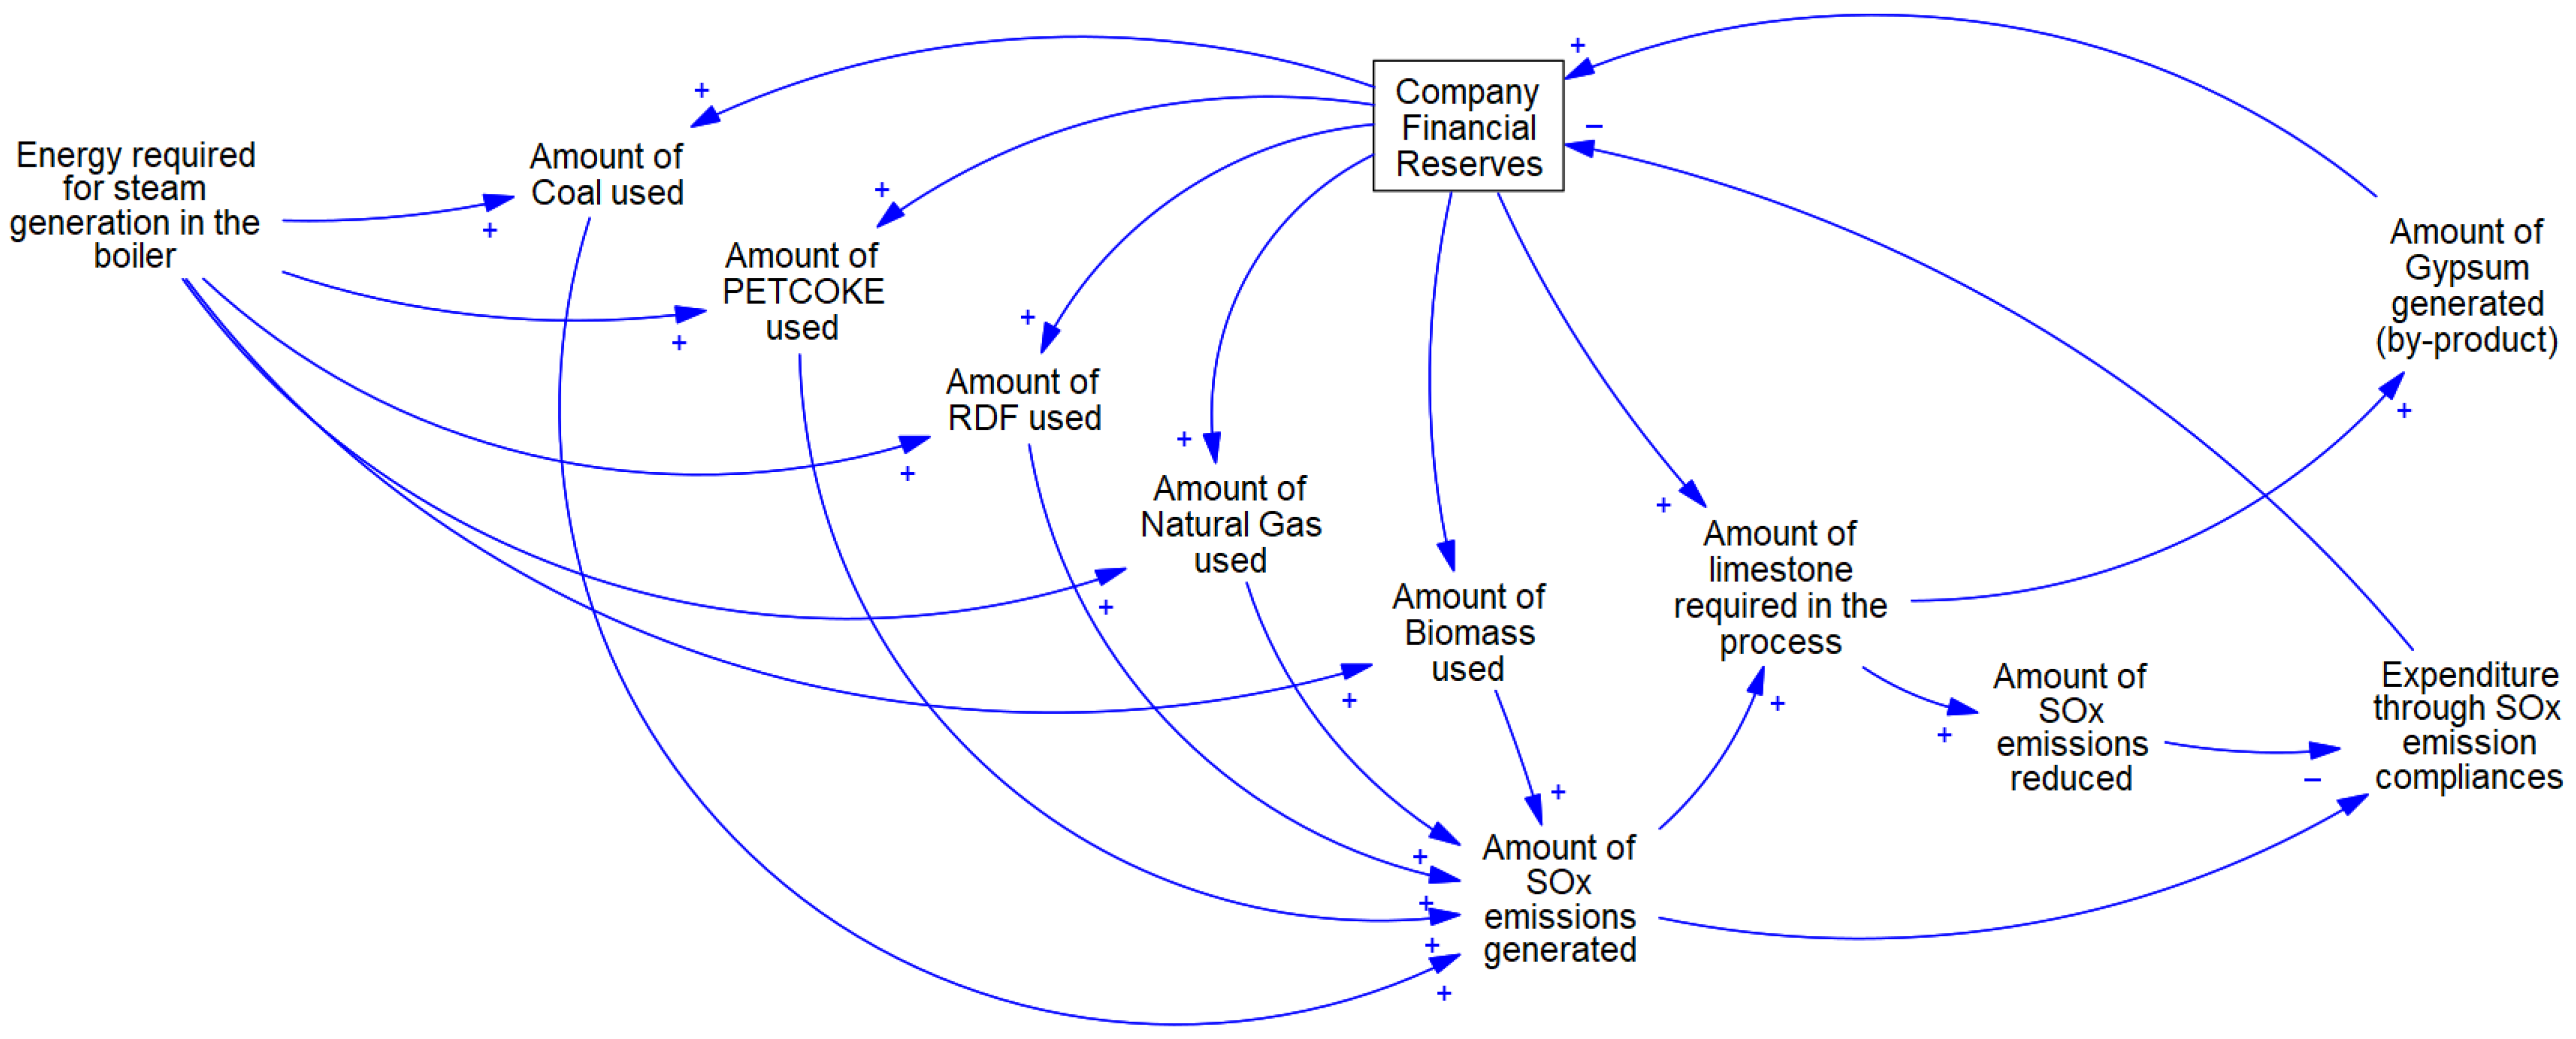
The CLD of the FGD system is depicted in Figure 2, in which the SOx emissions are calculated on the basis of sulphur content in the fuel used and the amount of thermal energy required for the operation of the boiler. The dry FGD process featured in this module utilises limestone to convert SOx into Gypsum as shown in Equations (1)–(3). In this process, Gypsum is generated as a by-product that could be sold in the local markets for generating additional income for the plant.
CaCO3(s) + SO2(g) → CaSO3(s) + CO2(g)
Ca(OH)2(s) + SO2(g) → CaSO3(s) + H2O(l)
CaSO3(aq) + 2H2O(l) + ½O2(g) → CaSO4·2H2O(s) (Gypsum)
Figure 2.
CLD of the Flue Gas Desulphurisation Module for SOx emission reduction.
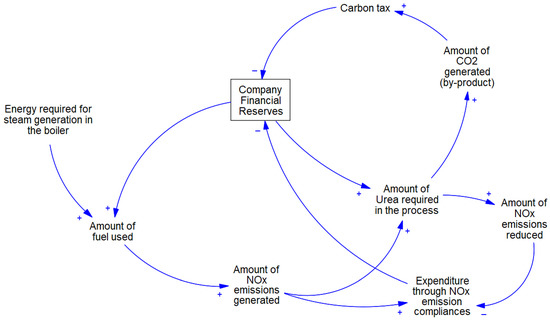
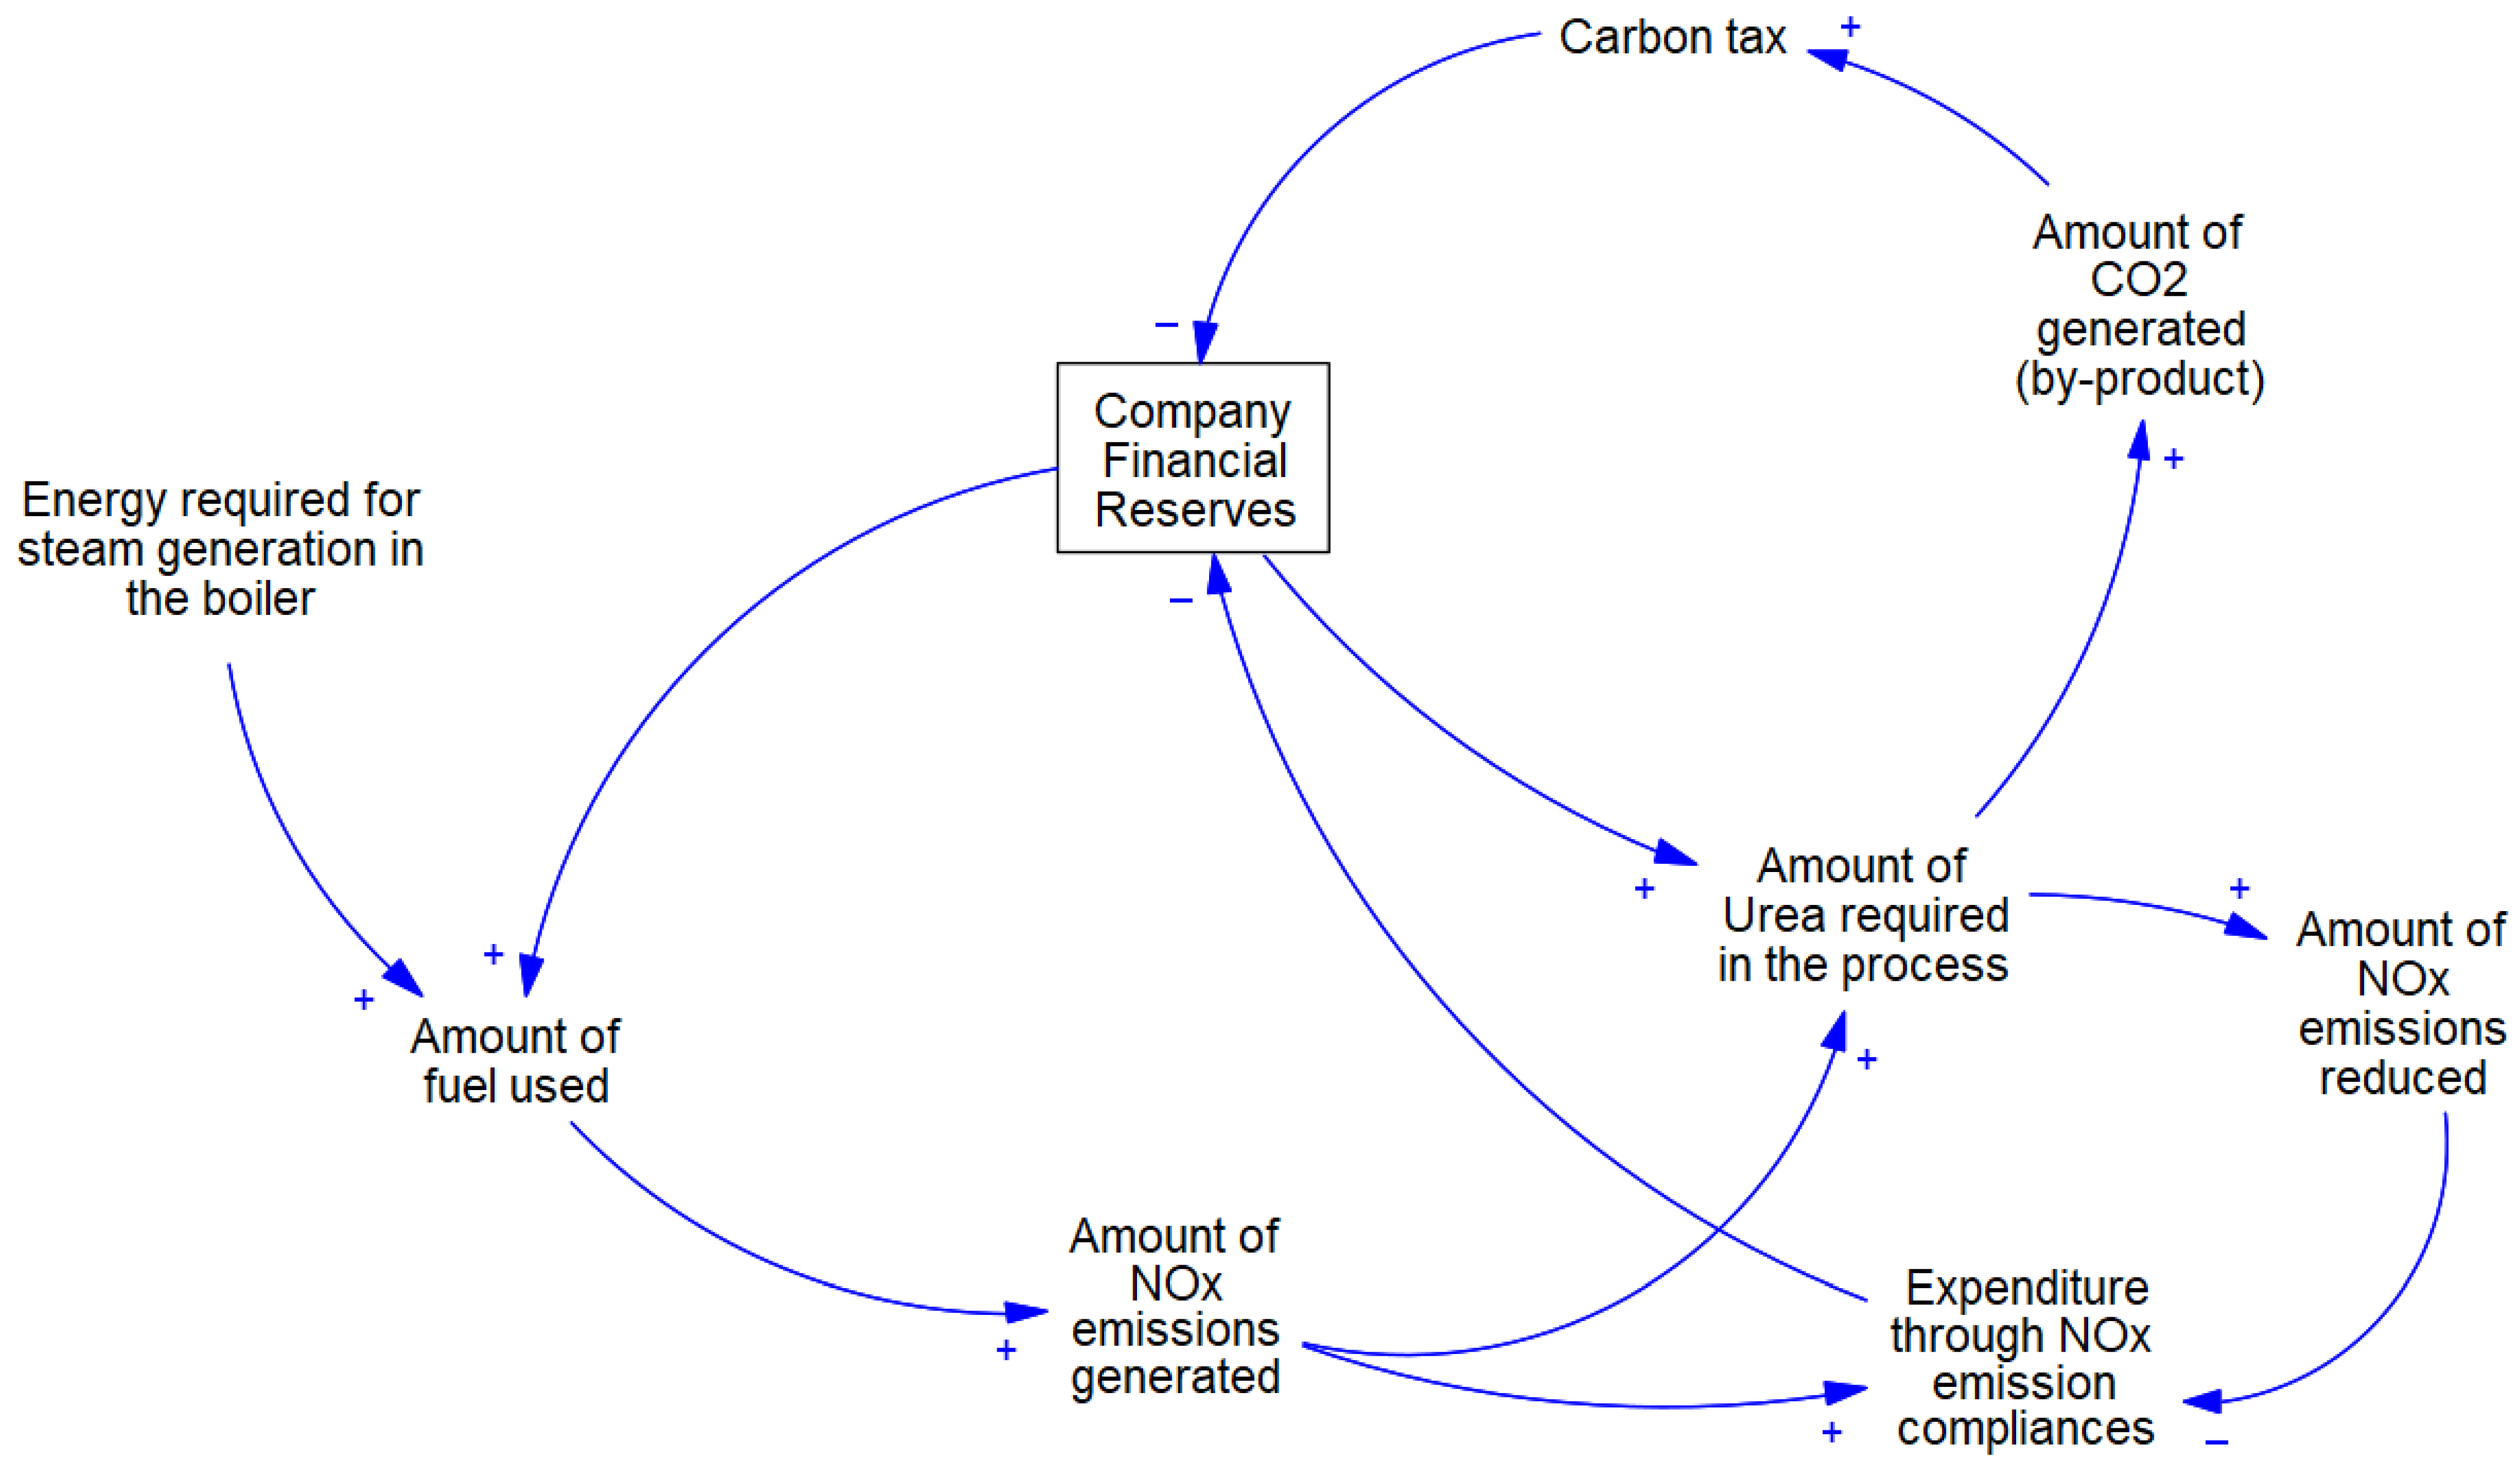
The CLD of the SNCR system is depicted in Figure 3, in which the NOx emissions in weight is determined on the basis of existing plant readings and the amount of fuel used in the burner system (for the calculation of the volume of flue gas generated).
Figure 3.
CLD of the Selective Non-Catalytic Reduction Module for NOx emission reduction.
The SNCR process featured in this module utilises Urea as a reactant that is injected into the boiler at a specific location depending on the temperature. It results in a chemical redox reaction in which Nitrous Oxide is converted into Nitrogen with CO2 released as a by-product, as depicted in Equations (4) and (5). In this module, the amount of Urea required in the plant is calculated using stochiometric analysis, which depends on the amount of NOx emissions that are to be reduced. Similarly, the amount of CO2 released as a by-product is also calculated. The additional CO2 generated as a by-product would then be utilised for calculating any applicable carbon tax, which then impacts the available financial reserves of the plant, thereby completing the loop.
2NO(g) + CO(NH2)2(s) + 1/2O2(g) → 2N2(g) + CO2(g) + 2H2O(l)
2NO2(g) + 2CO(NH2)2(s) +O2(g) → 3N2(g) + 2CO2(g) + 4H2O(l)
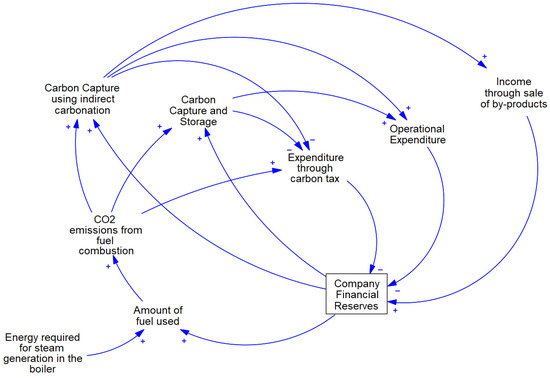
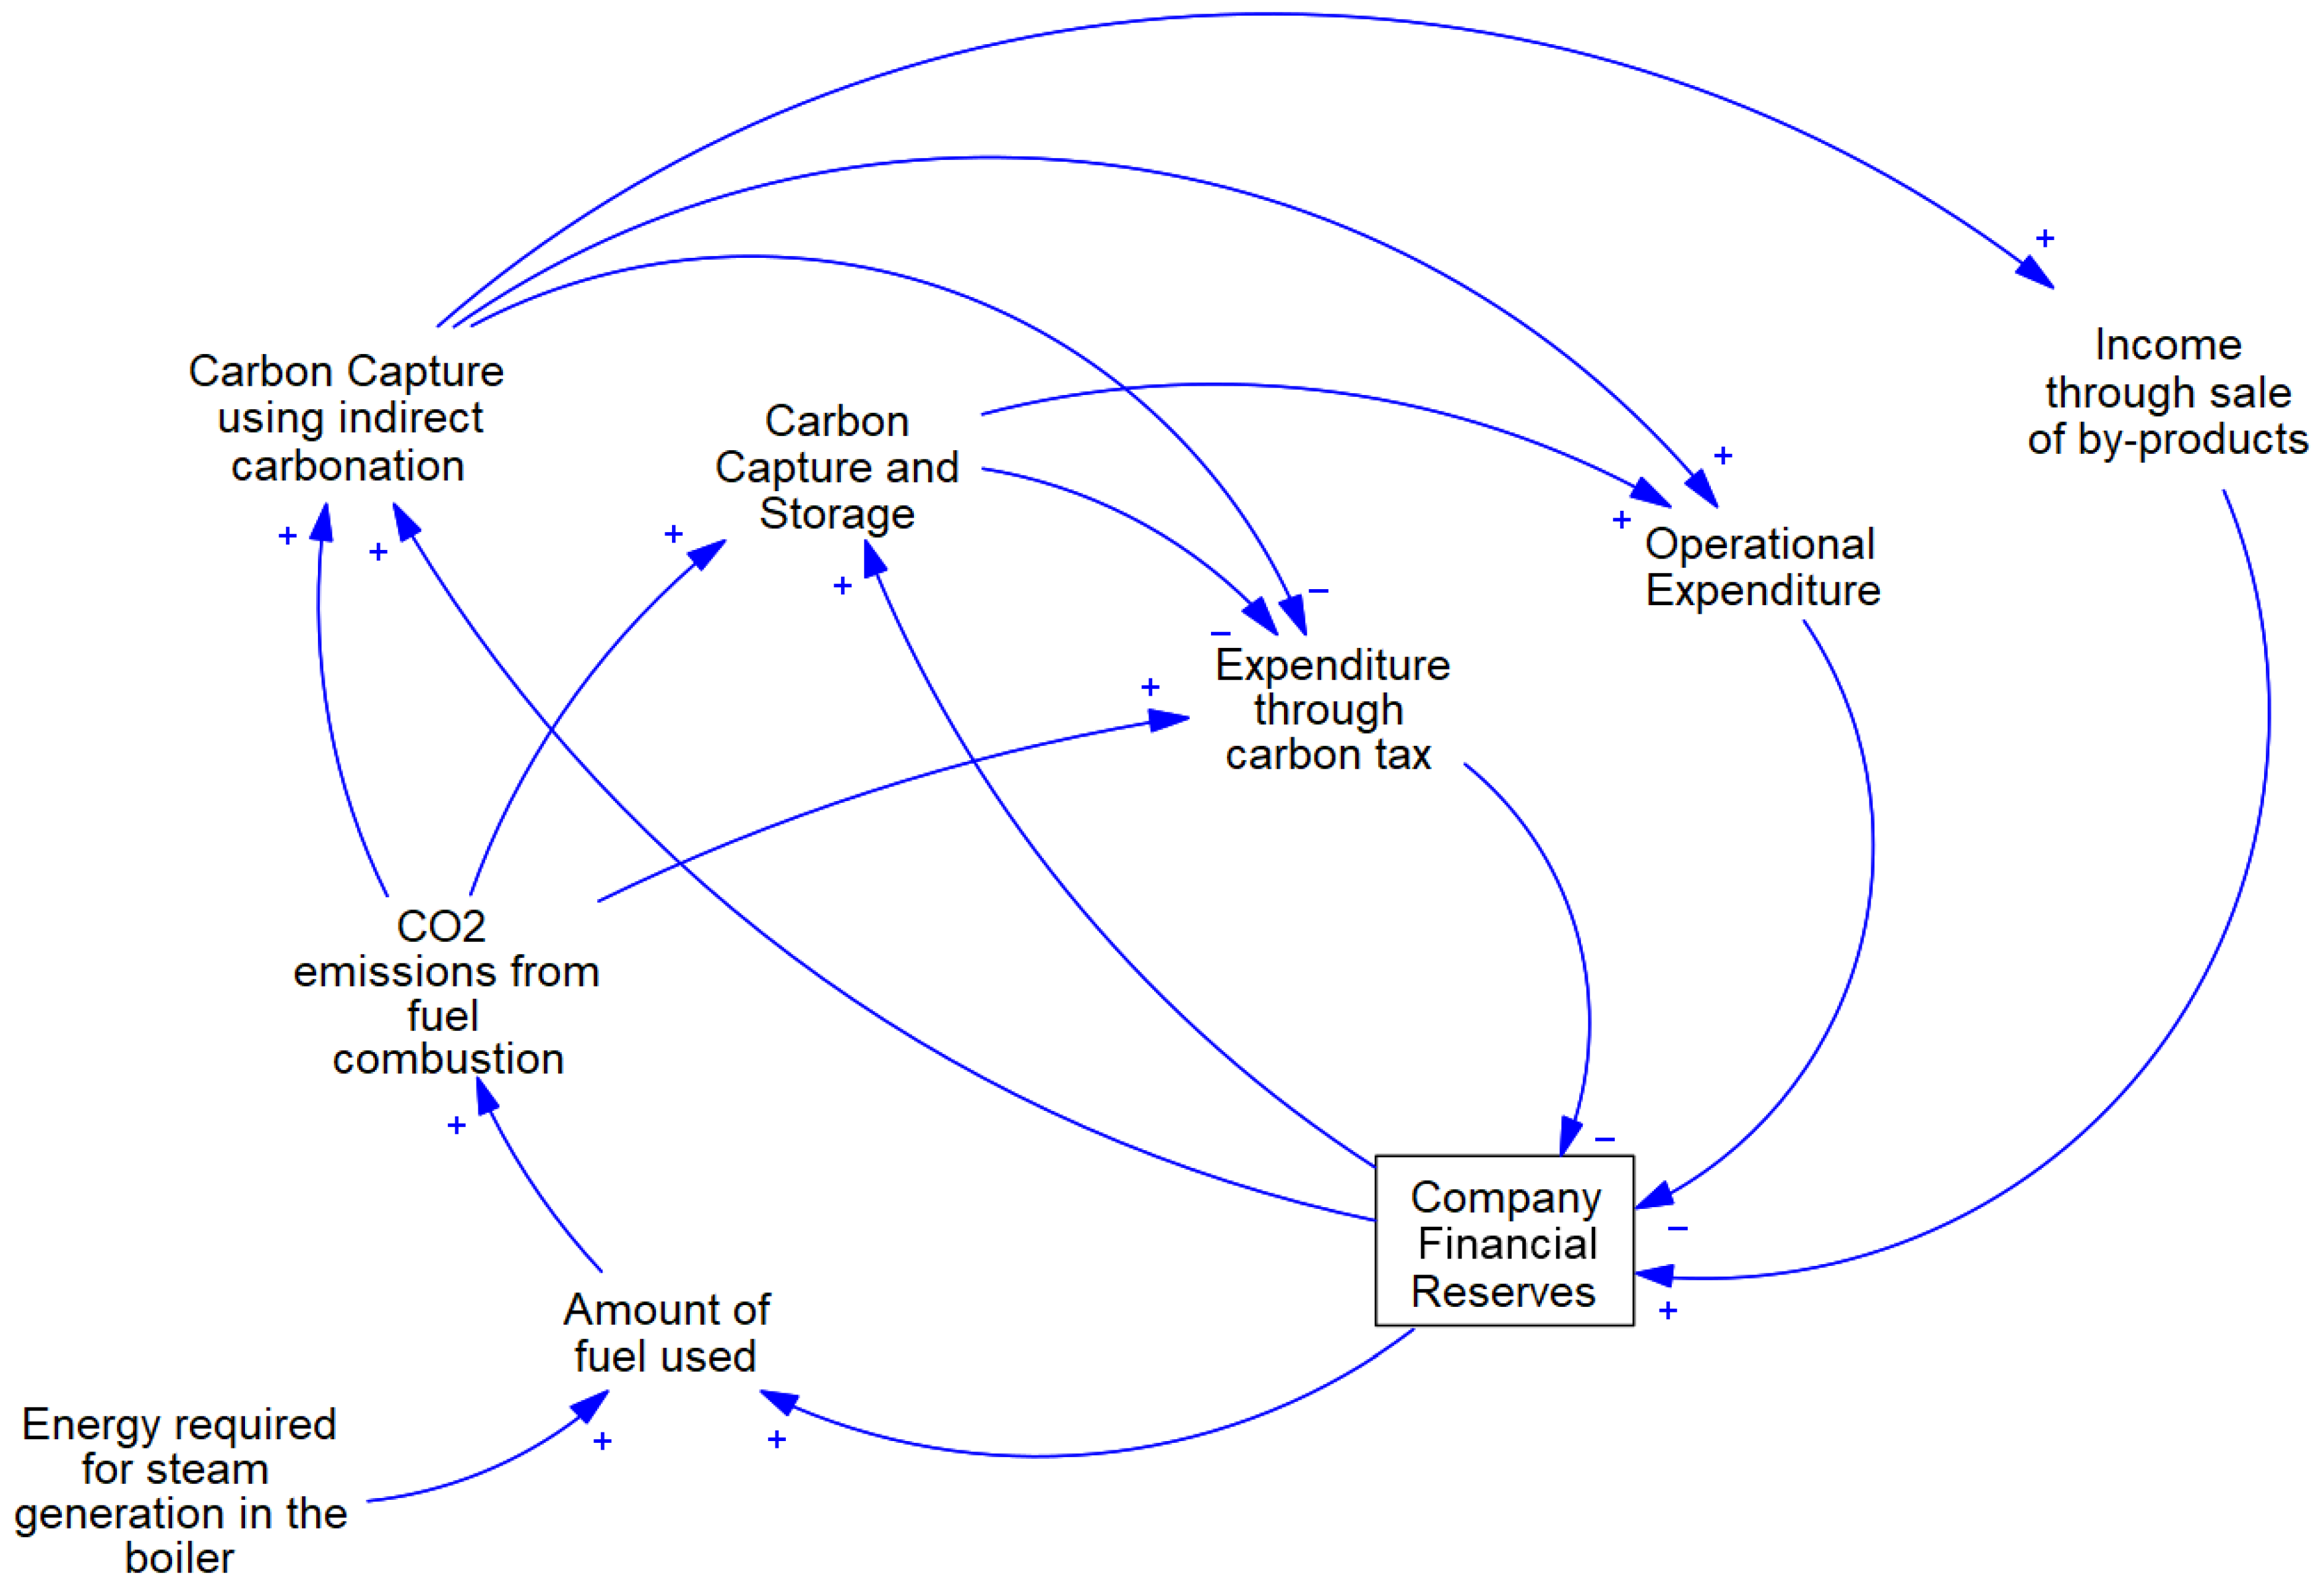
The CLD of the carbon capture system is depicted in Figure 4, which features two different capture techniques, i.e., indirect carbonation method using Sodium or Barium hydroxide, and the Carbon Capture and Storage (CCS) method. In the case of the indirect carbonation method, the process involves cooling the exhaust gases from the fuel burner system to 50 °C and removing any water vapour present in it [13]. Then the dry, cool exhaust gas is sent to crystallisers containing either Sodium Hydroxide or Barium Hydroxide which then react with CO2 to form their respective carbonates, i.e., Sodium Carbonate and Barium Carbonate, which can be sold back in the local market for additional income to the plant. In the case of CCS, the CO2 in the exhaust gases is captured, compressed, transported, and stored in designated locations where it is stored underground, either on-shore or off-shore for foreseeable future. In locations where a carbon tax is applicable, this system could lead to further savings, thereby positively impacting the available financial reserves of the plant.
Figure 4.
CLD of the Carbon Capture Module for CO2 emissions capture.
2.2. Model Construction
The proposed concepts from Section 2.1 are expanded and realised as a deterministic model with modules for FGD, SNCR, and carbon capture. The model is built using a web tool, SilicoAI, which facilities SD modelling through a graphical interface and allows for the construction of the modules through stock-and-flow diagrams [14]. The stock-and-flow diagrams of other modules and the description of all the variables used in the modules are attached to this study as Appendix A.
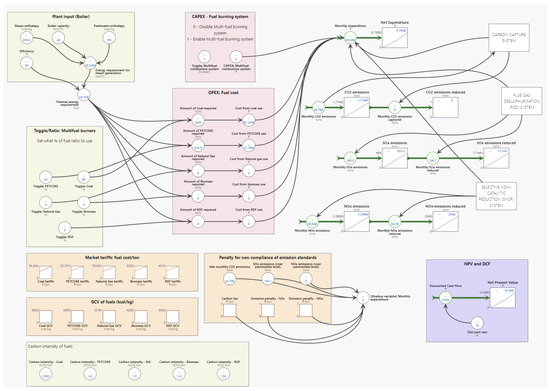
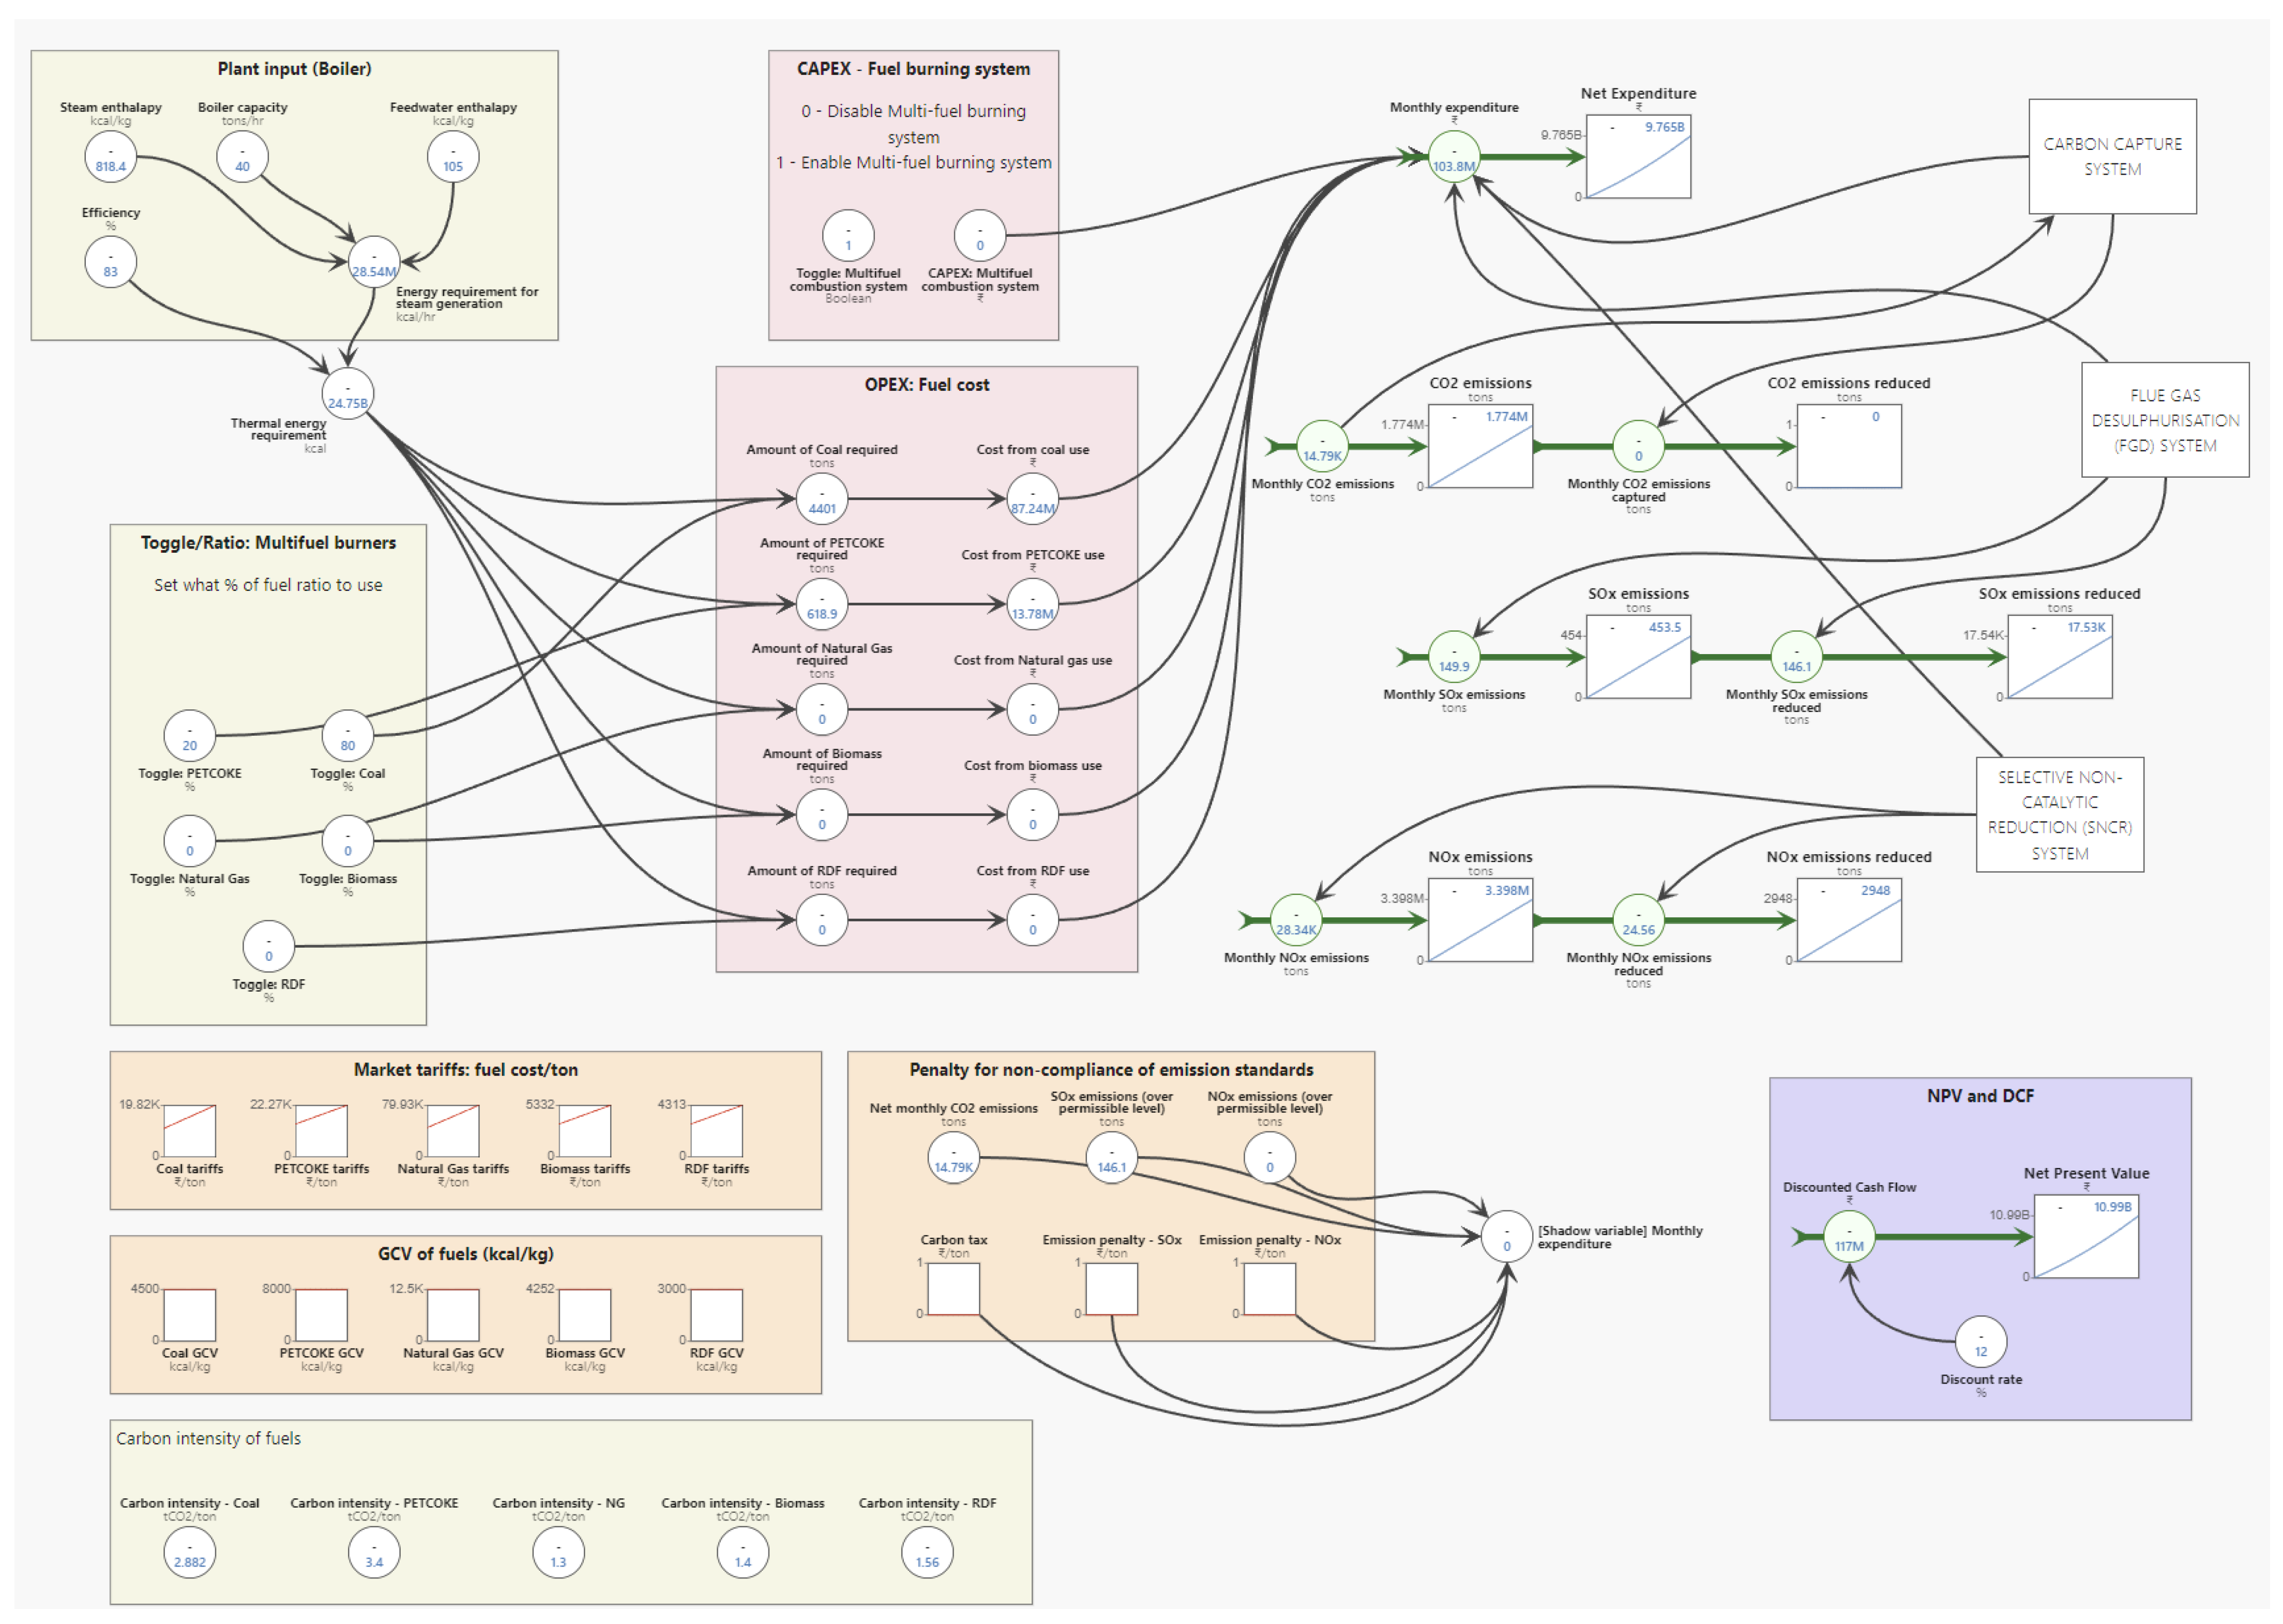
- Primary Module: Figure 5 depicts the stock-and-flow diagram of the proposed model, in which the input parameters from the plant are utilised along with the fuel mix to calculate the quantity of the fuels required as well as the relevant expenditure depending on the local market prices. The quantity of the fuel utilised along with other input plant parameters are then utilised in dedicated modules for carbon capture, FGD, and SNCR, which compute the amount of CO2, SOx, and NOx emissions respectively. The variables and the formulas used in the stock-and-flow diagram of the primary model are depicted in Table A1.
- Flue Gas Desulphurisation (FGD) Module: The stock-and-flow diagram for the FGD module is depicted in Figure A1, in which the sulphur content of the fuel used is provided as an input value, as it changes depending on the source from which the fuel is procured. From the primary module, the quantity of fuel combusted is taken to calculate the amount of flue gas generated for determining the SOx emissions in terms of weight per volume of flue gas. Based on the amount of SOx emissions that are to be reduced, the raw material needed in the FGD process, i.e., limestone, is calculated with the expenditure associated with it. Depending on the weight of SOx emissions reduced, the quantity of the by-product produced, i.e., Gypsum, is calculated. The cost recovered through either the sale of Gypsum in the local market or by reusing it within the plant is then calculated on the basis of prevailing market conditions at the location of the plant, which is taken as an input parameter. The variables used in this module are described in Table A2 along with the equations utilised.
- Selective Non-Catalytic Reduction (SNCR) Module: The stock-an-flow diagram of the SNCR system is depicted in Figure A2, in which the measured NOx emissions from the existing plant are taken as input as the NOx emissions cannot be calculated based on fuel alone. Depending on the amount of NOx emissions to be reduced, the quantity of Urea is calculated along with the expenditure incurred for procuring the raw material from the local market. This method releases CO2 as a by-product which is calculated on the basis of the amount of Urea utilised and appended to the primary module. The variables utilised in this module are then described in Table A3.
- Carbon Capture Module: The stock-and-flow diagram of the carbon capture system is depicted in Figure A3 in which the amount of CO2 emissions is calculated on the basis of quantity of fuels combusted and their associated carbon intensity. The module allows for 2 different methodology for carbon capture, (i) indirect carbonation method, in which the quantity of raw material needed, i.e., either Sodium Hydroxide or Barium Hydroxide, is calculated based on the amount of CO2 emissions generated through the fuel-burner system. The by-products of the chemical reaction, Sodium Carbonate or Barium Carbonate is also calculated along with additional income obtained through sale in the local market. The variables used in this module are described in Table A4 along with all the equations used.
Figure 5.
Stock-and-flow diagram of the proposed model.
2.3. Model Validation
The model is validated through sensitivity analysis and dimensional consistency tests before running the experiments under scenarios described in Section 2.4. The data used for the purpose of demonstrating the model’s utility is described in Section 2.5 and attached as Supplement dataset S1. The model is constructed using SilicoAI, a web-based simulation tool, and each simulation is run for a period of 10 years, with timesteps of 1 month. The units of measure are then checked among the variables for dimensional consistency.
2.3.1. Boundary Adequacy
The current model is designed to represent individual industrial plants that utilise a steam boiler. As such, the datasets for parameters such as fuel, raw materials, and by-product tariffs are prepared exogenously based on the existing tariffs in the applicable local markets and are escalated at each time step based on the existing trends for consumer price index in the geographical region. The endogenously calculated metrics in the model include the monthly expenditures for each module as well as the emissions generated and reduced or captured for SOx, NOx, and CO2.
2.3.2. Sensitivity Analysis
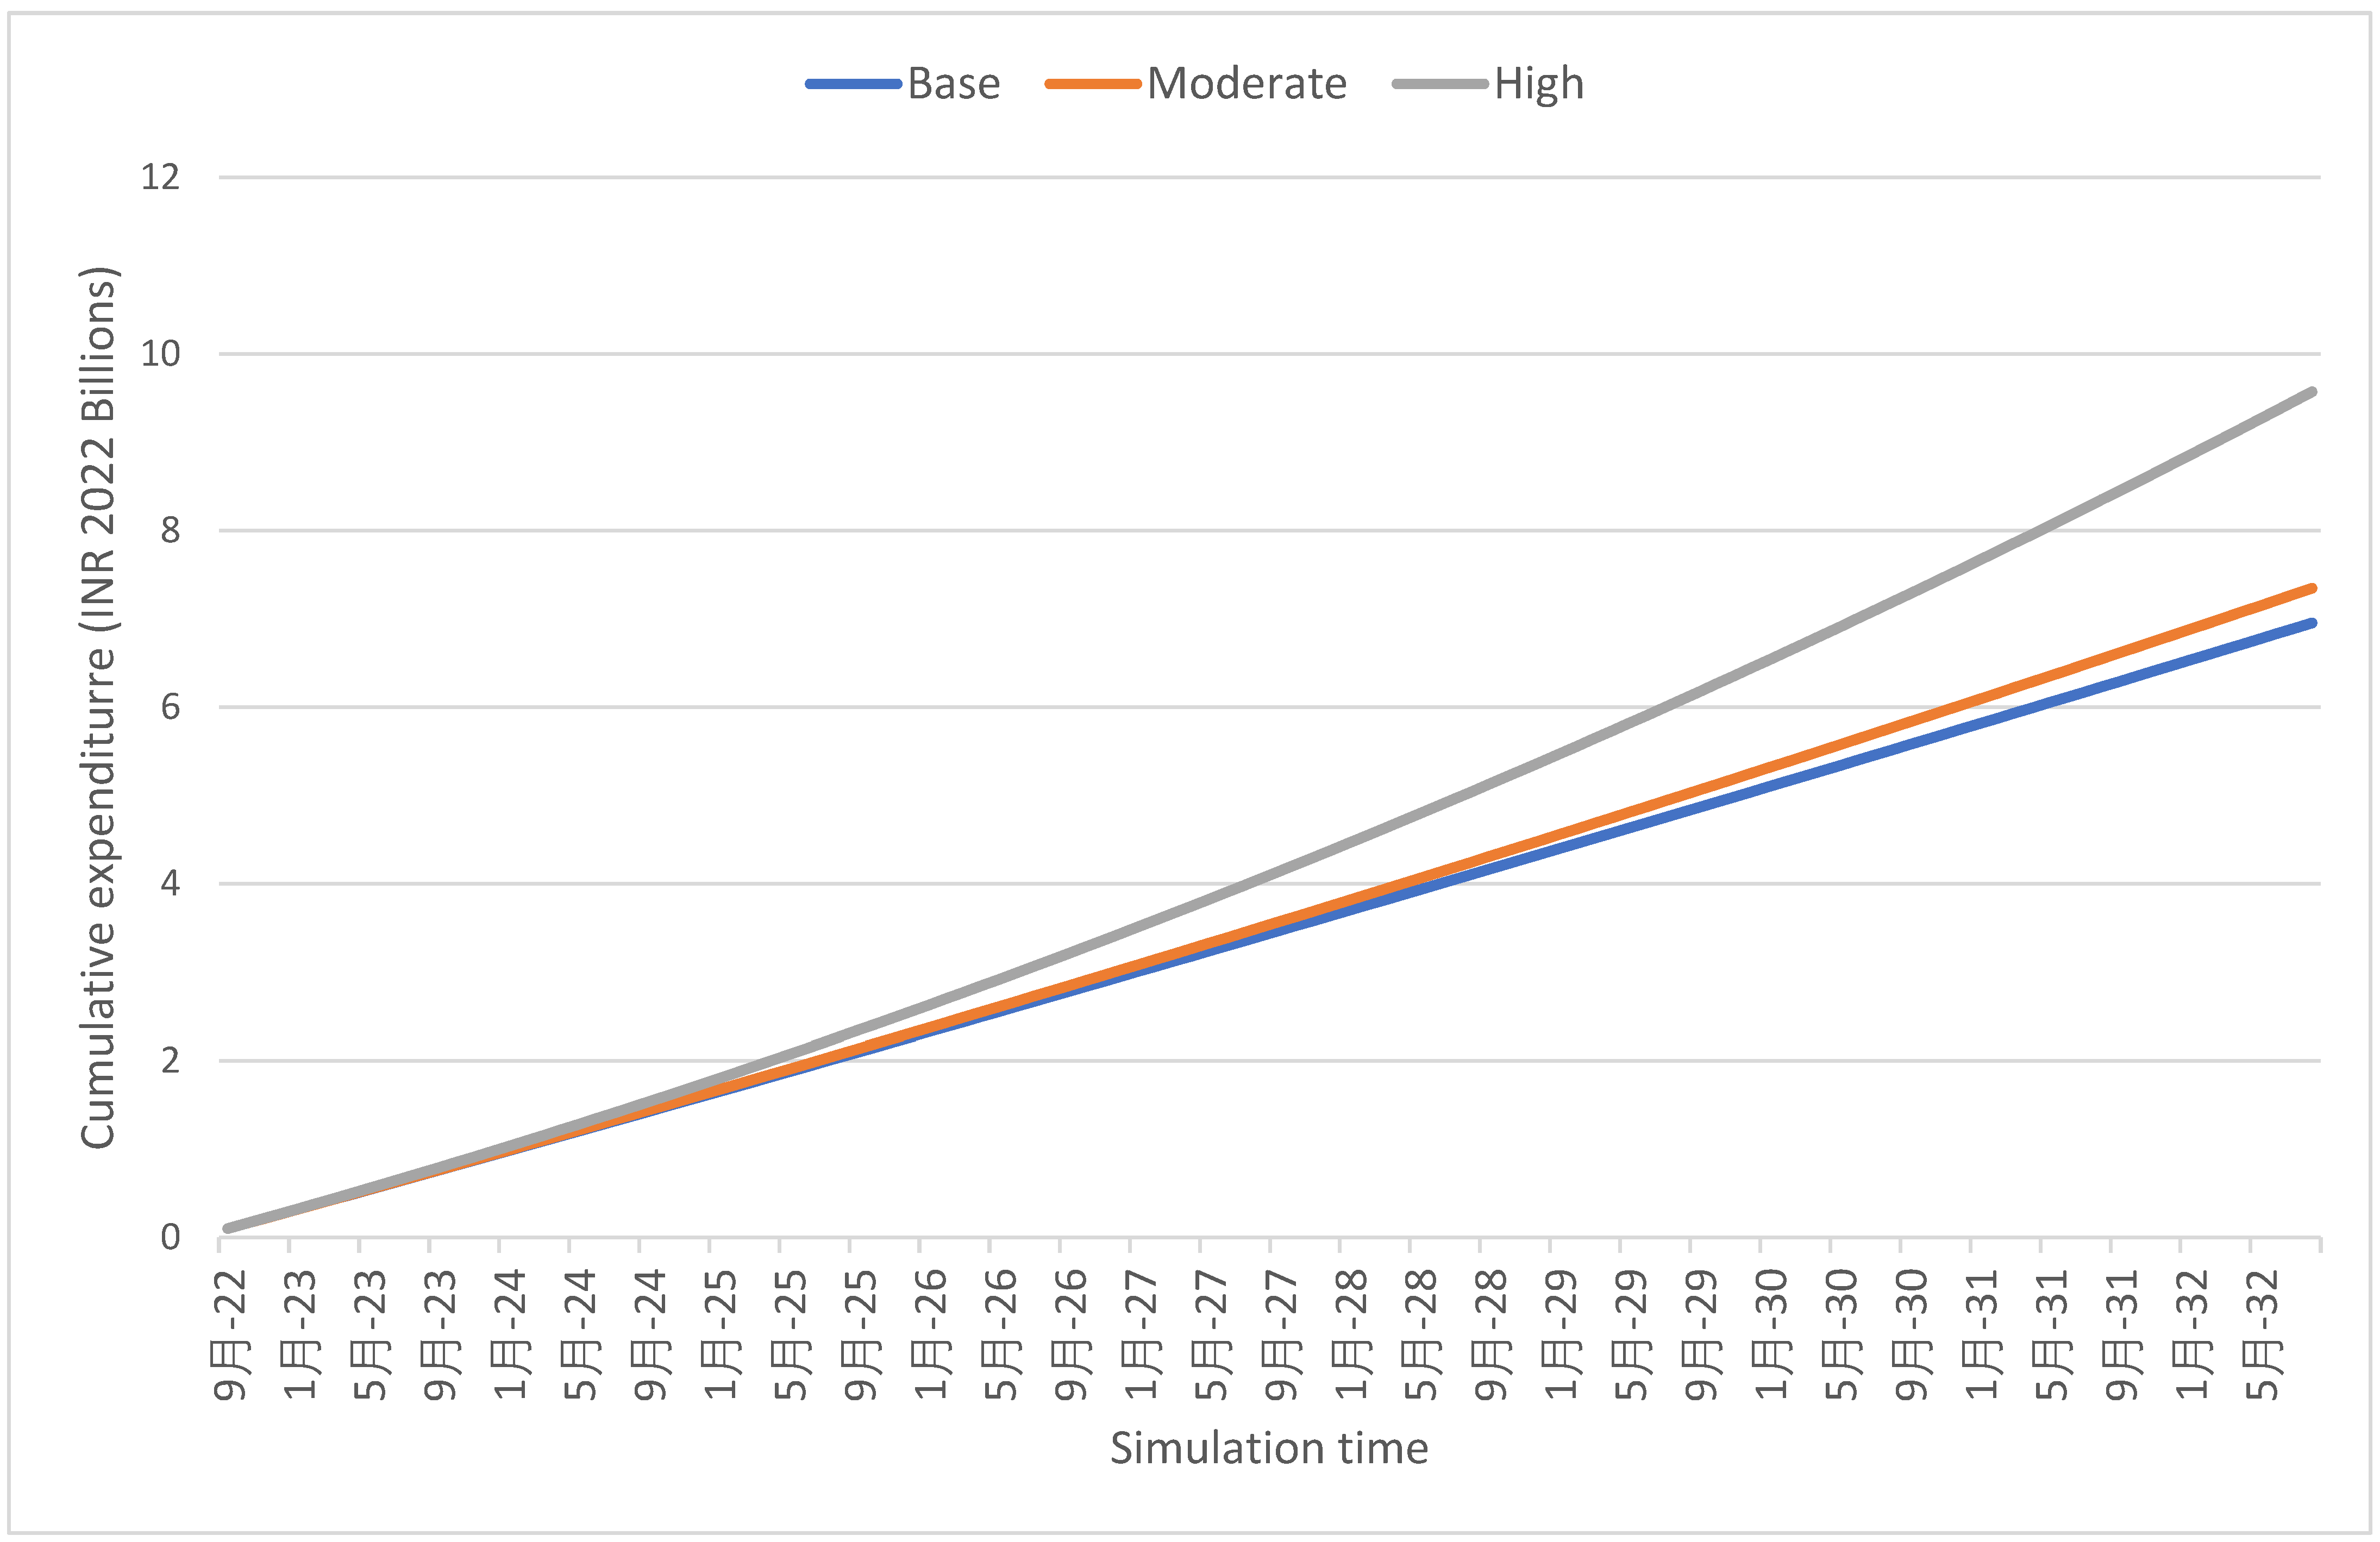
The sensitivity analysis is then conducted on the model to verify if changes in core input parameters reflect relatable shifts in the output provided by the system. The expenditure for operating a boiler is directly dependent on the cost of procurement of the respective fuels that are to be utilised in the burner system. As such, the sensitivity of the system is tested in the following scenarios:
- Base case, in which the fuel tariff remains constant throughout the simulation period.
- Moderate increment case, in which the fuel tariff linearly increases by 10% by the end of the simulation run.
- High increment case, in which the fuel tariff linearly increases by 100% by the end of the simulation run.
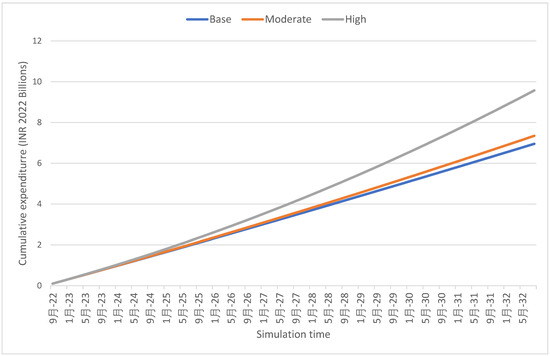
The changes in the net expenditure of the system in Indian Rupees (INR) for all three aforementioned cases is depicted in Figure 6. The moderate increment case and high increment case have an equivalent impact on the cumulative expenditure of the plant, thereby the model is deemed sensitive to the changes in the core input variables.
Figure 6.
Sensitivity of the model to changes in fuel tariffs.
2.4. Scenarios Considered
For demonstrating the model, a boiler of size 40 Tons Per Hour (TPH) is considered for all the applicable scenarios tested in this study, as it is the typical size of boilers used for steam generation in various industrial sectors such as textile and paper. Based on the parameters applicable to the aforementioned boiler, the energy requirement in each time step is computed and is fulfilled through user-set values of fuel mix and pollution control modules such as FGD, SNCR, and carbon capture. For testing the expenditure and emissions, the following fuel mix configurations are considered for the purpose of this study:
- 100% coal
- With SNCR and FGD systems
- Without SNCR and FGD systems
- 70% coal and 30% PETCOKE
- With SNCR and FGD systems
- Without SNCR and FGD systems
- 70% coal and 30% Biomass (cotton stalk)
- With SNCR and FGD systems
- Without SNCR and FGD systems
- 70% coal and 30% RDF
- With SNCR and FGD systems
- Without SNCR and FGD systems
- 50% coal, 40% PETCOKE, and 10% Biomass (cotton stalk)
- With SNCR and FGD systems
- Without SNCR and FGD systems
In combination with the above-mentioned configurations, the following scenarios are tested, which are:
- Business as usual (BAU), in which current prevailing conditions in India for non-compliance penalties for SOx and NOx emissions are considered. Currently, there are no penalties for excess SOx and NOx emissions for plants in India, as the deadlines for compliance had been already extended three times in the last five years [15]. As such, this scenario attempts to deduce the benefits of alternative fuel-mix configurations and implementation of pollution control systems, if any, if the current circumstances (as of October 2022) are prevalent throughout the duration of the simulation period.
- Low Mitigation Effort (LME) scenario, in which a base penalty of INR 8000 per ton of excess NOx and SOx emissions over permissible limits is considered. The monthly adjustment factor is then considered for calculating the penalty during the duration of the simulation period, which factors in the changes in the consumer price index as well as an annual increment multiplier of 5%. Additionally, the tariffs on fossil fuels (Coal, Natural Gas, and PETCOKE) are considered to increase by an additional 10% each year when compared to BAU, in order to reflect the local governmental bodies’ efforts in encouraging renewable alternatives. The penalty at each time step is then calculated as depicted in Equations 6 and 7. This scenario attempts to deduce the benefits of using alternative fuel-mix configurations and implementing pollution control systems under market conditions in which the governmental bodies are taking a conservative approach to enforcing emission compliances through penalties and taxes.
Penalty = 5000 × Monthly Adjustment Factor × tons of excess SOx and NOx
Carbon tax = 1500 × Monthly Adjustment Factor × tons of CO2 emissions
- c.
- High Mitigation Effort (HME) scenario, in which a base penalty of INR 25,000 per ton of excess NOx and SOx emissions over permissible limits is considered with an annual increment of 15%. Additionally, the tariffs on fossil fuels (Coal, Natural Gas, and PETCOKE) are considered to increase by an additional 35% each year when compared to BAU, in order to reflect the local governmental bodies’ efforts in encouraging renewable alternatives. The penalty at each time step is then calculated as depicted in Equations (8) and (9). This scenario attempts to deduce the benefits of using alternative fuel-mix configurations and implementing pollution control systems under market conditions in which the governmental bodies are prioritising the adaptation of pollution control measures in industries, by imposing significant penalties and taxes for non-compliance.
Penalty = 25,000 × Monthly Adjustment Factor × tons of excess SOx and NOx
Carbon tax = 10,000 × Monthly Adjustment Factor × tons of CO2 emissions
Table 1 depicts the changes in major input parameters under the three aforementioned scenarios, i.e., a, b, and c.
Table 1.
Summary of the chosen scenarios for experimentation.
2.5. Dataset Preparation
The dataset used in the simulation is attached as Supplementary dataset S1, which is prepared as described in Table 2. Additionally, the typical sulphur content in fuels that were utilised in the simulation experiments is presented in Appendix B.
Table 2.
Description of data used for experiments in this study.
3. Results
The constructed model is utilised to run under different fuel-mix configurations described in Section 2.4, under the three different penalty/tax scenarios, i.e., BAU, LME, and HME and the results are subsequently compared.
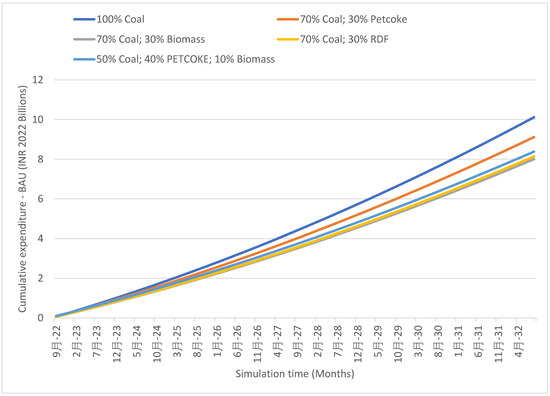
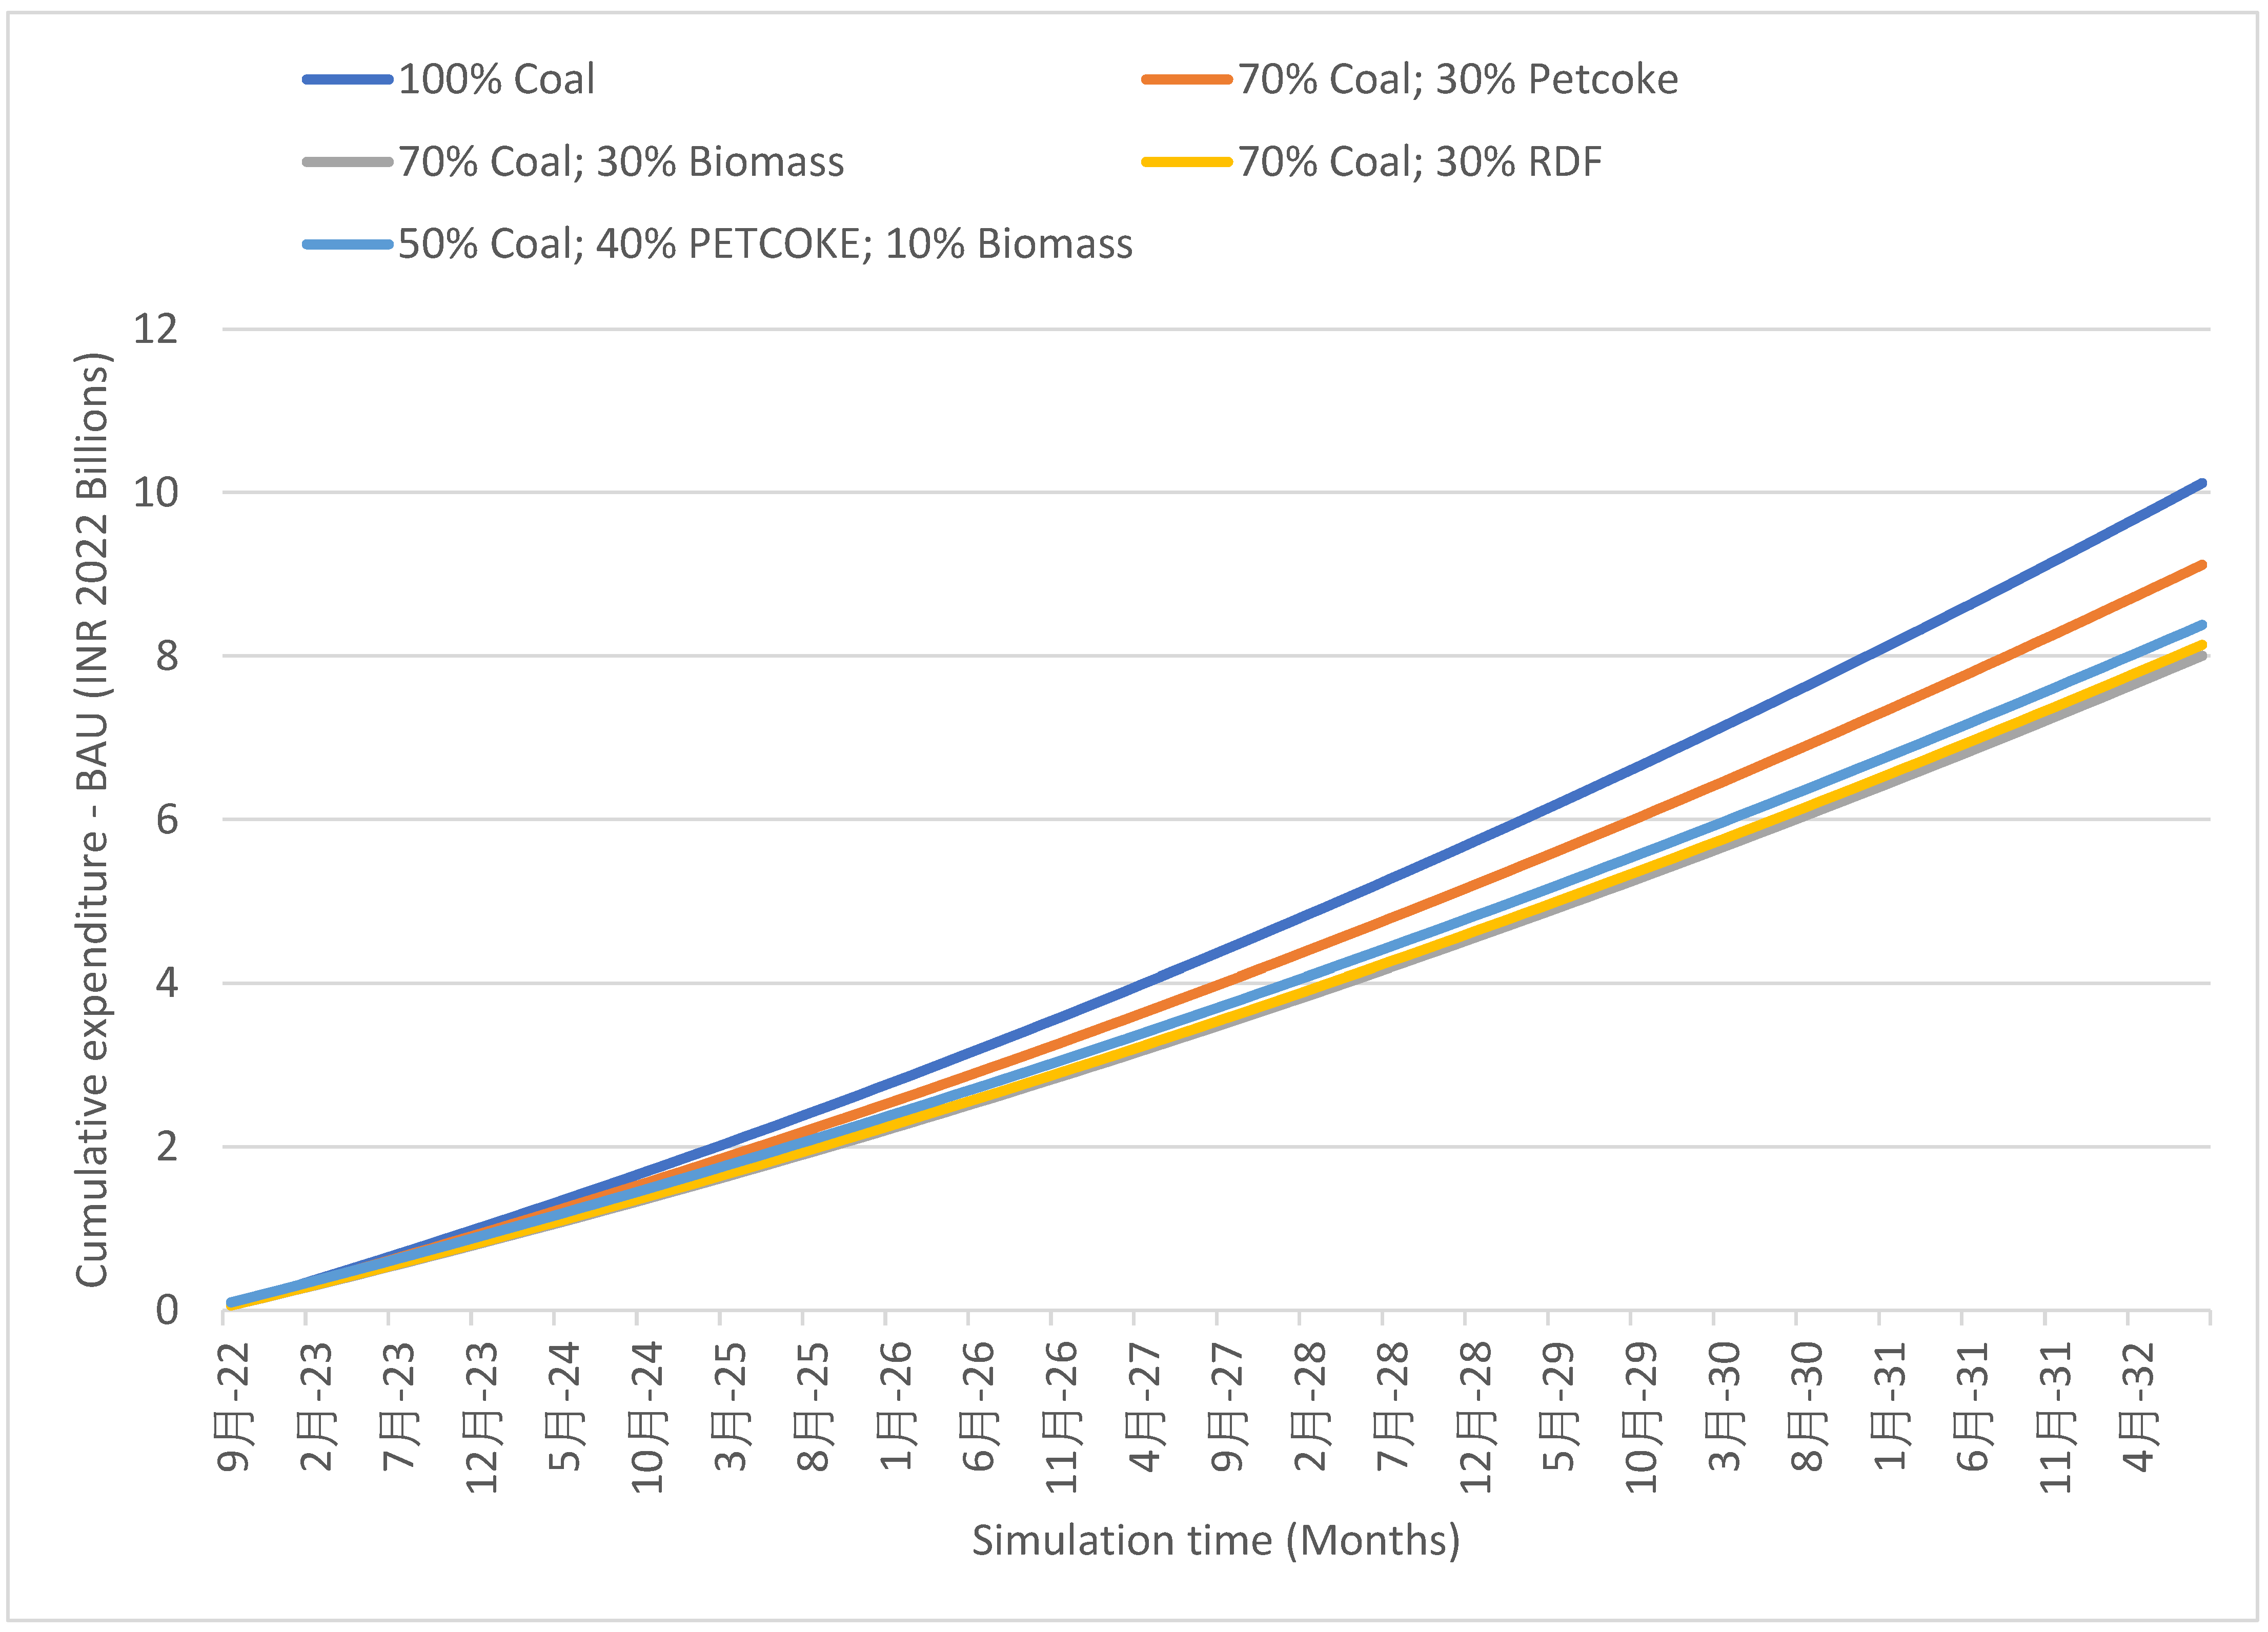
Figure 7 depicts the cumulative expenditure at the end of the simulation run under the BAU scenario for all five fuel-mix configurations, in which utilising Coal is determined to be the most expensive option. Using a mixture of 70% Coal and 30% biomass was determined to be the least expensive option, i.e., 20.9% cheaper than using coal exclusively at the end of the 10-year simulation period.
Figure 7.
Cumulative expenditure under BAU scenario for various fuel-mix configurations.
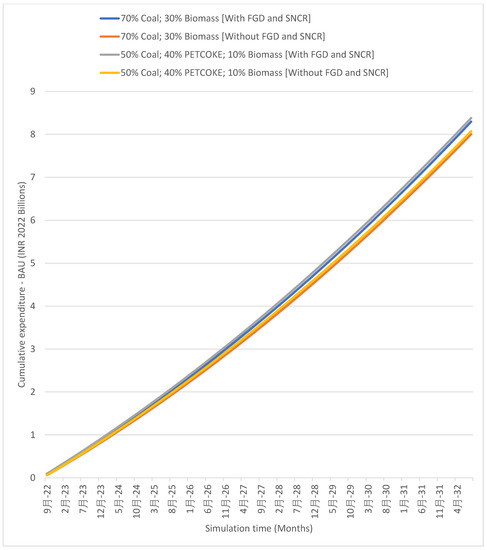
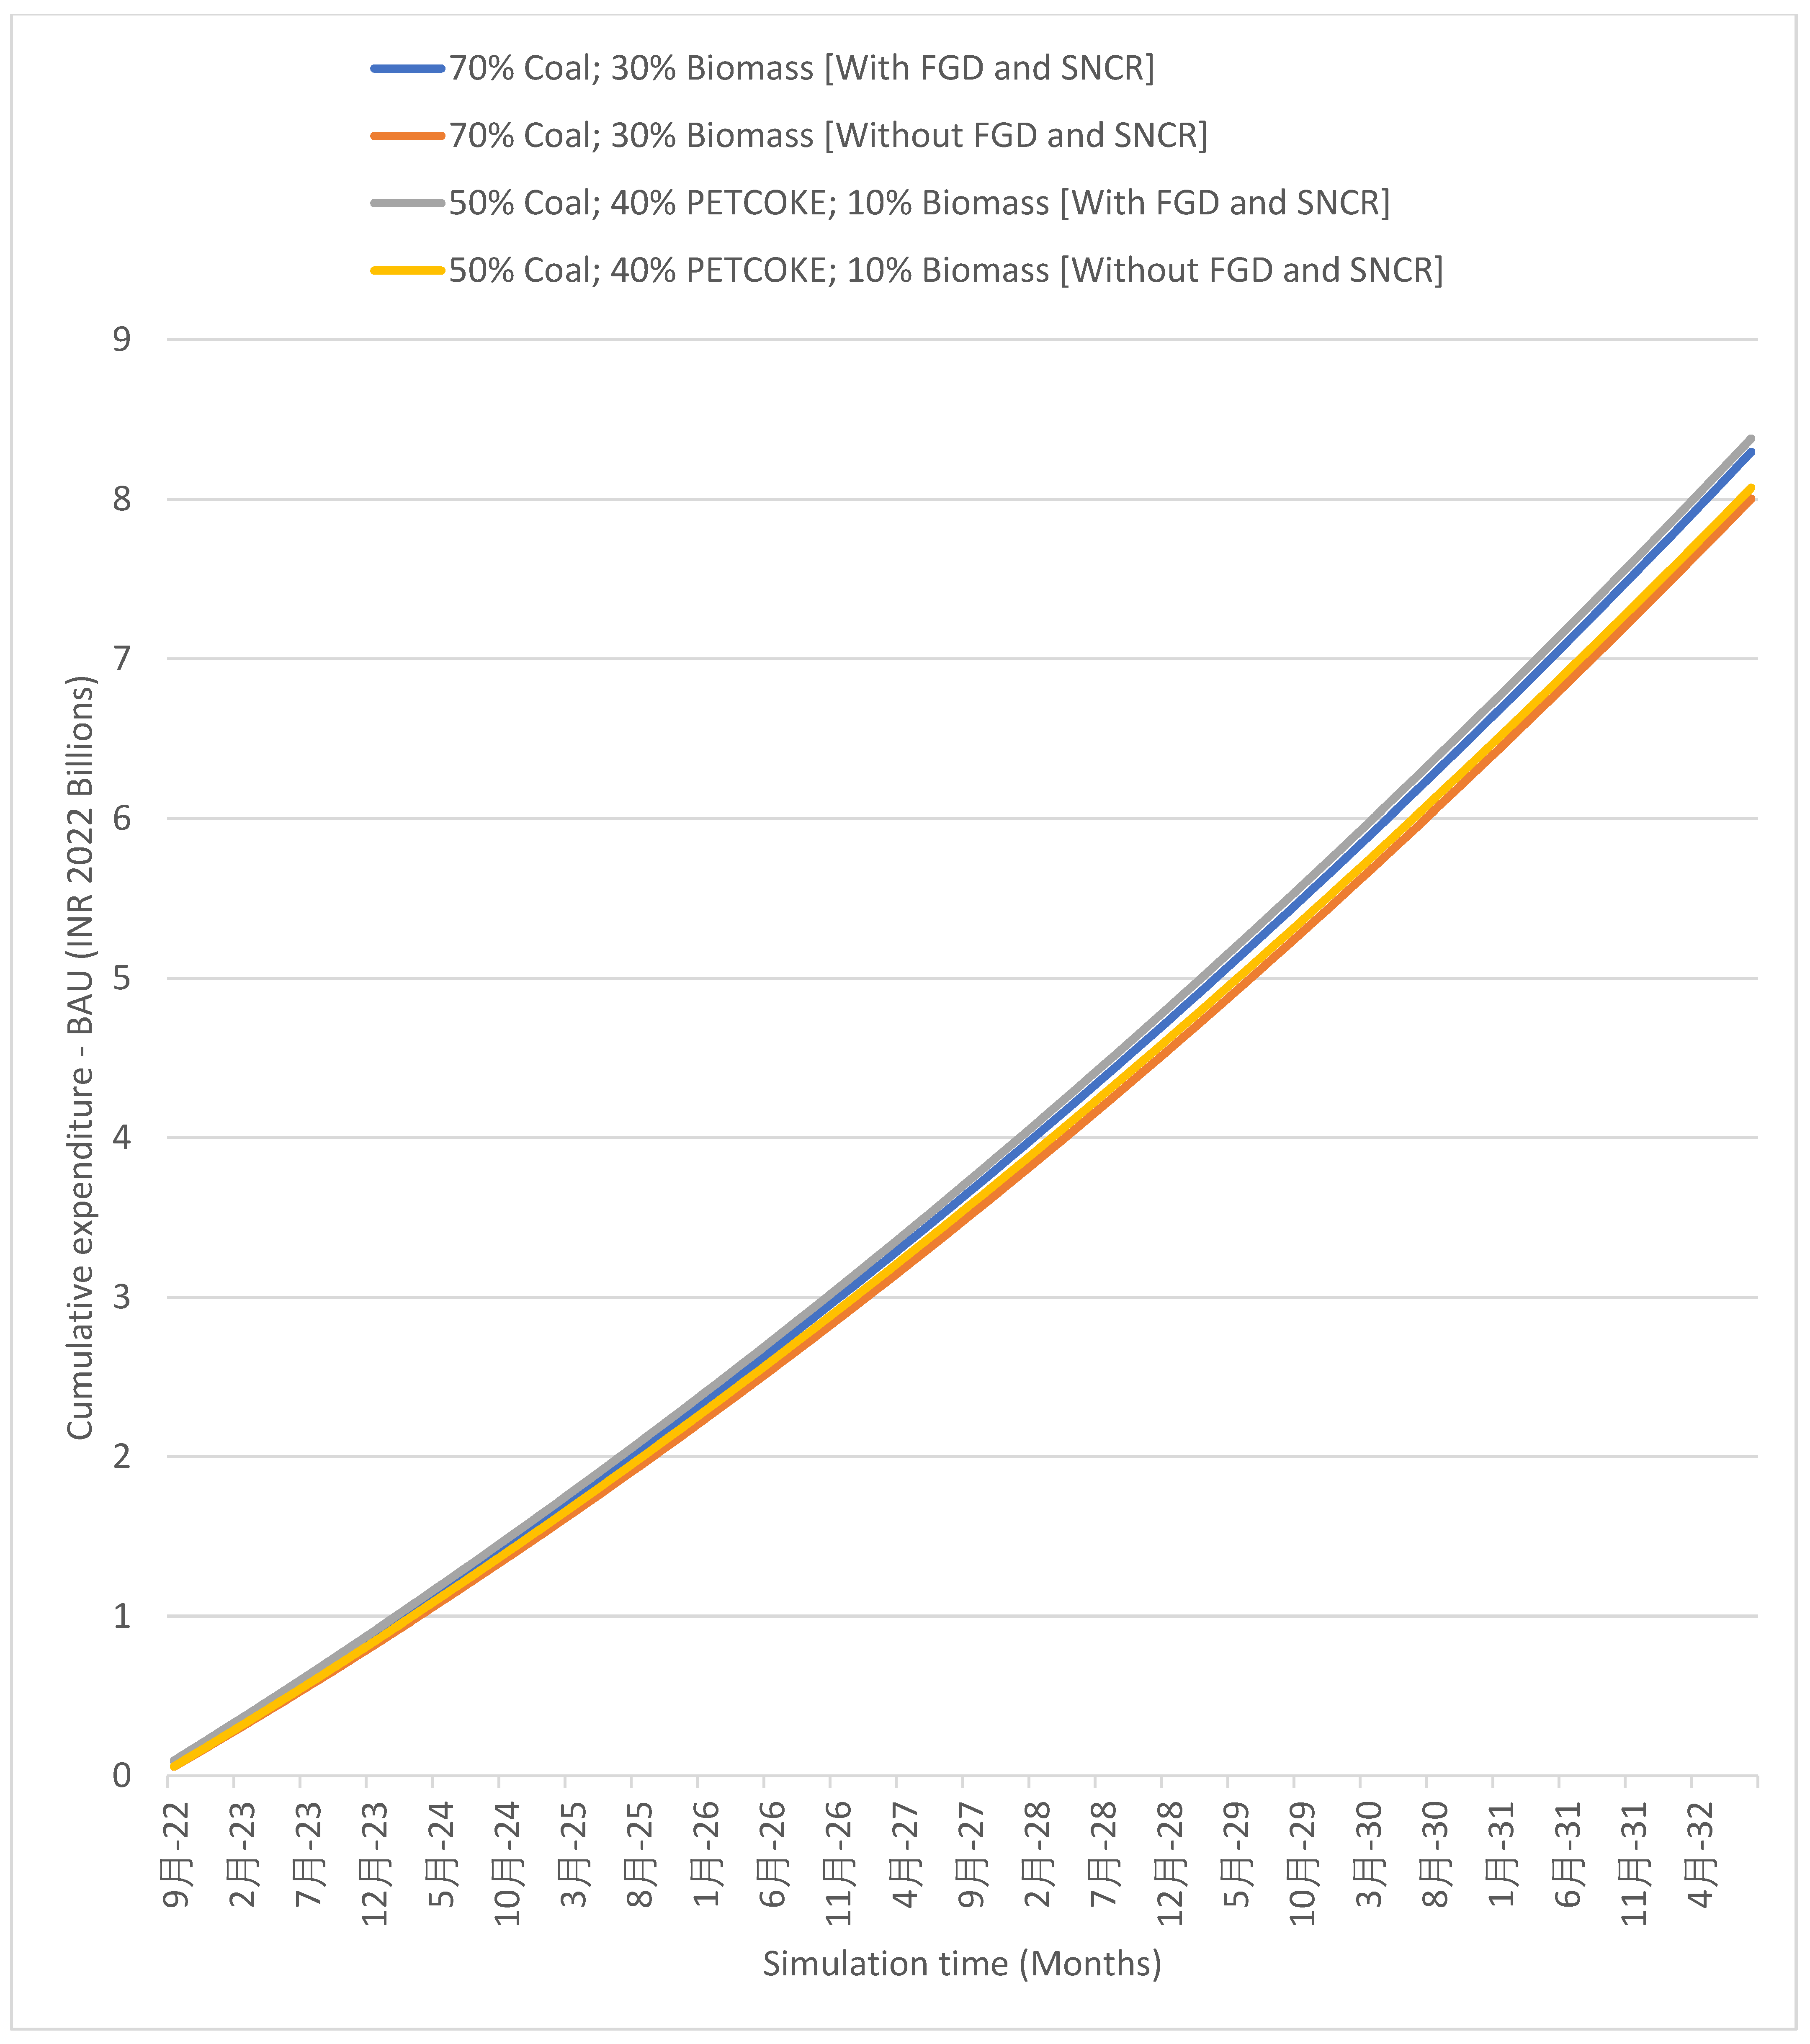
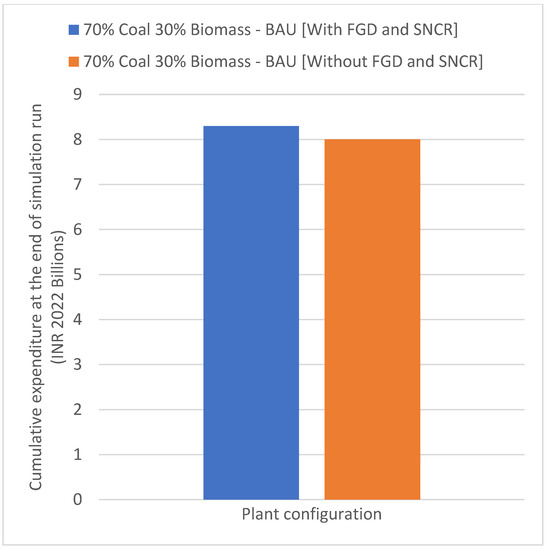
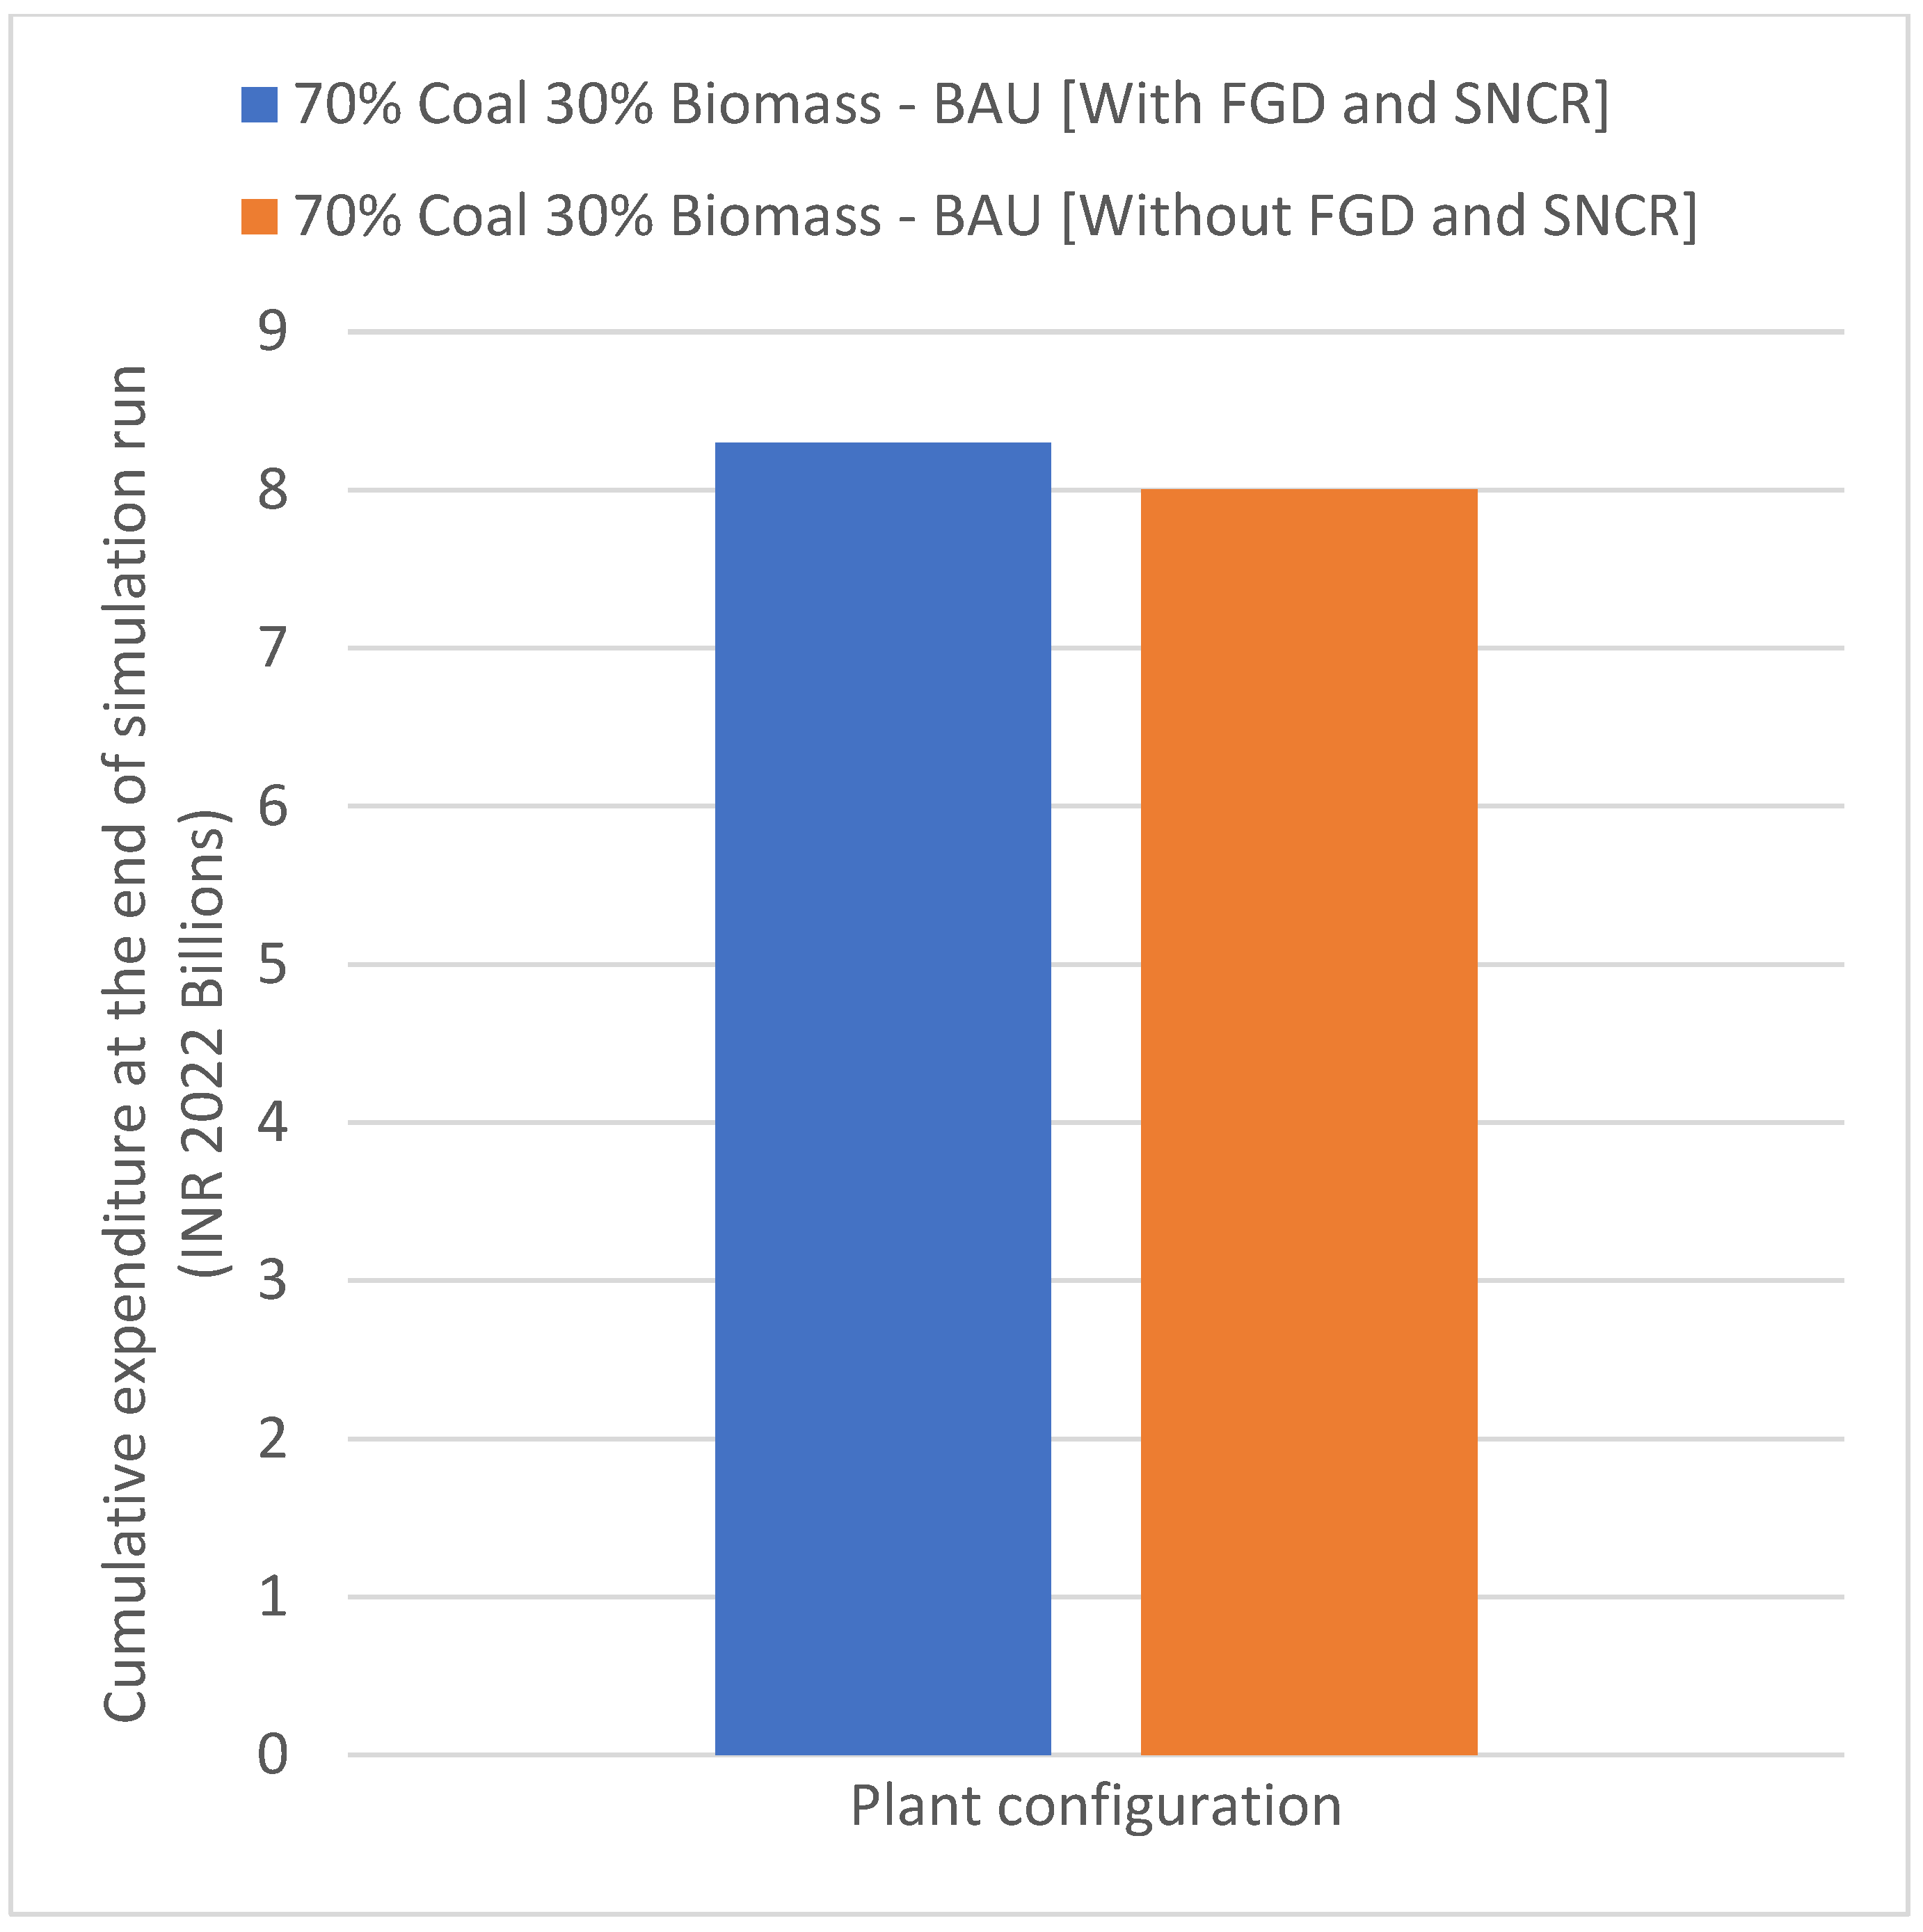
The fuel-mixes are then compared with and without the utilisation of pollution control systems, i.e., FGD and SNCR in Figure 8. In the BAU scenario, no penalties were considered for excess SOx and NOx emissions over permissible norms, and it resulted in the cumulative expenditure of configurations that include FGD and SNCR to be more expensive at the end of the simulation run when compared to configurations that do not include any pollution control systems as visualised in Figure 9.
Figure 8.
Cumulative expenditure under BAU scenario for selected fuel-mix configurations, with and without FGD and SNCR systems.
Figure 9.
Comparison of cumulative expenditure at the end of the simulation run in BAU scenario, with and without pollution control system.
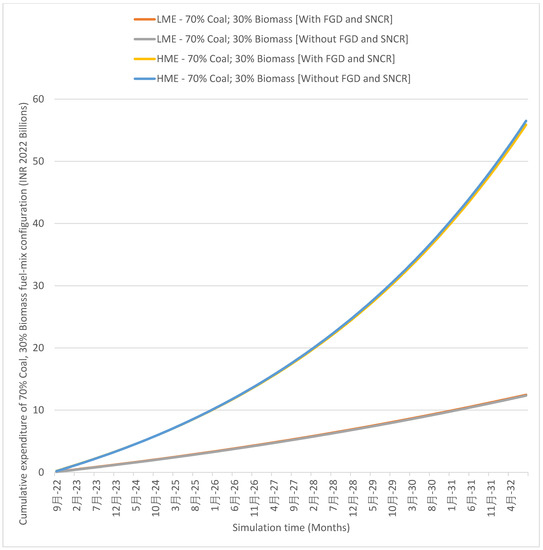
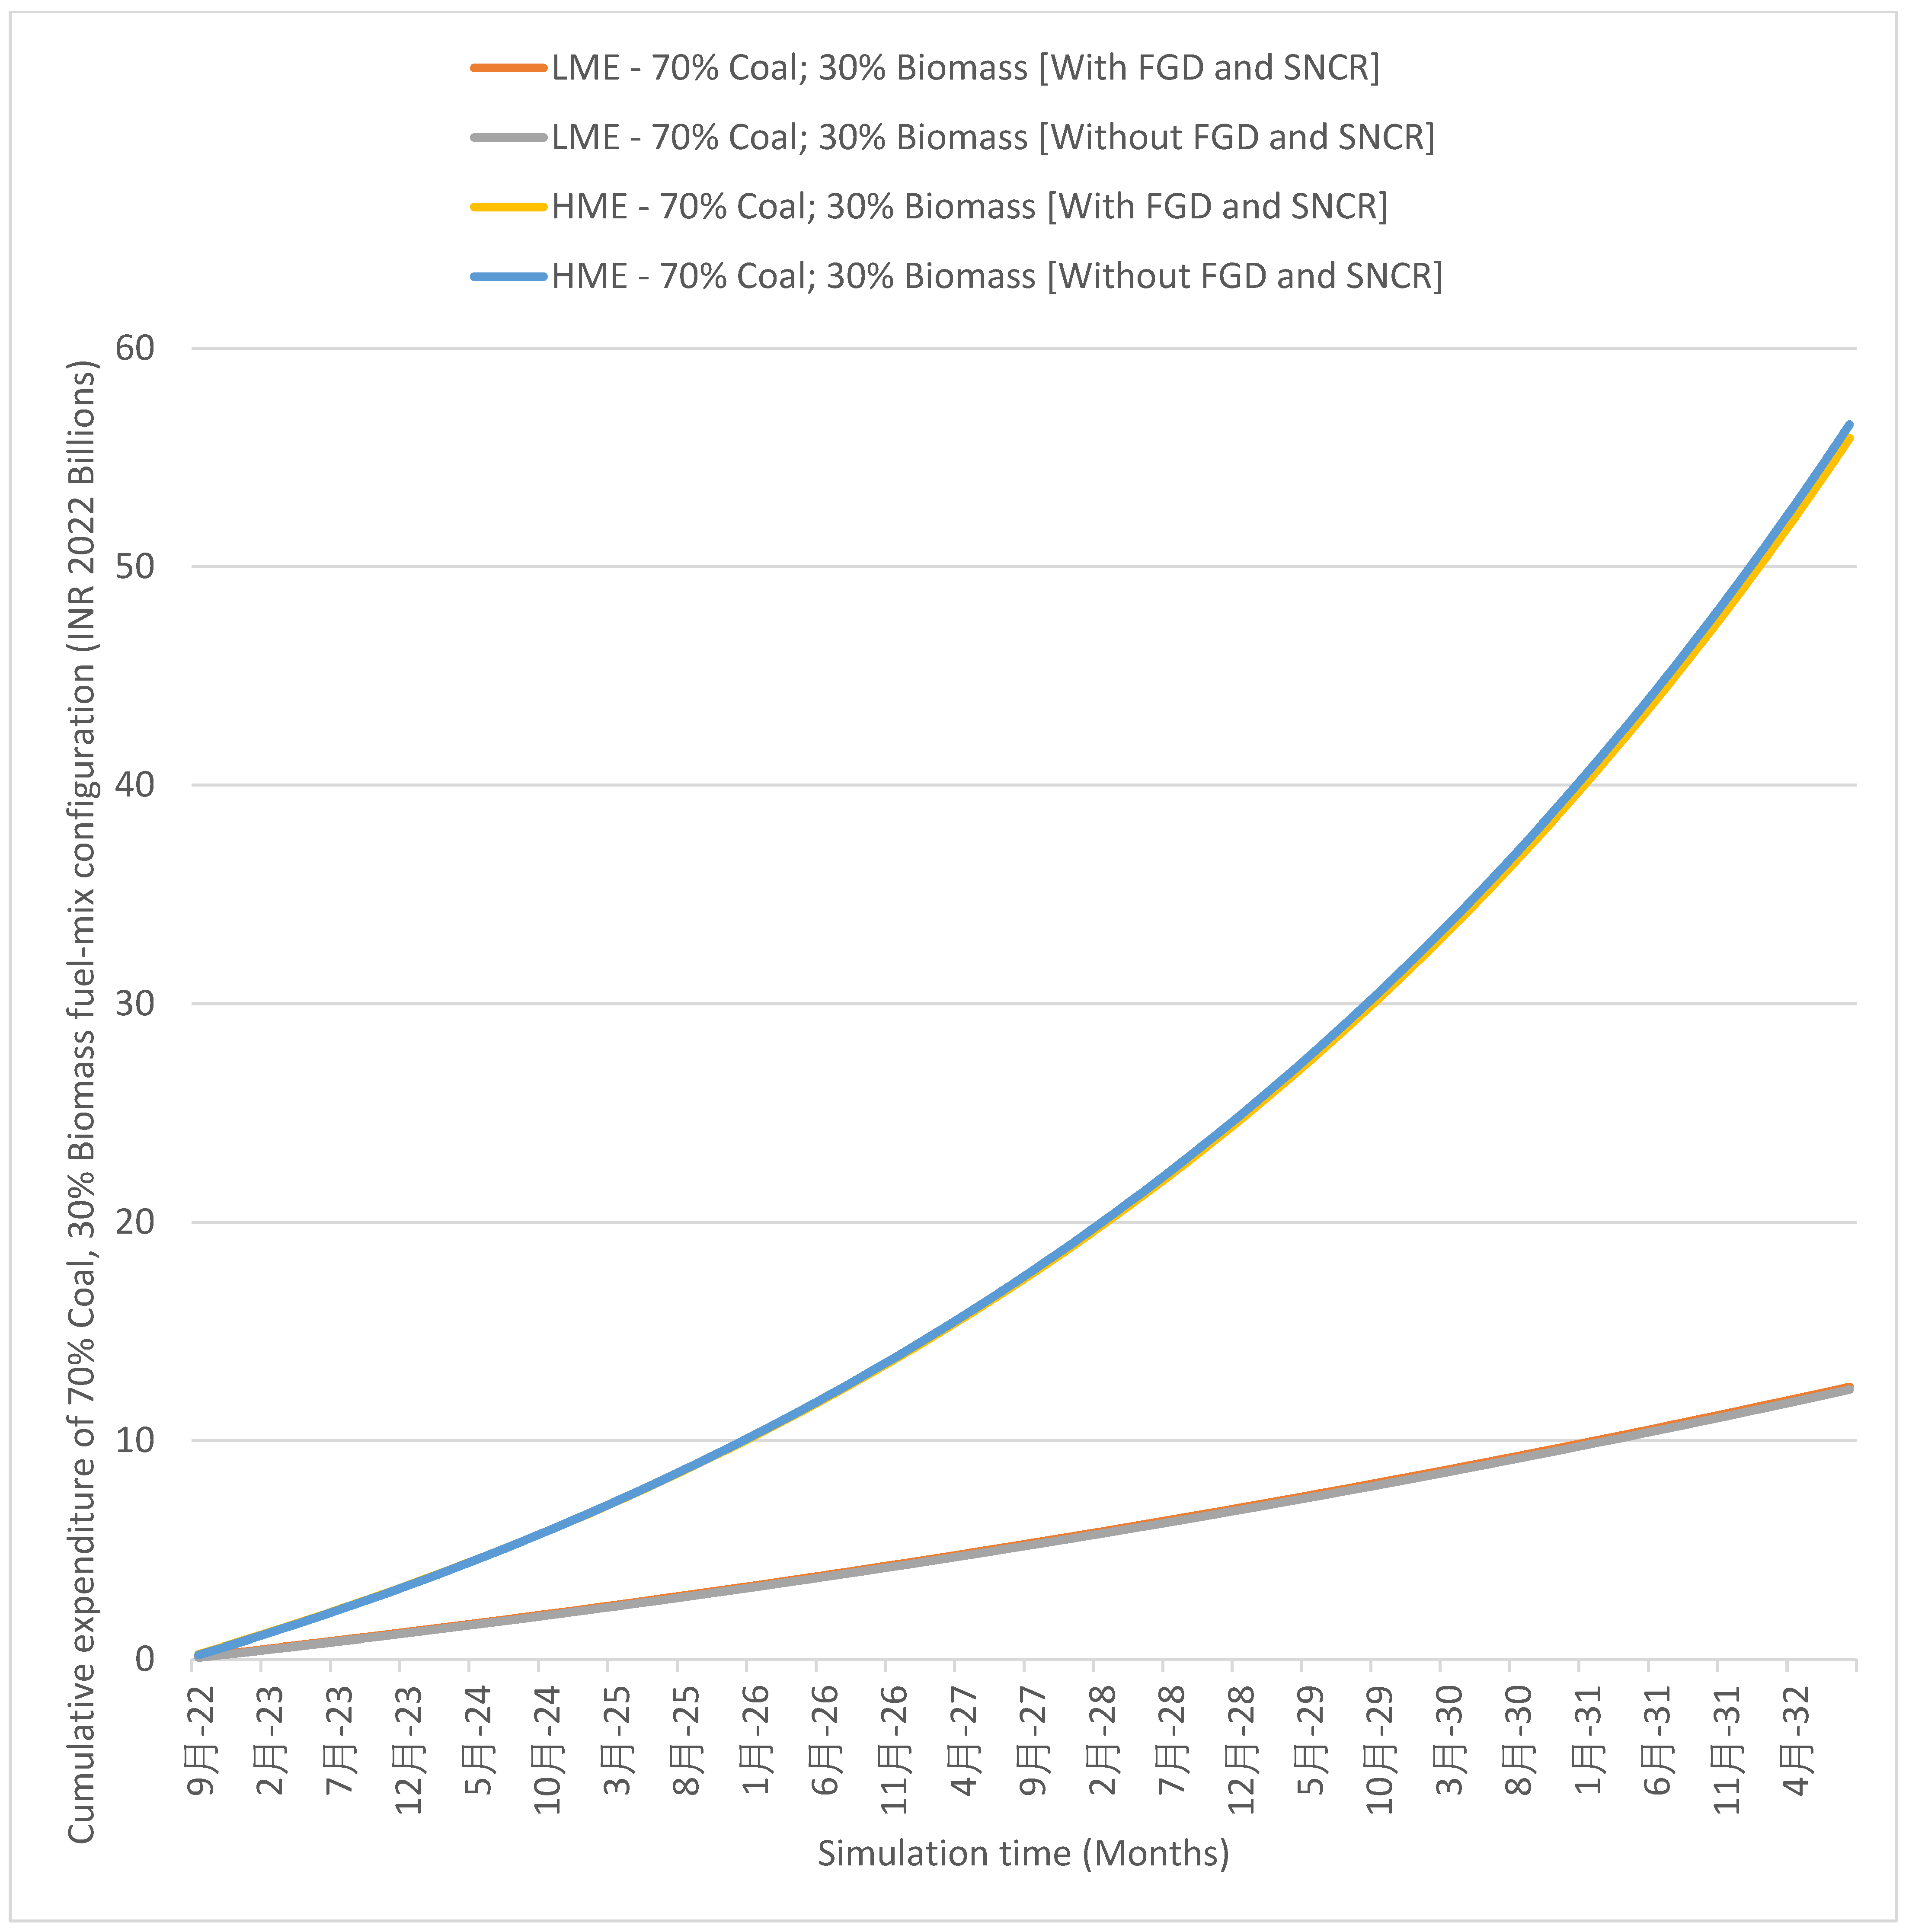
The impact of using pollution control systems under LME and HME scenarios which penalise excess SOx and NOx emissions, is depicted in Figure 10. However, the penalties tested in this simulation experiment resulted in an increase of 1% in cumulative expenditure at the end of the simulation run for equipping the plant with FGD and SNCR systems in the LME scenario. In the HME scenario, the penalties resulted in a decrease of 1% in cumulative expenditure at the end of the simulation run.
Figure 10.
The effect of FGD and SNCR systems on the cumulative expenditure of fuel-mix configuration–70% Coal, 30% Biomass under LME and HME scenarios.
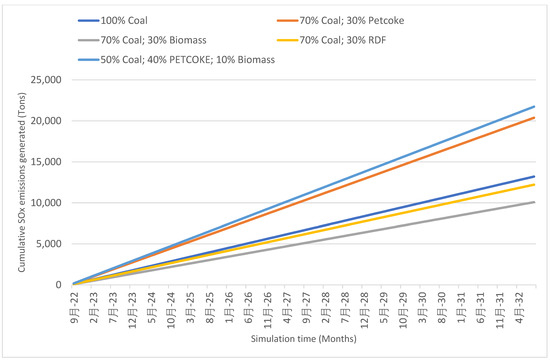
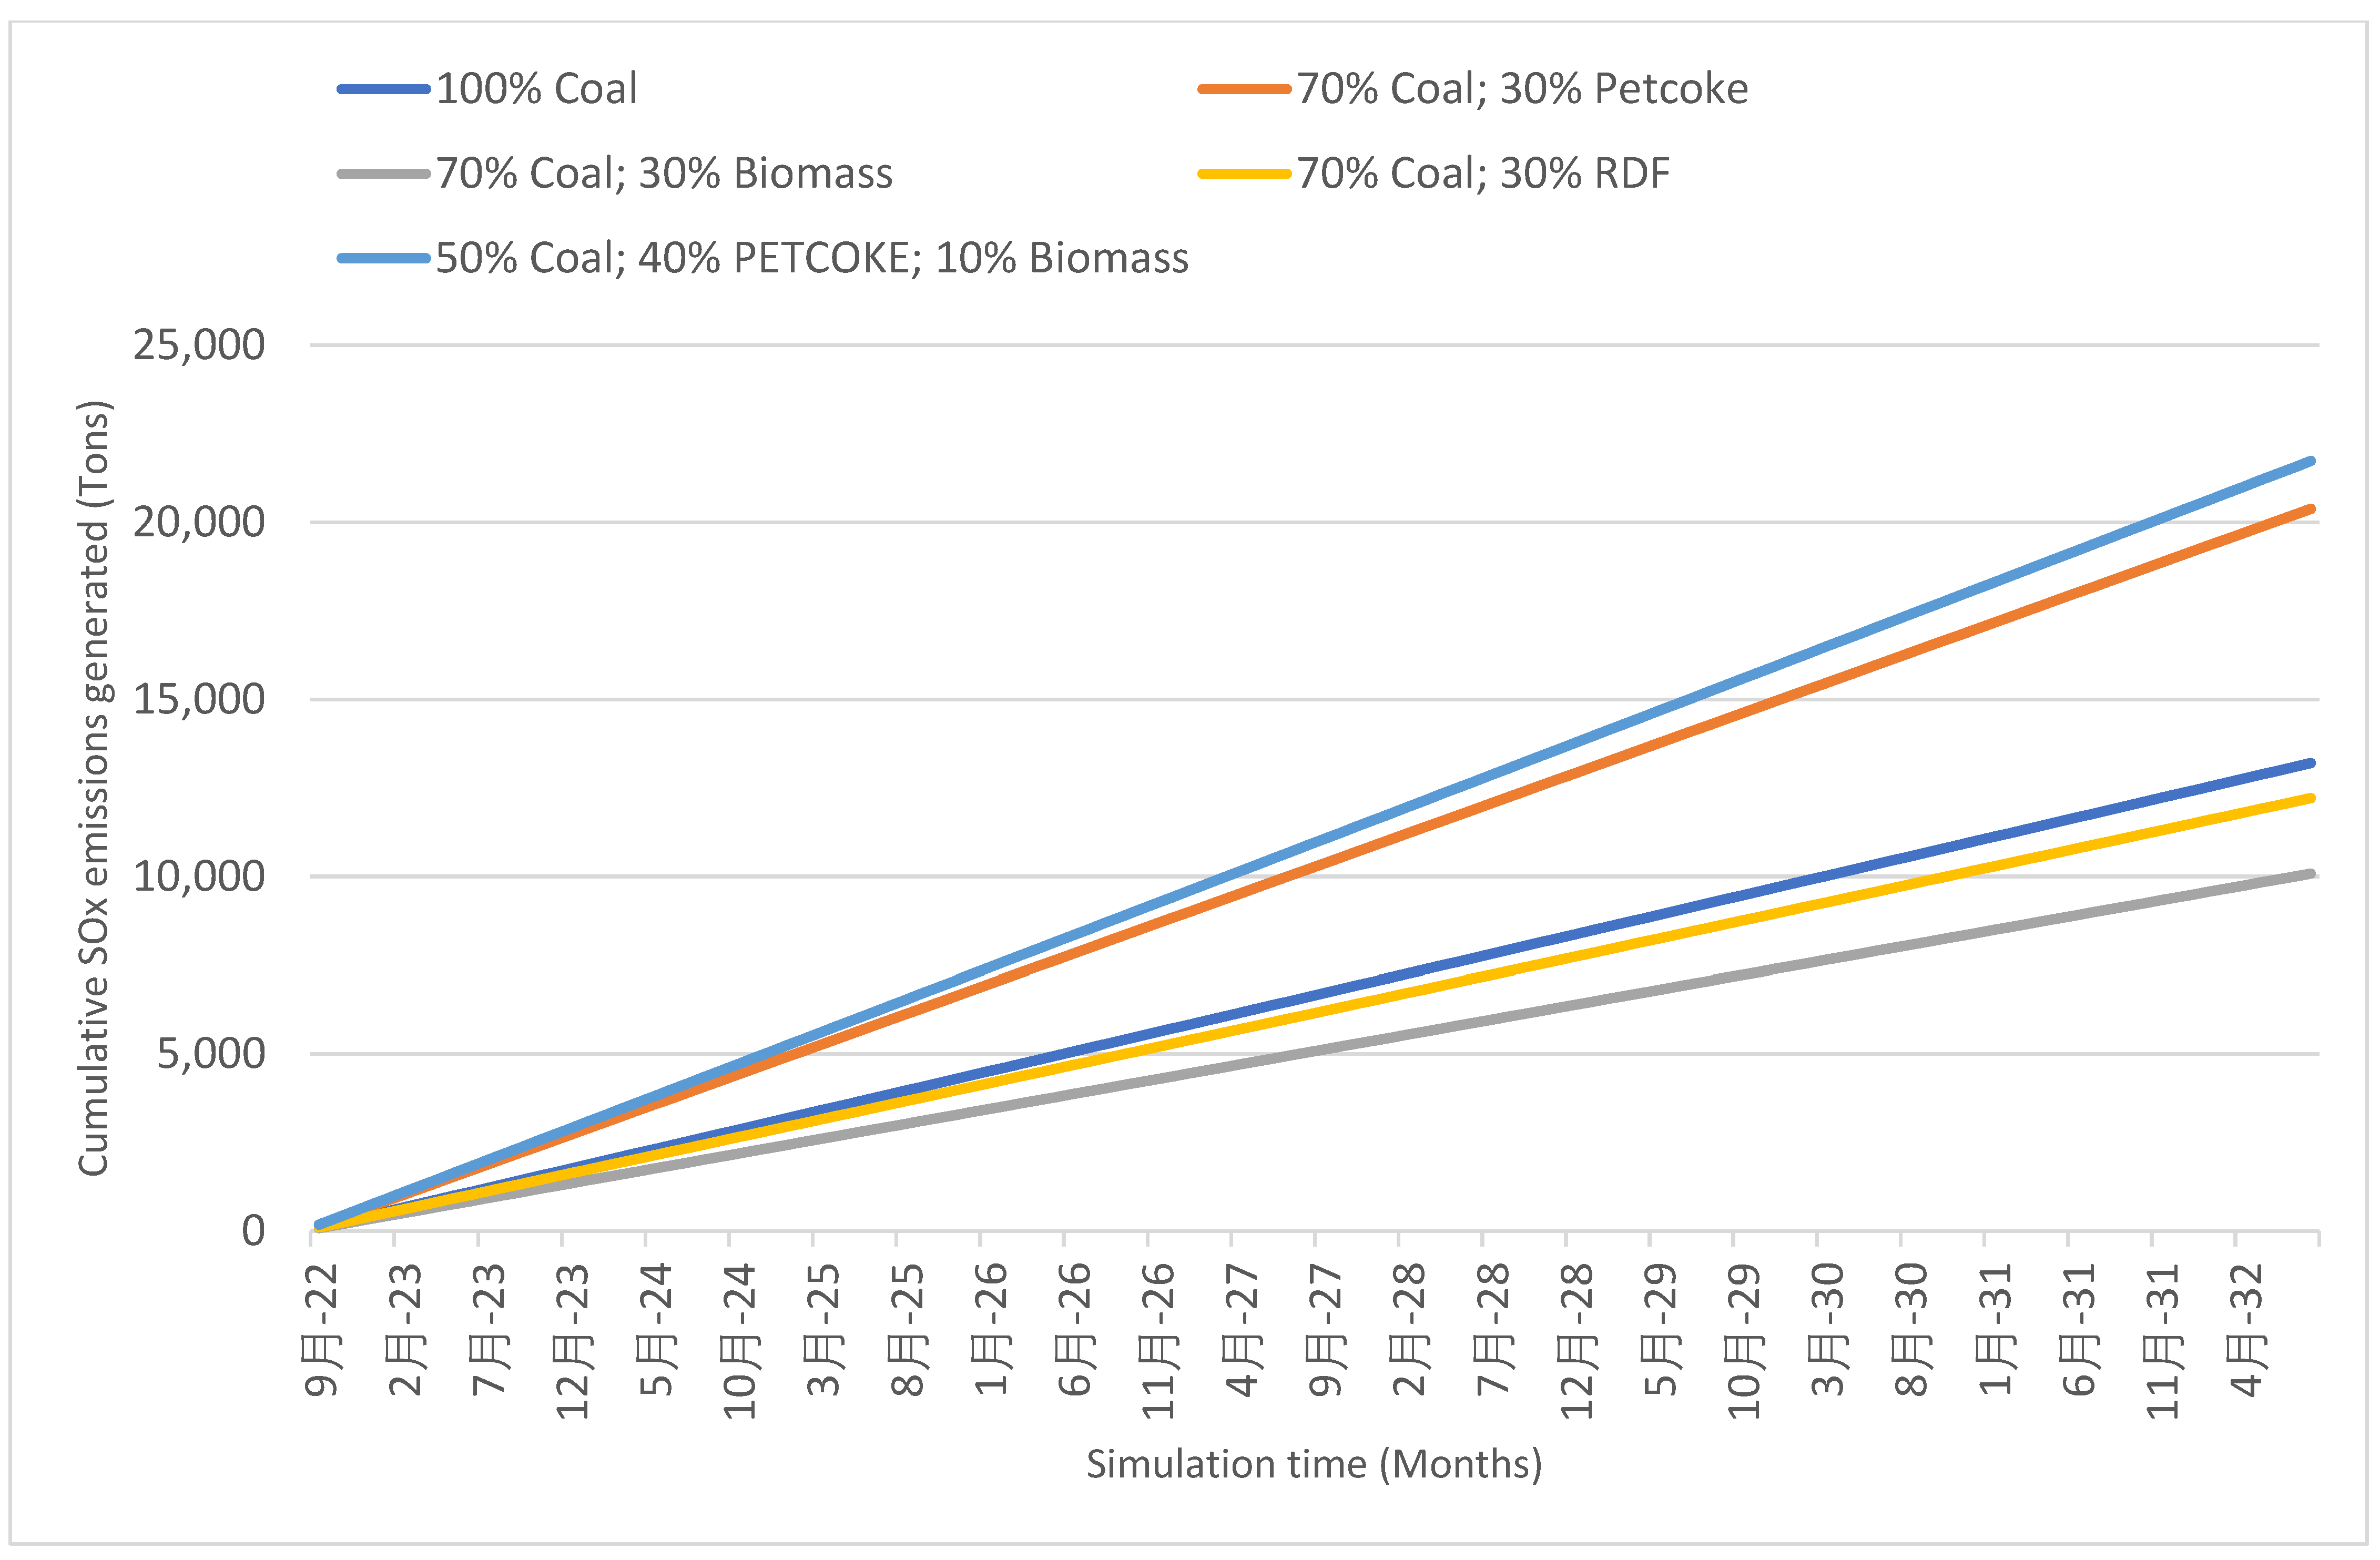
The amount of cumulative SOx emissions generated under each of the five fuel-mix configurations considered in this study is depicted in Figure 11. A combination of 70% Coal and 30% Biomass led to the least amount of SOx emissions among the configurations tested, which is 23.4% lower than using 100% coal.
Figure 11.
Cumulative SOx emissions generated from the fuel-burning system under different fuel-mix configurations.
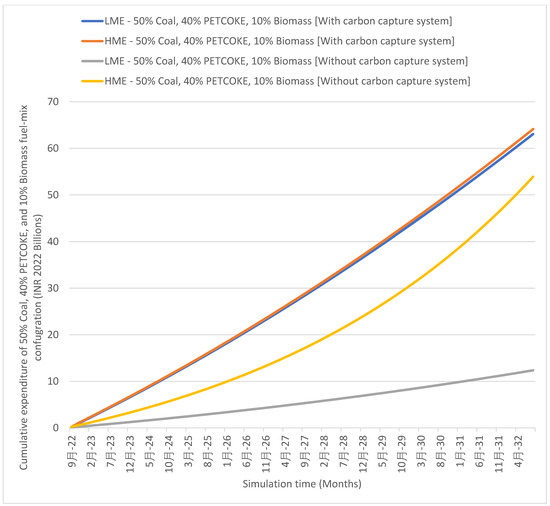
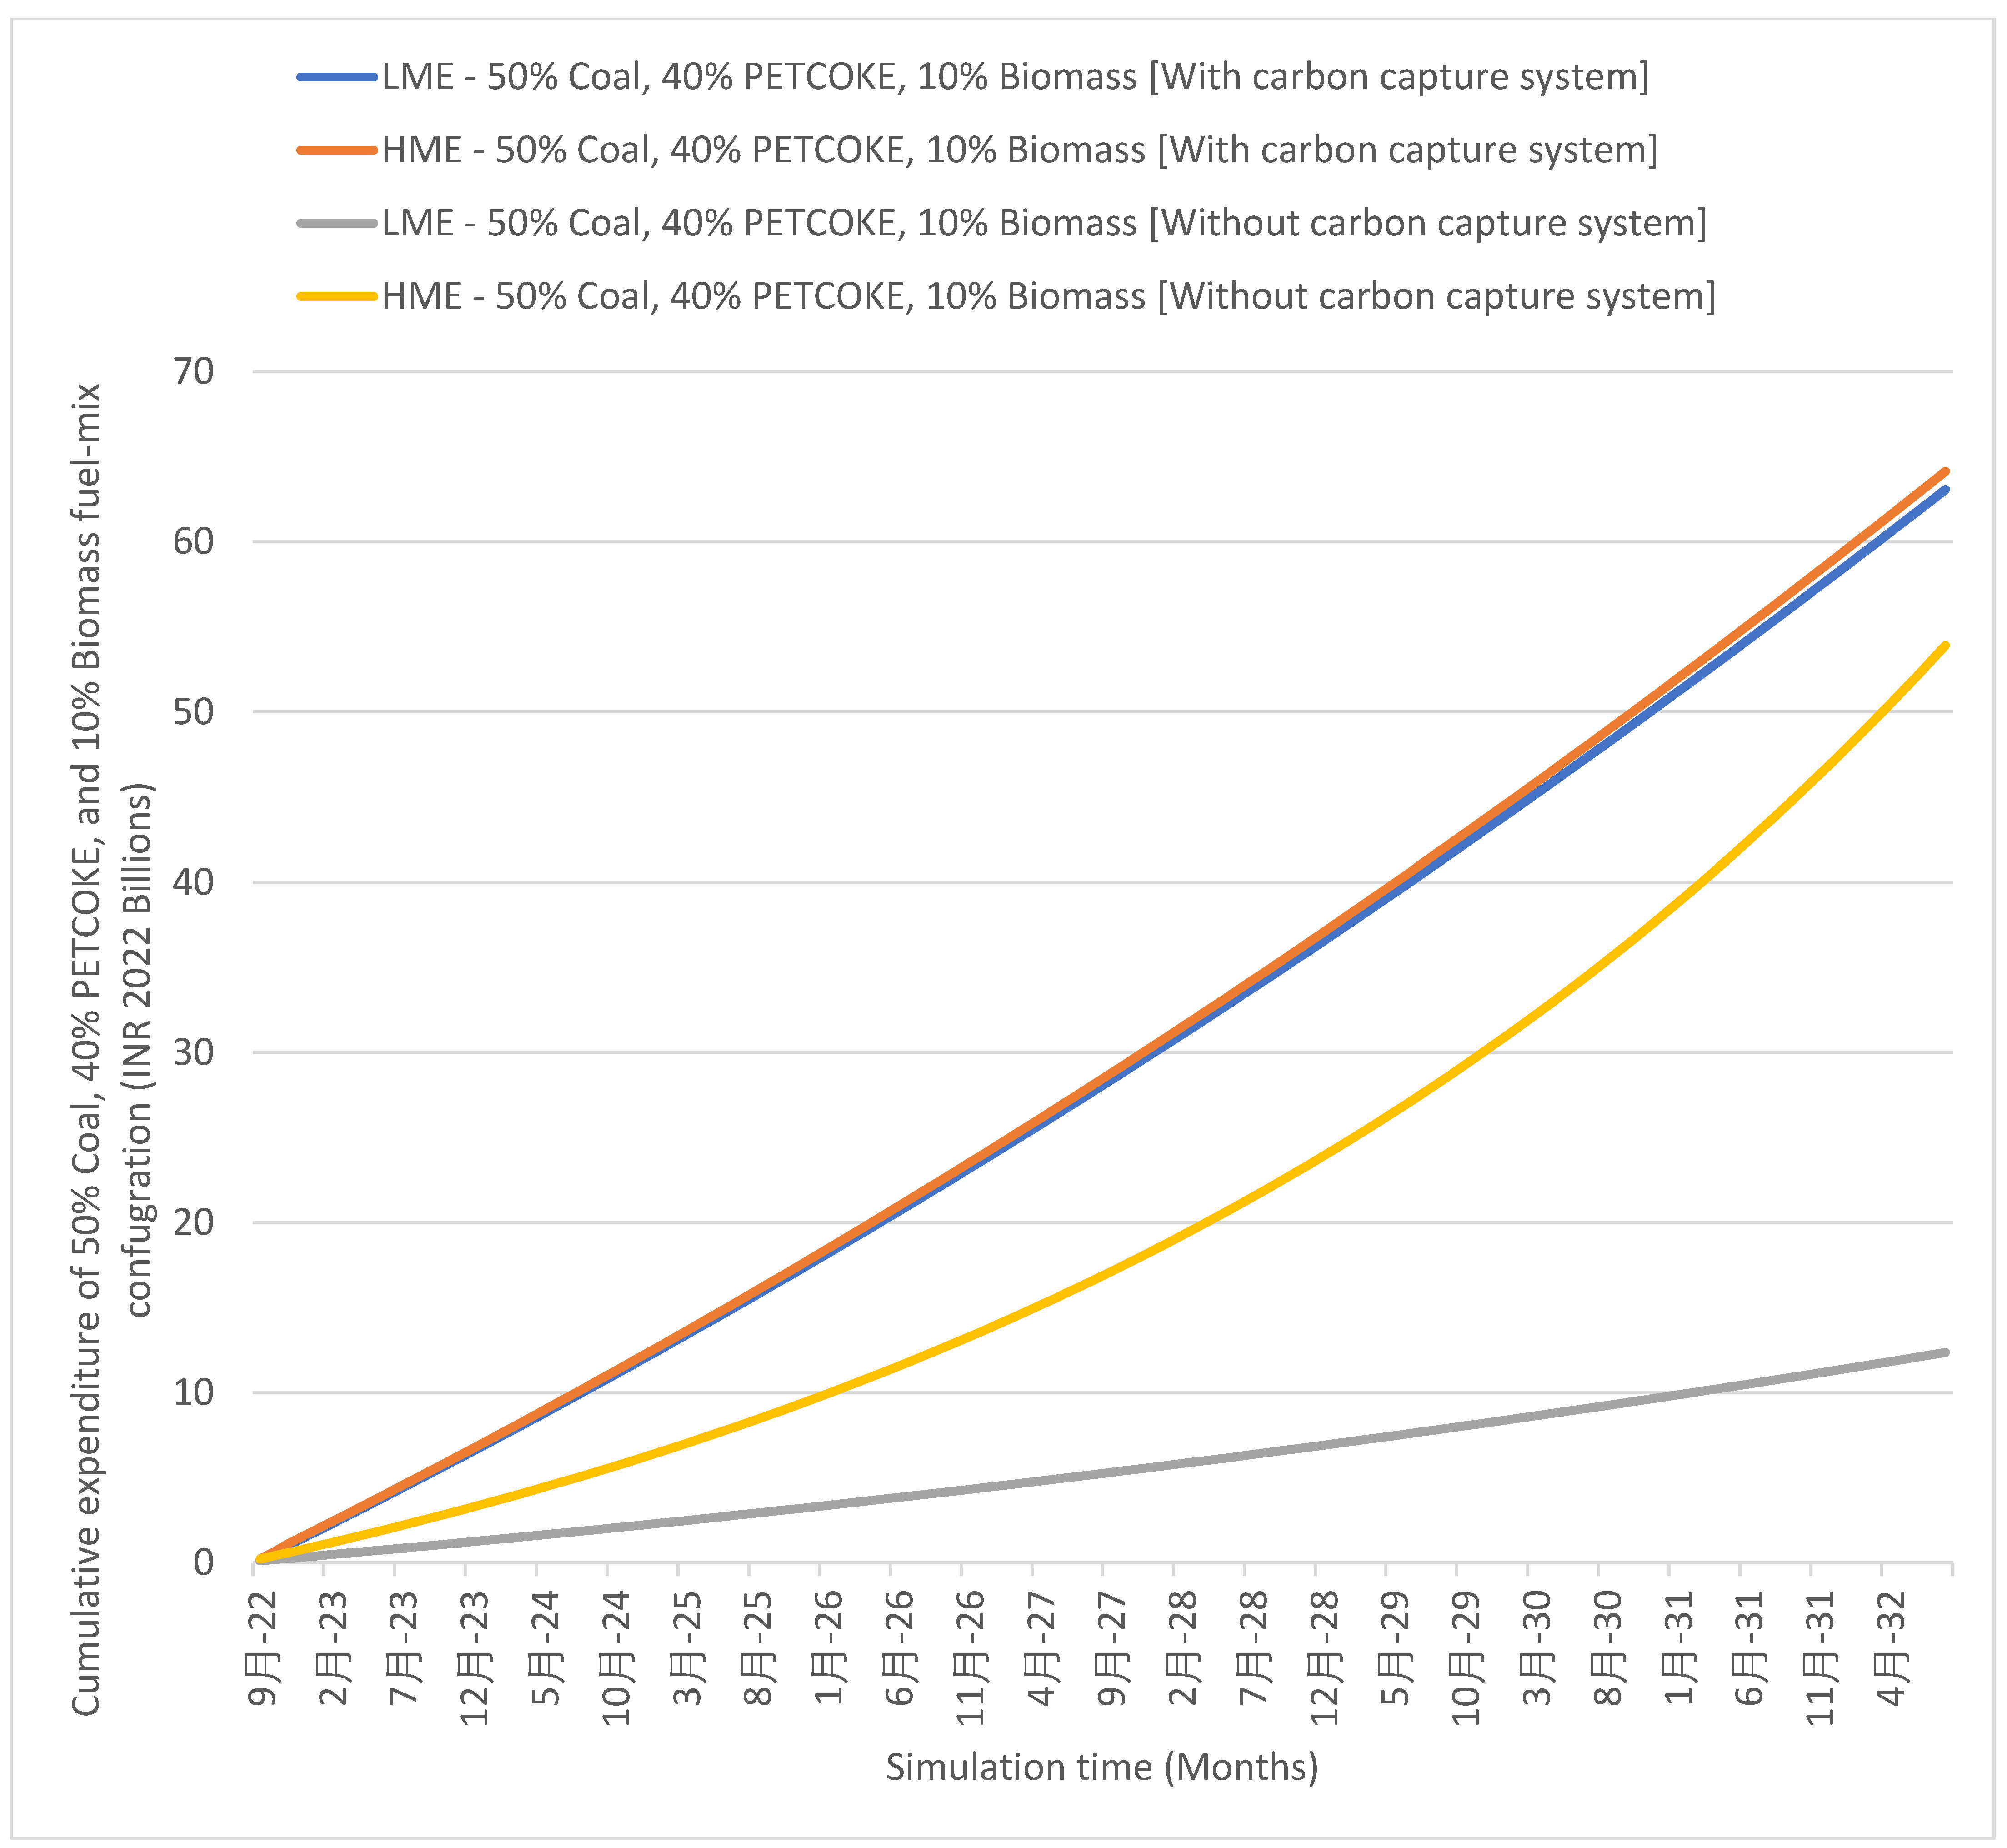
The impact of using a carbon capture system, specifically with the indirection carbonation method using Sodium Hydroxide, under LME and HME scenarios, is depicted in Figure 12. The capital expenditure of setting up a carbon capture facility in the plant is prohibitively high due to it being a relatively new application in the domain of emissions control and it would not be financially viable without introducing very high penalties for carbon emissions as it can be visualised in the figure. In the case of the LME scenario, the cumulative expenditure at the end of the simulation run with a carbon capture system is 80.3% higher than the cumulative expenditure without a carbon capture system. However, the higher carbon taxes in HME scenario meant having a carbon capture system resulted in 16% lower cumulative expenditure at the end of the simulation run.
Figure 12.
The effect of carbon capture system on the cumulative expenditure of 50% Coal, 40% PETCOKE, and 10% Biomass fuel mix under LME and HME scenarios.
4. Discussion
System dynamic simulation modelling allowed for the analysis of different fuel-mix configurations under varying market conditions and policy scenarios. By considering cumulative emissions and expenditures, the long-term impact of different fuel mixes could be analysed and compared with each other. As various governmental bodies in developing countries such as India attempt to enforce tighter regulations to curb SOx and NOx emissions, the simulation model constructed in this study allows for individual industrial plants that operate a boiler to find an optimal fuel mix configuration under varying market conditions, in terms of both tariffs and availability. The simulation experiments in this study were run using example data applicable for 40 TPH boilers operating under market conditions prevalent in India. Figure 9 shows that having low penalties for non-compliance provides no incentive for the stakeholders to adopt FGD or SNCR instead of paying the penalties. Table 3 describes the observations from the BAU, LME, and HME scenarios from the experiments conducted in the previous section.
Table 3.
Observations from the experiment results.
Under the BAU scenario, exclusively utilising fossil fuels such as coal and PETCOKE (fuel-mix configurations i and ii, as described in Section 2.4) led to the highest cumulative expenditure at the end of the simulation run due to increasing price trends of non-renewable fuels. Utilising a fuel mix of 70% coal and 30% biomass (cotton stalk) led to a significant reduction in cumulative expenditure due to the lower cost of procurement of cotton stalk from the local market and comparable GCV. As indicated in Figure 10, the penalties for emissions considered in scenarios LME and HME could be further tweaked to offer a significant advantage to utilising pollution control systems as opposed to paying the penalties for emissions. In terms of SOx emissions, a fuel mix of 50% coal, 40% PETCOKE, and 10% biomass led to the highest cumulative emissions, which is 53% higher than the configuration with the least cumulative emissions, i.e., 70% coal and 30% biomass. While utilising PETCOKE offers reduces the cumulative expenditure of fuel usage when compared to exclusively coal, it also increases the SOx emissions due to typically higher concentration of sulphur content in PETCOKE.
Based on the results obtained in Section 3, it is evident that it is important to ensure the cost of implementation of pollution control systems such as FGD and SNCR should be markedly lower than the cost of penalties in order to encourage the stakeholders in the industrial domains to adopt compliance measures. Similarly, the cost of technologies for carbon capture, especially in developing countries such as India, is prohibitively high and would require significantly high taxation for CO2 emissions, which also may adversely impact the financial sustainability of the plant. Based on the experiment results, it can be determined that replacing a portion of Coal with either biomass (cotton stalk in the current experiment) or RDF could lead to both the reduction in SOx emissions while also the operational expenditure of the plant. Additionally, in case of unavailability of either RDF or biomass at the plant location, PETCOKE could also be used as a substitute to reduce operational expenditure, but at a cost of additional Sox emissions, which could be mitigated using an additional FGD system. The model could also be utilised by policymakers to study the impact of various taxes and penalties for non-compliance on individual plants in order to determine an optimal balance between fostering faster adoption of pollution control measures and the financial sustainability of the local industry.
4.1. Limitations
The exogenous datasets used for running the experiments in this study are based on either published forecast data or linearly extrapolated historic data, thereby the accuracy of the quantitative results is dependent on the accuracy of the forecasts and extrapolated trends. Therefore, the quantitative results discussed in the study are meant to demonstrate the application of the model constructed in this study and should only be considered as an approximation of future trends. Additionally, the SNCR module featured in this model does not compute the NOx emissions in the outlet flue gas due to the complexity of the calculations and would require the plant stakeholders using this model to input the data from their existing measurement devices. As such, the module may only be applicable to existing plants that are already operational and have a pollution measurement sensor installed and not new plants that are yet to be constructed or commissioned.
4.2. Considerations for Future Work
The model can be further improved by embedding relevant, multi-regional, accurate datasets that would further improve the ease of using the model by the stakeholders in the industry to find an optimal fuel mix configuration for their specific plant. This would facilitate quicker adoption of pollution control measures in the industries. Additionally, the SNCR module could be improved to include calculations of NOx emissions without the use existing sensor data to improve applicability of the model to even new plants that are to be commissioned. Selective Catalytic Reduction (SCR) system could also be appended to the model, which while are more expensive to implement than SNCR, it could be relevant in large boilers where an SNCR system might not be sufficient to meet the emission norms for NOx emissions.
5. Conclusions
An SD model for assessing different fuel-mix configurations for industrial boilers in terms of SOx, NOx, and CO2 emissions as well as expenditure is developed in this study. For demonstrating the utility of the model, exemplar data based on prevalent market conditions in India was utilised and simulated under different scenarios for a period of 10 years. The results from the simulation revealed the significance of having appropriate emission penalties to foster the adoption of pollution control measures in industries that utilise boilers in their production processes. Furthermore, the model could be adapted to any specific plant that utilises an industrial boiler by modifying the relevant input datasets and parameters applicable to the plant and the local market conditions. The models could also be additionally utilised by the policymakers to design penalties and taxes that would hasten adoption of pollution control systems without adversely impacting the financial sustainability of the local industry. The study concludes with recommendations for improvements to the current model in future research as well as the inclusion of more pollution control systems that would further boost the applicability of the current model as a decision-making tool for choosing fuel-mix configurations for optimising emissions and expenditure.
Supplementary Materials
The following supporting information can be downloaded at: https://www.mdpi.com/article/10.3390/en16010149/s1. The datasets used for running the experiments in this study are attached as Supplementary S1.
Author Contributions
Writing—original draft preparation, data curation A.K.; writing—review, supervision, funding acquisition, B.M. All authors have read and agreed to the published version of the manuscript.
Funding
This research received no external funding.
Data Availability Statement
Dataset used in this simulation is available as supplementary dataset S1.
Conflicts of Interest
The authors declare no conflict of interest.
Appendix A
The stock-and-flow diagrams and the variable descriptions of the model described in the study are enclosed in this section.
Table A1.
Description of the variables used in the proposed model.
Figure A1.
Stock-and-flow diagram of the flue-gas desulphurisation system.
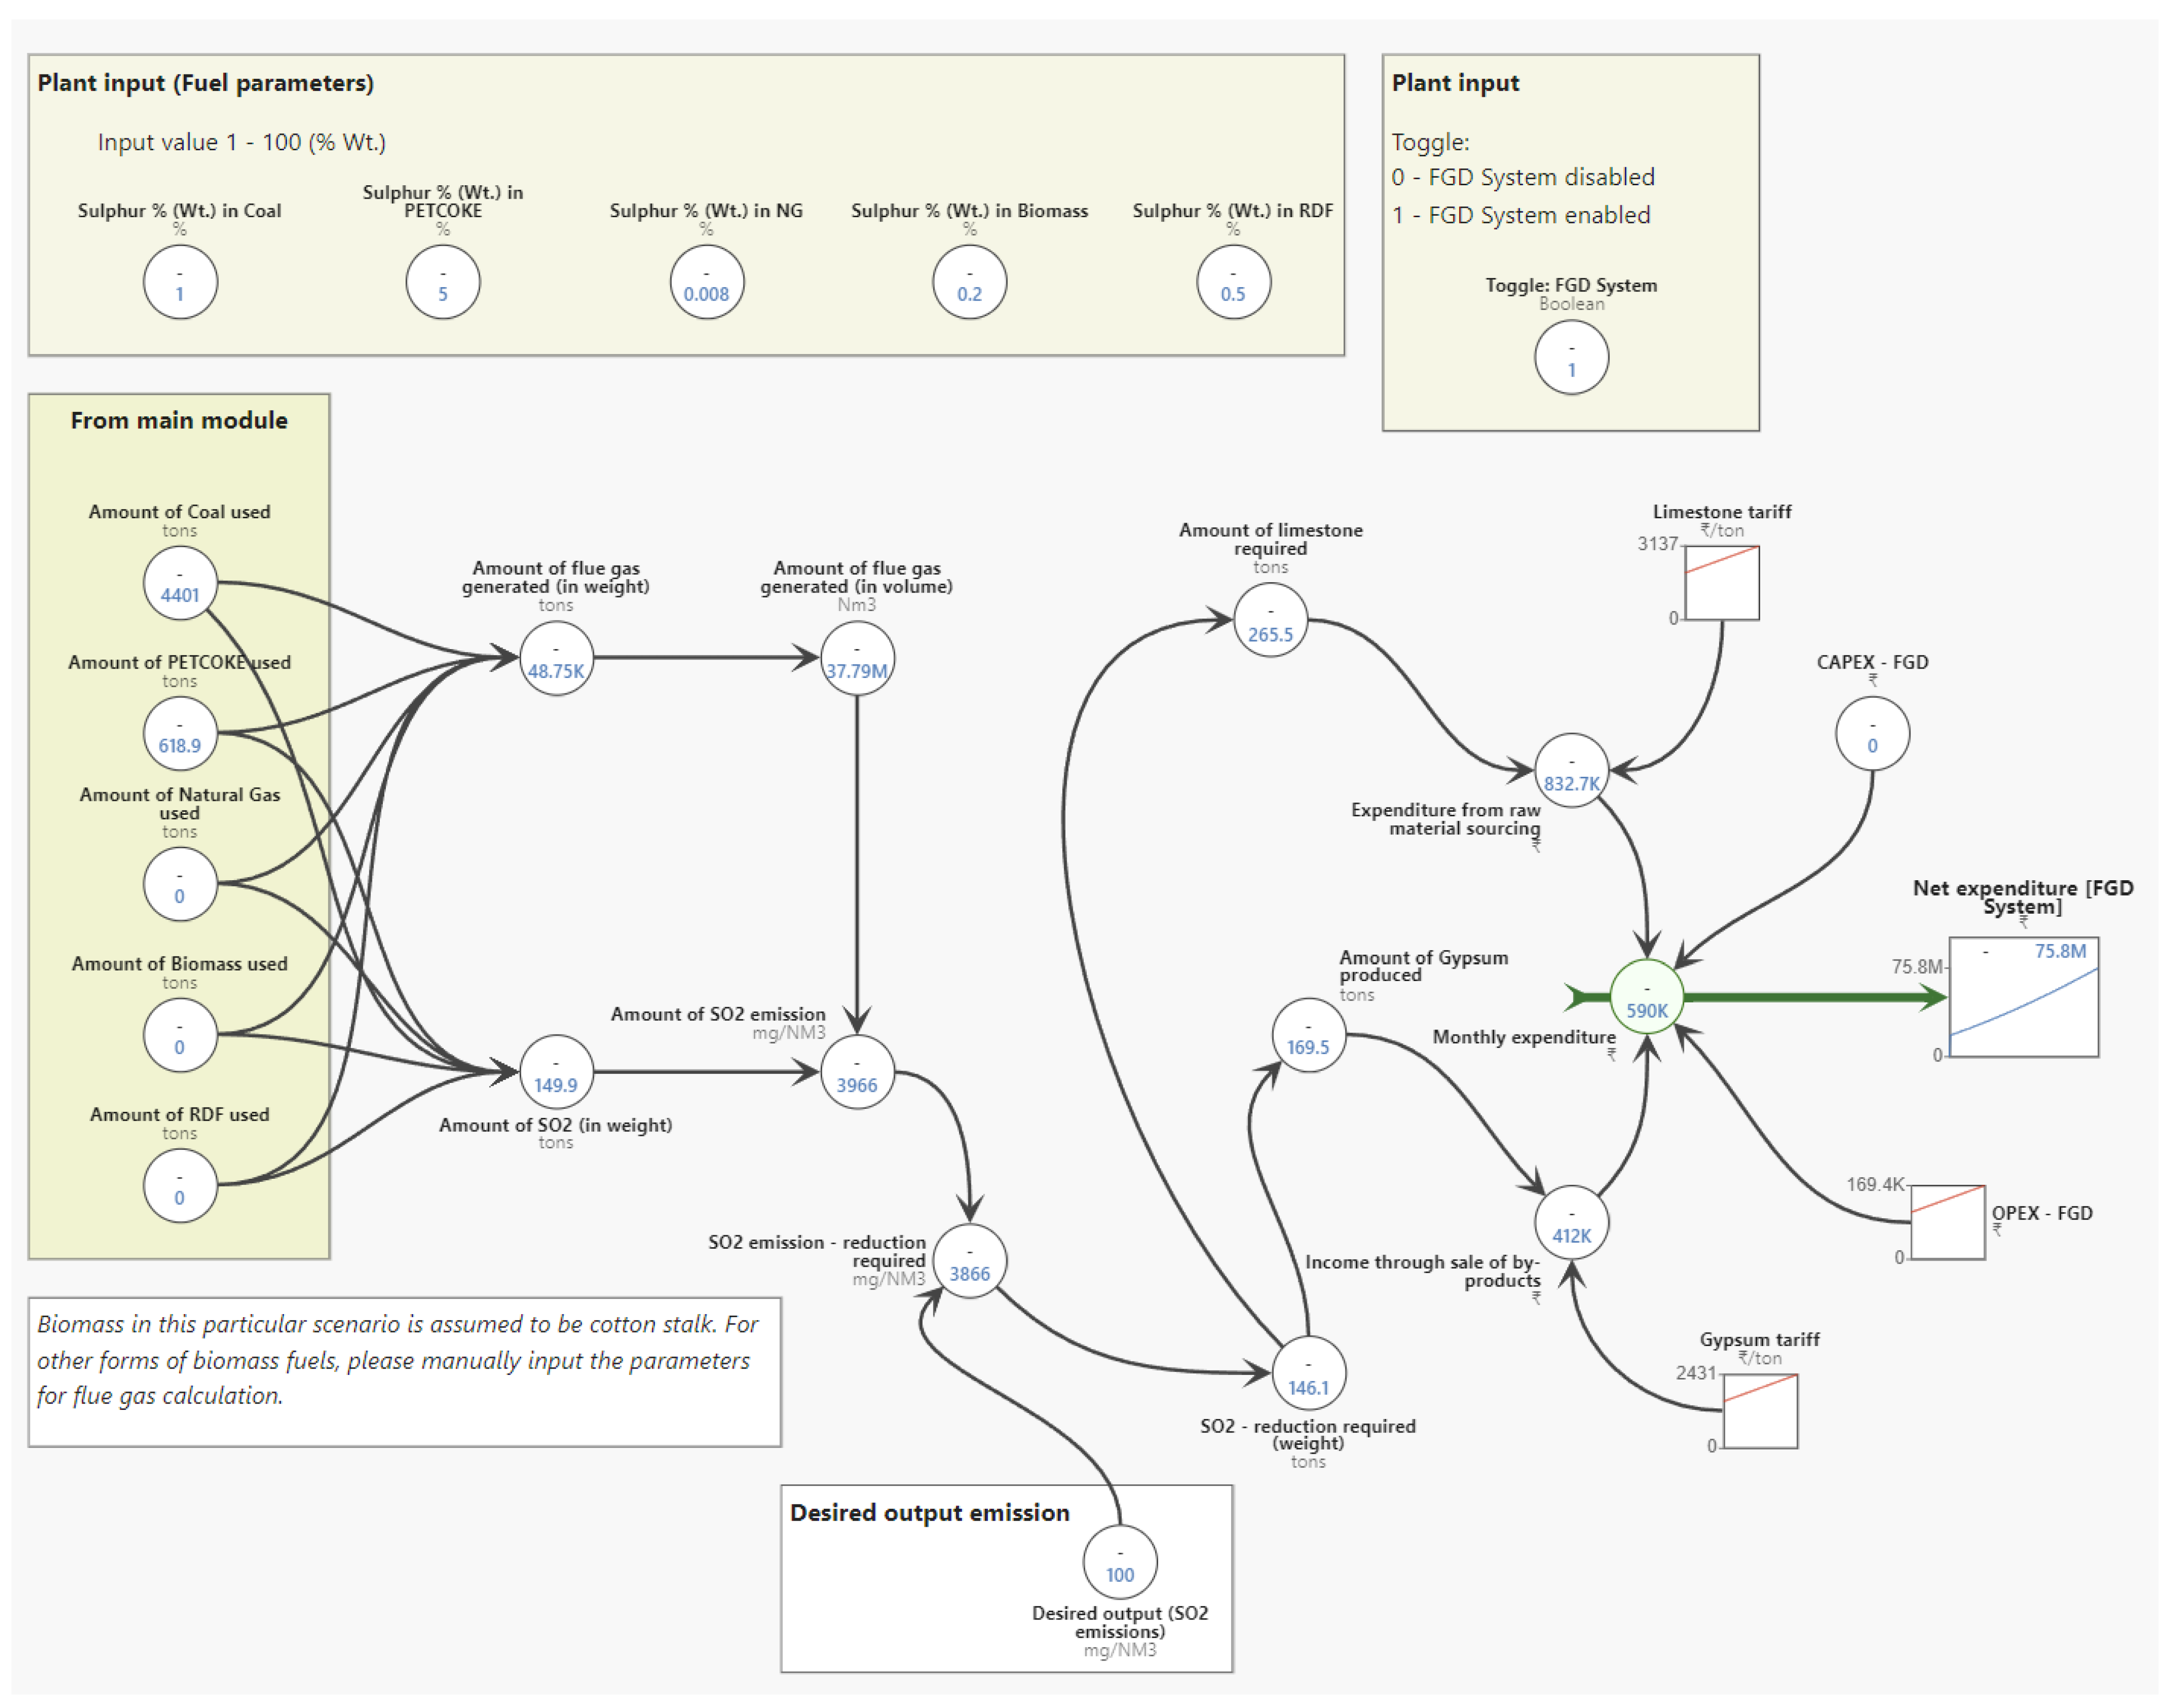
Table A2.
Description of the variables used in the FGD Module.
Figure A2.
Stock-and-flow diagram of the selective non-catalytic reduction system.
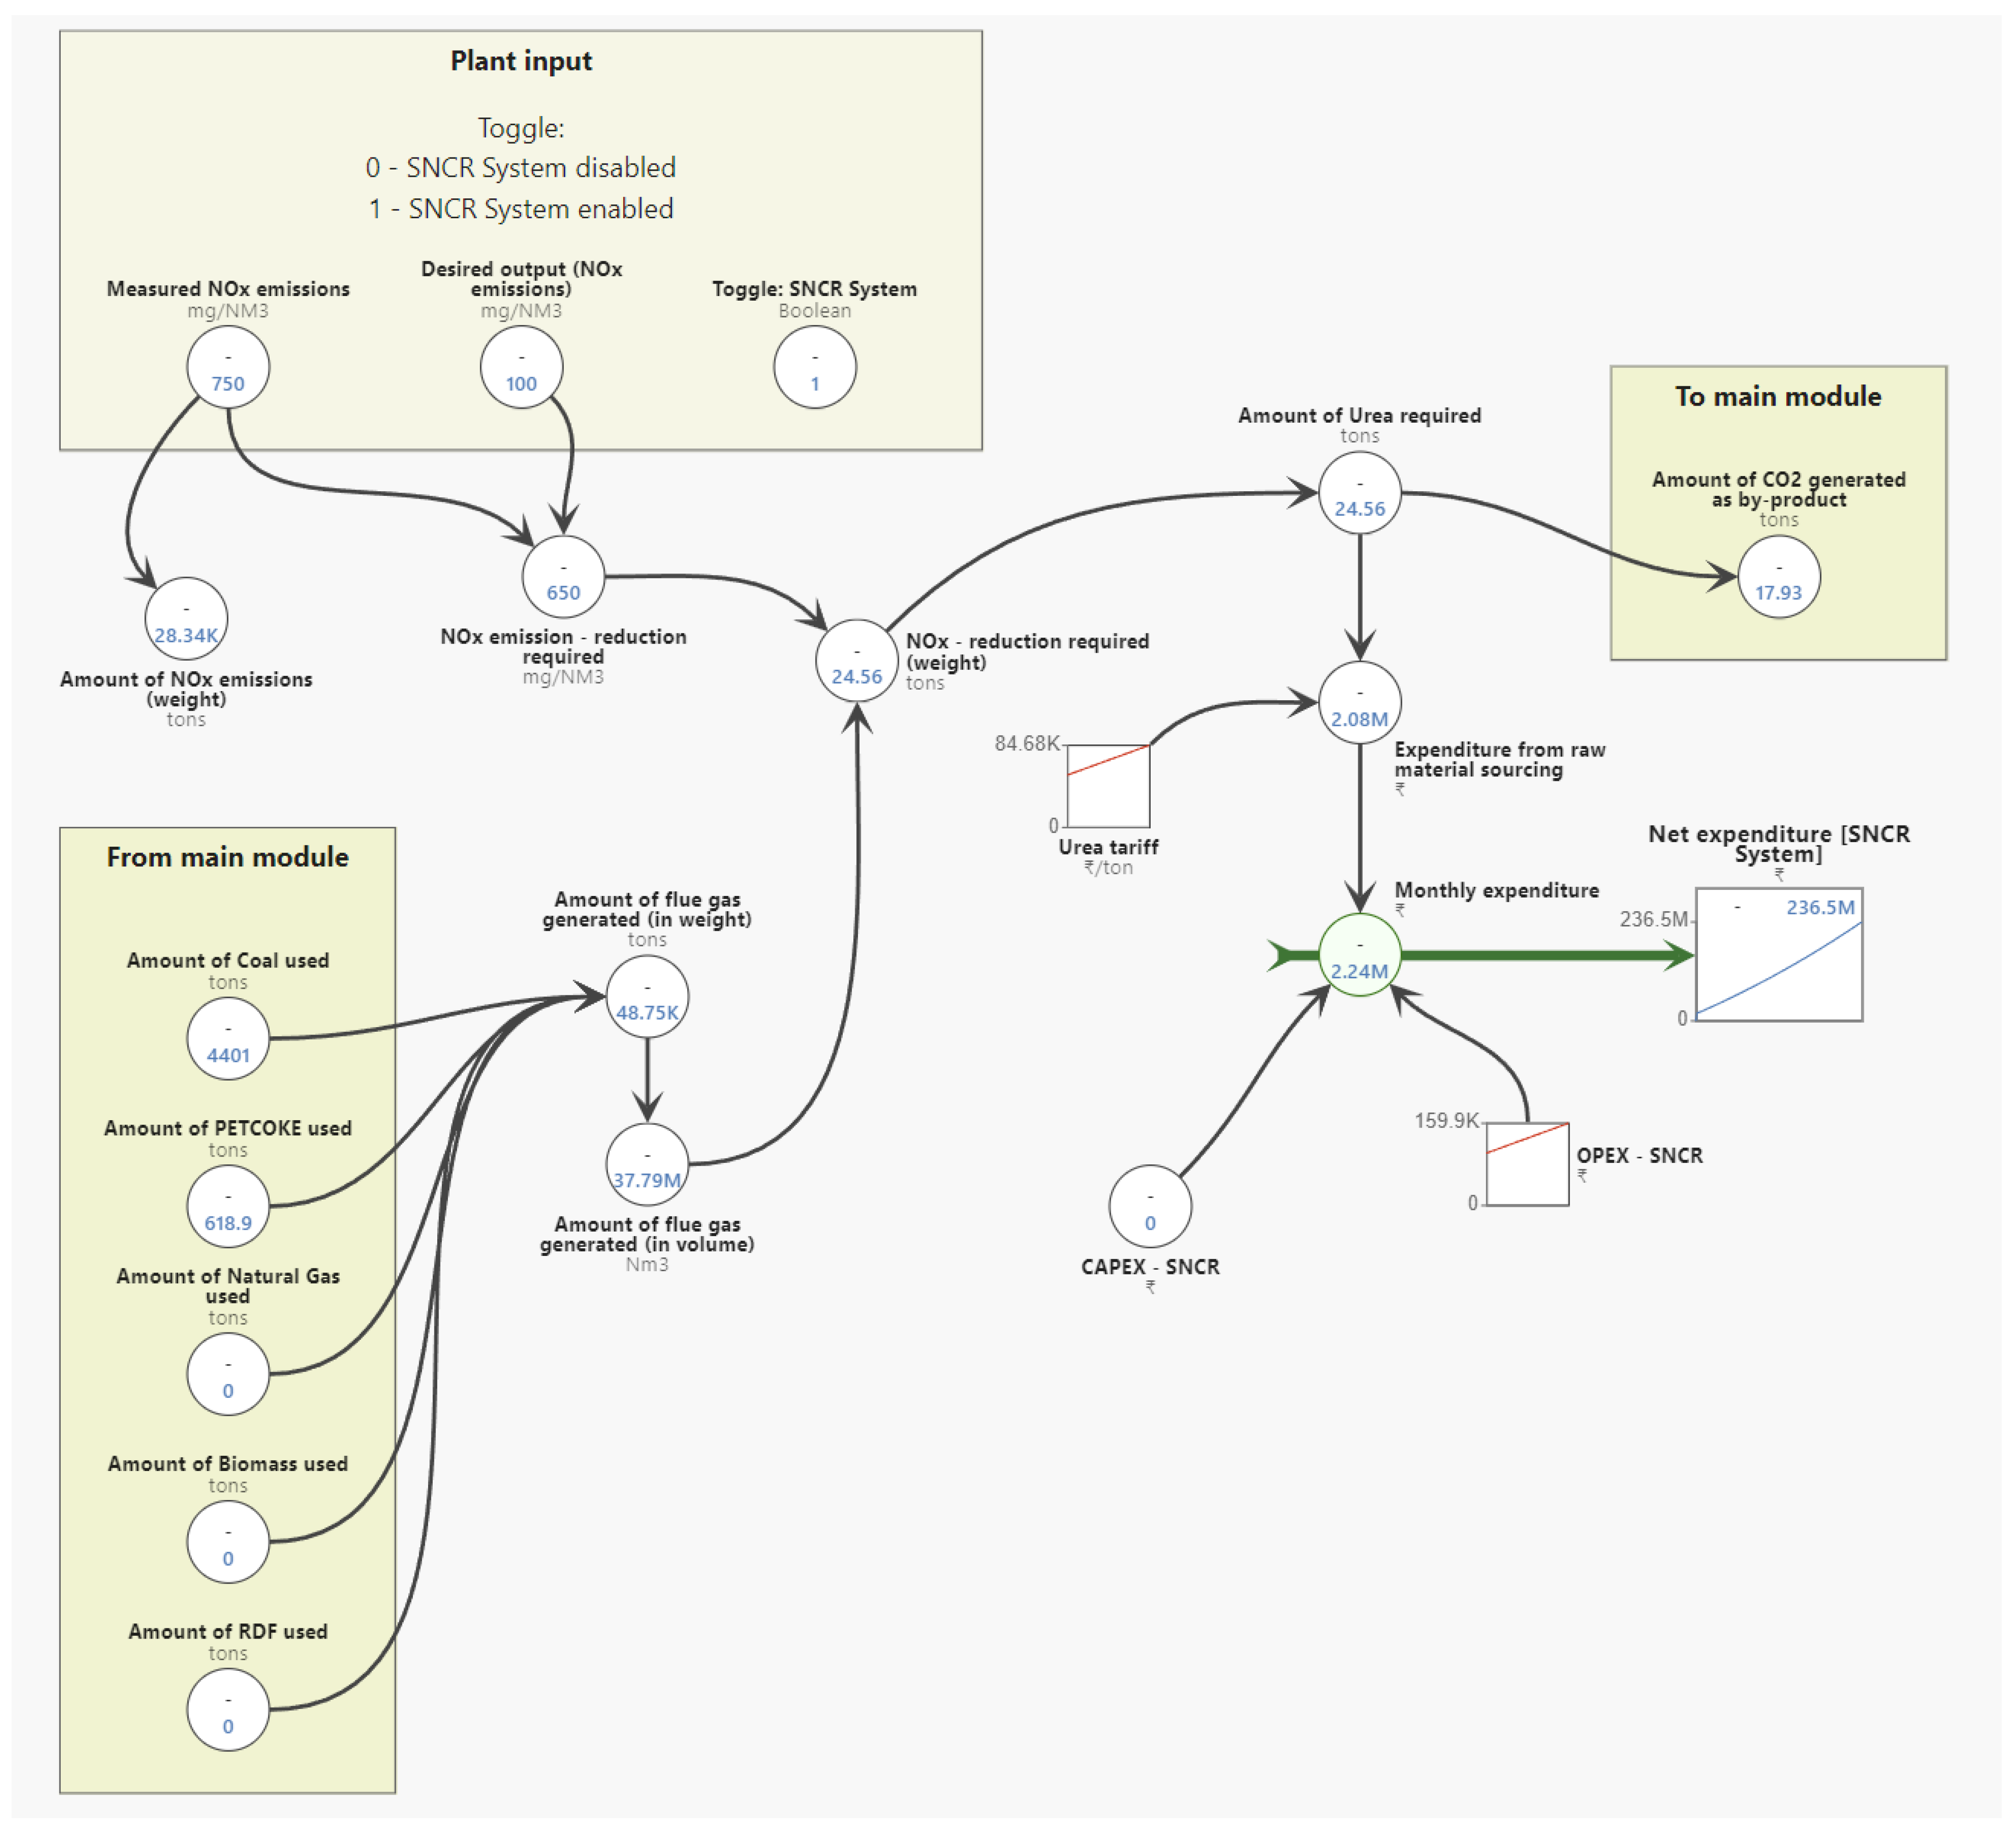
Table A3.
Description of the variables used in the SNCR Module.
Figure A3.
Stock-and-flow diagram of the carbon capture system.
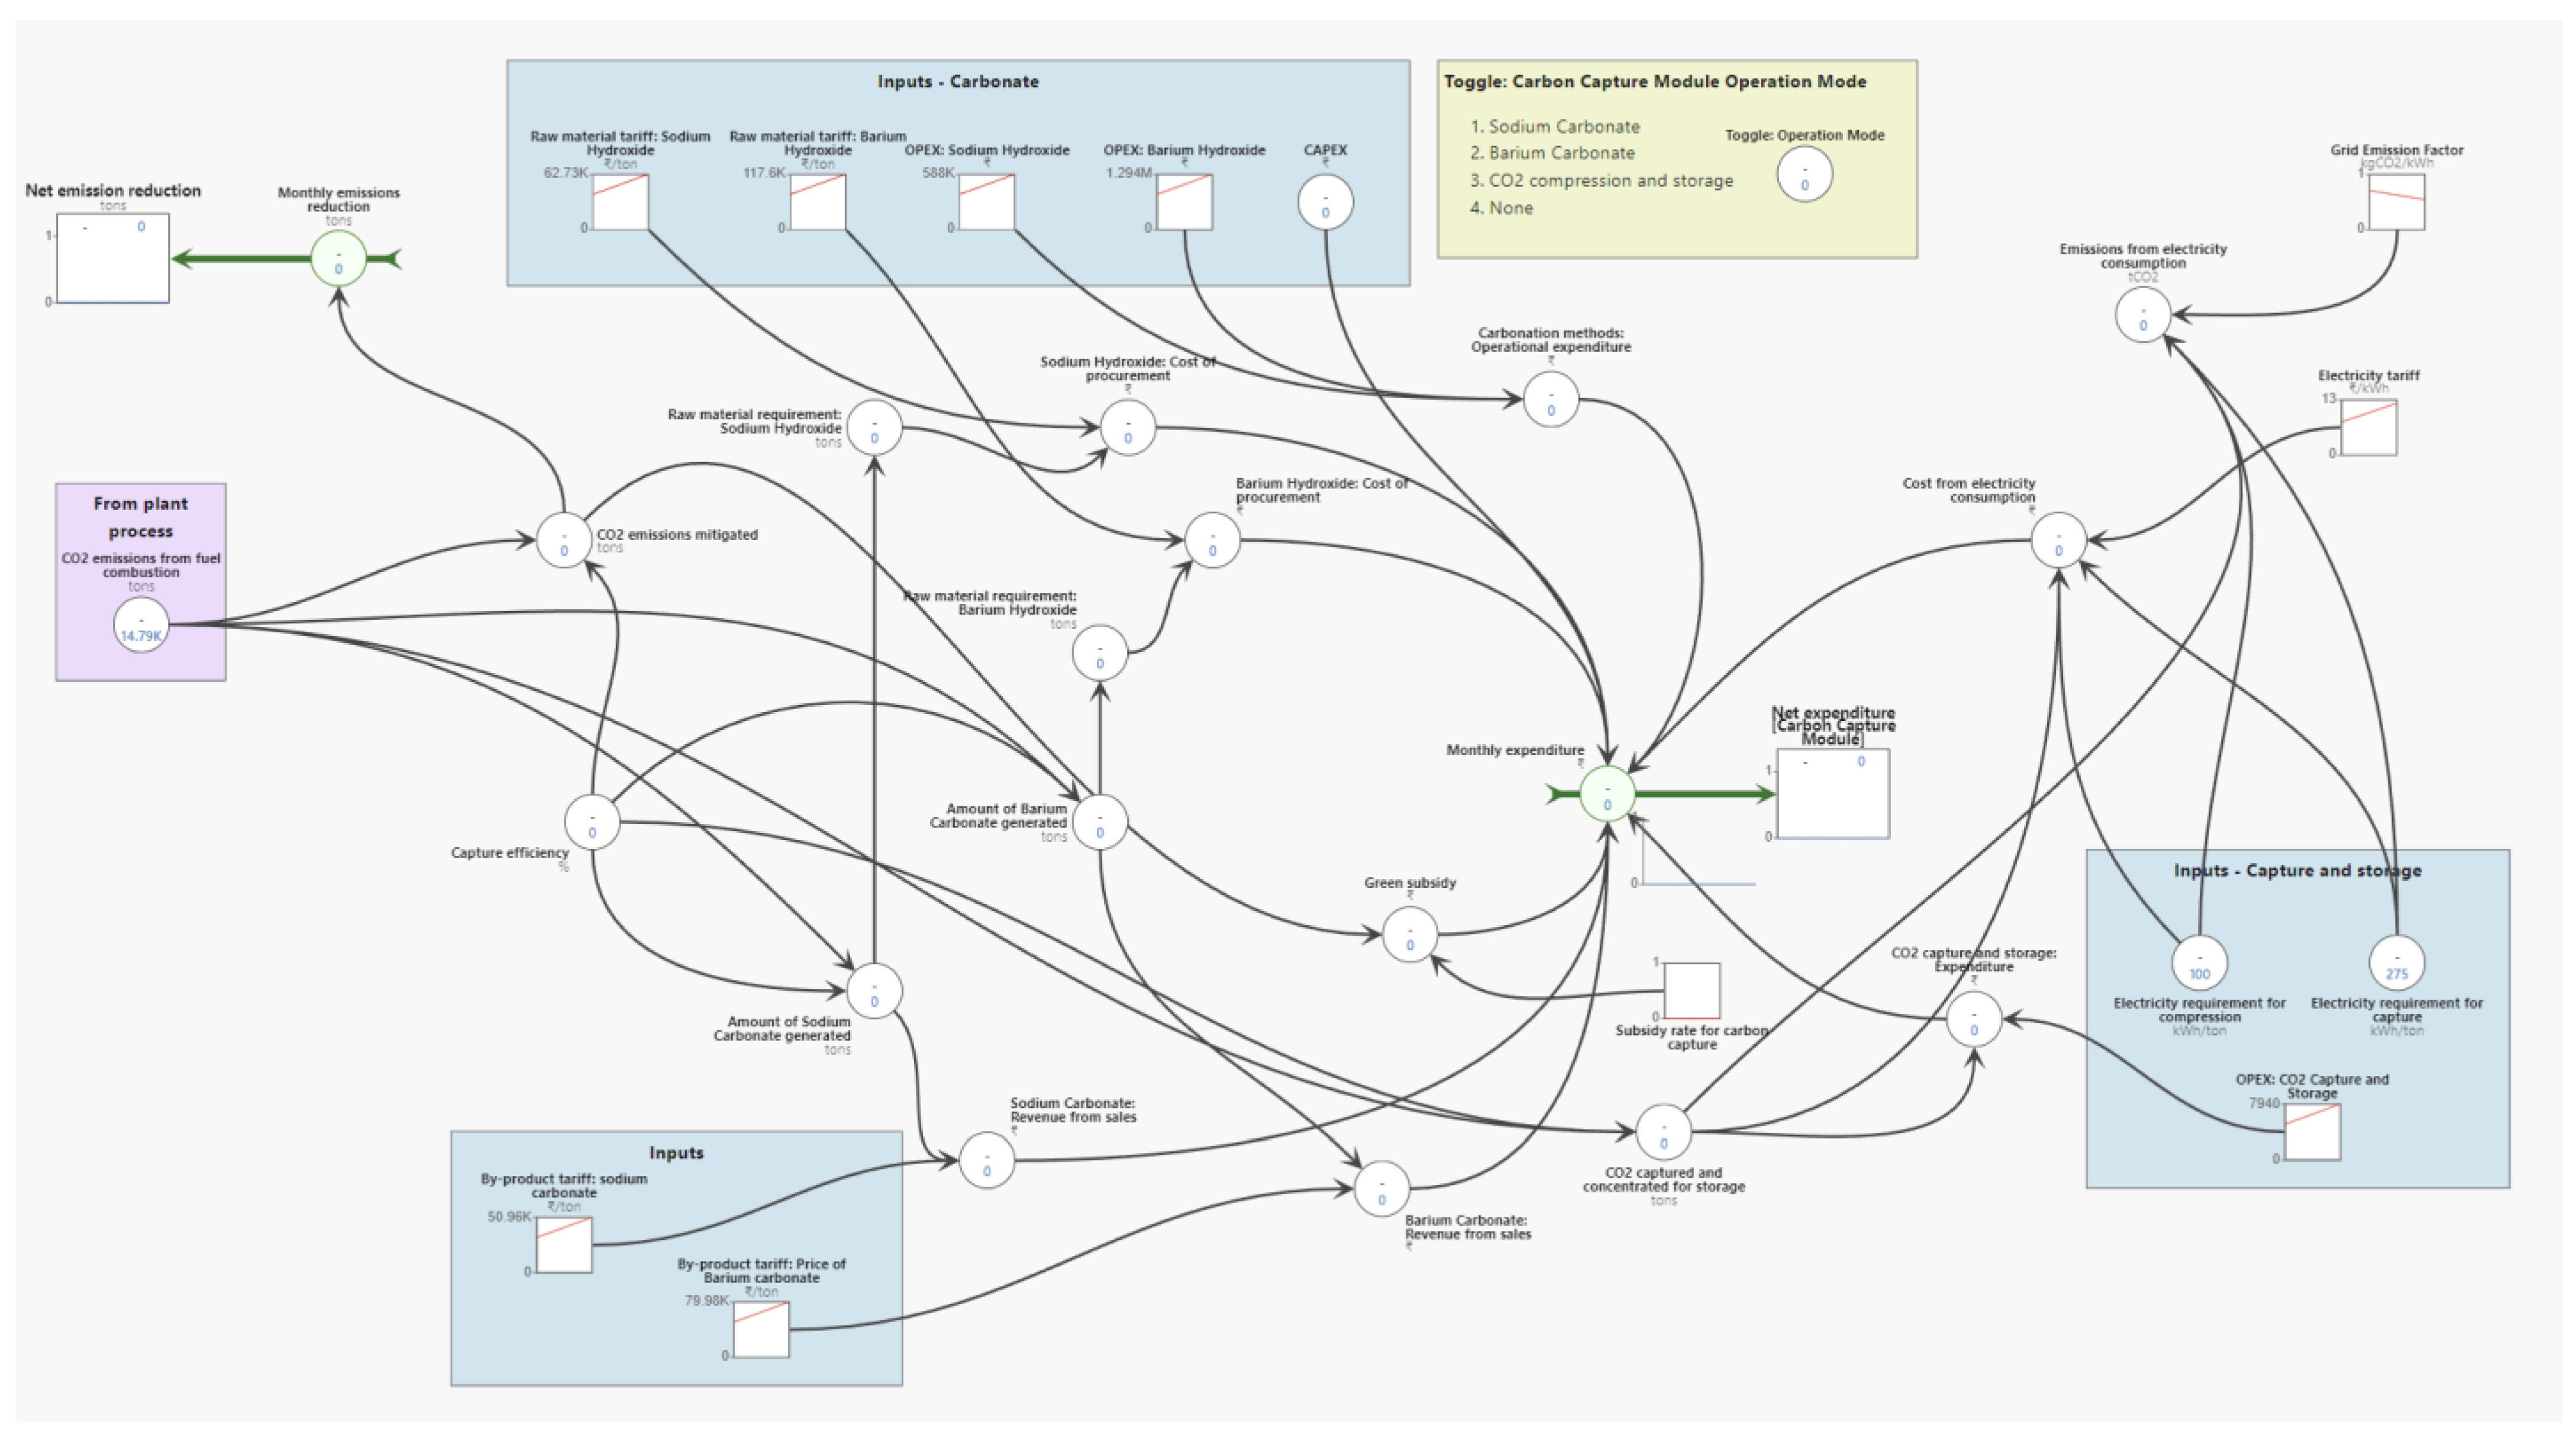
Table A4.
Description of the variables used in the Carbon Capture Module.
Appendix B
The typical sulphur content used present in fuels is depicted in Table A5, which was used in the simulation experiments.
Table A5.
Sulphur content in various fuels typically used in fuel burning systems.
References
- China: New Emission Standards for Power Plants. Air Pollution & Climate Secretariat. October 2012. Available online: https://www.airclim.org/acidnews/china-new-emission-standards-power-plants (accessed on 27 November 2022).
- A Review Report on New SO2 Norms. Union Ministry of Environment, Forest and Climate Change. August 2021. Available online: https://cea.nic.in/wp-content/uploads/tprm/2021/08/A_review_report_on_new_SO2_norms.pdf (accessed on 27 November 2022).
- Milićević, A.; Belošević, S.; Crnomarković, N.; Tomanović, I.; Stojanović, A.; Tucaković, D.; Deng, L.; Che, D. Numerical study of co-firing lignite and agricultural biomass in utility boiler under variable operation conditions. Int. J. Heat Mass Transf. 2021, 181, 121728. [Google Scholar] [CrossRef] [Scilit]
- Wils, A.; Calmano, W.; Dettmann, P.; Kaltschmitt, M.; Ecke, H. Reduction of fuel side costs due to biomass co-combustion. J. Hazard. Mater. 2012, 207–208, 147–151. [Google Scholar] [CrossRef] [Scilit] [PubMed]
- McIlveen-Wright, D.; Huang, Y.; Rezvani, S.; Mondol, J.; Redpath, D.; Anderson, M.; Hewitt, N.; Williams, B. A Techno-economic assessment of the reduction of carbon dioxide emissions through the use of biomass co-combustion. Fuel 2011, 90, 11–18. [Google Scholar] [CrossRef] [Scilit]
- Lintunen, J.; Kangas, H.-L. The case of co-firing: The market level effects of subsidizing biomass co-combustion. Energy Econ. 2010, 32, 694–701. [Google Scholar] [CrossRef] [Scilit]
- Kunche, A.; Mielczarek, B. Application of System Dynamic Modelling for Evaluation of CO2 Emissions and Expenditure for Captive Power Generation Scenarios in the Cement Industry. Energies 2021, 14, 3115. [Google Scholar] [CrossRef] [Scilit]
- Mwanza, M.; Ulgen, K. Sustainable electricity generation fuel mix analysis using an integration of multicriteria decision-making and system dynamic approach. Int. J. Energy Res. 2020, 44, 9560–9585. [Google Scholar] [CrossRef] [Scilit]
- Romagnoli, F.; Barisa, A.; Dzene, I.; Blumberga, A.; Blumberga, D. Implementation of different policy strategies promoting the use of wood fuel in the Latvian district heating system: Impact evaluation through a system dynamic model. Energy 2014, 76, 210–222. [Google Scholar] [CrossRef] [Scilit]
- Pamık, M.; Nuran, M.; Cerit, A. Emission reduction technologies for marine diesel engines: A system dynamics approach. Dokuz Eylül Üniversitesi Denizcilik Fakültesi Derg. 2015, 7, 55–74. [Google Scholar] [CrossRef] [Scilit]
- New norms for thermal plants may dent India’s emission targets: Experts. Hindustan Times. 12 April 2021. Available online: https://www.hindustantimes.com/india-news/paying-emission-fines-cheaper-for-thermal-plants-than-following-norms-101618167373910.html (accessed on 28 November 2022).
- Complainville, C.; Martins, J.O. NOx/SOx Emissions and Carbon Abatement; OECD: Paris, France, 1994. [Google Scholar] [CrossRef]
- Proaño, L.; Sarmiento, A.T.; Figueredo, M.; Cobo, M. Techno-economic evaluation of indirect carbonation for CO2 emissions capture in cement industry: A system dynamics approach. J. Clean. Prod. 2020, 263, 121457. [Google Scholar] [CrossRef] [Scilit]
- The Core Simulation Elements of Silico Simulation Models. Available online: https://www.silicoai.com//blog-post/the-core-simulation-elements-of-silico-simulation-models (accessed on 1 December 2022).
- Press Trust of India. Govt gives two-year extension to thermal power plants on SO2 norms. Business Standard. 6 September 2022. Available online: https://www.business-standard.com/article/current-affairs/govt-gives-two-year-extension-to-thermal-power-plants-on-so2-norms-122090601180_1.html (accessed on 2 December 2022).
- National Coal Index|Ministry of Coal, GOI. Available online: https://coal.nic.in/nominated-authority/national-coal-index (accessed on 3 December 2022).
- International Monetary Fund. Global price of Natural gas, EU. FRED, Federal Reserve Bank of St. Louis. 1 January 1985. Available online: https://fred.stlouisfed.org/series/PNGASEUUSDM (accessed on 3 December 2022).
- Consumer Price Index | Ministry of Labour & Employment. Available online: https://labour.gov.in/consumer-price-index (accessed on 3 December 2022).
- IndiaMART—Indian Manufacturers Suppliers Exporters Directory, India Exporter Manufacturer. IndiaMART. Available online: https://www.indiamart.com (accessed on 3 December 2022).
- Financial Studies & Assistance Division. Central Electricity Authority. Available online: https://cea.nic.in/financial-studies-assistance-division/?lang=en (accessed on 3 December 2022).
- CDM—CO2 Baseline Database. Central Electricity Authority. Available online: https://cea.nic.in/cdm-co2-baseline-database/?lang=en (accessed on 3 December 2022).
- SULFUR OXIDES (SOX) EMISSIONS FROM COAL. National Energy Technology Laboratory, US Department of Energy. Available online: https://netl.doe.gov/research/coal/energy-systems/gasification/gasifipedia/sox-emissions#:~:text=Typically%20coal%20contains%20anywhere%20from,percent%20sulfur%20by%20dry%20weight (accessed on 27 November 2022).
- Petroleum Processing: Natural Gas Composition and Specifications. College of Earth and Mineral Sciences, PennState. Available online: https://www.e-education.psu.edu/fsc432/content/natural-gas-composition-and-specifications (accessed on 27 November 2022).
- Tripathi, N.; Singh, R.S.; Hills, C.D. Microbial removal of sulphur from petroleum coke (petcoke). Fuel 2018, 235, 1501–1505. [Google Scholar] [CrossRef] [Scilit]
- Ganesh, T.; Vignesh, P.; Kumar, G.A. Refuse Derived Fuel to Electricity. IJERT 2013, 2. Available online: https://www.researchgate.net/publication/265725907_Refused_Derived_Fuel (accessed on 27 November 2022).
- Raju, N.P.; Raju, D.M. Experimental Study of Cotton Stalk Pellet Renewable Energy Potential from Agricultural Residue Woody Biomass as an Alternate Fuel for fossil fuels to Internal Combustion Engines. Int. J. Eng. Res. Technol. 2019, 8. [Google Scholar] [CrossRef]

Disclaimer/Publisher’s Note: The statements, opinions and data contained in all publications are solely those of the individual author(s) and contributor(s) and not of MDPI and/or the editor(s). MDPI and/or the editor(s) disclaim responsibility for any injury to people or property resulting from any ideas, methods, instructions or products referred to in the content. |
© 2022 by the authors. Licensee MDPI, Basel, Switzerland. This article is an open access article distributed under the terms and conditions of the Creative Commons Attribution (CC BY) license (https://creativecommons.org/licenses/by/4.0/).