1. Introduction
Indonesia has set a target of carbon neutrality by 2060 in its most recent Nationally Determined Contribution submitted to the United Nations Framework Convention on Climate Change [
1]. This target is realistic considering the vast renewable energy resources available in Indonesia [
2].
If Indonesia continues to rely heavily on fossil fuels to supply its energy demands in 2050, it is difficult to see how its emission objectives could be met. Carbon Capture and Storage is still in its demonstration phase, with only 26 operating facilities globally with an annual capacity of 40 million tonnes of carbon dioxide [
3]. It is far from ready for mass deployment.
By far, the largest practical source of renewable energy in Indonesia is solar photovoltaic (PV) energy. Solar PV has dominated global electricity markets in terms of annual capacity additions in recent years because it is cheap and environmentally friendly: about 45% of net global generation capacity additions in 2020 [
4].
A recent Indonesian Governmental estimate for the potential of renewable power is 443 Gigawatts (GW), of which 208 GW is from solar PV and 235 GW is from wind, hydro, geothermal, ocean energy and bioenergy combined [
5]. The Institute for Essential Services Reform (IESR) suggested a solar potential of 7700 GW and a wind energy potential of 106 GW [
6].
A recent study [
2] found that the Indonesian solar energy resource is far larger than both the Government and IESR estimates. A major point of difference is that this study identified vast potential for floating solar on Indonesia’s calm tropical inland sea, where large waves and strong winds are absent. Indonesia is the only large tropical archipelago. Weather data gathered over 40 years suggests that Indonesia could harvest 180,000 Terawatt-hours (TWh) per year of solar electricity from maritime areas that has never experienced waves and wind speeds larger than 4 m and 15 m/sec, respectively, over the past 40 years [
2].
The current electricity demand in Indonesia is 300 TWh per year [
7]. A generous upper bound for mid-century electricity demand is 9000 TWh per year, which is 30 times larger than current consumption.
This upper bound calculation [
2] makes the following assumptions:
That Indonesia catches up with Singapore in terms of per capita energy consumption. Singapore is a densely populated, tropical, industrialized nation with average annual electricity consumption of 9 Megawatt-hours (MWh) per person that shares a maritime border with Indonesia.
That population grows to 335 million people [
8].
That fossil fuel consumption is eliminated by using renewable electricity through direct or indirect electrification of all energy services: land transport (electric vehicles), heating (electric furnaces and heat pumps) and the chemical industry (hydrogen obtained from water splitting and carbon derived from air capture). The chemical industry includes ammonia, steel and other metals, plastics and synthetic fuels for shipping and aviation. It is assumed that electricity consumption must triple to accommodate these additional services [
9].
Thus, electricity consumption in 2050 is [335 million people] × [9 MWh per person] × 3, equal to 9000 TWh per year. Assuming an average capacity factor of 15.4%, this corresponds to 6700 GW of solar power [
2].
Indonesian renewable electricity options are summarized in
Table 1. Figures are derived from [
2]. Assuming an optimistic average capacity factor of 50%, the annual energy generation from the non-solar renewable sources could amount to about 1000 Terawatt-hours (TWh) per year.
Solar PV is likely to dominate the future Indonesian energy system. Such a system will require large-scale storage for overnight and longer periods. By far the leading electricity storage technologies are Pumped Hydro Energy Storage (PHES) [
10] and batteries. PHES constitutes about 95% of global storage power and 99% of global storage energy [
11]. PHES is a highly mature and widely deployed technology with low cost. The working fluid of PHES (water) is vastly more available than battery chemicals.
Battery storage includes home, utility and electric vehicle (EV) batteries. Future deployment of EV batteries is likely to be far larger than home and utility batteries. Presently, PHES is much cheaper than batteries for overnight and longer storage, as evidenced by the absence of significant deployment of large-scale battery systems with storage of more than 4 h. In the future, the cost of battery storage will decline, although there is large uncertainty as to future prices. If Vehicle-to-Grid technology becomes significant, then EV batteries could contribute substantially to future storage requirements because the scale of battery storage for an EV fleet is very large, and the cost of the batteries is largely covered by another purpose (mobility).
In this work, we do not try to compare the future cost and competitiveness of PHES and batteries. Such a comparison would be little better than guesswork. Rather, we point to the vast availability of PHES in Indonesia at the known and modest cost. This allows a confident upper bound to be placed on the cost of energy storage. The cost of overnight PHES storage at current prices is already low compared with the cost of the solar electricity that it supports [
12]. If future PHES and battery costs fall below current PHES costs, then the cost of storage will be even lower than the upper bound presented by current PHES costs.
The purpose of this work is to provide a systematic analysis of Indonesia’s practical PHES potential that could be utilized to support the transition to a decarbonized energy system in Indonesia. The novelty of this paper includes:
Comparison of the storage requirements to support 100% renewable energy in Indonesia with the available PHES potential;
A breakdown of Indonesia’s PHES potential at the regional level;
Estimation of the flooded land area requirement for upper and lower reservoirs that demonstrates that this requirement is small;
Consideration of water sources for the initial fill and to replace evaporation;
Consideration of the cost of land and water acquisition;
A methodology for desktop studies to sort through many candidate sites and find those that look particularly promising.
The paper is organized as follows: pumped hydro energy storage is described; then an upper bound on energy storage requirements in mid-century is derived; then land and water requirements are estimated and compared with availability; and finally, several representative PHES sites are analysed to illustrate a methodology for selecting the best sites to consider for detailed engineering studies.
2. Pumped Hydro Energy Storage
In 2020, global installed hydropower reached 1330 GW [
13] and generated a total of 4370 TWh of electricity. Indonesia has a small hydropower capacity of 6.2 GW or 23 Watts per person [
14]. For comparison, Iceland and Norway have installed hydropower capacity of 6000 Watts per person, and the global average is 170 Watts per person [
14].
Hydropower’s rapid response capability (seconds to minutes) can be used to assist in balancing electricy supply and demand. This capability is also attached to PHES. A recent review article on PHES is presented in [
10]. PHES is the most widely deployed and mature utility-scale storage technology currently available. Some countries have substantial existing PHES capacity, notably Japan, which has 170 Watts per person [
14], mostly constructed to assist with balancing electricity demand with nuclear electricity supply.
A PHES system (
Figure 1) comprises a pair of closely spaced reservoirs located at different altitudes. Water can be pumped uphill from the lower to the upper reservoir using solar (or other) electricity during the daytime. When insufficient energy is available, the stored energy can be recovered by flowing water downhill through the turbine to the lower reservoir. Pumping is typically accomplished by purchasing electricity during periods when prices are low (e.g., a sunny day). During peak demand periods, when prices are high, generation takes place. This pattern of buying low and selling high is called arbitrage.
Most existing PHES systems are located on rivers, usually in conjunction with hydroelectric power generation from river flow. In many regions, there is substantial environmental and social opposition to further interference with rivers. Furthermore, there are relatively few suitable sites for pumped hydro in association with rivers, confined to a corridor along each river where it passes through hilly country.
However, most potential PHES sites are not near rivers (“off-river”) for the simple reason that most of the global landscape is not near a river. A survey of possible PHES sites limited to rivers will miss the vast majority of viable locations. An off-river PHES system typically comprises a pair of small reservoirs (a few hundred hectares each) located in hilly country a few kilometres apart, with an altitude difference (“head”) of 200–1200 m, and connected by a tunnel or pipe containing a pump/turbine. Water is circulated indefinitely between upper and lower reservoirs (“closed loop”).
For example, a pair of 100 Ha reservoirs with a head of 600 m, an average depth of 20 m, a usable fraction of water of 85% and a turbine energy conversion efficiency of 90% can store 19 Gigalitres (GL) of water with an energy potential of 24 GWh, which means that it could operate at a power of 1 GW for 24 h.
Greenfield off-river PHES refers to a system that contains two new purpose-built reservoirs. Bluefield off-river PHES refers to a system in which one or both reservoirs already exist, such as a natural lake or an existing hydroelectric reservoir, such as for Snowy 2.0 [
15]. Brownfield off-river PHES refers to a system in which one or both reservoirs are constructed in a disused mining site, such as the Kidston project [
16].
2.1. Off-River PHES
Off-river PHES systems have major advantages over river-based PHES systems: the absence of a river eliminates most flood mitigation expenses; bespoke engineering in mountainous river valleys is unnecessary; generally, larger heads are available because the upper reservoir can be on a high hill rather than higher in the same river valley as the lower reservoir; and there is reduced environmental and social impact by avoiding interference with rivers. The far larger number of off-river sites from which to choose means that only the very best sites need to be selected. If an off-river site is problematical in terms of economic, environmental, sociological, geological, hydrological, logistical and other factors, then there are likely to be excellent alternative sites elsewhere.
Off-river pumped hydro systems can be built within a few years. The two reservoirs, the tunnel or pipeline, the powerhouse, and the transmission, may all be worked on simultaneously. For 3–300 GWh storage, construction timescales of 2–4 years are reasonable [
8]. This is much quicker than other storage technologies in terms of Gigawatt-hours (GWh) of new storage capacity added per year. Although a 0.1–1 GWh battery can be installed in a few months, it is typically one to two orders of magnitude smaller than an off-river pumped hydro system that is constructed over several years.
A global survey of Greenfield off-river PHES was undertaken by the Australian National University. A total of 616,000 closed-loop pumped hydro storage potential sites were identified with an enormous combined storage potential of 23 million GWh [
17]. A global atlas of Greenfield off-river PHES locations is accessible on the Australian Government’s NationalMap website [
18].
All the sites identified are located outside large urban areas or protected regions. Each site is assigned a cost class (A through E) based on a cost model [
17], with a class A system having a capital cost about half that of a class E system. The cost model is available in spreadsheet form [
19].
The global Greenfield atlas includes 8 different combinations of storage energy volume (GWh) and storage power capacity (expressed as maximum hours of generation at full capacity), namely 2, 5, 15 and 50 GWh with 6 h of storage and 5, 15, 50 and 150 GWh with 18 h of storage (
Figure 2 and
Figure 3). The power capacity (GW) is equal to energy capacity divided by storage hours. Many of the smaller identified sites occupy similar geographical space to larger sites—just with smaller dam walls and hence smaller water storage capacity and smaller flooded area.
2.2. PHES Construction Costs
A PHES system has a storage energy volume (GWh) and a storage power capacity (GW) that can be selected largely independently of each other. Thus, the system cost comprises the sum of an energy cost ($/GWh) and a power cost ($/GW).
Major cost components of a PHES system comprise the two reservoirs; the connecting tunnel or pipeline; the powerhouse (including the pump/turbine, the switchyard, transformers and controllers); transmission; and road access. The reservoir cost is associated with the cost of energy storage ($/GWh) and can be scaled up or down (by changing the height of the dam wall) without significantly affecting the cost of the other components. The tunnel, powerhouse and transmission are storage power costs ($/GW), whose costs scale with the desired maximum power output (which is related to maximum water flow in the tunnel).
A high-quality PHES site will have a large head, closely spaced reservoirs, a large volume of stored water per unit of reservoir wall volume and a large power rating:
A site that has a doubled head compared with another site with the same energy and power rating will require reservoirs that have half the water storage volume and can use narrower tunnels and smaller pump/turbines.
A site in which the reservoirs are closely spaced for a given head will require shorter and hence less expensive tunnels or pipelines.
A site in which a lower amount of rock (or concrete) is required to form the two reservoirs per unit of impounded water will have lower cost of reservoir construction.
In general, a system with larger storage energy and storage power will have a lower unit costs compared with a smaller system.
Some of the costs associated with off-river pumped hydro energy storage are comparable with those associated with conventional (on-river) pumped hydro energy storage—in particular, the powerhouse costs would generally be similar. However, the cost of reservoirs, tunnels, transmission and road access are strongly dependent upon siting.
River-based PHES sites are relatively few in number and are confined to places where rivers flow through hilly regions. Bespoke engineering is often required in remote river valleys with difficult access. Flood control mitigation and risk minimisation are critical for river-based systems. Interference with rivers often provokes strong social and environmental opposition, which can cause lengthy delays in approvals and increased costs.
Off-river PHES systems can potentially be located anywhere there are hills, which means that there are many more off-river than river-based sites. This, in turn, means that energy planners have a much wider selection of sites from which to choose, allowing the selection of only very good sites. If a site proves problematic, then there will often be an alternative site. On average, Greenfield off-river systems will have a larger head, shorter tunnels, lower-cost reservoirs, minimal flood control expenses, shorter transmission lines and easier road access than comparable river-based PHES systems. These attributes often can overcome the advantage of avoiding the construction of one (or even both) reservoirs in a Bluefield PHES system.
The cost of off-river PHES systems can be relatively predictable since they will often be similar to each other. Only good sites need to be selected; remote bespoke engineering and flood control are avoided; and social and environmental opposition can generally be minimised with good site selection. This allows cost reductions from learning-by-doing in a large-scale sequential PHES construction program.
A cost model for off-river PHES has been recently published [
17] and is used in this paper for cost estimates. The model is available in spreadsheet form [
19]. Caution is required when using the model, which is considerably more useful for cost comparison than for deriving absolute values of cost.
This model assumes a mature sequential PHES construction program within a country so that high levels of skill and smooth logistics are acquired; that labour and logistical costs converge to levels found in developed countries as countries industrialise and incomes rise; and that problematic sites are rejected in favour of sites that have few impediments and look quite like each other from the engineering point of view (“vanilla” sites). The latter assumption takes advantage of the fact that there are many similar potential sites in most regions, allowing energy planners to be choosy. Such a strategy is not tenable in river-based PHES systems because of the scarcity of sites, which is an important advantage of off-river PHES.
As an example, consider a 3 GW, 150 GWh Greenfield off-river pumped hydro system with a head of 600 m; generation efficiency of 90%; usable water volume of 85%; average water depth of 20 m; separation of the two reservoirs of 5 km; a water–rock volume ratio (ratio of total impounded water to the volume of rock needed to form the twin reservoirs) of 10; and low costs for access to transmission, roads, water and land. Many such potential systems are identified in the Global Greenfield PHES atlas.
According to the cost model [
19], such a system has a capital cost of about 4 billion USD, divided roughly equally between the cost of the reservoirs (the energy cost) and the tunnel and powerhouse (the power cost). Such a system can operate for 50 h at full power (3 GW) and stores about 120 GL in the combined upper and lower reservoirs, which have a combined area of about 1200 Ha. This corresponds to about 8 Ha of land per GWh of storage [
10] and 0.8 GL of water per GWh.
3. Pumped Hydro Energy Storage in Indonesia
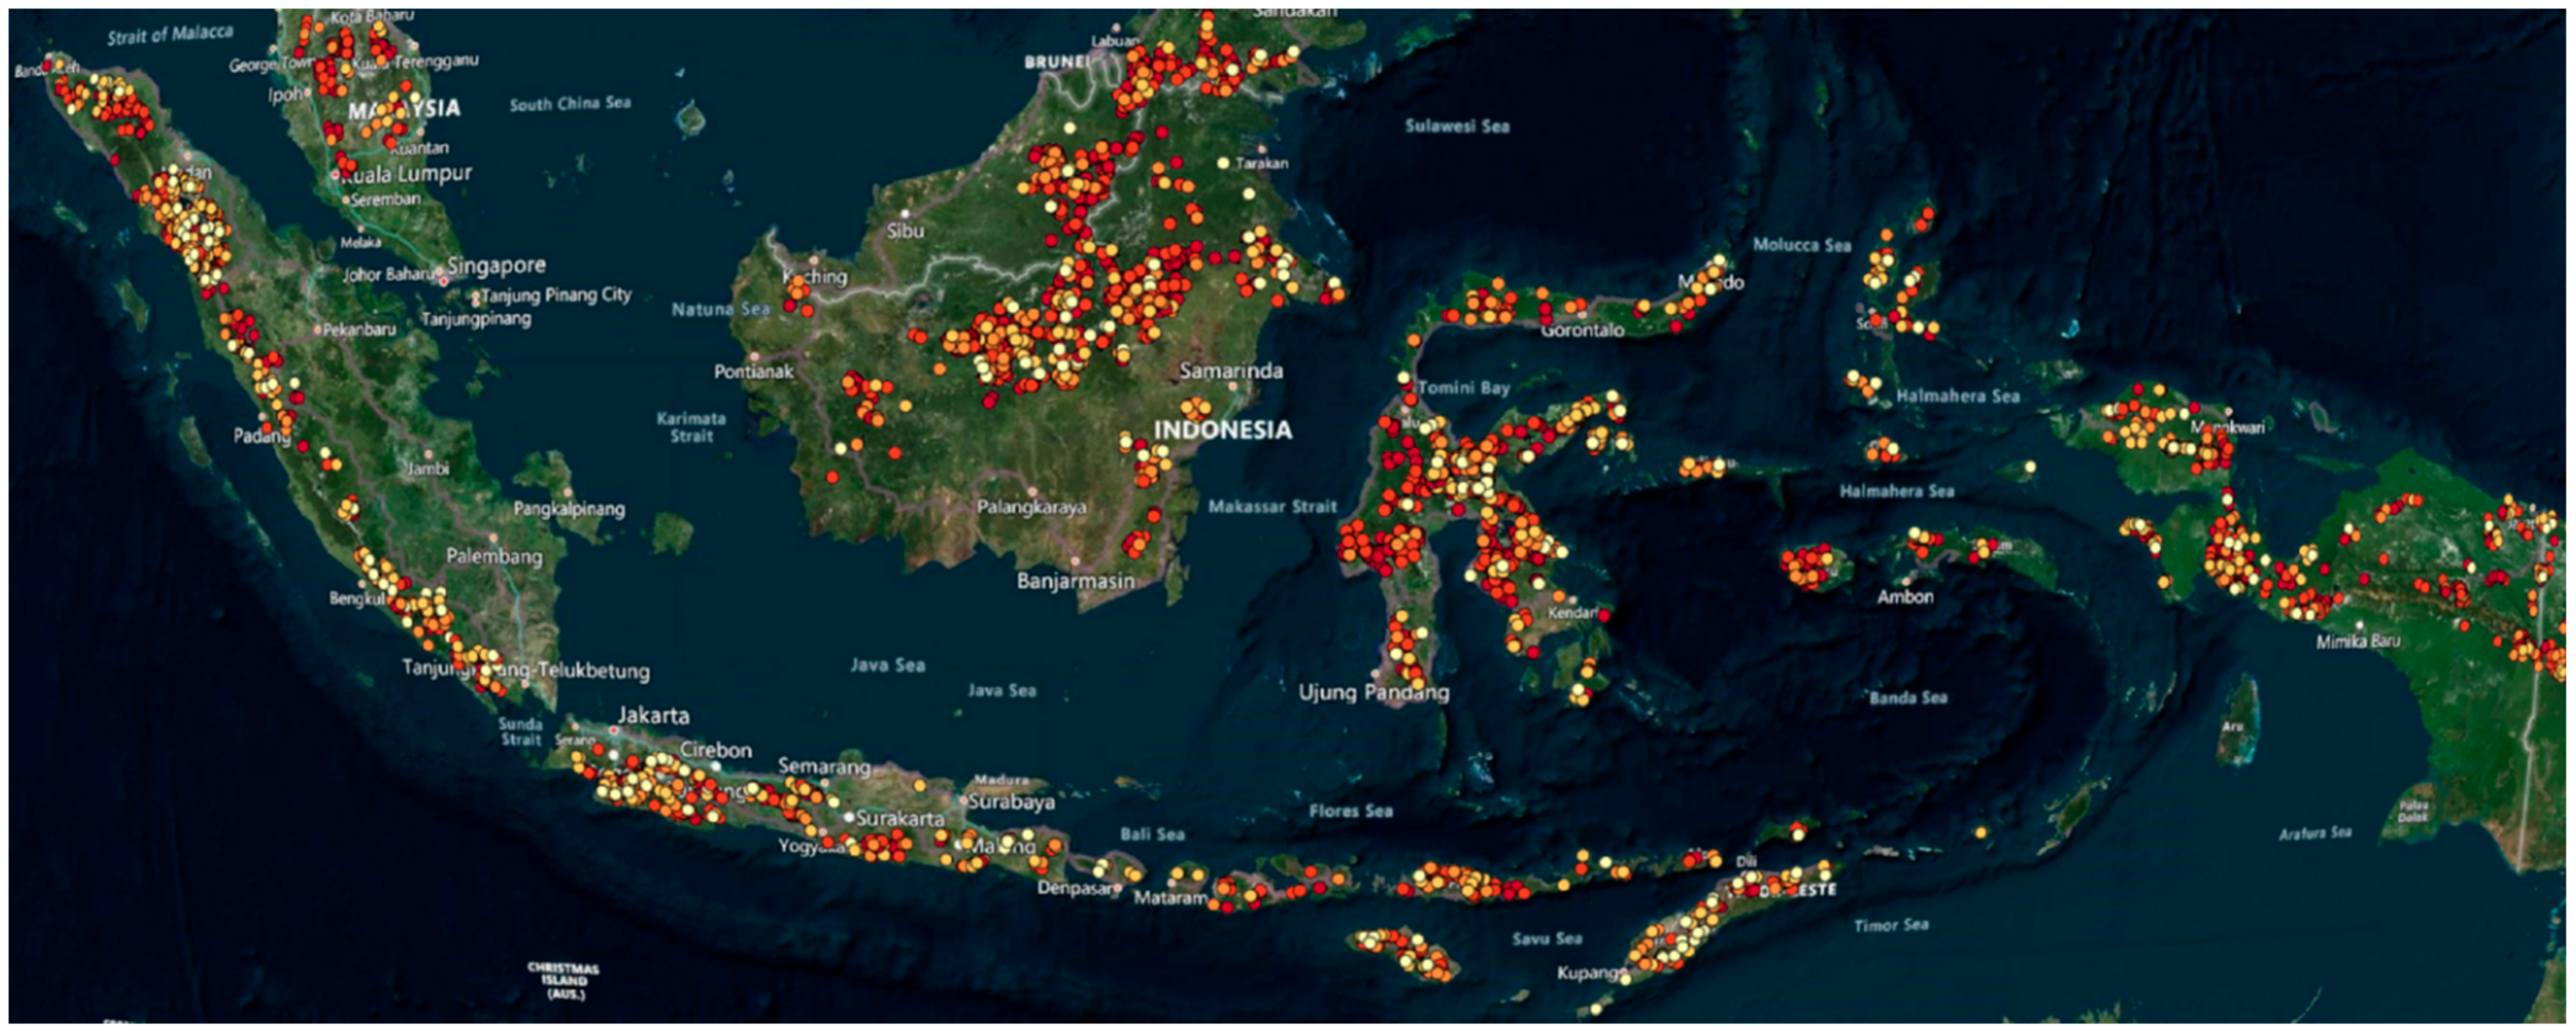
Based on the Global Greenfield Atlas [
17], a total of 26,000 off-river PHES potential sites were identified in Indonesia with 800 TWh of energy storage capacity.
Indonesia currently has no PHES systems. This is unsurprising considering that there is very little variable solar and wind generation in Indonesia and hence little need for Gigawatt-scale storage. However, this is about to change.
Indonesia has included 4000 MW of river-based PHES in its electricity development plan. The 1000 MW Upper Cisokan Pumped Storage project, located in Cianjur, West Java, is currently being financed and approved and is planned to operate from 2025 [
20]. The Matenggeng pumped hydro storage (943 MW) in West Java is expected to connect to the grid in 2028 [
21]. The Grindulu pumped hydro storage (1000 MW) in East Java is planned to operate from 2030 [
21]. The state electricity company Perusahaan Listrik Negara (PLN) plans to develop 4 × 250 MW PHES systems in Sumatera, which are expected to connect to the grid in 2029–2032 [
21,
22].
3.1. Indonesian Energy Storage Requirements in 2050
It is beyond the scope of this paper to undertake a high resolution (hourly) model of a future solar-dominated Indonesian economy. However, for the purposes of this paper, it is necessary to obtain an upper-bound estimate for storage requirements to support 100% renewable energy in Indonesia and compare this estimate with PHES availability.
Indonesia has a modest variance of solar irradiation because of its maritime tropical location. Seasonal storage of solar energy is not required because Indonesia lacks a summer–winter or monsoon cycle. Work presented in [
2] strongly suggests that solar radiation varies little on a weekly basis and that energy storage is mostly required for day–night load balancing.
In reference [
4], it is argued that the storage required to support a 100% renewable electricity system in a low latitude country is approximately one day of electricity consumption, which is supported by detailed hourly analysis for several countries (
Table 2). The required storage power capacity is estimated to be similar to the average daily electricity consumption. These regions include wind energy, and further study will be required to arrive at an estimate for a solar-dominated Indonesia.
Following this one-day storage rule of thumb, a zero-carbon, affluent, industrialised Indonesia in 2050 consuming 9000 TWh of renewable electricity per year (
Table 1) requires the storage of 25 TWh (75 kilowatt-hours per person) and 1000 GW of storage power. This can be compared with 800 TWh of PHES storage energy identified in Indonesia in the Global Greenfield PHES Atlas [
18]. Storage power attached to each reservoir pair can be adjusted independently to meet requirements by appropriate sizing of tunnels and electromechanical equipment.
Note that the 9000 TWh per year electricity consumption used in this calculation is 30 times larger than the current Indonesian electricity consumption of 300 TWh per year and represents a generous upper bound.
The approximate cost of the required storage, assuming that it is entirely PHES, is 750 billion USD according to the cost model [
17]. Systems would be constructed sequentially over 3–4 decades and could operate (with regular refurbishments) for a century or more. At current prices, the cost of constructing the 6.7 TW of solar PV required to generate 9000 TWh per year in Indonesia would be around 8000 billion USD [
25], constructed over 3 decades (the solar module economic lifetime). In other words, the cost of PHES storage is of the order of 10% of the cost of the solar energy system that it supports.
Note that these large financial numbers relate to nearly completely displacing oil, gas and coal from a future affluent, industrialised, fully electrified Indonesia inhabited by 335 million people. The per capita investment required at current prices for the solar generation and storage system described above is approximately 26,000 USD, which amounts to about 1000 USD per person per year when spread evenly over a 25–30-year construction program (followed by regular refurbishment or replacement thereafter).
3.2. Land Requirement for Off-River PHES
It will be shown in this section that the area of land flooded for off-river pumped hydro storage to support a 100% renewable energy in Indonesia is small compared with Indonesia’s landmass. Thus, sensitive regions can be generally avoided. The Global Greenfield Atlas excludes protected and urban regions.
Consider the 3 GW, 150 GWh Greenfield off-river pumped hydro example described in
Section 2.2. This system requires about 8 Ha of land per GWh of storage [
10]. Taking this figure as representative, storage of 25 TWh to support a 100% renewable energy system (estimated in
Section 1) corresponds to 2000 km
2 of land area, which is about 0.1% of Indonesia’s total land area of 1.9 million km
2. Different heads, water utilisation fraction and average water depths would yield a different result. A Bluefield system that utilises an existing lake or reservoir has half the land area requirements. This area of flooded land (about 6 m
2 per person) is much smaller than the area of solar module required to generate 9000 TWh of electricity per year in Indonesia, which is about 100 m
2 per person [
2].
For comparison, the river-based Upper Cisokan PHES project with 1 GW power capacity (6.5 h of storage) will create two new reservoirs and will flood an area of 340 Ha [
26]. This equates to 50 Ha per GWh. The head is relatively small (276 m), and the usable fraction of impounded water is low at 13%.
The calculations presented in this section have large uncertainty. However, it is clear that Indonesia has large off-river PHES potential that will require only a small fraction of Indonesia’s land surface area.
The cost of land acquisition needs to be included in the capital cost of a PHES system. To estimate this cost, land use at each site was audited using QGIS, a free and open-source Geographic Information System software [
27]. The approximate area (Ha) of each existing land use category (e.g., plantation, rice field, forest, settlement) of the area covered by the two reservoirs was determined, and the price of the land was assigned according to its land-use categorisation using data input from Indonesia’s Geospatial Information Agency [
28].
The price of land in Indonesia is influenced by economic, social, government and environmental factors [
29]. Land prices generally increase near central business districts [
30]. An analysis of a dataset of 64,000 Indonesian listed properties [
30] found that once rural land is converted to include housing, the price approximately triples. If developed as a business premise, the price increases tenfold. Thus, undeveloped rural land is favoured for the location of a PHES system.
In this study, we approximated the land acquisition cost by calculating the average land or house prices in the vicinity of where the PHES is located. We derived land price data from OLX ID [
31], the biggest Indonesian online buying and selling platform. For example, for a site in Bali, we analysed thirty undeveloped land sales in the Jembrana Regency. The median price of undeveloped rural land and land with housing was 35 USD per m
2 and 171 USD per m
2, respectively (IDR 14,000/USD). The undeveloped land price was applied to plantations, rice fields, other cropping areas, scrublands, roads and forests.
The 3 GW, 150 GWh Greenfield off-river pumped hydro system used as an example in
Section 2.2 requires 8 Ha of land per GWh of storage. If all this land was undeveloped with an average acquisition price of 35 USD/m
2, then the cost of land acquisition would be 420 million USD, compared with the capital cost (excluding land and water cost) of about 4 billion USD. In this example, the cost of land acquisition is significant but not prohibitive unless many settlements are also flooded at an average acquisition price of 171 USD per m
2. A robust land cost calculation for each individual PHES site requires a thorough assessment, which is beyond the scope of this study.
3.3. Water Requirement
It will be shown in this section that the available water supply in Indonesia is vastly larger than the amount required for PHES to support a 100% renewable energy Indonesia.
A PHES system requires water for the initial fill and also to replace evaporation (after accounting for rainfall over the reservoirs). Freshwater is preferred over saltwater for PHES to minimise corrosion of turbines, pumps and water conveyances, as well as to limit the risk of salt pollution of the land environment [
32]. Since Indonesia has high annual rainfall, the cheapest option is to collect rainwater falling directly into the reservoirs and flowing naturally to the reservoirs from the surrounding land. Pumping groundwater is also possible as Indonesia has numerous groundwater basins. The most expensive options are to transport the water by pipeline or road from nearby rivers or lakes and to desalinate seawater.
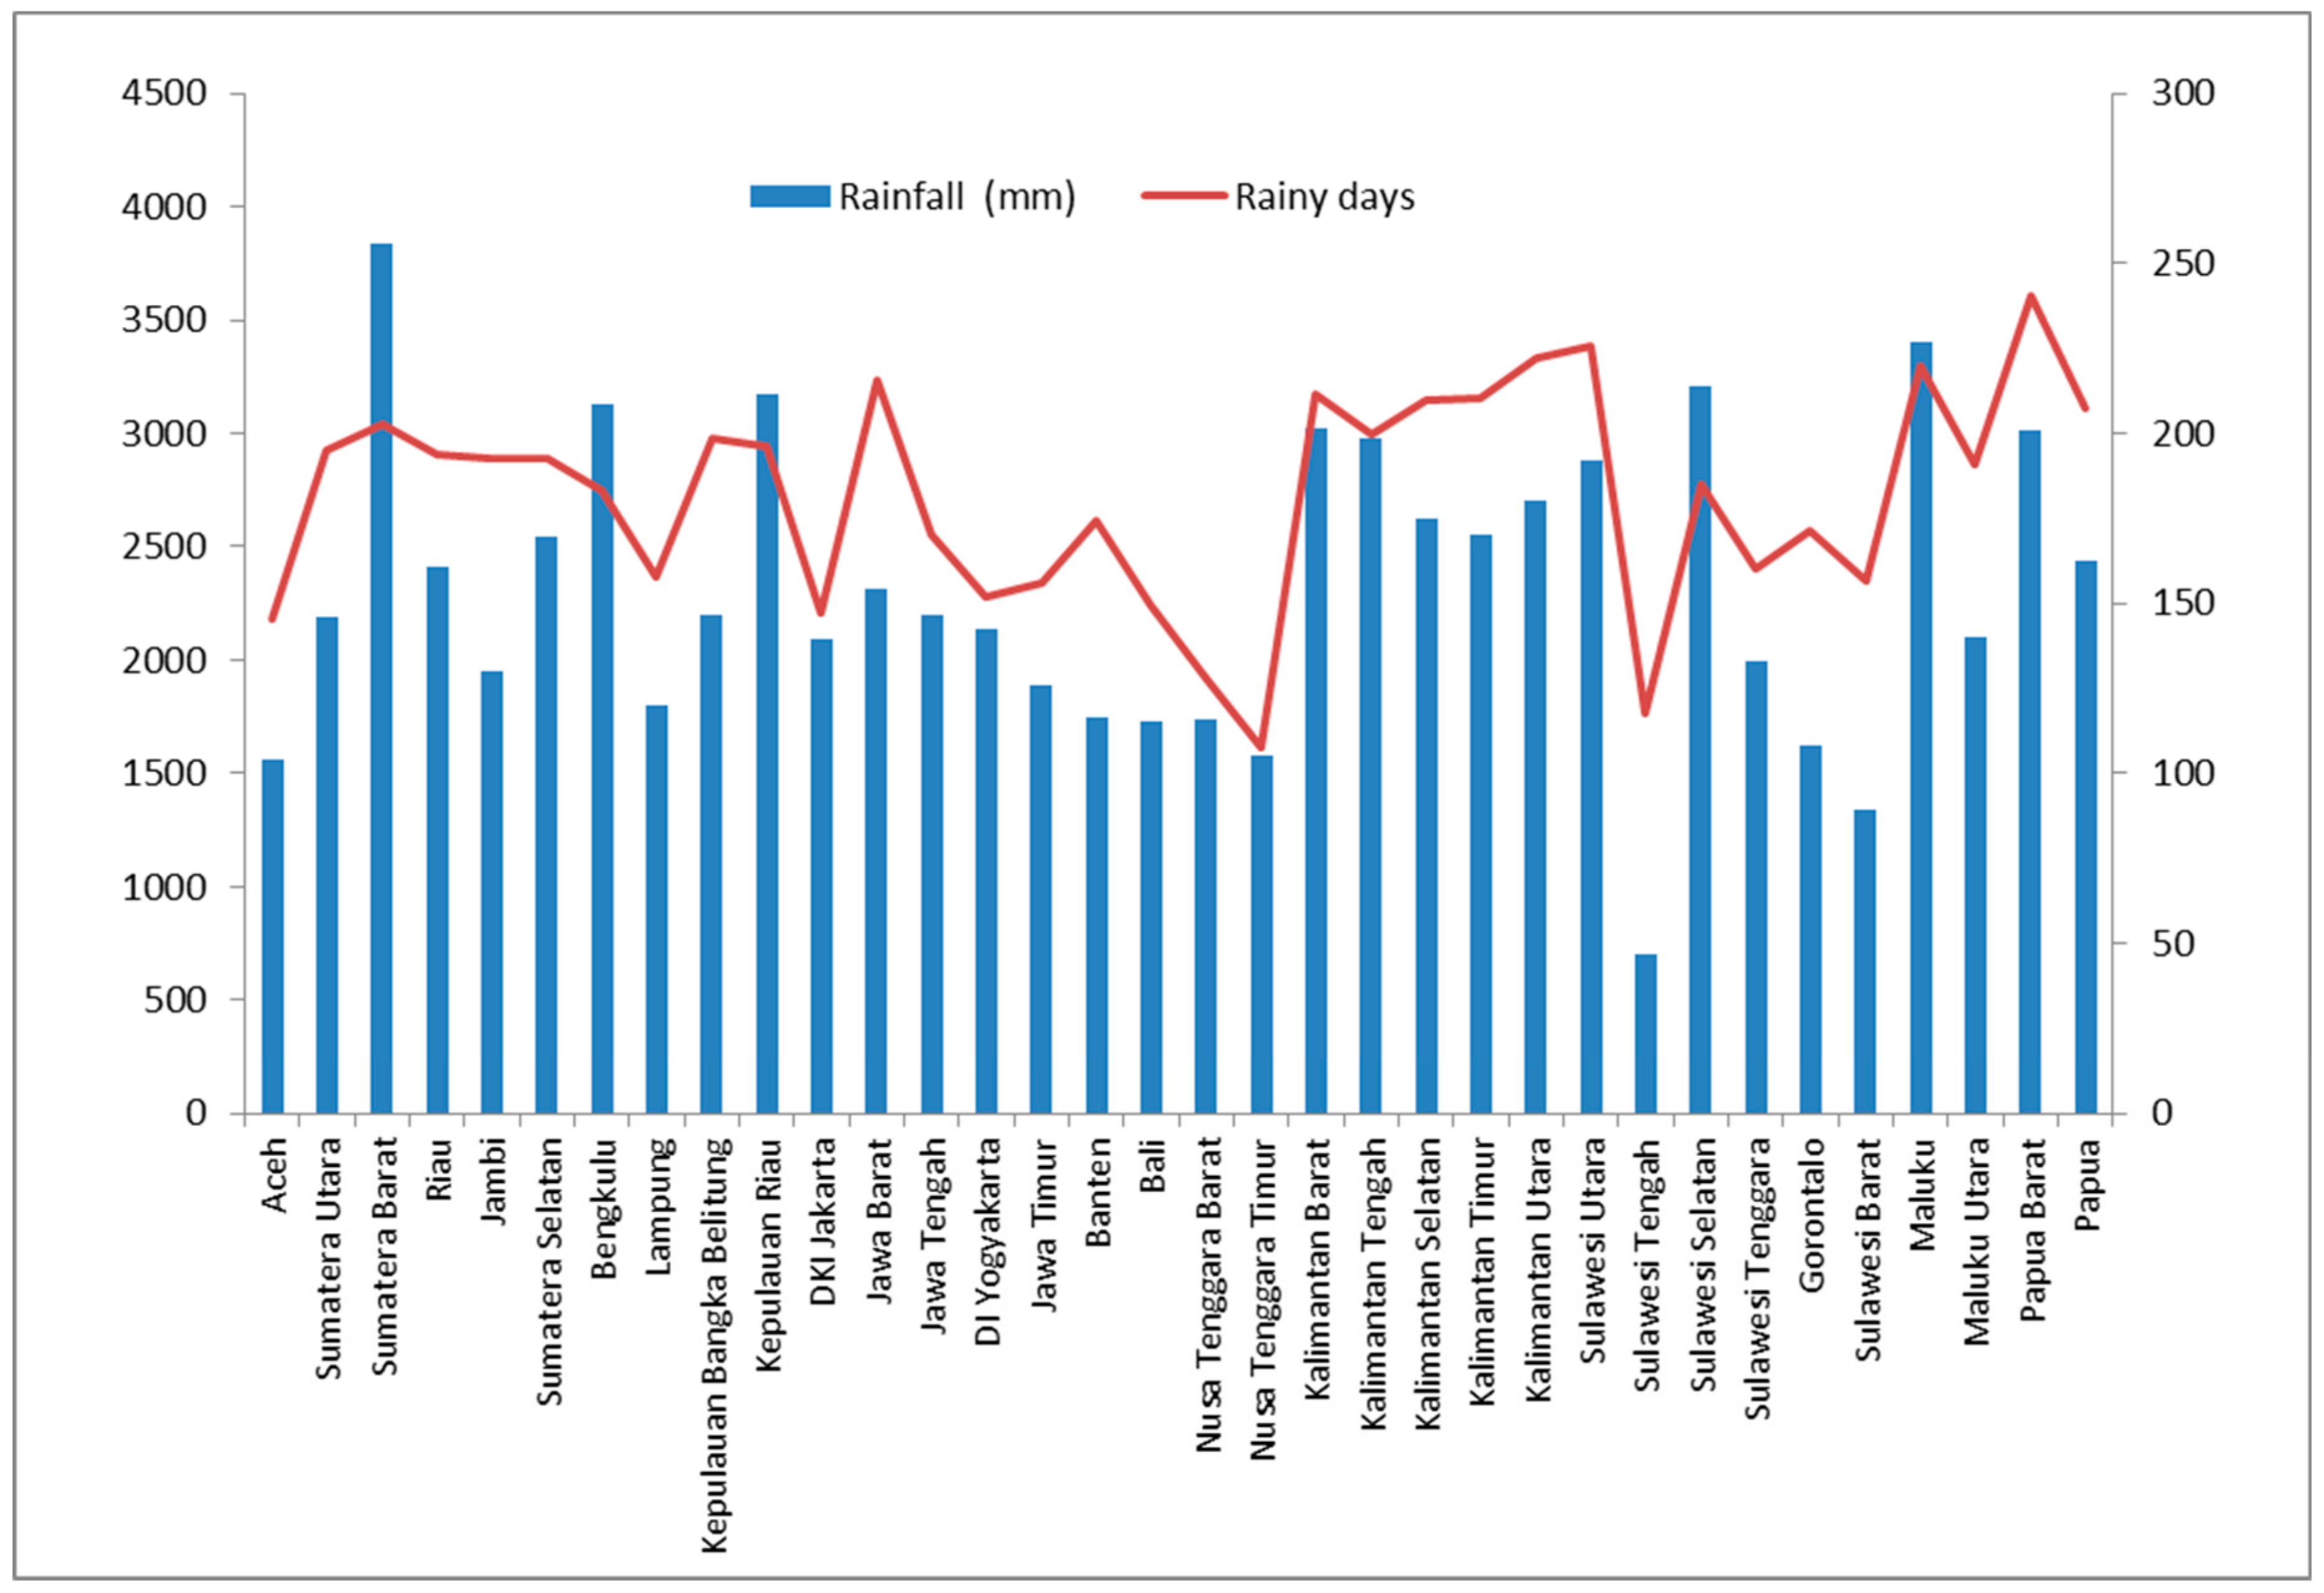
The rainfall in Indonesia averages 2221 mm per year (population weighted) [
33,
34]. This comfortably exceeds the evaporation rate (typically 1825 mm per year (5 mm per day on average)) [
35,
36], which reflects Indonesia’s tropical maritime location: high humidity, low wind speeds and frequent clouds [
36]. Hence, rainfall within the reservoirs is usually sufficient to obviate the need to replace evaporation losses.
For the 3 GW, 150 GWh Greenfield off-river pumped hydro system described in
Section 2.2, the volume of initial-fill water required per GWh of energy storage is around 0.8 GL. This translates to an initial-fill water requirement of 20,000 GL for the PHES storage of 25 TWh estimated above for a future affluent, industrialised, fully electrified Indonesia. Assuming that PHES systems are sequentially constructed over a 40-year period, the annual amount of initial fill is about 500 GL per year. This water is not actually consumed—it is cycled between the reservoirs for 100 years or more. The water requirement is halved or doubled by doubling or halving the head, respectively [
10]. Bluefield PHES systems may not require any additional water.
The average precipitation of 2221 mm per year translates to about 4 million GL per year over Indonesia’s 1.9 million km
2 landmass. This is 8000 times larger than the annual requirements for the initial fill. The population of Java, Sumatra and Bali amounts to 80% of the Indonesian total. The surface water availability on these three islands is 1.1 million GL per year [
37], which is 2000 times larger than the annual requirements for the initial fill. Plainly, Indonesia as a whole has adequate water. However, an individual PHES system could be located in a water-constrained region. A suitable water source must be identified prior to the construction of a new PHES system.
3.3.1. Rain Harvesting
Indonesia is a tropical country with annual rainfall varying over the regions. The lowest rainfall occurs in Nusa Tenggara Timur province, with an annual rainfall of 700 mm. The highest is in Sumatera Barat with 3838 mm. On average, Indonesia has population-weighted rainfall of 2221 mm per year [
33] (
Figure 4).
Rainfall directly into the reservoirs of a new PHES system is usually insufficient to provide the initial fill within a reasonable time, for example, the final year of construction of the system. However, rainfall in the catchment area surrounding the reservoirs is an important temporary source of water for the initial fill, even if the catchment is quite small. Rainwater runs by gravity through the landscape to the lowest point of the designed reservoirs. The water catchment yield can be accurately assessed after the investigation of the characteristics of the reservoir catchments. For the example of 150 GWh PHES system described in
Section 2.2, a combined catchment area of the two reservoirs of 100 km
2 would yield the 120 GL initial fill over about one year (neglecting evaporation), assuming average Indonesian rainfall and assuming a temporary water catchment yield and availability of 50% of that rainfall.
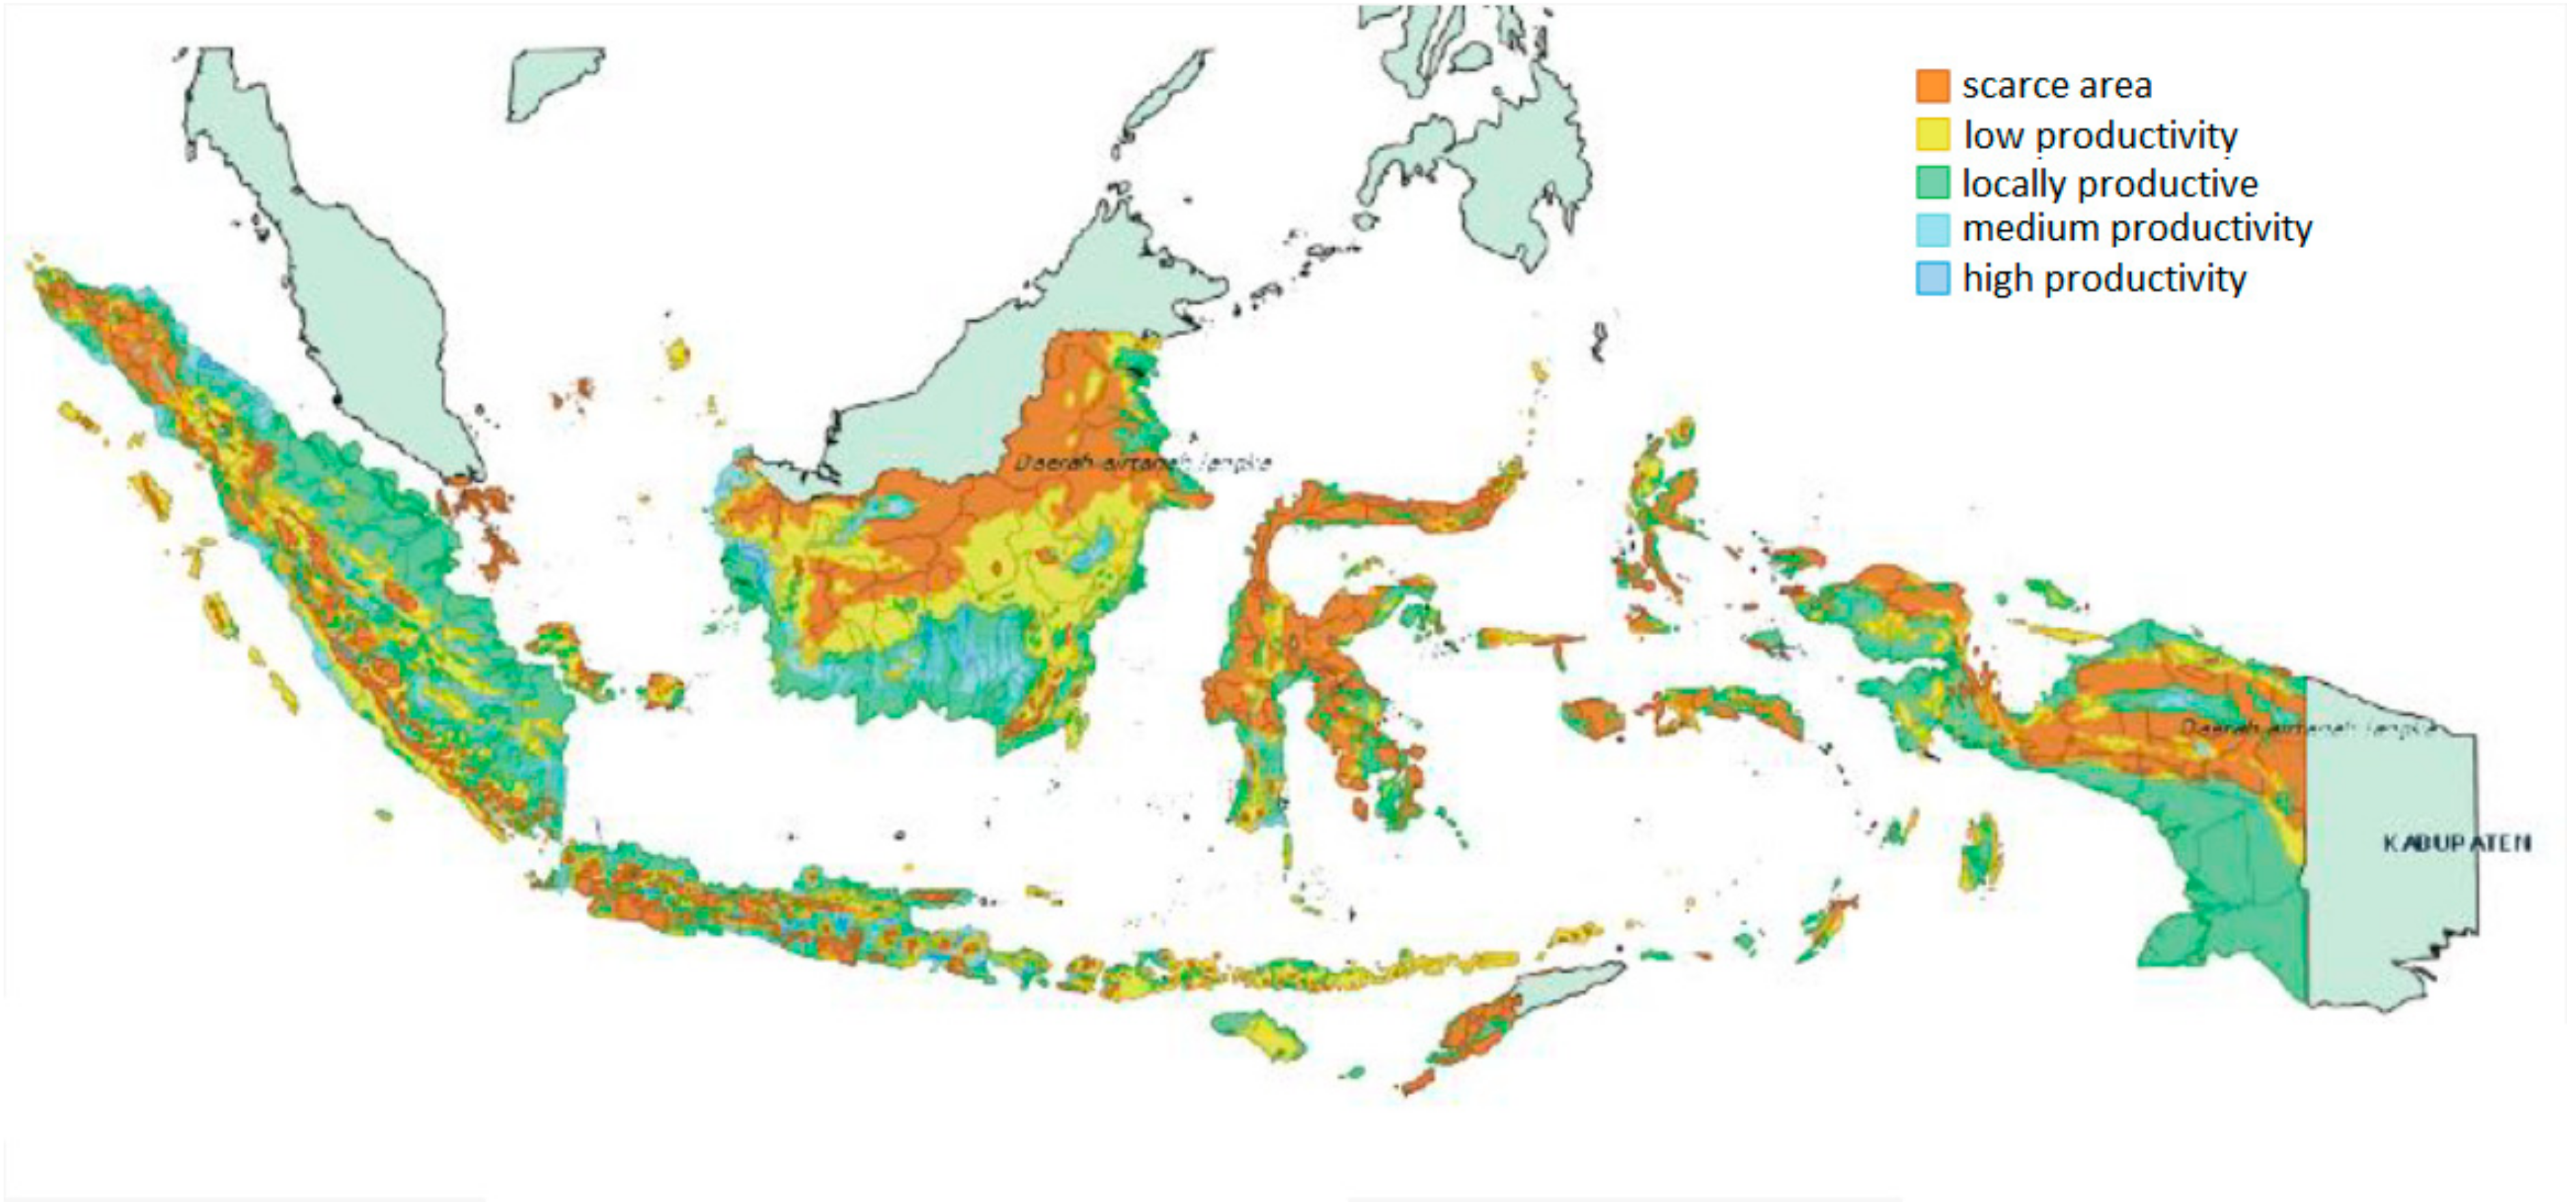
3.3.2. Groundwater
Groundwater could contribute to the initial reservoir fill in some places, although at a much-reduced scale compared with rainwater. There are numerous groundwater basins in Indonesia, with a combined potential yield of around 520 GL per year, and assuming an accessibility ratio of 30%, a yield of about 150 GL per year is available [
37]. The most productive groundwater basins are located in the lowlands of Java, Sumatera, south Kalimantan and Sulawesi (
Figure 5).
3.3.3. Water from Nearby Rivers or Lakes
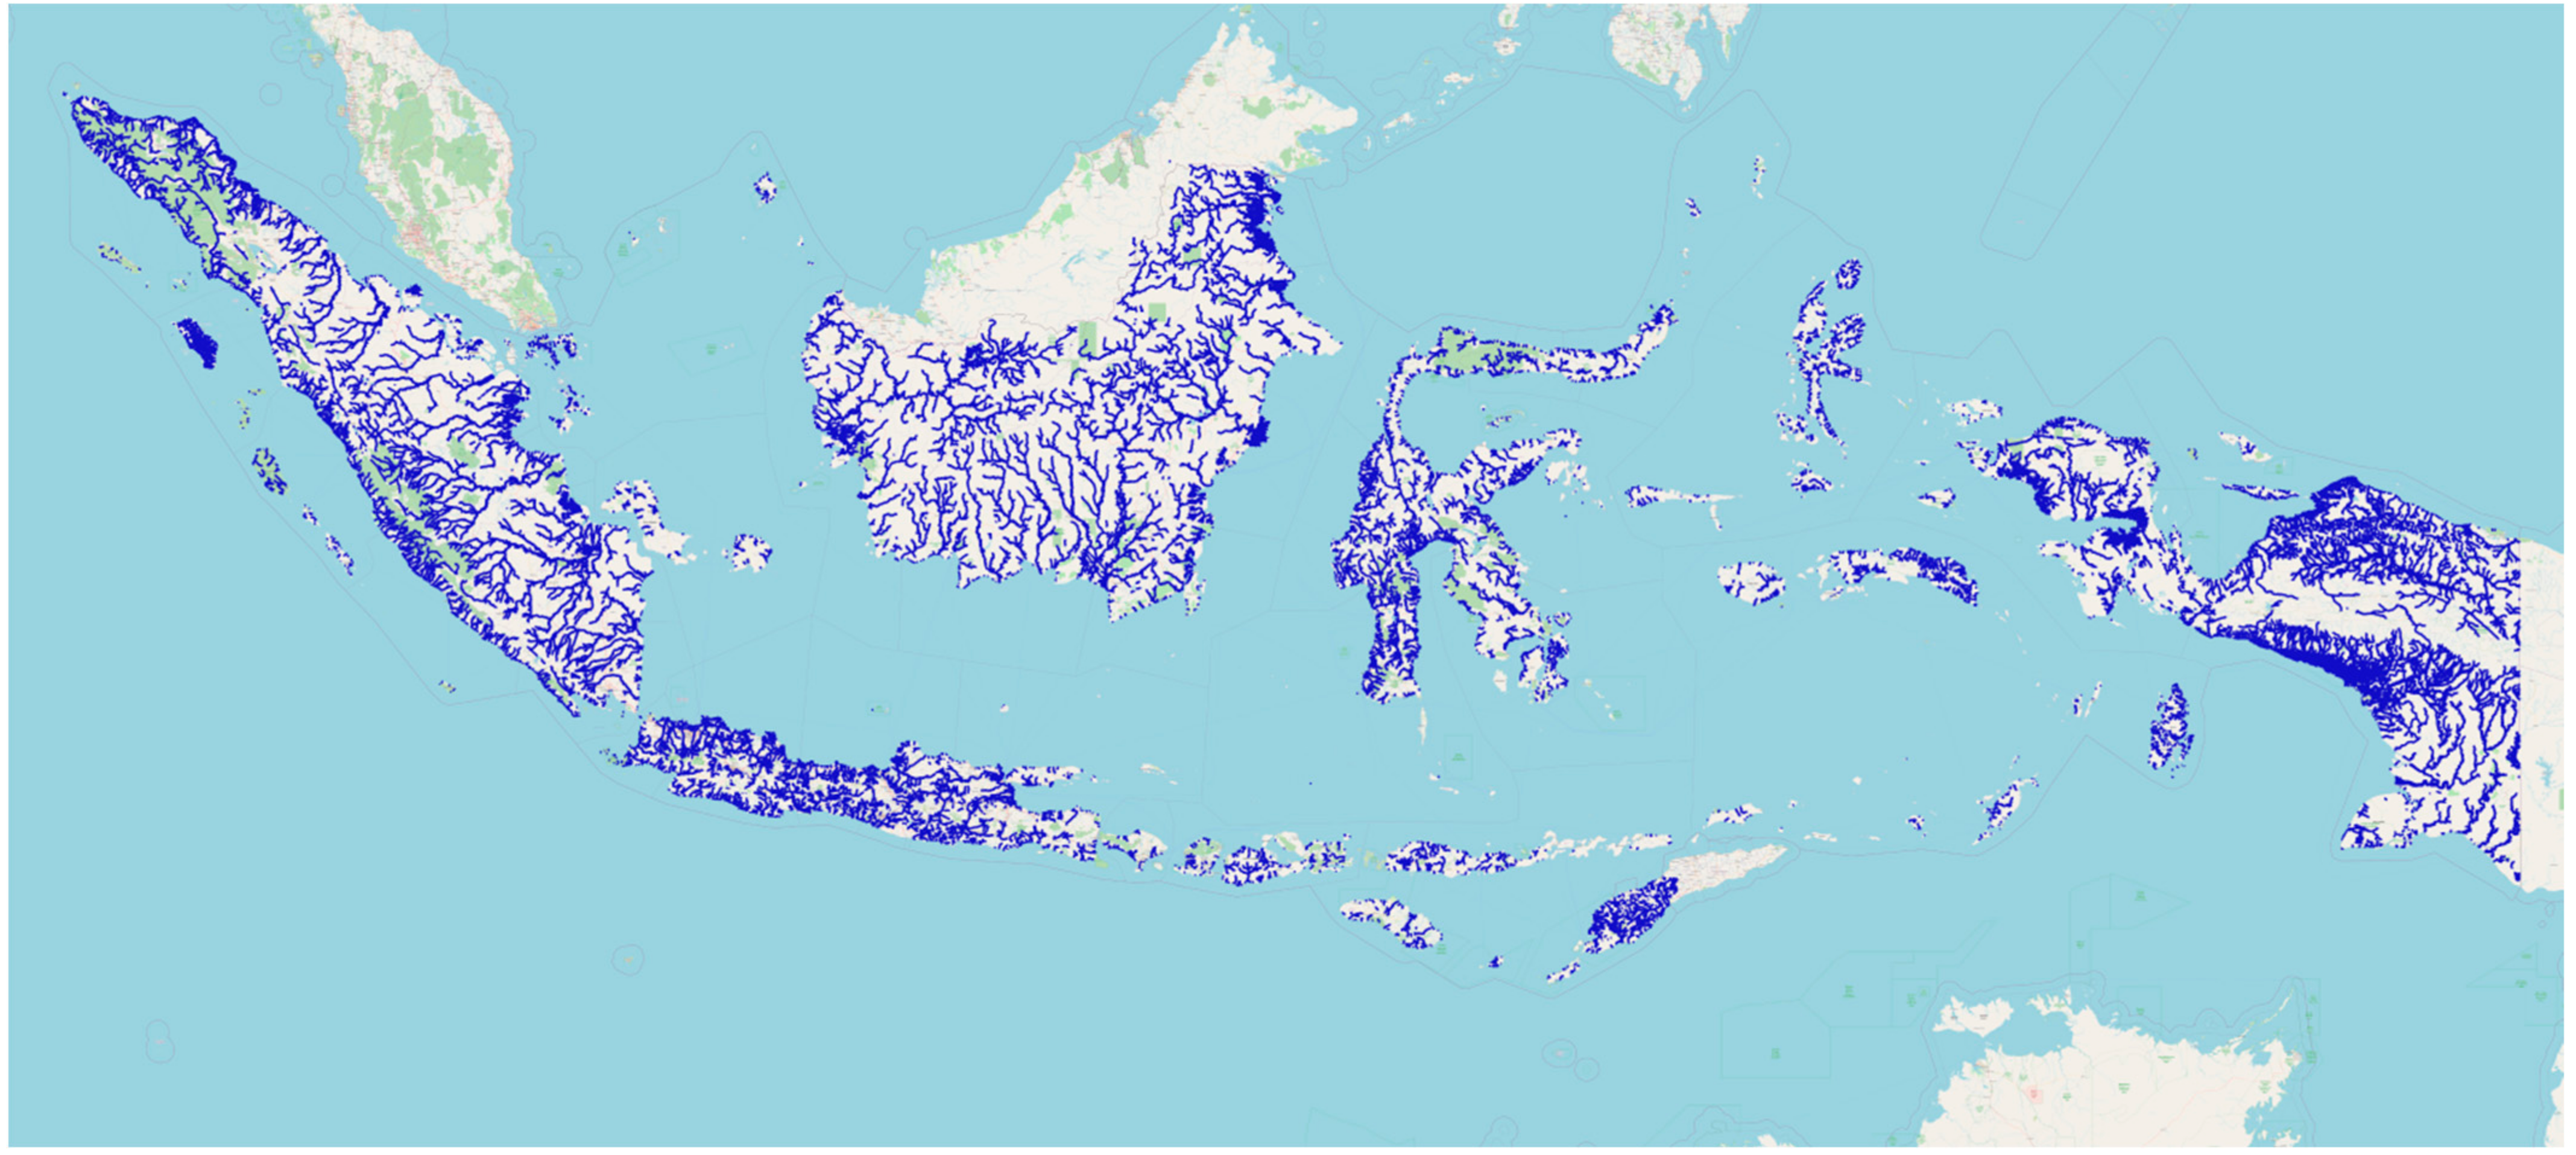
Indonesia has 5800 lakes [
38] and around 8000 watersheds (Daerah Aliran Sungai) divided into 131 river basins [
37]. Major rivers can be found on each main island, as shown in
Figure 6. Nearby rivers and lakes can supply the initial fill by temporary pipeline or even delivery by mobile water tanker.
An upper bound on the cost of the initial water fill can be obtained by estimating the cost of water delivery by the most expensive option. The water market in Indonesia is not well developed. However, neighbouring Singapore has a similar climate to Indonesia and has a highly developed and sustainable water infrastructure. Indonesian water arrangements may converge with those of Singapore as Indonesia’s population, affluence, industrialisation and per capita, water and energy use grows.
Singapore is a city-state with a small land area that relies for most of its water on local rainfall, recycling and desalination. Recycling and desalination cost much more than collecting rainwater. The industrial water tariff in Singapore is 0.5 million USD per GL [
39]. Water in rural Indonesia is likely to cost considerably less because of the order of magnitude lower population density, which allows for greater use of rainwater. The cost of industrial water in Singapore is adopted as an upper bound on the cost of sustainable water in Indonesia in the mid-century. The water is assumed to be derived from local catchments with low transportation costs.
The 3 GW, 150 GWh Greenfield off-river pumped hydro system used as an example in
Section 2.2 requires 0.8 GL per GWh for the initial fill, which results in an upper bound cost of water of 60 million USD compared with the capital cost of about 4 billion USD. Thus, the cost of water for the initial fill is a small fraction of the total cost.
4. Desktop Study of Selected Sites
According to the Global Atlas of Greenfield pumped hydro sites [
17], Indonesia has about 26,000 potential sites with 800 TWh of energy storage capacity in the cost classes A to E. Only a few percent of these would be needed to support massive solar energy expansion. In this section, an indicative desktop analysis of several good Indonesian sites is undertaken. The purpose is to illustrate a methodology for desktop analysis that allows the rapid identification of preferred options for subsequent detailed engineering study (at substantially greater expense).
PHES sites that fall in the A and B cost classes were selected. With so many sites from which to choose, energy planners can afford to focus on those with lower probable costs per unit of storage. A total of 321 TWh of class A/B storage capacity was identified in Indonesia (
Table 3) in the global Greenfield atlas. As shown in
Table 3, this is 13 times larger than the upper bound requirement of storage in 2050 estimated in
Section 3 (25 TWh). The addition of class C, D and E sites increases this ratio to 32.
PHES sites with energy storage volumes of 50 or 150 GWh (and lying within the A and B cost classes) were selected. Large sites tend to have lower financial, land and water requirements per unit of storage. A storage time of 20 h at full discharge power was chosen for illustrative purposes, equivalent to the power of 2.5 and 7.5 GW for 50 and 150 GWh, respectively. In practice, high power systems might comprise several independent tunnel and powerhouse units attached to a reservoir pair rather than a single very large generating unit.
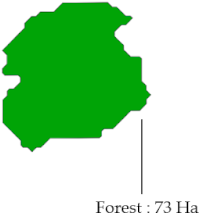
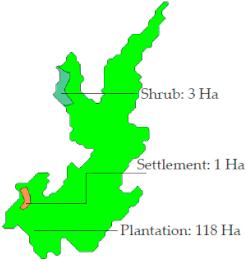
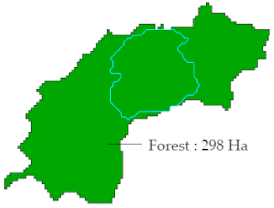
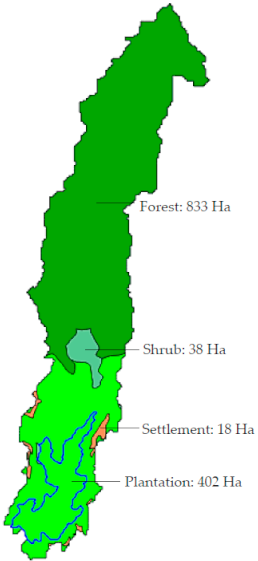
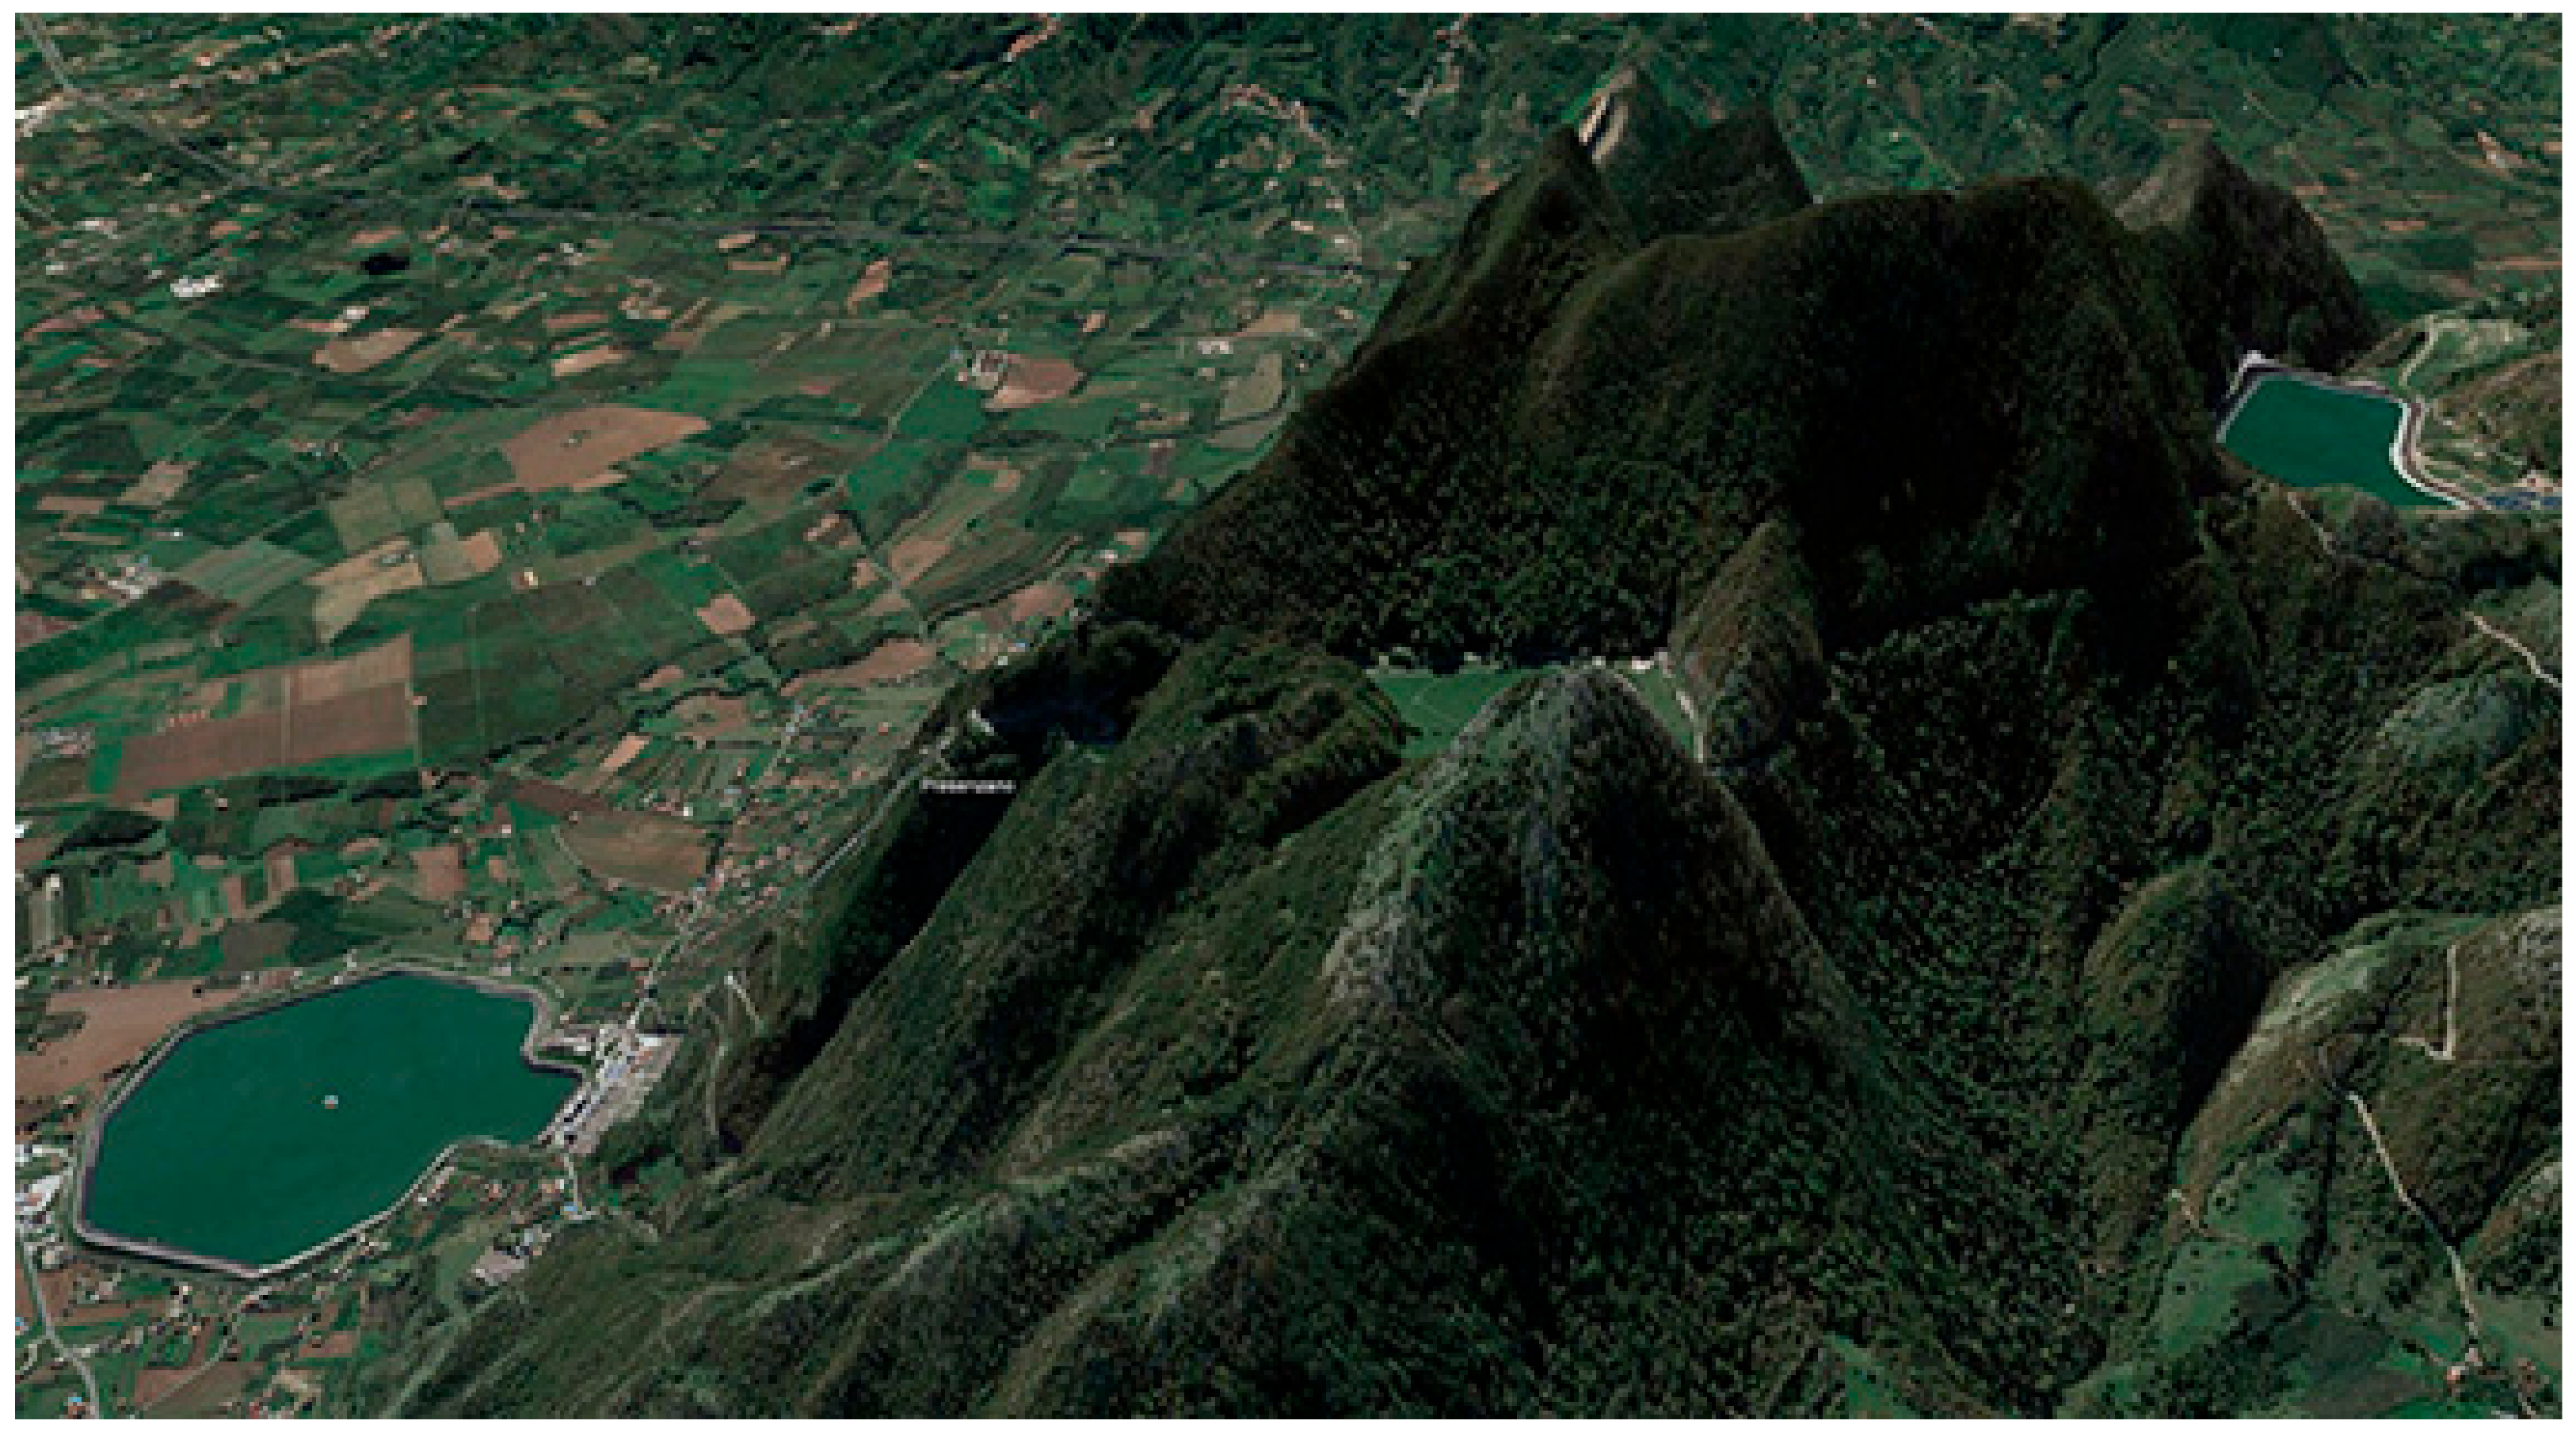
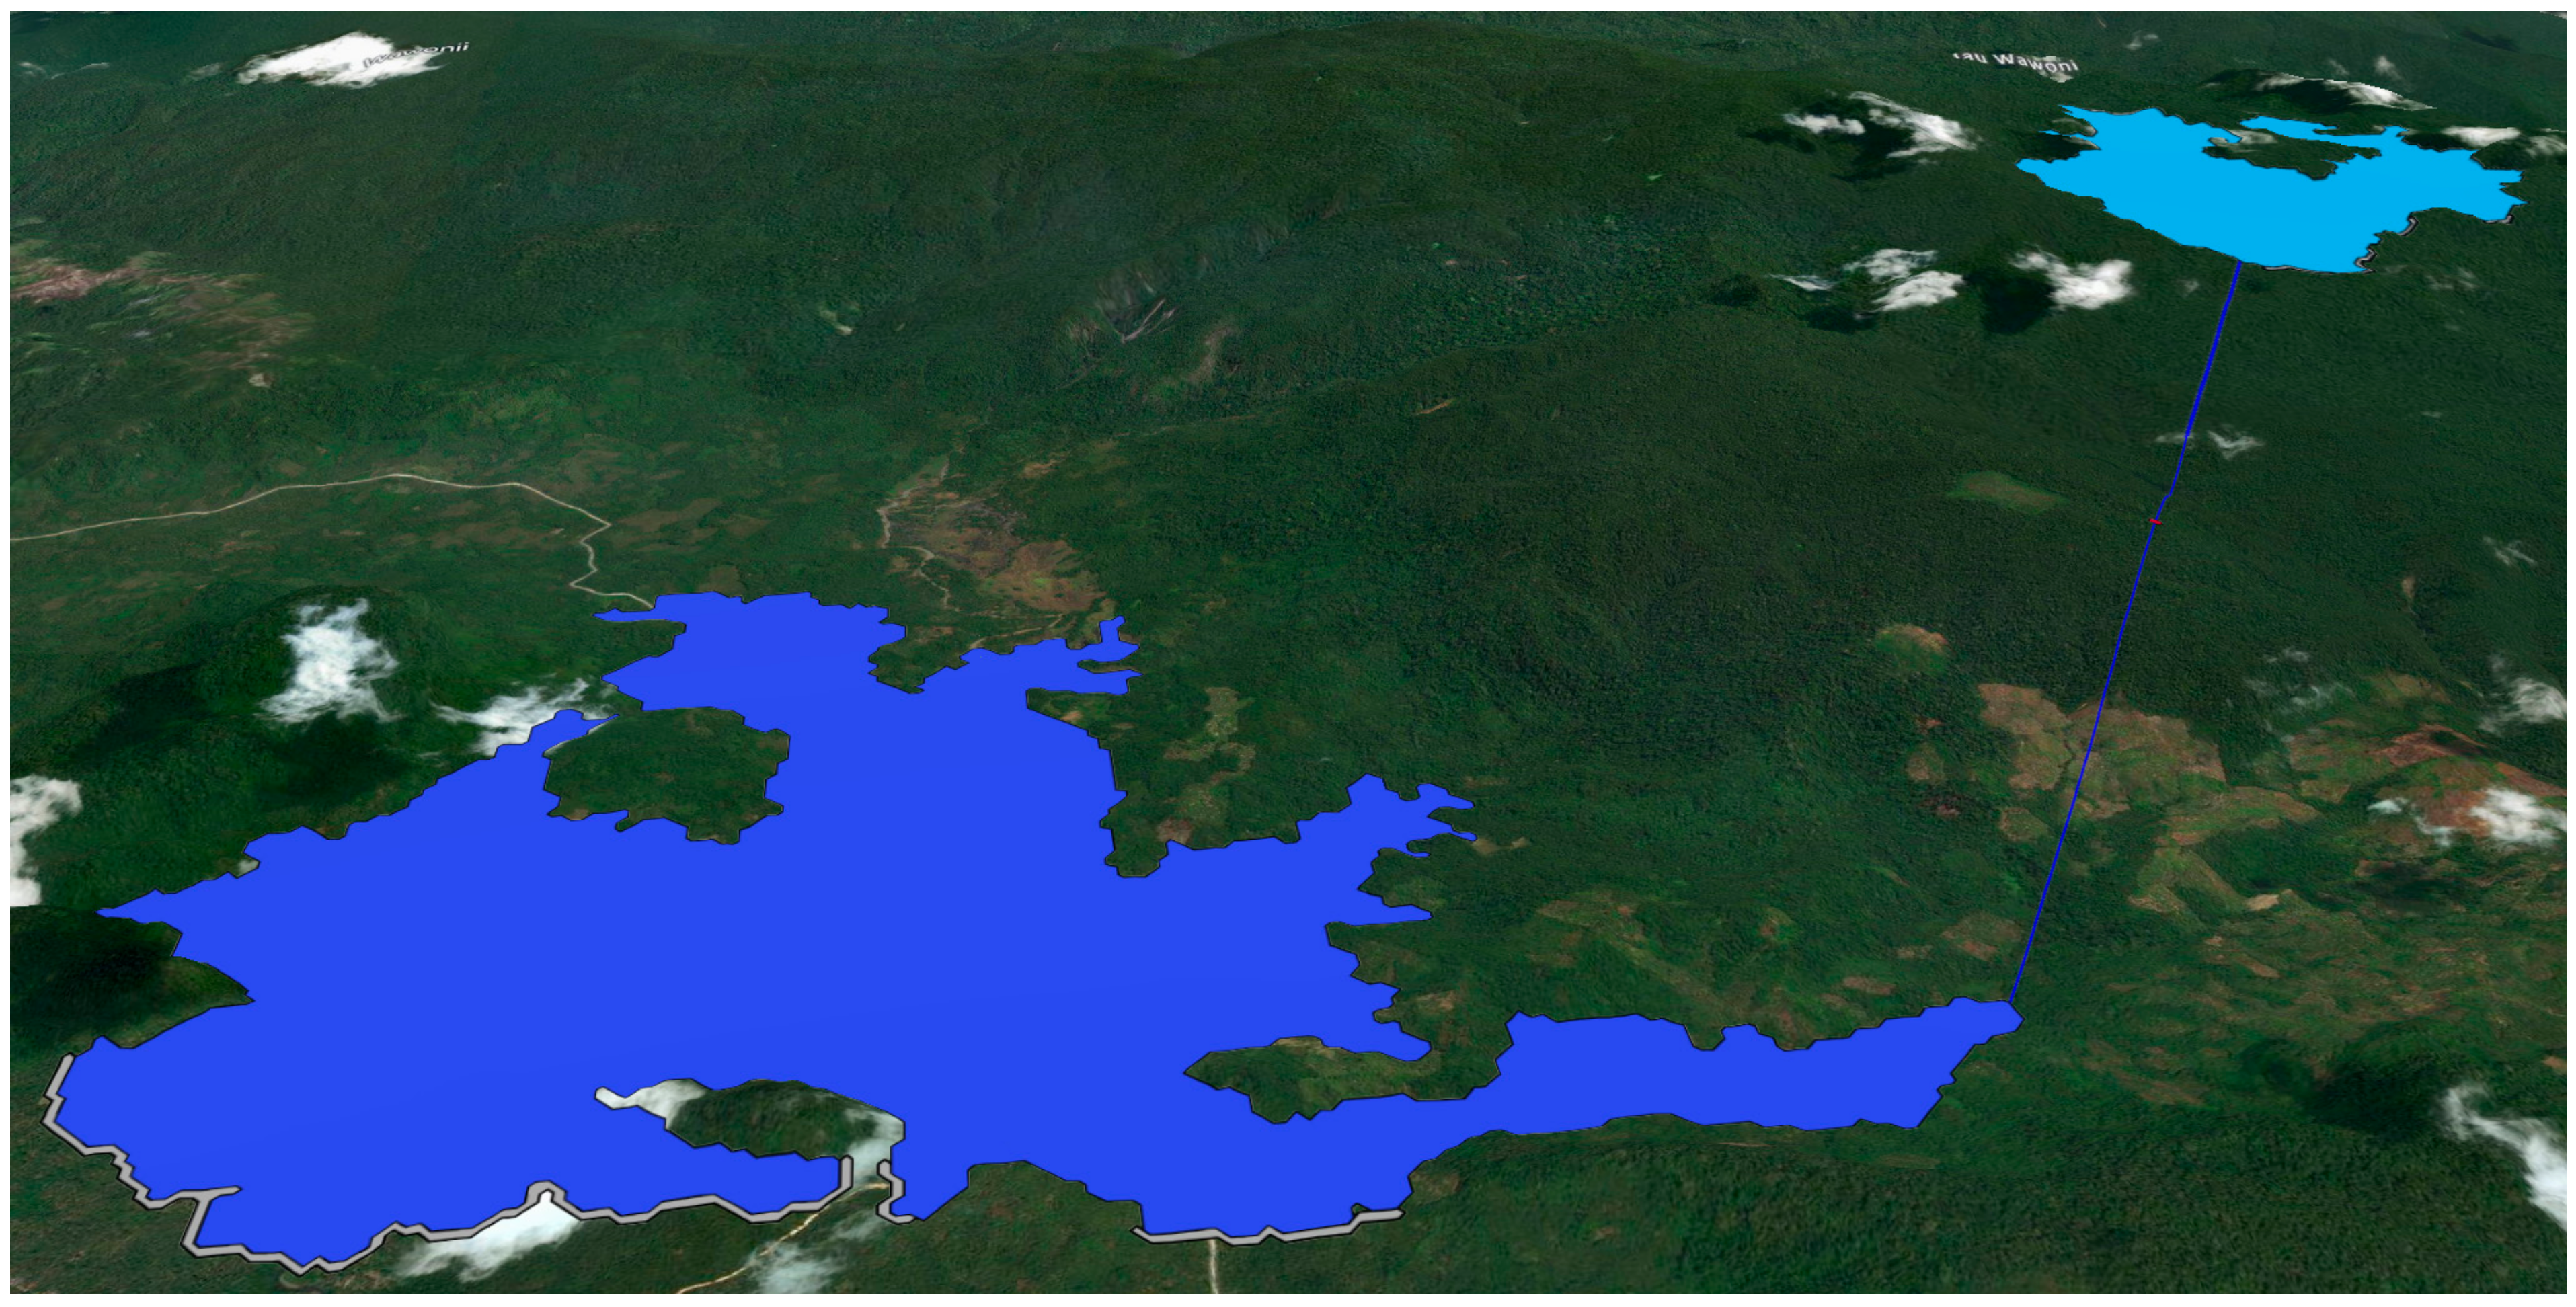
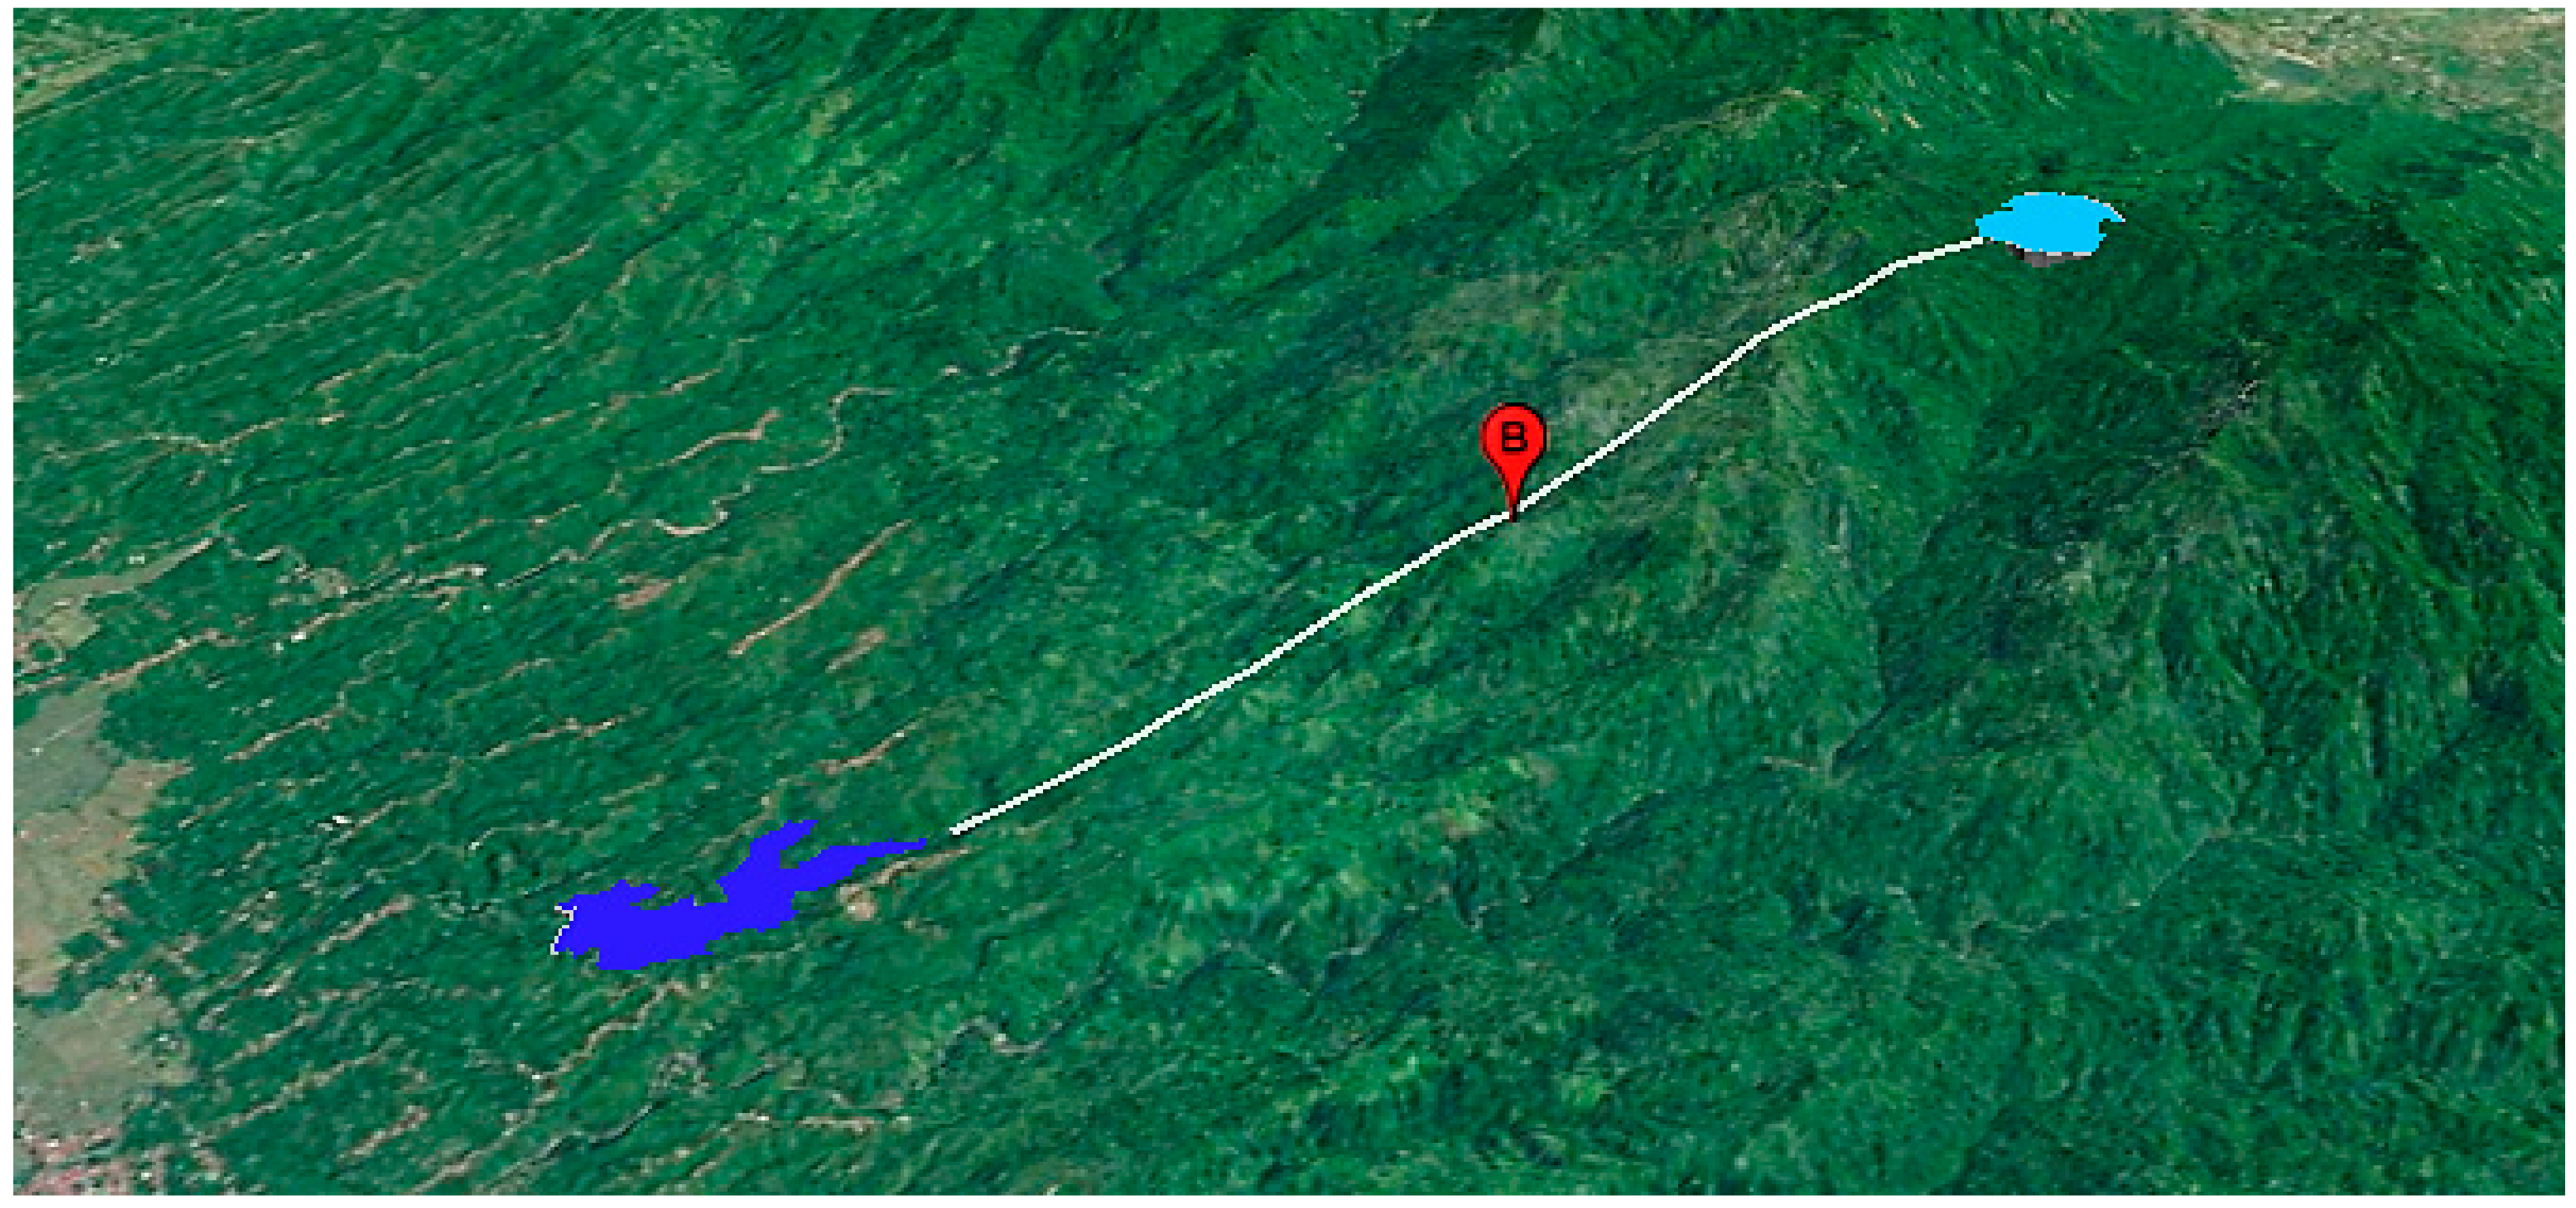
A 50 GWh Class B site in Jembrana Regency, Bali Province, is used as an example of desktop analysis.
Figure 7 illustrates this hypothetical site: an upper (light blue) and lower (dark blue) reservoir connected with a tunnel (white line).
Table 4 shows the shape, area and land-use categories and approximate land acquisition cost for the upper and lower reservoirs. Land use is 195 Ha, which amounts to about 4 Ha per GWh.
In the example shown in
Table 4, a forest is flooded to the extent of 73 Ha, which is unfortunate. To place this in perspective, this is a 4 billion USD investment for 50 GWh of energy storage, which is sufficient to service the energy storage needs of 0.7 million people (about 1 m
2 per person) for a future, industrialised, fully electrified (zero fossil fuel) Indonesia (75 kWh per person).
The cost of initial water filling must be included in the cost model. Using QGIS, the catchment areas of water flows to the reservoirs were analysed. Land elevation from USGS Earth Explorer [
40] was used to delineate the water catchment area. As suggested by The Indonesian National Standard [
41] for water catchment with less than 50 km
2 area, water flow can be calculated using the rational method formula developed by Mulvany [
42]. Annual rainfall from the Meteorological, Climatological, and Geophysical Agency [
33] and coefficient of run-off for each land categorisation [
41] was applied.
Table 5 illustrates the water catchment areas.
The combined upper and lower reservoir water catchment areas (1600 ha) can provide a rainwater flow of up to 9.6 GL per year, which will be partially offset by evaporation [
43]. This is much lower than the 30 GL required for the initial fill. Hence, if the reservoirs are to be filled within the last year of construction, delivering water from other nearby catchments, rivers or lakes will be necessary. Adopting a water cost of 0.5 million USD per GL (
Section 3.3.3) means that the cost of the initial water fill will be about 15 million USD.
Table 6 shows the characteristics of four sites analysed in a similar fashion to the Bali site. The Bali, Java and Kalimantan sites are Greenfield. The Sumatra site is Bluefield and utilises Lake Toba as the lower reservoir. Details are included in
Supplementary Materials.
Characteristics that confer low capital costs per unit of storage are large power capacity, large energy storage volume, a large head, large ratio of head to separation (“slope”) and large water–rock ratio. Other desirable characteristics include low land usage per unit of energy stored, low land-acquisition costs, low water usage, ready access to affordable water, proximity to roads and transmission and low environmental impact. Indonesia has many similar sites.
5. Conclusions
This work shows that Indonesia has vast practical off-river pumped hydro energy storage potential that requires only a small fraction of Indonesia’s land area. A total of 26,000 off-river potential PHES sites were identified in Indonesia with 800 TWh of energy storage capacity. Good sites are available throughout Indonesia, including many on the heavily populated islands of Java, Bali and Sumatera. In particular, the vast majority of potential sites require no new dams on significant rivers.
A high-quality PHES site will have a large head, closely spaced reservoirs, a large volume of stored water per unit of reservoir wall volume, a large power and energy rating and low environmental impact. The large number of potential PHES sites allows energy planners to be choosy. The paper describes a methodology for desktop studies to sort through many candidate sites and find those that look particularly promising. These can then be the subject of detailed investigation.
A total of 321 TWh of PHES storage volume in the lowest (A and B) cost-classes were identified. This is hundreds of times larger than Indonesia would require if all currently generated electricity was derived from variable solar and wind. It is 13 times larger than required to support a hypothetical future Indonesian energy system in which per capita energy consumption rises to match neighbouring Singapore; in which transport, heating and industry are fully electrified; that uses 100% solar energy; and that uses no fossil fuels. About 0.1% of Indonesia’s total land area would be required for off-river PHES reservoir storage to support such an energy system (75 GWh per million people occupying 6 km2).
A companion paper [
2] describes how Indonesia has vast potential for generating solar electricity, particularly floating on its calm tropical inland sea. The generation potential is much more than it would need to support the hypothetical future Indonesian energy system described above.
An important feature of this work is that cost-effective, very large-scale storage potential is identified that requires no future technology improvements nor cost reductions (although these would be welcome). Indonesian energy planners can confidently develop very large-scale solar generation in the knowledge that at least one highly credible and technically mature energy storage solution is ready for use at any required scale with moderate cost and low environmental impact.
This work provides a basis for detailed modelling of pathways to decarbonise the Indonesian economy while rapidly increasing per capita energy use commensurate with rising living standards.


