
Harvesting Energy from Ocean: Technologies and Perspectives


Abstract
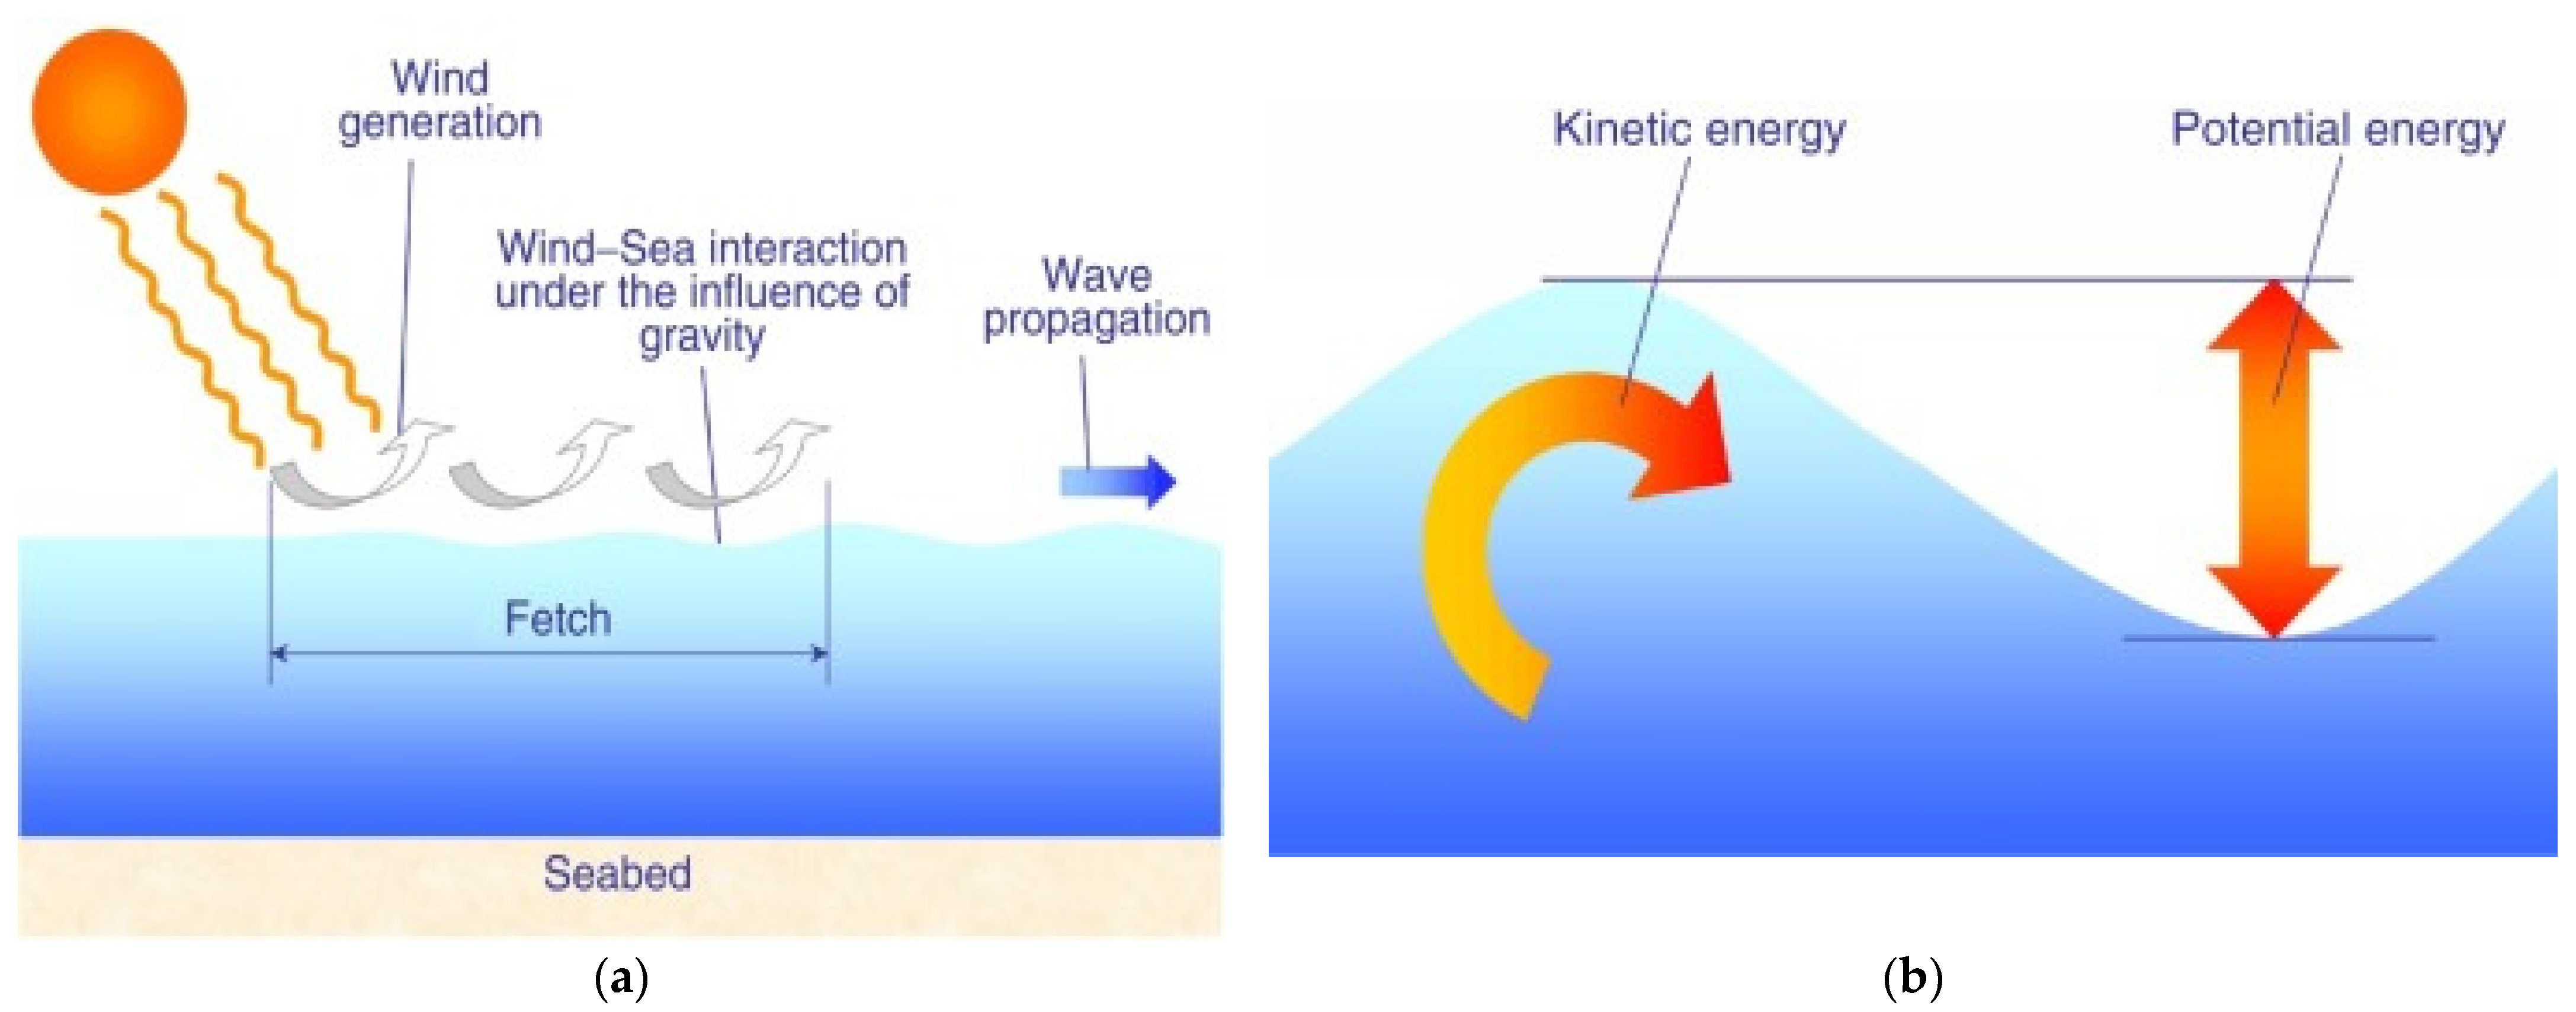
:1. Introduction
2. Ocean Energy Potential
2.1. Potential of Tidal Energy
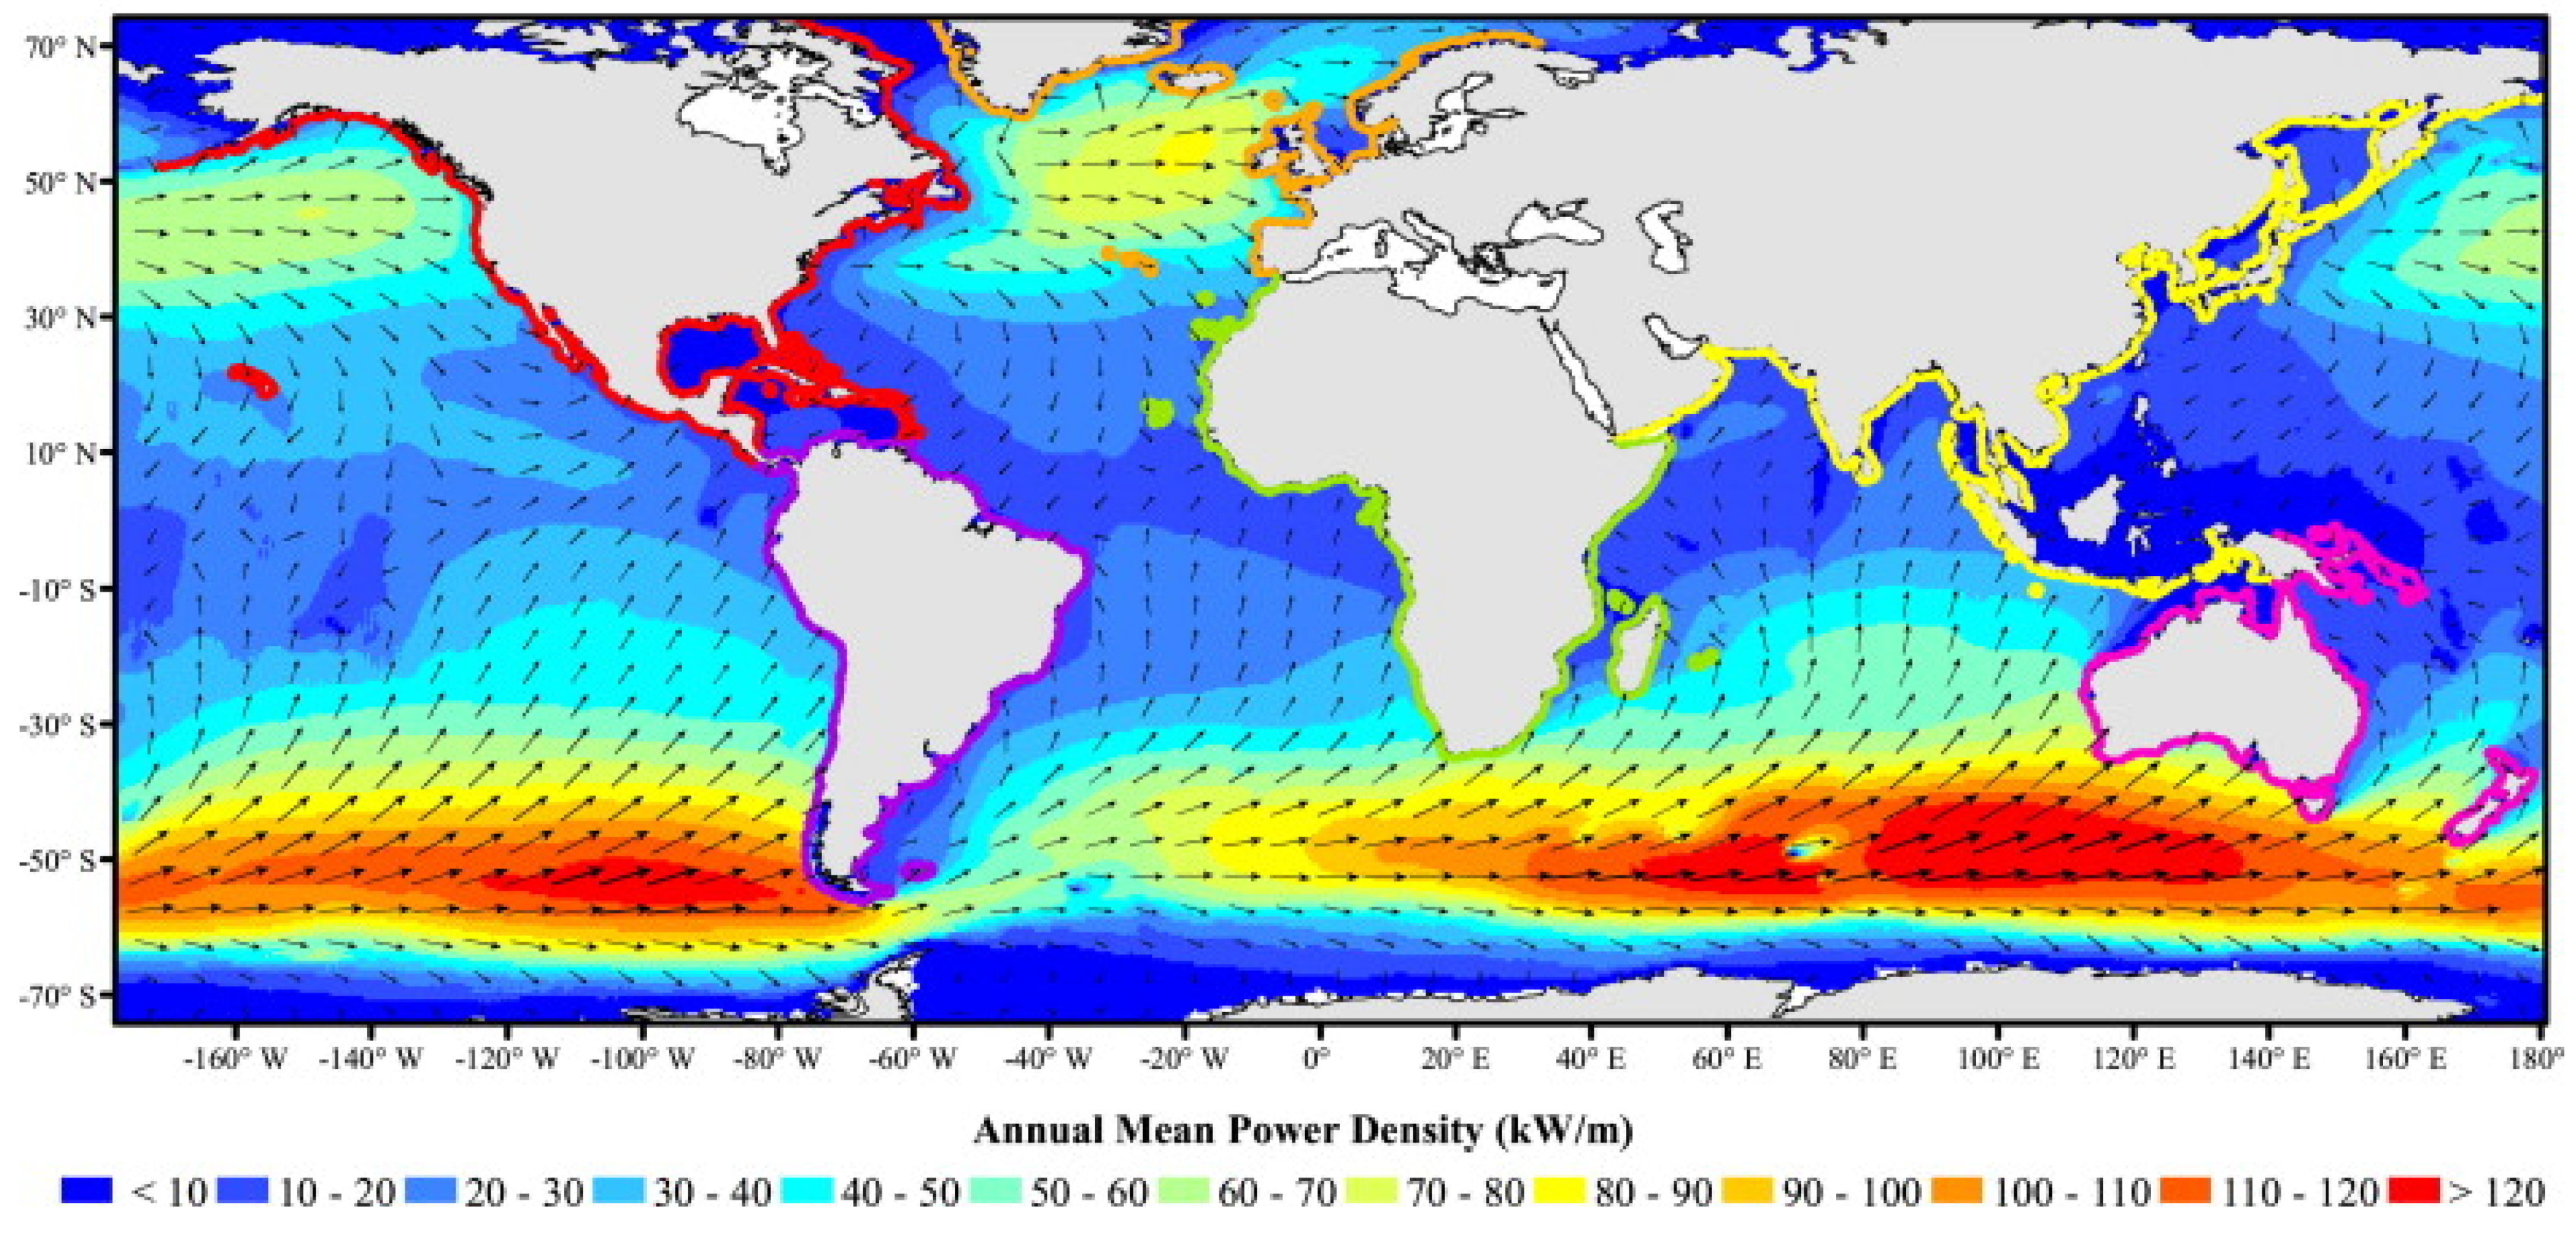
2.2. Potential of Wave Energy
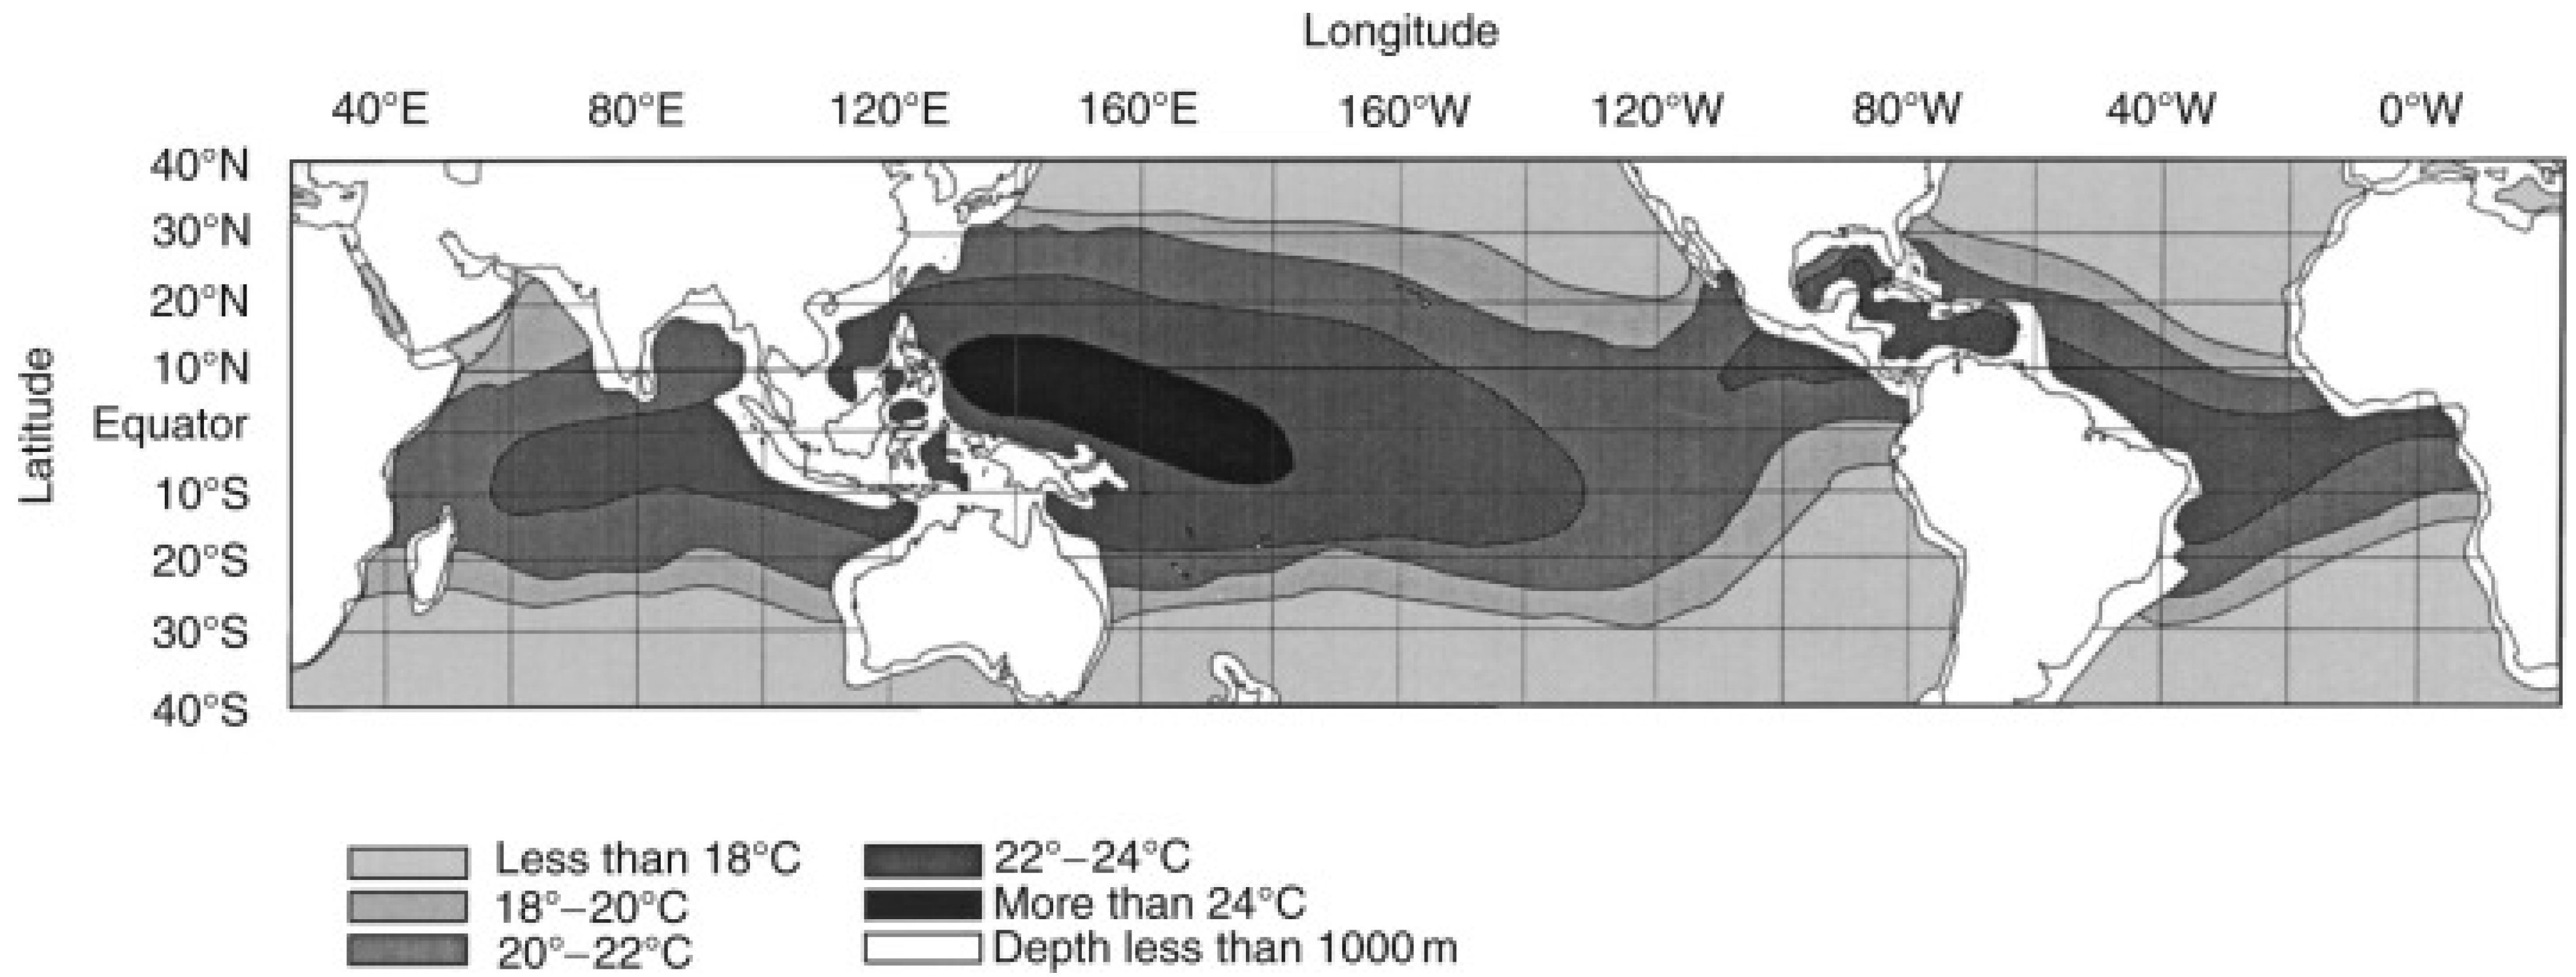
2.3. Potential of Ocean Temperature Difference
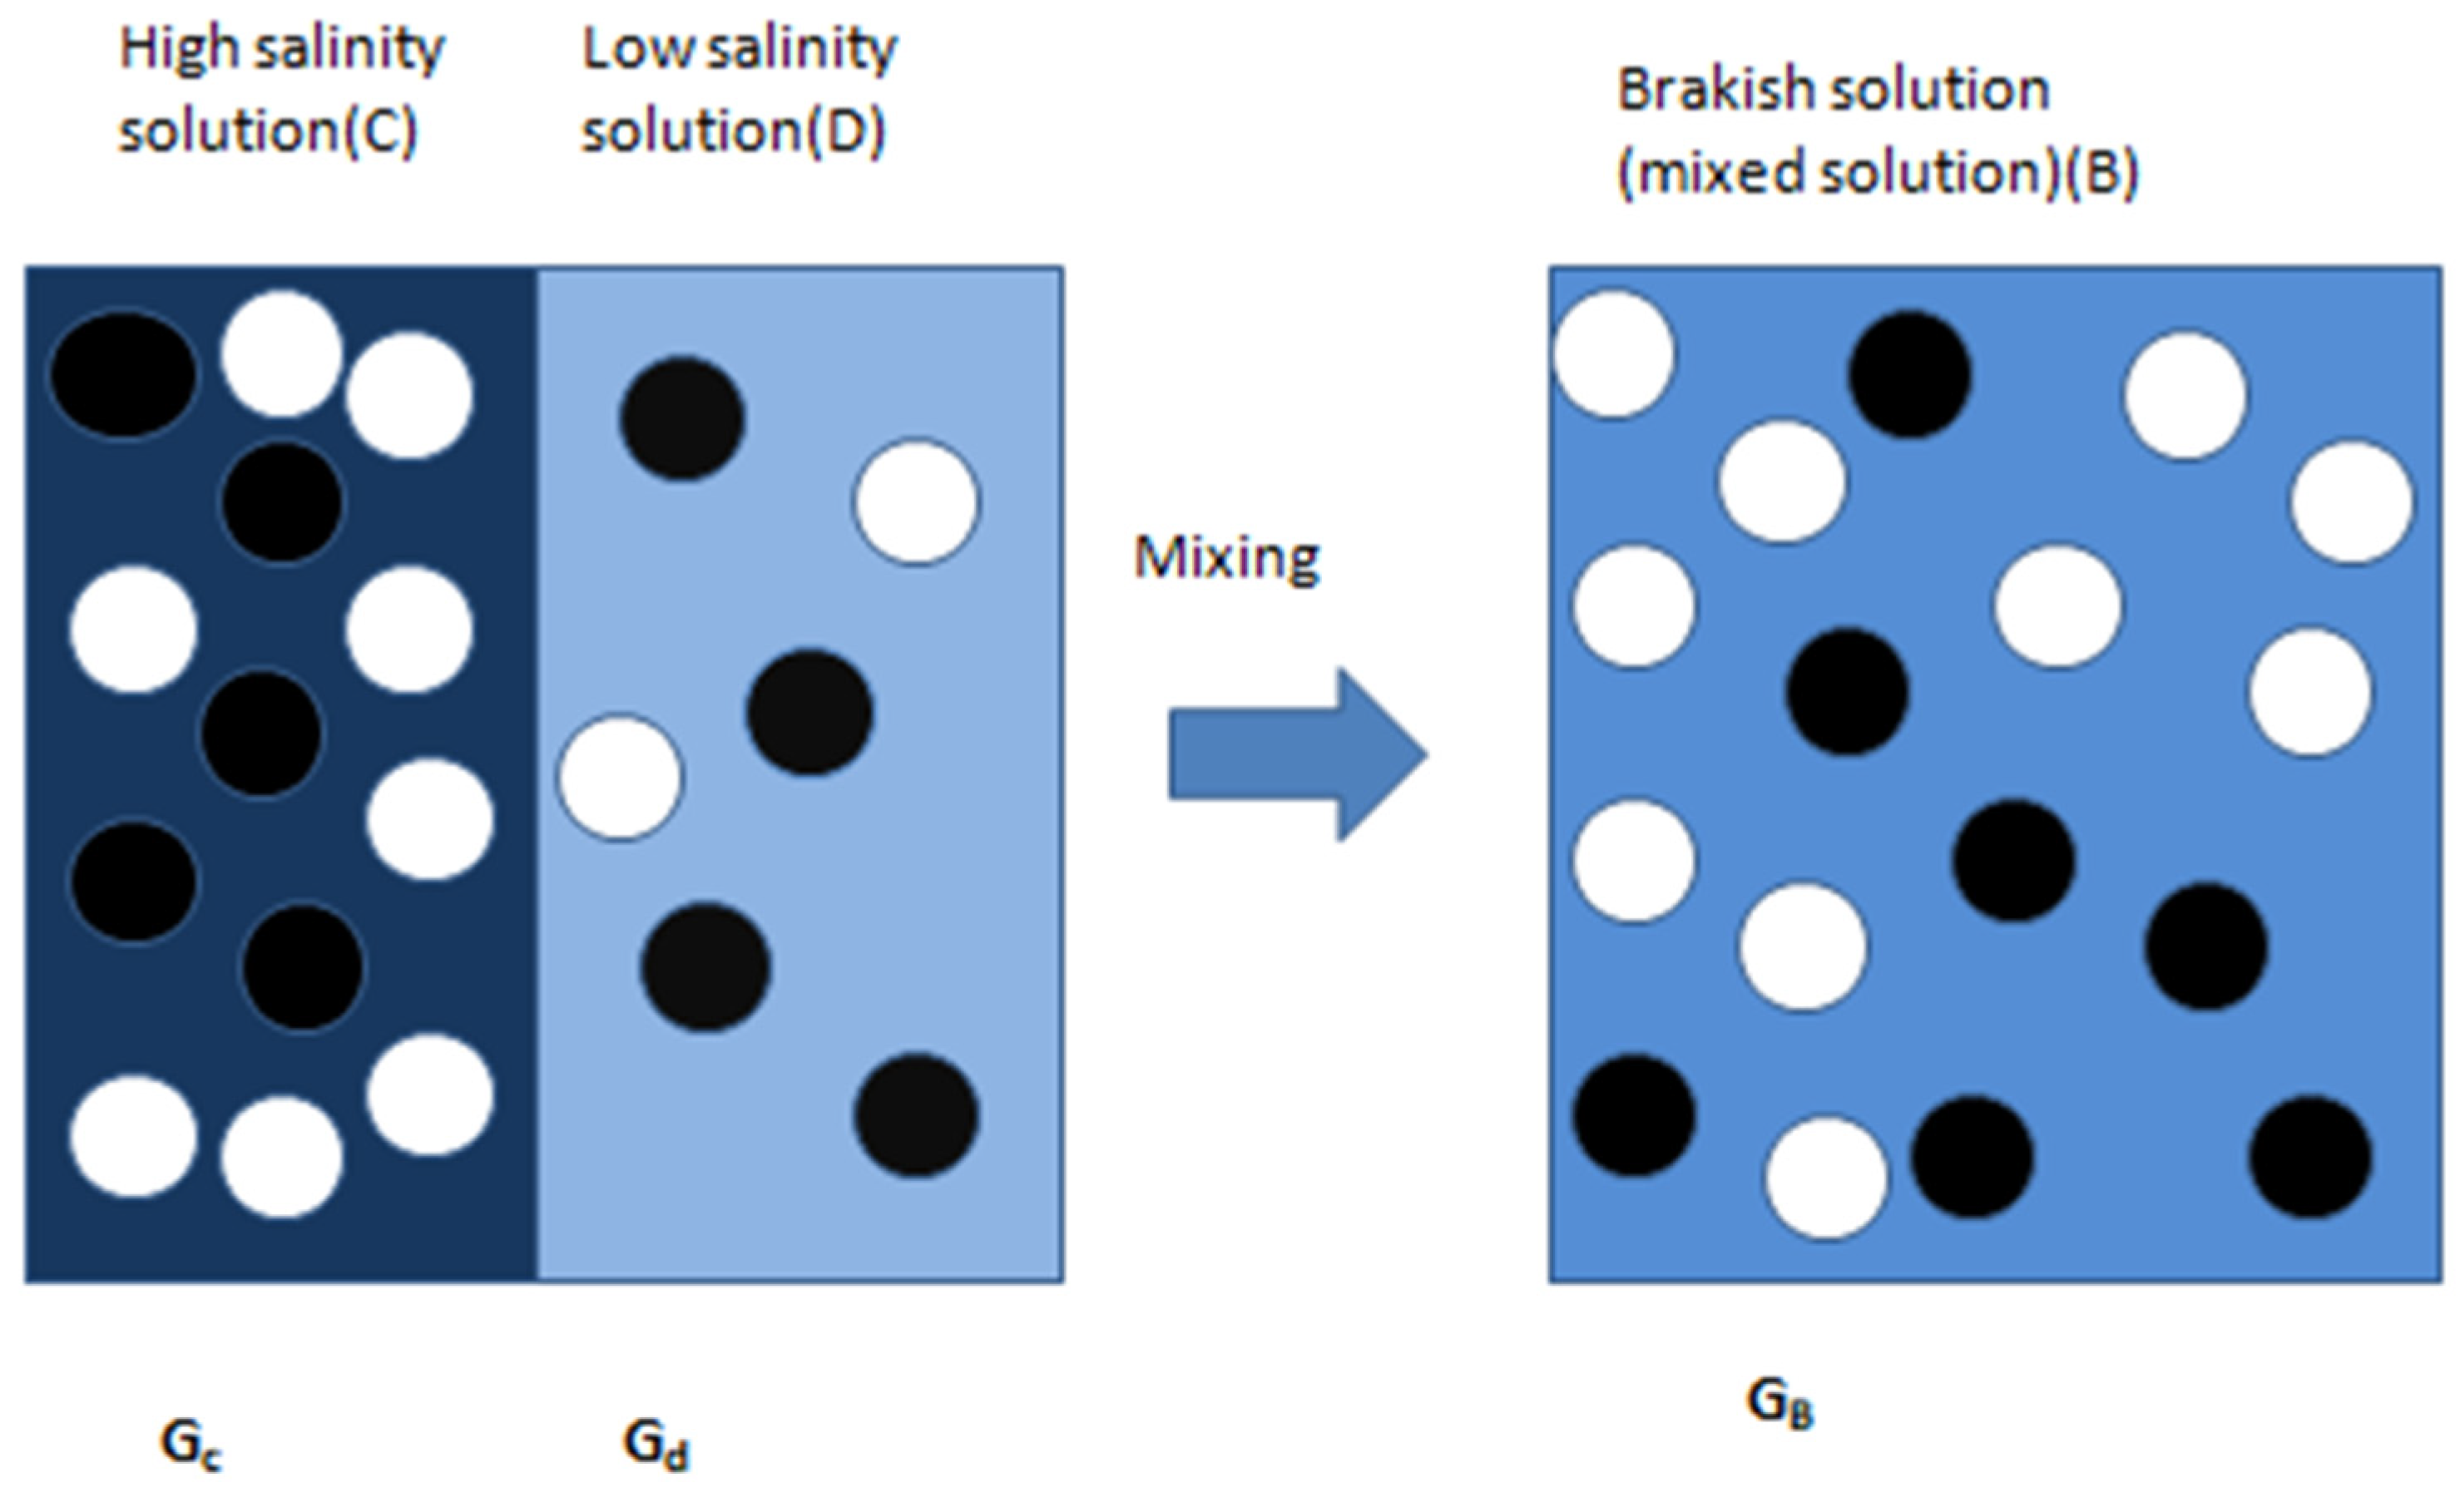
2.4. Potential of Salinity Gradient
3. Energy Harvesting Technologies from Wave/Tidal
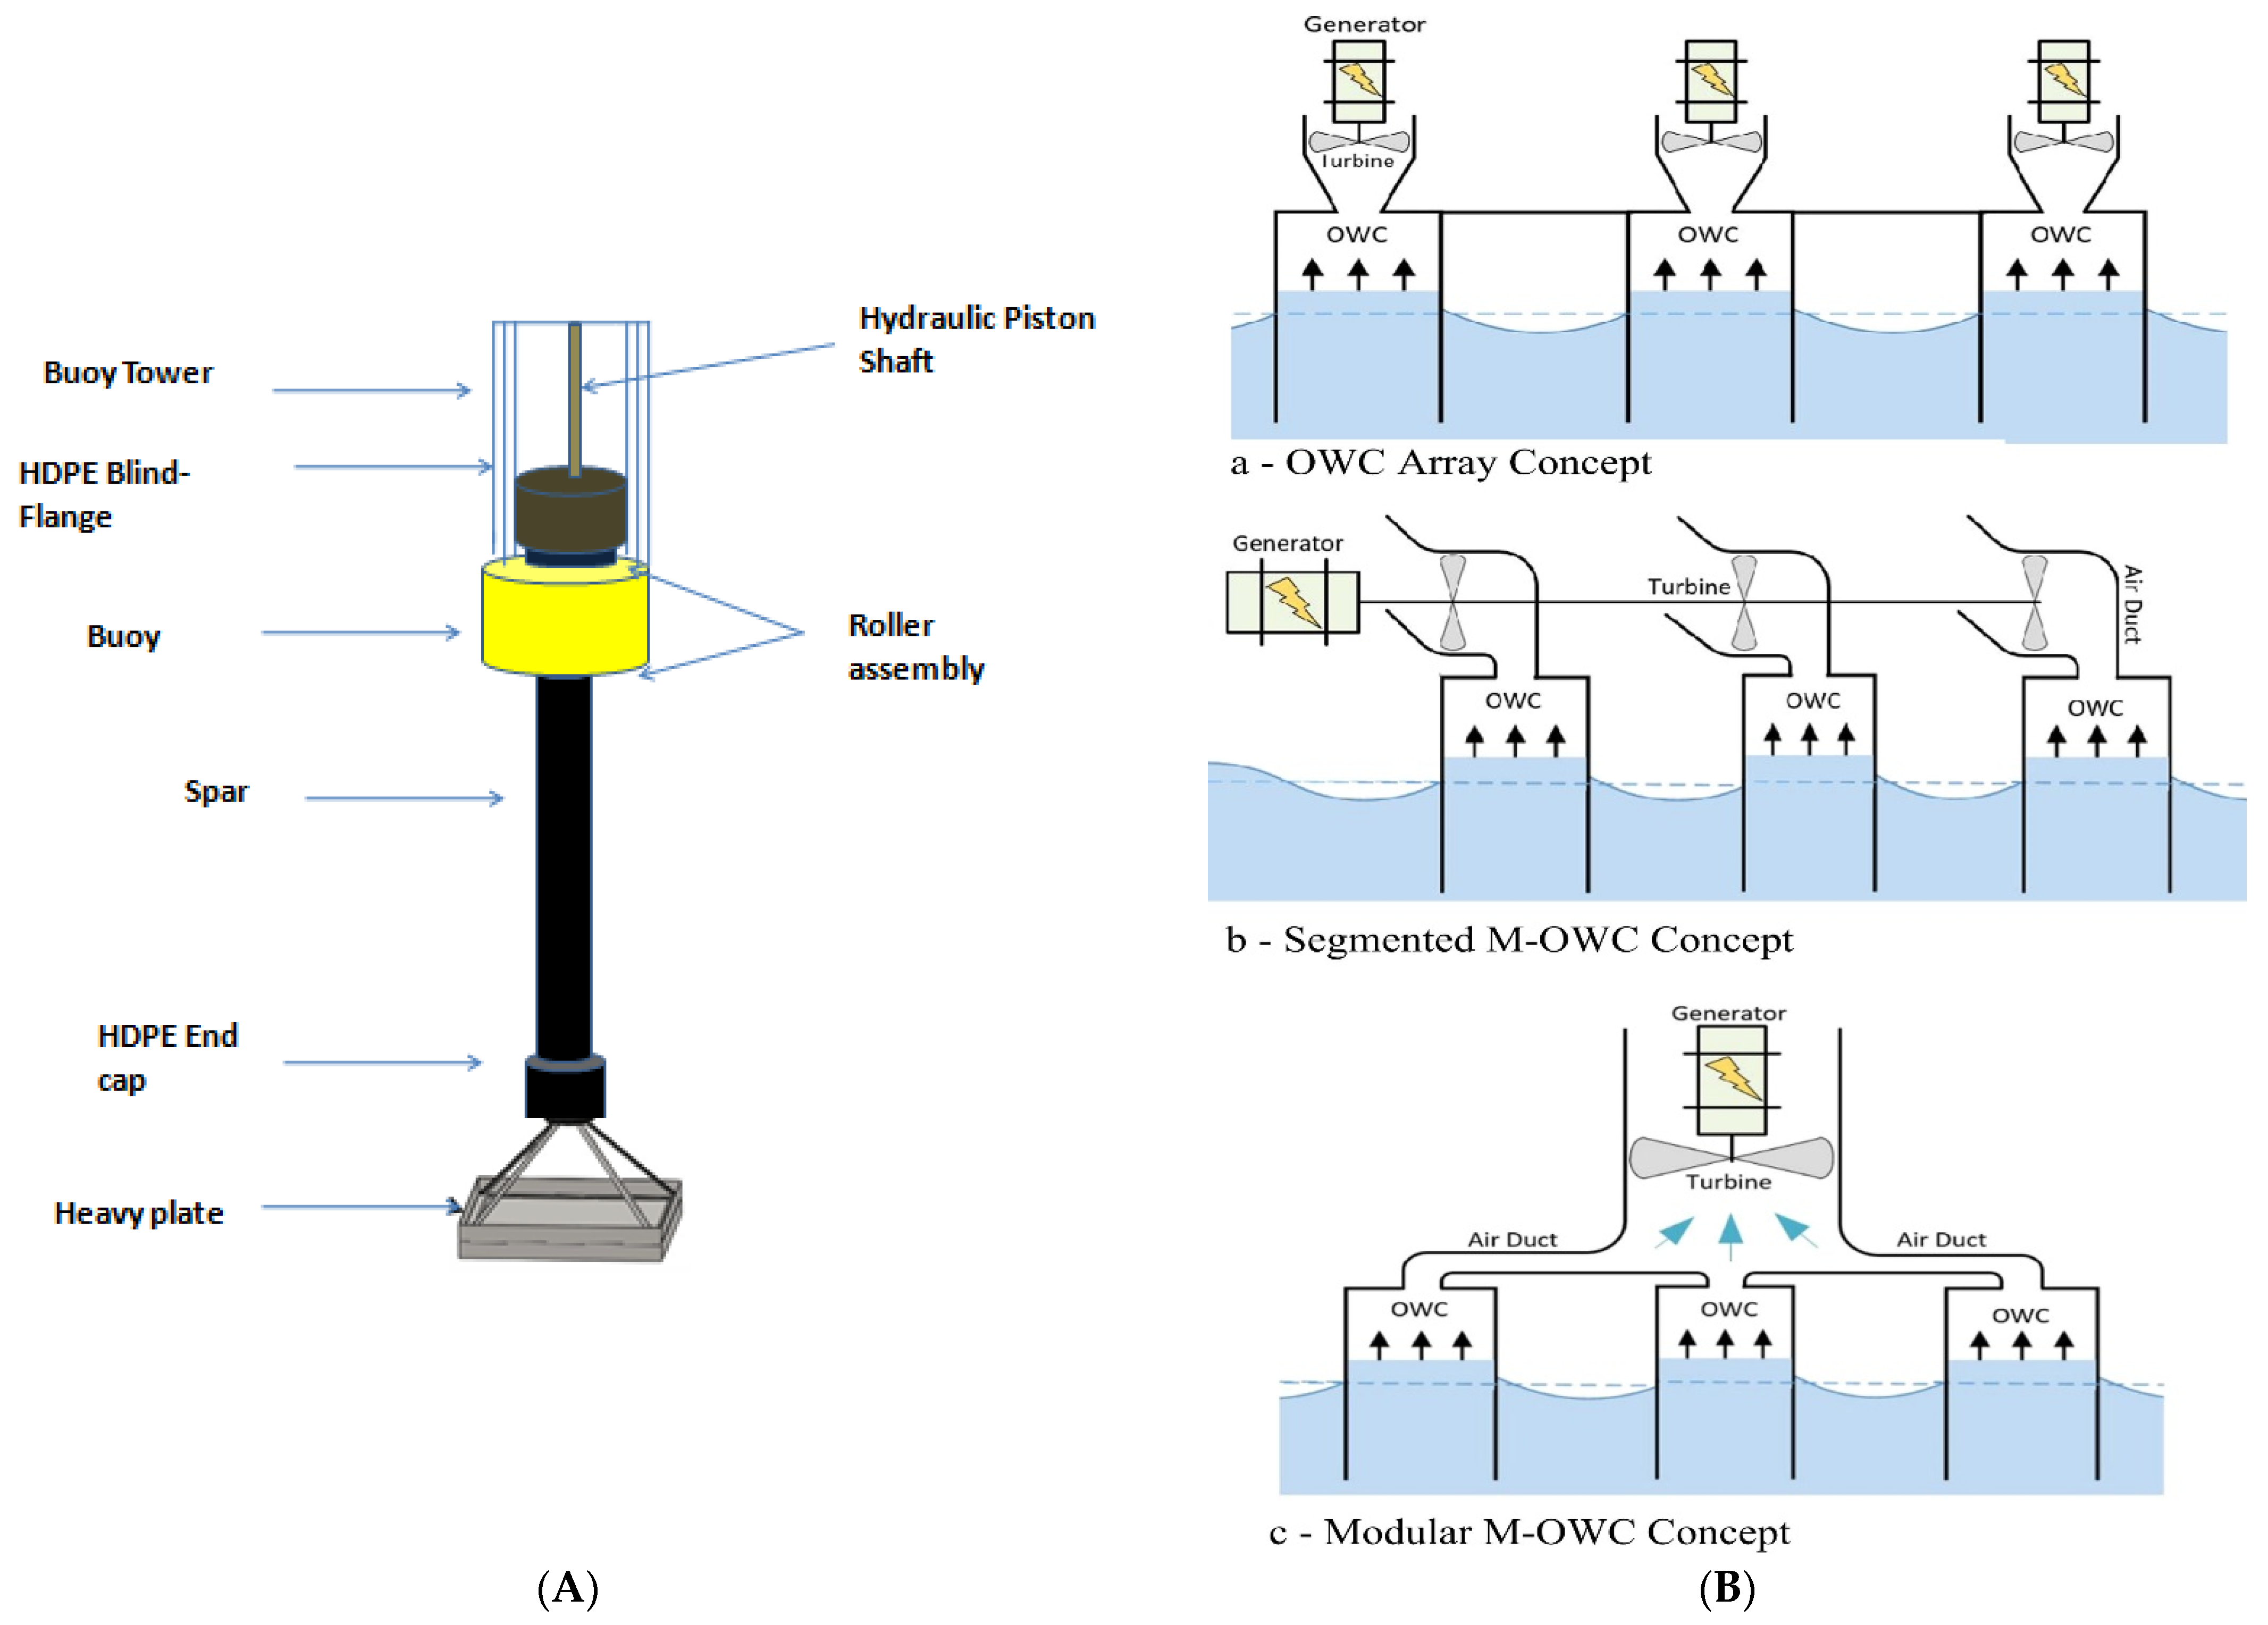
3.1. Wave Energy Extraction Devices
3.1.1. Oscillating Water Columns (OWCs)
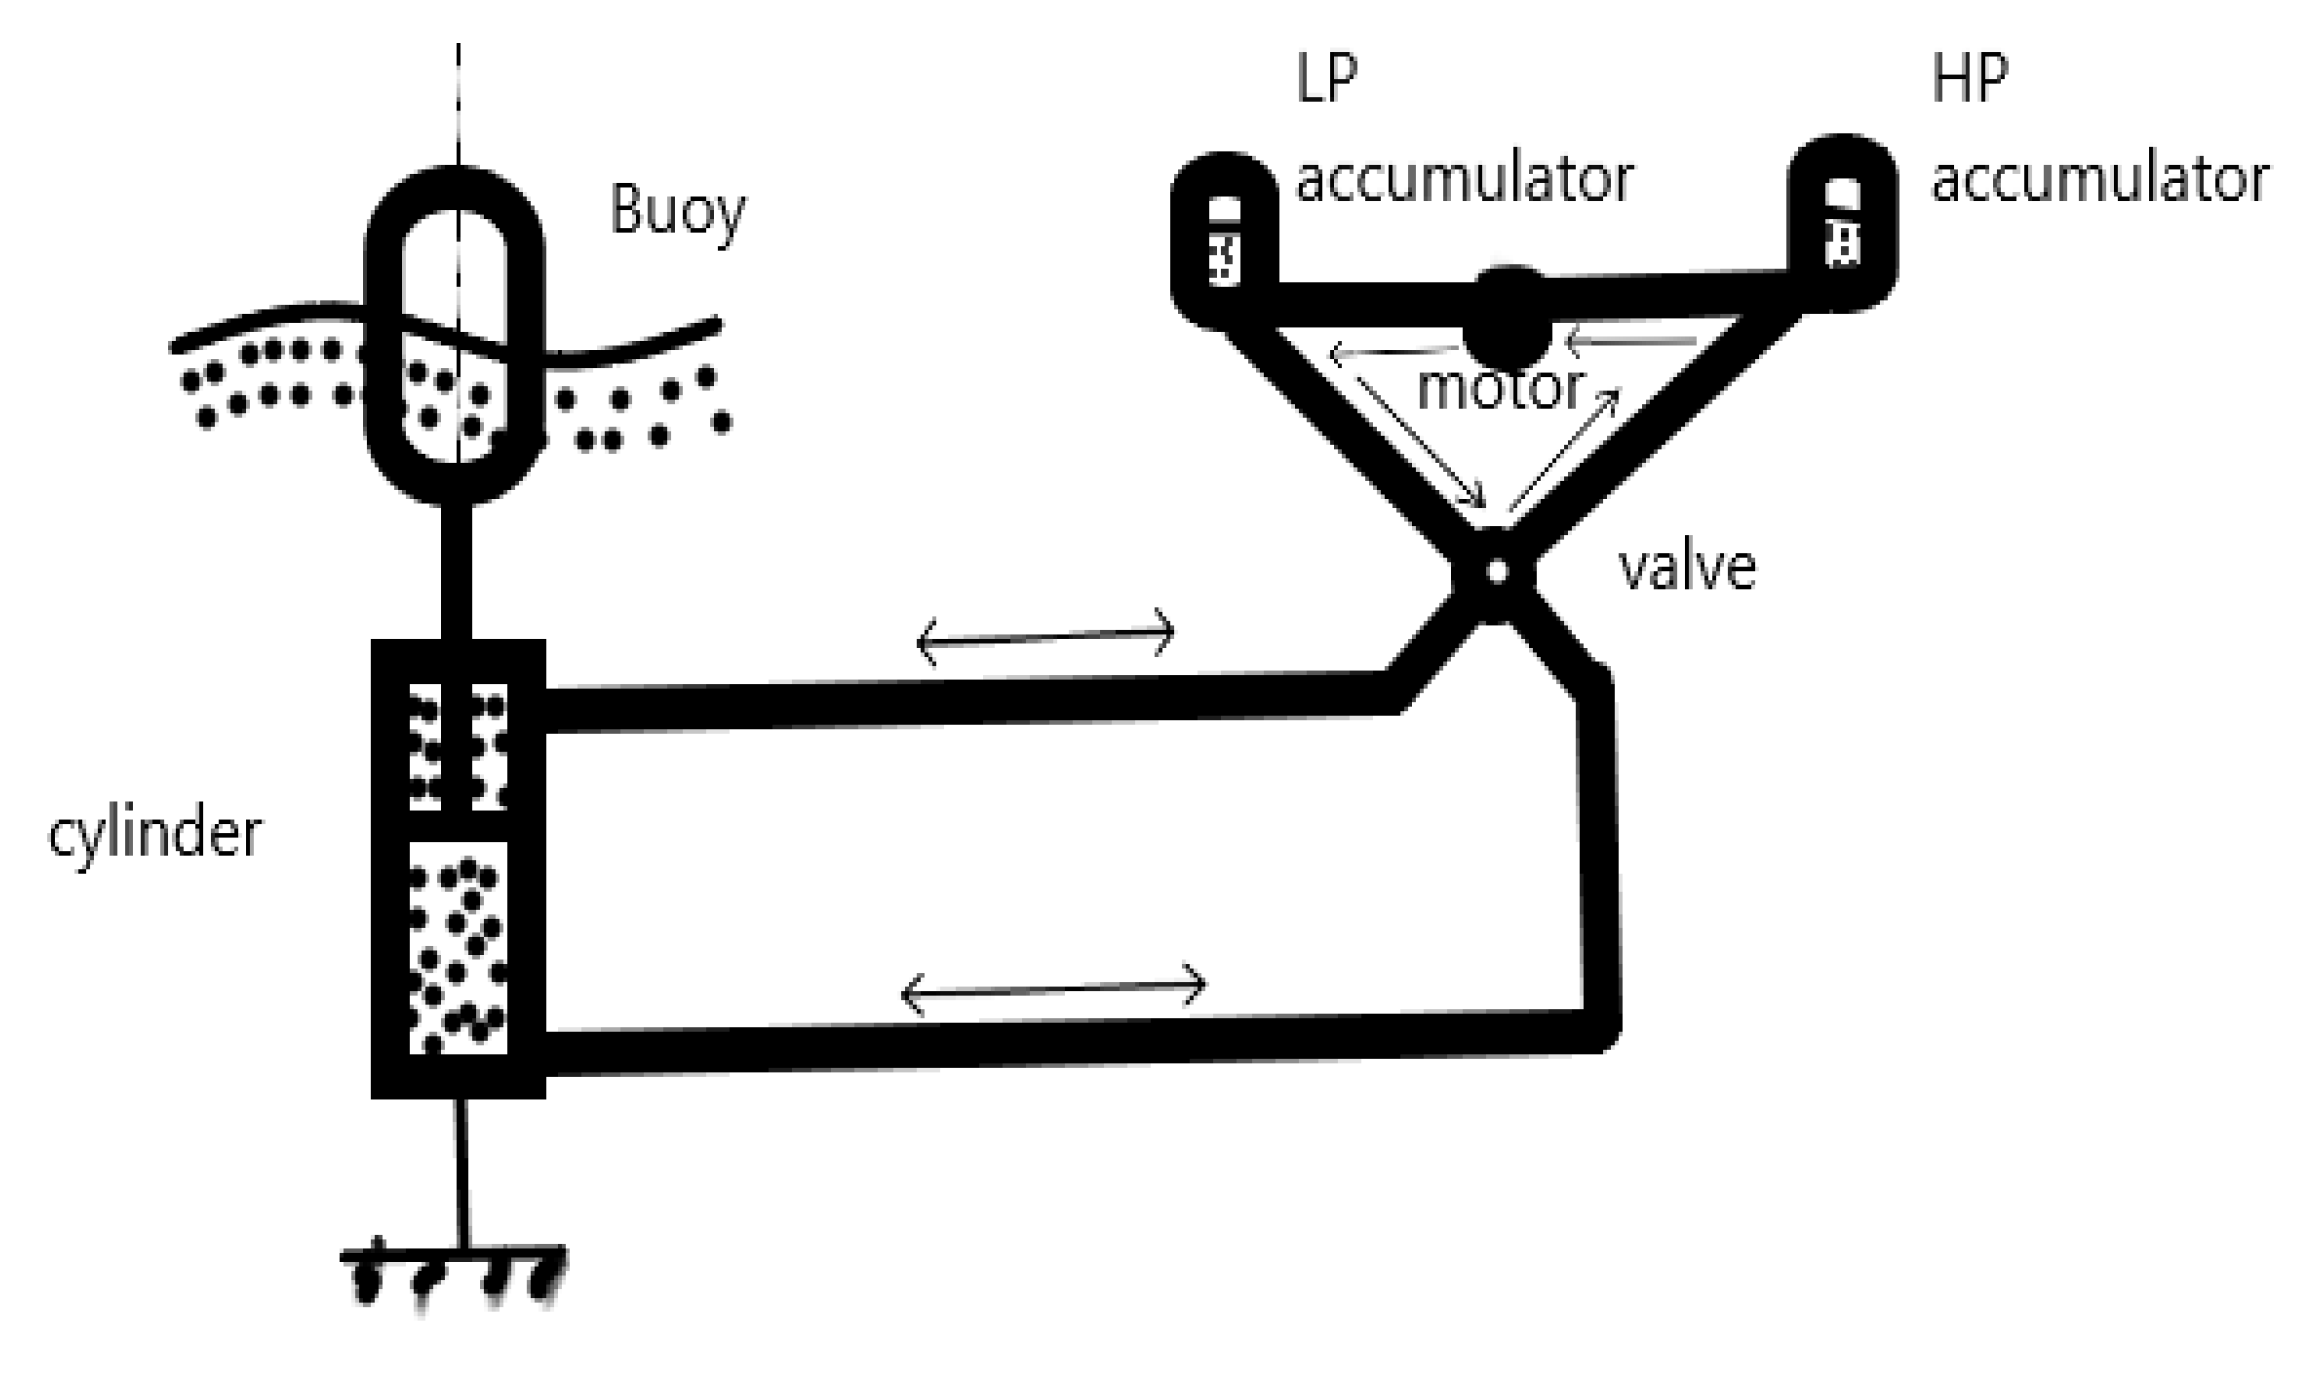
3.1.2. Oscillating Body Converters (OBCs)
3.1.3. Overtopping Converters
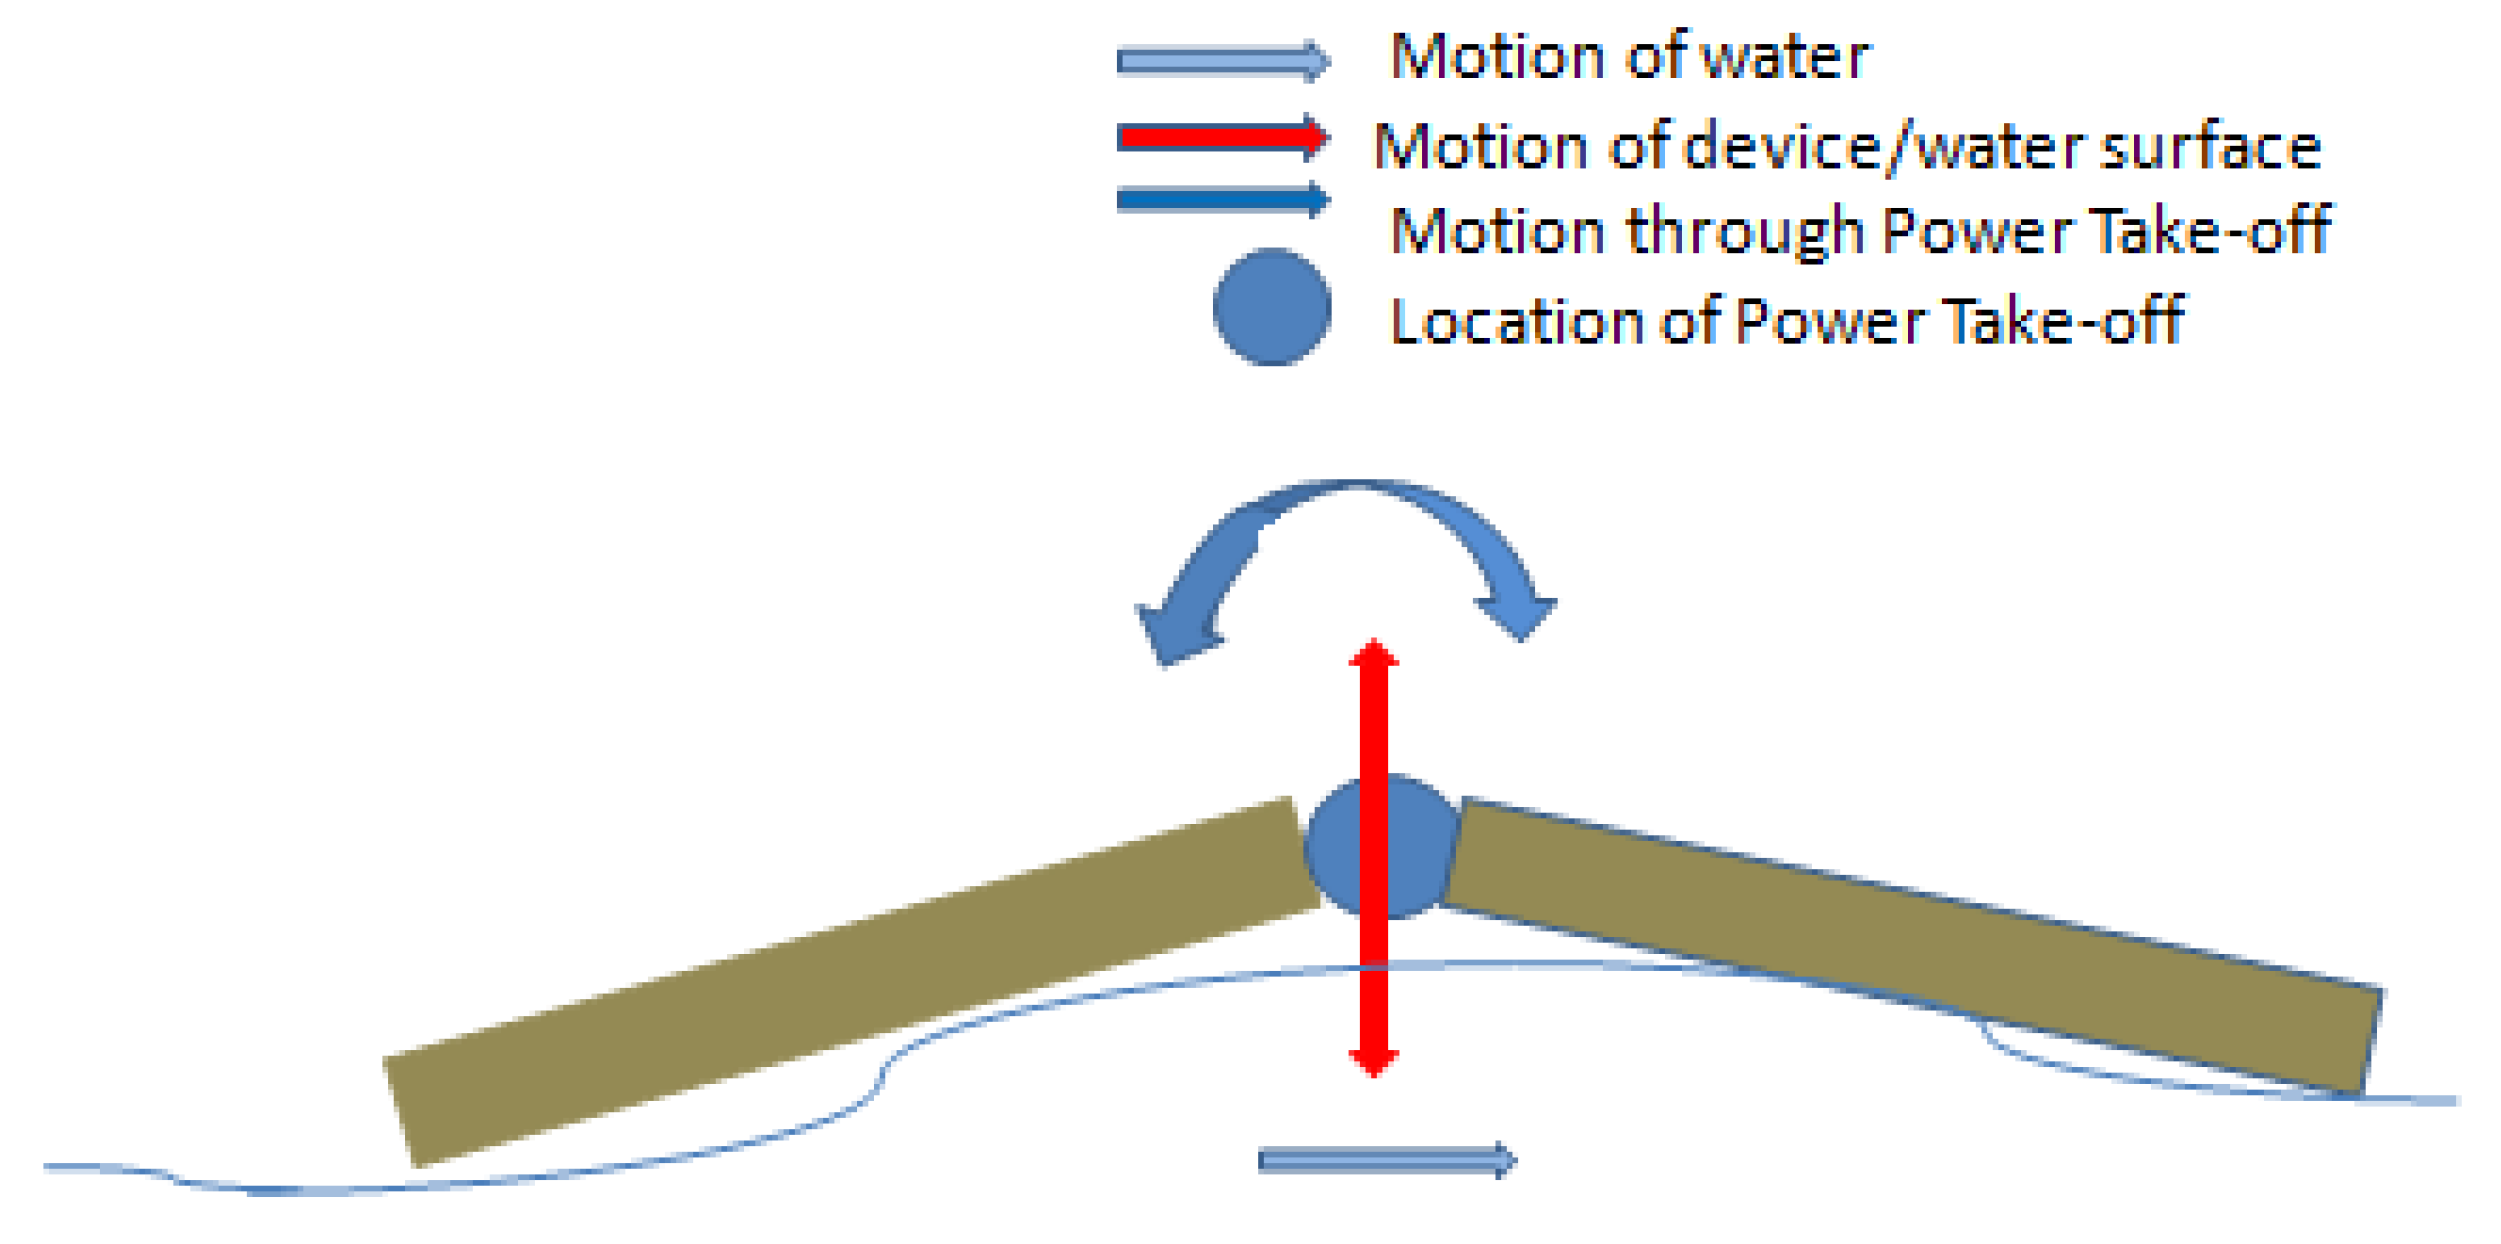
3.1.4. Wave-Activated Bodies (WAB)
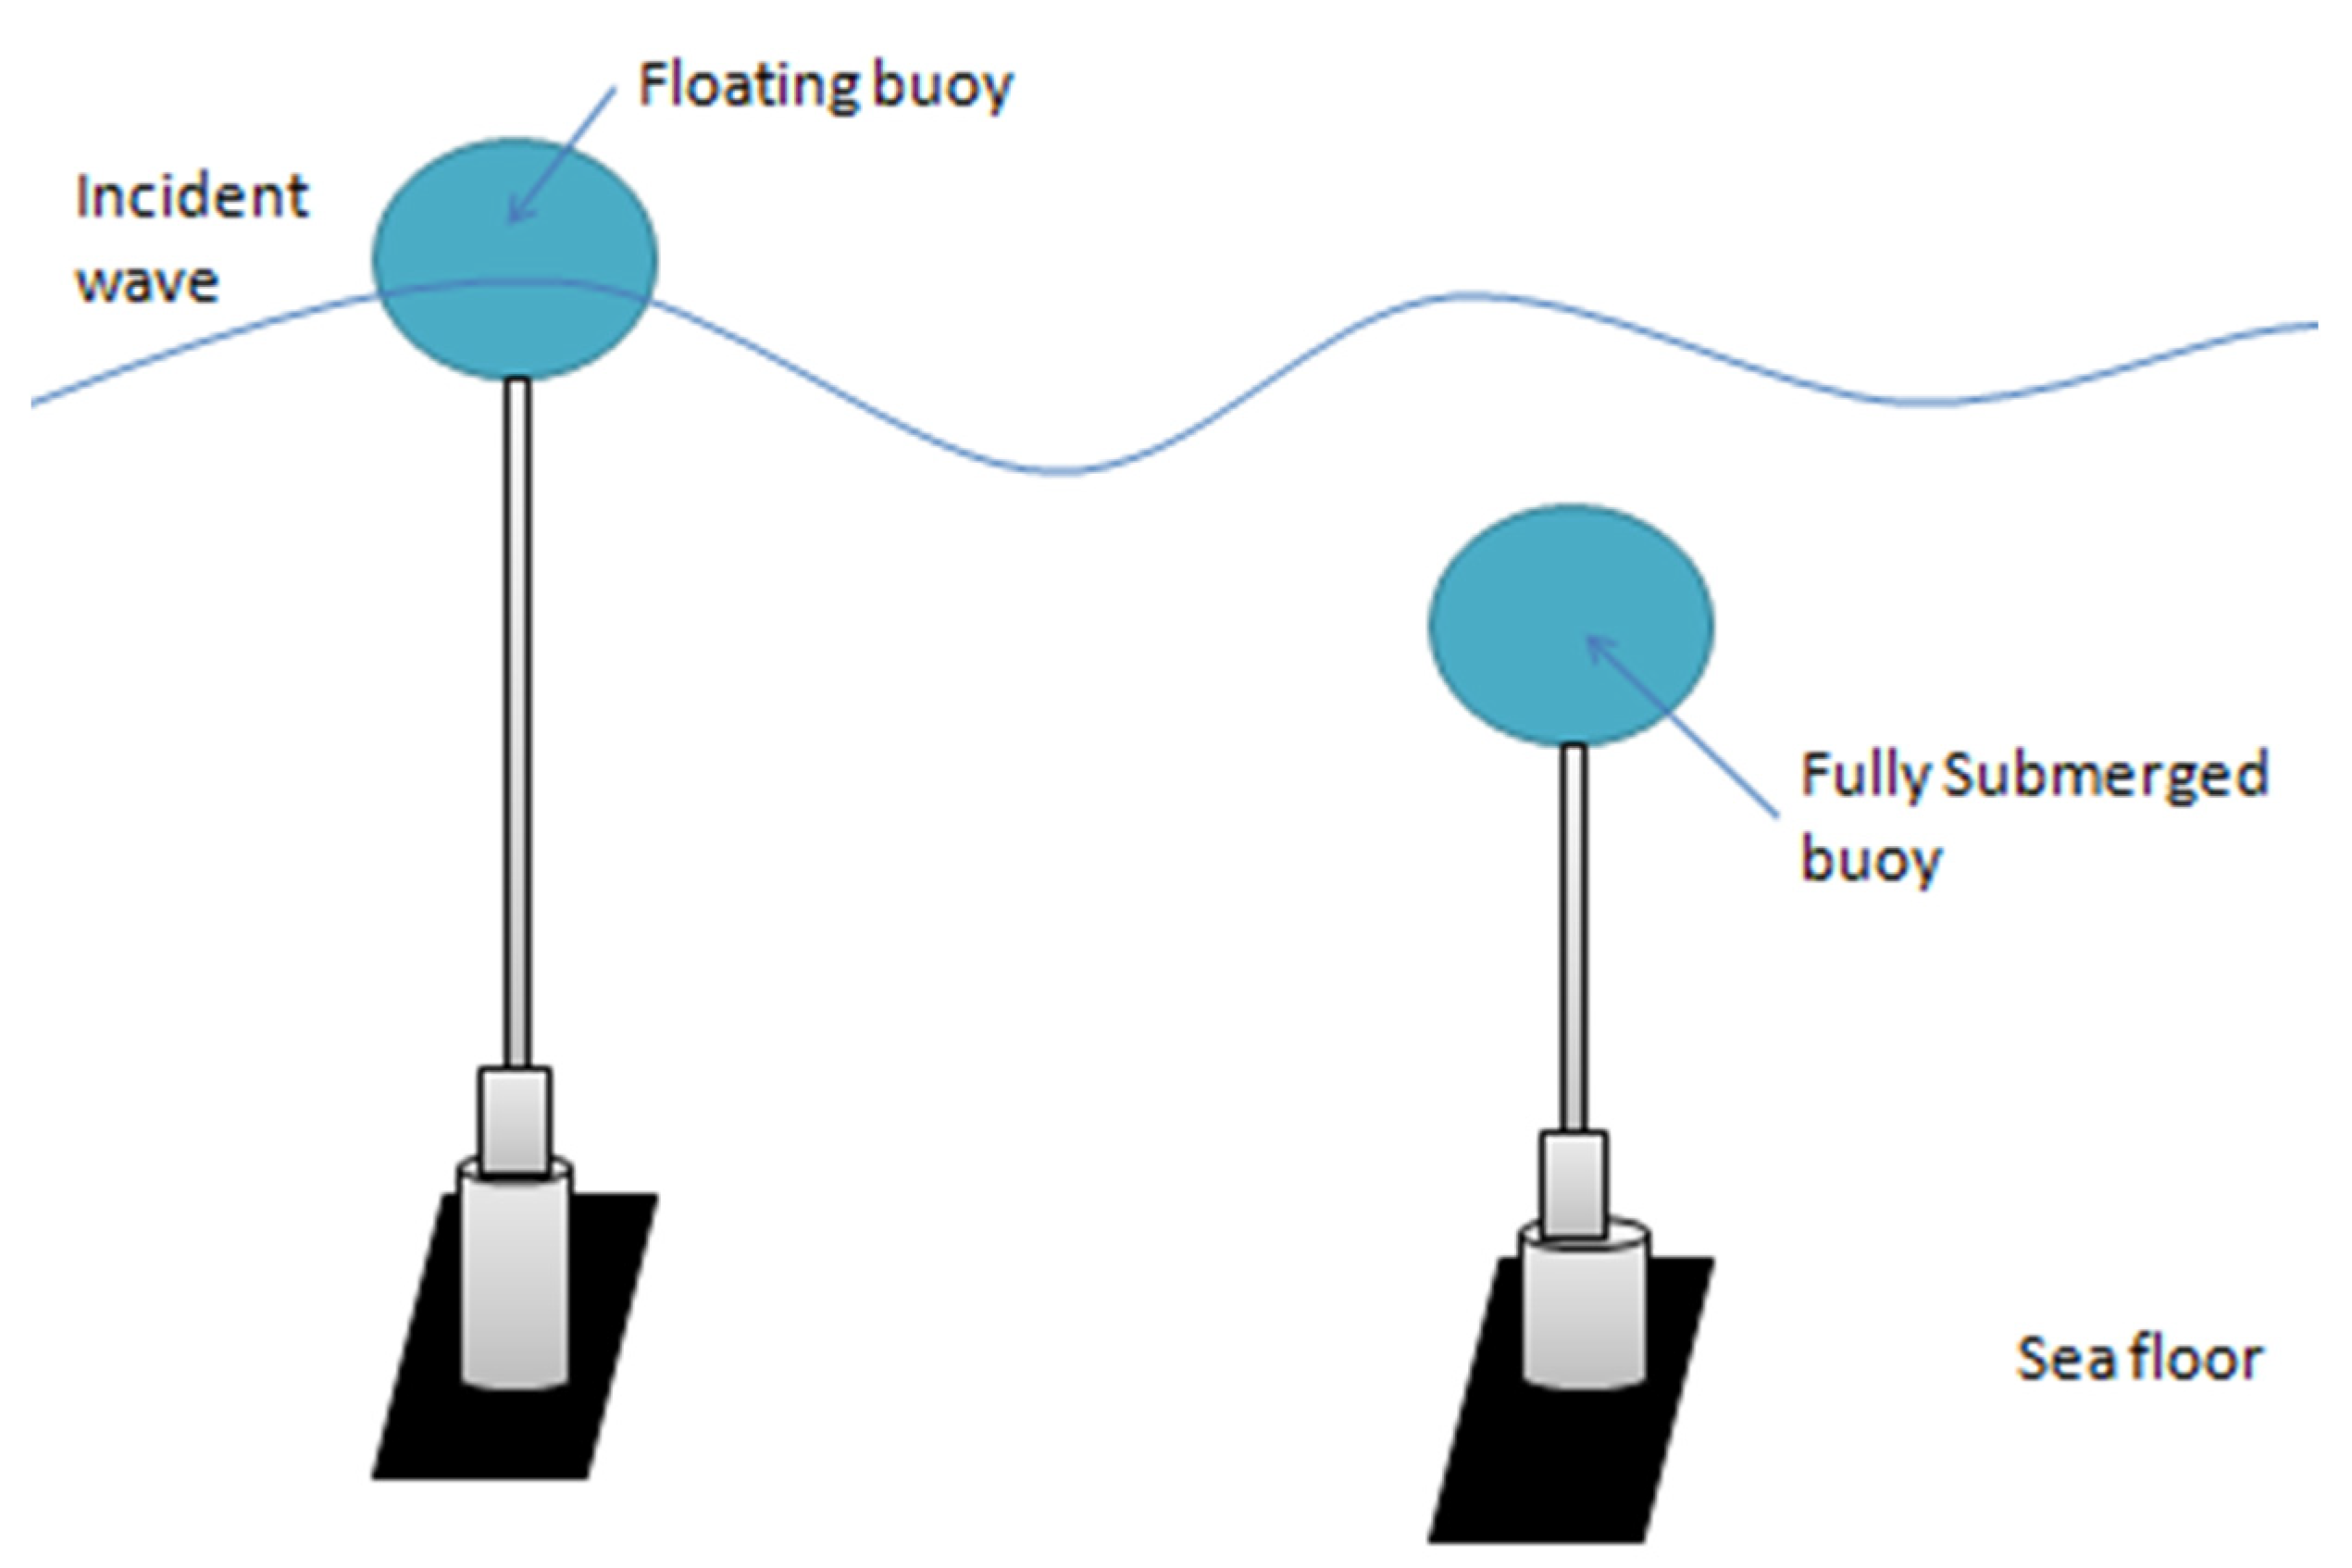
3.1.5. Point Absorber
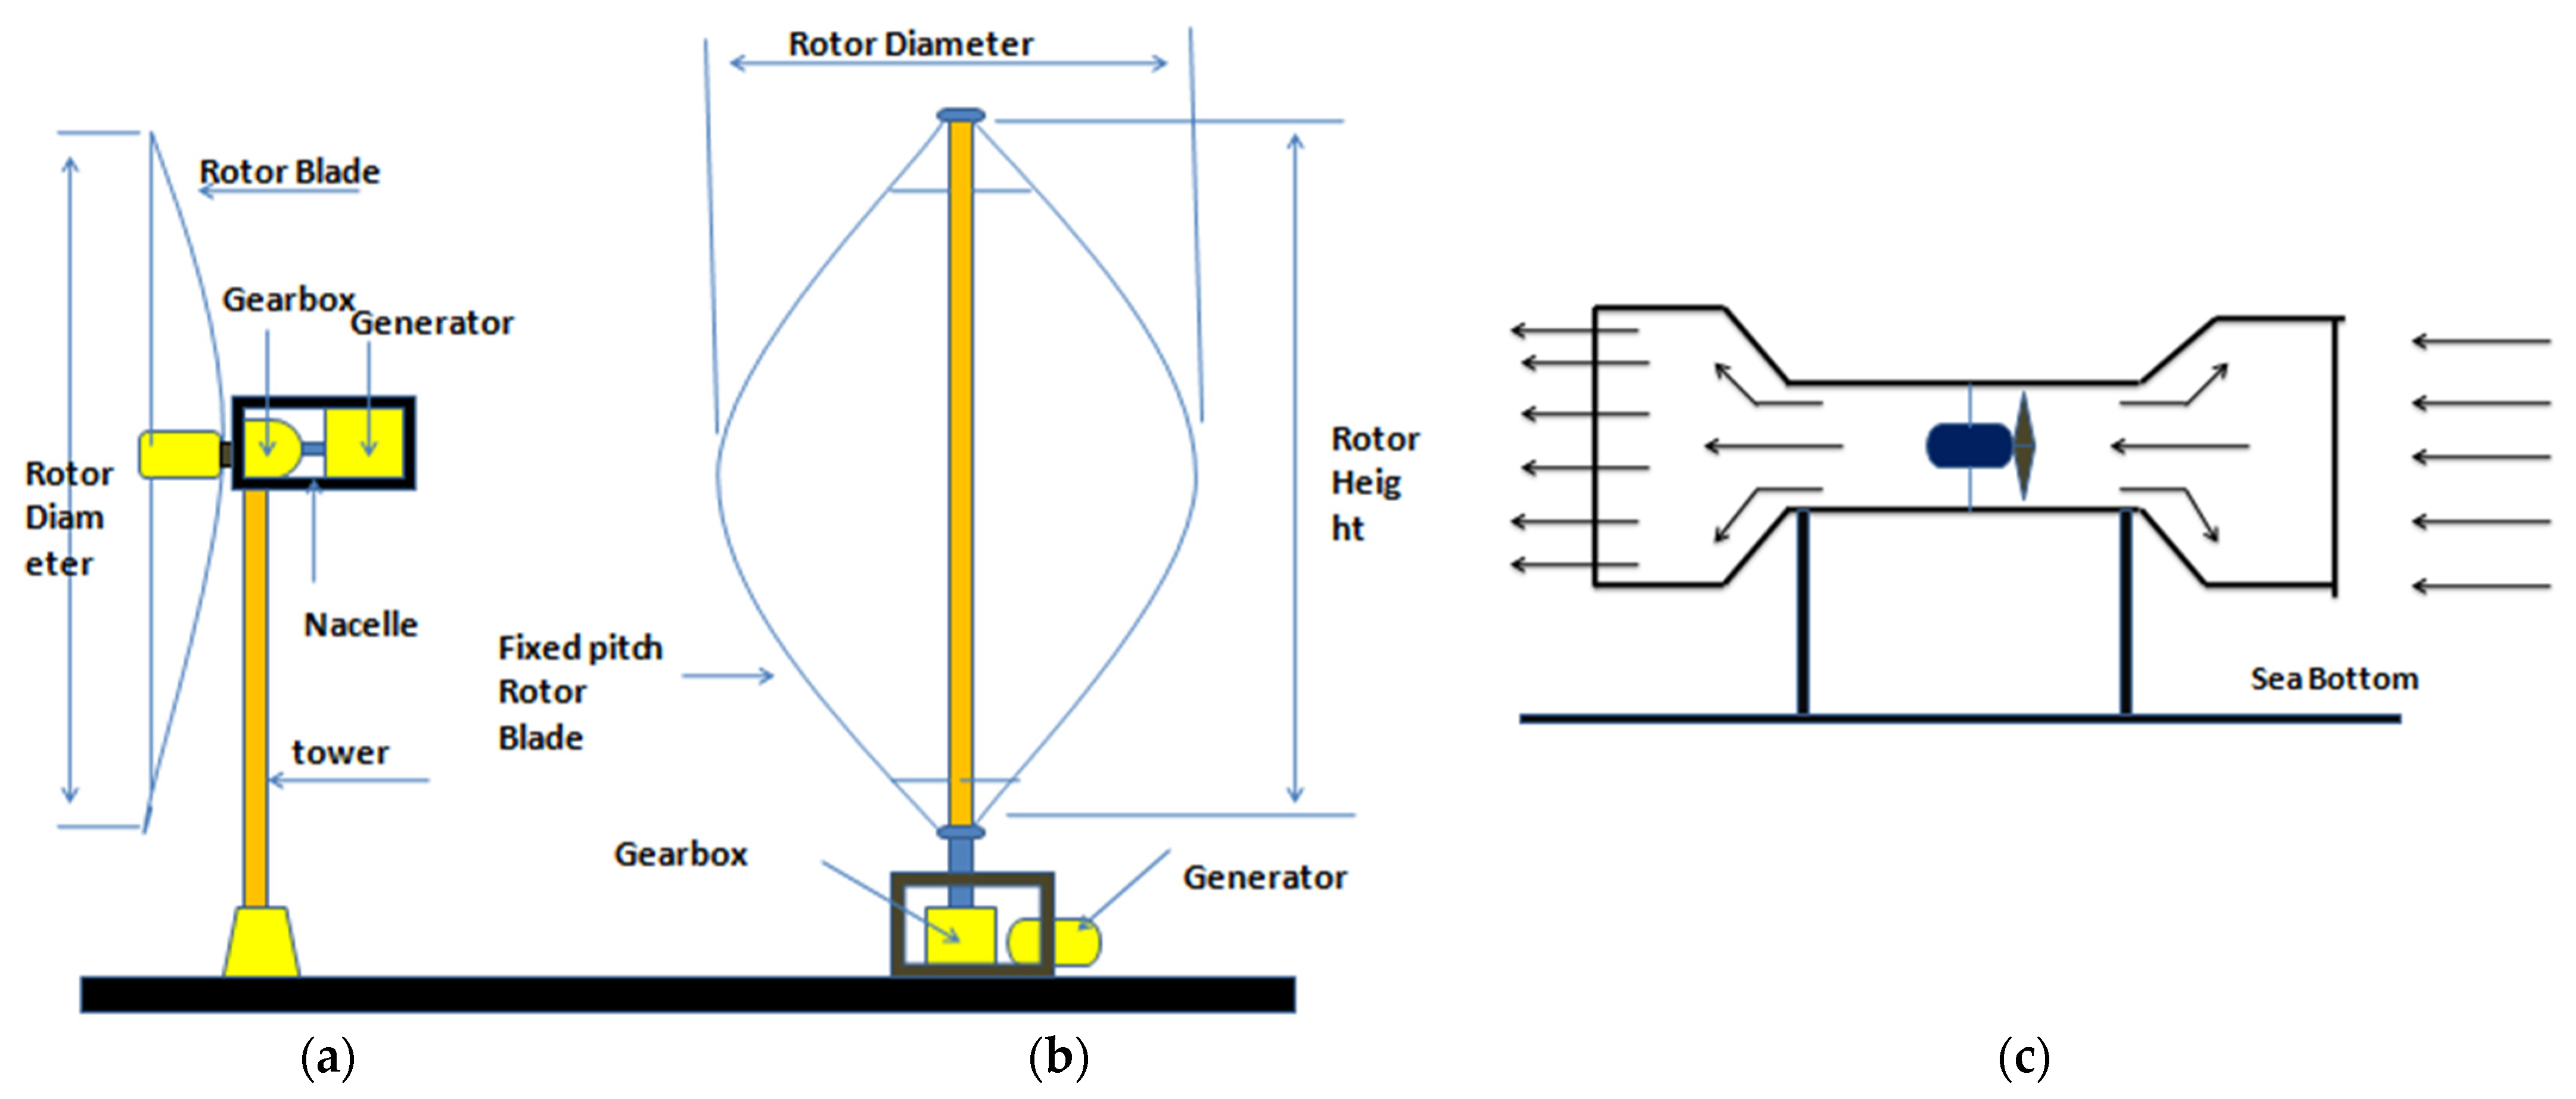
3.2. Tidal Energy Extraction Devices
3.2.1. Tidal Range Technologies
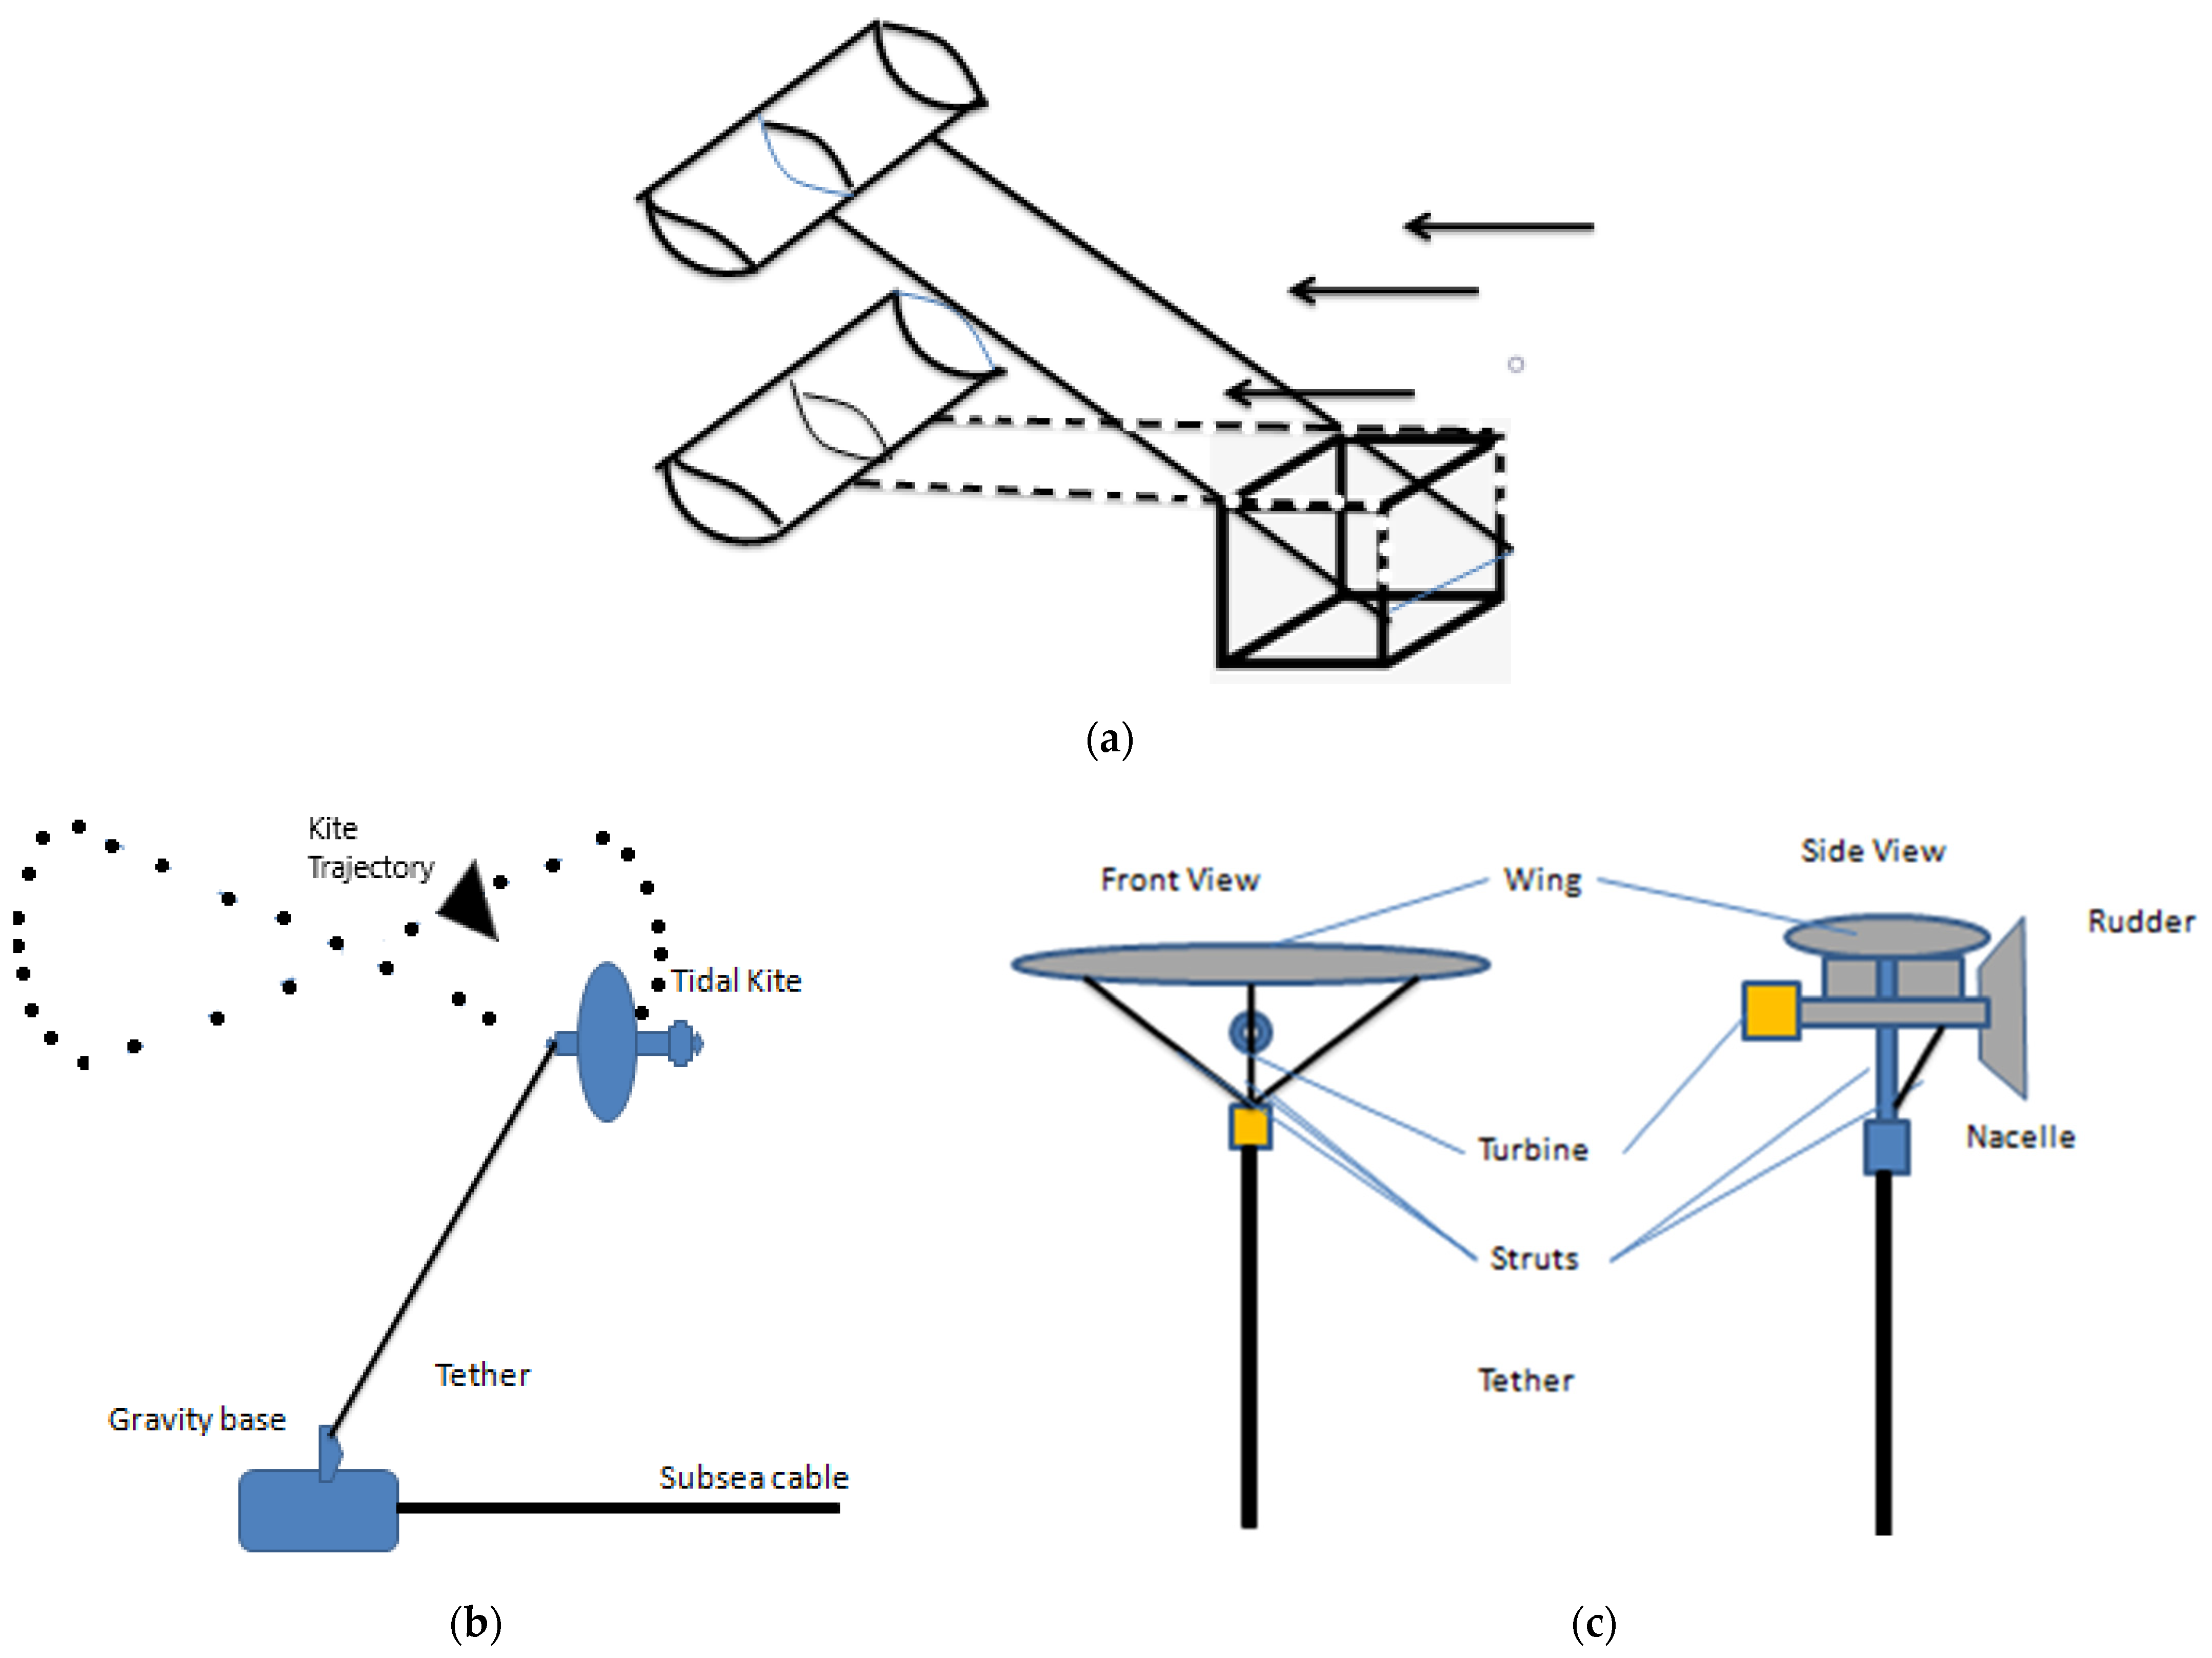
3.2.2. Tidal Current Technologies
3.3. Ocean Thermal Energy Converter (OTEC)
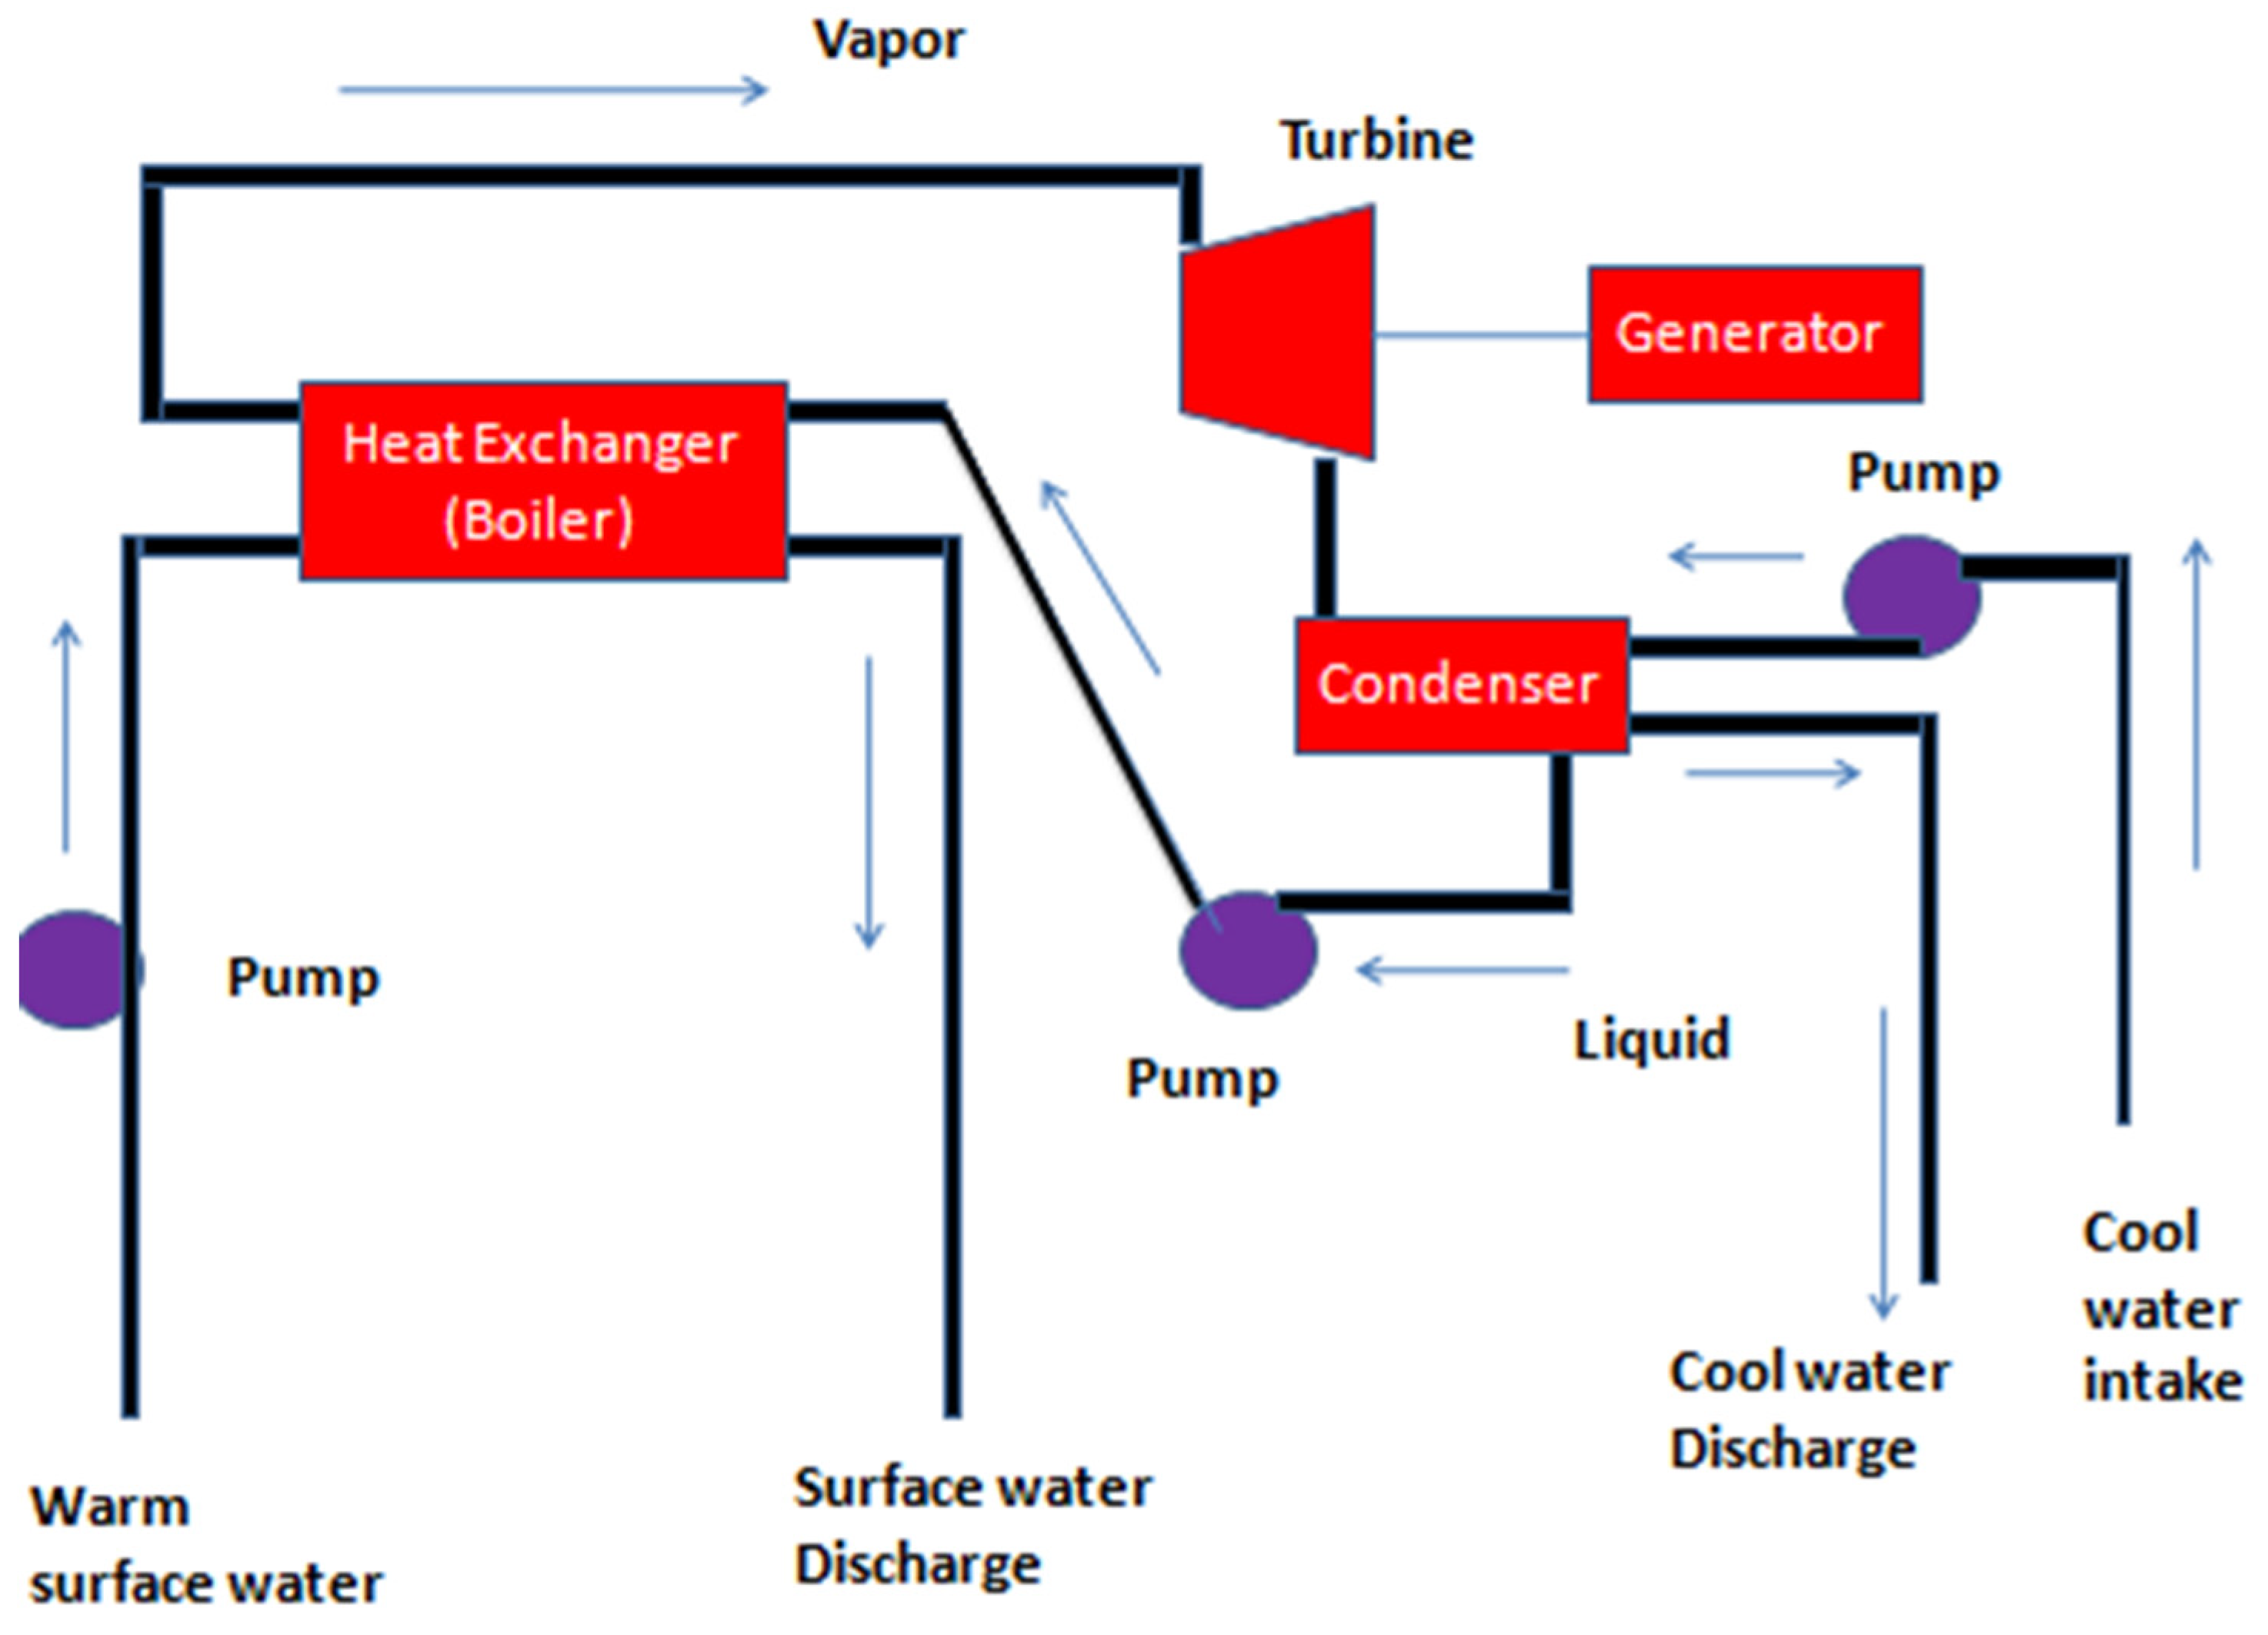
3.3.1. Closed-Cycle OTEC
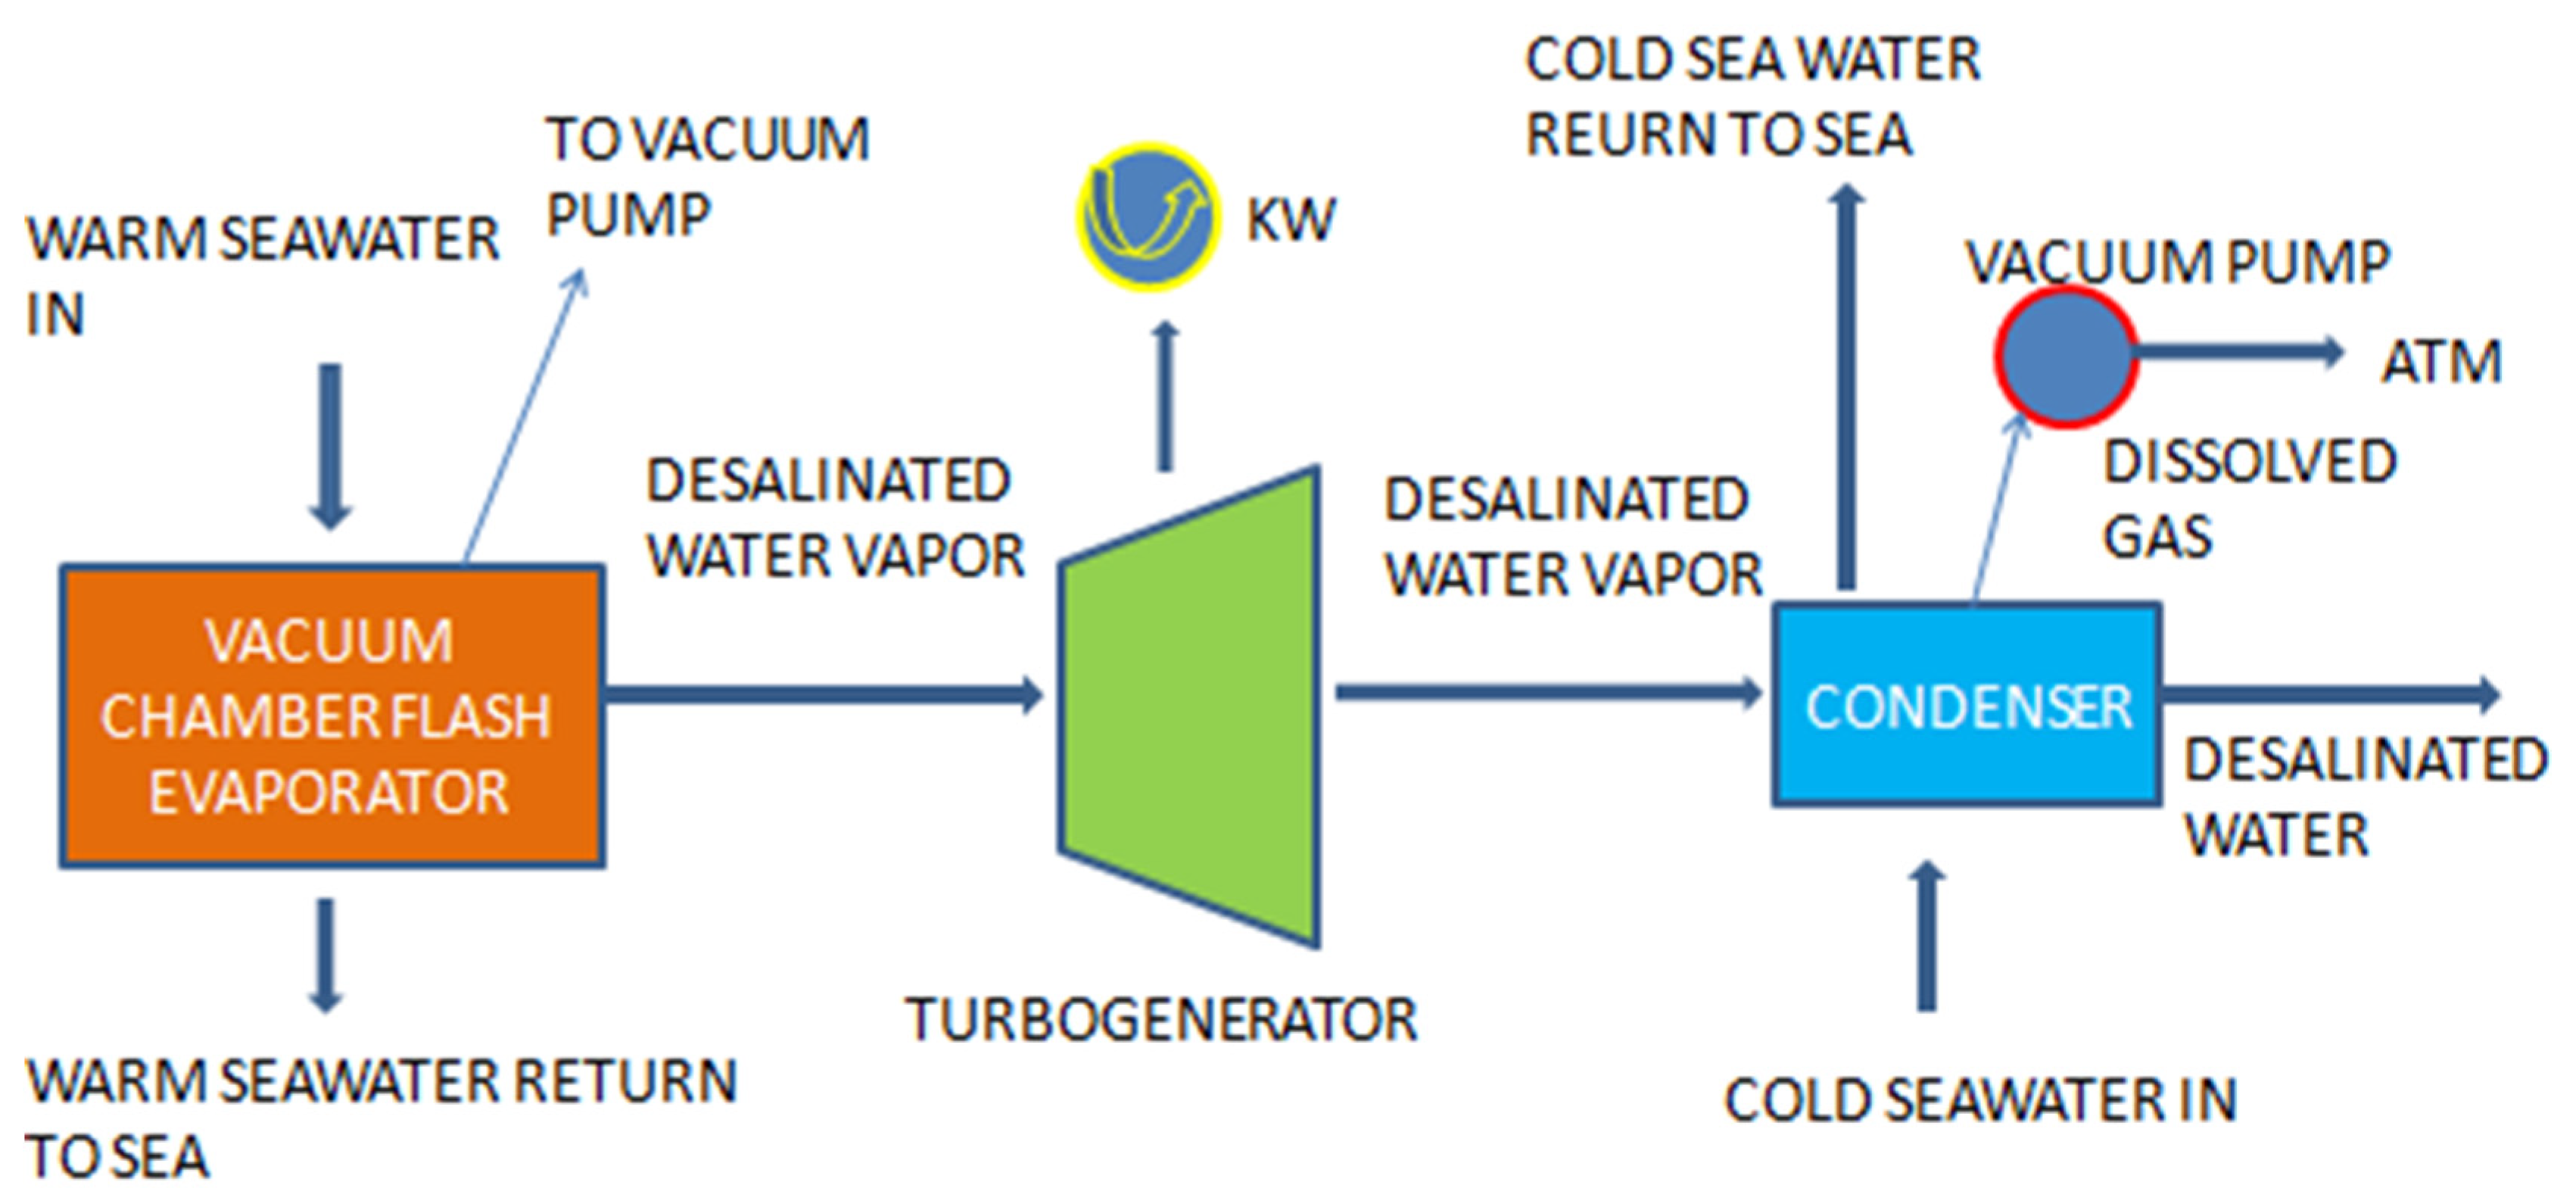
3.3.2. Open-Cycle OTEC
3.3.3. Kalina Cycle OTEC
3.3.4. Hybrid System
3.3.5. Ocean Thermoelectric Generators (OTEG)
3.4. Salinity Gradient Energy
3.4.1. Pressure Retarded Osmosis (PRO)
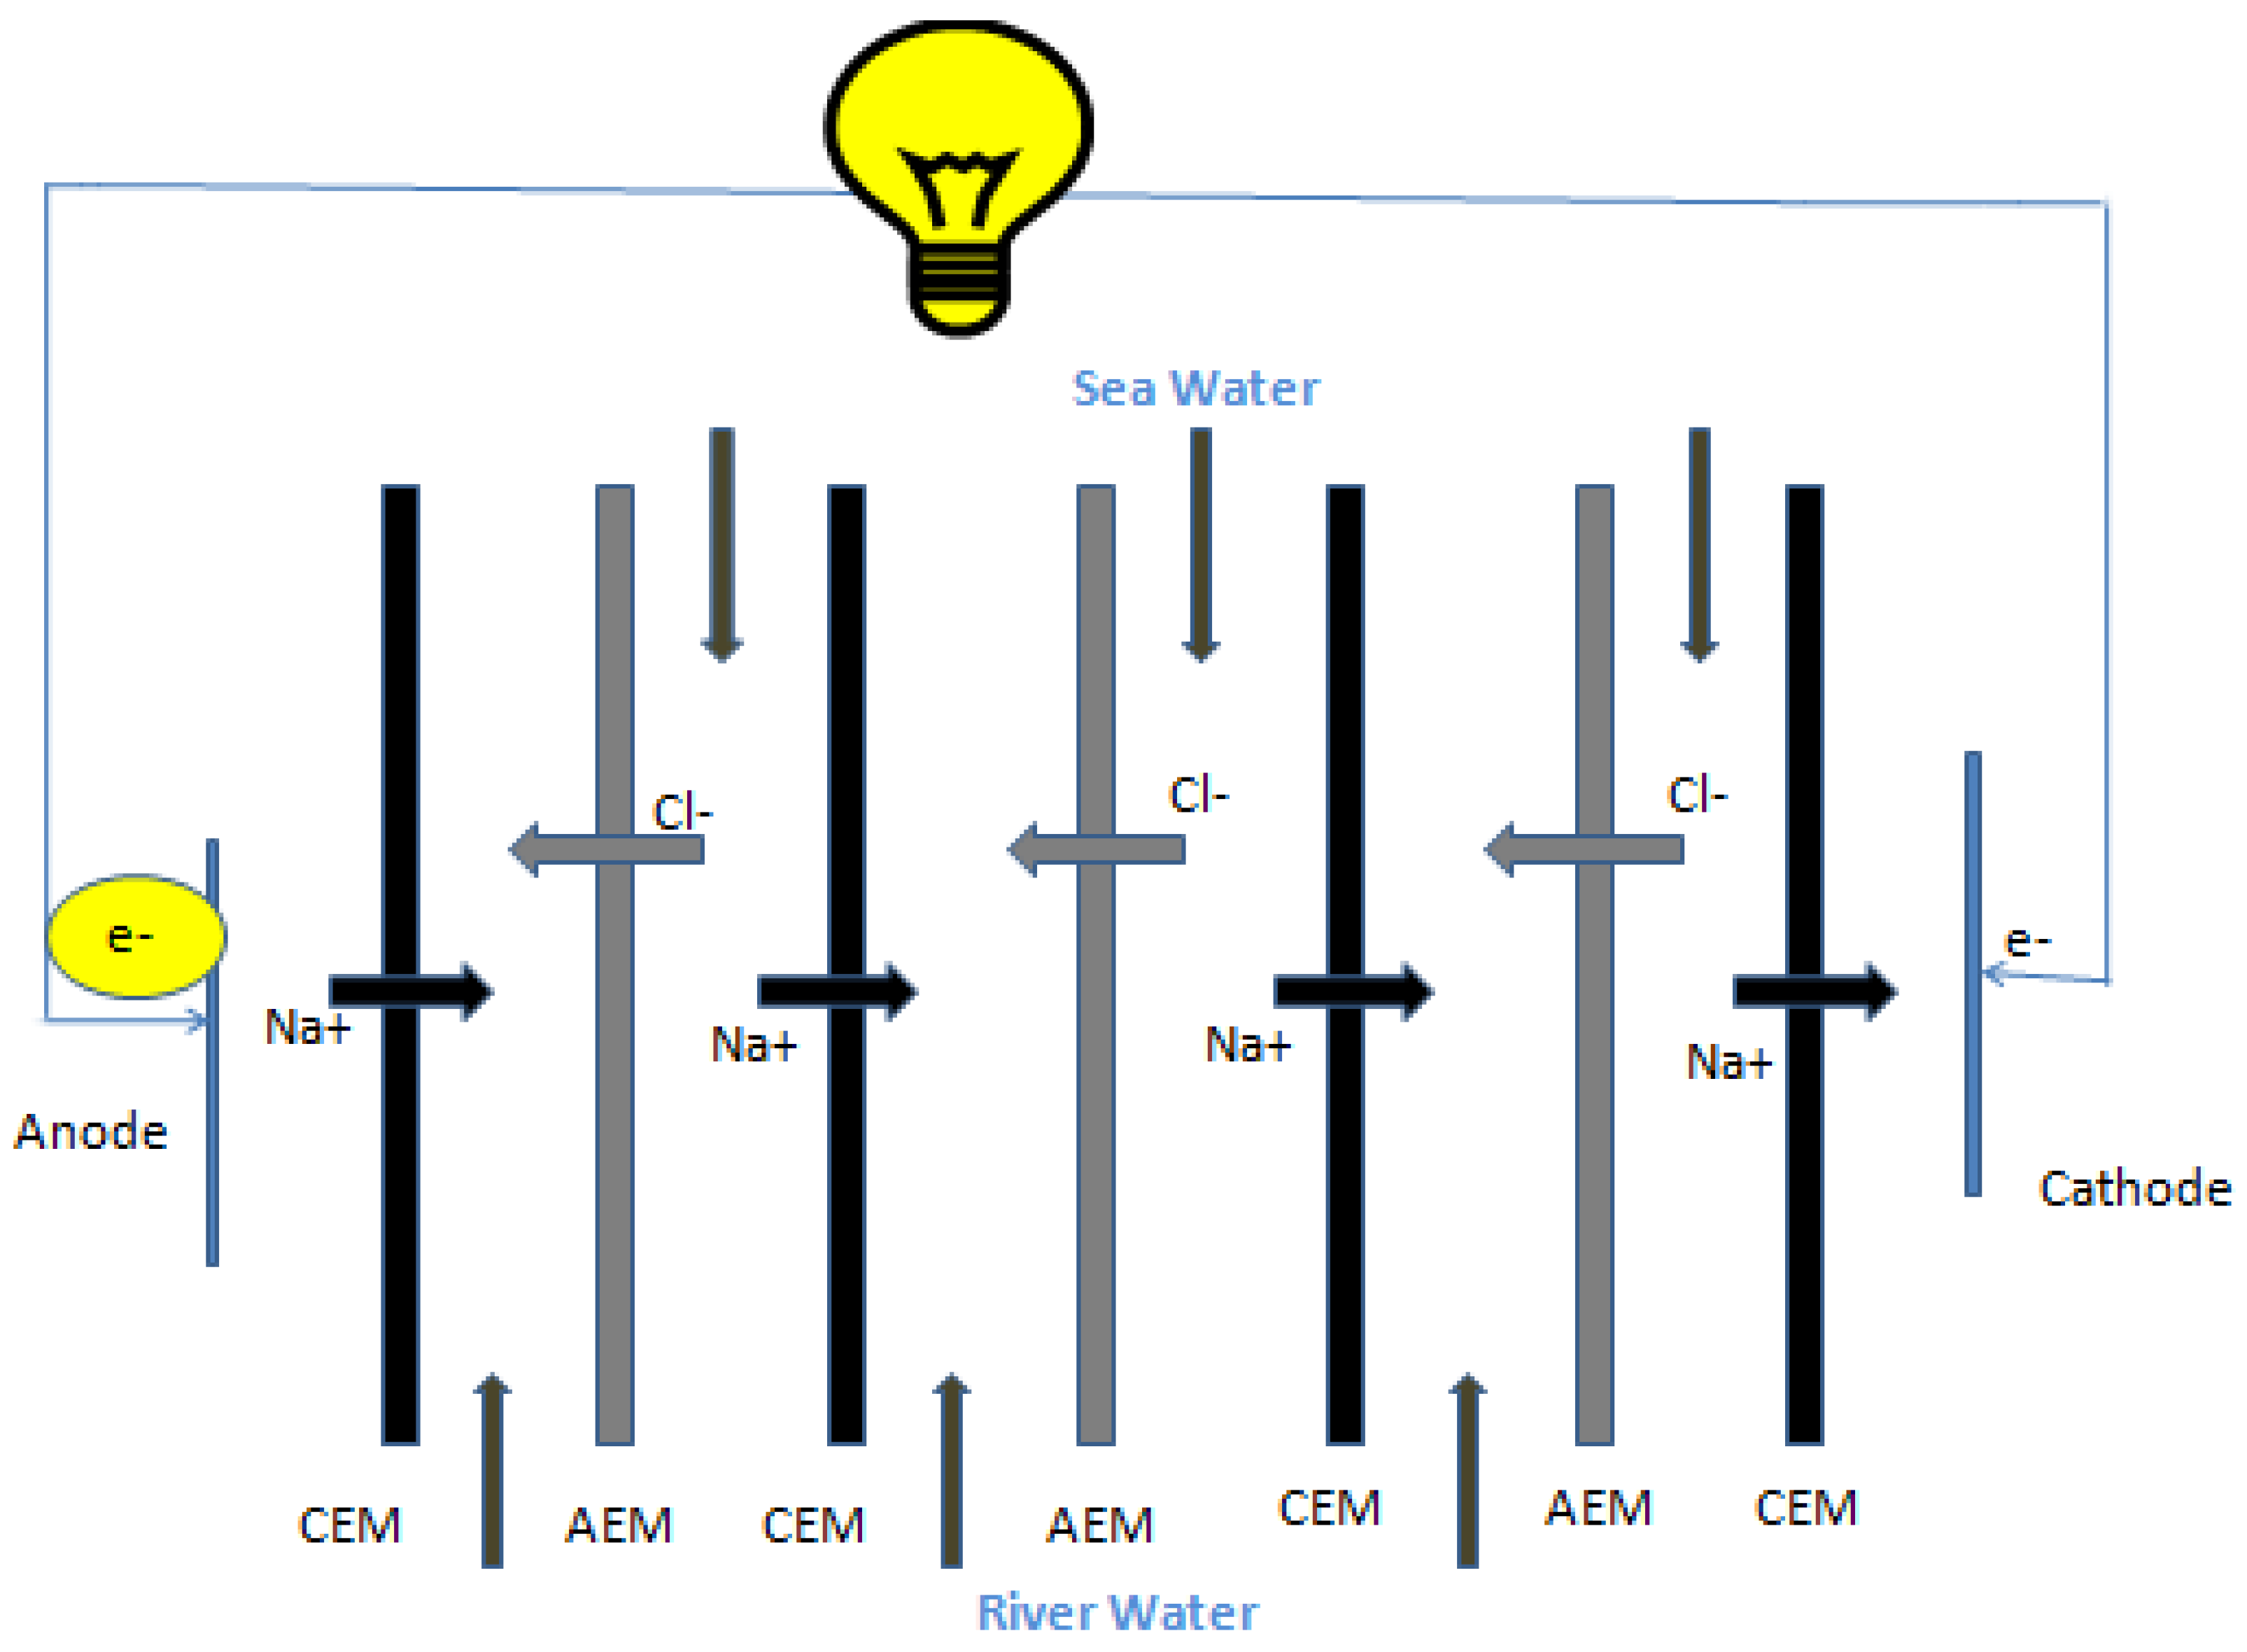
3.4.2. Reversed Electrodialysis (RED)
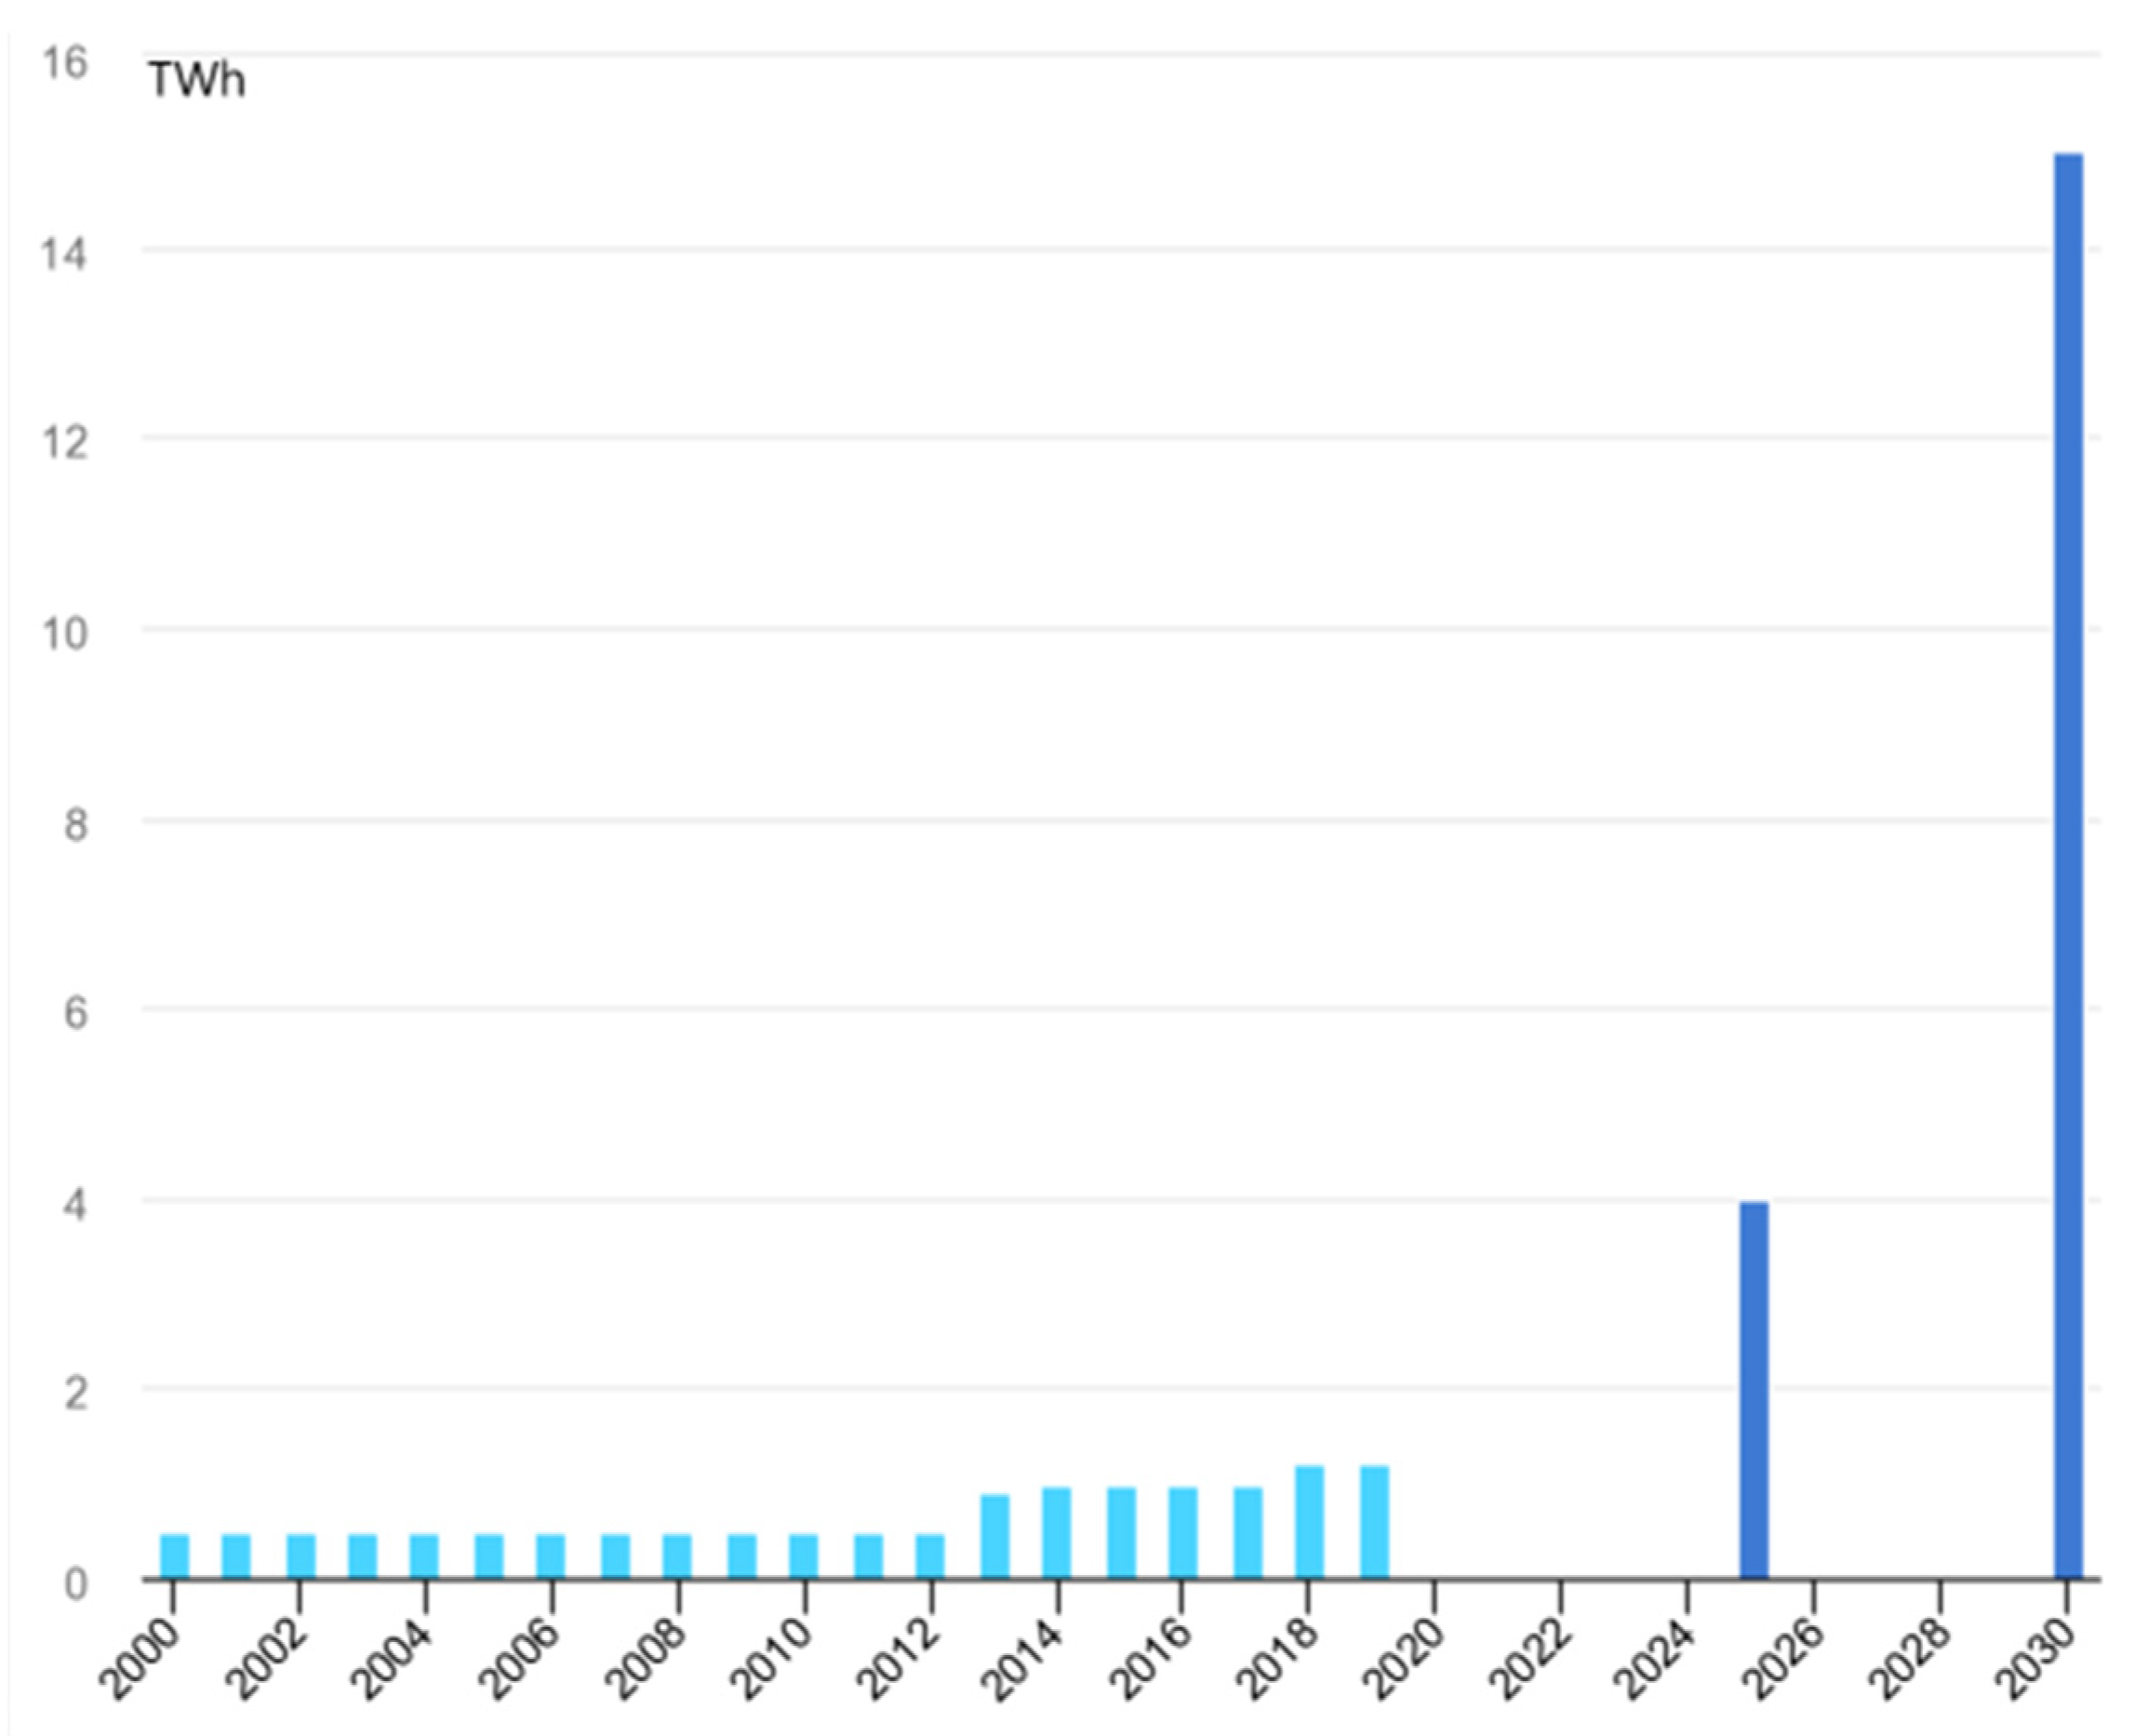
4. Current Updates on the Wave and Tidal Energy Projects
5. Environmental and Other Impacts

| Type of Impact | Description |
|---|---|
| Noise pollution | This is one of the biggest problems. However, sound travels faster in a denser medium; hence, the sound inside water is faster than that in air. As a result, marine life is highly disturbed by the amount of sound produced by these devices. |
| Collision | The animals in the sea are move frequently and wildly, and when there are barriers in the sea, collisions may occur. In addition, the visibility under the sea is worse than on land, and some marine animals have limited vision capability. This collision endangers marine life as well as possibly damages the devices. Therefore, design, operating conditions (e.g., speed and depth), materials, and location selection are essential in avoiding marine mammal collisions. |
| Electromagnetic fields (EMFs) | These are generated by subsurface wires that transport electricity to the shore. EMF is detected by various marine creatures including bony fish, sharks/rays, and marine mammals. A few sensitive species [199] are attracted to cable EMF, which can be detected up to 295 m away. There is little indication that offshore power cables have a broader influence [200] |
| Chemical effects | The expected risks connected with maritime vessel operations will be encountered during deployment, routine maintenance, and decommissioning. Spills can happen in routine operations, especially in systems that use hydraulic fluid. Continuous chemical leaching may occur if anti-fouling coatings are applied to decrease the biological fouling of devices. OTEC is involved in a one-of-a-kind circumstance that presents fresh challenges. It is possible that the working fluid in a closed system (typically ammonia, which is highly deadly to fish) could leak or spill [201]. |
| Hydrodynamics | Hydrodynamic aspects include the seabed form and type, erosion and scouring produced by current device modifications, and unique sediment transport and deposition patterns. Wave and tidal stream projects will be located in areas with high ambient energy. Therefore, there are site-specific challenges that must be addressed. Osmotic and permanent OTEC plants must be carefully sited, especially near their output pipe locations [202]. |
6. Opportunities and Challenges in Developing Ocean Energy Sources
6.1. Socio-Economic Performance
6.2. Social Influence
6.3. Design, Installation, and Operation
6.4. Grid Connection and Integration
6.5. Policy and Regulations
7. Conclusions
Author Contributions
Funding
Institutional Review Board Statement
Informed Consent Statement
Data Availability Statement
Conflicts of Interest
References
- González Moncada, V. Impact of COVID-19 on Transport and Logistics Connectivity in the Caribbean; United Nations: Santiago, Chile, 2020. [Google Scholar]
- Wen, C.; Akram, R.; Irfan, M.; Iqbal, W.; Dagar, V.; Acevedo-Duqued, Á.; Saydaliev, H.B. The asymmetric nexus between air pollution and COVID-19: Evidence from a non-linear panel autoregressive distributed lag model. Environ. Res. 2022, 209, 112848. [Google Scholar] [CrossRef] [PubMed]
- Iqbal, W.; Tang, Y.M.; Chau, K.Y.; Irfan, M.; Mohsin, M. Nexus between air pollution and NCOV-2019 in China: Application of negative binomial regression analysis. Process Saf. Environ. Prot. 2021, 150, 557–565. [Google Scholar] [CrossRef]
- Mitrova, T. Review of the “Global and Russian energy outlook up to 2040”. Energy Strateg. Rev. 2014, 2, 323–325. [Google Scholar] [CrossRef] [Green Version]
- Robb, D. Aeroderivative Gas Turbines. Available online: https://www.turbomachinerymag.com/view/aeroderivative-gas-turbines (accessed on 15 February 2021).
- Neumann, A. The Role of Gas in Europe towards 2050; NTNU: Trondheim, Norway, 2021. [Google Scholar]
- IEA. Total Final Consumption (TFC) by Source. Available online: https://www.iea.org/reports/key-world-energy-statistics-2020/final-consumption (accessed on 10 August 2020).
- Ritchie, H.; Roser, M. CO2 and other Greenhouse Gas Emissions. Available online: https://ourworldindata.org/co2-and-other-greenhouse-gas-emissions (accessed on 10 February 2021).
- British Petroleum. Statistical review of world energy 2021. Stat. Rev. World Energy 2021, 70, 66. [Google Scholar]
- British Petroleum. Energy Outlook 2020 Edition; British Petroleum: London, UK, 2020. [Google Scholar]
- Derakhshan, S.; Ashoori, M.; Salemi, A. Experimental and numerical study of a vertical axis tidal turbine performance. Ocean Eng. 2017, 137, 59–67. [Google Scholar] [CrossRef] [Green Version]
- Wahyudie, A.; Jama, M.A.; Susilo, T.B.; Saeed, O.; Nandar, C.S.A.; Harib, K. Simple bottom-up hierarchical control strategy for heaving wave energy converters. Int. J. Electr. Power Energy Syst. 2017, 87, 211–221. [Google Scholar] [CrossRef]
- de Andres, A.; Medina-Lopez, E.; Crooks, D.; Roberts, O.; Jeffrey, H. On the reversed LCOE calculation: Design constraints for wave energy commercialization. Int. J. Mar. Energy 2017, 18, 88–108. [Google Scholar] [CrossRef]
- Khan, N.; Kalair, A.; Abas, N.; Haider, A. Review of ocean tidal, wave and thermal energy technologies. Renew. Sustain. Energy Rev. 2017, 72, 590–604. [Google Scholar] [CrossRef]
- Ben Elghali, S.E.; Benbouzid, M.E.H.; Charpentier, J.F. Marine Tidal Current Electric Power Generation Technology: State of the Art and Current Status. In Proceedings of the 2007 IEEE International Electric Machines & Drives Conference, Antalya, Turkey, 3–5 May 2007; pp. 1407–1412. [Google Scholar]
- Farris, A.; Helston, C. Tidal Power. Available online: http://www.energybc.ca/tidal.html (accessed on 5 February 2022).
- SI Ocean. Ocean Energy: Cost of Energy and Cost Reduction Opportunities; European Ocean Energy: Brussels, Belgium, 2013; Available online: https://oceanenergy-sweden.se/wp-content/uploads/2018/03/130501-si-ocean-cost-of-energy-report.pdf (accessed on 5 February 2022).
- Magagna, D.; Uihlein, A. 2014 JRC Ocean Energy Status Report; Institute for Energy and Transport: Petten, The Netherlands, 2015; Available online: https://op.europa.eu/en/publication-detail/-/publication/359b9147-ab4e-4639-b9db-17a6011a255f/language-en (accessed on 5 February 2022).
- Gobato, R.; Gobato, A.; Fedrigo, D.F.G. Study Pelamis System to Capture Energy of Ocean Wave. arXiv 2015, arXiv:1508.01106. [Google Scholar]
- Onainor, E.R. Ocean Energy: Tidal and Tidal Power. Ocean Energy Tidal Tidal Power 2019, 1, 105–112. [Google Scholar]
- Schmitt, R.W. Form of the temperature-salinity relationship in the central water: Evidence for double-diffusive mixing. J. Phys. Oceanogr. 1981, 11, 1015–1026. [Google Scholar] [CrossRef] [Green Version]
- Rajagopalan, K.; Nihous, G.C. Estimates of global Ocean Thermal Energy Conversion (OTEC) resources using an ocean general circulation model. Renew. Energy 2013, 50, 532–540. [Google Scholar] [CrossRef]
- Enferad, E.; Nazarpour, D. Ocean’s Renewable Power and Review of Technologies: Case Study Waves. In New Developments in Renewable Energy; IntechOpen: London, UK, 2013; Available online: https://www.intechopen.com/chapters/42182 (accessed on 5 February 2022).
- Curto, D.; Franzitta, V.; Guercio, A. Sea Wave Energy. A Review of the Current Technologies and Perspectives. Energies 2021, 14, 6604. [Google Scholar] [CrossRef]
- International Renewable Energy Agency. Ocean Energy: Technologies, Patents, Deployment Status and Outlook; International Renewable Energy Agency (IRENA): Abu Dhabi, United Arab Emirates, 2014. [Google Scholar]
- Melikoglu, M. Current status and future of ocean energy sources: A global review. Ocean Eng. 2018, 148, 563–573. [Google Scholar] [CrossRef]
- Neill, S.P.; Hashemi, M.R.; Lewis, M.J. Tidal energy leasing and tidal phasing. Renew. Energy 2016, 85, 580–587. [Google Scholar] [CrossRef] [Green Version]
- Chen, Y.; Lin, B.; Lin, J.; Wang, S. Effects of stream turbine array configuration on tidal current energy extraction near an island. Comput. Geosci. 2015, 77, 20–28. [Google Scholar] [CrossRef]
- Waters, S.; Aggidis, G. Tidal range technologies and state of the art in review. Renew. Sustain. Energy Rev. 2016, 59, 514–529. [Google Scholar] [CrossRef] [Green Version]
- Waters, S.; Aggidis, G. A world first: Swansea Bay tidal lagoon in review. Renew. Sustain. Energy Rev. 2016, 56, 916–921. [Google Scholar] [CrossRef]
- Hammons, T.J. Tidal Power. Proc. IEEE 1993, 81, 419–433. [Google Scholar] [CrossRef]
- Sellar, B.; Harding, S.; Richmond, M. High-resolution velocimetry in energetic tidal currents using a convergent-beam acoustic Doppler profiler. Meas. Sci. Technol. 2015, 26, 085801. [Google Scholar] [CrossRef]
- Jefferson, W.T.; Elisabeth, M.D.; Driscoll, M.J.; Golay, M.W.; Peters, W.A. Sustainable Energy, 2nd ed.; MIT Press: Cambridge, UK, 2012; ISBN 9780262017473. [Google Scholar]
- Neill, S.P.; Angeloudis, A.; Robins, P.E.; Walkington, I.; Ward, S.L.; Masters, I.; Lewis, M.J.; Piano, M.; Avdis, A.; Piggott, M.D.; et al. Tidal range energy resource and optimization—Past perspectives and future challenges. Renew. Energy 2018, 127, 763–778. [Google Scholar] [CrossRef]
- Lee, K.L.; Baker, R.W.; Lonsdale, H.K. Membranes for power generation by pressure-retarded osmosis. J. Membr. Sci. 1981, 8, 141–171. [Google Scholar] [CrossRef]
- US EIA. International Energy Outlook 2013—DOE/EIA-0484(2013); US EIA: Washington, DC, USA, 2013.
- Lavidas, G.; Venugopal, V. Wave energy resource evaluation and characterisation for the Libyan Sea. Int. J. Mar. Energy 2017, 18, 1–14. [Google Scholar] [CrossRef] [Green Version]
- Kamranzad, B.; Chegini, V.; Etemad-Shahidi, A. Temporal-spatial variation of wave energy and nearshore hotspots in the Gulf of Oman based on locally generated wind waves. Renew. Energy 2016, 94, 341–352. [Google Scholar] [CrossRef] [Green Version]
- International Renewable Energy Agency. Wave Energy; International Renewable Energy Agency (IRENA): Abu Dhabi, United Arab Emirates, 2014. [Google Scholar]
- Xu, L.; Li, Z.L. Impacts of the Wave Train along the Asian Jet on the South China Sea Summer Monsoon Onset. Atmosphere 2021, 12, 1227. [Google Scholar] [CrossRef]
- Arinaga, R.A.; Cheung, K.F. Atlas of global wave energy from 10 years of reanalysis and hindcast data. Renew. Energy 2012, 39, 49–64. [Google Scholar] [CrossRef]
- Manasseh, R.; Sannasiraj, S.A.; Mcinnes, K.L.; Sundar, V.; Jalihal, P. Integration of wave energy and other marine renewable energy sources with the needs of coastal societies. Int. J. Ocean Clim. Syst. 2017, 8, 19–36. [Google Scholar] [CrossRef]
- Gunn, K.; Stock-Williams, C. Quantifying the global wave power resource. Renew. Energy 2012, 44, 296–304. [Google Scholar] [CrossRef]
- Brooke, J. Wave Energy Conversion; Bhattacharyya, R., McCormick, M.E., Eds.; Elsevier Science: Amsterdam, The Netherlands, 2003; ISBN 9780080543703. [Google Scholar]
- Pousa, J.L.; Naval, S.D.H. Wave-power potential along the coast of the province of buenos aires. Argentina 1992, 17, 997–1006. [Google Scholar]
- Hughes, M.G.; Heap, A.D. National-scale wave energy resource assessment for Australia. Renew. Energy 2010, 35, 1783–1791. [Google Scholar] [CrossRef]
- Beels, C.; De Rouck, J.; Verhaeghe, H.; Geeraerts, J.; Dumon, G. Wave energy on the Belgian continental shelf. In Proceedings of the OCEANS 2007—Europe, Aberdeen, UK, 18–21 June 2007; pp. 3–8. [Google Scholar]
- Sanchez, A.S.; Dejong, P.; Wind, E.T. Solar and waves’ energy in the Ne region of Brazil: Analysis of meteorological parameters related to the load curve of electric demand. In Proceedings of the CONEM, São Luis, Brazil, 25 July 2012. [Google Scholar]
- Cornett, A. Inventory of Canada’s Marine Renewable Energy Resources; Canadian Hydraulics Centre: Ottawa, ON, Canada, 2006. Available online: https://www.nrcan.gc.ca/sites/www.nrcan.gc.ca/files/canmetenergy/files/pubs/CHC-TR-041.pdf (accessed on 5 February 2022).
- Aquatera Ltd. Recommendations for Chile´s Marine Energy Strategy—A Roadmap for Development; Aquatera Ltd.: Stromness, UK, 2014. [Google Scholar]
- Nishimura, M. From Prototype to Market: Development of marine renewable energy policies and regional cooperation 1. In Proceedings of the PECC International Project Energy Transition and New Economic Models 2013–2014, Noumea, New Caledonia, 26–28 November 2014. [Google Scholar]
- Zhang, D.; Li, W.; Lin, Y. Wave energy in China: Current status and perspectives. Renew. Energy 2009, 34, 2089–2092. [Google Scholar] [CrossRef]
- Henfridsson, U.; Neimane, V.; Strand, K.; Kapper, R.; Bernhoff, H.; Danielsson, O.; Leijon, M.; Sundberg, J.; Thorburn, K.; Ericsson, E.; et al. Wave energy potential in the Baltic Sea and the Danish part of the North Sea, with reflections on the Skagerrak. Renew. Energy 2007, 32, 2069–2084. [Google Scholar] [CrossRef]
- Dufour, G.; Michard, B.; Cosquer, E.; Fernagu, E. EMACOP project: Assessment of wave energy resource along France’s coastlines. In Coasts, Marine Structures and Breakwaters 2013: From Sea to Shore—Meeting the Challenges of the Sea; ICE Publishing: Edinburg, UK, 2014; Volume 1, pp. 306–315. [Google Scholar]
- Pontes, M.T. Assessing the european wave energy resource. J. Offshore Mech. Arct. Eng. 1998, 120, 226–231. [Google Scholar] [CrossRef]
- Pillai, I.R.; Banerjee, R. Renewable energy in India: Status and potential. Energy 2009, 34, 970–980. [Google Scholar] [CrossRef]
- Gallagher, S.; Tiron, R.; Whelan, E.; Gleeson, E.; Dias, F.; McGrath, R. The nearshore wind and wave energy potential of Ireland: A high resolution assessment of availability and accessibility. Renew. Energy 2016, 88, 494–516. [Google Scholar] [CrossRef]
- Vicinanza, D.; Contestabile, P.; Ferrante, V. Wave energy potential in the north-west of Sardinia (Italy). Renew. Energy 2013, 50, 506–521. [Google Scholar] [CrossRef]
- Sasaki, W. Changes in wave energy resources around Japan. Geophys. Res. Lett. 2012, 39, 1–6. [Google Scholar] [CrossRef]
- Muzathik, A.M.; Nik, W.B.W.; Ibrahim, M.; Samo, K.B. Wave energy potential of peninsular Malaysia. ARPN J. Eng. Appl. Sci. 2010, 5, 11–23. [Google Scholar]
- Muzathik, A.M.; Wan Nik, W.B.; Samo, K.B.; Ibrahim, M.Z. Ocean wave measurement and wave climate prediction of Peninsular Malaysia. J. Phys. Sci. 2011, 22, 77–92. [Google Scholar]
- Chiang, E.P.; Zainal, Z.A.; Narayana, P.A.A.; Seetharamu, K.N. Potential of renewable wave and offshore wind energy sources in Malaysia. In Proceedings of the Marine Technology Seminar, Oxford, UK, 15–17 September 2003; pp. 1–7. [Google Scholar]
- Samrat, N.H.; Ahmad, N.B.; Choudhury, I.A.; Taha, Z. Prospect of wave energy in Malaysia. In Proceedings of the 2014 IEEE 8th International Power Engineering and Optimization Conference (PEOCO2014), Langkawi, Malaysia, 24–25 March 2014; pp. 127–132. [Google Scholar]
- Andersen, K.; Chapman, A.; Hareide, N.R.; Folkestad, A.O.; Sparrevik, E.; Langhamer, O. Environmental Monitoring at the Maren Wave Power Test Site off the Island of Runde, Western Norway: Planning and Design. In Proceedings of the 8th European Wave and Tidal Energy Conference, Uppsala, Sweden, 7–10 September 2009; pp. 1029–1038. [Google Scholar]
- Rusu, E.; Guedes Soares, C. Numerical modelling to estimate the spatial distribution of the wave energy in the Portuguese nearshore. Renew. Energy 2009, 34, 1501–1516. [Google Scholar] [CrossRef]
- Waters, R.; Engström, J.; Isberg, J.; Leijon, M. Wave climate off the Swedish west coast. Renew. Energy 2009, 34, 1600–1606. [Google Scholar] [CrossRef]
- Reeve, D.E.; Chen, Y.; Pan, S.; Magar, V.; Simmonds, D.J.; Zacharioudaki, A. An investigation of the impacts of climate change on wave energy generation: The Wave Hub, Cornwall, UK. Renew. Energy 2011, 36, 2404–2413. [Google Scholar] [CrossRef] [Green Version]
- Stopa, J.E.; Cheung, K.F.; Chen, Y.L. Assessment of wave energy resources in Hawaii. Renew. Energy 2011, 36, 554–567. [Google Scholar] [CrossRef]
- Beyene, A.; Wilson, J.H. Digital mapping of California wave energy resource. Int. J. Energy Res. 2007, 31, 1156–1168. [Google Scholar] [CrossRef]
- Wick, G.L.; Schmitt, W.R. Prospects for renewable energy from the sea. Mar. Technol. Soc. J. 1977, 11, 16–21. [Google Scholar]
- Defne, Z.; Haas, K.A.; Fritz, H.M. Wave power potential along the Atlantic coast of the southeastern USA. Renew. Energy 2009, 34, 2197–2205. [Google Scholar] [CrossRef]
- Masutani, S.M.; Takahashi, P.K. Ocean Thermal Energy Conversion (otec). In Encyclopedia of Ocean Sciences; Steele, J.H., Ed.; Academic Press: Oxford, UK, 2001; pp. 1993–1999. ISBN 978-0-12-227430-5. [Google Scholar]
- Wu, Z.; Feng, H.; Chen, L.; Ge, Y. Performance optimization of a condenser in ocean thermal energy conversion (OTEC) system based on constructal theory and a multi-objective genetic algorithm. Entropy 2020, 22, 641. [Google Scholar] [CrossRef]
- Yang, M.H.; Yeh, R.H. Analysis of optimization in an OTEC plant using organic Rankine cycle. Renew. Energy 2014, 68, 25–34. [Google Scholar] [CrossRef]
- Wang, M.; Jing, R.; Zhang, H.; Meng, C.; Li, N.; Zhao, Y. An innovative Organic Rankine Cycle (ORC) based Ocean Thermal Energy Conversion (OTEC) system with performance simulation and multi-objective optimization. Appl. Therm. Eng. 2018, 145, 743–754. [Google Scholar] [CrossRef]
- Yasunaga, T.; Ikegami, Y. Theoretical model construction for renewable low-grade thermal energy conversion: An insight from finite-time thermodynamics. Refrig. Sci. Technol. 2020, 2020, 446–454. [Google Scholar]
- Lee, W.Y.; Kim, S.S. The maximum power from a finite reservoir for a Lorentz cycle. Energy 1992, 17, 275–281. [Google Scholar] [CrossRef]
- Ikegami, Y.; Bejan, A. On the thermodynamic optimization of power plants with heat transfer and fluid flow irreversibilities. J. Sol. Energy Eng. Trans. ASME 1998, 120, 139–144. [Google Scholar] [CrossRef]
- Yasunaga, T.; Fontaine, K.; Ikegami, Y. Performance Evaluation Concept for Ocean Thermal Energy Conversion toward Standardization and Intelligent Design. Energies 2021, 14, 2336. [Google Scholar] [CrossRef]
- Lennard, D.E. Ocean thermal energy conversion—A base load renewable energy system. In Proceedings of the Institution of Chemical Engineers Symposium Series; Elsevier: Amsterdam, The Netherlands, 1982; pp. T6-15–T6-25. [Google Scholar]
- Asian Development Bank. Wave Energy Conversion and Ocean Thermal Energy Conversion Potential in Developing Member Countries; Asian Development Bank: Mandaluyong City, Philippines, 2014; ISBN 9789292545307. Available online: https://www.adb.org/publications/wave-energy-conversion-and-ocean-thermal-energy-conversion-potential-developing-member (accessed on 5 February 2022).
- Kempener, R.; Neumann, F. Tidal Energy Technology Brief; International Renewable Energy Agency (IRENA): Abu Dhabi, United Arab Emirates, 2014; Available online: https://www.irena.org/-/media/Files/IRENA/Agency/Publication/2014/Tidal_Energy_V4_WEB.pdf (accessed on 5 February 2022).
- Falcão, A.F.d.O. Wave energy utilization: A review of the technologies. Renew. Sustain. Energy Rev. 2010, 14, 899–918. [Google Scholar] [CrossRef]
- Alvarez-Silva, O.A.; Osorio, A.F.; Winter, C. Practical global salinity gradient energy potential. Renew. Sustain. Energy Rev. 2016, 60, 1387–1395. [Google Scholar] [CrossRef]
- Hagerman, G. Wave Power. In Encyclopedia of Energy Technology and the Environment; Bisio, A., Boots, S.G., Eds.; John Wiley & Sons: New York, NY, USA, 1995. [Google Scholar]
- Lemonis, G. Wave and Tidal Energy Conversion. In Encyclopedia of Energy; Cleveland, C.J., Ed.; Elsevier: New York, NY, USA, 2004; pp. 385–396. ISBN 978-0-12-176480-7. [Google Scholar]
- Xie, J.; Zuo, L. Dynamics and control of ocean wave energy converters. Int. J. Dyn. Control 2013, 1, 262–276. [Google Scholar] [CrossRef] [Green Version]
- Alamian, R.; Shafaghat, R.; Miri, S.J.; Yazdanshenas, N.; Shakeri, M. Evaluation of technologies for harvesting wave energy in Caspian Sea. Renew. Sustain. Energy Rev. 2014, 32, 468–476. [Google Scholar] [CrossRef]
- Liu, C. A tunable resonant oscillating water column wave energy converter. Ocean Eng. 2016, 116, 82–89. [Google Scholar] [CrossRef]
- Doyle, S.; Aggidis, G.A. Development of multi-oscillating water columns as wave energy converters. Renew. Sustain. Energy Rev. 2019, 107, 75–86. [Google Scholar] [CrossRef] [Green Version]
- Ocean Energy Systems. OES Annual Report 2021; Ocean Energy Systems: Lisbon, Portugal, 2022; Available online: https://www.ocean-energy-systems.org/publications/oes-annual-reports/document/oes-annual-report-2021/ (accessed on 10 March 2022).
- Ocean Energy. What Is the OE Buoy? Available online: https://oceanenergy.ie/oe-buoy/ (accessed on 1 April 2022).
- António, A.F. Modelling and control of oscillating-body wave energy converters with hydraulic power take-off and gas accumulator. Ocean Eng. 2007, 34, 2021–2032. [Google Scholar]
- Ocean Power Technologies Energizing Ocean Intelligence. Available online: https://oceanpowertechnologies.com/ (accessed on 1 April 2022).
- Jin, S.; Greaves, D. Wave energy in the UK: Status review and future perspectives. Renew. Sustain. Energy Rev. 2021, 143, 110932. [Google Scholar] [CrossRef]
- Atmocean Atmocean. Available online: https://atmocean.com/ (accessed on 1 April 2022).
- Seabased Seabased. Available online: https://seabased.com/ (accessed on 1 April 2022).
- Seatricity Seatricity. Available online: http://seatricity.com/ (accessed on 1 April 2022).
- Wave Rolle. Available online: https://aw-energy.com/waveroller/ (accessed on 1 April 2022).
- CCell Sea Powered Protection. Available online: https://ccell.co.uk/ (accessed on 1 April 2022).
- SeaPower Wave Energy. Available online: http://www.seapower.ie/wave-energy/ (accessed on 1 April 2022).
- Golbaz, D.; Asadi, R.; Amini, E.; Mehdipour, H.; Nasiri, M.; Nezhad, M.M.; Naeeni, S.T.; Neshat, M. Ocean Wave Energy Converters Optimization: A Comprehensive Review on Research Directions. arXiv 2021, arXiv:2105.07180. [Google Scholar]
- Yusop, Z.M.; Ibrahim, M.Z.; Jusoh, M.A.; Albani, A.; Economics, E. Wave-Activated Body Energy Converter Technologies: A Review Journal of Advanced Research in Fluid Wave-Activated Body Energy Converter Technologies: A Review. J. Adv. Res. Fluid Mech. Therm. Sci. 2020, 76, 76–104. [Google Scholar] [CrossRef]
- Wang, L.; Ringwood, J. V Geometric Optimization of a Hinge-Barge Wave Energy Converter. 2019. Available online: http://mural.maynoothuniversity.ie/14284/1/JR_geometric.pdf (accessed on 1 April 2022).
- Kofoed, J.P.; Frigaard, P. Hydraulic Evaluation of the LEANCON Wave Energy Converter; Department of Civil Engineering, Aalborg University: Aalborg, Denmark, 2008. [Google Scholar]
- Zanuttigh, B.; Angelelli, E.; Kofoed, J.P. Effects of mooring systems on the performance of a wave activated body energy converter. Renew. Energy 2013, 57, 422–431. [Google Scholar] [CrossRef]
- Ruol, P.; Zanuttigh, B.; Martinelli, L.; Kofoed, P.; Frigaard, P. Near-shore floating wave energy converters: Applications for coastal protection. Coast. Eng. Proc. 2011, 1, 61. [Google Scholar] [CrossRef] [Green Version]
- Martinelli, L.; Zanuttigh, B.; Kofoed, J.P. Selection of design power of wave energy converters based on wave basin experiments. Renew. Energy 2011, 36, 3124–3132. [Google Scholar] [CrossRef]
- Mustapa, M.A.; Yaakob, O.B.; Ahmed, Y.M.; Rheem, C.; Koh, K.K. Wave energy device and breakwater integration: A review. Renew. Sustain. Energy Rev. 2017, 77, 43–58. [Google Scholar] [CrossRef]
- Prado, M.; Polinder, H. Case study of the Archimedes Wave Swing (AWS) direct drive wave energy pilot plant. In Electrical Drives for Direct Drive Renewable Energy Systems; Elsevier: Amsterdam, The Netherlands, 2013; pp. 195–218. ISBN 9781845697839. [Google Scholar]
- OPT Ocean Power Technologies PB3 POWERBUOY®. Available online: https://oceanpowertechnologies.com/pb3-powerbuoy/ (accessed on 13 December 2021).
- Draper, M. More than just a ripple. Refocus 2006, 7, 54–56. [Google Scholar] [CrossRef]
- El Tawil, T.; Charpentier, J.F.; Benbouzid, M. Tidal energy site characterization for marine turbine optimal installation: Case of the Ouessant Island in France. Int. J. Mar. Energy 2017, 18, 57–64. [Google Scholar] [CrossRef]
- Soleimani, K.; Ketabdari, M.J.; Khorasani, F. Feasibility study on tidal and wave energy conversion in Iranian seas. Sustain. Energy Technol. Assess. 2015, 11, 77–86. [Google Scholar] [CrossRef]
- Rosli, R.; Dimla, E. A review of tidal current energy resource assessment: Current status and trend. In Proceedings of the 5th International Conference on Renewable Energy: Generation and Application, ICREGA 2018, Al Ain, United Arab Emirates, 25–28 February 2018; Volume 2018, pp. 34–40. [Google Scholar]
- Alvarez, E.A.; Rico-Secades, M.; Suárez, D.F.; Gutiérrez-Trashorras, A.J.; Fernández-Francos, J. Obtaining energy from tidal microturbines: A practical example in the Nalón River. Appl. Energy 2016, 183, 100–112. [Google Scholar] [CrossRef]
- Kadiri, M.; Ahmadian, R.; Bockelmann-Evans, B.; Falconer, R.A.; Kay, D. An assessment of the impacts of a tidal renewable energy scheme on the eutrophication potential of the Severn Estuary, UK. Comput. Geosci. 2014, 71, 3–10. [Google Scholar] [CrossRef]
- Kedar, O.P.; Fodase, G. A Review on Under Water Windmill. Int. Res. J. Eng. Technol. 2008, 9001, 2588. [Google Scholar]
- Borthwick, A.G.L. Marine Renewable Energy Seascape. Engineering 2016, 2, 69–78. [Google Scholar] [CrossRef] [Green Version]
- Xia, J.; Falconer, R.A.; Lin, B.; Tan, G. Estimation of annual energy output from a tidal barrage using two different methods. Appl. Energy 2012, 93, 327–336. [Google Scholar] [CrossRef]
- Wang, Z.J.; Wang, Z.W. A review on tidal power utilization and operation optimization. IOP Conf. Ser. Earth Environ. Sci. 2019, 240, 052015. [Google Scholar] [CrossRef]
- Jhun, J.G.; Lee, E.J. A new East Asian winter monsoon index and associated characteristics of the winter monsoon. J. Clim. 2004, 17, 711–726. [Google Scholar] [CrossRef]
- Priegue, L.; Stoesser, T. The influence of blade roughness on the performance of a vertical axis tidal turbine. Int. J. Mar. Energy 2017, 17, 136–146. [Google Scholar] [CrossRef]
- O’Doherty, T.; O’Doherty, D.M.; Mason-Jones, A. Tidal energy technology. Wave Tidal Energy 2017, 105–150. Available online: https://onlinelibrary.wiley.com/doi/abs/10.1002/9781119014492.ch4 (accessed on 1 April 2022).
- Sheng, Q.; Jing, F.; Zhang, L.; Zhou, N.; Wang, S.; Zhang, Z. Study of the hydrodynamic derivatives of vertical-axis tidal current turbines in surge motion. Renew. Energy 2016, 96, 366–376. [Google Scholar] [CrossRef]
- Lago, L.I.; Ponta, F.L.; Chen, L. Advances and trends in hydrokinetic turbine systems. Energy Sustain. Dev. 2010, 14, 287–296. [Google Scholar] [CrossRef]
- Roberts, A.; Thomas, B.; Sewell, P.; Khan, Z.; Balmain, S.; Gillman, J. Current tidal power technologies and their suitability for applications in coastal and marine areas. J. Ocean Eng. Mar. Energy 2016, 2, 227–245. [Google Scholar] [CrossRef] [Green Version]
- Minesto. The Future of Renewable Energy. Available online: https://minesto.com/our-technology (accessed on 13 December 2021).
- Liu, J.; Lin, H.; Purimitla, S.R.; E.T., M.D. The effects of blade twist and nacelle shape on the performance of horizontal axis tidal current turbines. Appl. Ocean Res. 2017, 64, 58–69. [Google Scholar] [CrossRef]
- Pacheco, A.; Ferreira, Ó. Hydrodynamic changes imposed by tidal energy converters on extracting energy on a real case scenario. Appl. Energy 2016, 180, 369–385. [Google Scholar] [CrossRef] [Green Version]
- Seo, J.; Lee, S.-J.; Choi, W.-S.; Park, S.T.; Rhee, S.H. Experimental study on kinetic energy conversion of horizontal axis tidal stream turbine. Renew. Energy 2016, 97, 784–797. [Google Scholar] [CrossRef]
- T., M.P.; Chatterjee, D. Computational analysis of flow over a cascade of S-shaped hydrofoil of fully reversible pump-turbine used in extracting tidal energy. Renew. Energy 2015, 77, 240–249. [Google Scholar] [CrossRef]
- Takahashi, P.; Masutani, S.; Sumida, K. The Blue Revolution: The Key to Hydrogen from OTEC. J. Hydrog. Energy Syst. 2003, 28, 20–28. [Google Scholar]
- Etemadi, A.; Emdadi, A.; Asef Afshar, O.; Emami, Y. Electricity generation by the Ocean Thermal Energy. Energy Procedia 2011, 12, 936–943. [Google Scholar] [CrossRef] [Green Version]
- Sandvik, A.B. Ocean Thermal Energy Conversion (OTEC). Available online: https://www.materials.sandvik/en/applications/renewable-energy/ocean-and-marine-energy/otec/ (accessed on 13 December 2021).
- Hamedi, A.-S.; Sadeghzadeh, S. Conceptual design of a 5 MW OTEC power plant in the Oman Sea. J. Mar. Eng. Technol. 2017, 16, 94–102. [Google Scholar] [CrossRef]
- Kim, A.S.; Kim, H.J. Ocean Thermal Energy Conversion (OTEC)—Past, Present, and Progress; IntechOpen: London, UK, 2020. [Google Scholar]
- Sahu, P.K.; Nanda, C.P. Indian Ocean Thermal Energy. Int. J. Eng. Res. Technol. 2013, 2, 1281–1289. [Google Scholar]
- Trimble, L.C.; Naef, F.E. Ocean thermal energy conversion. In Proceedings of the Annual Offshore Technology Conference, Houston, TX, USA, 5–8 May 1975; pp. 155–162. [Google Scholar]
- Charlier, R.G.; Justus, J.R. Ocean Energies: Environmental, Economic and Technological Aspects of Alternative Power Sources; Elsevier: Amsterdam, The Netherlands, 1993; ISBN 0444882480. [Google Scholar]
- Vega, L.A. Ocean thermal energy conversion. In Encyclopedia of Sustainability Science and Technology; Springer: New York, NY, USA, 2012; pp. 7296–7328. [Google Scholar] [CrossRef]
- Snyder, G.J.; Toberer, E.S. Complex thermoelectric materials. In Materials for Sustainable Energy: A Collection of Peer-Reviewed Research and Review Articles from Nature Publishing Group; Nature Publishing Group: London, UK, 2010; Volume 7, pp. 101–110. ISBN 9789814317665. [Google Scholar]
- Poudel, B.; Hao, Q.; Ma, Y.; Lan, Y.; Minnich, A.; Yu, B.; Yan, X.; Wang, D.; Muto, A.; Vashaee, D.; et al. High-thermoelectric performance of nanostructured bismuth antimony telluride bulk alloys. Science 2008, 320, 634–638. [Google Scholar] [CrossRef] [Green Version]
- Altaee, A. Sharif; Pressure retarded osmosis: Advancement in the process applications for power generation and desalination. Desalination 2015, 356, 31–46. [Google Scholar] [CrossRef]
- Post, J.W.; Veerman, J.; Hamelers, H.V.M.; Euverink, G.J.W.; Metz, S.J.; Nymeijer, K.; Buisman, C.J.N. Salinity-gradient power: Evaluation of pressure-retarded osmosis and reverse electrodialysis. J. Membr. Sci. 2007, 288, 218–230. [Google Scholar] [CrossRef] [Green Version]
- Schaetzle, O.; Buisman, C.J.N. Salinity Gradient Energy: Current State and New Trends. Engineering 2015, 1, 164–166. [Google Scholar] [CrossRef] [Green Version]
- Loeb, S.; Van Hessen, F.; Shahaf, D. Production of energy from concentrated brines by pressure-retarded osmosis. II. Experimental results and projected energy costs. J. Membr. Sci. 1976, 1, 49–63. [Google Scholar]
- Loeb, S.; Hessen, F.V.A.N.; Shahaf, D. Results and Projected Energy Costs. J. Membr. Sci. 1976, 1, 249–269. [Google Scholar] [CrossRef]
- Mehta, G.D.; Loeb, S. Internal polarization in the porous substructure of a semipermeable membrane under pressure-retarded osmosis. J. Membr. Sci. 1978, 4, 261–265. [Google Scholar] [CrossRef]
- Loeb, S. Energy production at the Dead Sea by pressure-retarded osmosis: Challenge or chimera? Desalination 1998, 120, 247–262. [Google Scholar] [CrossRef]
- Loeb, S.; Titelman, L.; Korngold, E.; Freiman, J. Effect of porous support fabric on osmosis through a Loeb-Sourirajan type asymmetric membrane. J. Membr. Sci. 1997, 129, 243–249. [Google Scholar] [CrossRef]
- Loeb, S. Large-scale power production by pressure-retarded osmosis, using river water and sea water passing through spiral modules. Desalination 2002, 143, 115–122. [Google Scholar] [CrossRef]
- Mehta, G.D.; Loeb, S. Performance of permasep B-9 and B-10 membranes in various osmotic regions and at high osmotic pressures. J. Membr. Sci. 1978, 4, 335–349. [Google Scholar] [CrossRef]
- Mehta, G.D. Further results on the performance of present-day osmotic membranes in various osmotic regions. J. Membr. Sci. 1982, 10, 3–19. [Google Scholar] [CrossRef]
- Nijmeijer, K.; Metz, S. Chapter 5 Salinity Gradient Energy. Sustain. Sci. Eng. 2010, 2, 95–139. [Google Scholar]
- Długołecki, P.; Nymeijer, K.; Metz, S.; Wessling, M. Current status of ion exchange membranes for power generation from salinity gradients. J. Membr. Sci. 2008, 319, 214–222. [Google Scholar] [CrossRef]
- Tollefson, J. Power from the oceans: Blue energy. Nature 2014, 508, 302–304. [Google Scholar] [CrossRef] [Green Version]
- Bloomberg New Energy Finance. Tidal Stream and Wave Power—A Lot Still to Prove; Bloomberg New Energy Finance: New York, NY, USA, 2014. [Google Scholar]
- Shankleman, J. Marine Power Industry Ready to Ride in Giant Sea Simulator. Available online: https://www.businessgreen.com/news/2348602/marine-power-industry-ready-to-ride-in-giant-sea-simulator (accessed on 13 December 2021).
- Renewableenergyfocus.com. Pelamis Wave Power Limited to Be Put into Administration. Available online: http://www.renewableenergyfocus.com/view/40731/pelamis-wave-power-limited-to-be-put-into-administration/ (accessed on 13 December 2021).
- SIMEC. Atlantis Energy Tidal Stream Project MeyGen. Available online: https://simecatlantis.com/projects/meygen/ (accessed on 13 December 2021).
- Power Technology. Going Deep to Harness Wave Power: Carnegie’s CETO Systems. Available online: https://www.power-technology.com/features/featuregoing-deep-to-harness-wave-power-carnegies-ceto-systems-4855445/ (accessed on 13 December 2021).
- Fortum.se Installationen av Världens Största Vågkraftspark Påbörjades Idag Utanför Sotenäs. Available online: https://news.cision.com/se/fortum-sverige/r/fortum-och-seabased--installationen-av-varldens-storsta-vagkraftspark-paborjades-idag-utanfor-sotena,c9610818 (accessed on 15 October 2021).
- European Commission. Commission Implementing Decision of 11 December 2013 Confirming Measures Proposed by the United Kingdom for the Protection of Marine Ecosystems in the Areas of Conservation Haisborough Hammond & Winterton; Start Point to Plymouth Sound & Eddystone, and La; European Commission: Brussels, Belgium, 2014; pp. 1–5. [Google Scholar]
- Cebr. The Economic Case for a Tidal Lagoon Industry in the UK; Centre for Economics and Business Research: London, UK, 2014; Available online: https://www.tidallagoonpower.com/wp-content/uploads/2016/08/The-Economic-Case-for-a-Tidal-Lagoon-Industry-in-the-UK_final.pdf (accessed on 5 February 2022).
- MacGillivray, A.; Jeffrey, H.; Hanmer, C.; Magagna, D.; Raventos, A.; Badcock-Broe, A. Ocean Energy Technology: Gaps and Barriers; European Ocean Energy: Brussels, Belgium, 2013; pp. 1–64. Available online: https://www.marineenergywales.co.uk/wp-content/uploads/2016/01/Gaps-and-Barriers-Report-FV.pdf (accessed on 5 February 2022).
- Tidal Today. Global Tidal Marine Development Market Overview; Tidal Today: London, UK, 2014. [Google Scholar]
- Magagna, D.; Uihlein, A. Ocean energy development in Europe: Current status and future perspectives. Int. J. Mar. Energy 2015, 11, 84–104. [Google Scholar] [CrossRef]
- EMEC: European Marine Energy Centre. Available online: https://www.emec.org.uk/2021/ (accessed on 5 February 2022).
- Case Study: Andritz Hydro Hammerfest Tidal Turbine. Available online: https://coastalenergyandenvironment.web.unc.edu/ocean-energy-generating-technologies/ocean-tidal-current-energy/tidal-energy-case-studies/case-study-andritz-hydro-hammerfest-tidal-turbine/ (accessed on 5 February 2022).
- Power Technology SeaGen Turbine, Northern Ireland, UK. Available online: https://www.power-technology.com/projects/strangford-lough/ (accessed on 2 February 2022).
- International Renewable Energy Agency. Renewable Capacity Statistics 2021 Statistiques de Capacité Renouvelable 2021 Estadísticas de Capacidad Renovable 2021; International Renewable Energy Agency (IRENA): Abu Dhabi, United Arab Emirates, 2021; pp. 1–300. [Google Scholar]
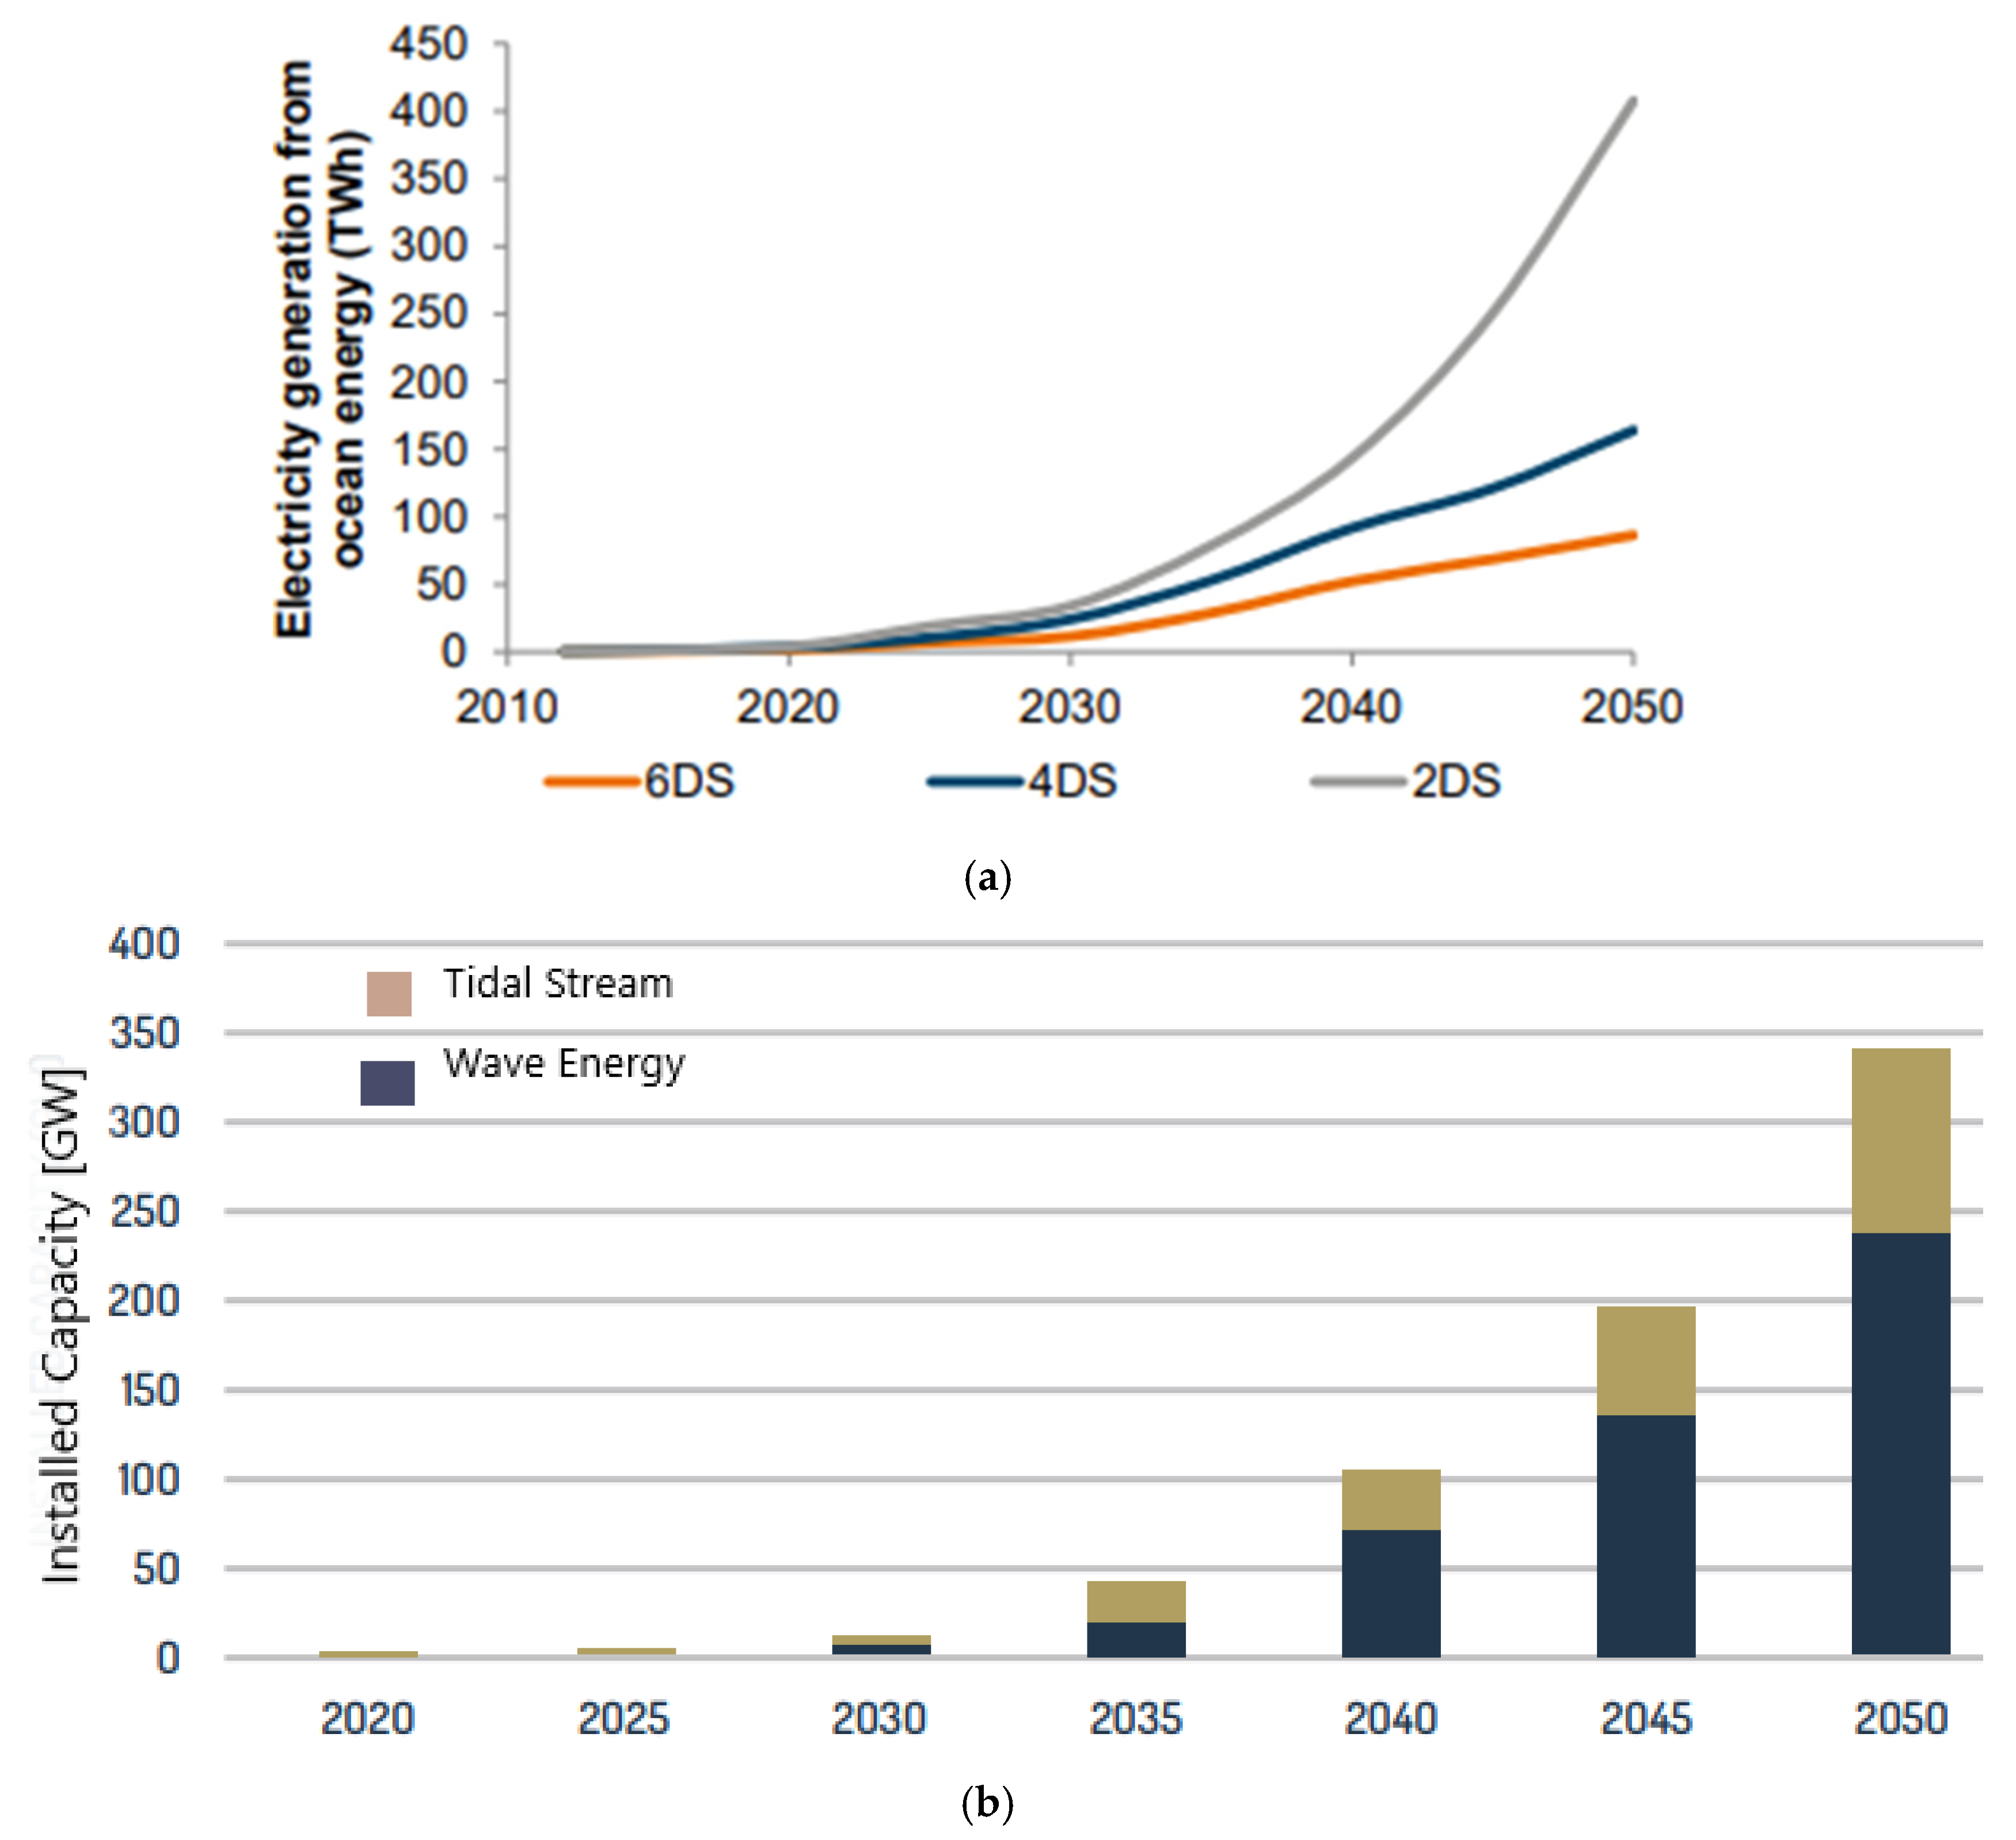
- IEA. Share of Renewables in Power Generation in the Sustainable Development Scenario; IEA: Paris, France, 2020. [Google Scholar]
- Fraunhofer IWES; Partners of Work Package 6. DTOcean Deliverable 6.1—Best Practice Guidelines for Offshore Array Monitoring and Control with Consideration of Offshore Wind and Oil & Gas Experiences; Fraunhofer IWES: Bremerhaven, Germany, 2014; Available online: https://www.dtoceanplus.eu/content/download/2529/file/DTO_WP6_ECD_D6.1.pdf (accessed on 2 February 2022).
- The Crown Estate. Energy and Infrastructure Outlook 2014–2015: Wave and Tidal; The Crown Estate: London, UK, 2014; Available online: https://www.offshorewindscotland.org.uk/media/1004/ei-outlook-offshore-wind.pdf (accessed on 2 February 2022).
- Leeney, R.H.; Greaves, D.; Conley, D.; O’Hagan, A.M. Environmental Impact Assessments for wave energy developments—Learning from existing activities and informing future research priorities. Ocean Coast. Manag. 2014, 99, 14–22. [Google Scholar] [CrossRef] [Green Version]
- Lalander, E.; Grabbe, M.; Leijon, M. On the velocity distribution for hydro-kinetic energy conversion from tidal currents and rivers. J. Renew. Sustain. Energy 2013, 5, 023115. [Google Scholar] [CrossRef] [Green Version]
- Wilson, E.M. Tidal Power. Elsevier Oceanogr. Ser. 1980, 24, 573–581. [Google Scholar] [CrossRef]
- Ministry for the Environment. Tocardo to Place Tidal Energy Turbines in Eastern Scheldt Storm Surge Barrier, The Netherlands|Dutch Water Sector. Available online: https://www.dutchwatersector.com/news/tocardo-to-place-tidal-energy-turbines-in-eastern-scheldt-storm-surge-barrier-the-netherlands (accessed on 5 February 2022).
- Kirby, R.; Retière, C. Comparing environmental effects of Rance and Severn barrages. Proc. Inst. Civ. Eng. Marit. Eng. 2009, 162, 11–26. [Google Scholar] [CrossRef]
- Seabased Ghana to be Early Adopter of Wave Power with Pioneer Company Seabased. Available online: https://seabased.com/news-insights/seabased-signs-100-mw-wave-power-plant-contract-with-ghana (accessed on 13 December 2021).
- Energias Renováveis Aguçadoura Wave Farm. Available online: http://www.energiasrenováveis.com/etiqueta/pelamis/ (accessed on 5 February 2022).
- Jha, A. ‘Waves Snakes’ Switch on to Harness Ocean’s Power; The Guardian: London, UK, 2008; Available online: https://www.theguardian.com/environment/2008/sep/24/renewable.wave.energy.portugal (accessed on 5 February 2022).
- United States Department of Energy. No Innovative Wave Power Device Starts Producing Clean Power in Hawaii. Available online: https://www.energy.gov/eere/articles/innovative-wave-power-device-starts-producing-clean-power-hawaii (accessed on 11 November 2021).
- Fred Olsen Bolt Wave Energy. Available online: https://scinnovation-global.com/sectors/renewable-energy/bolt-wave-energy-device/ (accessed on 13 December 2021).
- The Queen’s University of Belfast. Islay Limpet Wave Power Plant Report; The Queen’s University of Belfast: Belfast, UK, 2002. [Google Scholar]
- Koca, K.; Kortenhaus, A.; Oumeraci, H.; Zanuttigh, B.; Angelelli, E.; Cantu, M.; Suffredini, R.; Franceschi, G. Recent Advances in the Development of Wave Energy Converters. In Proceedings of the 9th European Wave and Tidal Energy Conference (EWTEC), Plymouth, UK, 5–9 September 2012. [Google Scholar]
- Renewable Technology. Mutriku Wave Energy Plant, Bay of Biscay, Basque Country, Spain. Available online: https://www.renewable-technology.com/projects/mutriku-wave-energy-plant/ (accessed on 10 September 2021).
- Santos, M.; Salcedo, F.; Haim, D.B.; Mendia, J.L.; Ricci, P.; Villate, J.L.; Khan, J.; Leon, D.; Arabi, S.; Moshref, A.; et al. Integrating Wave and Tidal Current Power: Case Studies Through Modelling and Simulation; Document No: T0331, International Energy Agency Implementing Agreement on Ocean Energy Systems; HAL Open Science: Paris, France, 2011; Available online: https://hal.archives-ouvertes.fr/hal-01265985/document (accessed on 11 February 2022).
- Aderinto, T.; Li, H. Review on Power Performance and Efficiency of Wave Energy Converters. Energies 2019, 12, 4329. [Google Scholar] [CrossRef] [Green Version]
- Offshore. Wave Energy Prototype Arrives at Orkney Ahead of Trials. Available online: https://www.offshore-mag.com/renewable-energy/article/14203296/wave-energy-prototype-arrives-at-orkney-ahead-of-trials (accessed on 11 February 2022).
- Weilepp, J. First Breakwater Wave Plant Built in Mutriku; HyPower: Fort Lauderdale, FL, USA, 2007; Available online: http://www.voithhydro.com/media/HyPower16_S.53.pdf (accessed on 11 February 2022).
- International Energy Agency. Energy Technology Perspectives 2015; International Energy Agency: Paris, France, 2015. [Google Scholar]
- Energy Technologies Institute. ESME Data References Book; ETI (Energy Technologies Institute): London, UK, 2018; p. 81. Available online: https://es.catapult.org.uk/guide/esme-data-references-book/ (accessed on 11 February 2022).
- International Energy Agency. Energy Technology Perspectives. 2020. Available online: https://www.iea.org/reports/energy-technology-perspectives-2020 (accessed on 13 December 2021).
- Aquatera. A Review of the Potential Impacts of Wave and Tidal Energy Development on Scotland’s Marine Environment; The Crown Estate: London, UK, 2014. Available online: https://tethys.pnnl.gov/publications/review-potential-impacts-wave-tidal-energy-development-scotlands-marine-environment (accessed on 11 February 2022).
- Neary, V.S.; Previsic, M.; Jepsen, R.A.; Lawson, M.J.; Yu, Y.-H.; Copping, A.E.; Fontaine, A.A.; Hallett, K.C.; Murray, D.K. Methodology for Design and Economic Analysis of Marine Energy Conversion (MEC) Technologies; Sandia National Laboratories: Albuquerque, NM, USA, 2014. Available online: https://energy.sandia.gov/wp-content/gallery/uploads/SAND2014-9040-RMP-REPORT.pdf (accessed on 11 February 2022).
- Parbery-Clark, A.; Skoe, E.; Kraus, N. Musical experience limits the degradative effects of background noise on the neural processing of sound. J. Neurosci. 2009, 29, 14100–14107. [Google Scholar] [CrossRef] [PubMed] [Green Version]
- Gill, A.B.A.B.B.; Huang, Y.; Gloyne-Philips, I.; Metcalfe, J.; Quayle, V.; Spencer, J.; Wearmouth, V.; Metcalf, J.; Quayle, V.; Spencer, J.; et al. COWRIE 2.0 Electromagnetic Fields (EMF) Phase 2: EMF-Sensitive Fish Response to EM Emissions from Sub-Sea Electricity Cables of the Type Used by the Offshore Renewable Energy Industry. Commissioned by COWRIE Ltd. (Project Reference COWRIE-EMF-1-06); Centre for Environment Fisheries and Aquaculture Science: London, UK, 2009; ISBN 9780956140418. Available online: https://www.pnnl.gov/main/publications/external/technical_reports/PNNL-22154.pdf (accessed on 11 February 2022).
- Öhman, M.C.; Sigray, P.; Westerberg, H. Offshore Windmills and the Effects of Electromagnetic Fields on Fish. Ambio 2007, 36, 630–633. [Google Scholar] [CrossRef]
- Boehlert, G.W.; Gill, A.B. Environmental and ecological effects of ocean renewable energy development. Oceanography 2010, 23, 68–81. [Google Scholar] [CrossRef] [Green Version]
- Huckerby, J. Marine Energy: Resources, Technologies, Research and Policies. In Operational Oceanography in the 21st Century; Springer: Dordrecht, The Netherlands, 2011; pp. 695–720. ISBN 9789400703322. [Google Scholar]
- Tougaard, J. Underwater noise from a wave energy converter is unlikely to affect marine mammals. PLoS ONE 2015, 10, e0132391. [Google Scholar] [CrossRef] [PubMed]
- Ann, M.; Quirapas, J.; Narasimalu, S.; Abundo, M.; Lin, H. Electricity from the ocean: A path to secure energy in Southeast Asia? In Proceedings of the International Conference on Sustainable Energy and Environment (SEE 2014): Science, Technology and Innovation for ASEAN Green Growth, Singapore, 24–25 February 2014; pp. 212–216. [Google Scholar]
- Quirapas, M.A.J.R.; Taeihagh, A. Ocean renewable energy development in Southeast Asia: Opportunities, risks and unintended consequences. Renew. Sustain. Energy Rev. 2021, 137, 110403. [Google Scholar] [CrossRef]
- Shek, J.K.H.; Macpherson, D.E.; Mueller, M.A. Experimental verification of linear generator control for direct drive wave energy conversion. IET Renew. Power Gener. 2010, 4, 395–403. [Google Scholar] [CrossRef]
- Veritas, D.N. Guidelines on Design and Operation of Wave Energy Converters; Carbon Trust: London, UK, 2005. [Google Scholar]
- Ko, D.H.; Chung, J.; Lee, K.S.; Park, J.S.; Yi, J.H. Current policy and technology for tidal current energy in Korea. Energies 2019, 12, 1807. [Google Scholar] [CrossRef] [Green Version]
- Chowdhury, M.S.; Rahman, K.S.; Selvanathan, V.; Nuthammachot, N.; Suklueng, M.; Mostafaeipour, A.; Habib, A.; Akhtaruzzaman, M.; Amin, N.; Techato, K. Current trends and prospects of tidal energy technology. Environ. Dev. Sustain. 2021, 23, 8179–8194. [Google Scholar] [CrossRef] [PubMed]
- Tidal Lagoon Power Projects. Available online: http://www.tidallagoonpower.com/projects/ (accessed on 13 December 2021).
- OES—IEA. International Levelised Cost of Energy for Ocean Energy Technologies; International Energy Agency: Paris, France, 2015. [Google Scholar]
- Dave Sagan. An Iconic, World-First Infrastructure Project in South West Wales. Available online: http://www.tidallagoonpower.com/projects/swansea-bay/ (accessed on 10 February 2021).
- European Ocean Energy. Industry Vision Paper 2013; European Ocean Energy: Brussels, Belgium, 2013. [Google Scholar]
- Mueller, M.; Wallace, R. Enabling science and technology for marine renewable energy. Energy Policy 2008, 36, 4376–4382. [Google Scholar] [CrossRef]
- Kiprakis, A.E.; Wallace, A.R. Maximising energy capture from distributed generators in weak networks. IEE Proc. Gener. Transm. Distrib. 2004, 151, 611–618. [Google Scholar] [CrossRef]
- Llorente Iglesias, R.; Lacal Arantegui, R.; Aguado Alonso, M. Power electronics evolution in wind turbines—A market-based analysis. Renew. Sustain. Energy Rev. 2011, 15, 4982–4993. [Google Scholar] [CrossRef]
- International Electrotechnical Commision. Grid Integration of Large-Capacity Renewable Energy Sources and Use of Large-Capacity Electrical Energy Storage; White Paper; International Electrotechnical Commission: Geneva, Switzerland, 2012; p. 102. [Google Scholar]
- Santos-Mugica, M.; Robles, E.; Endegnanew, A.G.; Tedeschi, E.; Giebhardt, J. Grid integration and power quality testing of Marine Energy Converters: Research activities in the MaRINET Project. In Proceedings of the 2014 9th International Conference on Ecological Vehicles and Renewable Energies, EVER 2014, Monte-Carlo, Monaco, 25–27 March 2014; pp. 1–9. [Google Scholar]
- Marine Renewables Infrastructure Network. Report on Grid Integration and Power Quality Testing; MARINET (Marine Renewables Infrastructure Network for emerging Energy Technologies): Bremerhaven, Germany, 2014; Available online: http://www.marinet2.eu/wp-content/uploads/2017/04/D4.03-Report-on-grid-integration-power-quality-testing-1.pdf (accessed on 11 February 2022).
- MacEnri, J.; Reed, M.; Thiringer, T. Power quality performance of the tidal energy converter, SeaGen. In Proceedings of the International Conference on Offshore Mechanics and Arctic Engineering—OMAE, ASMEDC, Hamburg, Germany, 5–10 June 2011; Volume 44373, pp. 529–536. [Google Scholar]
- European Committee for Standardization. Voltage Charecteristics of Electricity Supplied by Public Electricity Networks; European Committee for Standardization: Brussels, Belgium, 2015. [Google Scholar]
- Hong, Y.; Waters, R.; Boström, C.; Eriksson, M.; Engström, J.; Leijon, M. Review on electrical control strategies for wave energy converting systems. Renew. Sustain. Energy Rev. 2014, 31, 329–342. [Google Scholar] [CrossRef]
- Sanchez, E.V.; Hansen, R.H.; Kramer, M.M. Control performance assessment and design of optimal control to harvest ocean energy. IEEE J. Ocean. Eng. 2015, 40, 15–26. [Google Scholar] [CrossRef]
- Bacelli, G.; Ringwood, J. Constrained control of arrays of wave energy devices. Int. J. Mar. Energy 2013, 3–4, e53–e69. [Google Scholar] [CrossRef]
- Armstrong, S.; Cotilla-Sanchez, S.A.E.; Kovaltchouk, T. Assessing the Impact of the Grid Connected Pacific Marine Energy Centre Wave Farm. IEEE J. Emerg. Sel. Top. Power Electron. 2015, 3, 1011–1020. [Google Scholar] [CrossRef]
- Tedeschi, E.; Santos-Mugica, M. Modeling and control of a wave energy farm including energy storage for power quality enhancement: The bimep case study. IEEE Trans. Power Syst. 2014, 29, 1489–1497. [Google Scholar] [CrossRef]
- European Commission (EC). JRC Publications Repository: ETRI 2014—Energy Technology Reference Indicator Projections for 2010—2050; European Commission: Brussels, Belgium, 2014. [Google Scholar]
- Tiron, R.; Pinck, C.; Reynaud, E.; Dias, F. Is biofouling a critical issue for wave energy converters? In Proceedings of the International Offshore and Polar Engineering Conference, Rhodes, Greece, 17–23 June 2012; pp. 669–679. [Google Scholar]
- Tetu, A.; Kofoed, J.P.; Tully, S.; Roc, T. DTOcean: Deliverable 2.1: Assessment of Capabilities of Available Tools; The European Union’s Seventh Programme For Research, Technological Development And Demonstration: Derio, Spain, 2014; Available online: https://vbn.aau.dk/en/publications/dtocean-deliverable-21-assessment-of-capabilities-of-available-to (accessed on 10 March 2022).
- Ahmadian, R.; Falconer, R.A. Assessment of array shape of tidal stream turbines on hydro-environmental impacts and power output. Renew. Energy 2012, 44, 318–327. [Google Scholar] [CrossRef]
- Lee, S.H.; Lee, S.H.; Jang, K.; Lee, J.; Hur, N. A numerical study for the optimal arrangement of ocean current turbine generators in the ocean current power parks. Curr. Appl. Phys. 2010, 10, S137–S141. [Google Scholar] [CrossRef]
- Wolgamot, H.A.; Taylor, P.H.; Eatock Taylor, R. The interaction factor and directionality in wave energy arrays. Ocean Eng. 2012, 47, 65–73. [Google Scholar] [CrossRef]
- Child, B.F.M.; Venugopal, V. Optimal configurations of wave energy device arrays. Ocean Eng. 2010, 37, 1402–1417. [Google Scholar] [CrossRef]
- Borgarino, B.; Babarit, A.; Ferrant, P. Impact of wave interactions effects on energy absorption in large arrays of wave energy converters. Ocean Eng. 2012, 41, 79–88. [Google Scholar] [CrossRef] [Green Version]
- SI Ocean. Wave and Tidal Energy Market Deployment Strategy for Europe; European Ocean Energy: Brussels, Belgium, 2014; p. 47. Available online: https://www.oceanenergy-europe.eu/wp-content/uploads/2017/10/SI_Ocean_Market_Deployment_Strategy_-_Web_version.pdf (accessed on 10 March 2022).
- Walker, J.M.; Flack, K.A.; Lust, E.E.; Schultz, M.P.; Luznik, L. Experimental and numerical studies of blade roughness and fouling on marine current turbine performance. Renew. Energy 2014, 66, 257–267. [Google Scholar] [CrossRef]
- Connor, M.O.; Lewis, T.; Dalton, G. Operational expenditure costs for wave energy projects and impacts on financial returns. Renew. Energy 2013, 50, 1119–1131. [Google Scholar] [CrossRef] [Green Version]
- Gallagher, S.; Tiron, R.; Dias, F. A detailed investigation of the nearshore wave climate and the nearshore wave energy resource on the west coast of Ireland. In Proceedings of the International Conference on Offshore Mechanics and Arctic Engineering—OMAE, Nantes, France, 9–14 June 2013; Volume 8, pp. 1–12. [Google Scholar]
- Connor, M.O.; Lewis, T.; Dalton, G. Weather window analysis of Irish west coast wave data with relevance to operations & maintenance of marine renewables. Renew. Energy 2013, 52, 57–66. [Google Scholar]
- Abdulla, K.; Skelton, J.; Doherty, K.; O’Kane, P.; Doherty, R.; Bryans, G. Statistical availability analysis of Wave Energy Converters. In Proceedings of the International Offshore and Polar Engineering Conference, Twenty-First International Offshore and Polar Engineering Conference, Maui, HI, USA, 19−24 June 2011; pp. 572–577. [Google Scholar]
- Gray, A.; Dickens, B.; Bruce, T.; Ashton, I.; Johanning, L. Reliability and O&M sensitivity analysis as a consequence of site specific characteristics for wave energy converters. Ocean Eng. 2017, 141, 493–511. [Google Scholar]
- Maples, B.; Saur, G.; Hand, M.; van Pietermen, R.; Obdam, T. Installation, Operation, and Maintenance Strategies to Reduce the Cost of Offshore Wind Energy; National Renewable Energy Laboratory: Golden, CO, USA, 2013. Available online: https://www.nrel.gov/docs/fy13osti/57403.pdf (accessed on 10 March 2022).
- Thies, P.R.; Johanning, L.; Smith, G.H. Towards component reliability testing for marine energy converters. Ocean Eng. 2011, 38, 360–370. [Google Scholar] [CrossRef] [Green Version]
- Houde, J. Cost-Benefit Analysis of Tidal Energy Generation in Nova Scotia: A Scenario for a Tidal Farm with 300 mw of Installed Capacity in the Minas Passage in 2020; Dalhouse University: Halifax, NS, Canada, 2012. [Google Scholar]
- Blavette, A.; O’Sullivan, D.L.; Lewis, A.W.; Egan, M.G. Grid integration of wave and tidal energy. In Proceedings of the International Conference on Offshore Mechanics and Arctic Engineering—OMAE, Rotterdam, The Netherlands, 19–24 June 2011; Volume 5, pp. 749–758. [Google Scholar]
- Department of Communication Marine and Natural Resources. Green Paper towards a Sustainable Energy Future for Ireland; Department of Communication Marine and Natural Resources: Dublin, Ireland, 2006; pp. 1–112.
- The European Wind Energy Association. Large scale integration of Wind Energy; The European Wind Energy Association (EWEA): Brussels, Belgium, 2005. [Google Scholar]
- Sheng, S. Report on Wind Turbine Subsystem Reliability—A Survey of Various Databases (Presentation); National Renewable Energy Laboratory: Golden, CO, USA, 2013; p. 43.
- Edenhofer, O.; Pichs-Madruga, R.; Sokona, Y.; Seyboth, K.; Eickemeier, P.; Matschoss, P.; Hansen, G.; Kadner, S.; Schlömer, S.; Zwickel, T.; et al. IPCC, 2011: Summary for Policymakers. In IPCC Special Report on Renewable Energy Sources and Climate Change Mitigation; Cambridge University Press: Cambridge, UK, 2011; ISBN 9789291691319. [Google Scholar]
- Kalair, A.; Abas, N.; Khan, N. Comparative study of HVAC and HVDC transmission systems. Renew. Sustain. Energy Rev. 2016, 59, 1653–1675. [Google Scholar] [CrossRef]


| Country | Site | Type | Mean Tidal Range (m) | Basin Area (km2) | Proposed Capacity (GW) | Estimated Annual Output (TWh) |
|---|---|---|---|---|---|---|
| Argentina | San Jose | Barrage | 5.9 | - | 6.8 | 20 |
| Australia | Secure bay 1 | Barrage | 10.9 | - | - | 2.4 |
| Secure Bay 2 | Barrage | 10.9 | - | - | 2.4 | |
| Canada | Cobequid | Barrage | 12.4 | 240 | 5.34 | 14 |
| Cumberland | Barrage | 10.9 | 90 | 1.4 | 3.4 | |
| Shepody | Barrage | 10 | 115 | 1.8 | 4.8 | |
| India | Gulf of Kutch | Barrage | 5.3 | 170 | 0.9 | 1.7 |
| Gulf of Cambay | Barrage | 6.8 | 1970 | 7 | 15 | |
| South Korea | Garorim | Barrage | 4.7 | 100 | 0.48 | 0.53 |
| Cheonsu | Barrage | 4.5 | - | - | 1.2 | |
| Mexico | Rio Colorado | Barrage | 6.7 | - | - | 5.4 |
| Tiburon | Barrage | - | - | - | - | |
| UK | Severn | Barrage | 7.0 | 520 | 8.94 | 17 |
| Mersey | Barrage | 6.5 | 61 | 0.7 | 1.5 | |
| Wyre | Barrage | 6.0 | 5.8 | 0.047 | 0.09 | |
| Conwy | Barrage | 5.2 | 5.5 | 0.033 | 0.06 | |
| Swansea | Lagoon | - | - | 0.32 | - | |
| Newport | Lagoon | - | - | 0.75 | - | |
| Bridgewater | Lagoon | - | - | 2 | - | |
| Cardiff | Lagoon | - | - | 1.8–2.8 | - | |
| Colwyn Bay | Lagoon | - | - | 1.5 | - | |
| Blackpool | Lagoon | - | - | 1.0 | - | |
| U.S. | Passamquoddy | Barrage | 5.5 | - | - | - |
| Knik arm | Barrage | 7.5 | - | 2.9 | 7.4 | |
| Turnagain | Barrage | 7.5 | - | 6.5 | 16.6 | |
| Arm | Barrage | - | - | - | - | |
| Former Soviet Union | Mezen | Barrage | 9.1 | 2300 | 15 | 50.0 |
| Tugur | Barrage | - | - | 10 | 27.0 | |
| Penzhinskaya | Barrage | 6.0 | - | 50 | 27.0 | |
| Cauba | Barrage | - | - | - | - |
| Country | Location | Wave Resources (kW/m) | Reference |
|---|---|---|---|
| South Africa | South African and southwest Africa Coast | 40–50 | [44] |
| Argentina | Argentine Sea | 61.3–69 | [45] |
| Australia | Southern Australian shelf | 25–30 | [46] |
| Belgium | Belgium Continental Shelf | 4.64 | [47] |
| Brazil | North East region | 2–14 | [48] |
| Canada | North Pacific Ocean (Vancouver Island) | 25 | [49] |
| North Atlantic Ocean (Sable Island) | 25 | ||
| Chile | Los Lagos | 71–87 | [50] |
| Magallanes | 78 | [51] | |
| China | Bohai Sea | 7.73 | [52] |
| Yellow Sea | 6.29 | ||
| East China Sea | 6.36 | ||
| South China Sea | 5.32 | ||
| Denmark | North Sea | 9.8 | [53] |
| France | Bay of Biscay | 24.3 | [54] |
| Greece | Crete Island | 4–11 | [55] |
| India | Indian Coast | 5–10 | [56] |
| Ireland | West of Malin Head | 30–40 | [57] |
| Donegal Bay | 20–40 | ||
| Sherkin Island | 20 | ||
| Italy | Mediterranean Sea | 8.91–10.29 | [58] |
| Japan | Japan Sea Coast | 7.2 | [59] |
| East Coast | 6.3 | ||
| Entire Coast | 6.4 | ||
| Malaysia | East Peninsular Malaysia | <6.5 | [60] |
| West Peninsular Malaysia | 0.5–2.0 | [61] | |
| Sarawak Ocean | 3.1–4.5 | [62] | |
| Sabah Ocean | 6.5 | [63] | |
| Norway | Norwegian Sea (Runde Island) | 40–50 | [64] |
| Portugal | Portuguese nearshore | 30–40 | [65] |
| Sweden | Skagerrak Strait | 2.8–5.2 | [66] |
| United Kingdom | Celtic Sea | 15–32 | [67] |
| United States | Hawaii | 15–25 | [68] |
| California Coast | 10–32 | [69] | |
| Pacific Northwest | 36 | [70] | |
| Southeast Atlantic Coast | 9–15 | [71] |
| Type | Project and Place | Capacity (kW) | References |
|---|---|---|---|
| Fixed | Mutriku, Spain | 296 | [91] |
| REWEC3, Italy | 20 (potential of 2500) | [91] | |
| King Island, Australia | 200 | [91] | |
| Yongsoo OWC, Korea | 500 | [91] | |
| Floating | MARMOK-A-5, Spain | 30 | [91] |
| Ocean Energy Buoy, Ireland | 500 | [91,92] |
| Type | Project and Place | Capacity (kW) | References |
|---|---|---|---|
| Heaving | PB3 PowerBuoy, USA | 3 | [94] |
| CET06, Australia | 1000 | [95] | |
| Atmocean, USA | 10 | [96] | |
| Seabased, Sweden | 30 | [97] | |
| Oceanus, UK | 162 | [98] | |
| Corpower, Sweden | 300 | [95] | |
| BOLT LifeSaver, Norway | 30 | [95] | |
| Neptune 6, Canada | 20 | [95] | |
| Archimedes Waveswing, UK | 16 | [91] | |
| Horizontal | Wavepiston, Denmark | 100–200 | [95] |
| 40South Energy H24, Italy | 50 | [95] | |
| Flap | WaveRoller, Finland | 350 | [99] |
| CCell-Wave, UK | - | [100] | |
| LAMWEC, Belgium | 200 | [95] | |
| bioWAVE, Australia | 250 | [95] | |
| Articulated | SeaPower Platform, Ireland | - | [101] |
| SeaRay, USA | 5 | [91] | |
| Blue Horizon, UK | - | [91] | |
| Blue X, UK | 2–4 | [91] | |
| M4 WEC, UK | - | [95] |
| Technology | Case Studies | Mean Tidal Range (m) | Output (MW) | Notes, Operation Type | Turbine Used |
|---|---|---|---|---|---|
| Tidal barrage | La Rance (France) | 8.5 | 240 | Two-way generation with pumping, firstly operated in 1966, basin area of 22 km2 | Bulb |
| Sihwa Lake (South Korea) | 5.6 | 254 | Flood generation, first operated in 2015, basin area of 56 km2 | Bulb | |
| Kislaya Guba (Russia) | 2.3 | 1.7 | Two-way generation, firstly operated in 1968, basin area of 1.1 km2 | Savonius | |
| Annapolis Royal (Canada) | 7.0 | 20 | Ebb generation, firstly operated in 1984, basin area of 15 km2 | Rim | |
| Jiangxia (China) | 5.1 | 3.9 | Two-way generation, firstly operated in 1980, basin area of 1.4 km2 | Bulb | |
| Severn Estuary (UK) | 7.8 | 8640 | Two-way generation, basin area of 450 km2 | Bulb | |
| Incheon (South Korea) | 5.3 | 1320 | On hold, basin area of 110 km2 | - | |
| Mezen (Russia) | 9.1 | 19,200 | Proposed, basin area of 2300 km2 | - | |
| Penzhin (Russia) | 9.0 | 87,000 | Proposed, basin area of 20,530 km2 | - | |
| Solway Firth (UK) | 5.5 | - | - | - | |
| Bay of Fundy (Canada) | 11.7 | - | - | - | |
| Gulf of Cambay (India) | 6.1 | - | - | - | |
| Maluanwan (China) | 2.58 | 24 | Proposed | - | |
| Bachimen (China) | 3.1 | 36 | Proposed | - | |
| Jiantiaogang | 2.63 | 21 | Proposed | - | |
| Tidal lagoon | Swansea Bay | - | 320 | Firstly operated in 2019, Two-way generation with pumping, basin area of 11.5 km2 | Bulb |
| Tidal reef | No existing locations | - | - | - | - |
| Tidal fence | No existing location | - | - | - | - |
| Project and Place | Capacity (kW) | Ref., Notes |
|---|---|---|
| Kavaratti, Lakhshadweep Islands, India | 60 | [91], under development |
| KRISO, Goseong, Korea | 20 | [91], operational |
| KRISO, Korea | 1000 | [91], under development |
| Nauru, Japan | 120 | [136], constructed in 1982 |
| Okinawa, Japan | 50 | [136], constructed in 2013, a land based plant |
| NELHA, Hawaii | 50 | [136], constructed in 1979 |
| OTEC International LLC, Hawaii | 1000 | [136], operated between 1993–1998 |
| Lockheed Martin naval facility, Hawaii | 10,000 | [136] |
| Tuticorin, India | 1000 | [136], a floating closed cycle |
| Southern China | 10,000 | [136] |
| Martinique, Bellefontaine | 10,000 | [136], a floating type |
| Power Plant | Country | Year | Installed Capacity (MW) | Annual Capacity (GWh) | Reference |
|---|---|---|---|---|---|
| Annapolis Royal Station | Canada | 1984 | 20 | 30 | [177] |
| Jiangxi Tidal Station | China | 1980 | 3.2 | 4.4 | [177] |
| Kislaya | Russia | 1968 | 1.7 | 1.8 | [189] |
| Rance Tidal | France | 1966 | 240 | 480 | [189] |
| Sihwa Lake | South Korea | 2011 | 254 | 552 | [121] |
| Strangford Lough | UK | 2008 | 1.2 | - | [121] |
| Uldolmok | South Korea | 2009 | 1.5 | 2.4 | [190] |
| Eastern Scheldt | Netherlands | 2015 | 1.25 | - | [34] |
| Plant | Country | Capacity (MW) | Type | Year | Reference |
|---|---|---|---|---|---|
| Ada Foah Wave Farm | Ghana | 0.4 | Point absorber | 2016 | [181] |
| Agucadoura Wave Farm | Portugal | 2.25 | Surface-following attenuator | 2008 | [182] |
| Azura | United States | 0.02 | Point absorber | 2015 | [183] |
| BOLT Lifesaver | United States | 0.03 | Point absorber | 2016 | [184] |
| Islay Limpet | United Kingdom | 0.5 | Oscillating water column | 2000 | [185] |
| Mutriku Breakwater Wave Plant | Spain | 0.3 | Oscillating water column | 2009 | [186] |
| Orkney Wave Power Station | United Kingdom | 2.4 | Oscillating wave surge converter | Proposed | [191] |
| Pico Wave Power Plant | Portugal | 0.4 | Oscillating water column | 2010 | [192] |
| SDE Sea Waves Power Plant | Israel | 0.04 | Oscillating wave surge converter | 2009 | [192] |
| SINN Power wave energy converter | Greece | 0.02 | Point absorber | 2015 | [192] |
| Sotenäs Wave Power Station | Sweden | 3 | Point absorber | 2015 | [192] |
| Deployment Stage | Variable | Wave | Tidal | OTEC | |||
|---|---|---|---|---|---|---|---|
| Min | Max | Min | Max | Min | Max | ||
| First array/first project | Project capacity (MW) | 1 | 3 | 0.3 | 10 | 0.1 | 5 |
| CAPEX (USD/kW) | 4000 | 18,100 | 5100 | 14,600 | 25,000 | 45,000 | |
| OPEX (USD/kW·y) | 140 | 1500 | 160 | 1160 | 800 | 1440 | |
| Second array/second project | Project capacity (MW) | 1 | 10 | 0.5 | 28 | 10 | 20 |
| CAPEX (USD/kW·y) | 3600 | 15,300 | 4300 | 8700 | 15,000 | 30,000 | |
| OPEX (USD/kW·y) | 100 | 500 | 150 | 530 | 480 | 950 | |
| Availability (%) | 85% | 98% | 85% | 98% | 95% | 95% | |
| Capacity factor (%) | 30% | 35% | 35% | 42% | 97% | 97% | |
| LCOE (USD/MWh) | 210 | 670 | 210 | 470 | 350 | 650 | |
| First commercial-scale project | Project capacity (MW) | 2 | 75 | 3 | 90 | 100 | 100 |
| CAPEX (USD/kW) | 2700 | 9100 | 3300 | 5600 | 7000 | 13,000 | |
| OPEX (USD/kW·y) | 70 | 380 | 90 | 400 | 340 | 620 | |
| Availability (%) | 95% | 98% | 92% | 98% | 95% | 95% | |
| Capacity factor (%) | 35% | 40% | 35% | 40% | 97% | 97% | |
| LCOE (USD/MWh) | 120 | 470 | 130 | 280 | 150 | 280 | |
| Name | Capacity (MW) | Country | Primary Cost (B USD) | References |
|---|---|---|---|---|
| Garorim Bay Tidal Power Station | 520 | South Korea | 1 | [208] |
| Incheon Tidal Power Station | 1320 | South Korea | 3.4 | [209] |
| Tugurskaya Tidal Power Plant | 3640 | Russia | - | [209] |
| Mezenskaya Tidal Power Plant | 24,000 | Russia | 22.76 | [209] |
| Skerries Tidal Stream Array | 10.5 | UK | 0.07698 | [209] |
| Tidal Lagoon Swansea Bay | 320 | UK | 1.3 | [212] |
| Gulf of Kutch Project | 50 | India | 0.15 | [212] |
| Alderney Tidal Plant | 300 | Alderney | - | [212] |
| Policy Instrument | Country | Example Description |
|---|---|---|
| Targets | ||
| Legislated targets, aspirational targets, and forecasts | United Kingdom | 3% of UK electricity from ocean energy by 2020 |
| Ireland | 500 MW by 2020 | |
| Portugal | 550 MW by 2020 | |
| Government funding | ||
| Research and development programs/grants | United States | U.S. DoE hydrokinetic program (capital grants for R&D and market acceleration) |
| Prototype deployment and capital grants | United Kingdom | Marine Renewable Proving Fund (MRPF) |
| New Zealand | Marine Energy Deployment Fund (MEDF) | |
| Production incentives | ||
| Feed-in-Tariffs | Portugal | Guaranteed price (in USD/kWh or equivalent) for ocean energy-generated electricity |
| Ireland/Germany | ||
| Renewables Obligations | United Kingdom | Tradable certificates (in USD/MWh or equivalent) for ocean energy generated electricity |
| Prizes | Scotland | Saltire prize |
| Infrastructure developments | ||
| National marine energy centers | United States | Two centers were established (Oregon/Washington for wave/tidal and Hawaii for OTEC) |
| Marine energy testing centers | Most western European and North American countries | European Marine Energy Center (EMEC). There are about 14 centers under development worldwide |
| Offshore hubs | United Kingdom | Wave hub, connection infrastructure for devices |
| Other regulatory incentives | ||
| Standards/protocols | United Kingdom | A national standard for ocean energy (as well as participation in the development of international standards) |
| Permitting regimes | United Kingdom | Crown estate competitive tender for |
| Space/resource allocation regimes | United States | FERC/MMS permitting regime in U.S. outer Continental Shelf |
Publisher’s Note: MDPI stays neutral with regard to jurisdictional claims in published maps and institutional affiliations. |
© 2022 by the authors. Licensee MDPI, Basel, Switzerland. This article is an open access article distributed under the terms and conditions of the Creative Commons Attribution (CC BY) license (https://creativecommons.org/licenses/by/4.0/).
Share and Cite
Khan, M.Z.A.; Khan, H.A.; Aziz, M. Harvesting Energy from Ocean: Technologies and Perspectives. Energies 2022, 15, 3456. https://doi.org/10.3390/en15093456
Khan MZA, Khan HA, Aziz M. Harvesting Energy from Ocean: Technologies and Perspectives. Energies. 2022; 15(9):3456. https://doi.org/10.3390/en15093456
Chicago/Turabian StyleKhan, Muhammed Zafar Ali, Haider Ali Khan, and Muhammad Aziz. 2022. "Harvesting Energy from Ocean: Technologies and Perspectives" Energies 15, no. 9: 3456. https://doi.org/10.3390/en15093456
APA StyleKhan, M. Z. A., Khan, H. A., & Aziz, M. (2022). Harvesting Energy from Ocean: Technologies and Perspectives. Energies, 15(9), 3456. https://doi.org/10.3390/en15093456