Article

Tuscaloosa Marine Shale: Seal or Source? Petrophysical Comparative Study of Wells in SE Louisiana and SW Mississippi

by
Cristina Mariana Ruse
1,*,
Mehdi Mokhtari
1 and
Lenissongui Yeo
2
1
Department of Petroleum Engineering, University of Louisiana at Lafayette, Lafayette, LA 70504, USA
2
Department of Mechanical & Aerospace Engineering, Oklahoma State University, Stillwater, OK 74078, USA
*
Author to whom correspondence should be addressed.
Energies 2022, 15(9), 3417; https://doi.org/10.3390/en15093417
Submission received: 14 February 2022 / Revised: 2 May 2022 / Accepted: 4 May 2022 / Published: 7 May 2022
(This article belongs to the Special Issue Geomechanics of Hydraulic Fracturing)

Abstract

:
The Tuscaloosa Marine Shale (TMS) is a versatile Late Cretaceous shale formation present in central and SE Louisiana and SW Mississippi, which drew attention because of the various roles played within the Tuscaloosa Group. In this paper, it is debated whether the Tuscaloosa Marine Shale can act as a source, reservoir, or seal all throughout the shale play or only in certain areas. Well log and core data from Adams County, Mississippi, are compared to data from East Feliciana Parish in Louisiana. Conclusions were drawn based on the results of well log analysis, X-ray Diffraction (XRD), porosity–permeability measurements, programmed pyrolysis, and fracture analysis. It was shown that the Tuscaloosa Marine Shale interval in SE Louisiana consists of important amounts of calcite, exhibits multiple natural fractures, has porosity values as high as 9.3%, and shows a TOC content of up to 2.8 wt%. On the other hand, samples from a well at the Cranfield field, MS, are characterized by considerably lower TOC values of around 0.88 wt%, porosities between 0.33% and 4%, and no serious fracturing. The formation demonstrates better reservoir and source potential in SE Louisiana and reliable CO2 sealing capacity in SW Mississippi. The analysis presented in this paper represents a holistic approach to the characterization of shale formations, is applicable to other plays around the world, and can be used as an integral part of CO2 sequestration or hydraulic fracturing programs.

1. Introduction

The Tuscaloosa Marine Shale, present in both Louisiana and Mississippi, drew attention due to being the Lower Tuscaloosa sands’ source rock, was then targeted as an unconventional reservoir in the late 1970s, and might also represent a potential seal for carbon storage as shown by recent research. However, is the marine shale able to satisfy these roles all throughout the play, or does its potential differ based on location? The current paper uses results from previous research along with original analysis to discuss TMS’ reservoir, source, and seal capacity in SE Louisiana and SW Mississippi. Previous studies [1,2,3] have addressed Tuscaloosa Marine Shale’s contribution to the hydrocarbon production from the Tuscaloosa sands, but the significant spatial variability of its organic content and thermal maturity [4] suggests that the formation might have different source capabilities in Mississippi than it has in Louisiana.
On the other hand, in 2008, the Southeast Regional Carbon Sequestration Partnership (SECARB) started evaluating TMS’ seal potential as part of one of their early projects in western Mississippi. According to Hovorka et al. (2011) [5], the goal of the project was to efficiently conduct CO2 injection and EOR in the already hydrocarbon-depleted Lower Tuscaloosa sands at Cranfield field, MS (Figure 1). Seal integrity is crucial for CO2 sequestration, and mudstones are considered good candidates due to their low permeability and lateral continuity. However, the Tuscaloosa Marine Shale poses numerous challenges in assessing sealing capacity because of its heterogeneous character [6]. Moreover, extensive hydraulic fracturing can affect shale integrity and alter its capacity to act as a caprock in subsequent CO2 storage programs [7,8]. Other factors considered when addressing sealing properties are the mineralogical content, pore structure and cementation, rock texture, organic material arrangement, and mudstone diagenesis [9,10]. In addition, fracture presence can lead to CO2 leakage [11] and possible contamination of the neighboring formations and groundwater resources [12]. Such caprock integrity studies should precede the development of all EOR-CCUS (Carbon Capture, Utilization, and Storage) sites around the world. Fais et al. (2019) [13] investigated the sealing capacity of Middle Eocene to Lower Oligocene siliciclastic formations in the Sulcis Coal Basin, Southwestern Sardinia, while Hadian and Rezaee (2019) [14] addressed the effect of supercritical CO2 on the properties of shaly caprock in the Harvey sequestration site, Western Australia.
While fractures are a matter of concern for seal integrity, fracture presence in a reservoir can enhance permeability and further improve oil recovery. Nicot and Duncan [8] advise that production and storage sites can overlap and coexist only if the hydraulic fracturing history of the area investigated for geological carbon sequestration is known and permits for the former reservoir to be further exploited as a caprock [8]. Moreover, Elliot and Celia (2012) [7] explain that the colocation of CO2 potential sites with producing areas impacts up to 80% of the shale and tight formations extent in the United States and further recommend the implementation of improved subsurface management strategies to avoid future conflict and prevent resource loss.
In the 1970s, Alfred C. Moore made efforts to characterize the Tuscaloosa Marine Shale as a reservoir and confirmed natural fracture presence in an area located along the Mississippi–east Louisiana state boundary. The analyzed area falls within the TMS producing area as defined by Lohr et al. (2016) [15] and shown in Figure 1. Moreover, Hackley et al. (2018) [16] estimated recoverable resources of 1.5 billion barrels of oil and 4.6 trillion cubic feet of gas for the shale play. Between 2011 and 2015, more than 80 wells were drilled and hydraulically fractured in the core area of the play, which resulted in a total of 13.82 million barrels of oil and 9.04 billion cubic feet of gas produced from the Tuscaloosa Marine Shale [17]. Shaibu et al. (2022) [18] showed that the main factor responsible for production decline in the formation is the loss in fracture conductivity. Moreover, the marine shale poses other challenges as a reservoir and remains a difficult formation to drill, mainly due to its high average clay content (50 wt%) and varying mineralogy [4,19]. In addition, Ruse and Mokhtari (2020) and Ruse et al. (2021) [20,21] argued that the formation anisotropy should be taken into consideration when estimating the geomechanical profile prior to hydraulic fracturing, while Mlella et al. (2020) [22] showed that brittleness can be predicted with the help of machine learning and then employed to identify target areas.
Therefore, based on the arguments provided in the previous paragraphs, we define a good seal as a rock capable of preventing CO2 leakage due to favorable mineralogical composition leading to poor porosity and low permeability, as well as insignificant fracture development. On the other hand, both reservoir and source rocks should contain a substantial number of fractures to serve hydrocarbon movement and significant porous space. In addition, the capacity of a reservoir formation increases with its permeability, which is directly impacted by its lithological content. For example, the presence of sandy or silty streaks in a shale reservoir can considerably increase the overall permeability. In this paper, we analyze Tuscaloosa Marine Shale’s roles within the Tuscaloosa Group guided by the criteria presented above. Both well log and core data from SE Louisiana and SW Mississippi are being utilized. The results obtained as part of the Southeast Regional Carbon Sequestration Partnership (SECARB) project at Cranfield field, MS, are combined with new data collected as part of the Tuscaloosa Marine Shale Laboratory at the University of Louisiana at Lafayette, LA.
The goals of the paper are to supplement the currently limited body of published work on the Tuscaloosa Marine Shale and to address critical knowledge gaps about the potential of the formation through original interpretation. A comprehensive dataset comprising well log, XRD, porosity, permeability, and fracture data is employed to distinguish petrophysical differences between a well located in East Feliciana, LA, and another one drilled in the Cranfield field, MS. While other studies treat Tuscaloosa Marine Shale’s source, seal, and reservoir capabilities independently of one another, our work uses a holistic approach to better understand the potential of the unconventional formation and further assess the criteria responsible for its variability. Results from previous studies are also used to help delineate areas where the shale meets the criteria for a good source rock. Moreover, the analysis undergone in this paper aims to explore the effect of petrophysical variation on the marine shale’s capacity to act as a sealing layer for CO2 sequestration, as well as store or generate hydrocarbons.

Description of the Tuscaloosa Marine Shale

The Cenomanian-Turonian Tuscaloosa Group represents a self-standing low-order sea-level cycle and comprises three main units [23]. The Tuscaloosa Marine Shale is a time equivalent of the Lower Eagle Ford and comprises marine shales which were deposited in a shelfal paleoenvironment. However, studies showed that its organic enrichment happened later and coincided with a maximum flooding event [24,25]. The TMS overlies the transgressive fluvial-deltaic sand deposits of the Lower Tuscaloosa. These deposits include two basal sand units classified as “massive” sands and three other upper units which were characterized as “stringer” sands [26,27]. The Upper Tuscaloosa lies conformably on top of the Tuscaloosa Marine Shale and shows an increase in clastic sediment supply as a result of a regressive stage. The formation consists of interbedded sandstone, siltstone, and shale.
The boundary between the Tuscaloosa Marine Shale and Lower Tuscaloosa was used as a marker for regional correlation [17,28,29,30] due to a high resistivity zone (HRZ) present at the base of the marine shale. The HRZ marker shows resistivity values higher than 5 ohm-meters and aided Enomoto et al. (2017) [17] in estimating the apparent thickness of the Tuscaloosa Marine Shale in Louisiana and Mississippi. Authors showed that the shale is 500 ft thick in SW MS and about 400 ft thick east of the productive area. Moreover, Rouse et al. (2018) [30] demonstrated a significant north–south thickening of the Tuscaloosa Marine Shale with the help of a cross-section that extended north to south from Jefferson County, MS, to Saint Martin Parish, LA. However, the HRZ regional marker fades outside the productive area and there seems to be no direct correlation between TMS thickening and the thickening of the high resistivity zone.
The Tuscaloosa Marine Shale has extremely heterogenous mineralogy and organic content. Borrok et al. (2019) [4] used XRD data to conclude that the formation is comprised of 40–80% clay, 20–40% quartz, and less than 40% calcite. The total organic content (TOC) ranges from 0.14 to 4 wt% with a vitrinite reflectance of 0.6 to 1.3% [4,17]. In addition, the marine shale has a TVD of 11,000 to 14,000 ft, geo-pressure gradients of 0.5 to 0.75 psi/ft, permeabilities of 46 to 2990 nD, porosities of 3.86% to 9.86%, and shows mixed Type II–III kerogen [4,17,31].

2. Data and Methods

Well log and core data are used to assess the source and seal potential of the Tuscaloosa Marine Shale in SE Louisiana and SW Mississippi. Results of the SECARB project at the Cranfield field in Mississippi are compared to SE Louisiana data collected through the “Tuscaloosa Marine Shale Laboratory (TMSL)”, a Department of Energy (DOE)-funded project at the University of Louisiana at Lafayette.
Well log analysis is performed, and gamma-ray, resistivity, porosity, and sonic logs responses are compared in two wells. The first well is a former producing well located in East Feliciana Parish, LA, while the second one, Well CFU 31F-2, was used as an observation well during CO2 injection in SW Mississippi. The core data made available by SECARB and analyzed in this paper comprise X-Ray Diffraction (XRD) data for 15 samples ranging in depth from 10,170 ft to 10,197 ft and Mercury Intrusion Capillary Pressure (MICP) measurements for porosity and permeability. Core photos are also used to discuss the different facies present in the marine shale and fracture occurrence.
Source potential is analyzed based on previous studies and programmed pyrolysis data from both Louisiana and Mississippi. The Mississippi samples were released by the U.S. Geological Survey and their exact location is unknown, while TMSL samples were used to examine organic enrichment in a well in Louisiana. Differences in total organic content, thermal maturity, and migration trends in SE Louisiana and SW Mississippi are discussed and compared.

3. Analysis and Results

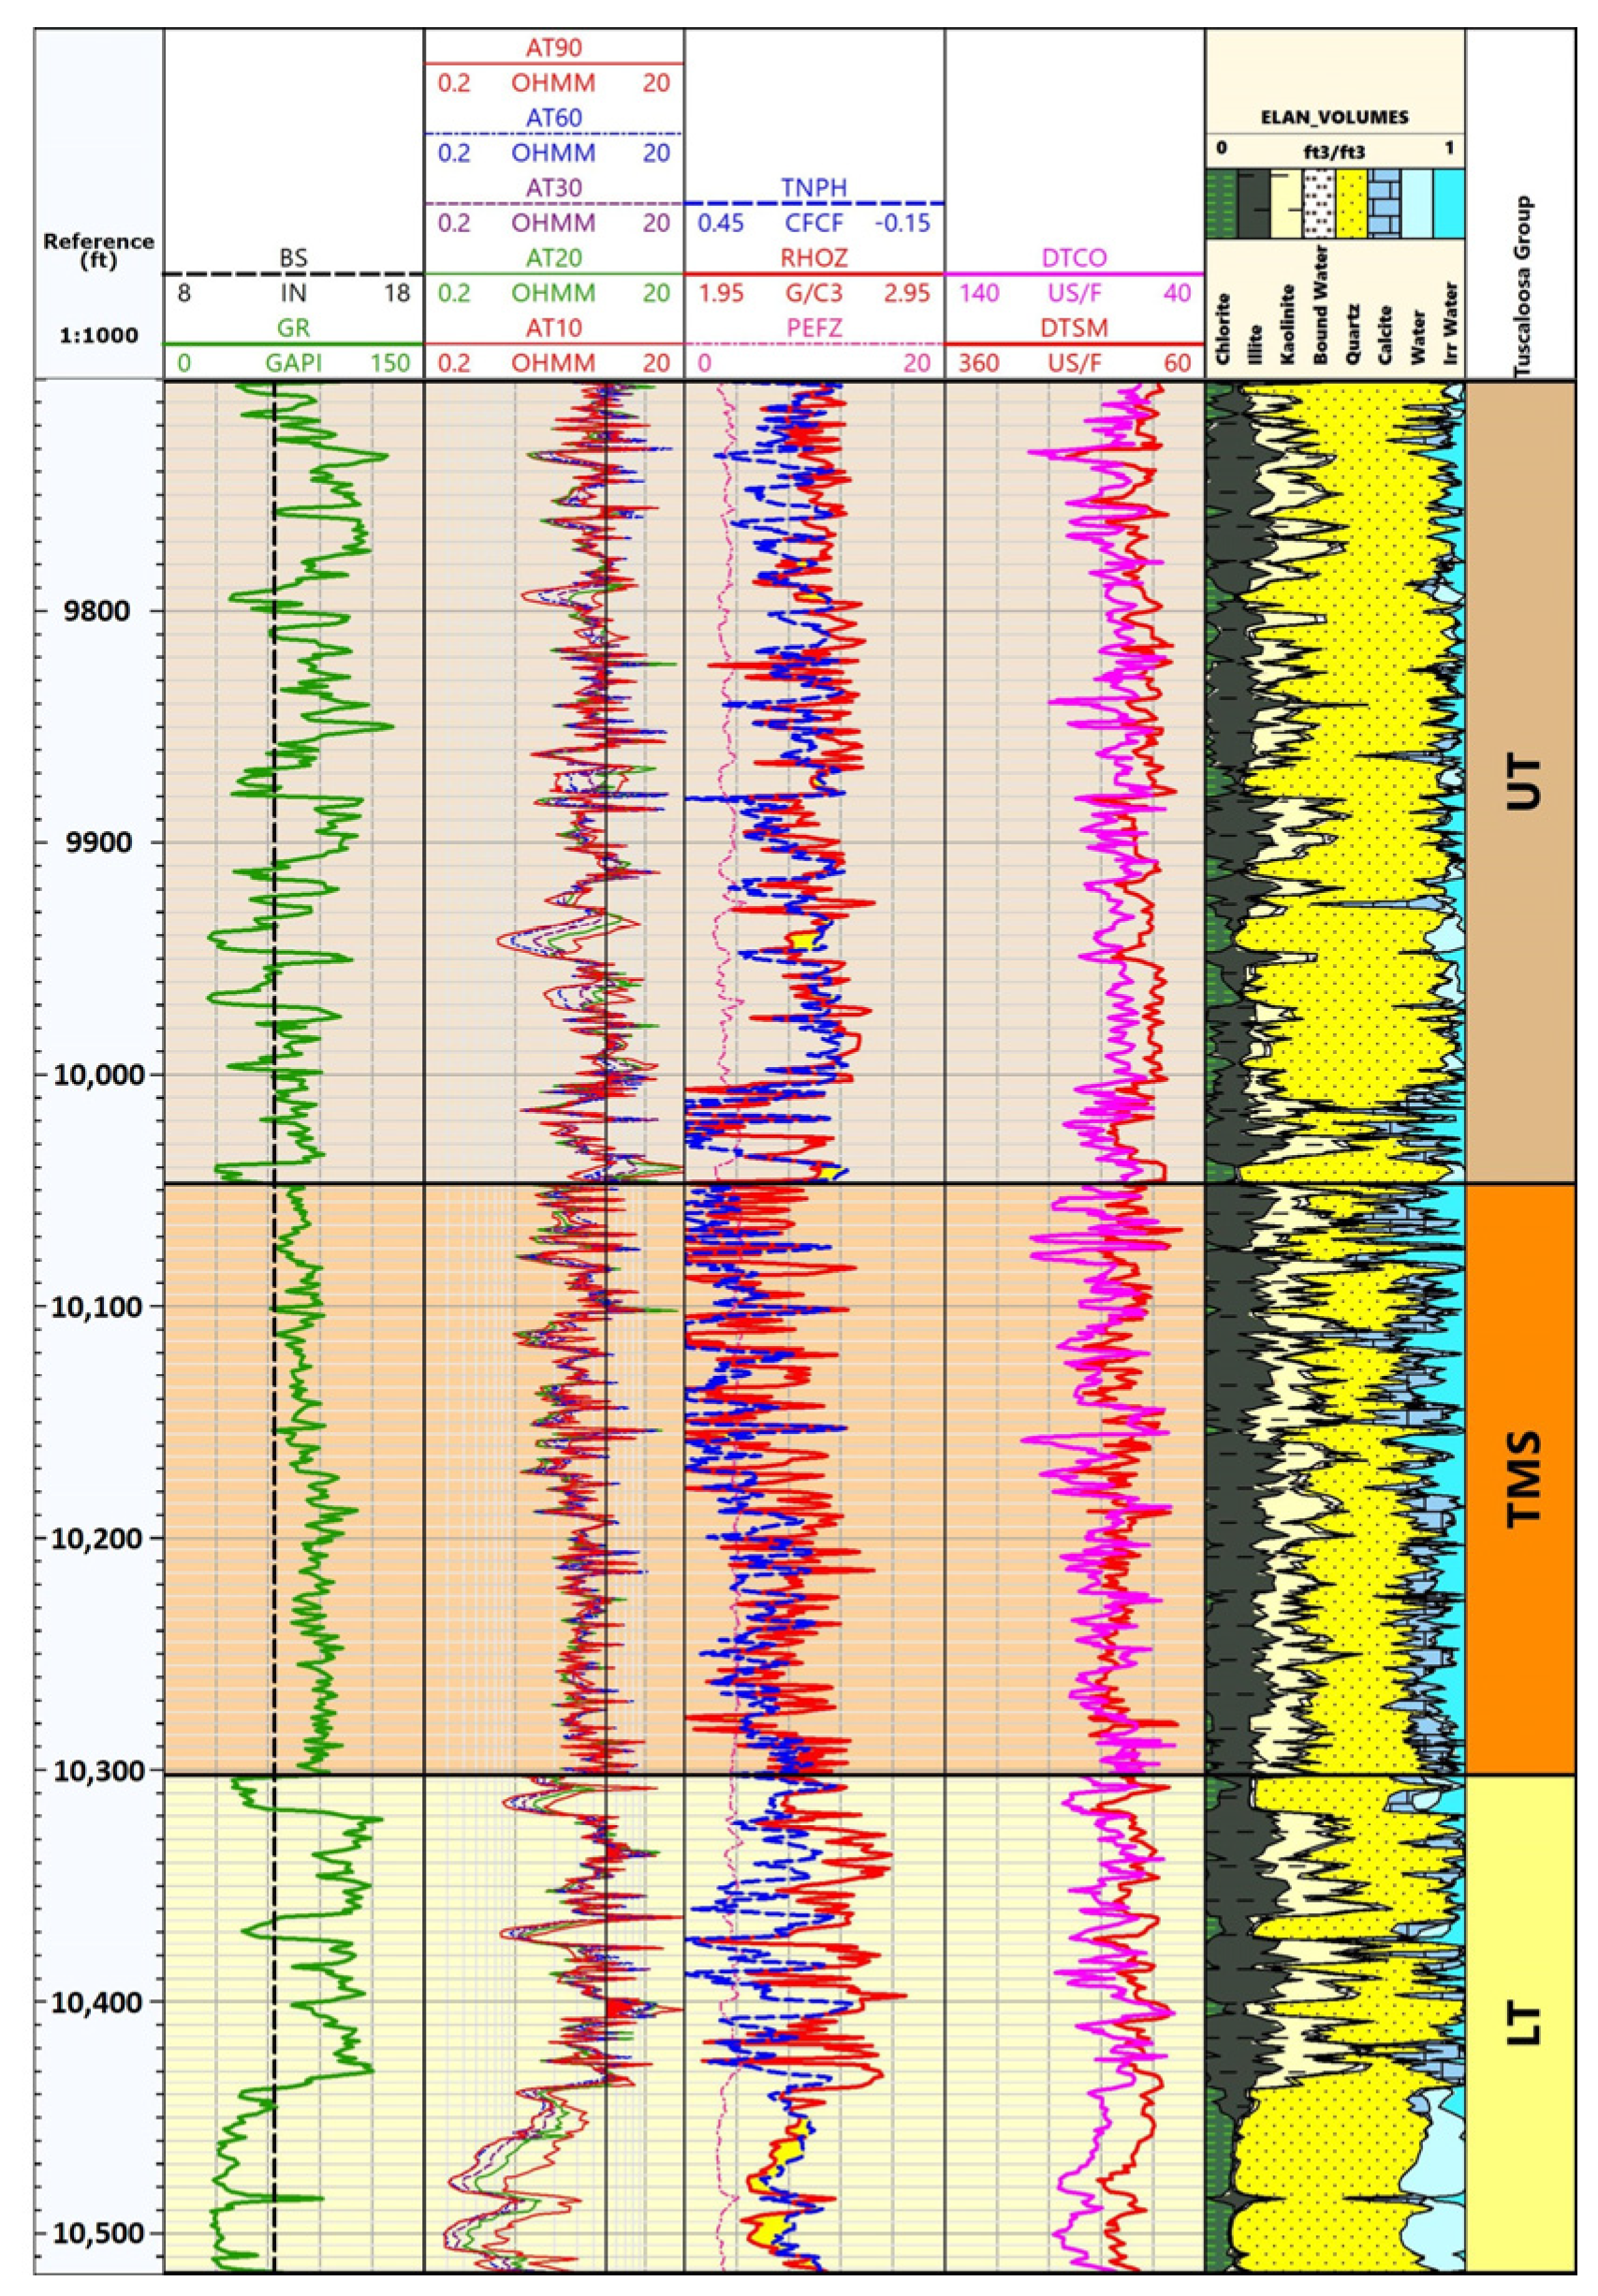
3.1. Well Log Analysis

In Figure 2 and Figure 3, gamma-ray and bit-size logs are displayed in the first track; resistivity measurements are shown in Track 2, while porosity and sonic logs are plotted in Tracks 3 and 4, respectively. Figure 2 shows the petrophysical character of the Tuscaloosa Group in a well from East Feliciana Parish, LA. The well log response in this well will be compared to the well log response obtained for Well CFU 31F-2 in SW MS. Gamma-ray and resistivity logs were used to delineate the Lower Tuscaloosa (LT), Tuscaloosa Marine Shale (TMS), and Upper Tuscaloosa (UT) formations. Both wells show zones with gamma-ray values characteristic to sandstone facies interbedded with thinner shale layers within the Lower Tuscaloosa interval. The density–neutron porosity crossover and the petrophysical model confirm the aquiferous character of the formation. While the Louisiana well shows an important increase in resistivity at the boundary between the Lower Tuscaloosa and the Tuscaloosa Marine Shale, no significant changes in resistivity are observed in the Cranfield well. In the first well, it appears that the high resistivity values (up to 15.5 ohm-meters) in the HRZ are related to either calcite or potential hydrocarbon occurrence. The second well shows very few values above the 5 ohm-meter baseline and seems to have fairly equal calcite concentrations throughout the Tuscaloosa Marine Shale interval. The boundary between the Lower Tuscaloosa and the TMS also shows a noticeable increase in the neutron porosity, compressional slowness, and shear slowness values. In the East Feliciana well, the limit between the Tuscaloosa Marine Shale and the Upper Tuscaloosa was picked at the transition from high to low resistivity values. Since no important resistivity changes are noticed in the second well, gamma-ray is used to select the top of the Tuscaloosa Marine Shale. In Well CFU 31F-2, the TMS is characterized by constant gamma-ray values of 77.5 GAPI in the top interval and about 90.5 GAPI in the bottom zone. Moreover, to ensure that the formation limits are accurately delineated, the boundaries are validated against the lithology changes observed in the cores available for the two wells.
For a quantitative formation evaluation with respect to lithology and fluids saturation, a petrophysical model with M components representing both solid and fluid volume fractions is defined and applied to the conventional well logs using a probabilistic approach. The theoretical response of the considered petrophysical model is used to compare the reconstructed logs to the original input logs with the help of the fitting errors. The iterative adjustment of the model with respect to its volume fractions is guided by the minimization of the error function E = E(V, σ) so as to obtain the best volumetric solution V for each depth interval. It can be observed that the petrophysical model utilized in both wells (Figure 2 and Figure 3–track 5) shows that the Tuscaloosa Marine Shale is mainly composed of clay minerals, such as chlorite, illite, and kaolinite, in addition to quartz and calcite. No hydrocarbons are utilized for the Cranfield well, since this well is located outside of the production area. It can be clearly noticed that the TMS displays a significant variation in the mineralogical content. Ahmadov and Mokhtari (2020) [19] confirmed elastic anisotropy presence in the formation through the study of the acoustic properties of the formation. In addition, in the first well, the marine shale is divided into a basal highly resistive zone and an upper non-resistive interval. The petrophysical model reveals that the non-resistive zone is composed of 34% clay minerals, 45% quartz, 8% calcite, and 1% pyrite, with the remaining percentage being attributed to the fluids and kerogen in the shale. The HRZ has around 33% clay minerals, 31% quartz, 22% calcite, and 1% pyrite. There is also an increase in the calcite concentration of up to 36% in the HRZ, which makes the rock more brittle and prone to natural fracture occurrence. No HRZ is present in the SW Mississippi well. Constant clay values of around 23% illite and 10% kaolinite are obtained, along with 45% quartz, and between 8% and15% calcite, the rest being represented by small amounts of chlorite and irreducible water.

3.2. XRD Data Analysis

XRD results published by SECARB (Table 1) were used to further analyze the mineralogy of the Tuscaloosa Marine Shale in Well CFU 31F-2. The data was also plotted and can be examined using the graph in Figure 4a. It can be observed that the minerals identified using XRD are quartz, K-feldspar, plagioclase (albite), clay minerals (illite and kaolinite), calcite, pyrite, and anatase. According to Lu et al. (2011) [6], illite, quartz, and kaolinite represent the main minerals encountered, and their combined concentrations range from 21 to 84%. Illite shows concentrations from 0 to 39%, while quartz and kaolinite have concentrations between 14 and 41% and 3 and 33%, respectively. Moreover, Lu et al. (2011) [6] were able to identify nine microfacies in the core acquired from Well CFU 31F-2 and concluded that quartz is the dominant mineral in the samples of very fine-grained sandstone, having concentrations of over 25%. Clay minerals are prevalent in the mudstone microfacies, with illite having percentages of over 32%, followed by kaolinite with concentrations higher than 25%. In addition, the samples of fine sandstone show quartz–feldspar combinations totaling about 61%. Calcite presence is associated with the coarser-grained sandstone samples, as well as with samples showing an important amount of fossiliferous material. In these samples, calcite can reach concentrations of up to 66.2%. Lu et al. (2011) [6] also concluded that calcite cement is present in the sandy layers.
An XRD analysis of the high resistivity zone in the Louisiana well (Figure 4b) shows that calcite is one of the major minerals, together with quartz and clay minerals. It can be observed that the sample collected at 13,847 ft has 79% calcite and only 11% quartz. The lowest calcite concentration is shown by a sample located in the top interval of the high resistivity zone. Quartz concentration varies from 10 to 41%, with average concentrations of 20% in the bottom interval of the HRZ. Clay minerals show concentrations between 3 and 63%, with illite, smectite, and kaolinite as dominant. Chlorite is also present throughout the TMS interval.

3.3. Porosity–Permeability Data Analysis

The porosity of the samples from the Louisiana well was estimated by determining the bulk volume of the sample and then crushing it to remove all pores. Permeability was derived from the decrease in system gas pressure using the fast pressure-decay method. MICP (Mercury Intrusion Capillary Pressure) data were collected for the Cranfield samples by injecting mercury into the samples [6].
The Cranfield samples show poor porosity with values between 0.33% and 4% and permeabilities ranging from 4 to 110 nD (Figure 5—data points in orange), which indicates the good sealing capacity of the formation [32]. It can be observed that there is an increase in permeability with increasing porosity, as concluded by Lu et al. (2011) [6]. In the Louisiana well (Figure 5–data points in blue), most permeabilities plot around the 100 nD value and there is not a distinct trend to conclude that the permeability increases with the porosity. In addition, the porosity has higher values in this well with values ranging from almost 1% to 9.3% and an average of 5.73%. It is important to reiterate that the Tuscaloosa Marine Shale interval in the Cranfield field is used as a sealing layer and that low permeability and porosity values are crucial to prevent CO2 leakage. On the other hand, the East Feliciana well is located in the producing area of the marine shale, and higher porosity values can help in the extraction of the hydrocarbons stored in the formation. This is also in good agreement with the study conducted by Nicot and Duncan (2012) [8], who concluded that the Tuscaloosa Marine Shale has good caprock potential in SW Mississippi, but can present oil resources farther south, closer to the Gulf Coast.
Lu et al. (2011) [6] explained that the Cranfield sandstone samples exhibit lower porosities than the mudstone samples. However, highly burrowed sandstones show higher permeabilities than the other sandstone samples, but still lower than the typical sandstone values. Their analysis showed that silty mudstones have the highest permeability and porosity values. In addition, Ezeakacha et al. (2020) [33] demonstrated that there is no clear porosity–depth relationship in the Tuscaloosa Marine Shale, but changes in porosity could be the result of mineralogical variation in the formation. The authors showed that laminations with a high quartz content are associated with an increase in porosity, while poor porosity is caused by high proportions of clay and calcite. Ezeakacha et al. (2020) [33] obtained an average porosity of 5.75% for 9 wells in the core producing area of the marine shale, which is comparable to the average porosity value (5.73%) obtained for the LA well. The TMS at the East Feliciana location has good reservoir capacity, while the shale formation at the Cranfield field presents poor porosity and permeability. This further shows that the Tuscaloosa Marine Shale in SW Mississippi might have promising seal potential, which is in good agreement with the results obtained as part of the SECARB Cranfield Project [6] and by Lohr and Hackley (2018) [32].

3.4. Organic Enrichment in the Tuscaloosa Marine Shale

While the organic enrichment of the Tuscaloosa Marine Shale took place during a major flooding event, previous studies suggest that the marine shale has a varying total organic content throughout the play and may have reached thermal maturity only in certain areas. Sassen (1990) [34] performed programmed pyrolysis to demonstrate that northernmost samples from Mississippi have very low TOC values and concluded that there appears to be a southward increase in the source potential of the Tuscaloosa Marine Shale. In agreement with Koons et al. (1974) [1], Sassen (1990) [34] argues that SW Mississippi samples show oxidized type III kerogen, while the transition to the type II/III kerogen occurs southward, towards the Mississippi/Louisiana border. The marine shale is thermally mature to marginally mature in SW MS and reaches thermal maturity in south-central Louisiana. The LA samples examined by Sassen (1990) [34] have a mean Tmax of 491 °C, and agree with results previously published by Smith (1985) [2].
In addition, the samples in south-central Louisiana show lower OI values of around 9 mg CO2/g TOC which can be associated with an anoxic depositional environment and suggest a deepening of the depositional environment from north to south. However, more recent studies [4,17] showed that the total organic content of the TMS ranges from 0.14 to 4 wt% for samples from both Louisiana and Mississippi, which indicates possible differences in the TMS depositional environment that did not allow further organic enrichment. For example, Allen et al. (2014) [29] argue that the lower TOC values of the shale are the result of a well-oxygenated open marine, middle-to-distal shelf environment. It is known that major shales, such as Bakken, Marcellus, or Barnett, were deposited in deep anoxic environments.
USGS made available the pyrolysis data for three samples from the Cranfield field (Table 2). TOC values of 0.88, 0.88, and 0.85 wt%, respectively, were estimated for the samples. The kerogen in the samples appears to be mature and shows Tmax values of 440, 439, and 440 °C, respectively. The thermal maturity of the samples is in good agreement with the vitrinite reflectance values (Ro,1 = 0.89, Ro,2 = 0.98, and Ro,3 = 1.14 %). The kerogen was classified as either Type I or Type I/II, and there is a fair to good potential for the generation of liquid hydrocarbons. The first two samples show higher H to C ratios and lower (Oxygen Indices) OI, which agrees with the kerogen classification and indicates that the Tuscaloosa Marine Shale in SW Mississippi was deposited in a shallow marine environment. According to Hart (2016) [35]’s conceptual facies model, proximal mudstones are expected to have low TOC contents due to the freshwater and sediment input interfering with the organic matter accumulation.
On the other hand, the 60 programmed pyrolysis samples from a well in Louisiana are characterized by higher TOC values (min = 0.11 wt% and max = 2.8 wt%) and have reached advanced thermal maturity (Table 3). No vitrinite reflectance data were available, but samples show a mean Tmax of 448 °C and fall within the oil zone with Oil Production Indices (OPI) between 0.21 and 0.73. The East Feliciana samples have lower oxygen to carbon ratios (mean OI = 19) and more significant hydrogen contents (mean HI = 156 and max HI = 235) than the Mississippi samples, which confirms the southward deepening of the depositional environment and agrees with previous research conducted by Koons et al. (1974) [1] and Sassen (1990) [34]. The Tuscaloosa Marine Shale in central and SE Louisiana was deposited in a distal shelf environment and with less oxygen compared to the SW Mississippi depositional environment.

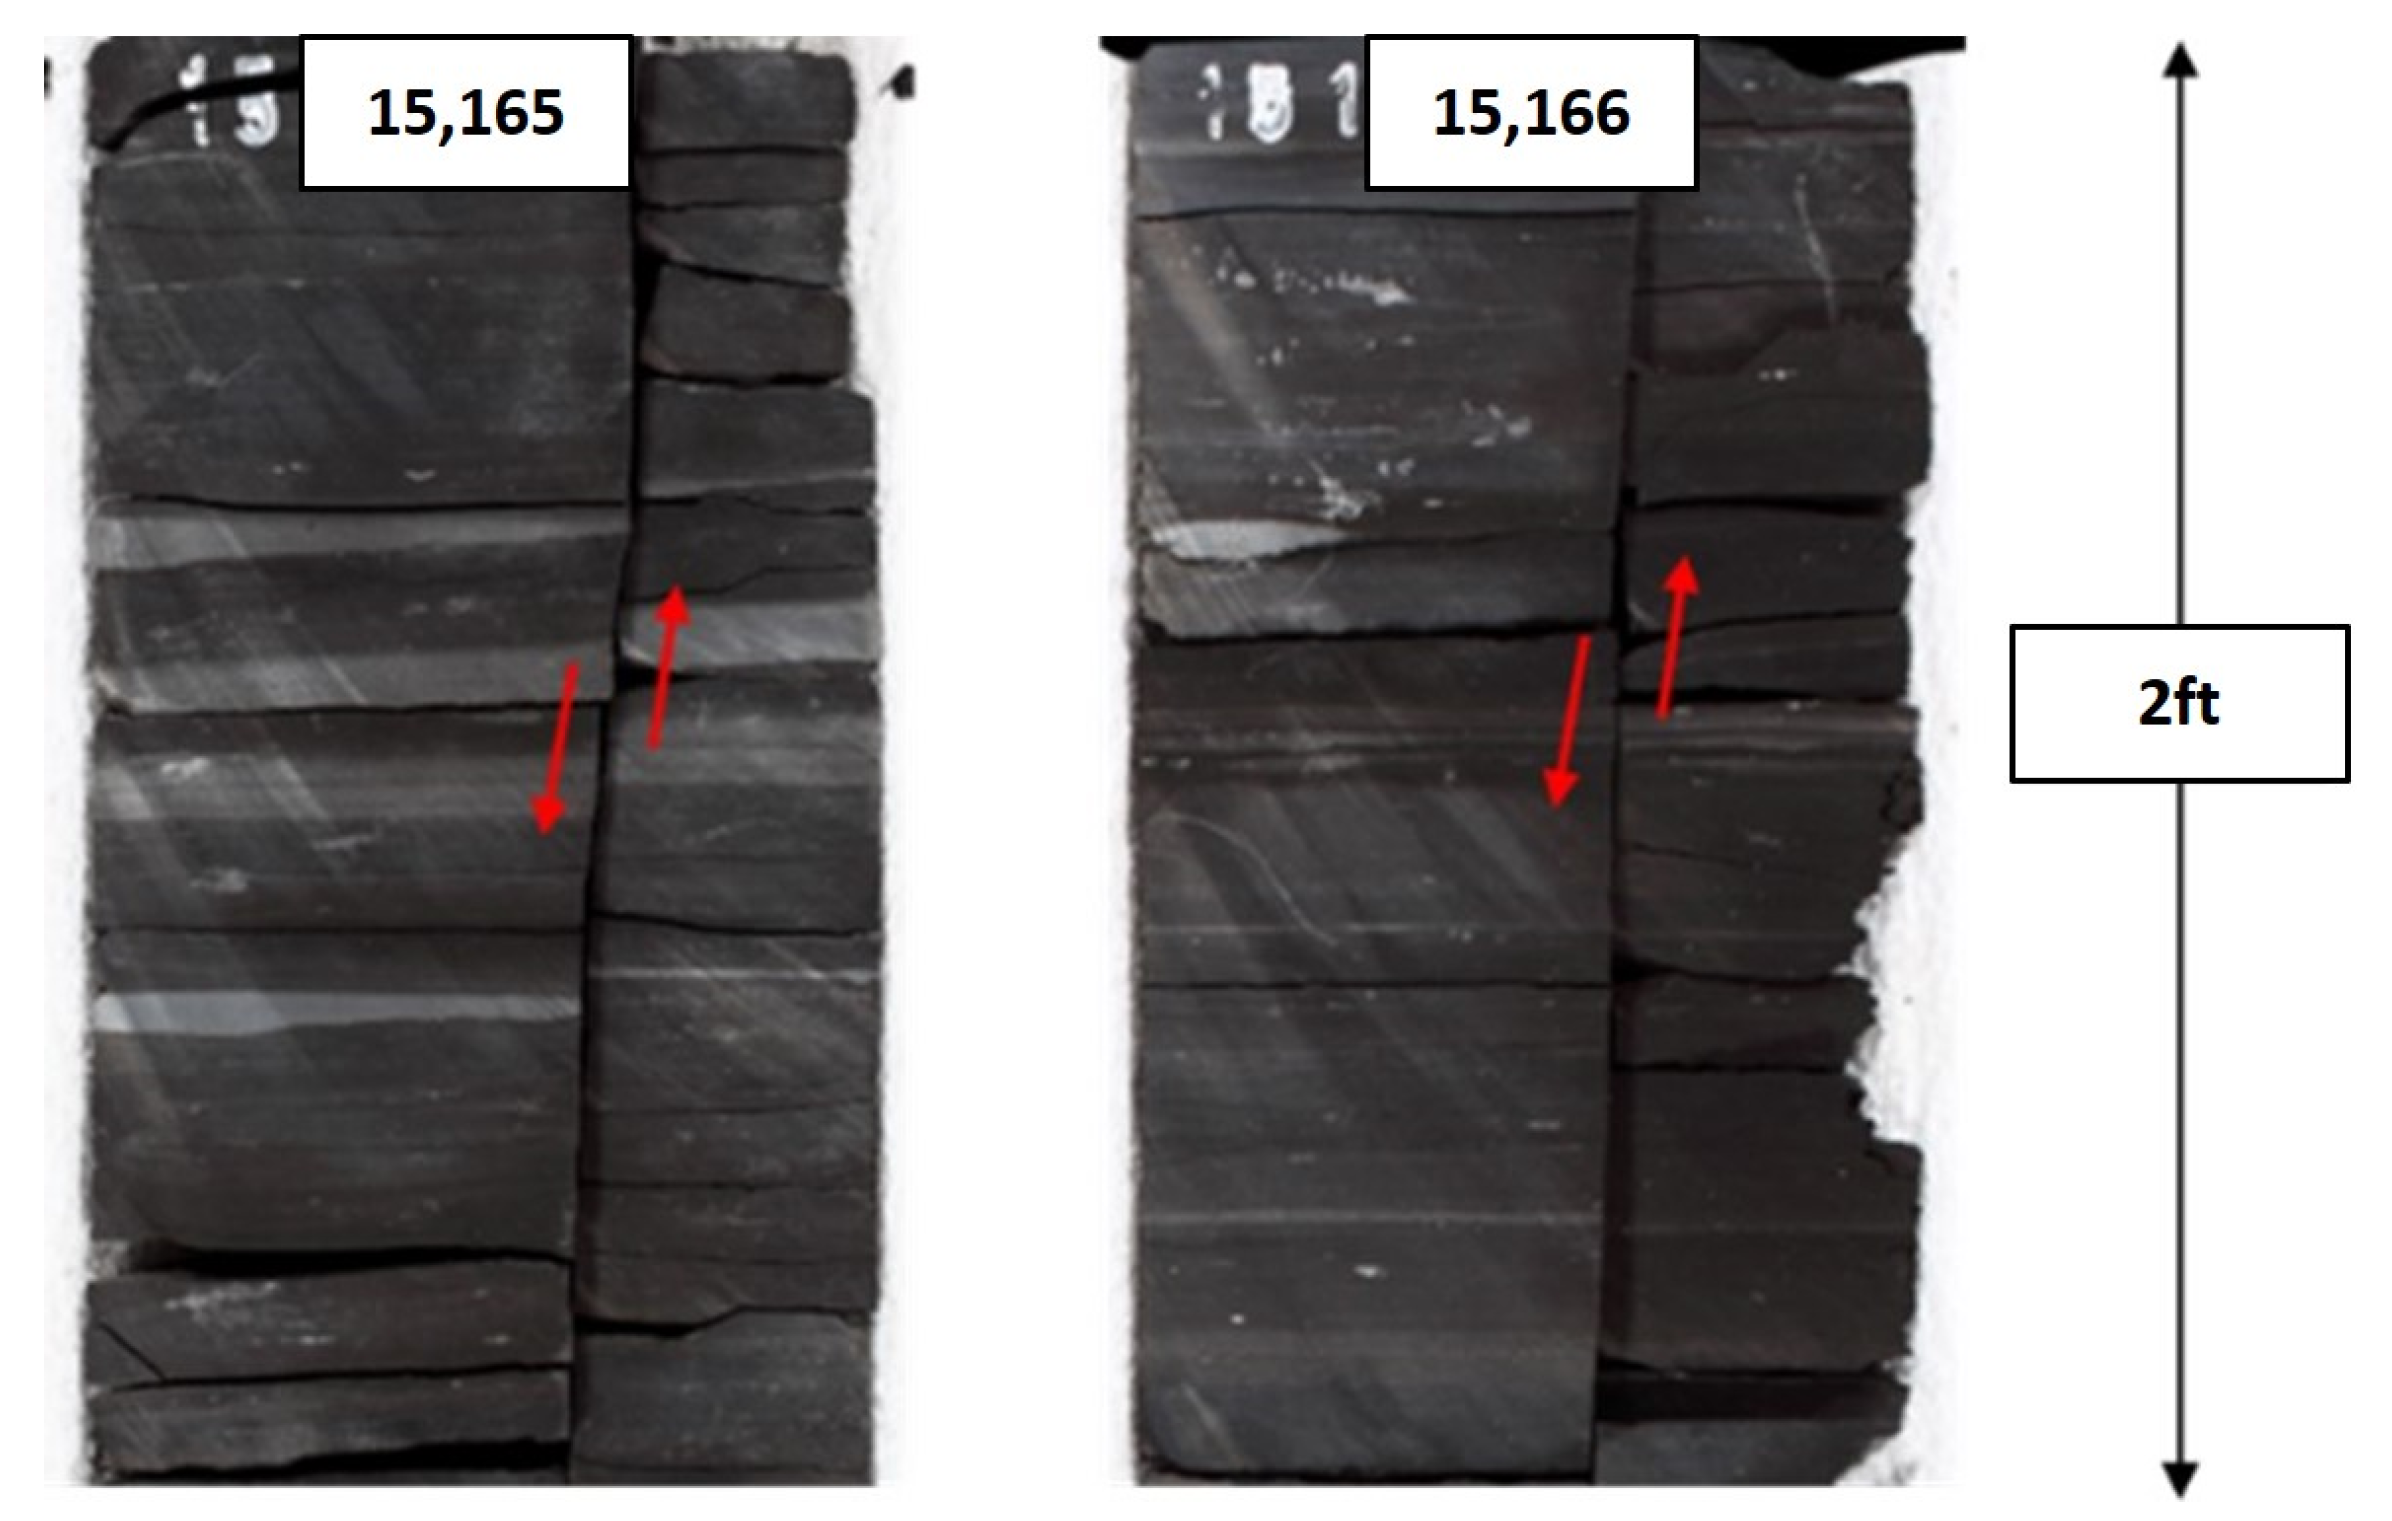
3.5. Fracture Occurrence in the Tuscaloosa Marine Shale

The petrophysical model used to estimate the mineralogical content of the Tuscaloosa Marine Shale and the XRD results confirm calcite presence throughout the TMS interval. Calcite acts as a cement in both analyzed wells, however, in the East Feliciana well, the base of the formation is characterized by a significant increase in the calcite content, which makes the rock more brittle and prone to fracturing. While Lu et al. (2011) [6] identified nine different facies in the core acquired from Well CFU 31F-2, from fossil-bearing mudstone or silt-bearing mudstone to very fine-grained sandstone with fossils, none of these facies were characterized by fracture presence. On the other hand, in the Louisiana well, the transition from the quartz-dominated grain framework in the less-resistive upper section of the formation to the calcite-filled intergranular pores in the high resistivity zone (HRZ) is associated with an increase in the number of fractures. Core analysis revealed that high-angle extension fractures are the predominant fractures in the Tuscaloosa Marine Shale. Figure 6 shows an example of a near-vertical natural fracture in a core retrieved from the well located in East Feliciana. The analyzed fracture has a height of at least four feet, and calcite mineralization can be observed on the walls of the fracture. The hydraulic fracturing design should account for the interaction between the natural fractures in the formation and the new hydraulic fractures through fracture length optimization [36]. In addition, to control fracture size, the fracture toughness of the formation should be measured [37].
Moreover, fault occurrence was noticed in another well from the producing zone (Figure 7). Faults can considerably reduce the sealing capacity of the formation since they can serve as high permeability pathways for gas or fluid flow. On the other hand, fault occurrence in a reservoir is beneficial and can further improve oil recovery, while fracture and fault presence in source rocks can facilitate hydrocarbon migration to the more porous neighboring formations. The natural fractures in the Tuscaloosa Group are viewed as hydrocarbons paths between the TMS and the lower Tuscaloosa sands.
Therefore, the natural fracture network and the last 20 years’ hydraulic fracturing history of a formation should be carefully studied in a CCUS project. This is because caprock integrity may have been seriously damaged in places where extensive hydraulic fracturing was conducted. This study shows that fractures are crucial no matter the role played by the Tuscaloosa Marine Shale. Since no fractures were observed in the TMS interval at Cranfield, it is understandable why this location was selected for CO2 sequestration. On the other hand, natural fracture presence in the wells located within the producing zone helps improve oil rates in the early stages of production but also has an altering effect on the sealing capacity of the formation. Moreover, due to the multi-stage fracturing performed in the core area, the TMS interval here presents a high leakage risk for CO2 sequestration projects.

4. Conclusions

The Tuscaloosa Marine Shale interval in SE Louisiana is mainly composed of quartz (10–41%), clay minerals (3–63%), and up to 79% calcite. The XRD data build upon the output of the petrophysical model and confirm that the base of the Tuscaloosa Marine Shale in SE Louisiana is more brittle and prone to fracturing. In addition, near-vertical extension natural fractures were identified in the East Feliciana well. These fractures observed in the Louisiana part of the shale play can improve hydrocarbon recovery or even serve as migration paths for the movable hydrocarbons in the formation. In terms of porosity and permeability values, Louisiana samples display good porosities of up to 9.3% and permeabilities of around 100 nD, which contribute to the reservoir potential of the marine shale. Alternatively, the amount of organic matter in the formation and its thermal maturity can show how good of a source rock the shale can be. The East Feliciana samples show a TOC of up to 2.8 wt% and low oxygen indices, which indicates that the Tuscaloosa Marine Shale interval at this location was deposited in a deeper marine environment with less oxygen and is mature enough to produce hydrocarbons.
On the other hand, the Tuscaloosa Marine Shale at the Cranfield field appears to have a less complex mineralogical content with illite, quartz, and kaolinite as the most important constituents. Calcite is also present in the coarser samples from the MS well, but there are no significant spikes in the resistivity response of the well logs due to the overall moderate calcite percentage. Moreover, the mineralogical composition of the TMS interval in SW Mississippi seems to prevent fracture development, which leads to an unfractured shale formation with good sealing capacity at this location. In addition, the results of the porosity-permeability analysis are in good agreement and confirm that porosities range from 0.33% to 4%, while permeabilities show values between 4 to 110 nD. Conversely, the Tuscaloosa Marine Shale formation at the Cranfield field, MS has reduced source potential with average TOC values of only 0.88 wt%.
This shows that the Tuscaloosa Marine Shale is a versatile formation able to act as a source, reservoir, or seal. However, the analysis undergone in this paper revealed that its heterogeneous character and lateral changes affect its capacity to play all roles at the studied locations. The well log analysis confirmed that there are important petrophysical differences between a well in Mississippi and another one located in East Feliciana, LA. The Louisiana well located within the TMS producing zone presents a significant high resistivity zone (HRZ), possibly associated with hydrocarbon presence, and exhibits good reservoir capacity due to the increased average porosity (5.73%). Contrastingly, the Tuscaloosa Marine Shale interval in SW Mississippi has poor porosity and permeability, which indicates the possibly promising seal potential of the formation at the studied location. In addition to the porosity and permeability analysis, fracture occurrence in the TMS was also addressed and revealed that the sealing capacity of the formation can be negatively impacted by the fractures and the faults in the formation. Regarding the source potential of the Tuscaloosa Marine Shale, the data analyzed in this paper show that there is a southward increase in TMS’s total organic content (TOC) and thermal maturity, which is in good agreement with previous studies. Therefore, the Tuscaloosa Marine Shale interval analyzed in SE Louisiana shows good reservoir and source potential, while the TMS formation at the Cranfield field has promising seal capacity. The paper contributes to the enrichment of the currently small amount of knowledge published about the Tuscaloosa Marine Shale and establishes a set of petrophysical criteria to explore the potential of the formation. Moreover, the proposed framework represents a step towards identifying long-term carbon sequestration sites and ensuring seal formation integrity through an integrated analysis of intrinsic rock properties. Authors recommend further study to confirm the role of the marine shale at additional locations.

Author Contributions

Data collection, interpretation, writing, manuscript preparation, C.M.R.; innovation, idea generation, funding acquisition, project initiation and supervision, M.M.; literature review, writing, L.Y. All authors have read and agreed to the published version of the manuscript.

Funding

This research was funded by the Department of Energy National Energy Technology Laboratory under award no. DEFE0031575 (Tuscaloosa Marine Shale Laboratory).

Institutional Review Board Statement

Not applicable.

Informed Consent Statement

Not applicable.

Data Availability Statement

Not applicable.

Acknowledgments

The authors would like to acknowledge the efforts undergone by the Southeast Regional Carbon Sequestration Partnership (SECARB) and thank them for making available to the general public the CO2 data used in this paper. We also wish to acknowledge Goodrich Petroleum Corporation for providing the data for the well located in East Feliciana, LA.

Conflicts of Interest

The authors declare no conflict of interest.

References

  1. Koons, C.B.; Bond, J.G.; Peirce, F.L. Effects of depositional environment and postdepositional history on chemical composition of Lower Tuscaloosa oils. AAPG Bull. 1974, 58, 1272–1280. [Google Scholar]
  2. Smith, G.W. Decade of Exploration in Deep Lower Tuscaloosa Gas Trend in Southern Louisiana. AAPG Bull. 1985, 69, 308. [Google Scholar]
  3. Walters, C.C.; Dusang, D.D. Source and thermal history of oils from Lockhart Crossing, Livingston Parish, Louisiana. Trans. Gulf Coast Assoc. Geol. Soc. 1988, 38, 37–44. [Google Scholar]
  4. Borrok, D.M.; Yang, W.; Wei, M.; Mokhtari, M. Heterogeneity of the mineralogy and organic content of the Tuscaloosa Marine Shale. Mar. Pet. Geol. 2019, 109, 717–731. [Google Scholar] [CrossRef]
  5. Hovorka, S.D.; Meckel, T.A.; Trevino, R.H.; Lu, J.; Nicot, J.P.; Choi, J.W.; Freeman, D.; Cook, P.; Daley, T.M.; Ajo-Franklin, J.B.; et al. Monitoring a large volume CO2 injection: Year two results from SECARB project at Denbury’s Cranfield, Mississippi, USA. Energy Procedia 2011, 4, 3478–3485. [Google Scholar] [CrossRef] [Green Version]
  6. Lu, J.; Milliken, K.; Reed, R.M.; Hovorka, S. Diagenesis and sealing capacity of the middle Tuscaloosa mudstone at the Cranfield carbon dioxide injection site, Mississippi, USA. Environ. Geosci. 2011, 18, 35–53. [Google Scholar] [CrossRef]
  7. Elliot, T.R.; Celia, M.A. Potential Restrictions for CO2 Sequestration Sites Due to Shale and Tight Gas Production. Environ. Sci. Technol. 2012, 46, 4223–4227. [Google Scholar] [CrossRef]
  8. Nicot, J.-P.; Duncan, I.J. Common attributes of hydraulically fractured oil and gas production and CO2 geological sequestration. Greenh. Gas. Sci. Technol. 2012, 2, 352–368. [Google Scholar] [CrossRef]
  9. Katsube, T.J.; Williamson, M.A. Effects of diagenesis on shale nano-pore structure and implications for sealing capacity. Clay Miner. 1994, 29, 451–461. [Google Scholar] [CrossRef]
  10. Bolton, A.J.; Maltman, A.J.; Fisher, Q. Anisotropic permeability and bimodal pore-size distributions of fine-grained marine sediments. Mar. Pet. Geol. 2000, 17, 657–672. [Google Scholar] [CrossRef]
  11. Trujillo, N.; Rose-Coss, D.; Heath, J.E.; Dewers, T.A.; Ampomah, W.; Mozley, P.S.; Cather, M. Multiscale Assessment of Caprock Integrity for Geologic Carbon Storage in the Pennsylvanian Farnsworth Unit, Texas, USA. Energies 2021, 14, 5824. [Google Scholar] [CrossRef]
  12. Jahanbakhsh, A.; Liu, Q.; Hadi Mosleh, M.; Agrawal, H.; Farooqui, N.M.; Buckman, J.; Recasens, M.; Maroto-Valer, M.; Korre, A.; Durucan, S. An Investigation into CO2–Brine–Cement–Reservoir Rock Interactions for Wellbore Integrity in CO2 Geological Storage. Energies 2021, 14, 5033. [Google Scholar] [CrossRef]
  13. Fais, S.; Casula, G.; Cuccuru, F.; Ligas, P.; Bianchi, M.G.; Plaisant, A.; Pettinau, A. A Contribution to the Geological Characterization of a Potential Caprock-Reservoir System in the Sulcis Coal Basin (South-Western Sardinia). Energies 2019, 12, 4524. [Google Scholar] [CrossRef] [Green Version]
  14. Hadian, P.; Rezaee, R. The Effect of Supercritical CO2 on Shaly Caprocks. Energies 2020, 13, 149. [Google Scholar] [CrossRef] [Green Version]
  15. Lohr, C.D.; Hackley, P.C.; Valentine, B.J.; Enomoto, C.B. Thermal gradient trends in the Tuscaloosa Marine Shale play area: Preliminary results from studies to support oil and natural gas resources assessments. Gulf Coast Assoc. Geol. Soc. Trans. 2016, 66, 1099–1108. [Google Scholar]
  16. Hackley, P.C.; Enomoto, C.B.; Valentine, B.J.; Rouse, W.A.; Lohr, C.D.; Dulong, F.T.; Hatcherian, J.J.; Brennan, S.T.; Craddock, W.H.; Finn, T.M.; et al. Assessment of Undiscovered Continuous Oil and Gas Resources in the Upper Cretaceous Tuscaloosa Marine Shale of the U.S. Gulf Coast, 2018, Fact Sheet 2018–3043; U.S. Geological Survey: Reston, VA, USA, 2018; Volume 2. [CrossRef] [Green Version]
  17. Enomoto, C.B.; Hackley, P.C.; Valentine, B.J.; Rouse, W.A.; Dulong, F.T.; Lohr, C.D.; Hatcherian, J.J. Geologic characterization of the hydrocarbon resource potential of the Upper Cretaceous Tuscaloosa marine shale in Mississippi and Louisiana, USA. Gulf Coast Assoc. Geol. Soc. Trans. 2017, 67, 95–110. [Google Scholar]
  18. Shaibu, R.; Guo, B.; Wortman, P.B.; Lee, J. Stress-sensitivity of fracture conductivity of Tuscaloosa Marine Shale cores. J. Pet. Sci. Eng. 2022, 210, 110042. [Google Scholar] [CrossRef]
  19. Ahmadov, J.; Mokhtari, M. Experimental evaluation of ultrasonic velocities and anisotropy in the Tuscaloosa Marine Shale Formation. Interpretation 2020, 8, SL113–SL125. [Google Scholar] [CrossRef]
  20. Ruse, C.M.; Mokhtari, M. Characterization of elastic mechanical properties of Tuscaloosa Marine Shale from well logs using the vertical transversely isotropic model. Interpretation 2020, 8, T1023–T1036. [Google Scholar] [CrossRef]
  21. Ruse, C.M.; Ahmadov, J.; Liu, N.; Mokhtari, M. An Integrated Analytics and Machine Learning Solution for Predicting the Anisotropic Static Geomechanical Properties of the Tuscaloosa Marine Shale. In Proceedings of the SPE/AAPG/SEG Unconventional Resources Technology Conference, Austin, TX, USA, 20–22 July 2020. [Google Scholar] [CrossRef]
  22. Mlella, M.; Ma, M.; Zhang, R.; Mokhtari, M. Machine learning for geophysical characterization of brittleness: Tuscaloosa Marine Shale case study. Interpretation 2020, 8, T589–T597. [Google Scholar] [CrossRef]
  23. Spooner, H.V., Jr. Basal Tuscaloosa sediments, east-central Louisiana. AAPG Bull. 1964, 48, 1–21. [Google Scholar]
  24. Lowery, C.M.; Cunningham, R.; Barrie, C.D.; Bralower, T.; Snedden, J.W. The northern Gulf of Mexico during OAE2 and the relationship between water depth and black shale development. Paleoceanography 2017, 32, 1316–1335. [Google Scholar] [CrossRef] [Green Version]
  25. Snedden, J.W.; Galloway, W.E. The Gulf of Mexico Sedimentary Basin: Depositional Evolution and Petroleum Applications; Cambridge University Press: Cambridge, UK, 2019. [Google Scholar]
  26. Frascogna, X.M. Mesozoic-Paleozoic producing areas of Mississippi and Alabama: Jackson, MS. Miss. Geol. Soc. 1957, 1, 139. [Google Scholar]
  27. Lu, J.; Kordi, M.; Hovorka, S.D.; Meckel, T.A.; Christopher, C.A. Reservoir characterization and complications for trapping mechanisms at Cranfield CO2 injection site. Int. J. Greenh. Gas Control 2013, 18, 361–374. [Google Scholar] [CrossRef]
  28. Werren, E.G.; Shew, R.D.; Adams, E.R.; Stancliffe, R.J. Meander-belt reservoir geology, mid-dip Tuscaloosa, Little Creek field, Mississippi. In Sandstone Petroleum Reservoirs; Springer: New York, NY, USA, 1990; pp. 85–107. [Google Scholar]
  29. Allen, J.E., Jr.; Meylan, M.A.; Heitmuller, F.T. Determining hydrocarbon distribution using resistivity, Tuscaloosa Marine Shale, southwestern Mississippi. Gulf Coast Assoc. Geol. Soc. Trans. 2014, 64, 41–57. [Google Scholar]
  30. Rouse, W.A.; Enomoto, C.B.; Gianoutsos, N.J. Correlation of the Tuscaloosa marine shale in Mississippi, Louisiana, and East Texas, USA. Gulf Coast Assoc. Geol. Soc. Trans. 2018, 68, 461–475. [Google Scholar]
  31. John, C.J.; Jones, B.L.; Moncrief, J.E.; Bourgeois, R.; Harder, B.J. An unproven unconventional seven billion barrel oil resource—The Tuscaloosa Marine Shale. BRI Bull. 1997, 7, 1–22. [Google Scholar]
  32. Lohr, C.D.; Hackley, P.C. Using mercury injection pressure analyses to estimate sealing capacity of the Tuscaloosa marine shale in Mississippi, USA: Implications for carbon dioxide sequestration. Int. J. Greenh. Gas Control 2018, 78, 375–387. [Google Scholar] [CrossRef]
  33. Ezeakacha, C.P.; Mokhtari, M.; Ben Hmida, J. Evaluation of Porosity in Liquid-Rich Tuscaloosa Marine Shale. In Proceedings of the SPE/AAPG/SEG Unconventional Resources Technology Conference, Online, 20–22 July 2020. [Google Scholar] [CrossRef]
  34. Sassen, R. Lower Tertiary and Upper Cretaceous source rocks in Louisiana and Mississippi: Implications to Gulf of Mexico crude oil. AAPG Bull. 1990, 74, 857–878. [Google Scholar]
  35. Hart, B.S. Marine mudstone source rocks in epicontinental basins: Development of a conceptual facies model and application to Cenomanian/Turonian mudstones of the Cretaceous Western Interior Seaway. In Hydrocarbon Source Rocks in Unconventional Plays, Rocky Mountain Region; Dolan, M., Higley, D., Lillis, P., Eds.; Rocky Mountain Association of Geology Sp.Pub.: Denver, CO, USA, 2016; pp. 1–58. Available online: https://www.rmag.org/index.php?src=directory&srctype=detail&refno=4098&view=products&submenu=cart&back=products&id=4098 (accessed on 13 February 2022).
  36. Fu, C.; Guo, B.; Mokhtari, A. Quantitative analysis of the sequential initiation and simultaneous propagation of multiple fractures in shale gas/oil formations. J. Pet. Sci. Technol. 2021, 200, 108272. [Google Scholar] [CrossRef]
  37. Kramarov, V.; Parrikar, P.N.; Mokhtari, M. Evaluation of Fracture Toughness of Sandstone and Shale Using Digital Image Correlation. Rock Mech. Rock Eng. 2020, 53, 4231–4250. [Google Scholar] [CrossRef]
Figure 1. Map showing TMS’ extent in Louisiana and Mississippi, its core hydrocarbon-producing area, and the location of the wells studied.
Energies 15 03417 g001
Figure 2. Type log of the Tuscaloosa Marine Shale in a well in the East Feliciana Parish, LA.
Energies 15 03417 g002
Figure 3. Type log of Well CFU 31F-2 in Cranfield field, MS.
Energies 15 03417 g003
Figure 4. Whole-rock XRD mineralogy for: (a) Well CFU 31F-2 in Cranfield field, MS, and (b) a well in the East Feliciana Parish, LA.
Energies 15 03417 g004
Figure 5. Plot showing permeability versus porosity estimates for samples acquired from a well in the East Feliciana Parish, LA (data points in blue), and Well CFU 31F-2 in Cranfield field, MS (data points in orange).
Energies 15 03417 g005
Figure 6. Example of a near-vertical extension fracture in a slab core retrieved from the East Feliciana well. The fracture extends from the bottom of the third row through the next two rows and out of the core, having a height of at least four feet. No vertical fracture terminations are identified, as the fracture cuts indiscriminately across the shale layers. Calcite mineralization is observed on the walls of the fracture. Red arrows indicate the location of the fracture.
Energies 15 03417 g006
Figure 7. Example of a possible dip-slip (normal) fault in the Tuscaloosa Marine Shale, where the left compartment is moving downward relative to the compartment above the fracture. The direction of the movement of the fault is indicated using red arrows.
Energies 15 03417 g007
Table 1. Whole-rock XRD mineralogy results for Well CFU 31F-2 in Cranfield field, MS. Adapted from Lu et al. (2011) [6].
Depth (ft)QuartzK-feldsparAlbiteIlliteKaoliniteAnastasePyriteCalcite
110,170.629.2512.873.6925.3022.380.903.442.23
210,171.3615.069.600.5532.1030.051.006.285.36
310,173.3914.027.581.4736.1032.511.205.201.97
410,178.6416.307.901.8739.3028.841.304.300.30
510,179.7918.247.103.0338.3027.191.303.861.00
610,180.6436.409.409.804.7013.102.001.4023.30
710,181.8216.305.506.000.004.900.500.7066.20
810,183.623.9013.806.8014.9017.871.202.1619.50
910,185.9916.207.501.9035.5030.661.504.742.00
1010,188.1916.108.201.7035.1030.201.705.032.10
1110,189.516.408.401.7036.9028.931.803.942.00
1210,191.8616.807.903.8013.0015.001.103.6538.70
1310,192.8214.209.701.7033.9030.161.206.962.20
1410,194.9529.3014.0010.404.002.910.601.1937.50
1510,196.125.209.203.3037.9010.363.109.131.90
Table 2. Programmed pyrolysis results for samples acquired from a well located in the Cranfield field (USGS).
TOC (wt%)S1
(mg HC/g Rock)
S2
(mg HC/g Rock)
S3
(mg CO2/g Rock)
Tmax (°C)Ro (%)HIOIPI
10.880.211.120.334400.89128380.16
20.880.421.260.304390.98143340.25
30.850.260.991.584401..141171870.21
Table 3. Programmed pyrolysis results for a well in the East Feliciana Parish, LA; 14 out of the 60 samples are shown.
TOC (wt%)S1
(mg HC/g Rock)
S2
(mg HC/g Rock)
S3
(mg CO2/g Rock)
Tmax (°C)HIOIPI
11.010.81.550.29456153290.34
21.320.772.250.27456170200.25
30.970.441.390.2459143210.24
40.810.351.030.17458127210.25
50.860.240.920.13459107150.21
60.950.441.30.19460137200.25
72.82.716.230.33456223120.3
80.630.220.550.1145787170.29
91.551.032.80.22457181140.27
101.020.511.490.24456146240.26
111.510.992.910.25454193170.25
120.110.060.030.08032730.63
132.531.995.610.38452222150.26
142.071.44.350.31456210150.24
Publisher’s Note: MDPI stays neutral with regard to jurisdictional claims in published maps and institutional affiliations.

