Article

Valve Regulated Lead Acid Battery Evaluation under Peak Shaving and Frequency Regulation Duty Cycles

Battery Materials & System Group, Pacific Northwest National Laboratory, Richland, WA 99352, USA
*
Author to whom correspondence should be addressed.
Energies 2022, 15(9), 3389; https://doi.org/10.3390/en15093389
Submission received: 8 April 2022 / Revised: 29 April 2022 / Accepted: 3 May 2022 / Published: 6 May 2022
(This article belongs to the Topic Energy Storage and Conversion Systems)

Abstract

:
This work highlights the performance metrics and the fundamental degradation mechanisms of lead-acid battery technology and maps these mechanisms to generic duty cycles for peak shaving and frequency regulation grid services. Four valve regulated lead acid batteries have been tested for two peak shaving cycles at different discharge rates and two frequency regulation duty cycles at different SOC ranges. Reference performance and pulse resistance tests are done periodically to evaluate battery degradation over time. The results of the studies are expected to provide a valuable understanding of lead acid battery technology suitability for grid energy storage applications.

1. Introduction

Enabling a more sustainable energy supply system requires the integration of renewable energy resources as well as energy storage systems (ESS) with the power grid. For a robust and resilient grid, ESS can provide various grid services such as load leveling, frequency regulation, energy management, backup power, voltage support, and grid stabilization [1,2]. To validate and identify the challenges related to the extensive use of ESS in the power grid, ESS is tested for reliability and safety as part of the “Grid Energy Storage Strategy” released by the U.S. Department of Energy (DOE) [3]. The lessons learned from these tests are expected to increase the deployment of ESS.
Many different energy storage technologies are being tested, evaluated, and deployed globally. Grid-scale lead-acid batteries were deployed as far back as the 1980s [4] and are a cost-effective and reliable option for different grid services [5,6,7,8]. Materials sustainability is one of the most important aspects of lead acid batteries since nearly a 100% recycling rate is achievable [2]. However, for the larger battery size required for grid scale battery energy storage systems (BESS), there are several challenges that need to be addressed.
The charge-discharge reactions for lead acid battery at the positive and negative electrodes are given in Equations (1) and (2) respectively, while Equation (3) shows the overall cell reaction [9,10].
PbSO 4 ( s ) + 2 H 2 O   discharging charging   PbO 2 ( s ) + H 2 SO 4 + 2 H + + 2 e
PbSO 4 ( s ) + 2 H + + 2 e discharging charging Pb ( s ) + H 2 SO 4
2 PbSO 4 ( s ) + 2 H 2 O   discharging charging   PbO 2 ( s ) + Pb ( s ) + 2 H 2 SO 4
The discharged species for both electrodes is lead sulfate (PbSO4), while the charged species is lead dioxide (PbO2) for the positive electrode and spongy lead (Pb) for the negative electrode. The formation of lead sulfate at both electrodes during discharge results in electrolyte dilution due to sulfuric acid consumption, with protons migrating from the negative to the positive electrode. Lead dioxide in the positive electrode is reduced while spongy lead in the negative electrode is oxidized to lead sulfate. The reverse process takes place during charge, with electrolyte specific gravity increasing due to sulfuric acid generation.
In a valve regulated lead acid battery (VRLA), the electrolyte is absorbed in a glass mat separator, also known as absorbed glass mat (AGM) separator, or absorbed into a gel, with no excess free-flowing electrolyte, unlike its flooded counterpart.
VRLA battery capacity is typically positive electrode limited, generating oxygen at the positive on overcharge (Equation (4)) before the negative electrode is fully charged. Gas channels are formed either as connected porosity in the AGM separator or as micro-cracks in the gel [11]. This creates a passage for oxygen gas to the negative, where it is electrochemically reduced in the presence of hydrogen ions to form water (Equation (5)). In addition to oxygen generation, there is an ongoing parasitic reaction related to positive grid corrosion during charge, which is accelerated during overcharge in the presence of oxygen. The depolarization of the negative electrode by the oxygen recombination reaction increases the positive electrode potential during constant voltage charge mode, further accelerating grid corrosion. This parasitic grid corrosion reaction has to be balanced at the negative electrode. Since the negative electrode is in excess, the balancing reaction is expected to be charging of the negative electrode active material from lead sulfate to spongy lead. If the oxygen generation rate exceeds the recombination rate at the negative, this excess oxygen generation also has to be balanced by charging of the negative electrode active material from lead sulfate to spongy lead. Ideally, there should be sufficient excess negative active material to account for positive grid corrosion and incomplete oxygen recombination, such that at the end of design life, hydrogen generation at the negative is avoided, thus preventing water loss. The reactions for oxygen generation at the positive during overcharge, followed by recombination with lead at the negative, and subsequent conversion to lead sulfate are given below in Equation (4) at the positive and Equation (5) at the negative, which is the reverse of Equation (4), thus keeping the positive and negative electrode state-of-charge (SOC) fixed [12]:
H 2 O     1 2 O 2 ( g ) + 2 H + + 2 e
1 2 O 2 ( g ) + 2 H + + 2 e   H 2 O
Common failure modes of VRLA batteries are discussed in Section 2, along with cell design to optimize performance and life. Degradation modes are proposed to explain the internal resistance increase and capacity degradation trends under peak shaving and frequency regulation duty cycles for VRLA battery modules in Section 4. Suggestions for post-test disassembly and analysis of individual components to validate the proposed failure mechanism for each duty cycle are provided in Section 4.4. Mapping has been done between the proposed degradation modes for each duty cycle with corresponding degradation modes for hybrid electric vehicles in Section 4.7.

2. Failure Modes for Lead Acid Batteries

The lead acid battery failure modes comprise the following, with electrolyte stratification and dry-out limited to VRLA [13,14,15,16]
  • Positive grid corrosion
  • Positive active material softening and shedding
  • Electrolyte stratification (VRLA)
  • Electrolyte dry-out (VRLA)
  • Negative active material sulfation

2.1. Flooded Batteries

In flooded batteries positive grid corrosion is mitigated by using lead-antimony alloy grids [17,18], related to higher creep strength of this alloy [19]. Antimony also facilitates conversion of the highly resistive PbO corrosion product to the conductive PbO2, which has a conductivity 17 orders of magnitude higher [20]. However, antimony dissolves in the electrolyte, migrates to the negative electrode, and promotes hydrogen evolution during standby, charge and overcharge. Hence for maintenance-free batteries, low antimony positive grid alloys are used, while for VRLA, antimony free alloys of Pb-Ca-Sn are used [19,21], with calcium providing mechanical strength and tin mitigating grid corrosion, while Pb-Ca alloy is used for the negative gird. Positive active material softening and shedding, and negative active material sulfation, common to flooded and VRLA batteries, are covered in detail in the next section. Electrolyte stratification is mitigated by overcharging to promote gas evolution with associated electrolyte mixing. Electrolyte dry-out is prevented by periodic addition of deionized water as part of standard maintenance. For flooded batteries, grid corrosion mitigation by use of lead-antimony alloy is expected to reduce positive active material shedding due to better grid-active material bond, while mitigation of electrolyte stratification and starting with a lower negative to positive active material ratio relative to VRLA are expected to reduce negative electrode irreversible sulfation.

2.2. VRLA Batteries

For VRLA batteries, there are areas that need further study. Oxygen recombination depolarizes the negative electrode, thus raising its potential. For batteries charged at a constant potential, this raises the positive electrode potential, leading to greater positive grid corrosion, with associated water loss [19,21] and additional oxygen evolution, which corrodes the grid further [12]. The higher sulfuric acid concentration due to water loss accelerates grid corrosion [19]. This leads to a synergistic effect of water loss on grid corrosion. Hence it is important to avoid water loss, not just to ensure the cell capacity is not electrolyte-limited, but to limit positive grid corrosion. Control of overcharge current such that it does not exceed the recombination rate ensures complete recombination of oxygen evolved from the positive electrode. For fresh VRLA batteries, there may be some excess electrolyte, which slows down oxygen transport to the negative, resulting in water loss till the oxygen recombination current can be supported. During this period, the oxygen generation current at the positive is supported by charging of the negative electrode active material. Cell design should take this into account and add sufficient excess negative capacity to ensure the negative electrode does not get fully charged during this period to avoid hydrogen evolution. The unintended effect of excess negative is that some uncharged lead sulfate crystals may eventually grow in size and become difficult to charge, increasing electronic resistance and preventing electronic and ionic access to parts of the electrode. Hence it is important to ensure the positive and negative electrode active mass and electrolyte content are optimized to avoid (1) hydrogen generation at the negative, (2) irreversible sulfation of negative electrode (3) electrolyte dry-out.
Upon discharge, there is a near doubling of volume in the positive electrode and about a 2.5× increase in the negative electrode volume [19] since the lead sulfate discharge product has a lower density. The negative spongy lead is compressible; hence this volume growth is partially compensated by a reduction in the volume of the remaining lead during discharge. For VRLA batteries using glass mat separators, while volume change in the in-plane direction due to positive grid corrosion has been mitigated by the use of antimony-free Pb-Ca-Sn alloy, the through plane increase in positive active material volume upon discharge is mitigated by applying a compressive force to the electrode assembly [19]. The glass mat is made of fibers with various diameters to optimize mechanical strength, pore size distribution, porosity, and wicking characteristics of the separator. Smaller fiber diameter lends itself to smaller pore size and greater wicking ability, while larger fiber diameter improves mechanical strength and resistance to compression [12,22]. With proper glass mat separator design, electrolyte stratification is avoided or mitigated by wicking, and positive active material growth is mitigated by compression, with the glass mat pressed against the positive active material at pressures up to 138 kPA [22]. In a gel VRLA battery, where sulfuric acid is mixed with fumed silica, forming an immobile electrolyte, stratification is less of an issue [22]. Note that for flooded batteries, as discussed earlier, electrolyte stratification is mitigated during overcharge, where the gases evolved stir the electrolyte.
VRLA batteries have a higher specific gravity at full charge compared to flooded batteries to compensate for the lower electrolyte content. The positive electrode has two oxide types in the fully charged state–α-PbO2, which has lower activity, and β-PbO2 which has higher activity. As long as the acid concentration is maintained in the 0.9–5 M (1.05–1.28 specific gravity) range, the active material is in the more active state, with the less active α-PbO2 dominating outside this range [18]. Electrolyte stratification could result in greater α-PbO2 formation at the bottom of the electrode, while water loss can result in α-PbO2 dominating throughout the charged positive electrode. As discussed earlier, higher electrolyte specific gravity also accelerates positive grid corrosion, which manifests itself as a steady decrease in usable capacity at a fixed rate.
Electrolyte stratification also results in greater lead sulfate formation at the bottom. This uneven lead sulfate distribution across the electrode height results in lower electrode active mass utilization and associated capacity loss [12]. This is mitigated for tall cells and modules by placing the tall side horizontally [23].
Using the mitigation approaches described, the above failure modes have been reduced, resulting in the negative electrode failure being the main R&D topic for further work. The low surface area of the negative electrode and its low specific capacitance results in poor charge acceptance especially at high rates. The voltage range above which gassing occurs and below which charge is incomplete is quite narrow for VRLA batteries [23,24], which further contributes to poor negative electrode charge acceptance at high rates. The positive lead dioxide active material has an order of magnitude higher specific surface and three times higher specific capacitance relative to the negative electrode spongy lead [23,25]. This ensures uniform distribution of the charge transfer reaction across the bulk of the positive electrode, and formation of lead sulfate film at the negative electrode surface due to poor charge acceptance. This is especially the case for partial state of charge cycling of lead acid batteries [16,26], where the batteries are not fully charged at the end of each cycle (e.g., hybrid electric vehicle, frequency regulation). To overcome this, expanders are added to the negative electrode active mix during paste formulation. These consist of barium sulfate, which increases nucleation rate for the lead sulfate formation reaction [12,16,26], lignosulfonates with functionalities that promote the formation of lead sulfate uniformly across the electrode thickness by inhibiting lead sulfate crystal growth and formation of a passivating layer [12,24], and various forms of carbon such as graphite and carbon black that increase electronic conductivity, surface area and specific capacitance [24,27]. The higher electronic conductivity reduces isolation of negative active mass via electronic percolation, while the higher surface area allows uniform distribution of lead sulfate across the bulk of the electrode, with the higher capacitance improving charge acceptance at high rates [25]. The carbon is incorporated either in the paste mix or laminated onto the electrode to form a parallel lead-carbon hybrid, or simply replaces the negative spongy lead electrode or the grid [15,19]. For the batteries used in this work, high surface area carbon is introduced in the paste formulation step of the negative electrode [28]. Table 1 shows the summary of failure modes.

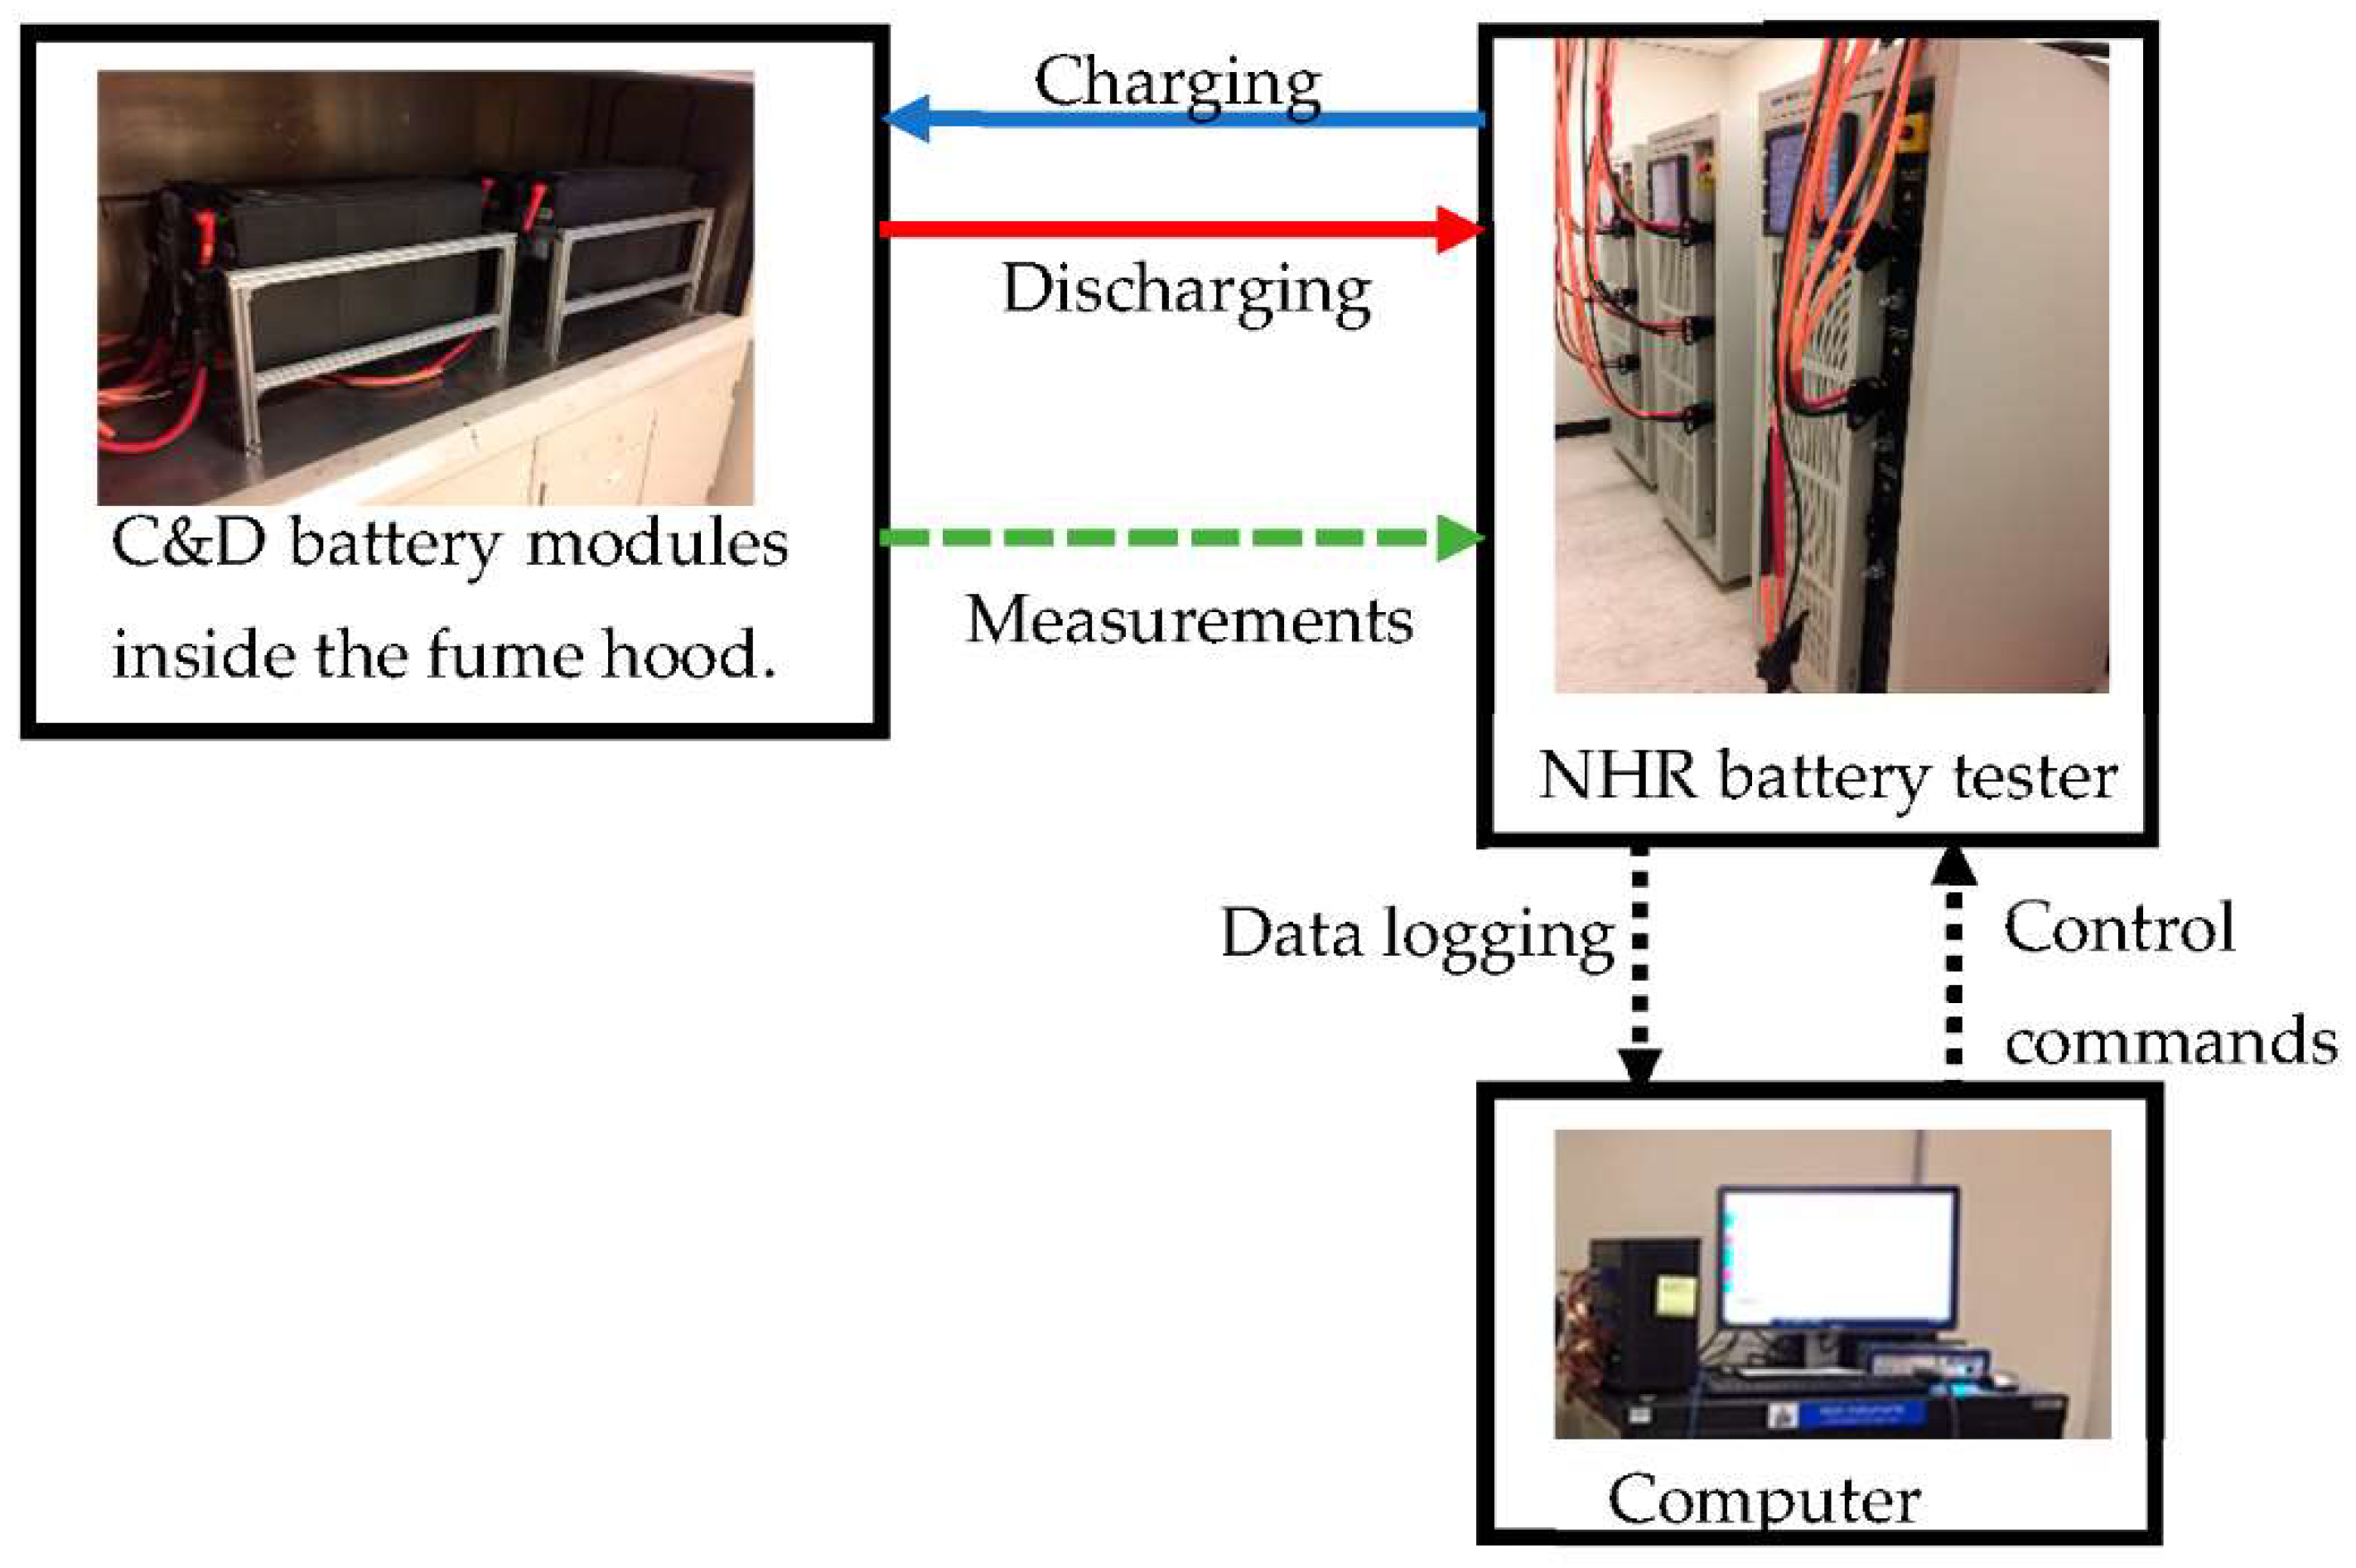
3. Experimental Setup

3.1. Module Specification

A valve regulated lead acid battery (VRLA) module with six series-connected cells manufactured by C&D technology, Inc (Horsham, PA, USA), using absorbent glass mat (AGM) technology (model no. SHC 12-200FT), is used for testing. These batteries, also referred to as carbon lead batteries, use lead carbon composite in the active material paste of the negative electrode to reduce irreversible sulfation and improve charge acceptance of the negative plate. The battery has a capacity of 172 Ah when discharged at the C10 or 10-h (h) rate from a fully charged state to 1.8 V per cell at 25 °C, where C10 rate is the discharge current at which the battery requires 10 h to reach an end of discharge voltage of 1.8 V from a fully charged state at 25 °C. The battery specification sheet [28] provides battery weight (60 kg), dimensions, performance, and cycle life details.

3.2. Test Protocols

Four lead-acid battery modules are subjected to two peak shaving duty cycles and two frequency regulation duty cycles. The duty cycles are based on the “Protocol for Uniformly Measuring and Expressing the Performance of Energy Storage Systems” developed by energy storage industry stakeholders, led by Pacific Northwest National Laboratory and Sandia National Laboratory [29]. The tests are ongoing for over one year. The test data correspond to 28 months for one duty cycle and 18 months for three other duty cycles. Testing was performed using an N.H. Research Inc. (NHR, Irvine, CA, USA) battery pack test system (9200 series, model 4912), with a maximum DC voltage of 120 V and current of 200 amperes (A), with an 8 kW limit for charge and 12 kW limit for discharge [30]. Figure 1 shows the experimental setup for the BESS, where the lead acid battery module is the DC storage block, and the NHR battery tester performs the role of the grid and site controller. At the beginning of each test, the battery module is charged at a constant current (CC) of 17.5 A (10-h rate) until module voltage reaches 14.1 V (2.35 V/cell), followed by a constant voltage (CV) charge until current drops to 1 A. After charge, the battery is subjected to a rest period of three hours. Reference performance tests are done at the beginning of the test regime to establish a baseline and repeated periodically. These tests consist of a capacity test and a pulse resistance test to determine battery degradation during operation. The reference performance capacity test is conducted every month, corresponding to 58 peak shaving duty cycles or 30 frequency regulation duty cycles. A pulse resistance test is done every two months, after 116 peak shaving cycles and 60 frequency regulation cycles to measure internal resistance.

3.2.1. Reference Performance Capacity Test

The battery is initially charged at a CC of 17.24 A (10-h rate) until the module voltage reaches 14.1 V, followed by a CV charge at 14.1 V until the charge current drops to 1 A. After the initial charge, the battery is discharged at the C5 rate of 31.34 A until the module voltage drops to 11.1 V (1.85 V/cell). Note that during this test, the end of discharge voltage is kept at 1.85 V/cell to avoid deep discharge-related degradation during the capacity test, since the main goal was to estimate duty cycle-related degradation. The battery is not subjected to rest after discharge to minimize duration at a low state of charge, where irreversible sulfation may occur. The CC/CV charge is repeated, with termination condition during CV charge corresponding to either the current decreasing to 1 A or charge capacity (Ah) reaching 103% of previous discharge Ah capacity. Note that the battery module is charged at a higher rate (5-h or C5 rate) for 1 h to minimize time spent at low SOC, followed by charge at the C10 rate. After charge, a 3 h rest period is incorporated. The discharge and charge steps are repeated for a total of two discharges, with the battery capacity calculated as the average of these two discharges. Capacity retention is calculated as the ratio of Ah capacity measured during reference performance test as the battery ages to the initial or baseline measured Ah capacity of the battery.

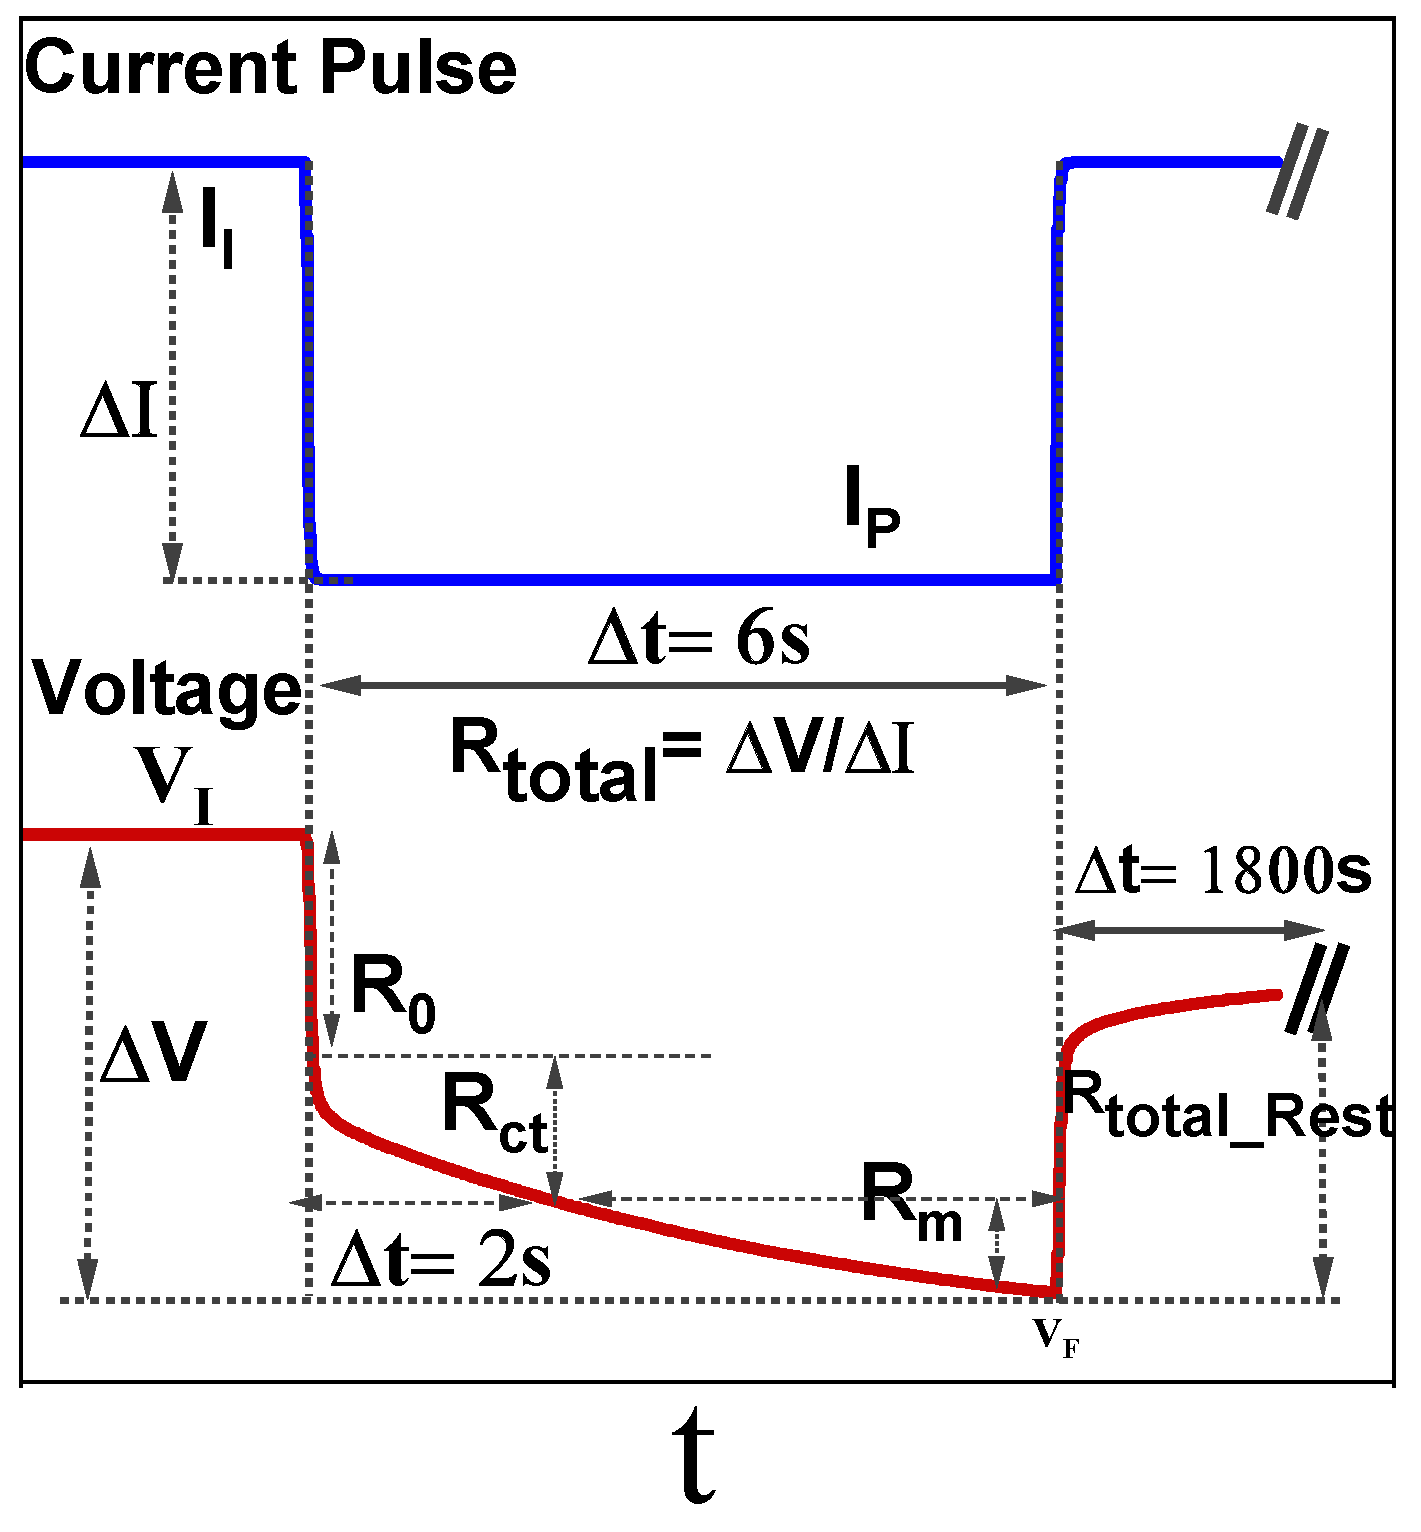
3.2.2. DC Current Pulse Test to Measure Internal Resistance

The lead acid battery modules’ internal resistance can be measured using DC pulse current or electrical impedance spectroscopy (EIS). EIS employs multiple frequency sine waves to measure resistance over a wide range of frequencies [31]. However, EIS is not a viable option for a large battery module due to hardware limitations related to voltage and current. Per the battery cycler specifications [30], the current change time is <5 ms, while the internal resistance is reported every 10-millisecond (ms) time interval. However, it took 30–100 ms for the applied pulse current to stabilize, hence ohmic resistance is estimated at 100 ms, where there is a significant contribution expected from charge transfer.
The internal resistance of the battery module comprises ohmic resistance, charge transfer, and mass transport resistance. For AC impedance tests, ohmic resistance is estimated at 10–100 kHz [32], which corresponds to a duration of 10–100 µs, while charge transfer resistance is evaluated at 1–10 Hz (0.1–1 s), and mass transfer resistance or diffusion resistance to ion transport to and from the electrode pores is measured at 0.001–0.1 Hz (10–1000 s).
It has been shown that the pulse width at a fixed pulse current should be such that the ΔSOC is ≤0.1% [33]. This condition is met by using C1 or 1-h rate pulse of 115 A for 6 s, with a ΔSOC of 0.11%. The discharge and charge pulses are applied at every 10% SOC change from 100% SOC to 0% SOC, with only discharge pulse applied at 100% SOC and charge pulse at 0% SOC, with a 30-min rest period imposed after each pulse to allow the battery voltage to relax and the temperature to equilibrate. The battery’s internal resistance is calculated from the voltage change during the pulse.
Total internal resistance, R total = V I , V = ( V F V I )   and   I = ( I P I I ) .
Where, VI is the initial voltage before pulse is applied, VF is the final voltage at the end of the pulse and II is the initial current, which is 0, and IP is the pulse current. Figure 2 shows a discharge pulse current and voltage profile of the battery.
In this work, the 100 ms data is used to calculate ohmic resistance, while the 2-s data is used to calculate the sum of ohmic (Ro) and charge transfer resistance (Rct), and the 6-s data is used to calculate total resistance (Rtotal) [34]. Mass transport resistance (Rm) is the difference in 6-s and 2-s data. Corresponding times for calculation of resistance from the voltage relaxation after charge or discharge are 0.1 s, 2 s, and 1800 s.

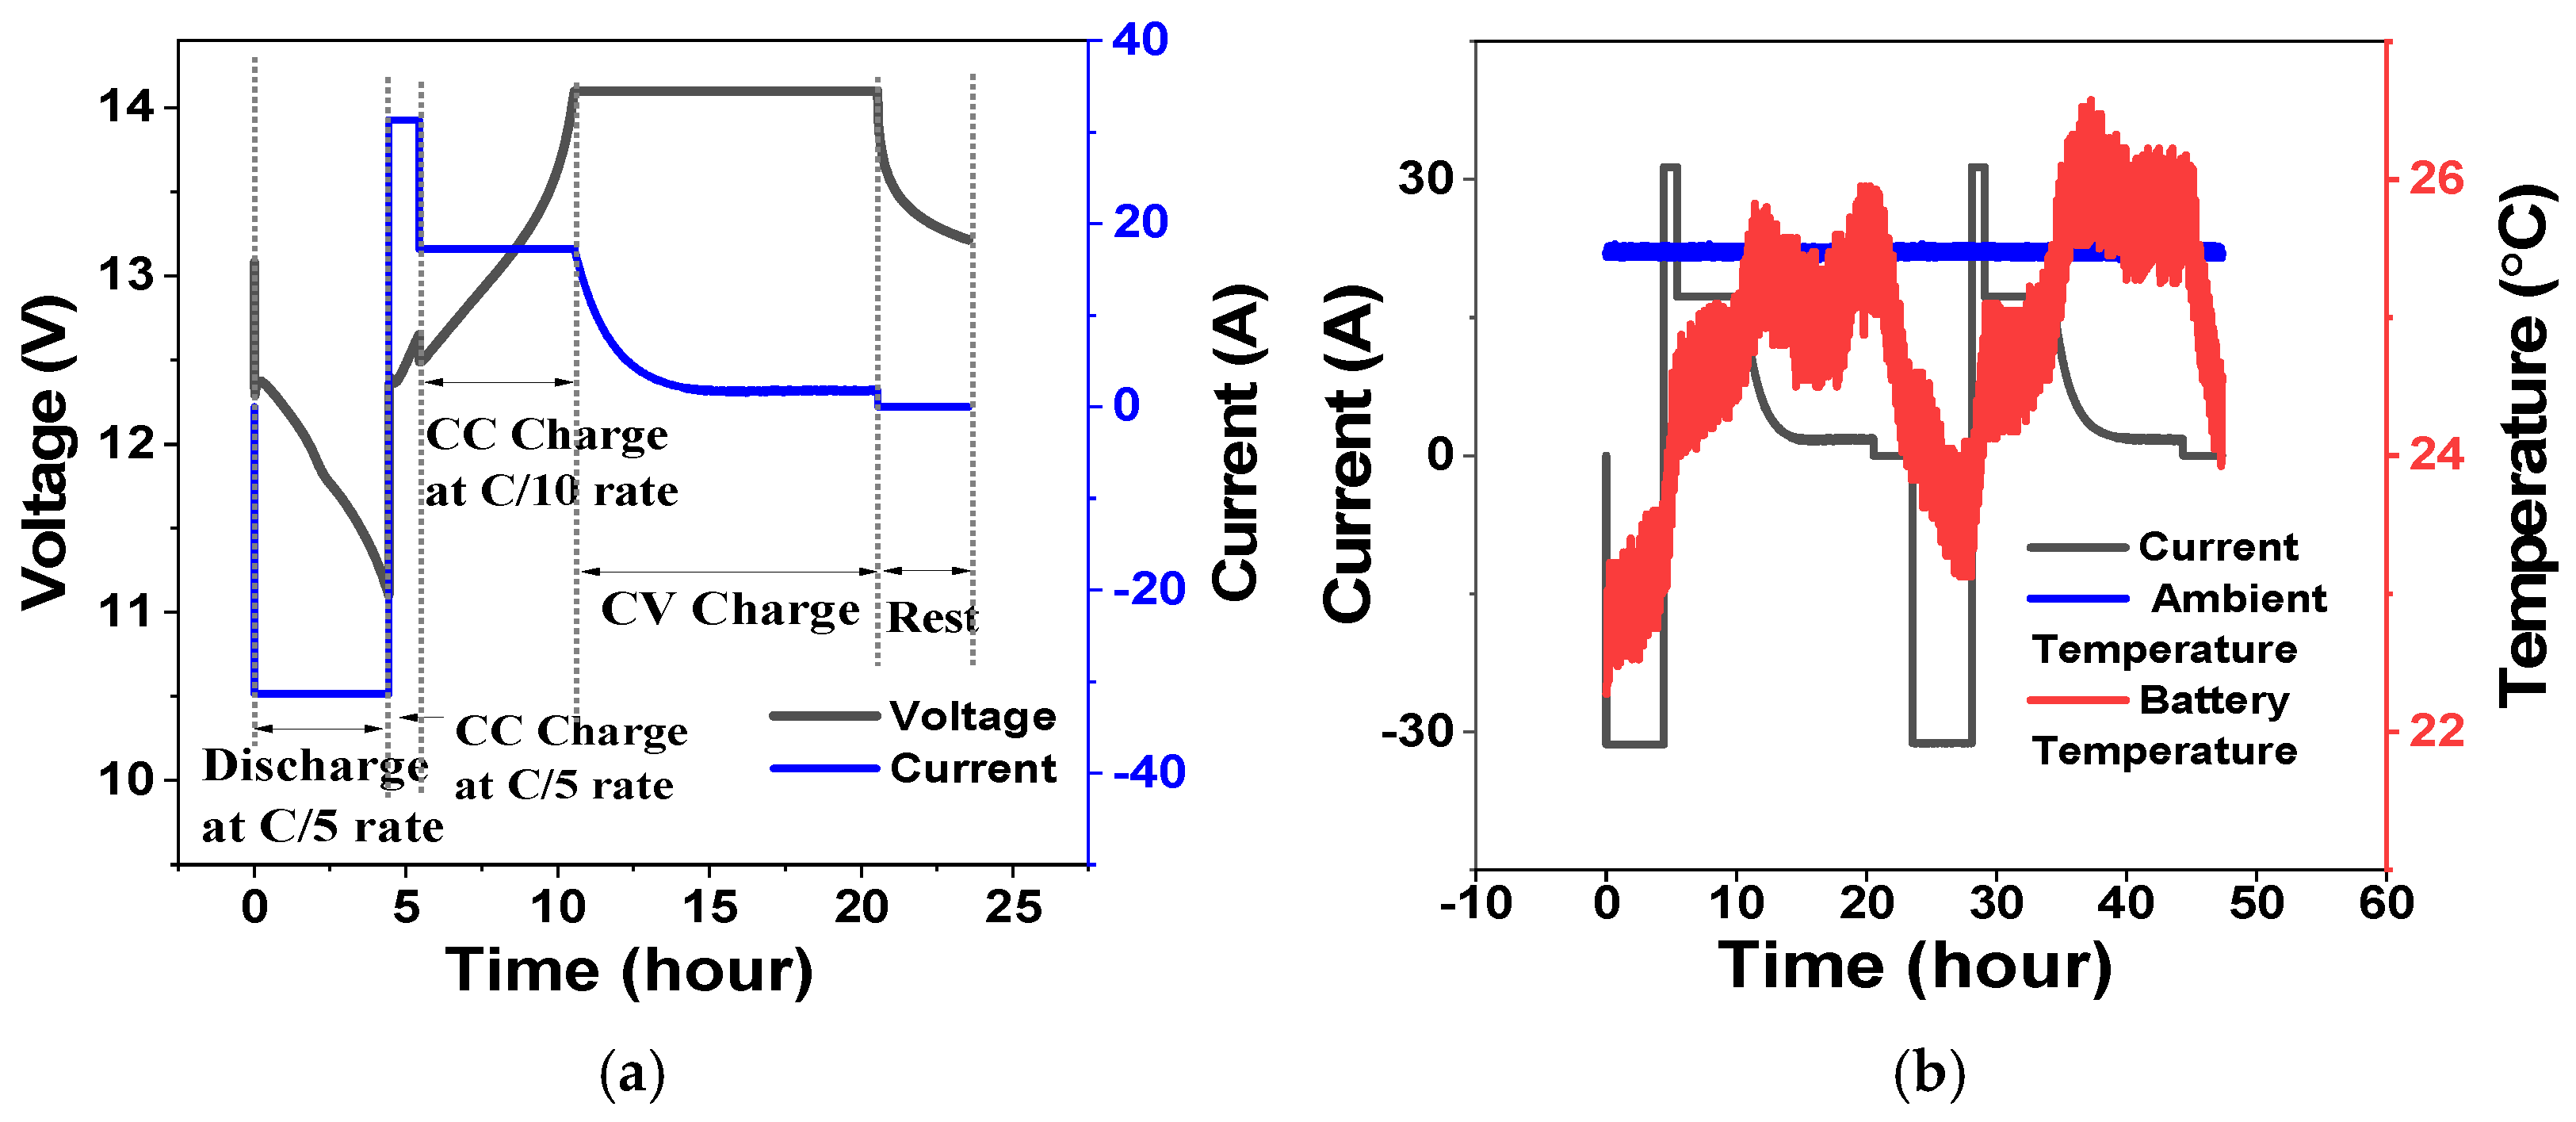
3.2.3. Peak Shaving Duty Cycle Test

Two battery modules are subjected to peak shaving duty cycles. A peak shaving (PS) duty cycle consists of a discharge at constant power for a duration ranging from 1–4 h during the daily on-peak period followed by a recharge during the off-peak period. Table 2 shows the peak shaving duty cycle operating parameters. The depth of discharge (DOD) of the battery module is 50% based on the initial Ah-capacity measurement. Discharge is done at two power levels (730 watts (W) and 246 W) to analyze the effect of power on performance and degradation. At the end of 58 peak shaving cycles, the battery is fully discharged, followed by a reference performance test.
For the 730 W, the discharge time is 1.2 h, with the highest current corresponding to the 2-h rate, and is referred to as PS 2-h. The corresponding numbers are 3.8 h and 8-h rate for discharge at 246 W, referred to as PS 8-h. The charge back power is kept the same for both modules at 265 W. The charge power is calculated by multiplying the voltage at the low end of SOC with the C10 charge current. The batteries are charged at a constant power of 265 W until the voltage is 14.1 V, followed by a CV charge until current decreases to 1 A. The total duration of both the peak shaving duty cycles is 12 to 14 h. The rest time for peak shaving is 2 h to accommodate close to 2 cycles per day.

3.2.4. Frequency Regulation Duty Cycle Test

Two modules have been subjected to the 24-h frequency regulation (FR) duty cycle. The 24-h duty cycle power is normalized with respect to the power corresponding to the C1 rate at 50% SOC of the battery module, estimated at 1090 W for both FR duty cycles. This corresponds to a discharge energy throughout of 3.9 kWh per cycle for this energy neutral signal. Note that positive power typically represents discharge from the battery module, and negative represents charge into the battery module from a grid perspective. In this work, since a battery cycler is used to charge and discharge the battery, charge is associated with a positive power signal, and discharge with a negative power signal. A reference to the raw data based on which the duty cycle is generated is given in Appendix B of [29]. Table 3 shows the operating parameters for the frequency regulation duty cycles, with the DOD for the 24-h duty cycle set at 20%.
Frequency regulation tests are done at two different initial SOC levels (80% and 57%) to determine the effect of different operating SOC ranges on performance and degradation. The charge acceptance of lead acid batteries is impacted by the preceding step. If the preceding step is a discharge step, the formation of small lead sulfate crystals offers sufficient surface area for the subsequent charge, whereas, if the preceding step is a charge step, the newly formed low surface area spongy lead reduces charge acceptance [35]. While optimization of expander properties is expected to mitigate this issue, for this work, starting an FR duty cycle after a preceding charge step to the initial SOC resulted in voltage excursions above the upper limit at the start of the duty cycle. Hence the batteries were brought to an SOC equal to target start SOC + 5% (62% for target SOC of 57% and 85% for target start SOC of 80%), and subsequently discharged to the target start SOC. This finding also indicates there is room for further improvement in expander research and development for duty cycles with volatile power signals.
Since the frequency regulation duty cycle is energy neutral, the total discharge Ah exceeds the total charge Ah for each cycle, since RTE < 1. That is, for the condition of charge energy equal to discharge energy, the average charge voltage is higher than average discharge voltage. Since energy in Wh is the product of Ah and battery voltage, the discharge Ah is greater than charge Ah for a 24-h FR duty cycle. At the end of each frequency regulation cycle, the battery modules are charged to bring them back to their starting SOC using a 10-h rate., followed by a constant voltage charge until the desired charge Ah is achieved. The desired charge Ah is calculated by measuring the difference between charge Ah and discharge Ah for the preceding frequency regulation cycle and applying a suitable overcharge to address gassing during charge. Note that no overcharge is applied for the FR duty cycle starting at 57% SOC, while a 0.75% overcharge is applied during charge back for the FR duty cycle starting at 80% SOC. The charge back step is followed by a rest period of 1 h before the next frequency regulation cycle. The total duration for frequency regulation, including charge back and rest, is about 29 h.

4. Results and Discussion

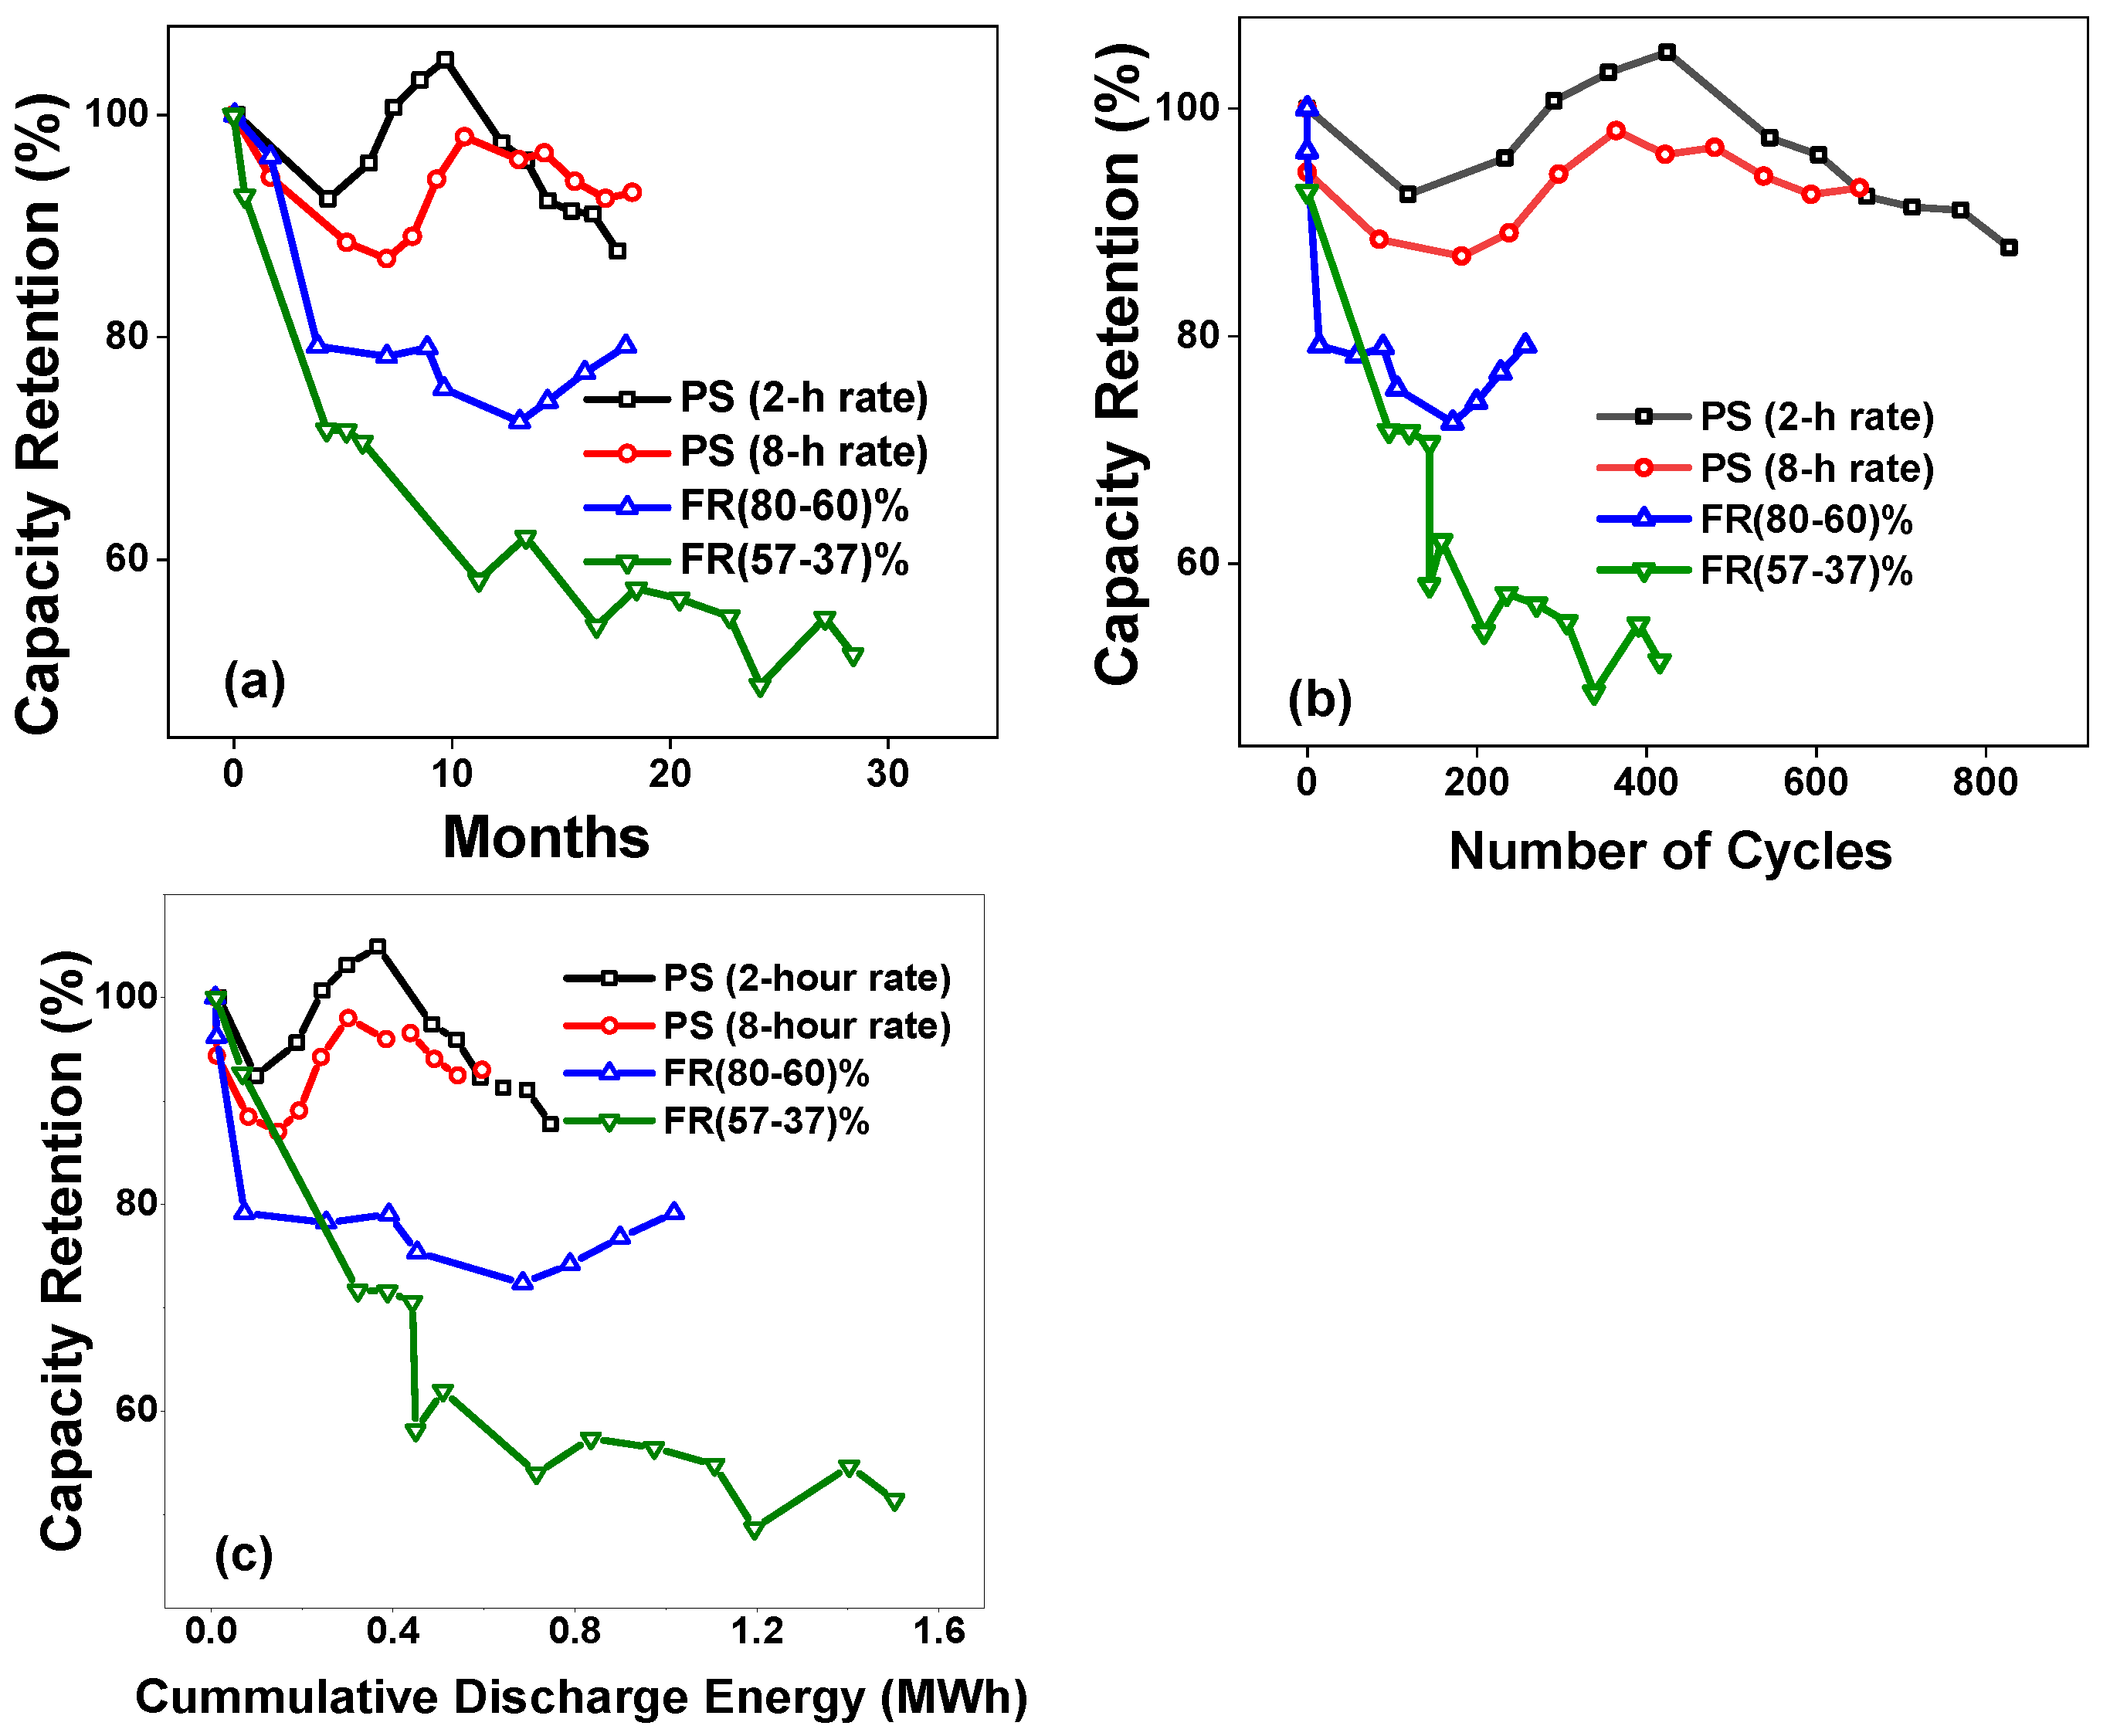
4.1. Reference Performance Test Results

Reference performance tests and pulse resistance tests are conducted at regular intervals to evaluate the performance stability of the batteries performing four different duty cycles. Performance stability assessment is done by monitoring changes in the battery capacity and internal resistance as a function of elapsed test time, number of cycles and cumulative energy throughput for each of the four duty cycles.
Figure 3a shows the voltage and current profile of one discharge and charge cycle for the reference performance capacity test. Figure 3b shows the current and temperature profiles for two charge and discharge cycles. Resistive and reversible heat contribute to heat generation during operation [36]. Lead acid batteries have a positive temperature coefficient for open circuit voltage of 0.2 mV/°C, which corresponds to endothermic contribution of reversible heat during discharge (and exothermic contribution of reversible heat during charge) [37,38]. The battery temperature rises during charge as expected, while during discharge, it rises during the first cycle and drops during the second cycle. At the start of the first discharge, the battery temperature was low at 22 °C, resulting in resistive heating that overwhelms the endothermic effect. In contrast, at the beginning of the second discharge, the temperature was higher at 24 °C, with associated lower resistive heating, such that the endothermic effect dominates. The exothermic behavior during charge has the potential for cell dry-out during constant voltage charging, hence it is prudent to set the CC current low to avoid significant temperature increase. None of the modules exhibited significant temperature increase during the course of testing, indicating that the charge profile is suitable, and the electrolyte dry-out is not a major failure mode.
Figure 4a shows battery capacity retention as a function of time elapsed since test start for different duty cycles. Capacity retention is calculated using the initial measured capacity as 100%. Over the same elapsed time, batteries subjected to FR duty cycles batteries degraded more than those subjected to PS duty cycles. The battery subjected to FR duty cycle operating in the 57–37% SOC range has the longest testing period and degraded the most. For PS duty cycle batteries, the battery capacity recovered after initial degradation. Performance enhancement can occur due to various factors such as improved electrode wetting during initial cycles, rearrangement of active material resulting in a greater active area, better electrolyte distribution among battery cell components [39], and reversal of irreversible sulfation. This recovery indicates that the initial capacity drop is not related to positive active mass shedding. Figure 4b shows capacity retention as a function of cycles, while Figure 4c shows capacity retention as a function of cumulative discharge energy. The sharp drop in capacity for FR (57–37)% in Figure 4b,c was observed after the battery was in an idle state for four months stored in a fully charged condition and is probably related to irreversible sulfation of the electrodes [40].
Typically, irreversible sulfation due to the growth of lead sulfate crystals occurs when batteries are stored for prolonged periods without being charged or subjected to low SOC during cycling [40,41]. The poor electronic conductivity of these lead sulfate crystals also isolate portions of the electrode, making them inaccessible, further reducing battery capacity. The battery subjected to FR (57–37)% duty cycle degraded more during the same period than FR (80–60)% duty cycle. The degradation may be related to irreversible sulfation of the battery electrodes caused by operation at lower SOC levels.
Since the frequency regulation duty cycle has higher discharge energy throughput per cycle than the peak shaving duty cycle, Figure 4b shows higher degradation per cycle for FR, while the gap decreases when degradation is normalized per unit MWh discharged (Figure 4c), especially for the FR (80–60)% duty cycle. Note that the average SOC for this duty cycle is 70%, close to the average SOC of 75% for the PS duty cycles.
The greater rate of capacity loss for FR duty cycles, coupled with less of a capacity recovery appears to indicate that positive active material shedding, in addition to irreversible sulfation, may play a bigger role for the FR duty cycle, which involves multiple charge-discharges and the associated contractions and expansions of the active mass within a 24-h duty cycle. This needs to be taken into consideration while using VRLA batteries for frequency regulation. This failure mechanism appears to be absent for PS duty cycles. Note that converting cumulative energy throughput to number of 100% DOD equivalent cycles, FR (57–37)% has completed 728 100% DOD equivalent cycles, while the corresponding numbers for FR (80–60)%, PS (2-h) and PS (8-h) are 494, 362 and 289 respectively.

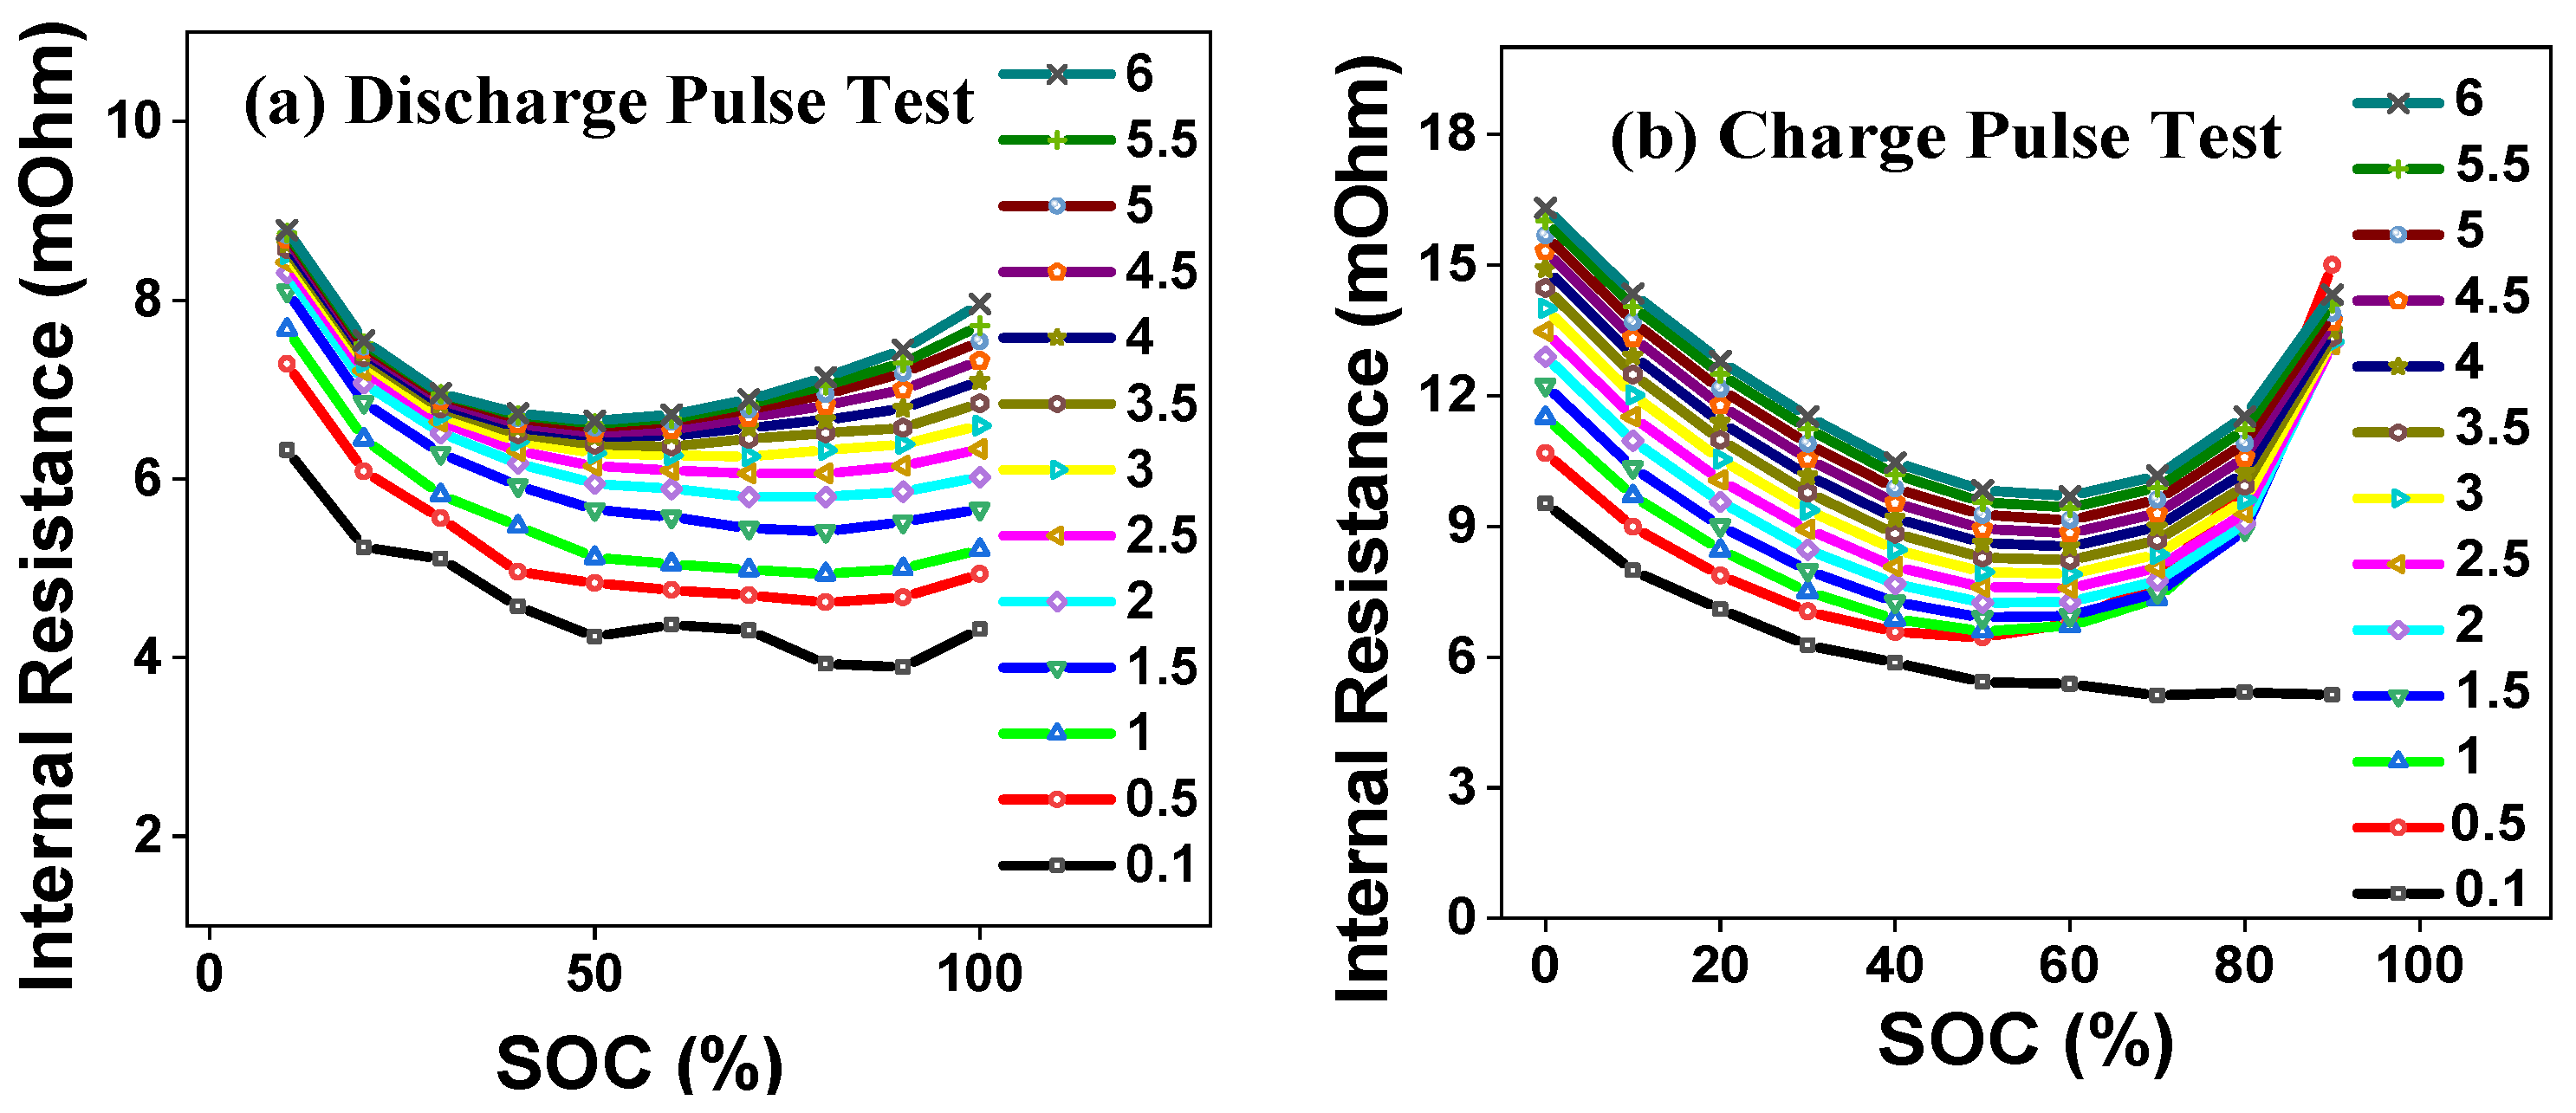
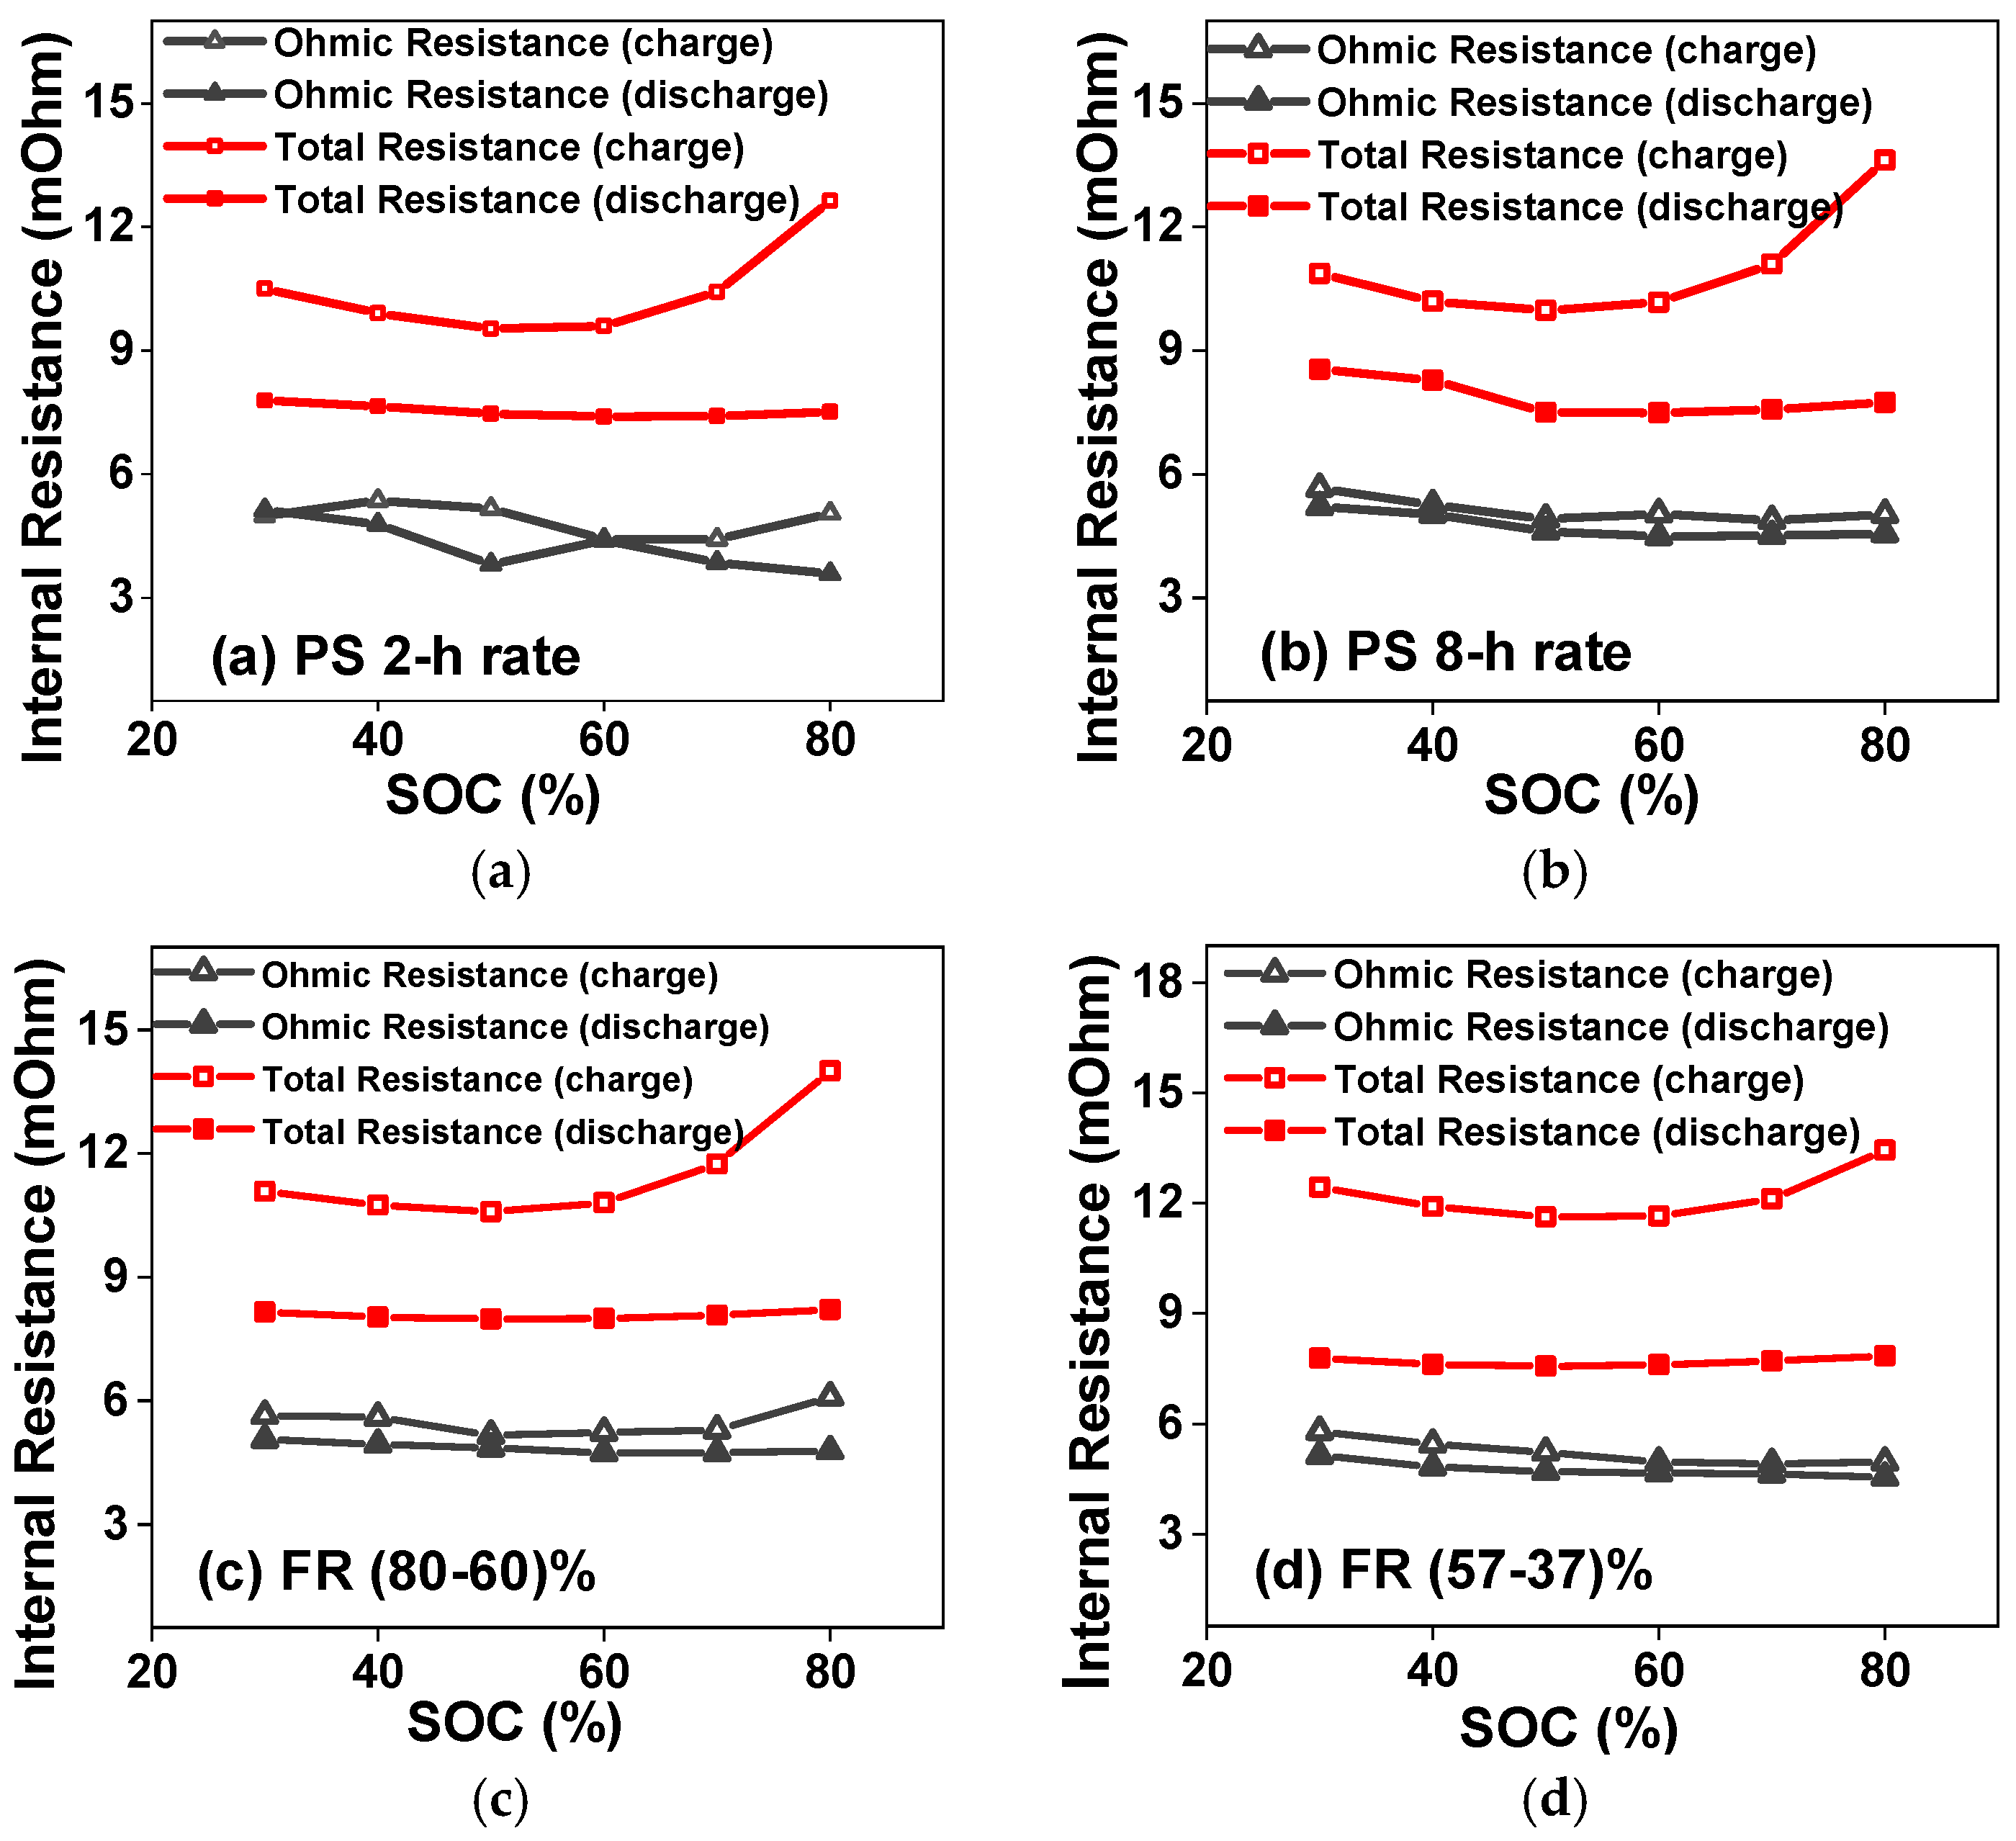
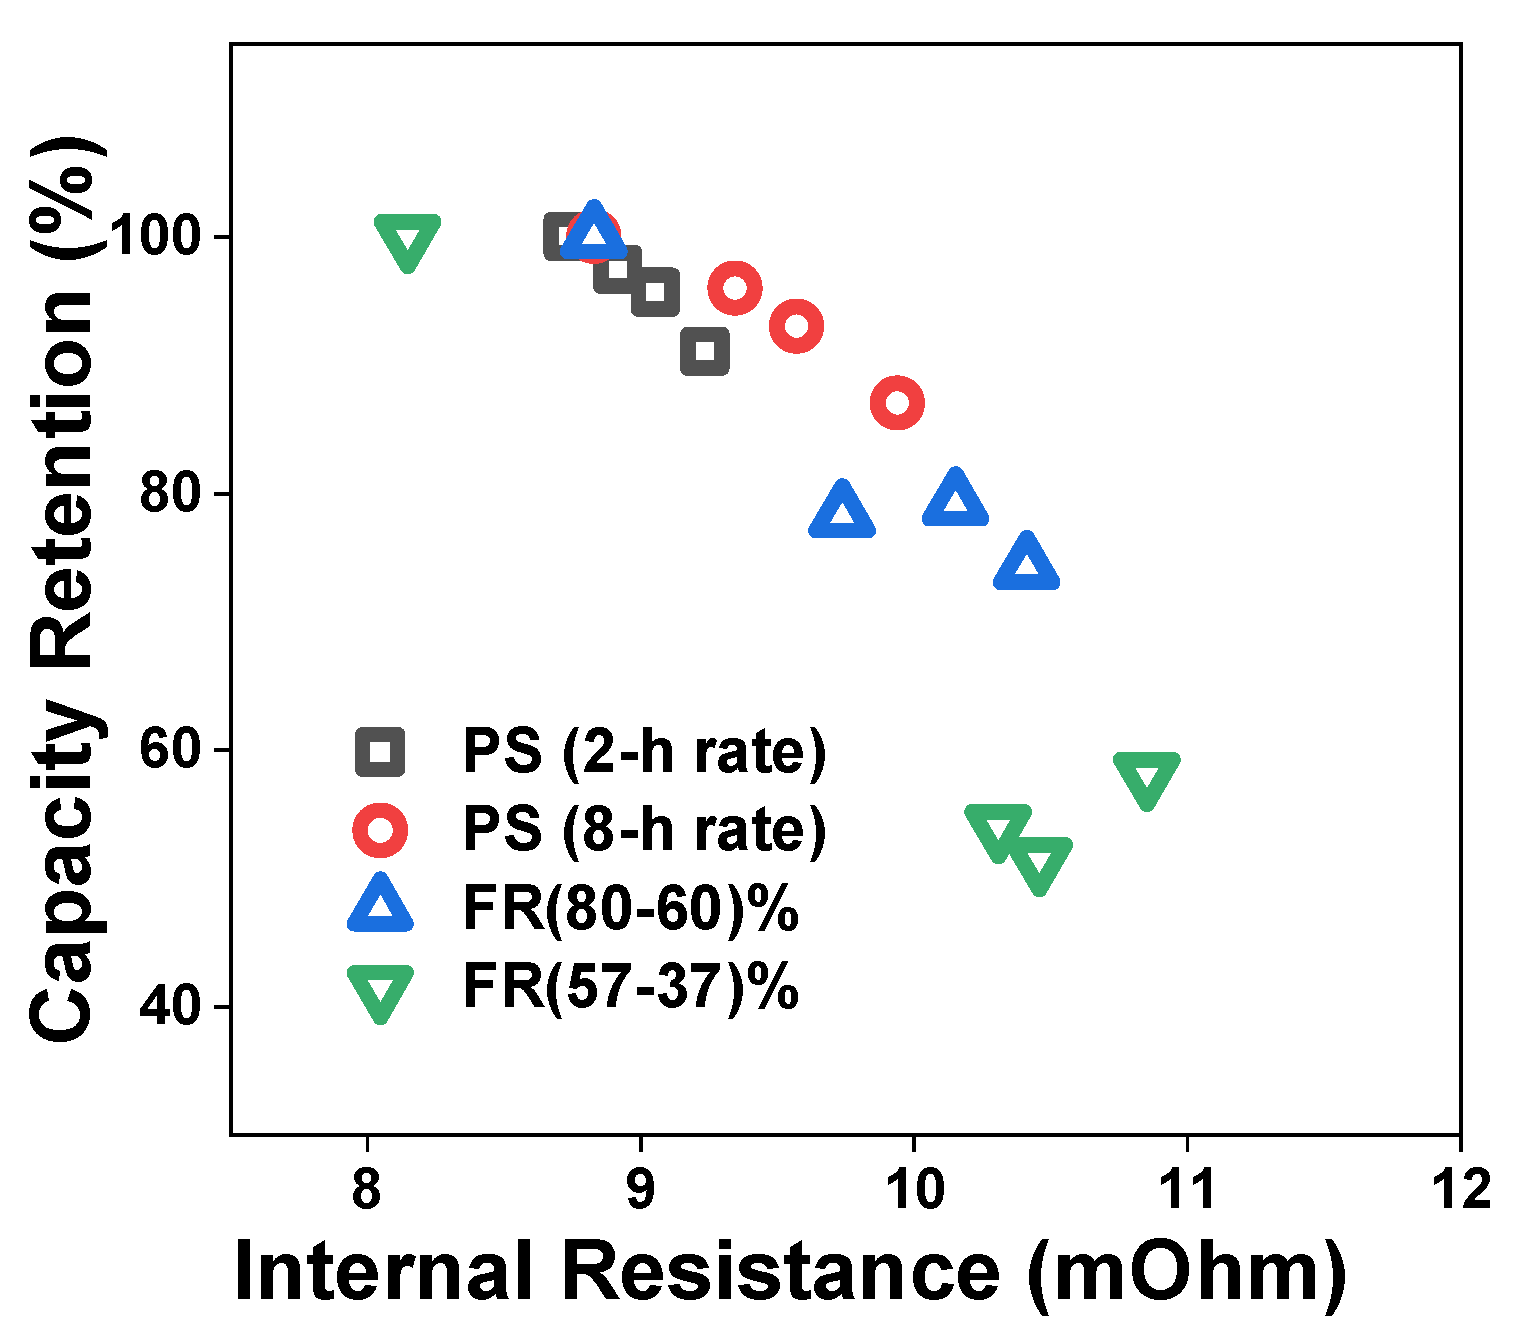
4.2. Pulse Resistance Test Results

Figure 5a shows internal resistance vs. SOC for discharge pulse durations from 100 (ms) to 6 s, while Figure 5b shows corresponding results for the charge pulse. The ohmic resistance, corresponding to the 100 ms measurement, includes contribution from charge transport resistance as well, and decreases as SOC increases. Ohmic resistance is determined by electronic conductivity of the current collector and the electrode active mass, along with electrolyte ionic conductivity and tortuosity of the separator and electrode pores. The discharge product at both electrodes, PbSO4, has lower electronic conductivity than the corresponding charge states of PbO2 at the positive and spongy Pb at the negative, while the electrolyte ionic conductivity increases with increasing state of charge [42]. While ohmic resistance should not depend on pulse direction (charge vs. discharge), for the 0.1-s discharge pulse, the ohmic resistance decreases more steeply with increasing state of charge compared to the charge pulse. The resistance at 10% SOC is nearly the same regardless of direction of the pulse, indicating the charge transfer resistance at this SOC is nearly the same for the charge and discharge pulse. As the SOC increases, the discharge pulse resistance decreases more than the charge pulse. This is expected, as the charge transfer resistance is expected to increase with state of charge for the charge pulse, negating the decrease in ohmic resistance at high SOC.
For the discharge pulse, at high SOC, the internal resistance increases with pulse width. While it is difficult to separate out charge transport and mass transport effects, assuming a 2-s cut-off for charge transport, it appears that mass transport effects can be estimated all the way up to 6-s pulse width. On the other hand, at low SOC, after 2–3 s, the resistance does not increase significantly. This indicates that due to low acid concentration at low SOC, mass transport effects are almost fully captured within 2–3 s. The data for the charge pulse is a mirror image. At low SOC, since there is plenty of water in the electrolyte, mass transport effects are observed for the entire 6-sec pulse duration. At high SOC, due to higher concentration of the sulfuric acid product, a majority of the mass transport related effects are captured within 2–3 s.

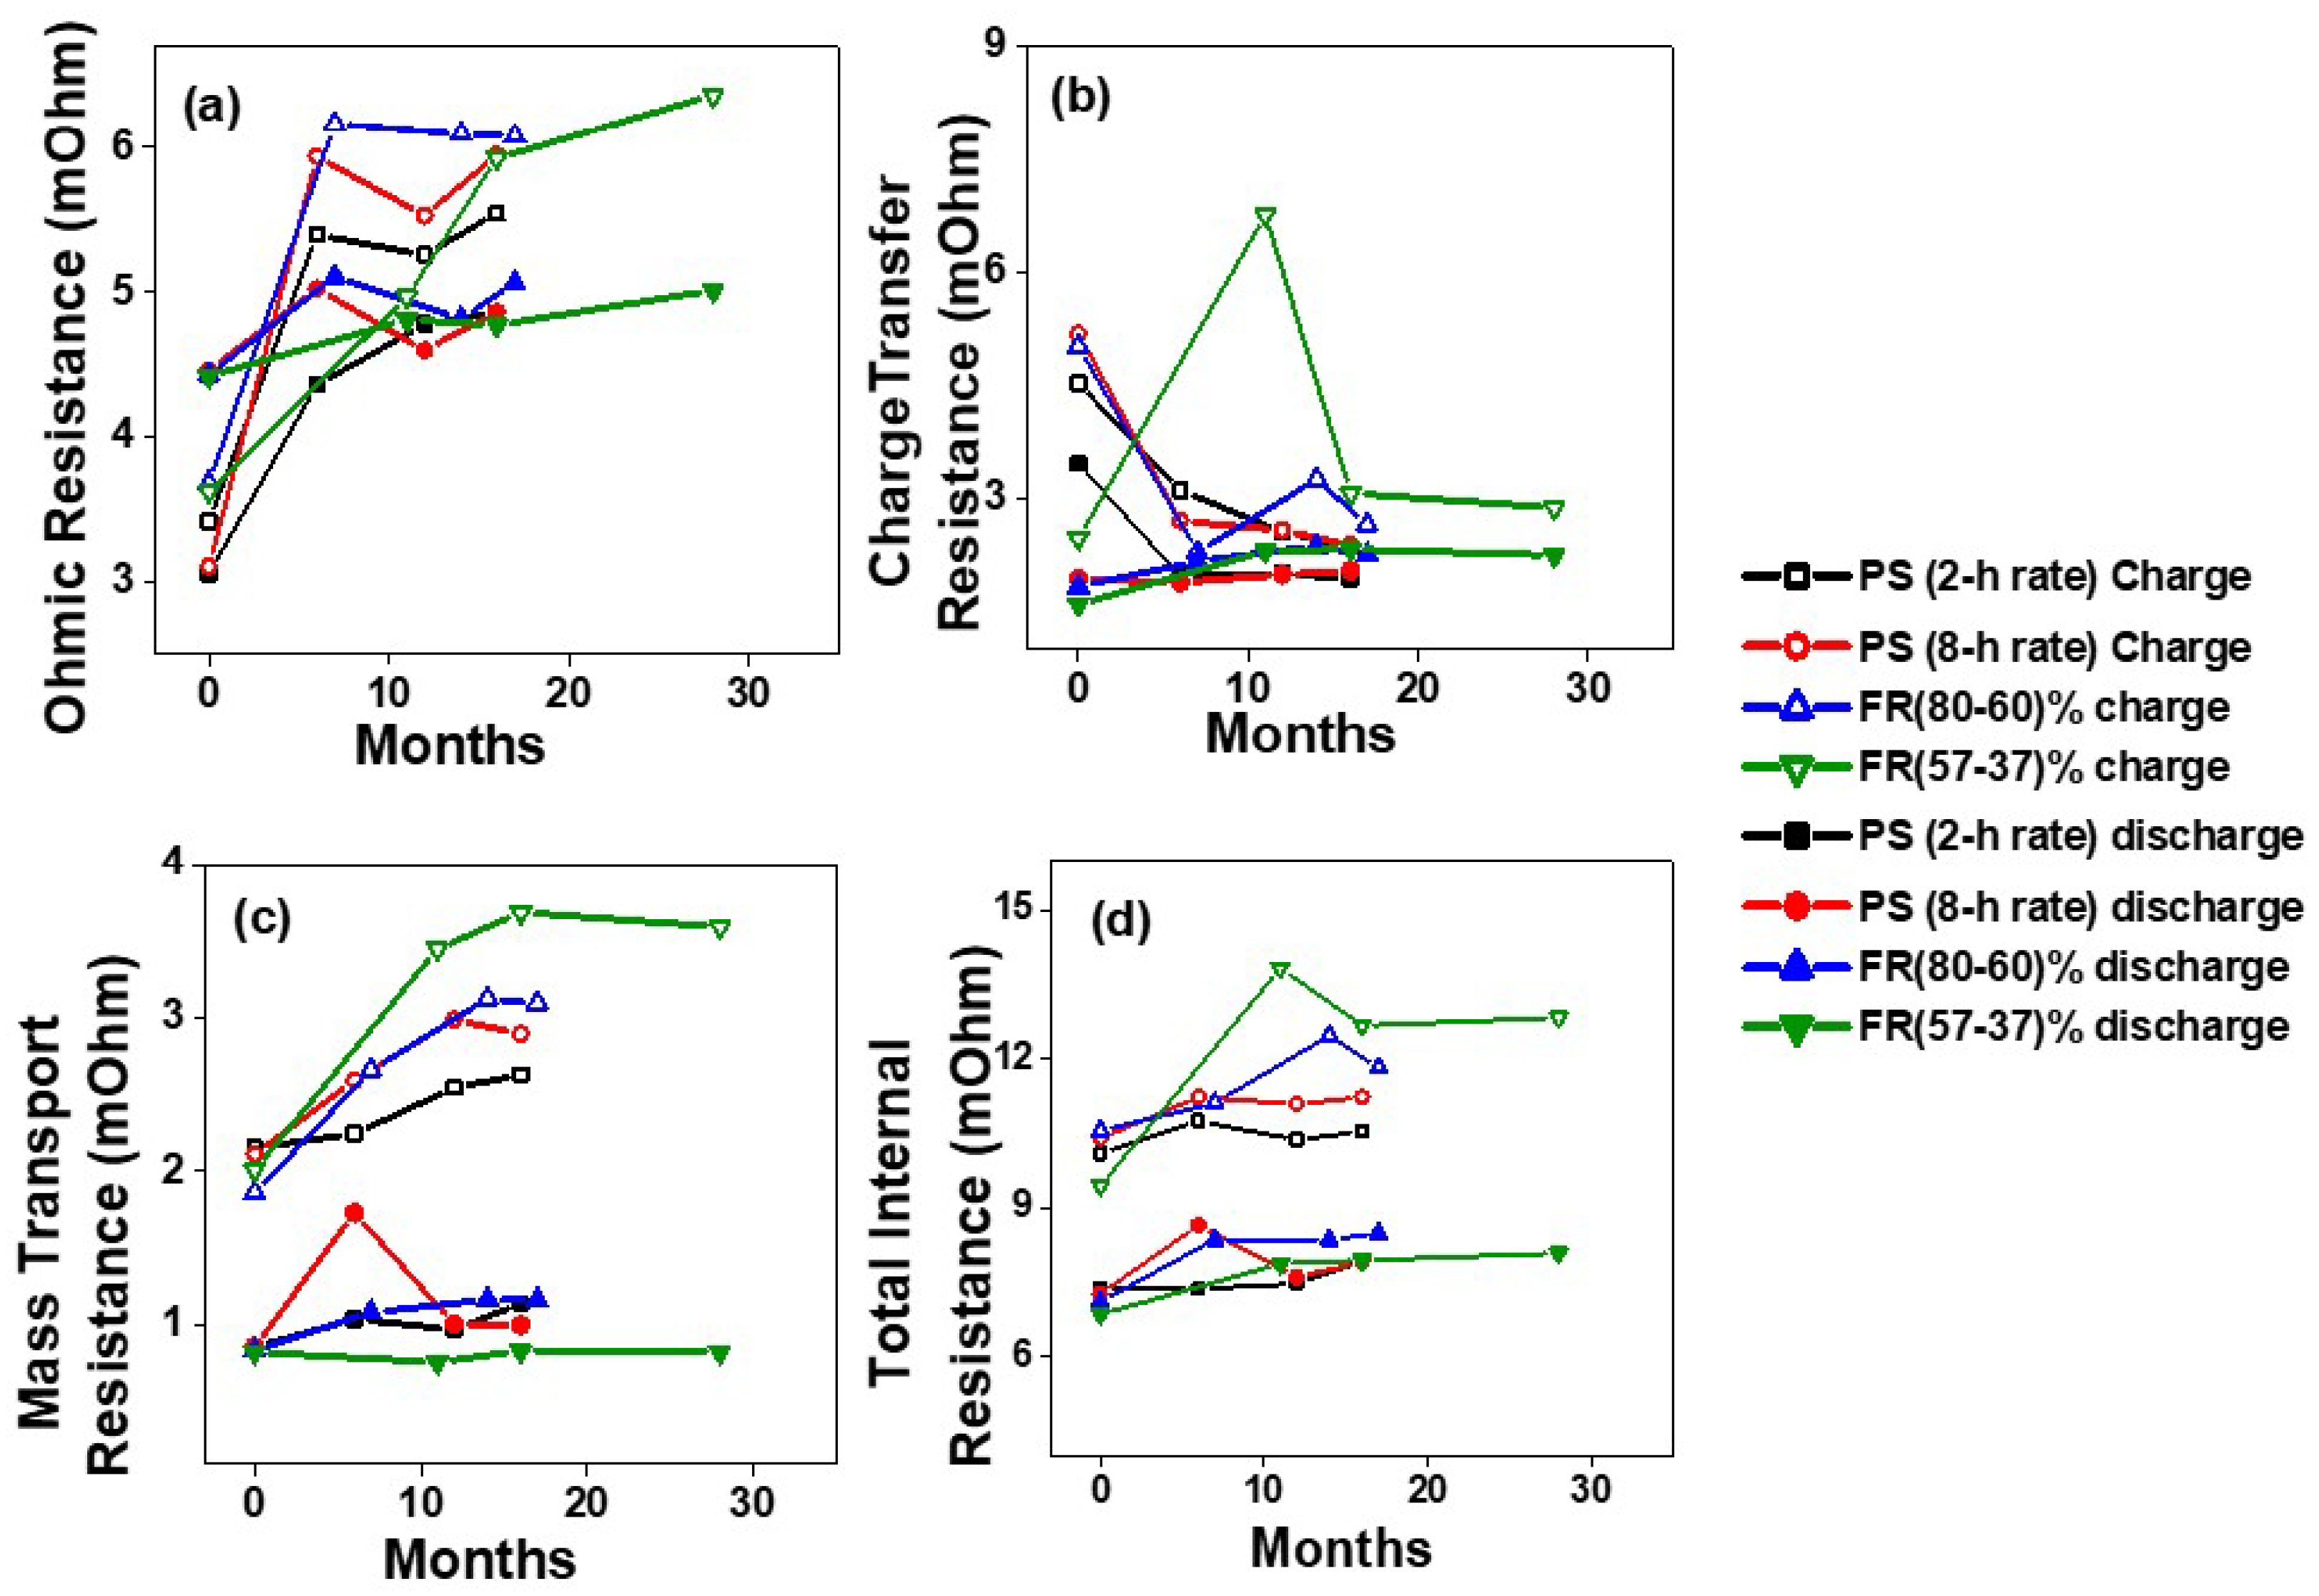
4.3. Degradation Analysis

Figure 6 shows all four batteries’ capacity retention vs. total internal resistance. The total internal resistance is averaged from 80% SOC to 30% SOC for charge and discharge pulses. The capacity degrades linearly with an internal resistance increase. VRLA batteries are typically positive electrode limited. As the battery cycles, the positive electrode grids undergo corrosion, causing an in-plane mechanical stress on the grid, leading to a decrease in adhesion between the active material and the grid. The active material is separated from the grid because of the expansion and shrinkage of the active material during the discharge and charge cycles, reducing the capacity [43]. The capacity recovery for PS cycles in Figure 4c indicates that positive active material shedding is not the main reason for capacity loss. As stated earlier, use of appropriate alloys and compressive force appears to have mitigated this failure mode. This indicates that irreversible sulfation at the bottom of electrodes due to electrolyte stratification and at the low surface area negative during partial state of charge operation may be a reason for the linear decrease in capacity as resistance increases, while resistance increase may be associated with positive grid corrosion, water loss and irreversible sulfation. As irreversible sulfation at the negative increases, there is expected to be a transition from positive limit to negative limit, at which point gas generation increases, accompanied by further resistance increase due to water loss. The slight increase in capacity corresponding to an increase in resistance for FR duty cycles may be related to reversal of dense sulfation film (leading to increase in capacity), while grid corrosion and loss of water lead to an increase in resistance.
Figure 7 shows internal resistance vs. elapsed test duration. Ohmic resistance increases with increasing duration. Some of the reasons could be (1) irreversible lead sulfate formation at the bottom of both electrodes related to electrolyte stratification and at the negative electrode due to partial state of charge cycling, (2) positive grid corrosion resulting in in-plane mechanical stress on grid and loss of contact with positive active material (3) Positive active material shedding due to active material volume change during cycling resulting in loss of electronic percolation in active mass (4) Electrolyte dry-out resulting in an increase in ionic resistance.
For all duty cycles, the ohmic resistance for charge pulse is greater than that for discharge pulse, which is due to contribution from charge transfer in the 100 ms pulse. Depending on the duty cycle, the reason for ohmic resistance increase may differ. For example, for peak shaving, since the charge rate is the same for both duty cycles, if electrolyte dry-out is the predominant mode, electrolyte loss is expected to be nearly the same for the 2-h and 8-h duty cycles. The slightly lower resistance for the 2-h discharge may be related to less time spent in the 75% to 50% SOC range, resulting in less irreversible sulfation at the negative electrode. The ohmic resistance for the FR (80–60)% run matches the results for the PS 8-h, whereas the corresponding values for the FR (57–37)% case is lower. Hence it appears that electrolyte dry-out could be the dominating reason for ohmic resistance increase for the PS duty cycles and the FR duty cycle operating in the 80–60% SOC range, with the PS duty cycles expected to have greater grid corrosion and water loss due to being subjected to a full charge after each cycle, while the FR (80–60)% duty cycle is expected to have more sulfation due to spending >3.5× duration at <70% SOC. Irreversible sulfation at the negative electrode could be the dominant reason for ohmic resistance increase for FR (57–37)%. Note that this battery was on open circuit for four months. During this time, some water loss is expected due to self-discharge, but the main degradation mechanism may be irreversible sulfate formation, which is corroborated by the steep increase in charge transfer resistance for the charge pulse at the 10-month mark (Figure 7b).
The charge transfer resistance for the discharge pulse is relatively unchanged with a slight increase, while it decreases in the first few months for the charge pulse. This appears to indicate that the charge acceptance initially is not very high, probably related to sulfation formed over a long storage period of ~6 months prior to testing. The steep increase in charge transfer resistance for the charge pulse at the 10-month mark appears to be related to the 4-month rest on the open circuit, which leads to sulfation of the active material and the associated poor charge acceptance. As expected, the corresponding charge transfer resistance for the discharge pulse is not very high since the reacting species is the charged form of the active mass in each electrode.
Mass transport resistance for the charge pulse increases with time, while that for the discharge pulse increases to a much less degree (Figure 7c). During charge, sulfuric acid is produced in the pores, requiring transport of the acid away from the pores to allow reactant water access. It is difficult for bulk water to force its way into the pores while displacing the acid that is produced. During discharge, sulfuric acid is consumed at the electrode pores, which are now filled with water. It is easier for acid in bulk to enter the pores and displace the produced water. Irreversible sulfation results in the increase of active mass volume, with an associated decrease in porosity and pore size. Hence the pore size and porosity reduction associated with irreversible sulfate formation increase mass transport resistance, with more of an impact on the charge pulse.
This effect is maximum for FR (57–37)% duty cycle, where irreversible sulfation at the negative electrode is expected to be the largest, with corresponding greatest pore size and porosity reduction. The results are similar for FR (80–60)% duty cycle and PS 8-h, where both duty cycles spent significant time at <70% SOC and hence are expected to have a similar degree of irreversible sulfation, while the PS 2-h duty cycle spends less time at <70% SOC, and hence has less irreversible sulfation, accompanied by a lower increase in mass transport resistance.
It is our hypothesis that for the PS duty cycles and FR (80–60)% duty cycle, the main mode of degradation is water loss, with some irreversible sulfation at the bottom of both electrodes related to electrolyte stratification, with additional sulfation at the low surface area negative for FR (80–60%) and PS 8-h related to longer time spent at SOC < 70%, while for FR (57–37)% duty cycle, the main mode is irreversible sulfation at the negative electrode related to longer time spent at low SOC along with sulfation at the bottom of both electrodes related to electrolyte stratification, with water loss related effects expected to be lower. To validate these hypotheses, the aged battery modules, along with fresh modules to establish a baseline, need to be disassembled in the charged state and subjected to the recommended tests in the following section.

4.4. Recommended Tests to Validate the Proposed Failure Mechanism

(1)
Determine mass of negative, positive and separator. The negative electrode needs to be transferred immediately in deionized water to avoid oxidation in air.
(2)
Determine electrolyte content in positive, negative and separator by measuring wet and dry weight. The negative needs to be dried in a vacuum oven.
(3)
Determine electrolyte specific gravity by titrating a known electrolyte volume obtained by squeezing electrolyte from separator.
(4)
Determine electrolyte distribution at various heights of electrodes and separator (to estimate electrolyte stratification).
a.
Cut the electrode into three parts, top, middle, and bottom, measuring wet weight, followed by titration to determine acid content for each part, followed by measurement of dry weight.
(5)
Determine acid content at the top, middle and bottom parts of the separator, followed by filtration and drying of the retained separator.
a.
Immerse each separator piece in deionized water after weighing and titrate vs. 1 M NaOH.
(6)
Determine porosity and pore size distribution by BET and mercury porosimetry to correlate results with mass transport resistance.
(7)
Determine elemental composition using energy dispersive X-ray analysis (EDX) for the top, middle and bottom part of positive and negative electrodes.

4.5. Internal Resistance vs. SOC Trends for the Duty Cycles

Figure 8 shows the internal resistance measured from discharge and charge pulse at different SOC levels for four different duty cycles. The internal resistance is averaged over time at the same SOC. From Figure 8a–d, it can be seen that the duty cycles affect the battery internal resistance similarly, with the shape of the resistance as f (SOC) similar for all duty cycles. For all four duty cycles, total internal resistance measured from charge pulse is higher than total internal resistance measured from discharge pulse. This is in line with our observation that charge transfer- and mass transport-related losses are higher for charge.

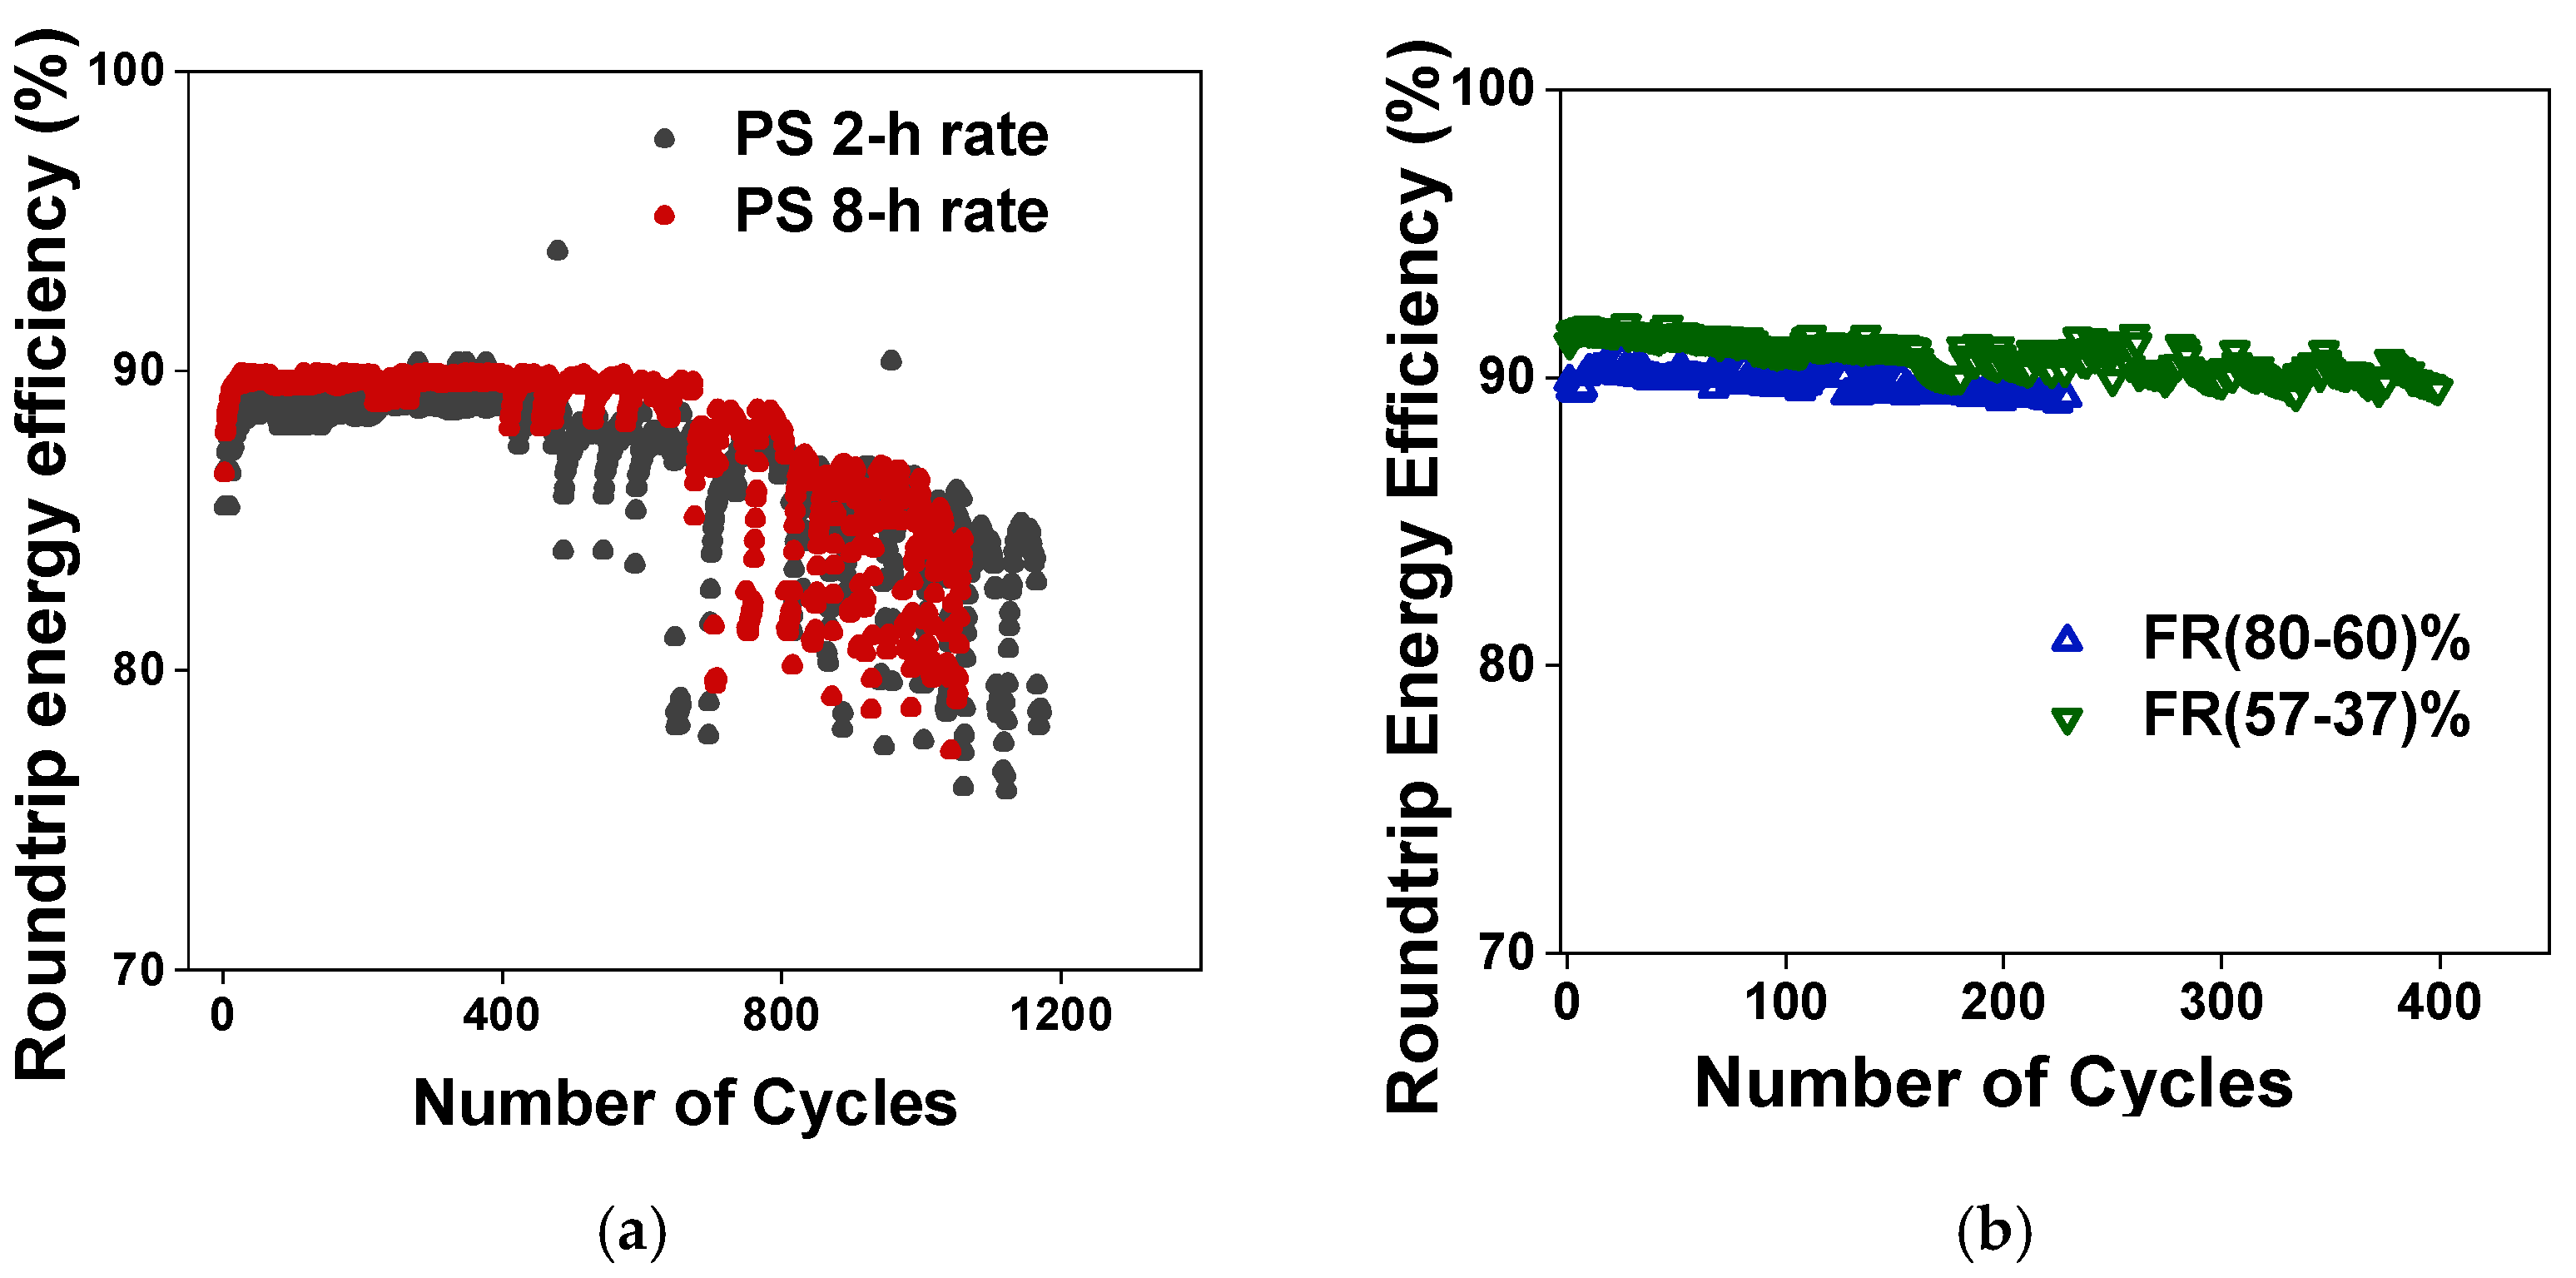
4.6. Round Trip Efficiency Results for the Duty Cycles

Figure 9 shows the round-trip efficiency (RTE) of (Figure 9a) peak shaving duty cycles and (Figure 9b) frequency regulation duty cycles. While the RTE is constant for 400 peak shaving duty cycles, it decreases subsequently, with significant fluctuations. This is due to a change in the charge procedure after 400 cycles. Initially, the charge back procedure consisted of a CC/CV charge with charge termination set at 3% overcharge or current decreasing to 0.8 A, whichever occurs first. Also, the constant current and constant voltage charge steps each had a 7-h time limit to reduce excessive gassing. After 400 cycles, the CC/CV charge is terminated when the current decreases to 0.8 A, with the 3% overcharge requirement removed. Note that in these subsequent cycles, the overcharge is more than 3% of the discharge capacity, thus reducing the RTE. Additionally, the charge capacity is different in each cycle as some of the charge back cycles reached the termination current of 0.8 A before the time limit, while for other cases, the time limit was reached before the current decreased to 0.8 A. Hence the decrease and fluctuation in RTE are not primarily due to battery degradation. The FR (80–60)% has slightly lower RTE than FR (57–37)%. For the energy neutral frequency regulation signal, as explained earlier, the total discharge Ah > total charge Ah for the FR duty cycle, since RTE < 1. The charge back Ah is determined by applying a 0.75% overcharge to the difference between total discharge Ah and total charge Ah for the FR (80–60)% duty cycle, while no overcharge was applied to the FR (57–37)% duty cycle since gassing is expected to be insignificant in this low SOC level. Hence FR (57–37)% has a slightly higher RTE.

4.7. Mapping Hybrid Electric Vehicle (HEV) Degradation with Grid Services

It was determined that batteries subjected to a micro hybrid electric vehicle (HEV) drive cycle operating at 5% DOD in the 90–85% SOC range experienced no sulfation of the negative electrode, while batteries subjected to a mild HEV drive cycle operating in the 90–70% SOC range experienced mild sulfation, and batteries subjected to a full HEV drive cycle operating in the 80–30% SOC range experienced rapid sulfation [20]. The PS duty cycle appears to map with the mild HEV cycle, with a slightly lower average SOC, but getting fully charged after each cycle. The PS 8-h duty cycle spends more time at SOC < 75%, hence may have more sulfation at the negative. The FR (57–37)% duty cycle has a slightly lower average SOC than a full HEV drive cycle, is charged to only 57% SOC at the end of each cycle and is expected to show greater sulfation of the negatives. The FR (80–60)% duty cycle has an average SOC halfway between mild HEV and full HEV and is expected to experience sulfation greater than mild HEV and less than full HEV. The PS duty cycle and the FR (80–60)% duty cycle are expected to see greater water loss compared to the FR (57–37)% duty cycle. Table 4 below provides a mapping of grid services degradation with that experienced by various HEV cycles.

5. Conclusions

Leveraging upon work done on the degradation of lead acid batteries used for hybrid electric, degradation mechanisms of batteries used in micro, mild, and full HEV are mapped with the grid service duty cycles used in this work. Post-cycling tests have been proposed to validate the hypothesis for dominant failure modes for each duty cycle.
Assigning different durations within the charge or discharge current pulse, ohmic, charge transfer and mass transport resistances are estimated. Higher ohmic resistance for PS 8-h relative to PS 2-h is explained by the longer duration spent at <70% SOC for the former, while similar ohmic resistance increase for the PS 8-h and FR (80–60)% is explained by higher water loss for the former balanced by the higher sulfation for the latter related to 3.5× longer time at <70% SOC for the FR (80–60)% grid service. The higher charge transfer resistance during the charge pulse at the start of testing may be related to extended storage prior to test, resulting in sulfation, which is subsequently reversed. This hypothesis is further validated by the spike in charge transfer resistance for the charge pulse for the FR (57–37)% duty cycle after a 4-month stand at open circuit, which is also reversed upon further testing. The higher mass transport resistance for the charge pulse also correlates with grid services with greater expected sulfation, with the value highest for FR (57–37)% and lowest for PS 2-h. Hence these measurements provide very useful insights into the degradation mechanisms for various grid services. The higher resistance during charge across all duty cycles places limitation on maximum power for energy neutral grid services such as frequency regulation.
Regardless of the duty cycle, capacity loss increased with an increase in internal resistance, with nearly the same slope for all duty cycles. For FR (57–37)%, while the capacity decreases as expected with increase in resistance, there is reversal in this trend with a slight increase in capacity as resistance increases, which appears to signal a switch from negative limit to positive limit related to reversal of the dense sulfation at the negative. Such signatures provide insights into battery management approaches for VRLA used in various grid services, taking into account the initial positive & negative electrode active material ratio and electrolyte content to maximize battery operating life.
While positive active material shedding does not appear to be the main failure mode for PS duty cycles. it may play a bigger role for the FR duty cycle, due to multiple contractions and expansions of the active mass within a 24-h duty cycle. This needs to be taken into consideration while using VRLA batteries for frequency regulation and other services such as renewable smoothing that are associated with volatile signals. The capacity loss per energy throughput is highest for grid services with the highest potential for sulfation—FR (57–37)% > FR (80–60)% > PS 8 h > PS 2 h—thus highlighting the need for the mitigation of sulfation to be a top priority. This is achieved by minimizing electrolyte stratification, which affects both electrodes, and by increasing negative electrode surface area to ensure uniform current distribution by addition of suitable expanders.

Author Contributions

Conceptualization, V.V.V., E.C.T., D.M.R. and V.L.S.; Formal analysis, N.S.; Funding acquisition, D.M.R. and V.L.S.; Methodology, N.S., V.V.V. and E.C.T.; Software, E.C.T.; Supervision, V.V.V., D.M.R. and V.L.S.; Writing—original draft, N.S. and V.V.V.; Writing—review & editing, N.S., V.V.V., E.C.T. and G.L. All authors have read and agreed to the published version of the manuscript.

Funding

This research was funded by the U.S. Department of Energy (DOE) Office of Electricity under contract number 57558. The APC was funded by the U.S. Department of Energy (DOE) Office of Electricity.

Institutional Review Board Statement

Not applicable.

Informed Consent Statement

Not applicable.

Data Availability Statement

Data is contained in the figures and tables of this article. Supporting data for the figures and tables are available from the corresponding author.

Acknowledgments

This work was funded by the U.S. Department of Energy (DOE) Office of Electricity under contract number 57558 through Pacific Northwest National Laboratory (Validated Safety & Reliability). Pacific Northwest National Laboratory is operated by Battelle for the DOE under contract number DE-AC05-76RL01830.

Conflicts of Interest

The authors declare that they have no known competing financial interest or personal relationship that could have appeared to influence the work reported in this paper.

References

  1. Malhotra, A.; Battke, B.; Beuse, M.; Stephan, A.; Schmidt, T. Use cases for stationary battery technologies: A review of the literature and existing projects. Renew. Sustain. Energy Rev. 2016, 56, 705–721. [Google Scholar] [CrossRef]
  2. May, G.J.; Davidson, A.; Monahov, B. Lead batteries for utility energy storage: A review. J. Energy Storage 2018, 15, 145–157. [Google Scholar] [CrossRef]
  3. Choi, D.; Shamim, N.; Crawford, A.; Huang, Q.; Vartanian, C.K.; Viswanathan, V.V.; Paiss, M.D.; Alam, M.J.E.; Reed, D.M.; Sprenkle, V.L. Li-ion battery technology for grid application. J. Power Sources 2021, 511, 230419. [Google Scholar] [CrossRef]
  4. Cook, G.; Spindler, W. Low-maintenance, valve-regulated, lead/acid batteries in utility applications. J. Power Sources 1991, 33, 145–161. [Google Scholar] [CrossRef]
  5. Da Silva, V.C.; Gimenes, A.L.V.; Udaeta, M.E.M. Energy Storage and Multi-Source System for Reduction Energy Costs in the Consumer-Side. J. Power Energy Eng. 2021, 9, 80–105. [Google Scholar] [CrossRef]
  6. Luo, X.; Wang, J.; Dooner, M.; Clarke, J. Overview of current development in electrical energy storage technologies and the application potential in power system operation. Appl. Energy 2015, 137, 511–536. [Google Scholar] [CrossRef] [Green Version]
  7. Chen, H.; Cong, T.N.; Yang, W.; Tan, C.; Li, Y.; Ding, Y. Progress in electrical energy storage system: A critical review. Prog. Nat. Sci. 2009, 19, 291–312. [Google Scholar] [CrossRef]
  8. Ibrahim, H.; Ilinca, A.; Perron, J. Energy storage systems—Characteristics and comparisons. Renew. Sustain. Energy Rev. 2008, 12, 1221–1250. [Google Scholar] [CrossRef]
  9. Gandhi, K.S. Modeling of Sulfation in a Flooded Lead-Acid Battery and Prediction of its Cycle Life. J. Electrochem. Soc. 2020, 167, 13538. [Google Scholar] [CrossRef]
  10. David, G.; Enos, S.N.L. Lead-Acid Batteries and Advanced Lead-Carbon Batteries; Sandia National Lab: Albuquerque, NM, USA, 2014. [Google Scholar]
  11. Nelson, R. The basic chemistry of gas recombination in lead-acid batteries. JOM 2001, 53, 28–33. [Google Scholar] [CrossRef]
  12. Culpin, B.; Rand, D. Failure modes of lead/acid batteries. J. Power Sources 1991, 36, 415–438. [Google Scholar] [CrossRef]
  13. Moseley, P. Improving the valve-regulated lead–acid battery. J. Power Sources 2000, 88, 71–77. [Google Scholar] [CrossRef]
  14. Cooper, A.; Moseley, P. Progress in overcoming the failure modes peculiar to VRLA batteries. J. Power Sources 2003, 113, 200–208. [Google Scholar] [CrossRef]
  15. Moseley, P.T.; Rand, D.A.; Peters, K. Enhancing the performance of lead–acid batteries with carbon – In pursuit of an understanding. J. Power Sources 2015, 295, 268–274. [Google Scholar] [CrossRef]
  16. Bullock, K.R. Carbon reactions and effects on valve-regulated lead-acid (VRLA) battery cycle life in high-rate, partial state-of-charge cycling. J. Power Sources 2010, 195, 4513–4519. [Google Scholar] [CrossRef]
  17. Culpin, B. Separator design for valve-regulated lead/acid batteries. J. Power Sources 1995, 53, 127–135. [Google Scholar] [CrossRef]
  18. Pavlov, D. Chapter 1—Invention and Development of the Lead–Acid Battery. In Lead-Acid Batteries: Science and Technology; Pavlov, D., Ed.; Elsevier: Amsterdam, The Netherlands, 2011; pp. 3–28. [Google Scholar]
  19. Rand, D.A.J.; Moseley, P.T. 3—Lead–Acid Battery Fundamentals. In Lead-Acid Batteries for Future Automobiles; Garche, J., Karden, E., Moseley, P.T., Rand, D.A.J., Eds.; Elsevier: Amsterdam, The Netherlands, 2017; pp. 97–132. [Google Scholar]
  20. Pavlov, D. Chapter 4—Lead Alloys and Grids. Grid Design Principles. In Lead-Acid Batteries: Science and Technology; Pavlov, D., Ed.; Elsevier: Amsterdam, The Netherlands, 2011; pp. 149–221. [Google Scholar]
  21. Lam, L.; Ceylan, H.; Haigh, N.; Lwin, T.; Rand, D. Influence of residual elements in lead on oxygen- and hydrogen-gassing rates of lead-acid batteries. J. Power Sources 2010, 195, 4494–4512. [Google Scholar] [CrossRef]
  22. Pavlov, D. Chapter 14—Valve-Regulated Lead–Acid (VRLA) Batteries. In Lead-Acid Batteries: Science and Technology, 2nd ed.; Pavlov, D., Ed.; Elsevier: Amsterdam, The Netherlands, 2017; pp. 593–620. [Google Scholar]
  23. Wagner, R. 8—Positive Active-Materials for Lead–Acid Battery Plates. In Lead-Acid Batteries for Future Automobiles; Garche, J., Karden, E., Moseley, P.T., Rand, D.A.J., Eds.; Elsevier: Amsterdam, The Netherlands, 2017; pp. 235–267. [Google Scholar]
  24. Pavlov, D. Chapter 7—Additives to the Pastes for Positive and Negative Battery Plates. In Lead-Acid Batteries: Science and Technology; Pavlov, D., Ed.; Elsevier: Amsterdam, The Netherlands, 2011; pp. 311–361. [Google Scholar]
  25. Fernández, M.; Valenciano, J.; Trinidad, F.; Muñoz, N. The use of activated carbon and graphite for the development of lead-acid batteries for hybrid vehicle applications. J. Power Sources 2010, 195, 4458–4469. [Google Scholar] [CrossRef]
  26. Pavlov, D.; Nikolov, P.; Rogachev, T. Influence of expander components on the processes at the negative plates of lead-acid cells on high-rate partial-state-of-charge cycling. Part I: Effect of lignosulfonates and BaSO4 on the processes of charge and discharge of negative plates. J. Power Sources 2010, 195, 4435–4443. [Google Scholar] [CrossRef]
  27. Boden, D.; Loosemore, D.; Spence, M.; Wojcinski, T. Optimization studies of carbon additives to negative active material for the purpose of extending the life of VRLA batteries in high-rate partial-state-of-charge operation. J. Power Sources 2010, 195, 4470–4493. [Google Scholar] [CrossRef]
  28. C&D Technologies, Carbon Battery. Available online: http://www.energyinsight.co.za/wp-content/uploads/2015/06/Lead-Carbon-gen-brochure-en-1411-Final.pdf (accessed on 28 April 2022).
  29. Conover, D.R.; Crawford, A.J.; Viswanathan, V.V.; Ferreira, S.; Schoenwald, D. Protocol for Uniformly Measuring and Expressing the Performance of Energy Storage Systems; PNNL-22010 Rev 2; Pacific Northwest National Lab: Richland, WA, USA, 2016. [Google Scholar]
  30. NH Research Inc. 9200 Series Battery Module/Pack Test System; NH Research Inc.: Irvine, CA, USA; Available online: https://nhresearch.com/power-electronics-test-systems-and-instruments/battery-module-pack-test-systems/high-power-battery-charge-discharge-test-systems-9200-series/ (accessed on 9 February 2022).
  31. Research, P.A. Basics of Electrochemical Impedance Spectroscopy. In Instruments, Complex Impedance in Corrosion; In Application Note AC-1; Gamry Instruments Inc.: Warminster, PA, USA, 2006. [Google Scholar]
  32. Alavi, S.M.M.; Birkl, C.R.; Howey, D.A. Time-domain fitting of battery electrochemical impedance models. J. Power Sources 2015, 288, 345–352. [Google Scholar] [CrossRef]
  33. Schweiger, H.-G.; Obeidi, O.; Komesker, O.; Raschke, A.; Schiemann, M.; Zehner, C.; Gehnen, M.; Keller, M.; Birke, P. Comparison of Several Methods for Determining the Internal Resistance of Lithium Ion Cells. Sensors 2010, 10, 5604–5625. [Google Scholar] [CrossRef] [PubMed] [Green Version]
  34. Barai, A.; Uddin, K.; Widanage, W.D.; McGordon, A.; Jennings, P. A study of the influence of measurement timescale on internal resistance characterisation methodologies for lithium-ion cells. Sci. Rep. 2018, 8, 21. [Google Scholar] [CrossRef] [PubMed]
  35. Peters, K.; Rand, D.A.J.; Moseley, P.T. 7—Performance-Enhancing Materials for Lead–Acid Battery Negative Plates. In Lead-Acid Batteries for Future Automobiles; Garche, J., Karden, E., Moseley, P.T., Rand, D.A.J., Eds.; Elsevier: Amsterdam, The Netherlands, 2017; pp. 213–234. [Google Scholar]
  36. Williford, R.E.; Viswanathan, V.V.; Zhang, J.-G. Effects of entropy changes in anodes and cathodes on the thermal behavior of lithium ion batteries. J. Power Sources 2009, 189, 101–107. [Google Scholar] [CrossRef]
  37. Salkind, A.J.; Kelley, J.J.; Cannone, A.G. Handbook of Batteries, 2nd ed.; McGraw-Hill, Inc.: New York, NY, USA, 1995. [Google Scholar]
  38. Electropaedia, Thermal Management. Available online: https://www.mpoweruk.com/thermal.htm#thermochemical (accessed on 1 February 2022).
  39. Kohya, Y.; Takeda, T.; Takano, K.; Kohno, M.; Yotsumoto, K.; Ogata, T. A deterioration estimating system for 200-Ah sealed lead-acid batteries. In Proceedings of the Intelec 94, Vancouver, BC, Canada, 30 October–3 November 1994. [Google Scholar]
  40. Hollenkamp, A.; Constanti, K.; Huey, A.; Koop, M.; Aputeanu, L. Premature capacity-loss mechanisms in lead/acid batteries. J. Power Sources 1992, 40, 125–136. [Google Scholar] [CrossRef]
  41. Battery University. BU-804b: Sulfation and How to Prevent It. Last Updated 2 November 2021. Available online: https://batteryuniversity.com/article/bu-804b-sulfation-and-how-to-prevent-it (accessed on 9 February 2022).
  42. Badeda, J.; Huck, M.; Sauer, D.U.; Kabzinski, J.; Wirth, J. 16—Basics of Lead–Acid Battery Modelling and Simulation. In Lead-Acid Batteries for Future Automobiles; Garche, J., Karden, E., Moseley, P.T., Rand, D.A.J., Eds.; Elsevier: Amsterdam, The Netherlands, 2017; pp. 463–507. [Google Scholar]
  43. Kurisawa, I.; Iwata, M. Internal resistance and deterioration of VRLA battery-analysis of internal resistance obtained by direct current measurement and its application to VRLA battery monitoring technique. In Proceedings of the Power and Energy Systems in Converging Markets, Melbourne, Australia, 23–23 October 1997. [Google Scholar]
Figure 1. Experimental setup of the BESS, comprising battery module DC storage, and battery tester representing the grid and site controller.
Energies 15 03389 g001
Figure 2. Measurement of internal resistance by DC pulse current.
Energies 15 03389 g002
Figure 3. (a) Voltage and current profile of the capacity test; positive current is charge; (b) Temperature and current profile of the capacity test.
Energies 15 03389 g003
Figure 4. Capacity retention vs. (a) months (b) number of cycles and (c) cumulative discharge energy for four different duty cycles.
Energies 15 03389 g004
Figure 5. Internal resistance vs. SOC (%) profile (a) for discharge pulse (b) for charge pulse.
Energies 15 03389 g005
Figure 6. Capacity retention vs. internal resistance profile for four duty cycles.
Energies 15 03389 g006
Figure 7. Resistance vs. elapsed test duration (a) ohmic, (b) charge transfer, (c) mass transport, (d) total.
Energies 15 03389 g007
Figure 8. Internal resistance vs. SOC (%) for four duty cycles. (a) peak shaving 2-h rate (b) peak shaving 8-h rate (c) frequency regulation (80–60)% and (d) frequency regulation (57–37)%.
Energies 15 03389 g008
Figure 9. RTE (a) peak shaving duty cycle (b) frequency regulation duty cycle.
Energies 15 03389 g009
Table 1. Failure Modes of Absorbed Glass Mat Valve Regulated Lead Acid Batteries.
Failure ModeCauseMitigation
Positive grid corrosionNegative electrode depolarization during recombination for CV charge
Water loss resulting in higher electrolyte concentration
Electrolyte stratification, resulting in greater corrosion at electrode bottom
Mitigate water loss
Reduce stratification by appropriate choice of separator fiber diameter
Use of Pb-Ca-Sn alloy to increase creep strength and reduce grid corrosion
Water lossCharge current exceeds recombination rate
Charge voltage not temperature compensated
Positive grid corrosion
Proper charge control
Mitigate grid corrosion
Adjust initial electrolyte amount, negative excess and optimize separator porosity to minimize hydrogen evolution through the design life
Positive active material sheddingGrid growth due to corrosion
Active material expansion by 2× during charge
Mitigate grid corrosion
Optimize separator fiber diameter distribution to balance mechanical strength (large diameter) versus wicking characteristics (small diameter)
Electrolyte stratificationPoor separator wickingOptimize separator diameter distribution
α-PbO2 formationElectrolyte stratification
Water loss
Mitigate stratification and water loss
Negative electrode sulfationLow surface area leads to poor charge acceptance
Partial state of charge cycling
Expanders that increase nucleation rate of lead sulfate formation and inhibit crystal growth
High surface area carbon to increase surface area and electronic conductivity of partially charged electrode
Table 2. Peak Shaving Characteristics.
ParameterValue
Module12
DOD50%50%
Initial SOC100%100%
Highest discharge current2-h rate8-h rate
Discharge power (W)730246
Discharge duration (h)~1.2~3.5
Rest after discharge (h)11
Charge back power (W)265265
Charge time (h)~8.5~7.5
Rest after charge (h)22
Total duration for each PS cycle (h)~13~14
Table 3. Frequency regulation characteristics.
ParameterValue
Module12
DOD20%20%
Initial SOC80%,57%
Ending SOC60%,37%
Discharge duration (h)2424
Maximum power (W)10901090
Charge back current10-h rate10-h rate
Total duration for each FR cycle (h)~29~29
Table 4. Mapping of Grid Services Degradation with HEV Cycles.
Drive CycleMicro HEVMild HEVFull HEV
SOC range90–85%90–70%80–30%
Sulfation of negativeNegligibleMildHighest
Grid CorrosionMediumLowerLowest
Water lossMediumLowerLowest
Inactive α-PbO2MediumLowerLowest
Grid services that map to drive cycles PS 2-h lower sulfation, PS 8-h higher sulfation. Both expected to have similar grid corrosion, similar water loss.
FR (80–60)% similar grid corrosion and water loss, greater sulfation
FR (80–60)% lower sulfation, FR (57–37)% higher sulfation, lower grid corrosion and water loss.
Publisher’s Note: MDPI stays neutral with regard to jurisdictional claims in published maps and institutional affiliations.

