Article

Effect of Gaskets Geometry on the Performance of a Reverse Electrodialysis Cell

by
Elier Sandoval-Sánchez
1,
Ziomara De la Cruz-Barragán
1,
Margarita Miranda-Hernández
2 and
Edgar Mendoza
1,*
1
Instituto de Ingeniería, Universidad Nacional Autónoma de México, Ciudad Universitaria, Circuito Exterior s/n, Coyoacán, Mexico City 04510, Mexico
2
Instituto de Energías Renovables, Universidad Nacional Autónoma de México, Priv. Xochicalco, Temixco 62580, Mexico
*
Author to whom correspondence should be addressed.
Energies 2022, 15(9), 3361; https://doi.org/10.3390/en15093361
Submission received: 16 March 2022 / Revised: 27 April 2022 / Accepted: 3 May 2022 / Published: 5 May 2022
(This article belongs to the Special Issue Marine Renewable Energy Technology)

Abstract

:
Salinity gradient energy (SGE) allows the difference in salt concentration in two volumes of water to be harnessed and transformed into clean energy. The most advanced SGE technology is reverse electrodialysis (RED) cells. Recent studies have focused on ways to optimize the flow distribution in the compartments containing the water, for which it is necessary to consider the characteristics of the solutions, the cell dimensions, the operating conditions, as well as their influence on the hydrodynamics and mass transport in the system. In this study, two spacers with different gasket geometry were designed, fabricated, and compared experimentally through voltage and current measurements. The power output was computed, obtaining a maximum power density of 0.14 W/m2. Results show that the geometry of the cell components directly influences the physicochemical principles governing the RED process and is closely related to the cell output parameters. In turn, it is possible to increase the performance of a RED cell by optimizing the gasket geometry by reducing dead zones.

1. Introduction

Salinity gradient energy (SGE) is a relatively novel group of technologies developed to convert the renewable energy source available when two bodies of water with different salt concentrations interact. There are many ways to use salinity gradients to generate energy, the most developed technology for this purpose is reverse electrodialysis (RED) [1]. RED is a technique in which electricity can be generated directly from the chemical potential between solutions of different concentrations by using ion exchange membranes (IEM) [2,3]. An RED cell (Figure 1) is an electrochemical system that consists of a variable number of IEMs alternating with each other; the compartments between the membranes receive both a high concentration solution and a low concentration solution [4]. The concentration difference on both sides of the membrane promotes the diffusion of ions in the concentrated solution through the IEMs into the compartment with the dilute solution, generating an ionic current. In the endplates of the cell, there is an electrode system; this consists of an electrode rinse solution that performs the redox reaction that transforms the ionic current into electric current, and it is collected by the electrodes [2,3].
The development of electrochemical cells has gained much interest, and new studies have focused on optimizing the cell geometry and its configuration. The efficiency of the electrochemical cells depends on several factors [5]:
  • Cell design and components (materials, equipment and cell geometry);
  • Hydrodynamics (flow distribution, pressure drop);
  • Mass transport (mass distribution);
  • Energy transport (potential and current distribution).
Regarding fluid dynamics and mass transport, the pressure drop and concentration polarization are the phenomena that can significantly reduce the efficiency of the membrane processes [6]. In the specialized literature, it has been proposed to compensate the pressure drop within the cell by varying the velocities of the feed solutions, but increasing the pumping power consumption will decrease the net power output of the cell, which is estimated to be proportional to the gross power generated minus the pumping power losses [2,6]. On the other hand, the concentration polarization arises due to high concentration gradients at the boundary layer of the interface formed by the membrane and the fluid mass [7,8]. This phenomenon reduces the potential at the membrane surface generating lesser potential differences throughout the cell, thus decreasing the power output [9]. The magnitude of the polarization depends on the flow rate, the concentration of the feed solutions, and the cell and spacers geometry [10].
Attending to the principles that govern the behavior of reverse electrodialysis devices, Ref. [11] proposed other ways to improve the electrochemical cells’ performance. According to the authors, the efficiency of the stack can be upgraded by modifying the type of membranes, the active area, the cell dimensions, the salinity difference between the solutions, the distance between membranes, the residence time, and the hydrodynamic properties of the flow in the adjacent compartments of the membrane [2]. Therefore, we can understand optimization as any improvement that increases the performance of the studied system [11]. Despite the progress in RED research, the optimization of these devices is a continuous process [4], which depends on the application that the cells will perform.
In this work, the optimization of the RED cell is focused on modifying the geometry of the gaskets. Within a cell, the compartments that let the fluid get in contact with the membrane are constrained by spacers, while leaking is prevented by gaskets. Spacers are widely used in several electrochemical devices to improve the flow of the fluids inside them. They are used for desalination and water treatment processes in electrodialysis cells [12] and for power generation in fuel cells [13]. Its use has also been reported in storage systems such as flow batteries [14] and iron-air batteries [15], as well as in electrochemical reactors for mineral recovery [16] and, generally, in most of the processes related to membranes. The configuration of the spacers is essential for RED cells due to their influence on hydrodynamics and mass transport in the system [6]. Spacers are commonly fabricated with non-conductive polymeric materials. However, the use of conductive spacers made from membranes to reduce stack resistance has also been explored [17].
Some aspects to be considered when optimizing the geometry of the spacers include:
  • Thickness of the gaskets. Flow velocities are higher within thinner compartments, and this can reduce the formation of dead zones and generate a more uniform flow distribution [18];
  • Spacers characteristics. Filament spacing, diameter, arrangement, and angle affect the flow pattern, velocity distribution, flow regime, pressure drops, and mass transport [6];
  • Gaskets geometry. The geometry of the gasket can influence the distribution of the solutions in the compartments; this promotes fluid mixing, reducing polarization phenomena and electrical resistance [18].
In some applications (as the one presented in this research), the spacer and the gasket may be the same element. In our case, a polymeric mesh is used to stabilize the flux and produce a uniform distribution of ions on the membrane [2,19].
There are several studies on the impact of spacer geometry on RED cells potential [6,10,11,20,21]. Furthermore, some studies focus on the variation of the number of inlets of feed solutions [18], but, to the authors’ knowledge, the influence of gasket geometry in cell performance has not been sufficiently investigated. The distribution of potential and current is closely related to the concentration fields and the mass transport flux distribution in the cell; gasket geometry design and materials play a vital role in such distributions [16]. In this work, we compare two different gasket geometries maintaining the same spacer to evaluate the impact of the edge effects. This research demonstrates that a minimal variation in gasket geometry influences hydrodynamic variables, such as flow velocity and dead zone formation, which directly affects cell resistance and power output.

2. Materials and Methods

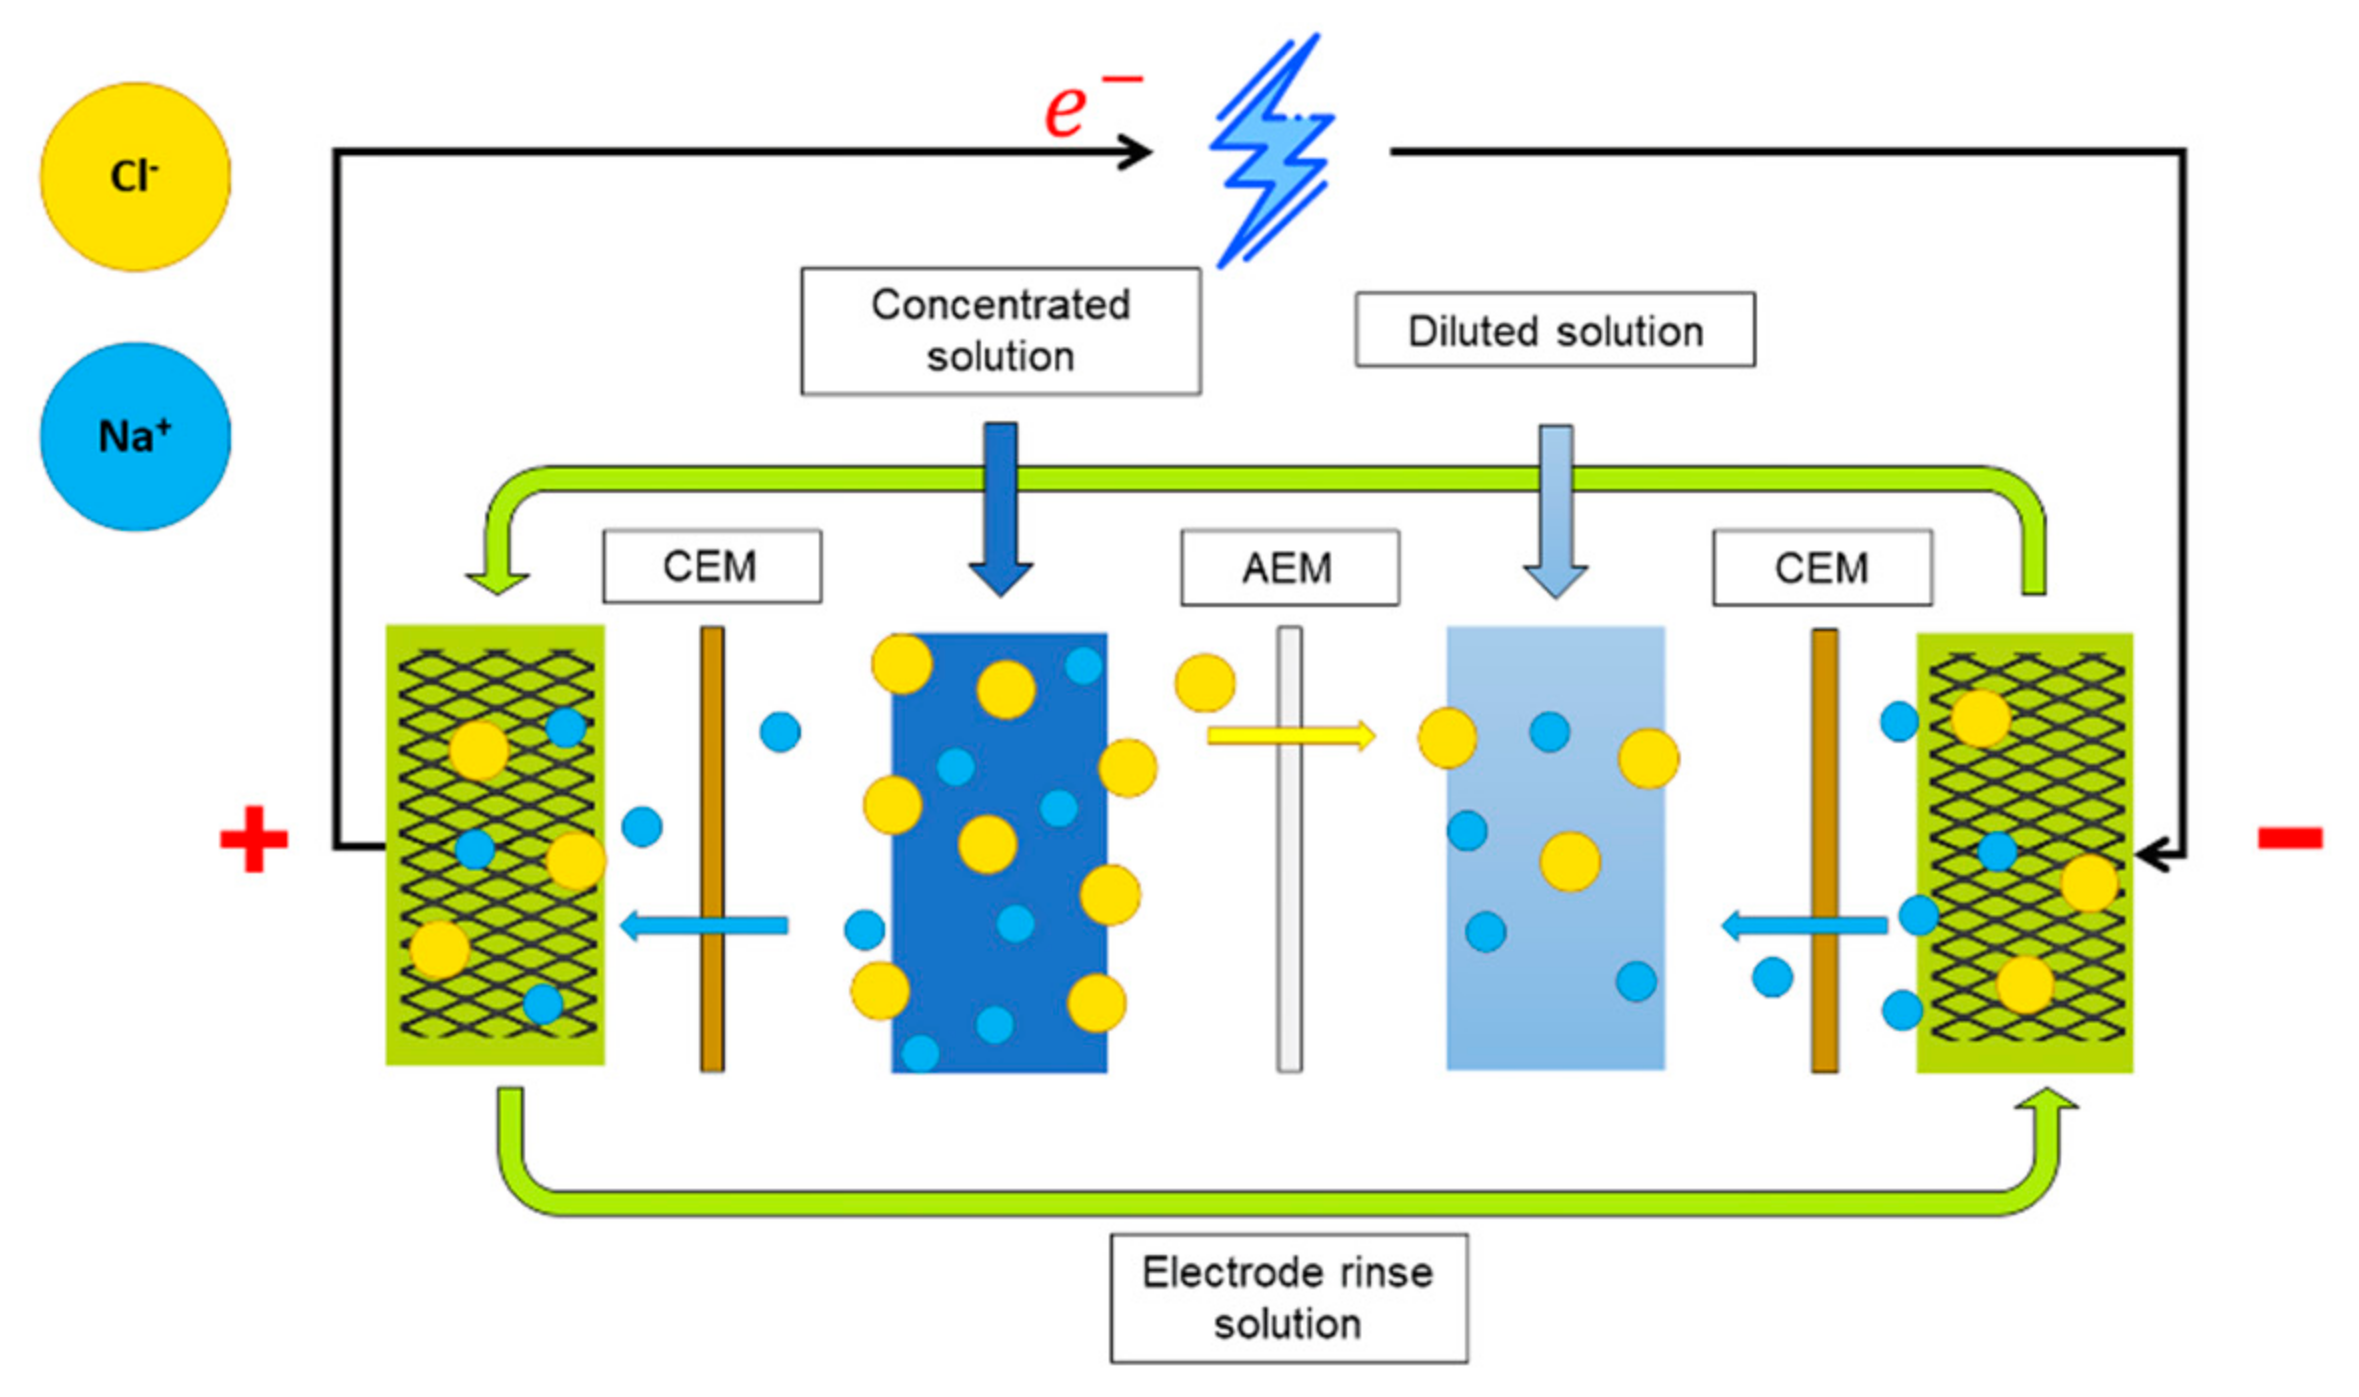
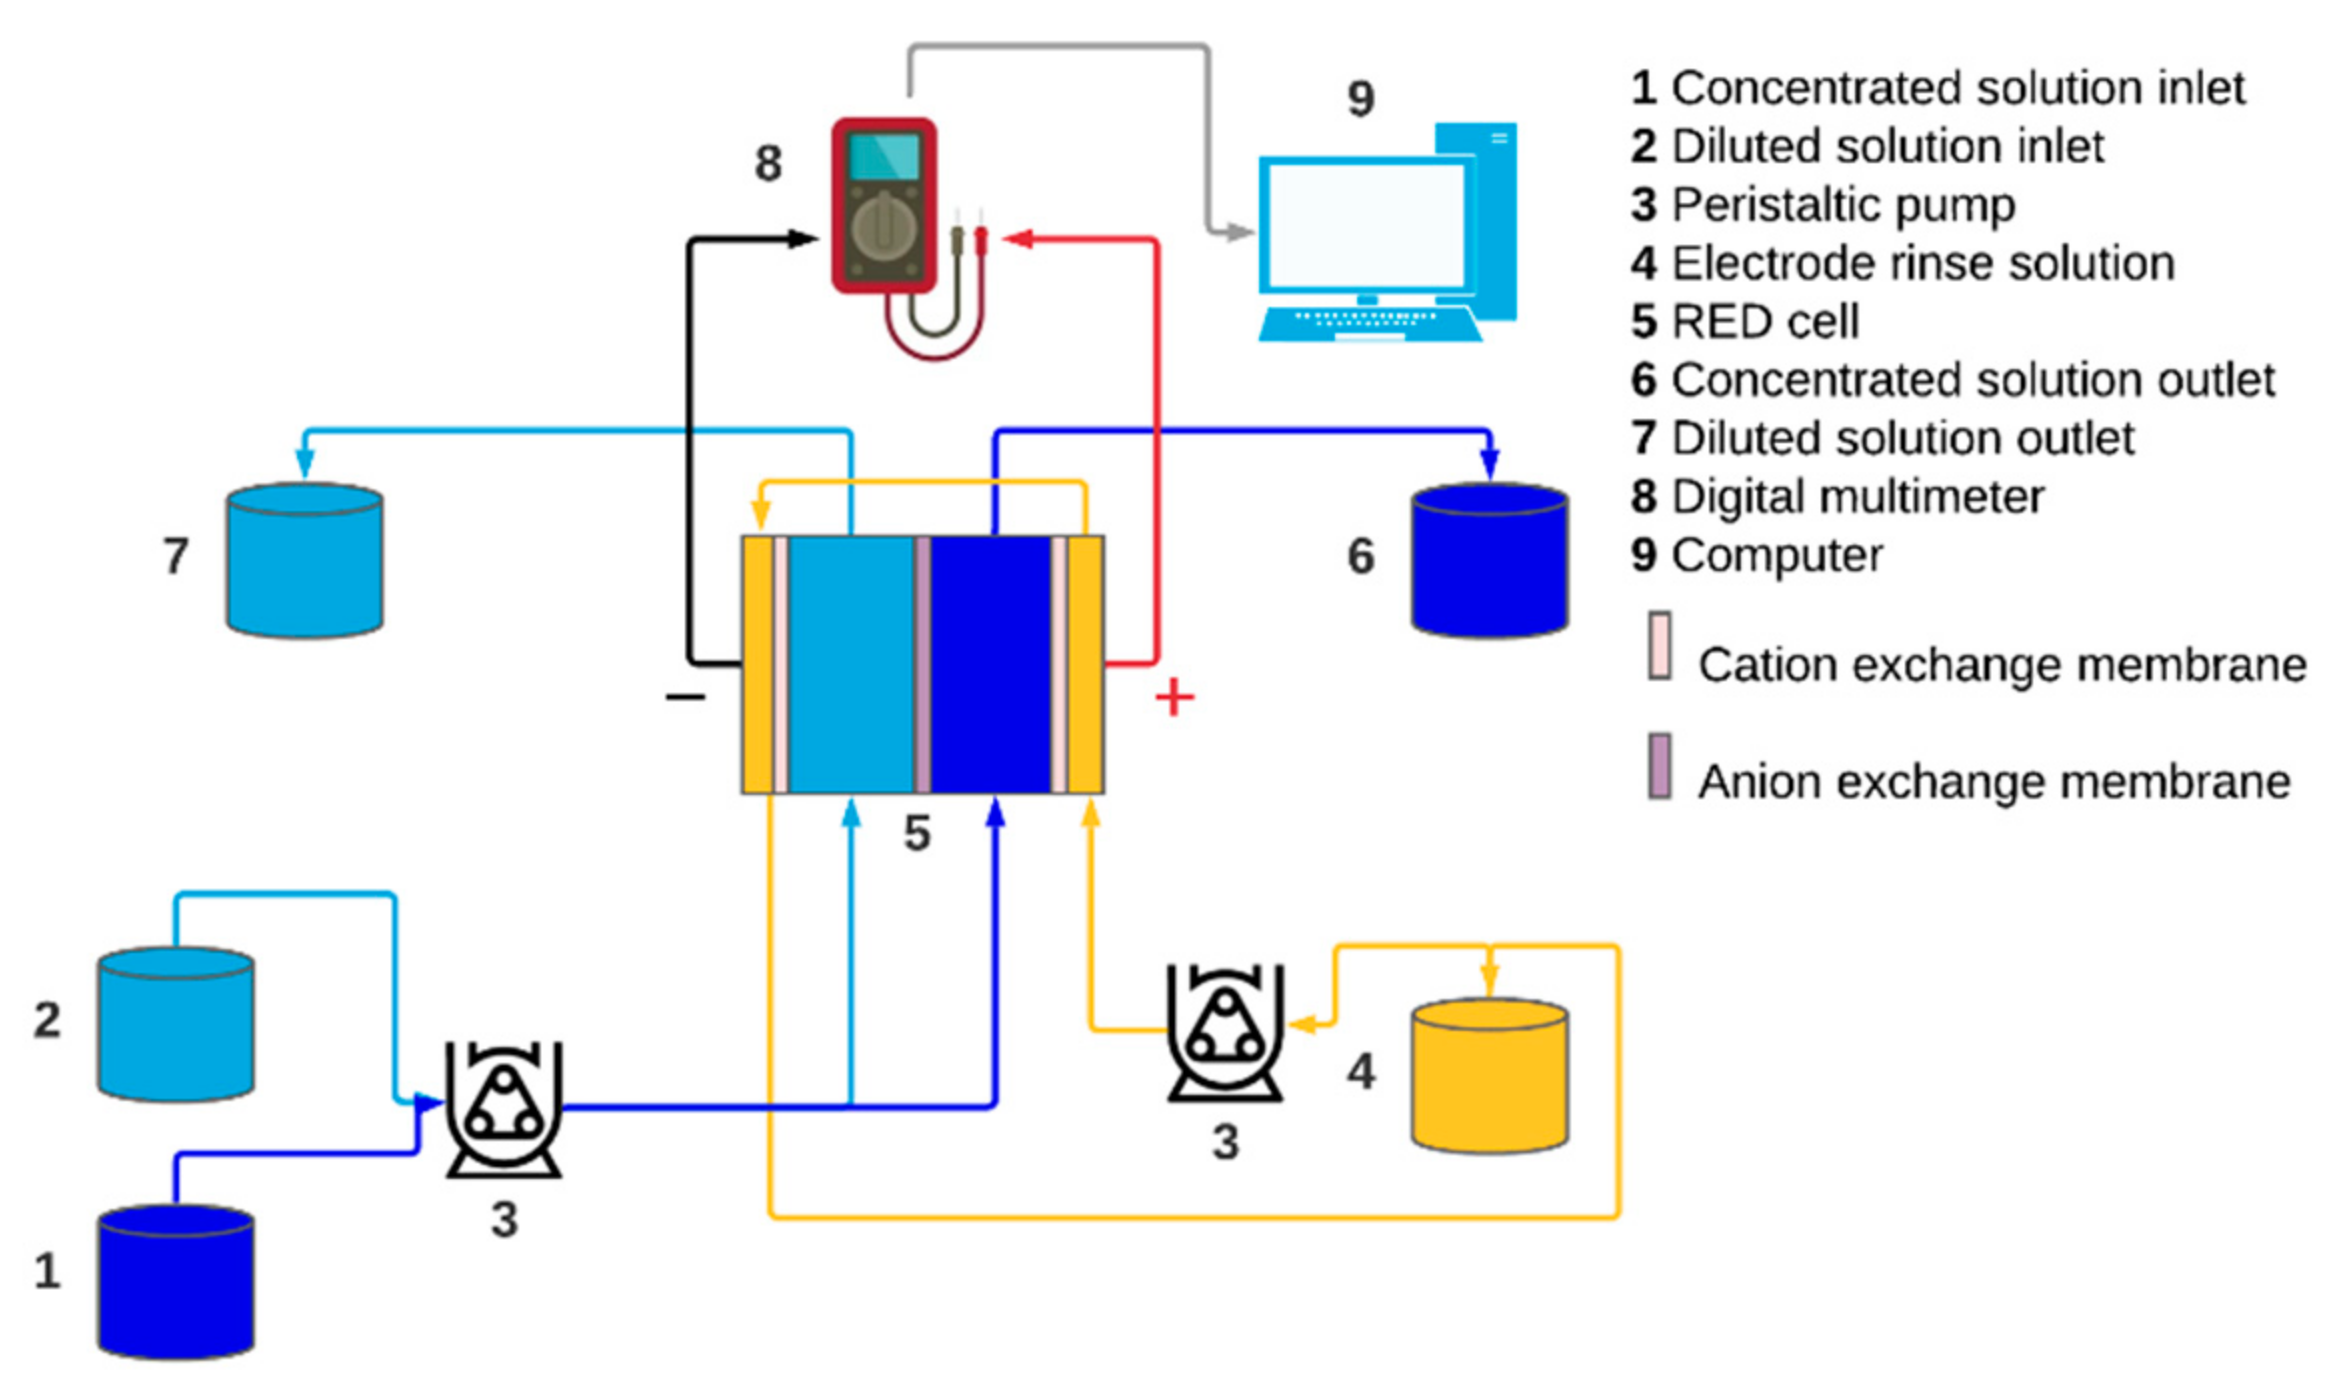
2.1. Reverse Electrodialysis Cell

The studied RED system (Figure 2) consists of a single membrane pair cell with an active area of 10 × 10 cm2. The nylamid endplates were manufactured ‘in house’ using a CNC. The material was selected due to its hardness and mechanic strength [2,3]. Two dimensionally stable titanium mesh electrodes (10 × 10 cm2) coated with ruthenium and iridium (Magneto Special Anodes BV) were placed on the plates, and a silicon gasket was used to prevent leakage of the electrode rinse solution. Polymeric ion exchange membranes (AEM and Fujifilm CEM Type 1) (FUJIFILM Manufacturing Europe BV, Tilburg, The Netherlands) were used. The membranes were conditioned in 0.3 M NaCl solution for 24 h. Table 1 shows the main characteristics of the membranes used.

2.2. Feed Solutions

Two saline solutions were prepared, the high-concentration solution contained 35 g NaCl/L, while the low-concentration solution had 3 g NaCl/L. The concentrations were selected in order to simulate sea water and river water. In Table 2, the characteristics and conditions of the saline feed solutions are presented.
There are several electrode systems that contemplate different materials and electrolytes for RED devices [22], and the K4Fe(CN)6/K3Fe(CN)6 redox couple was selected because it does not present voltage losses due to parasitic reactions. To improve conductivity, NaCl was used as the support electrolyte. The concentration of the support electrolyte was selected based on an average salinity between the concentrated solution and the diluted solution. This system has the advantage of being bidirectional if DSA electrodes are used, so it is possible to change the flow direction [2]; besides that, they have a longer useful life because they do not participate in the reaction [22].
The electrode rinse solution was prepared with 0.1 M of potassium ferrocyanide (K4[Fe(CN)6]·3H2O), 0.1 M potassium ferricyanide (K3[Fe(CN)6]), and 0.3 M NaCl of analytical grade (Sigma-Aldrich, Mexico City, Mexico). All solutions were prepared with deionized water at room temperature (20 °C).
A counter-flow distribution was used inside the cell; the pump output was set at 10 mL/min for the saline solutions and 140 mL/min for the electrode rinse solution. A peristaltic pump with two heads was used for the saline solutions (model 323S Watson Marlow) and a small peristaltic pump for recirculating the electrode rinse solution (model 120U/DV Watson Marlow). A multi-interval electrical conductivity meter was used (HI76302W HANNA Instruments).

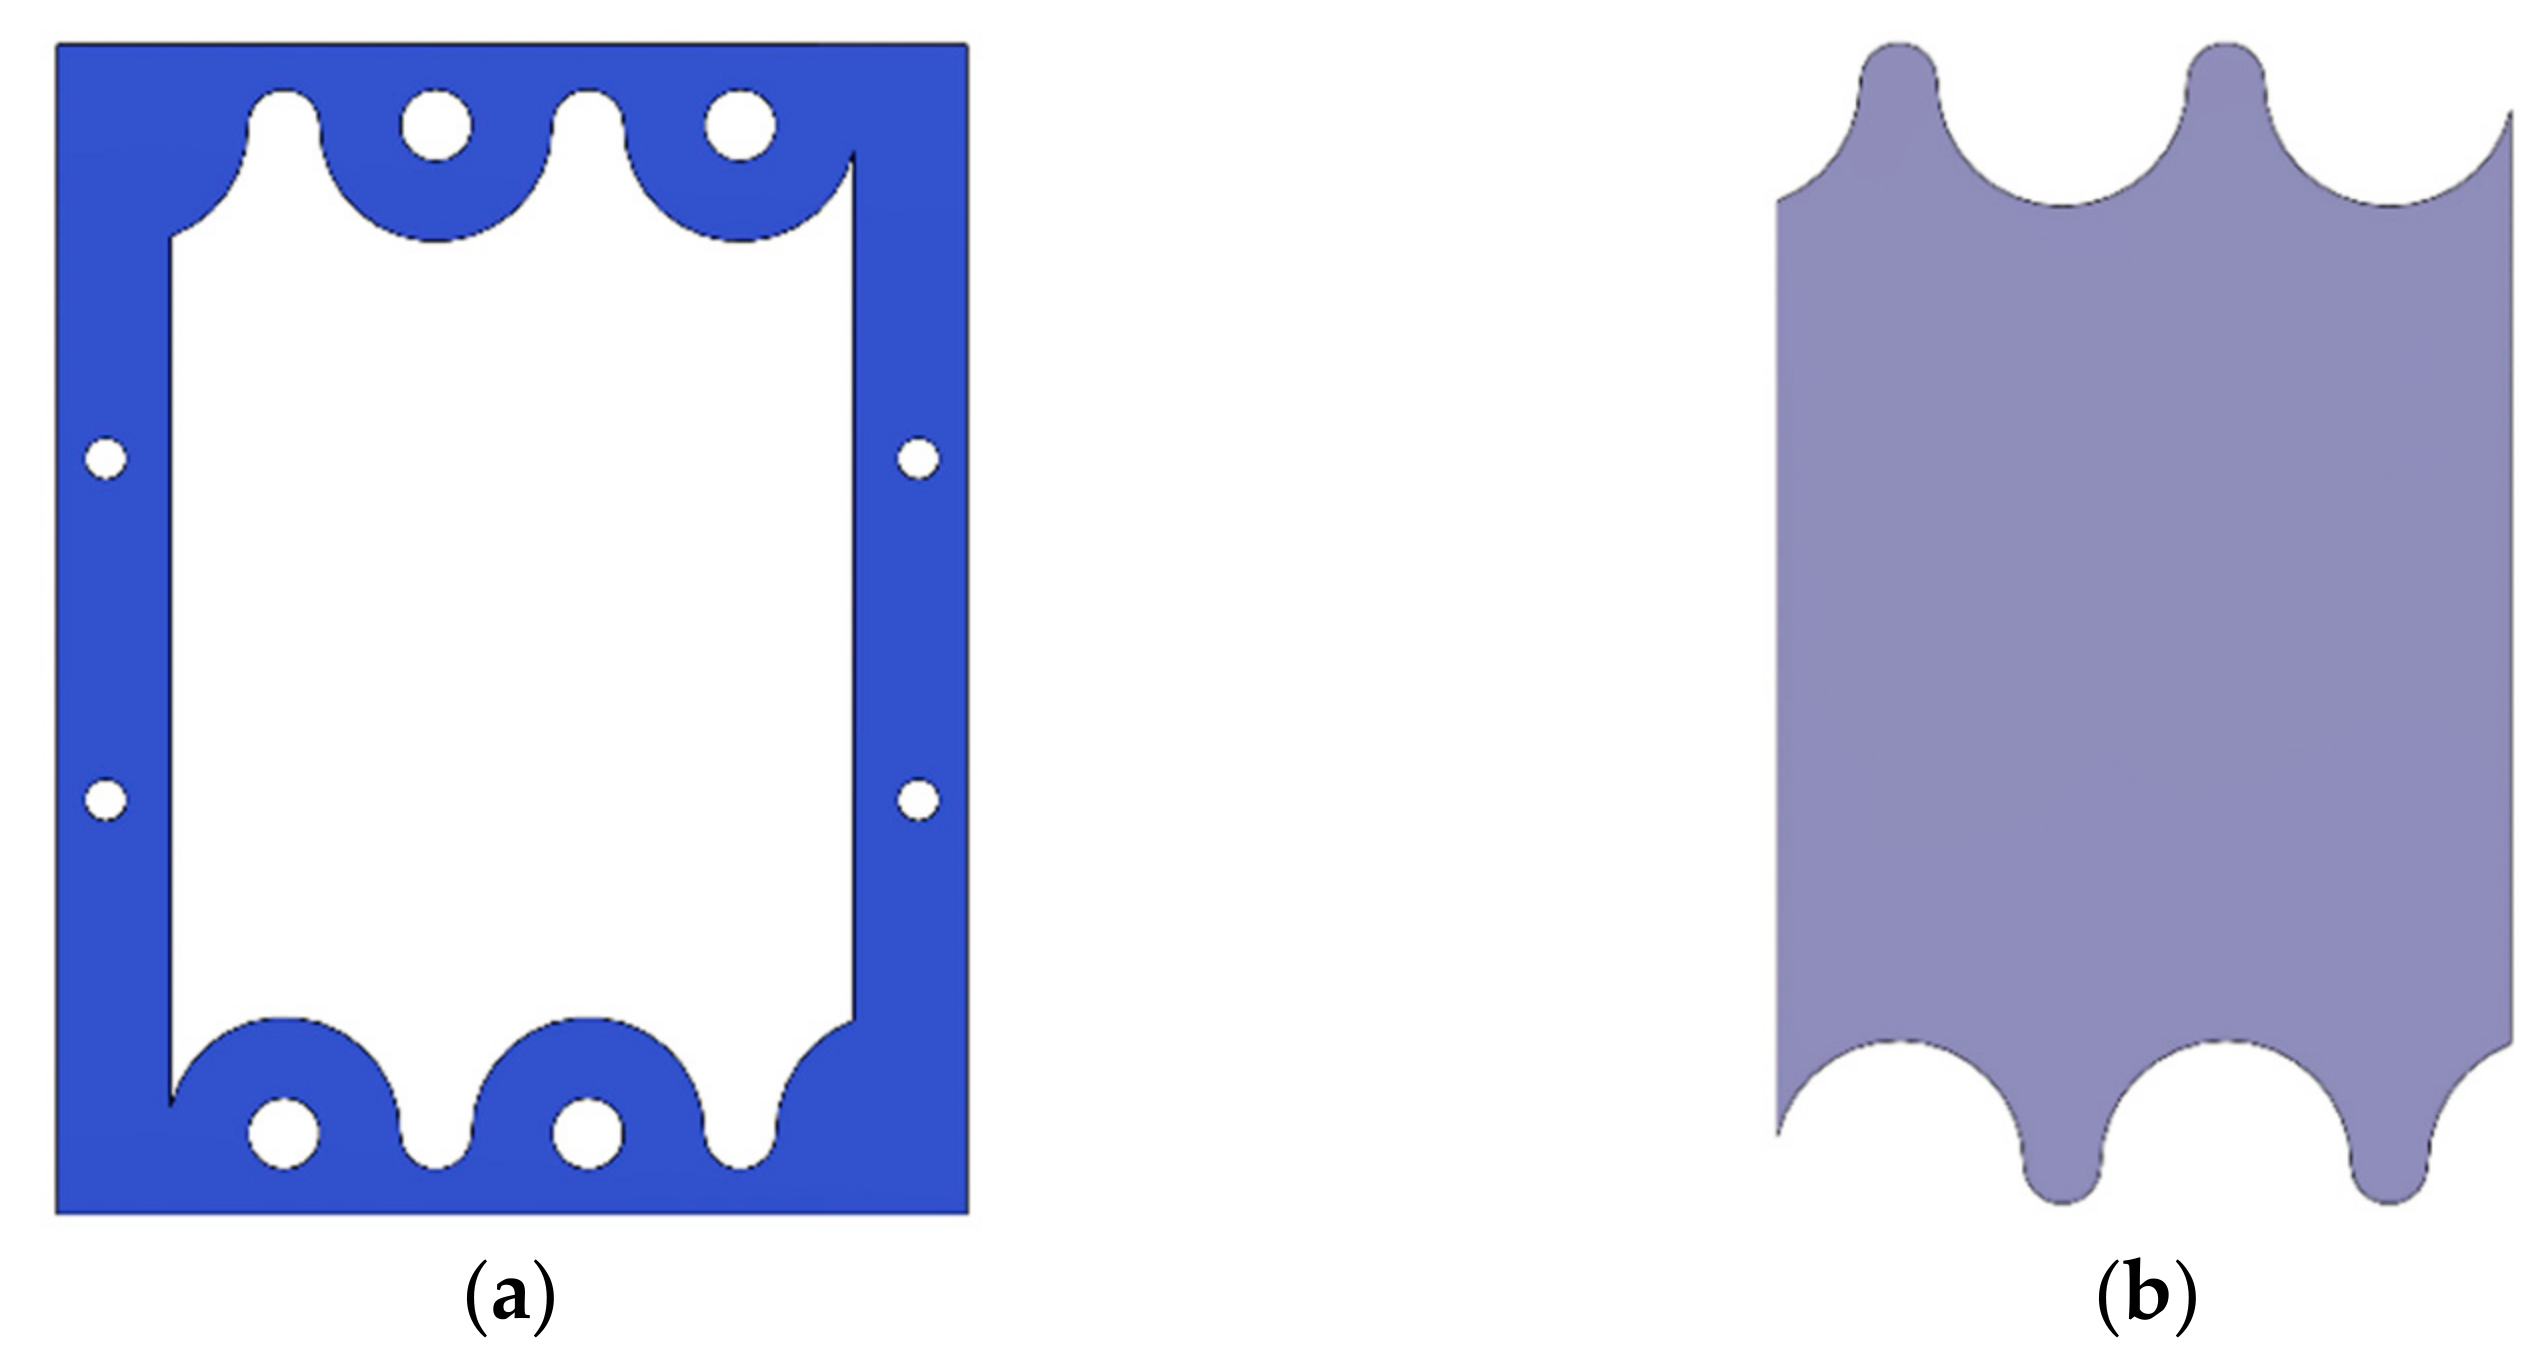
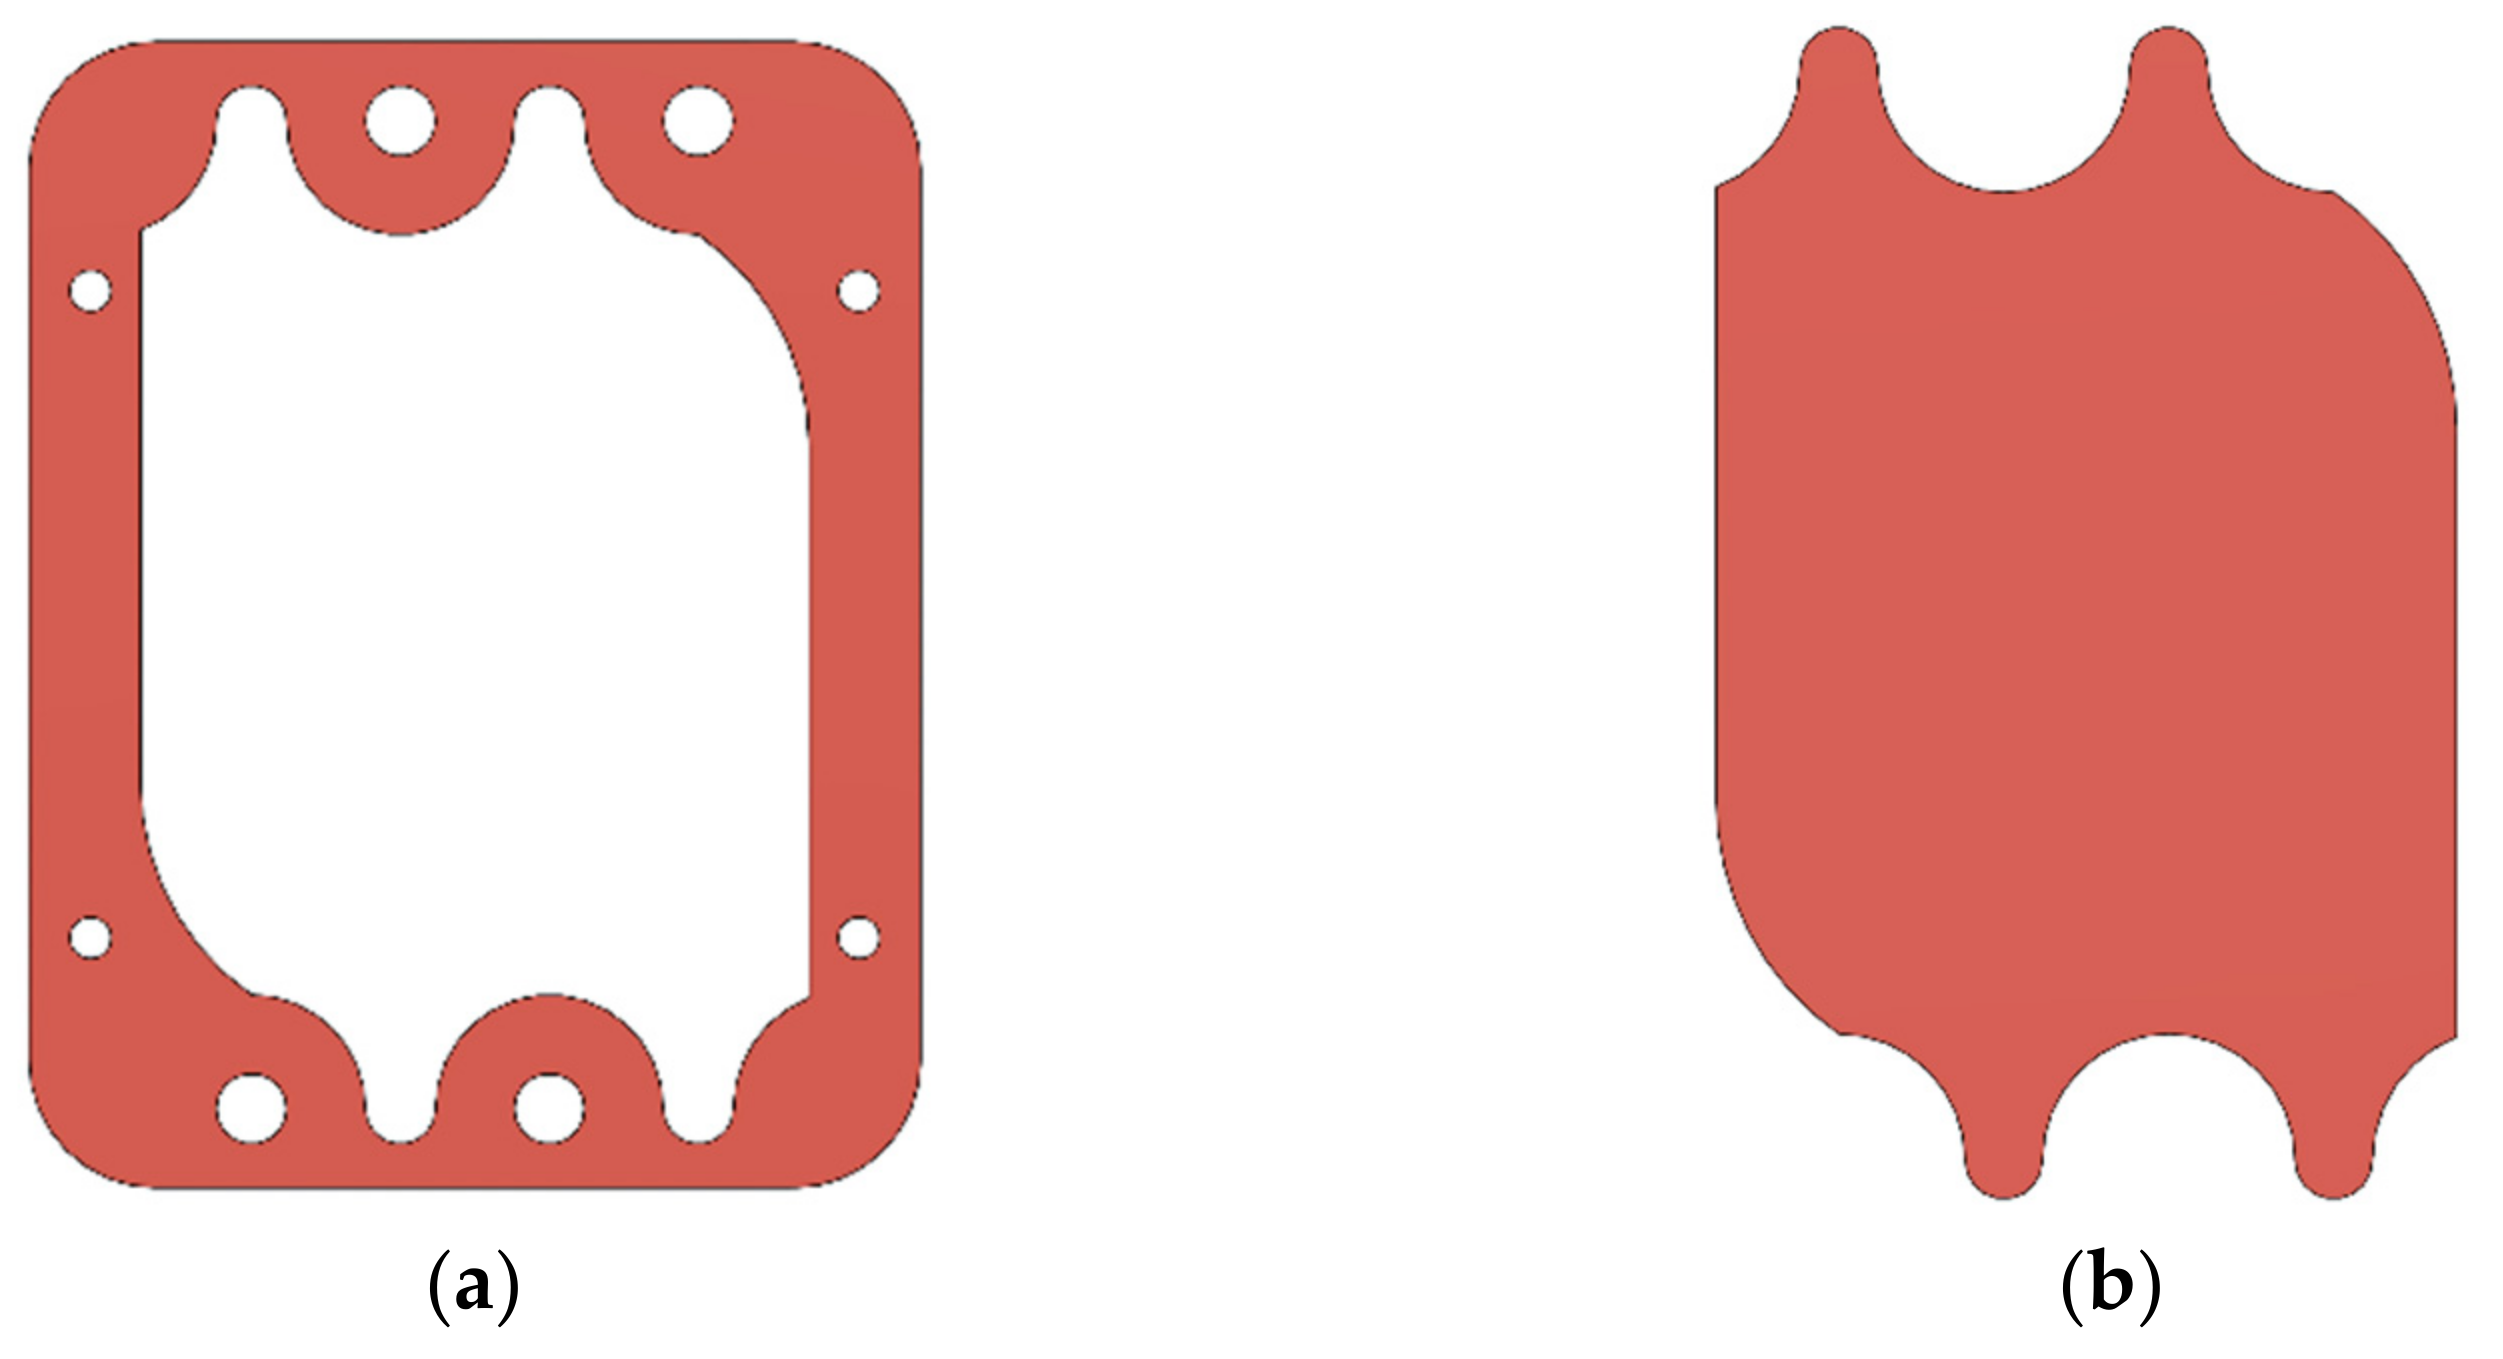
2.3. Gasket Geometry

The conventional gasket geometry used in RED cells were adapted from similar electrochemical devices, such as fuel cells, electrolysis cells, and flow batteries [20]. Gaskets were manufactured for the spacers inspired by the geometry reported in the literature [18,23], which was called G1 (Figure 3a).
The spacers were made with polyamide mesh (provided by Sefar). The mesh has a thickness of 200 μm, a mesh opening of 300 μm, and an opening percentage of 51%. The gasket of the spacer is made of a silicone material ALPAPRINT WHITE NG (provided by CHT) to contain the fluids between the membranes.

2.4. Gaskets Optimization

Since the electrochemical measurements of the cells are a function of the membrane potential, it is a priority to optimize the compartment that contains the solutions and provide flow conditions that promote the exchange of ions on the membrane surface. Due to this, there is a need to study even the slightest change in the geometry of the entire compartment that contains the fluids. Designs that go beyond conventional ones could end up being important contributions to the study of electrochemical reactors.
The second design, G2 (Figure 4a), is a proposal in which the unnecessary area of the spacer where unfavorable hydrodynamic conditions may occur was reduced. In this work, the effects on cell performance by modifying the gaskets without altering the active area are compared. The active area coincides with the electrode area (10 × 10 cm2).
Figure 3b and Figure 4b show the compartments formed by the spacer’s gasket with geometries G1 and G2 with a total area of 142 cm2 and 137 cm2, respectively. The total area difference between the two spacers is 5 cm2, representing an area difference of 3.5%. Reducing the area is expected to increase the velocity and reduce the areas of low velocity or stagnation that can influence concentration polarization phenomena and resistance in the compartment.

2.5. Calculations and Measurement of Parameters

The open circuit voltage (OCV) and short circuit current (CC) of the cell were measured with a portable digital multimeter (Amprobe AM-520), and the voltage (V) and current (I) measurements were carried out with a series of external precision resistors (Rext) in the range of 0.5–100 ohm to obtain the V-I curve and the P-I curve. The power (P) obtained by the cell for each value of external resistor was calculated with Equation (1):
P = V · I     W
The membrane potential (EIEM) can be calculated using an approximation of the Nernst equation [2], presented in Equation (2):
E I E M = α I E M R T z F ln γ c C c γ d C d   V
where αIEM is the membrane selectivity (%), R is the ideal gas constant (8.314 J/mol K), T is the temperature expressed in Kelvin, z is the valence of the ion in solution, F is the Faraday constant, γc and γd are the activity coefficient of the concentrated and dilute solutions, respectively; and Cc and Cd are the concentration of the concentrated and dilute water (mol/L).
The potential of a unit cell is approximately the sum of the potential of the two membranes (EAEM and ECEM). The electrical potential of a RED cell depends on the number of unit cells within the device (N); to calculate the cell potential (Ecell), Equation (3) is used:
E C e l l = N ( E A E M + E C E M )   V
The cell resistance (rcell) is calculated with Equation (4), while the electric current (I) can be calculated with Equation (5) [2]:
r c e l l = R A E M + R C E M + R H + R L    
I = E c e l l r c e l l + R e x t     A
where RAEM and RCEM are the resistance of the membranes (Table 1), and RH and RL are the resistance of the high and low concentration solutions, obtained from the conductivity of the solutions (Table 2).
The power density (Pd) and current density (J) are parameters obtained from the active area of the membrane (Amem) and are calculated with Equations (6) and (7) respectively:
P d = P A m e m     W / m 2
J = I A m e m     A / m 2

3. Results

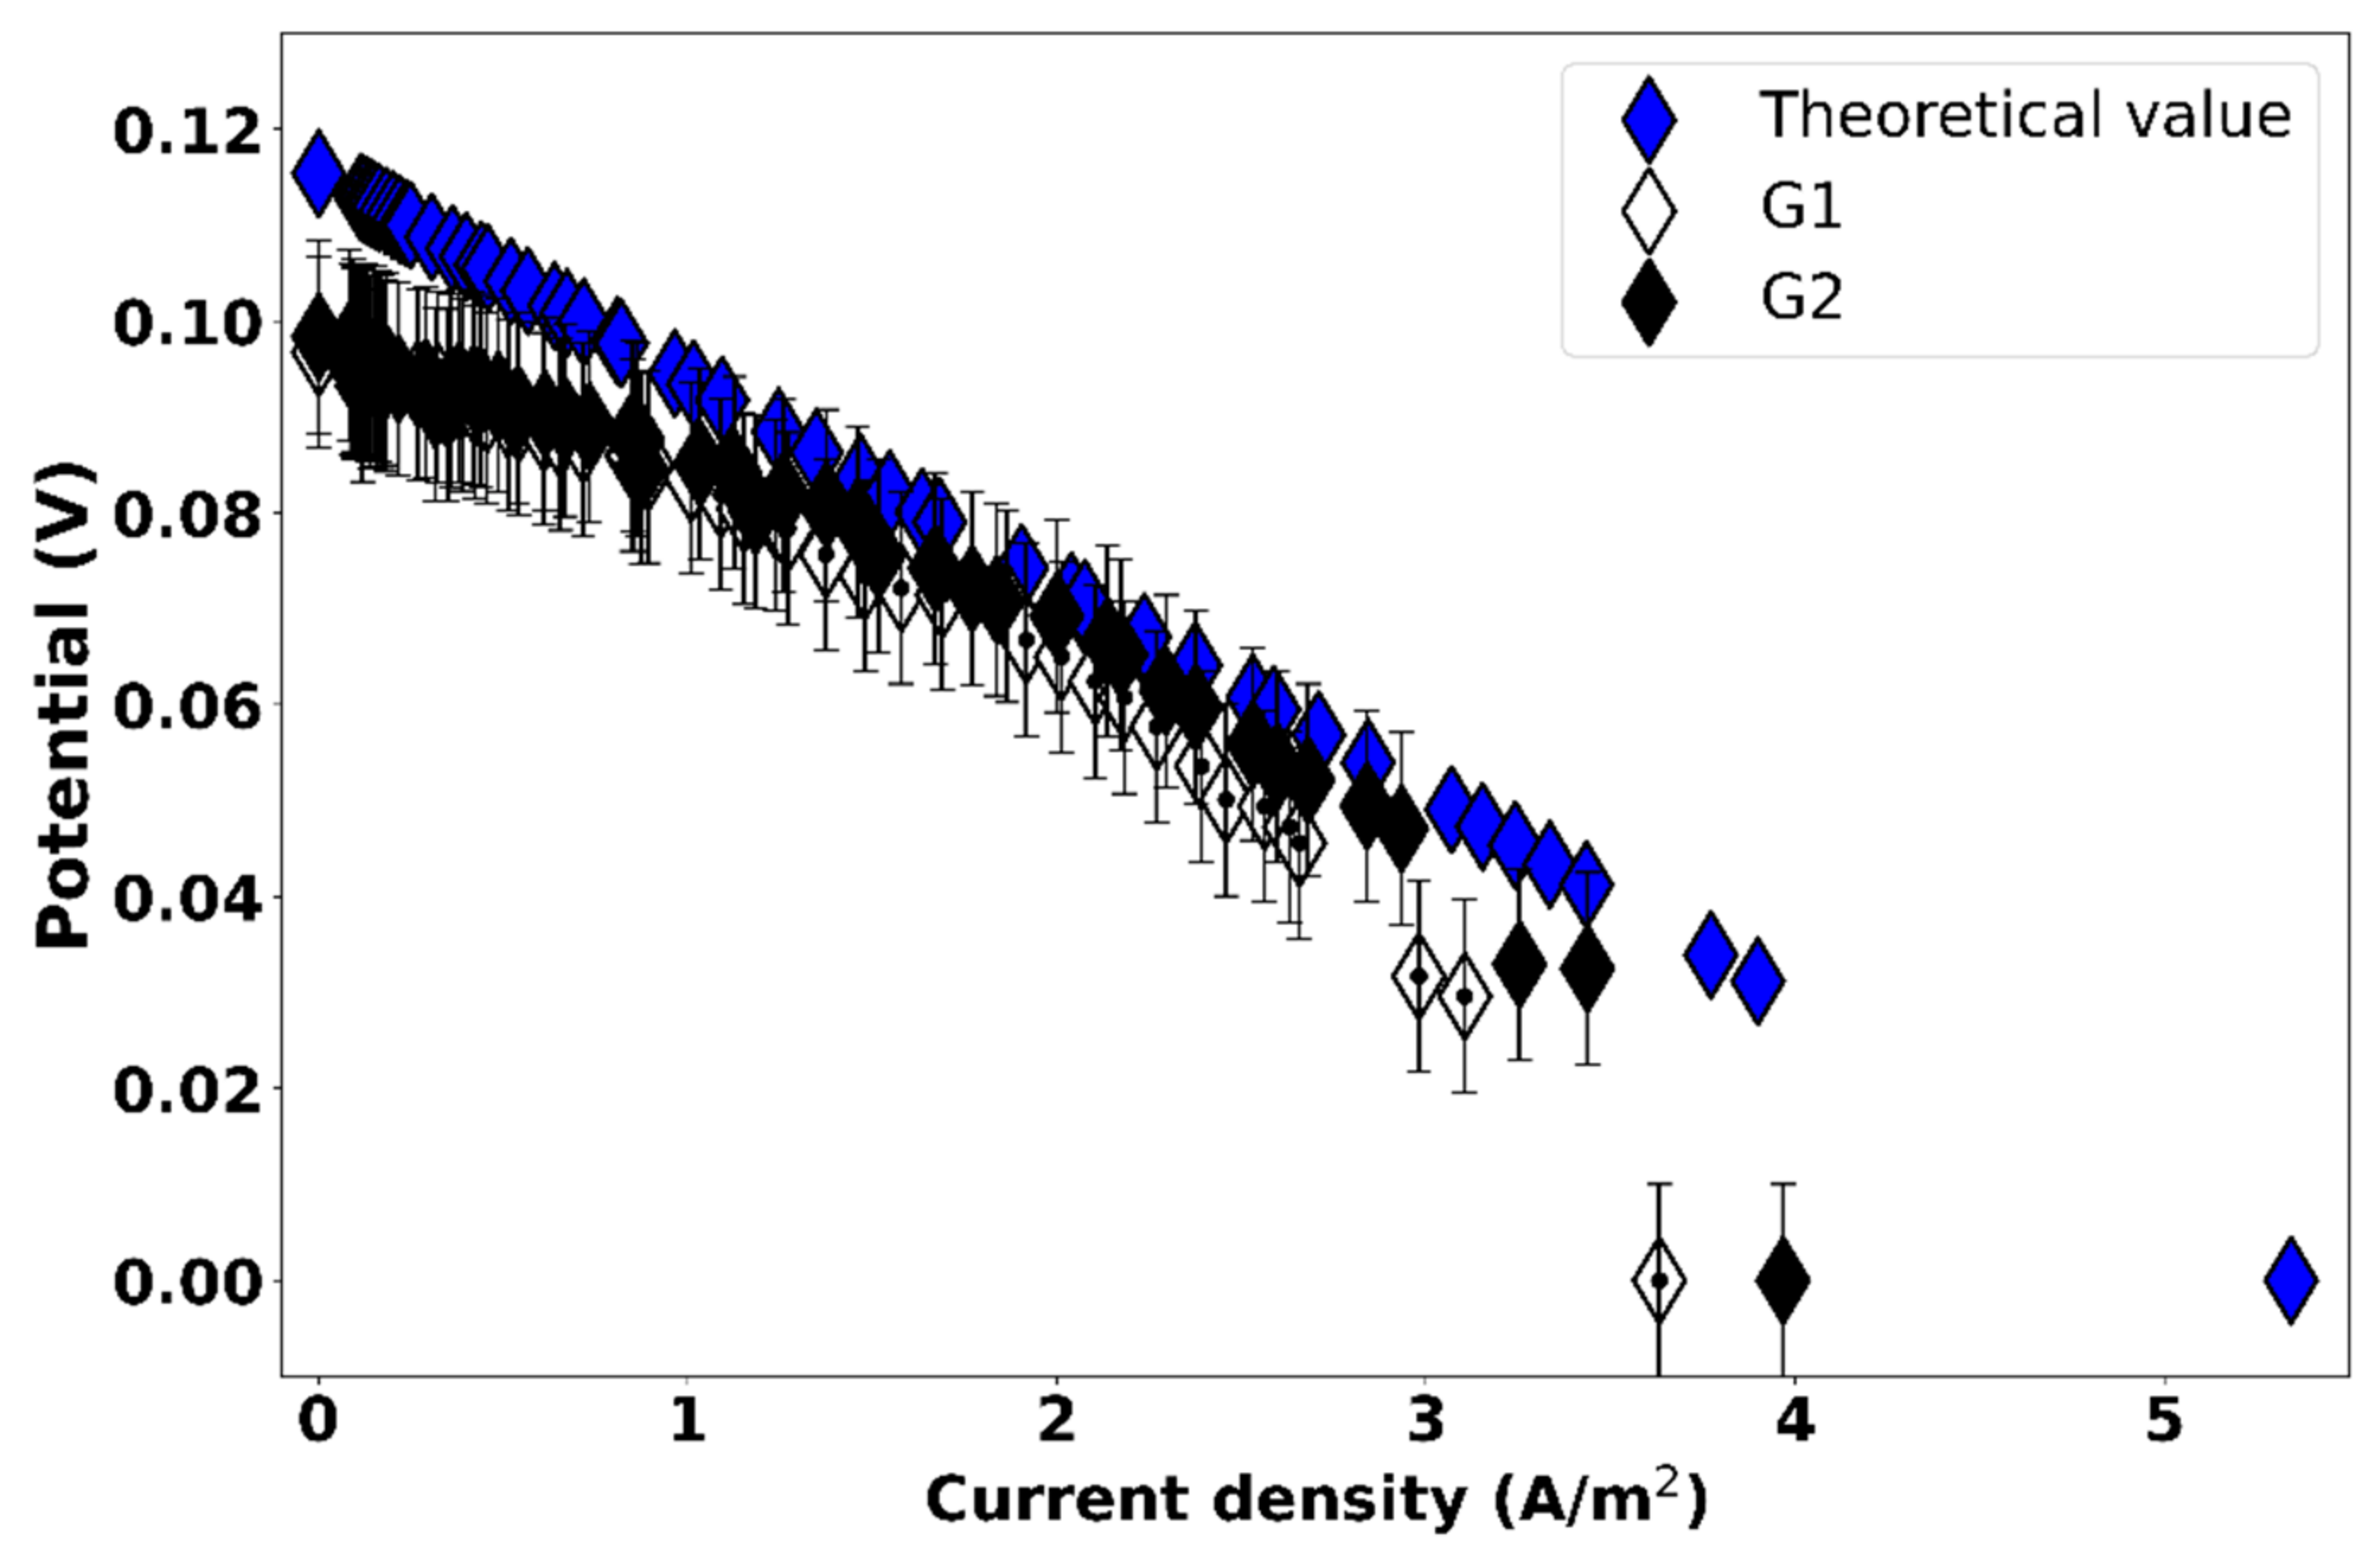
3.1. Effect of Gasket Geometry on the Potential of the RED Cell

Characterization of the RED cell was carried out using the spacers with the G1 and G2 geometries under the previously described conditions. Experiments were performed in triplicate for each geometry, and confidence intervals were calculated. OCV, DC, voltage, and current with each external resistor were measured; then, power, power density, cell resistance, and current density were calculated. Meanwhile, Equations (3)–(5) were used to calculate the theoretical potential, cell resistance, and short circuit current, respectively, using the values of temperature, concentrations, and membrane selectivity from experimental conditions, to compare with the average values obtained with each geometry of the gasket.
Table 3 presents a summary of the most representative measurements of OCV, short circuit current, and cell resistance with each gasket geometry and the theoretical calculations. The potential and current measurements are lower in the spacers G1 and G2 compared to the values obtained theoretically. On the contrary, the theoretical resistance of the cell is lower compared to the experimental ones. This behavior is fully expected and may be since the resistance of the system increases as it moves away from the ideal ohmic behavior. It was observed that the cell resistance with geometry G2 is lower compared to G1; consequently, the short circuit current and the potential obtained are higher than G1.
Figure 5 shows the V-I curves for the spacer G1 and G2, as well as a curve that represents the theoretical behavior of the system. The curves of G1 and G2 are represented in black and white markers with their confidence intervals, while the blue markers show the theoretical behavior of the cell. The maximum value in the V-I curve indicates the OCV obtained, and the minimum value represents the short-circuit current; the cell resistance can be obtained with the slope of the V-I curve in each case. The responses for G1 and G2 are similar for current density values of less than 1 A/m2. Between values of 1 to 3 A/m2, the responses differ. The theoretical curve shows the ideal ohmic behavior. The deviation from the ideal behavior of experimental responses is due to contributions of non-ohmic resistances in the stack, where G1 tends to move further away. Cipollina et al. [2] point out that non-ohmic resistances are phenomena that decrease the driving force due to changes in concentration at the membrane–solution interface. Non-ohmic resistances can be increased by the presence of dead zones due to a non-uniform distribution of the flow throughout the compartment. Therefore, the reduction of probable dead zones in geometry G2 improved the performance of the RED cell, by increasing the potential and decreasing the cell resistance.

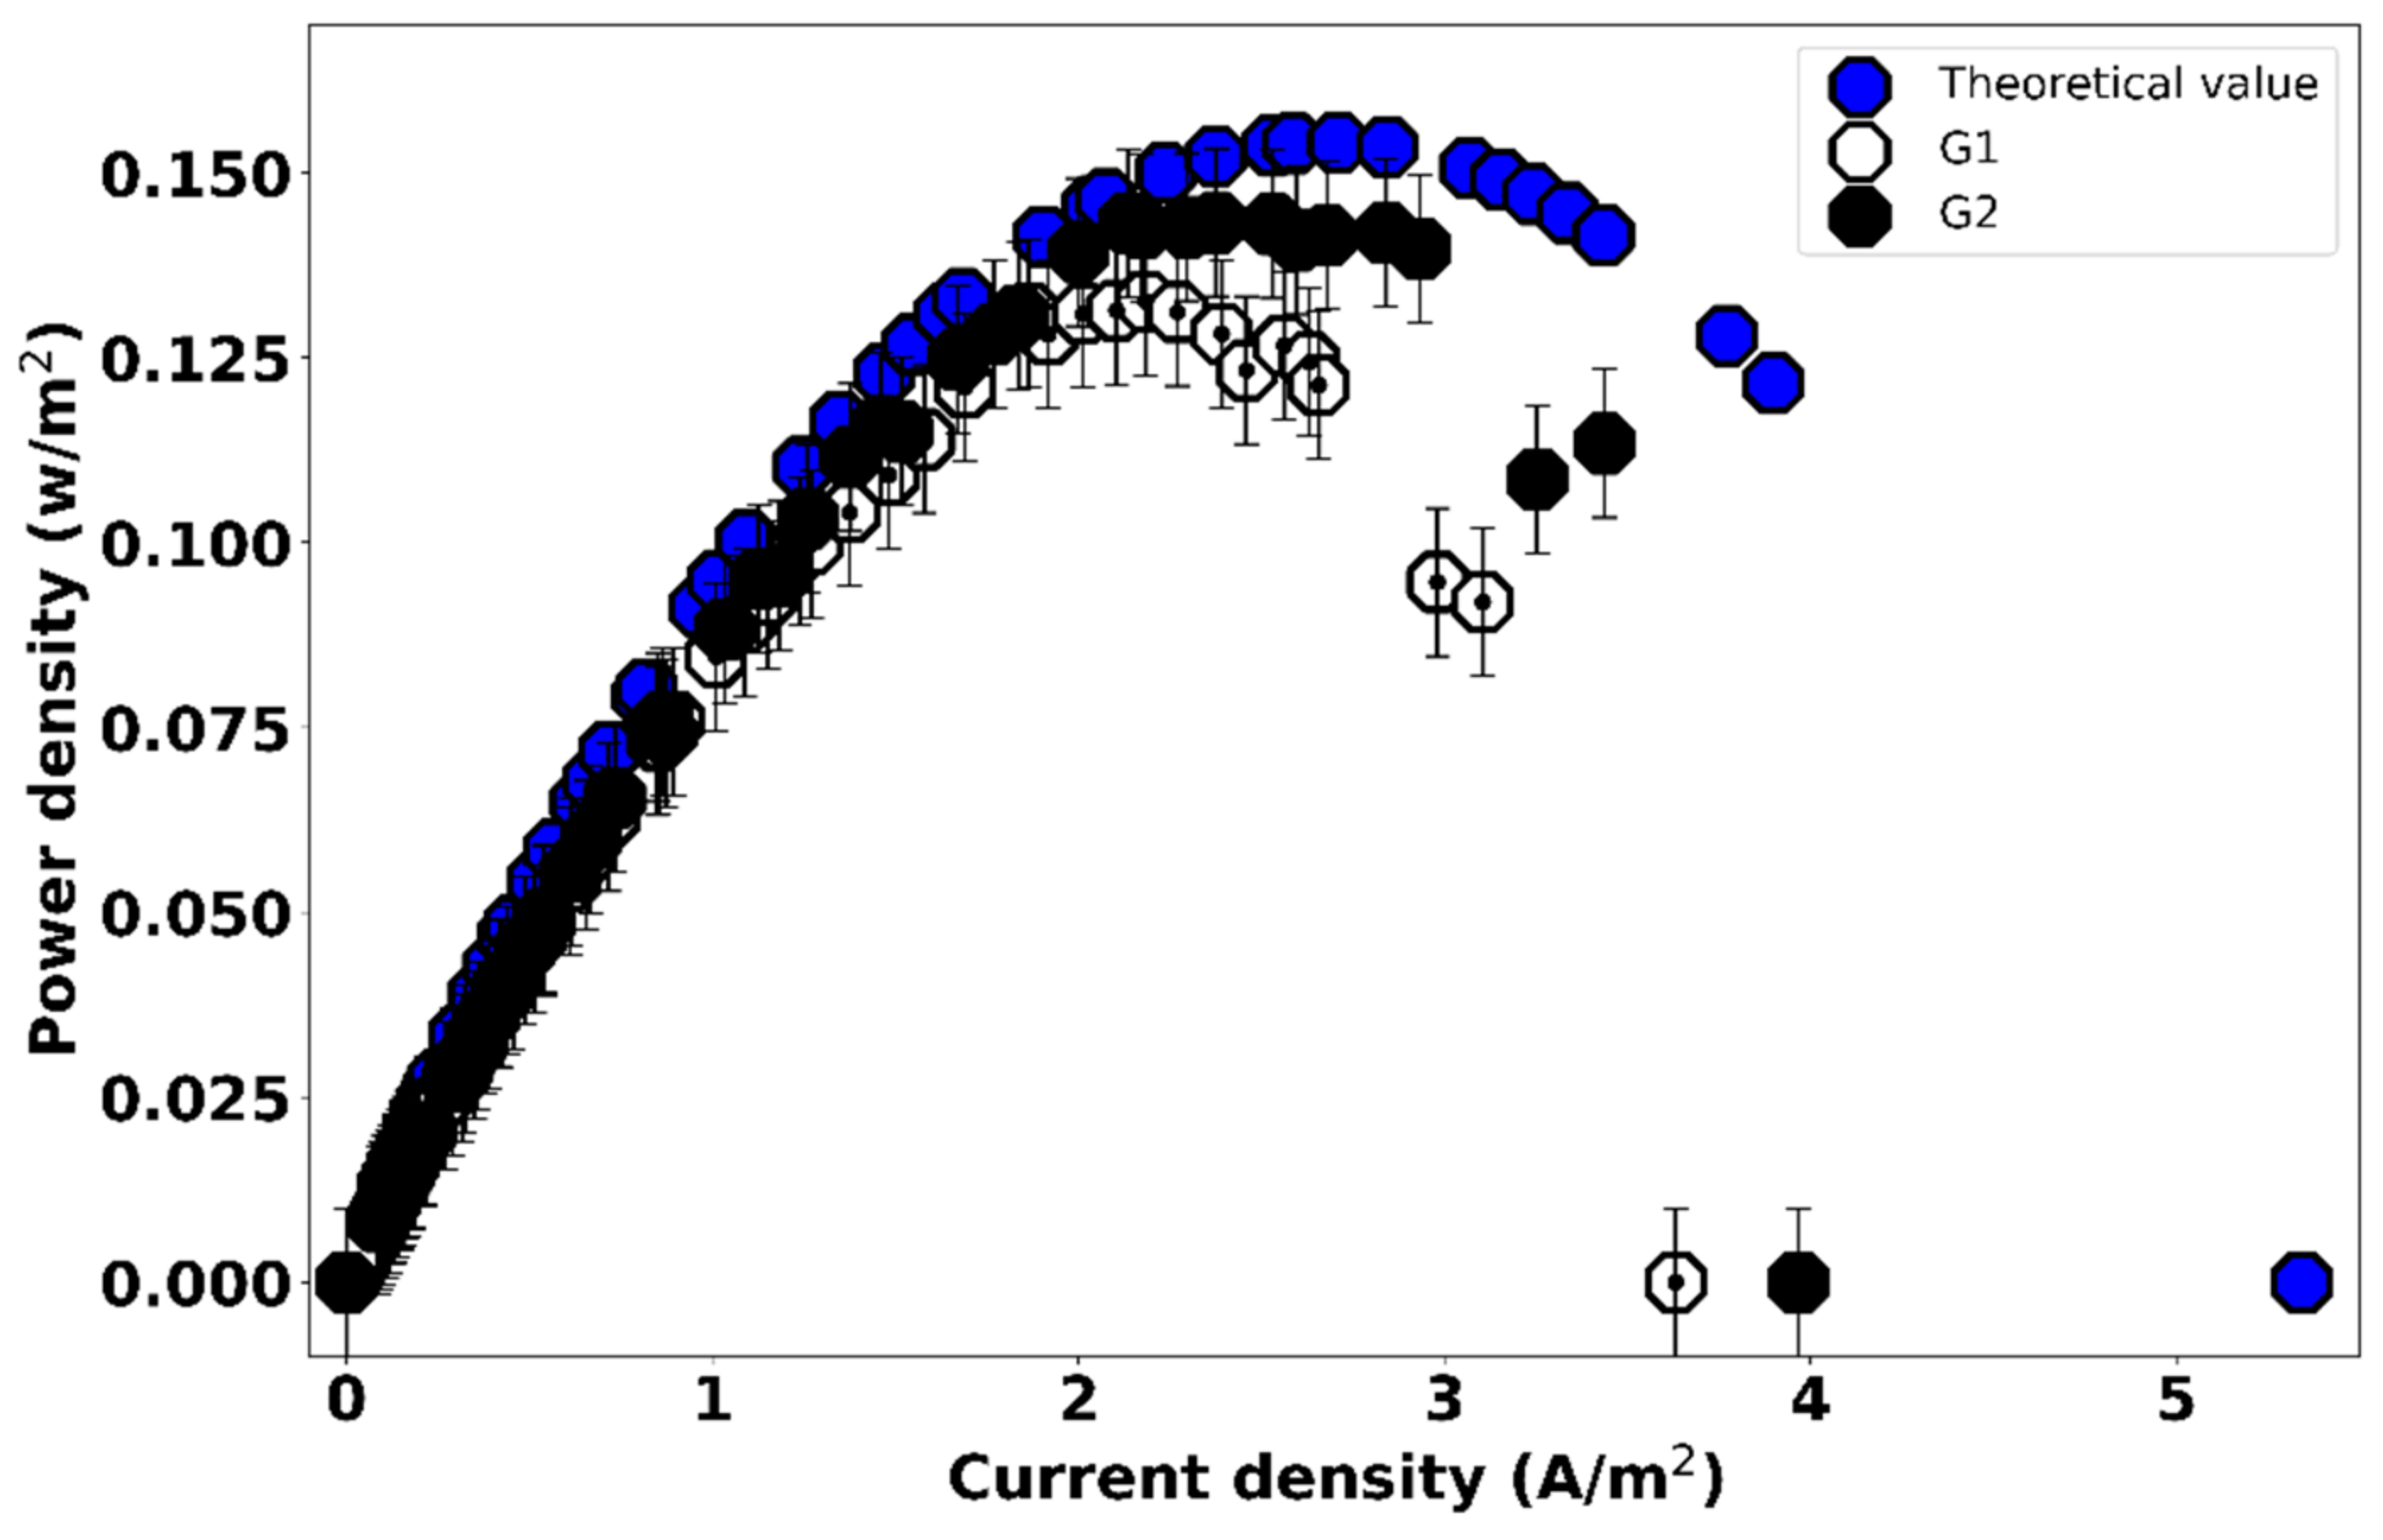
3.2. Effect of Gasket Geometry on the Power Output of the RED Cell

The effect of gasket geometry on the output power density in the RED cell was analyzed. Table 4 shows the comparison of the measurements and the theoretical power values. Optimum current density values are presented; this is the current density at which the cell output power is maximum. This information is especially important in devices focused on power generation. It is observed that the power density generated with the G2 geometry is higher than with G1 but lower than the theoretical one. The output power was analyzed based on the gasket geometries, obtaining 8% more power density by eliminating 5 cm2 of possible dead zones in spacer G2.
Figure 6 shows a graph comparing the performance of the cell during the experiments with the values theoretically calculated. It is observed that, for an ideal or theoretical P-I curve, the maximum power output is exactly half of the total current generated, which does not occur in real measurements. At the beginning of the experiment, the curves are similar to the theoretical behavior. As the experiment progresses, the measured values separate from the theoretical ones; this is due to the contribution of non-ohmic resistances, generated in the system by concentration polarization phenomena along the flow path in the compartments.
Although the measurements of the experiments are slightly lower than those expected in theory, the maximum power achieved by the G2 geometry is closer to the theoretical one than G1. It is worth noting that, by decreasing the area of the spacer G2, there is an increase in the ionic current through the membrane, which leads to an improvement in power density.
Transport phenomena in electrodialysis and reverse electrodialysis involve both convection flow through the compartments along ion exchange membranes and electromigration flow of ions through them. Because the membranes do not behave ideally, the co-ions and water can cross the membranes, reducing the yield of the process [24]. Ion transport phenomena can be modeled in ED and RED. Even so, it is very complex and requires a reliable description of all the transport phenomena that are generated in the compartment, which must consider several factors such as the spacer and gasket geometries, the properties of the membrane, as well as the interface membrane-solution [25].
Currently, different approaches have been implemented to model the phenomena described above. Some models are based on the Nernst–Planck equation [26]. It is worth mentioning that the working group has considered a strategy to optimize some physical factors associated with the gasket spacers, and to detail the geometrical effects of the spacer gaskets. Once optimized, the modeling will be carried out using different formalisms, either by Nernst–Planck, the Stefan–Maxwell approach [27], or the irreversible thermodynamic formalism [28,29,30].

4. Conclusions

The performance of a reverse electrodialysis cell was studied by modifying the geometry of the cell’s internal components. Two spacers with different gasket geometry were proposed and compared, and their effect on the maximum power density achieved by the cell was demonstrated. On average, the maximum power density of the cell obtained with the G1 spacer was 0.1326 W/m2, while the maximum power density achieved with the G2 spacer was 0.1433 W/m2. It can be concluded that, for our experiments, reducing the total area of the spacer by 3.5% led to an increase in the output power density of 8%. Although statistically the confidence intervals seem to overlap, the G2 gasket reached maximum values that G1 never could. Thus, an improvement was produced.
The results show that it is possible to optimize RED cells by modifying their geometry. The study of the hydrodynamic phenomena within RED cells is motivated by their impact on the flow velocity and polarization phenomena and the pressure drop inside the compartments. This is reflected in the cell’s net power output. It is essential to optimize the components in RED systems to make energy consumption efficient if they are to be scaled up to a commercial level.
It was also demonstrated that the small variations in the gasket geometry can alter the overall cell performance. In this regard, consider the gasket by [18] which is similar the one proposed herein but with the slight differences shown in Table 5. Evidently, the power density results between both cells differ significantly.
The following steps of the present research are studying the problems that affect RED power generation processes, e.g., the non-homogeneous distribution of the water flow in contact with the IEM. An approach to its optimization can be analyzing the border effect generated by the geometry of the components that make up the cell.

Author Contributions

E.S.-S.: Conceptualization, Experimental activities, Formal analysis, Writing—original draft preparation. Z.D.l.C.-B.: Experimental activities, Methodology, Data curation, Writing—original draft preparation. M.M.-H.: Writing—Review and Editing, Visualization. E.M.: Supervision, Writing—Review and Editing, Project administration. All authors have read and agreed to the published version of the manuscript.

Funding

This research was funded by CONACYT-SENER/Sustentabilidad Energética through the Centro Mexicano de Inovación en Energías del Océano (CEMIE-Océano), Grant No. 249795.

Acknowledgments

E.S.S. and Z.C.B. thank CONACYT for the scholarships.

Conflicts of Interest

The authors declare no conflict of interest. The funders had no role in the design of the study; in the collection, analyses, or interpretation of data; in the writing of the manuscript, or in the decision to publish the results.

References

  1. Coleman Gilstrap, M. Renewable Electricity Generation from Salinity Gradients Using Reverse Electrodialysis. August 2013, p. 37. Available online: http://hdl.handle.net/1853/49031 (accessed on 31 January 2022).
  2. Cipollina, A.; Micale, G. Sustainable Energy from Salinity Gradients; Elsevier/Woodhead Publishing: Duxford, UK, 2016. [Google Scholar] [CrossRef]
  3. Veerman, J.; Saakes, M.; Metz, S.J.; Harmsen, G.J. Electrical power from sea and river water by reverse electrodialysis: A first step from the laboratory to a real power plant. Environ. Sci. Technol. 2010, 44, 9207–9212. [Google Scholar] [CrossRef] [PubMed]
  4. Altıok, E.; Kaya, T.Z.; Güler, E.; Kabay, N.; Bryjak, M. Performance of reverse electrodialysis system for salinity gradient energy generation by using a commercial ion exchange membrane pair with homogeneous bulk structure. Water 2021, 13, 814. [Google Scholar] [CrossRef]
  5. Cervantes-Alcalá, R.; Miranda-Hernández, M. Flow distribution and mass transport analysis in cell geometries for redox flow batteries through computational fluid dynamics. J. Appl. Electrochem. 2018, 48, 1243–1254. [Google Scholar] [CrossRef]
  6. Gurreri, L.; Tamburini, A.; Cipollina, A.; Micale, G.; Ciofalo, M. Flow and mass transfer in spacer-filled channels for reverse electrodialysis: A CFD parametrical study. J. Membr. Sci. 2016, 497, 300–317. [Google Scholar] [CrossRef] [Green Version]
  7. Tanaka, Y. Concentration polarization in ion-exchange membrane electrodialysis—The events arising in a flowing solution in a desalting cell. J. Membr. Sci. 2003, 216, 149–164. [Google Scholar] [CrossRef]
  8. Strathmann, H. Electrodialysis, a mature technology with a multitude of new applications. Desalination 2010, 264, 268–288. [Google Scholar] [CrossRef]
  9. Vermaas, D.A.; Saakes, M.; Nijmeijer, K. Doubled power density from salinity gradients at reduced intermembrane distance. Environ. Sci. Technol. 2011, 45, 7089–7095. [Google Scholar] [CrossRef]
  10. Gurreri, L.; Tamburini, A.; Cipollina, A.; Micale, G.; Ciofalo, M. CFD prediction of concentration polarization phenomena in spacer-filled channels for reverse electrodialysis. J. Membr. Sci. 2014, 468, 133–148. [Google Scholar] [CrossRef] [Green Version]
  11. Veerman, J.; Saakes, M.; Metz, S.J.; Harmsen, G.J. Reverse electrodialysis: A validated process model for design and optimization. Chem. Eng. J. 2011, 166, 256–268. [Google Scholar] [CrossRef]
  12. Mei, Y.; Tang, C.Y. Recent developments and future perspectives of reverse electrodialysis technology: A review. Desalination 2018, 425, 156–174. [Google Scholar] [CrossRef]
  13. He, W.; Zhang, X.; Liu, J.; Zhu, X.; Feng, Y.; Logan, B.E. Microbial fuel cells with an integrated spacer and separate anode and cathode modules. Environ. Sci. Water Res. Technol. 2016, 2, 186–195. [Google Scholar] [CrossRef]
  14. Noack, J.; Roznyatovskaya, N.; Herr, T.; Fischer, P. The Chemistry of Redox-Flow Batteries. Angew. Chem. Int. Ed. 2015, 54, 9776–9809. [Google Scholar] [CrossRef] [PubMed]
  15. Chamoun, M. Rechargeable Aqueous Batteries Based on Available Resources Investigation and Development towards Efficient Battery Performance. 2019. Available online: http://urn.kb.se/resolve?urn=urn:nbn:se:su:diva-163154 (accessed on 31 January 2022).
  16. Rivera, F.F.; Pérez, T.; Castañeda, L.F.; Nava, J.L. Mathematical modeling and simulation of electrochemical reactors: A critical review. Chem. Eng. Sci. 2021, 239, 116622. [Google Scholar] [CrossRef]
  17. Długołecki, P.; Dąbrowska, J.; Nijmeijer, K.; Wessling, M. Ion conductive spacers for increased power generation in reverse electrodialysis. J. Membr. Sci. 2010, 347, 101–107. [Google Scholar] [CrossRef]
  18. He, Z.; Gao, X.; Zhang, Y.; Wang, Y.; Wang, J. Revised spacer design to improve hydrodynamics and anti-fouling behavior in reverse electrodialysis processes. Desalin. Water Treat. 2016, 57, 28176–28186. [Google Scholar] [CrossRef]
  19. Post, J.W.; Hamelers, H.V.M.; Buisman, C.J.N. Energy recovery from controlled mixing salt and fresh water with a reverse electrodialysis system. Environ. Sci. Technol. 2008, 42, 5785–5790. [Google Scholar] [CrossRef] [PubMed]
  20. Cruz-Díaz, M.R.; Laureano, A.; Rodríguez, F.A.; Arenas, L.F.; Pijpers, J.J.H.; Rivero, E.P. Modelling of flow distribution within spacer-filled channels fed by dividing manifolds as found in stacks for membrane-based technologies. Chem. Eng. J. 2021, 423, 130232. [Google Scholar] [CrossRef]
  21. Mehdizadeh, S.; Yasukawa, M.; Abo, T.; Kakihana, Y.; Higa, M. Effect of spacer geometry on membrane and solution compartment resistances in reverse electrodialysis. J. Membr. Sci. 2019, 572, 271–280. [Google Scholar] [CrossRef]
  22. Veerman, J.; Saakes, M.; Metz, S.J.; Harmsen, G.J. Reverse electrodialysis: Evaluation of suitable electrode systems. J. Appl. Electrochem. 2010, 40, 1461–1474. [Google Scholar] [CrossRef] [Green Version]
  23. Vermaas, D.A. Energy Generation from Mixing Salt Water and Fresh Water. Ph.D. Thesis, University of Twente, Enschede, The Netherlands, 2014. [Google Scholar] [CrossRef] [Green Version]
  24. Tedesco, M.; Hamelers, H.V.M.; Biesheuvel, P.M. Nernst-Planck transport theory for (reverse) electrodialysis: I. Effect of co-ion transport through the membranes. J. Membr. Sci. 2016, 510, 370–381. [Google Scholar] [CrossRef]
  25. Hong, J.G.; Zhang, B.; Glabman, S.; Uzal, N.; Dou, X.; Zhang, H.; Wei, X.; Chen, Y. Potential ion exchange membranes and system performance in reverse electrodialysis for power generation: A review. J. Membr. Sci. 2015, 486, 71–88. [Google Scholar] [CrossRef]
  26. Moya, A.A. A Nernst-Planck analysis on the contributions of the ionic transport in permeable ion-exchange membranes to the open circuit voltage and the membrane resistance in reverse electrodialysis stacks. Electrochim. Acta 2017, 238, 134–141. [Google Scholar] [CrossRef]
  27. Luo, T.; Abdu, S.; Wessling, M. Selectivity of ion exchange membranes: A review. J. Membr. Sci. 2018, 555, 429–454. [Google Scholar] [CrossRef]
  28. Kedem, O.; Katchalsky, A. A physical interpretation of the phenomenological coefficients of membrane permeability. J. Gen. Physiol. 1961, 45, 143–179. [Google Scholar] [CrossRef] [PubMed] [Green Version]
  29. Auclair, B.; Nikonenko, V.; Larchet, C.; Métayer, M.; Dammak, L. Correlation between transport parameters of ion-exchange membranes. J. Membr. Sci. 2002, 195, 89–102. [Google Scholar] [CrossRef]
  30. Nikonenko, V.; Zabolotsky, V.; Larchet, C.; Auclair, B.; Pourcelly, G. Mathematical description of ion transport in membrane systems. Desalination 2002, 147, 369–374. [Google Scholar] [CrossRef]
Figure 1. Diagram of an RED cell.
Energies 15 03361 g001
Figure 2. Experimental configuration of the RED system.
Energies 15 03361 g002
Figure 3. Spacer G1. (a) gasket of spacer G1; (b) total area of spacer G1.
Energies 15 03361 g003
Figure 4. Spacer G2. (a) gasket of spacer G2; (b) total area of spacer G2.
Energies 15 03361 g004
Figure 5. Comparison of V-I curves obtained with spacers G1 and G2 against the theoretical value.
Energies 15 03361 g005
Figure 6. Comparison of P-I curves obtained with spacers G1 and G2 against the theoretical value.
Energies 15 03361 g006
Table 1. Main properties of Fujifilm Type 1 membranes 1.
ParmetersCEMAEM
Thickness (µm)135125
Electical resistance (Ω cm2)2.71.3
Selectivity (%)9292
Ion exchange capacity (mol/g)1.41.4
1 Parameters obtained from the supplier’s technical sheet.
Table 2. Characteristics of saline solutions.
ParametersConcentrated SolutionDilute Solution
Concentration (M)0.60.05
Conductivity (mS/cm)49.65.2
Flow rate (mL/min)1010
Velocity (m/s)0.010.01
Temperature (°C)2020
Table 3. Measurements of OCV, short circuit current, and cell resistance with each gasket geometry and theoretical calculations.
MeasurementOpen Circuit Voltage (V)Short Circuit Current (A/m2)Cell Resistance (Ω)
Theoretical calculation0.11545.342.16
G10.09673.632.66
G20.09833.972.48
Table 4. Optimum current and power density measurements with each gasket geometry and theoretical calculations.
MeasurementPower Density (W/m2)Optimum Current Density (A/m2)
Theoretical calculation0.15412.71
G10.1326 (±0.02)2.18
G20.1433 (±0.06)2.38
Table 5. Comparison between He et al. [19] and proposed spacers.
SpacerNet Thickness (mm)Frame Thickness (mm)Porosity (%)Manufacturer
He et al. [19]0.450.7286.5Tianwei Membrane Technology Co., Ltd., Shandong, China
Proposed0.20.151.0UNAM, Mexico City, Mexico
Publisher’s Note: MDPI stays neutral with regard to jurisdictional claims in published maps and institutional affiliations.

