Article

Breakup Mechanism of a Jet in the L-Shape Crossflow of a Gas Turbine Combustor

1
Graduate School, Korea Aerospace University, Goyang 10540, Korea
2
Department of Smart Air Mobility, Korea Aerospace University, Goyang 10540, Korea
3
School of Aerospace Mechanical Engineering, Korea Aerospace University, Goyang 10540, Korea
*
Author to whom correspondence should be addressed.
Energies 2022, 15(9), 3360; https://doi.org/10.3390/en15093360
Submission received: 22 March 2022 / Revised: 22 April 2022 / Accepted: 27 April 2022 / Published: 5 May 2022

Abstract

:
Experimental investigations are conducted to determine the mechanism and characteristics of a jet in an L-shape crossflow simulating the radial swirl injector of a lean premixed-prevaporized (LPP) combustor. To simplify the radial flow of the actual injector while ignoring the centrifugal effect, the L-shaped 2D-channel is used for the crossflow, and water is used as a fuel simulant. The jet breakup is captured using a high-speed camera, and the density gradient magnitude is post-processed to clarify the spray. The Sauter mean diameter (SMD) of the spray is measured via a laser diffraction method with a helium–neon laser optical system (HELOS). The characteristics of the jet in the L-shape crossflow are compared with the characteristics of the jet in a typical crossflow through the flat channel. The results for different outlet heights of the L-shape channel ( H / d 0 ) and different injector positions ( L / d 0 ) are presented. A dimensionless number ( τ ) consisting of a time ratio is introduced to describe the jet characteristics. In a previous work, the spraying tendency was demonstrated for different injector positions. In addition, the effect of the recirculation area on H / d 0 was empirically shown. H / d 0 determines the size of the recirculation area, and the range of τ determines the jet breakup mechanism inside the L-shape channel. The results of this study present the breakup mechanism of the jet in the L-shape channel flow, which simulates a jet in a radial swirler injector for gas turbine engines. It is expected that these results can be used to assist in designing gas turbine engines with more combustion efficiency.

1. Introduction

The jet-in-crossflow (JICF) method is a conventional, classical method that is mainly used in air-breathing propulsion systems. A JICF breaks the spray to mix the fuel and air using a large amount of air entering the combustor, and this method has advantages from the perspective of combustion stability, efficiency, and, in particular, emission reductions, which is a critical issue in today’s world [1,2,3,4,5,6,7,8,9,10]. In previous studies, empirical correlations have been explored and developed for typical JICF methods, which inject fuel vertically into a horizontal airflow. Ingebo and Foster used air for the crossflow and various fuel simulants, including isooctane, JP-5, water, benzene, and carbon tetrachloride [11]. They suggested that the major factors affecting droplet size were the We and Re of the liquid and air. Ingebo modified the empirical equation to include the density effect by adding a new dimensionless group, which was the molecular scale momentum transfer group [12]. Song et al., to improve upon the research from Ingebo, used Jet-A as an injection medium and conducted phase doppler interferometry to determine the effects of ambient pressure on droplet size [13]. In addition, the jet behavior and penetration length in the crossflow were expressed by dimensionless numbers [14]. Based on this study, Schetz et al. predicted not only penetration distance but also droplet size according to the injector orifice diameter [15]. Wu et al. created a regime map by classifying jet breakup mechanisms according to the We and momentum flux ratios (MFR) of water, ethyl alcohol, glycerol, and emulsion [16]. In addition, research has been conducted on engineering applications such as the jet in the supersonic crossflow [17,18,19,20,21], emulsion spraying [12,22], and twin fluid jets in a crossflow (TF-JICF) [23,24]. To apply the JICF system to the gas turbine injector, spray conditions must match the operating range of the land and take-off (LTO) cycle of the engine. In the LTO cycle, under max thrust conditions such as the conditions present at take-off, the jet collides with the wall inside the injector. This wall interaction is an important phenomenon for internal combustion engines and has also been studied [25]. For instance, Cohen et al. studied a high-shear injector using the jet wall interaction to facilitate atomization. In addition, they analyzed the change of spray pattern according to fuel nozzle types, swirler designs, and the defection occurring in the assembly process to study the main parameters to be considered when designing an injector. Based on this study, it is clear that, as with We and Re, geometry has a significant influence on determining the atomization performance of the injector. Makida et al. [26], Johnson [27], and Shin et al. [28] studied the effects of the recirculation zone or separation area formed by the venturi angle inside the air blast injector (not using the JICF method) and the dump area on the atomization characteristics and the generation rate of pollutants like NOx. The separation area causes the accumulation of droplets and increases the size. Therefore, the existence and size of the separation area according to the geometry of the injector greatly affect atomization.
The multipoint injection system for the gas turbine injector, which is an air-blast method, mainly adopts the JICF system [10,29,30,31]. Typically, the multi-point injection system uses a swirler (e.g., the axial and radial swirlers constitute the flow path into the fuel injection area), which affects the location of the injection point and the crossflow conditions near the fuel injection point [32,33,34,35]. A comparison of these two types of swirlers is shown in Figure 1. Unlike the conventional JICF, which is shown in Figure 1a, the airflow from the radial swirler bends once, as shown in Figure 1b. This bending flow generates the flow separation at the corner before the fuel injection. Choi et al. addressed the separation zone issue at the corner of the upper wall, which generates a recirculating flow when a radial swirler is employed [36,37]. The concept of a representative LPP combustor is illustrated in Figure 2. Its geometry greatly affects the fuel breakup mechanism of the JICF. The breakup mechanism consequently affects fuel evaporation, flame stability, and combustion efficiency, and it may result in incomplete combustion, which can create further emission problems. Therefore, to improve flame stability and combustion, which are important for aircraft and plants, it is necessary to understand the fuel breakup mechanism in a radial swirler.
Choi et al. qualitatively studied the penetration and characteristics of a jet according to the position of the fuel injection in the L-shape channel, simulating the radial swirler using 2D geometry without centrifugal force [36,37]. Figure 3 shows the concept of the 2D simulator or the radial swirler as the L-shape channel. This concept has also been applied in the present study to observe the effects of the bending flow on a jet breakup inside the radial swirler. This concept can be compared to cutting a donut in half and flattening it out. Although this method ignores the influence of the swirl flow, which can generate centrifugal force and a tangential flow, the more critical effects from the bending crossflow can be investigated and compared with other effects because the swirl flow does not develop further inside the swirler [32,33,34,35]. When the position of the fuel orifice changes, the exposure time of the jet in the flow inside the channel changes depending on the distance from the outlet to the injector. Therefore, the injection position can affect fuel atomization.
This study focuses on two main objectives; (1) to discuss the effects of the flow separation induced by the L-shape channel on the JICF mechanism, and (2) to evaluate the atomization characteristics with empirical correlations and non-dimensional numbers, thereby providing data that can be used in the design process of a radial swirler for gas turbine engines. The present study primarily examines the effects of the channel outlet height and the fuel orifice position on the jet breakup. To evaluate atomization performance, high-speed image capturing and droplet-size measurements from the laser diffraction analyzer are employed. The jet breakup mechanism in the L-shape cross-flow is qualitatively analyzed using the breakup images and quantitatively evaluated using the measured droplet sizes. Consequently, the characteristics of the jet breakup in the L-shape channel are driven by the Buckingham π theorem.

2. Setup and Methods

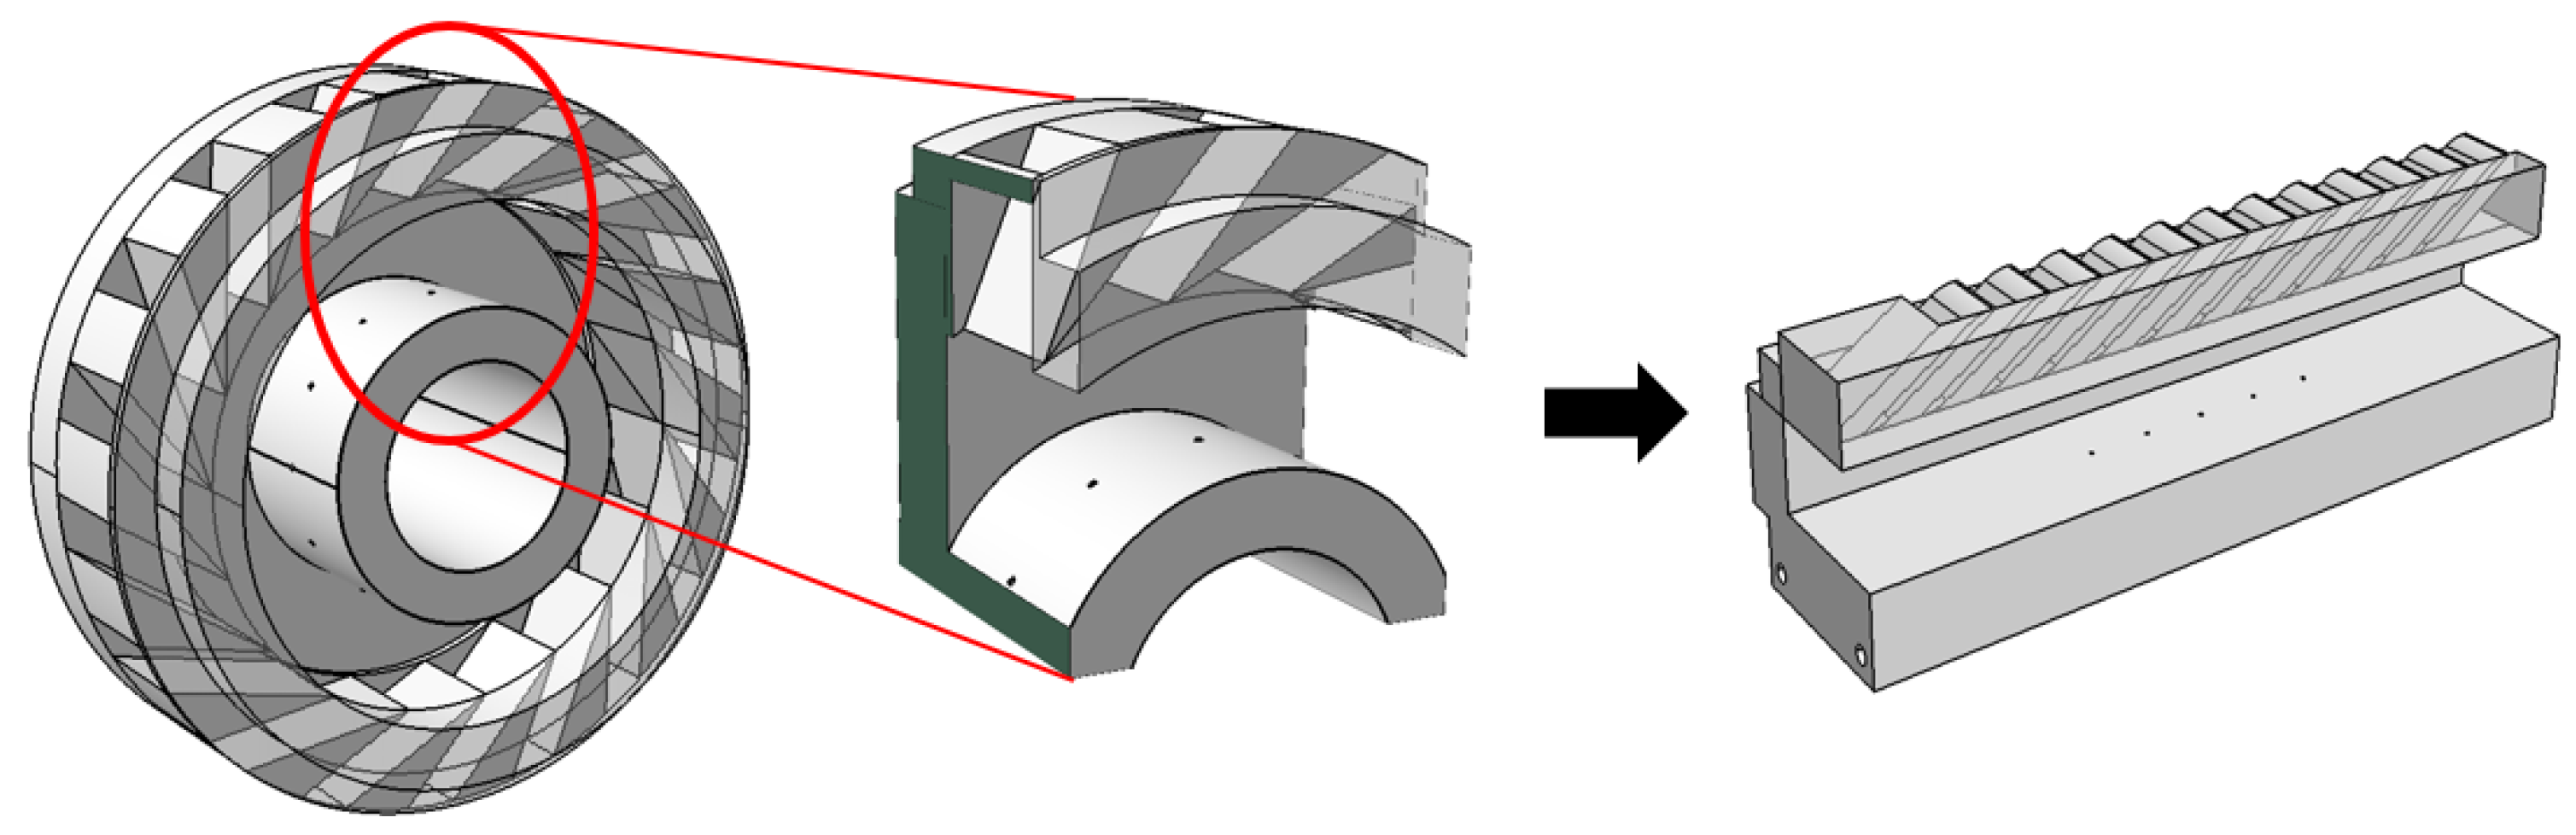
2.1. Design of L-Shape Channel

The L-shape channel flow was employed to simulate the JICF inside the radial swirler, as shown in Figure 4. Acrylic windows were installed on both sides of the experimental device to observe the jet breakup mechanism. The air was supplied by the blower, and the flow was bent twice to approximate the crossflow in a radial swirler. The height of the channel outlet (H) was varied to 5, 10, and 15 mm to investigate the effects of swirler geometry. The injector position was defined as the distance (L) from the outlet. The fuel injector was placed at 3 different positions; L varied between 10 mm, 12 mm, and 14 mm from the inside vertical wall; that is, 6, 8, and 10 mm away from the outlet. The width of the L-shape channel inlet ( D w ) was set to 10 mm to simulate the radial swirler inlet. Generally, the size of D w is a primary variable affecting the swirl number. However, it is not the main variable that affects the size of the separation area. To be precise, the length ratio of the inlet and outlet affects the size of the separation area. Therefore, D w was fixed. The fuel injector dimensions are also shown in Figure 4. The fuel injector had a single-hole orifice with a 10 mm length and a 0.5 mm diameter at the injector–outlet interface. The water, a simulant of the fuel, entered the injector from the pressurized tank. The injector diameter ( d 0 ) was used to nondimensionalize the x-axis and y-axis, and this was expressed as x / d 0 and y / d 0 , respectively. The heights (H) of the outlets were also nondimensionalized as H / d 0 = 10, 20, and 30, and the injector location (L) was expressed as L / d 0 = 12, 16, and 20.

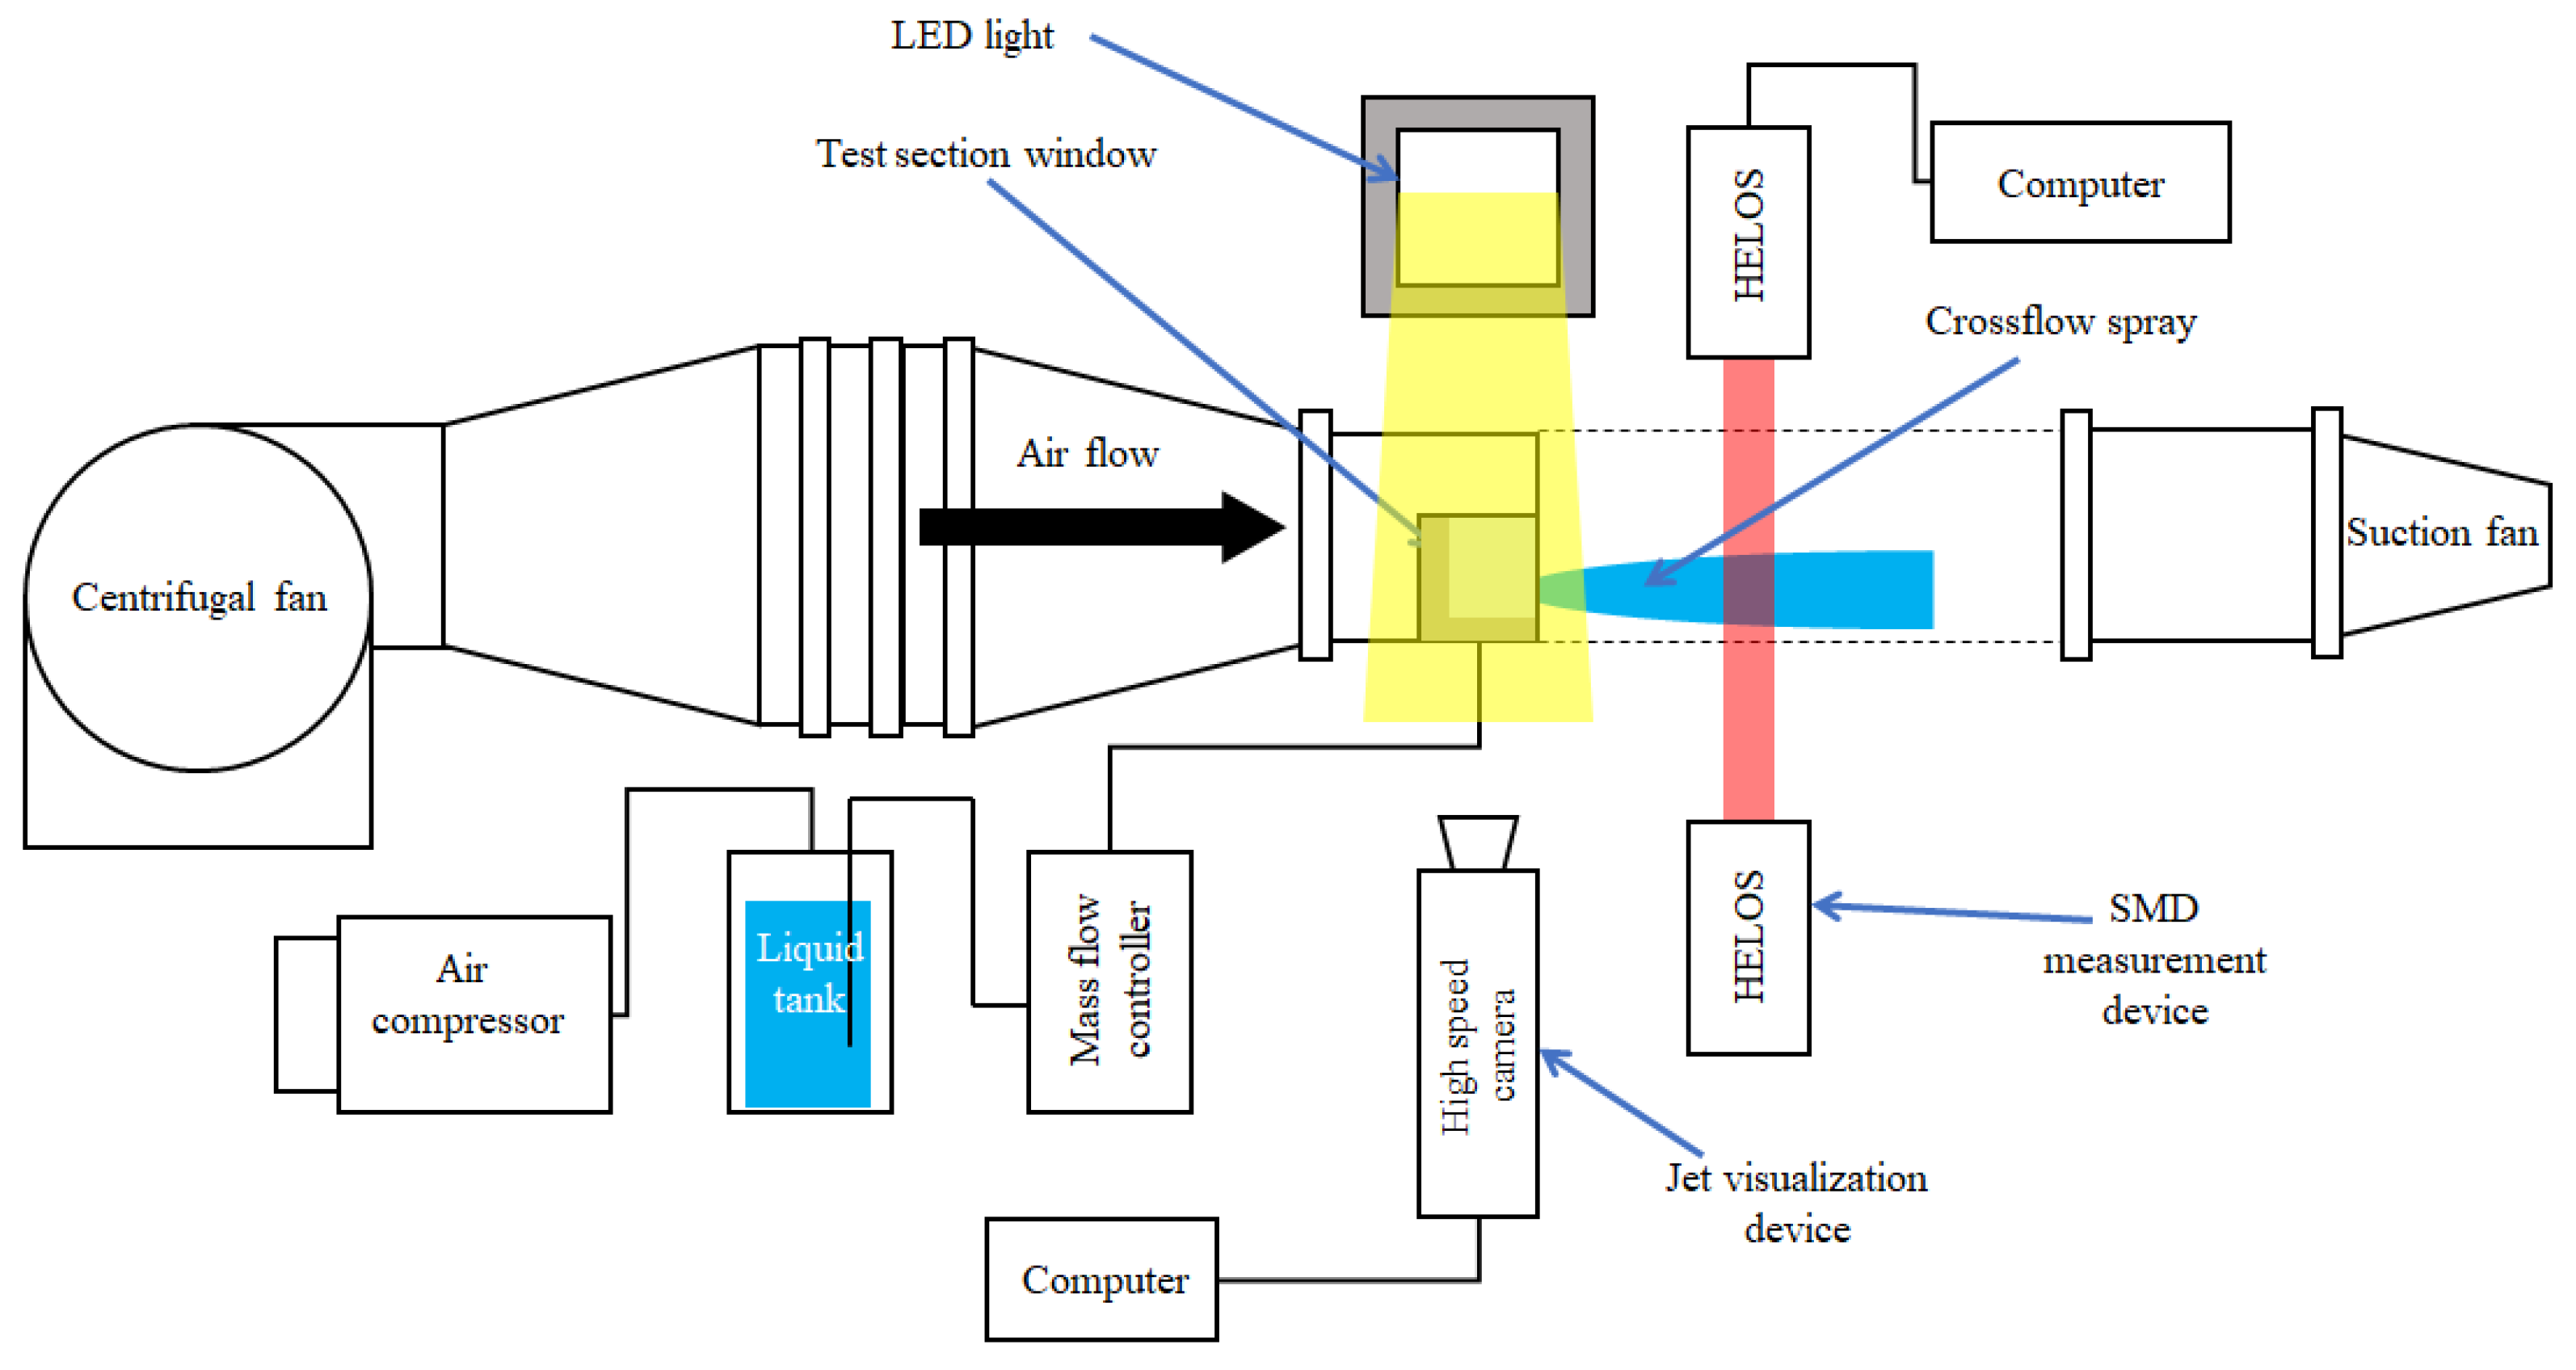
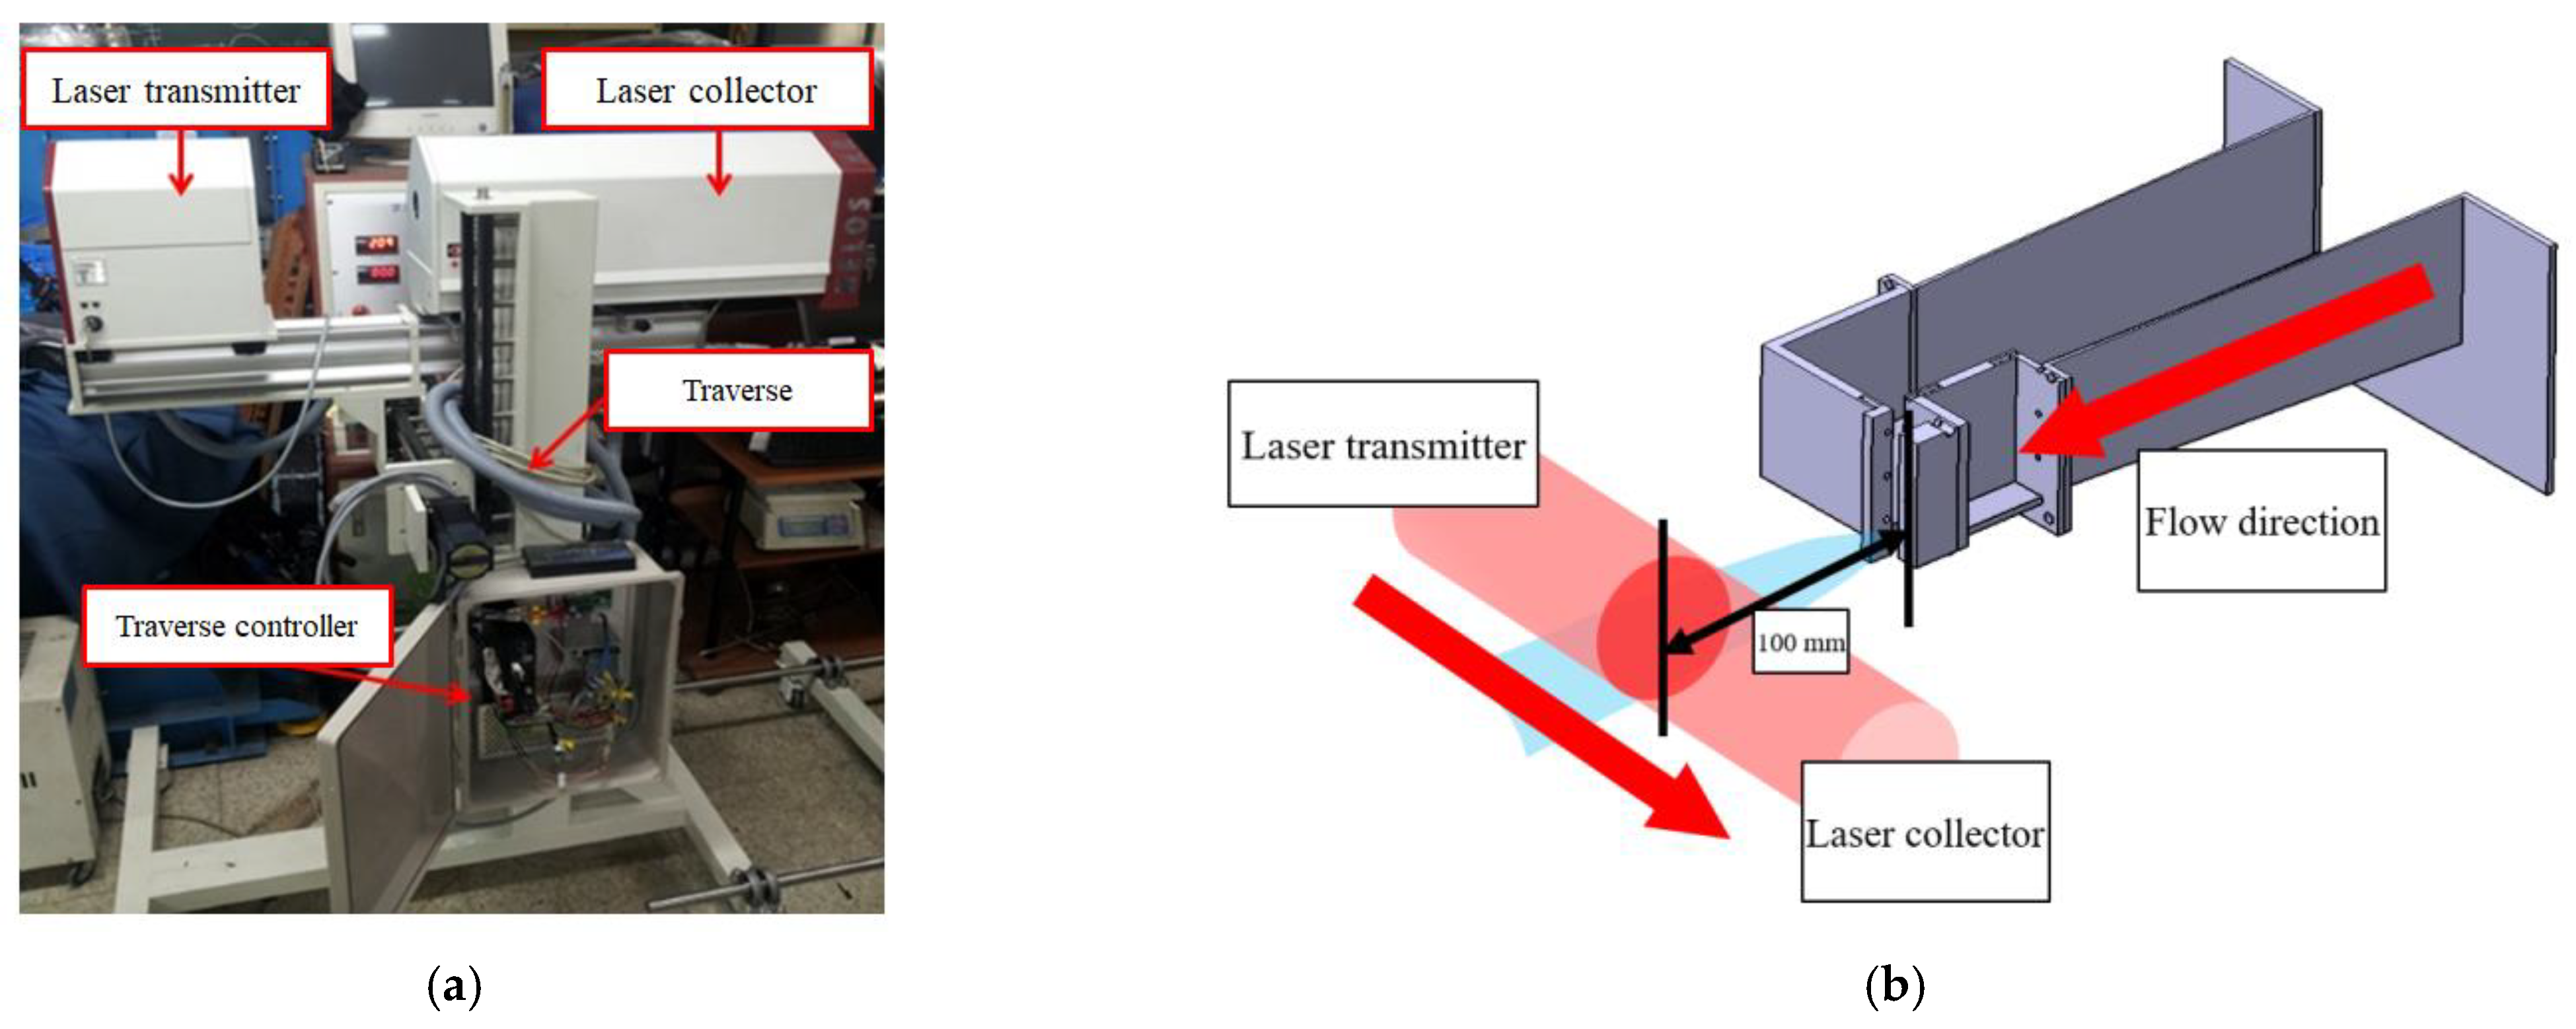
2.2. Experimental Setup

The experimental setup and diagnostics system are shown in Figure 5. The L-shape channel module was connected to the wind tunnel, and the airflow in the wind tunnel was supplied by a centrifugal fan (or blower), which could rotate up to 3600 rpm and supply up to the mass flow rate of 1.2 kg/s at the maximum rotation speed. The airflow was inserted into the L-shape channel through the wind tunnel, and this generated the crossflow. The air subsequently exited the system through the outlet and dispersed into the atmosphere with sprays. The liquid jet was pressurized by the compressed air, and the flow rate of the liquid was controlled using a mass flow controller (mini CORI-FLOW M15 model from Bronkhorst). The high-speed camera (APX-RS of Photron) captured spray images at 10,000 frames per second, and the shutter speed was 1/100,000 s. Shadowgraph images were produced using a flat LED light source. The diameters of the spray droplets were measured by a helium–neon laser optical system (HELOS) from Sympatec. This system employs the laser diffraction analysis method, and it is capable of measuring particle diameters between 0.1 and 8750 μm. The HELOS system, which was used to measure the Sauter mean diameter (SMD) of the spray, is shown in Figure 6. The HELOS consisted of two parts, a transmitter and a collector, and a jet was sprayed between them. The measuring position of the sprayed jet was 100 mm away from the outlet in this study. The laser diameter was 29.5 mm, and the SMD was calculated by averaging the measured droplet diameters within the laser volume where the spray crossed.

2.3. Non-Dimensional Parameters and Experimental Conditions

The MFR, Re, and We were chosen as important dimensionless numbers. These numbers were used to explain the jet breakup mechanism. In previous studies, dimensionless numbers were used for the crossflow and fuel jet, and a dimensionless number was also used as the corresponding ratio. The MFR is defined as Equation (1), which is the ratio of the fuel jet to the crossflow. The Reynolds numbers of the jet and crossflow are defined by Equations (2) and (3). The Weber numbers of the jet and crossflow are defined as Equations (4) and (5).
MFR   = ρ l V l 2 ρ a V a 2 ,
Re l = ρ l V l d μ l ,
Re a = ρ a V a d μ a ,
We l = ρ l V l 2 d σ l ,
We a = ρ a V a 2 d σ l .
ρ is density, V is velocity, and d is characteristic length, and mainly diameter of injector is used. μ is viscosity, and σ is surface tension. The subscripts a and l stand for air and liquid, respectively.
The fuel used in actual gas-turbine engines is a hydrocarbon-based liquid fuel such as kerosene and jet-A. However, water is very easy to handle and very useful for observing jet characteristics at room temperature and normal pressure. In the experiment, the characteristic variables of the water jet can be known using different fluids’ densities and viscosity, which have already been verified by other researchers such as Ingebo et al. [11,12]. For these reasons, only water was used in the experiment. The experimental parameter values are presented in Table 1, where the gas and liquid are separately specified. The jet velocity was controlled from 5 to 15 m/s. The experiment was conducted at room temperature and pressure. The crossflow was air, and the flow rate was controlled from 34 to 87 g/s. The velocity of the air was calculated using Equation (6) and the measured flow rate.
m ˙ = ρ A V .
Accordingly, the crossflow velocity varied from 27 to 80 m/s. These values correspond to the average crossflow velocity values of the injector and combustor in a typical gas-turbine engine [1,32,34]. The variation ranges of the Re and We are also shown in Table 1. Typically, the MFR of a jet is between 3 and 45. If the MFR is between 5 and 10 in the injector, it corresponds to an idle engine condition within the land and take-off (LTO) cycle of a general gas-turbine aircraft engine. When the MFR value reaches or exceeds 25, it corresponds to the maximum thrust condition of the take-off cycle [23,24,38].

3. Results

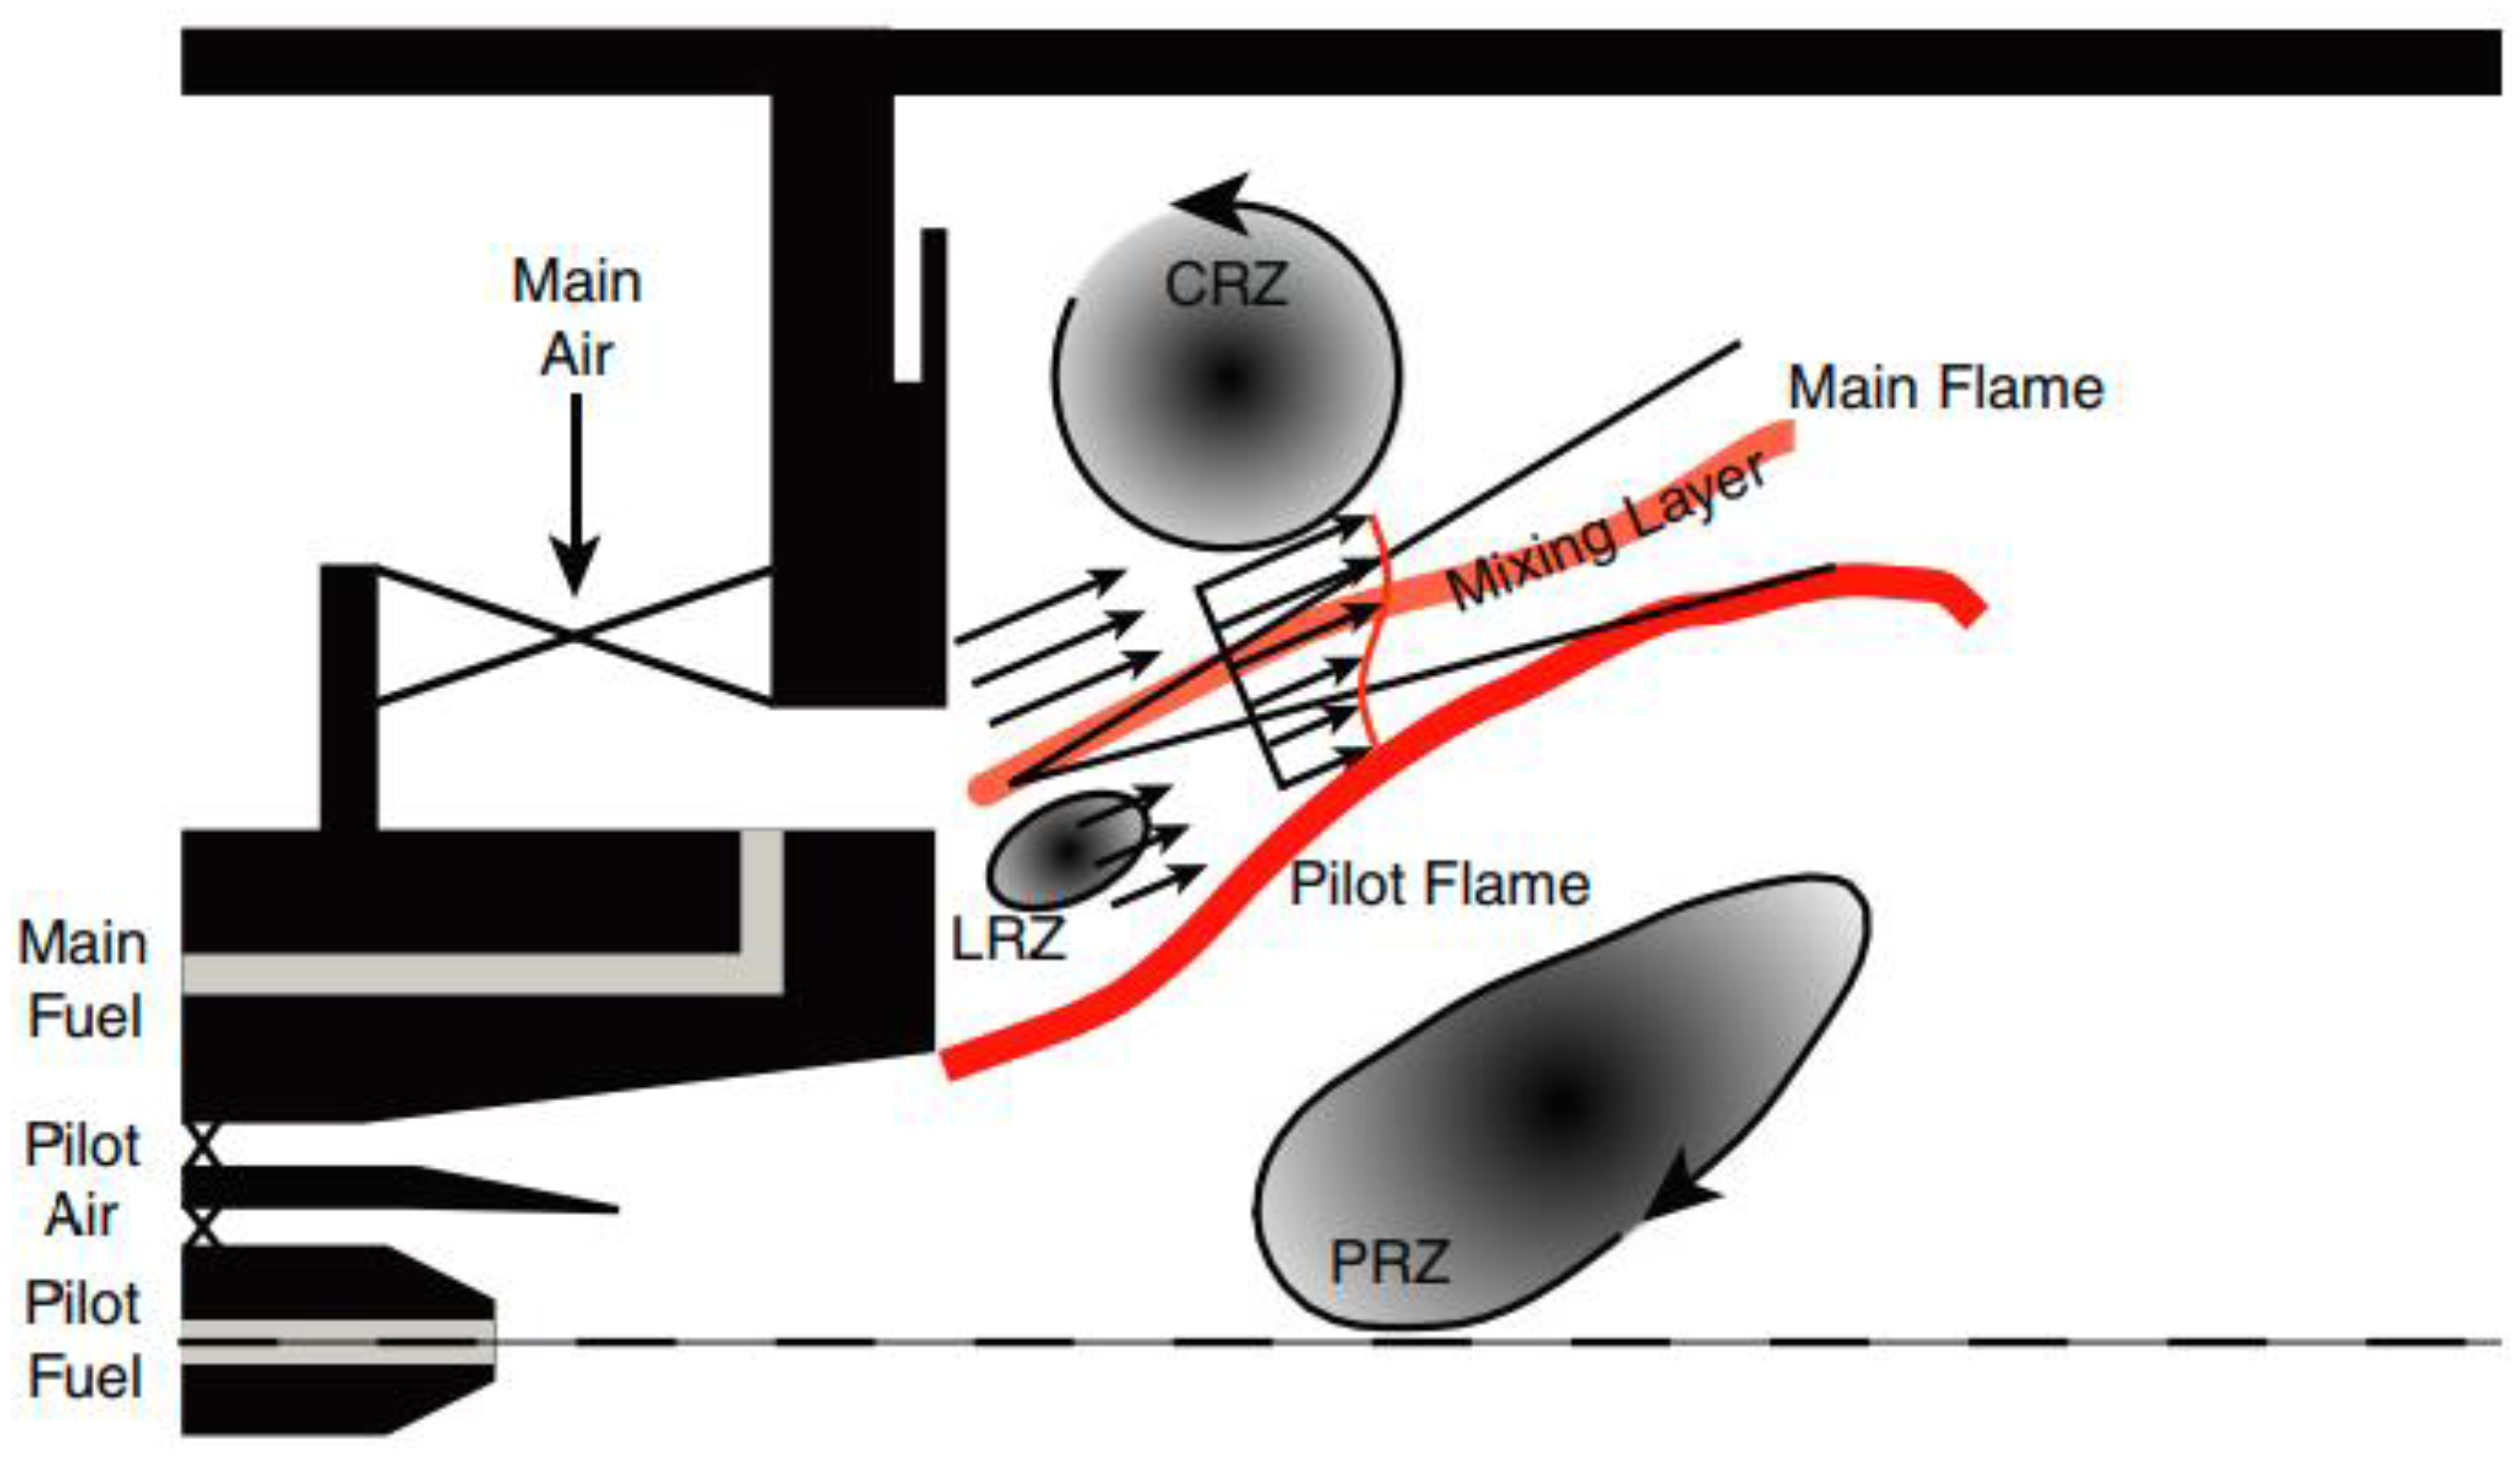
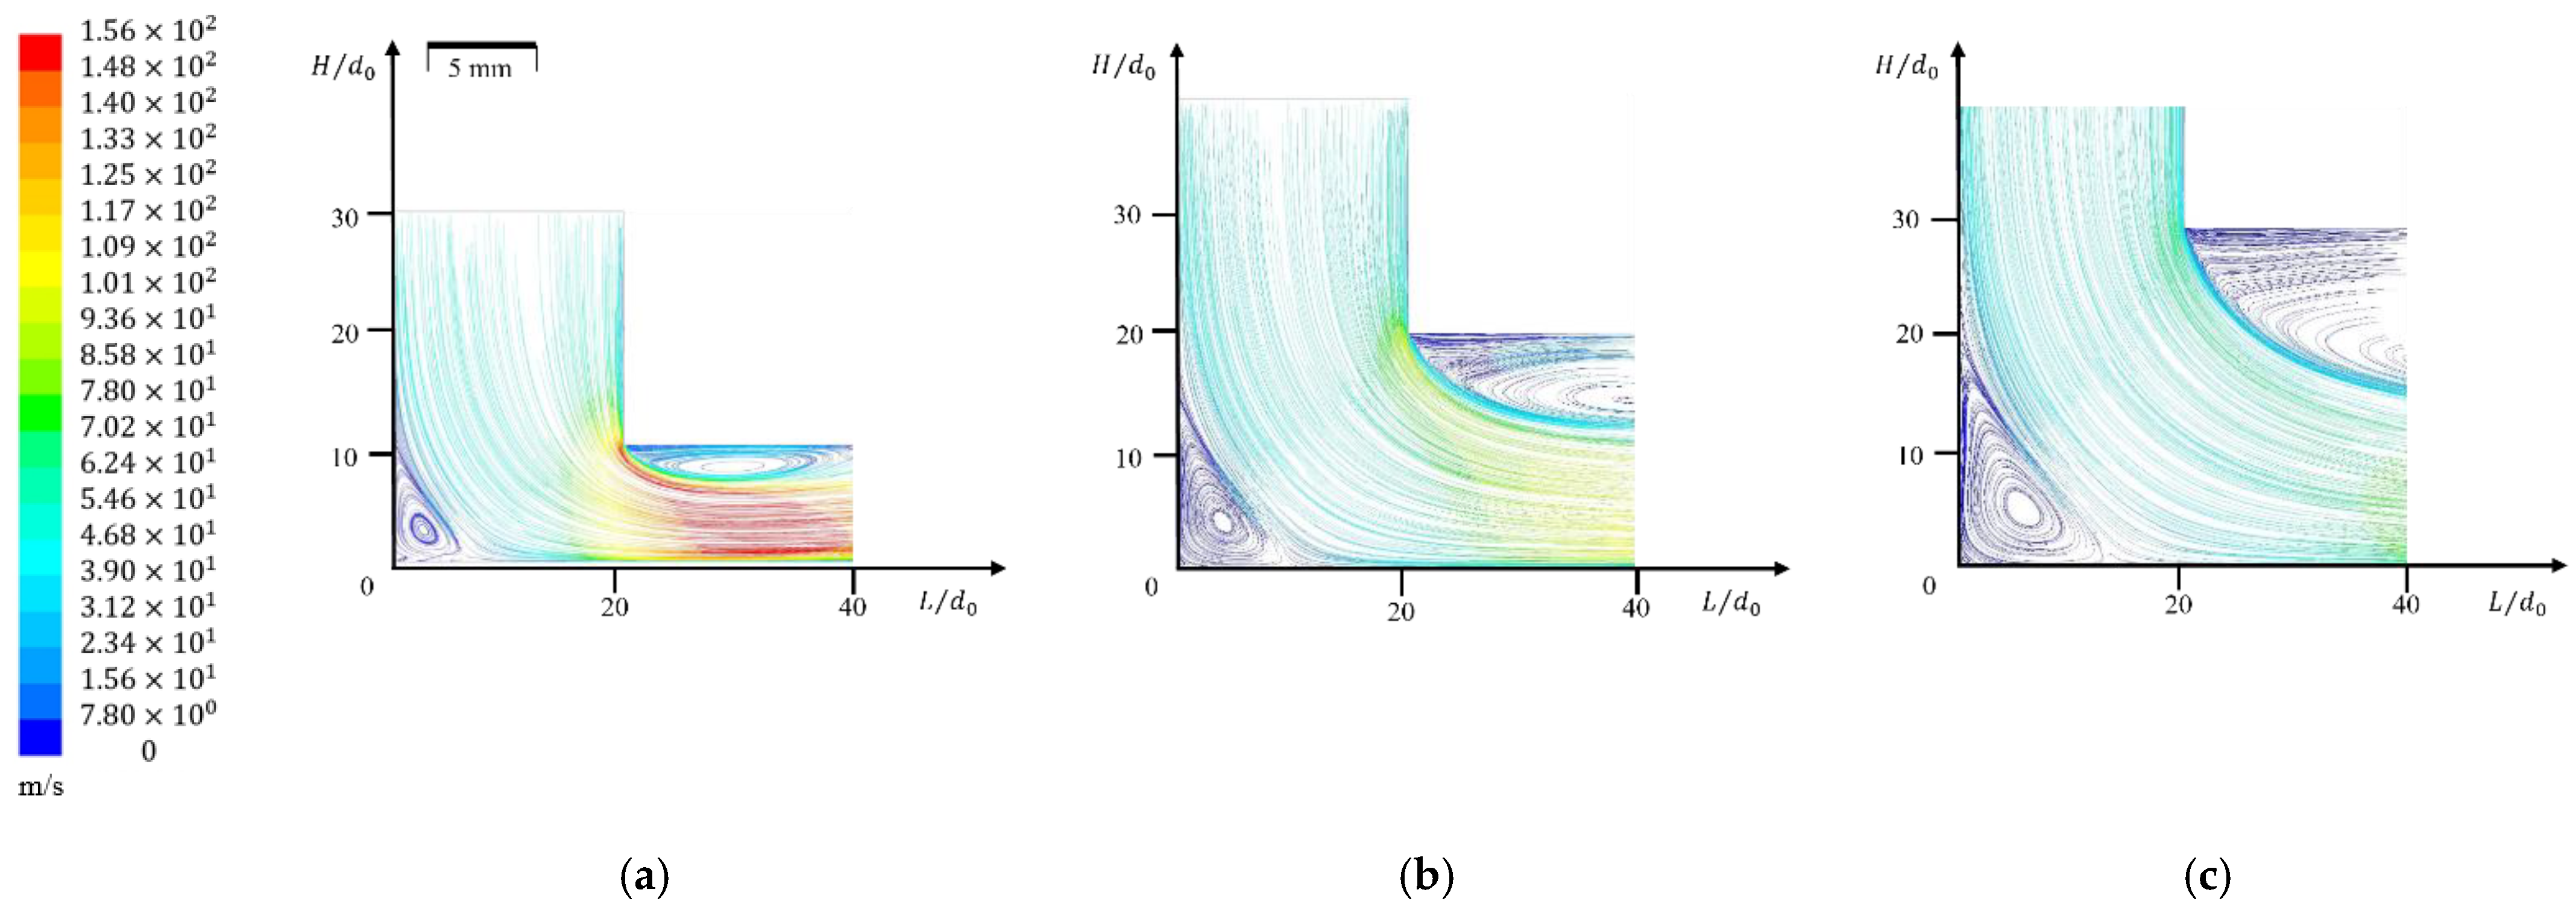
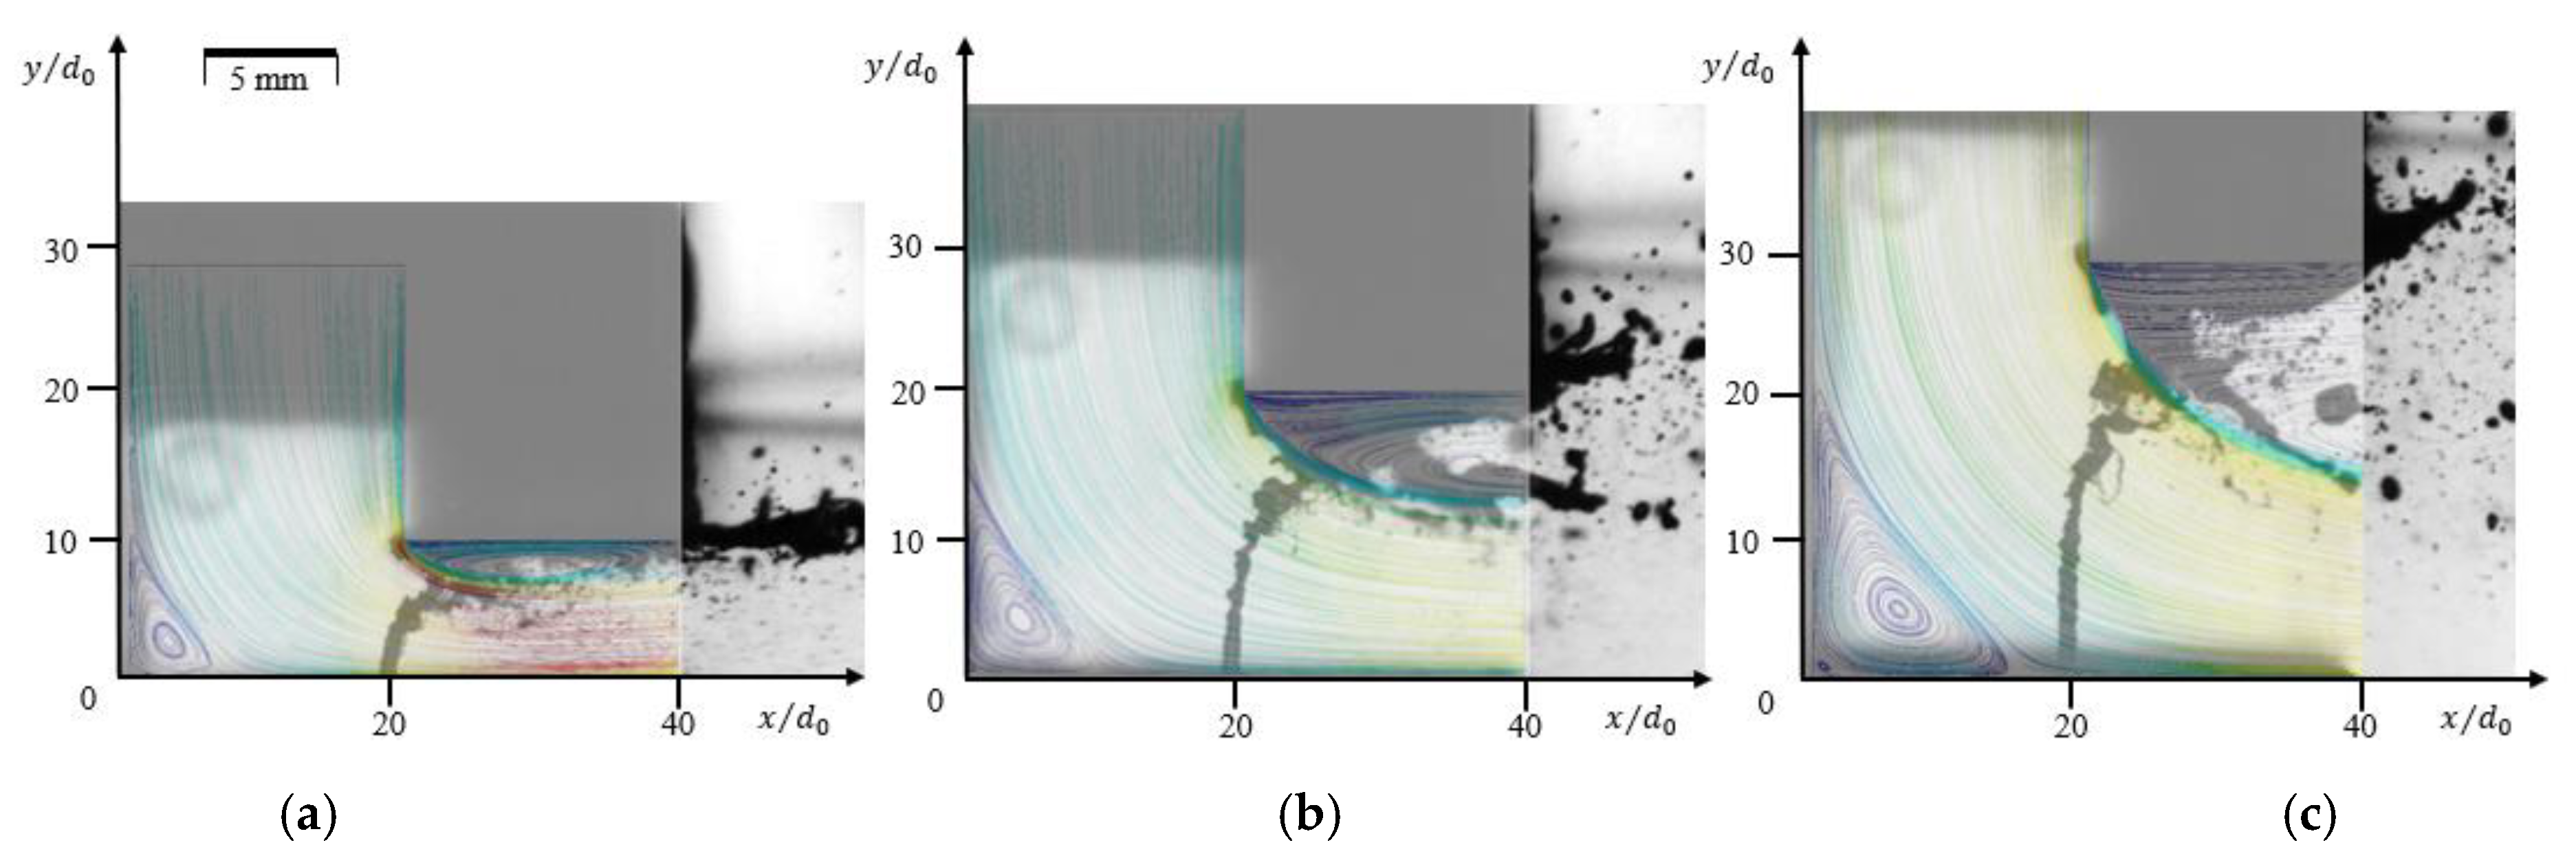
3.1. Flow Characteristics in the L-Shape Channel

To characterize the flow field in the L-shape channel with three different channel outlet widths, a numerical simulation was conducted. In a previous study, Choi et al. [36] demonstrated the flow field characteristics inside an L-shape channel. For the numerical method in this study, a commercial program, Ansys Fluent, was used, and a standard K-epsilon model was used for the turbulent modeling. The fixed mass flow rate and constant pressure outlet were applied for boundary conditions, and air at room temperature and atmospheric pressure was used as the working fluid to observe the crossflow behavior. Figure 7 shows the velocity contours with streamlines in the L-shaped channel. Flow separations occurred at the concave and convex corners. A big recirculation zone at the top of the flow field near the jet separated from the convex corner, and it was expected that this recirculation would strongly affect the jet breakup. As shown in Figure 7, the separation area increased as H / d 0 increased, and the velocity decreased in the outlet, whereas the crossflow rate was constant. This suggested that the jet in the low H / d 0 channel, as shown in Figure 7, could be significantly affected by the strong crossflow momentum, whereas a jet in the high H / d 0 channel, as shown in Figure 7c, could achieve deeper penetration. Figure 8 presents the velocity profiles in the x- and y-directions in the L-shape channel according to three H / d 0 cases with the constant mass flow rate of 77 g/s. The velocity of the y-axis direction was negative because the momentum in the downward direction remained inside the crossflow channel due to the special characteristic of the L-shape channel, unlike with a conventional JICF. In the jet breakup mechanism, the factor determining the size of the droplet was the x-axis velocity, which was perpendicular to the liquid jet column. Because the speed in the x-axis direction peaked when H / d 0 = 10, it was predicted that this condition would generate the smallest droplet diameter, as noted. However, the breakup mechanism was not controlled solely by the crossflow velocity in the L-shape channel because there was a big separation area or recirculation zone at the top in the L-shape channel. Due to this zone, the x-axis velocity was not constant, and the y-axis momentum could also affect the jet breakup. Each velocity component had a local maximum point, which existed at the boundary where separation occurred. The absolute value of the velocity increased as L / d 0 decreased because the flow path area was reduced due to the flow separation, similar to the vena-contracta effect. In other words, if the liquid jet was injected at the highest crossflow velocity region, which was closed to the outlet of the channel, a stronger collision would occur.
Meanwhile, because the x-axis velocity was negative in the separation area, the droplet entering the area could be trapped. Even if the penetration length of the jet was within the range of H / d 0 , the jet could break into the separation area. Then, it would be predicted that an extraordinary jet breakup mechanism would occur, including the wall interaction. Therefore, the mechanism was experimentally investigated in this study.

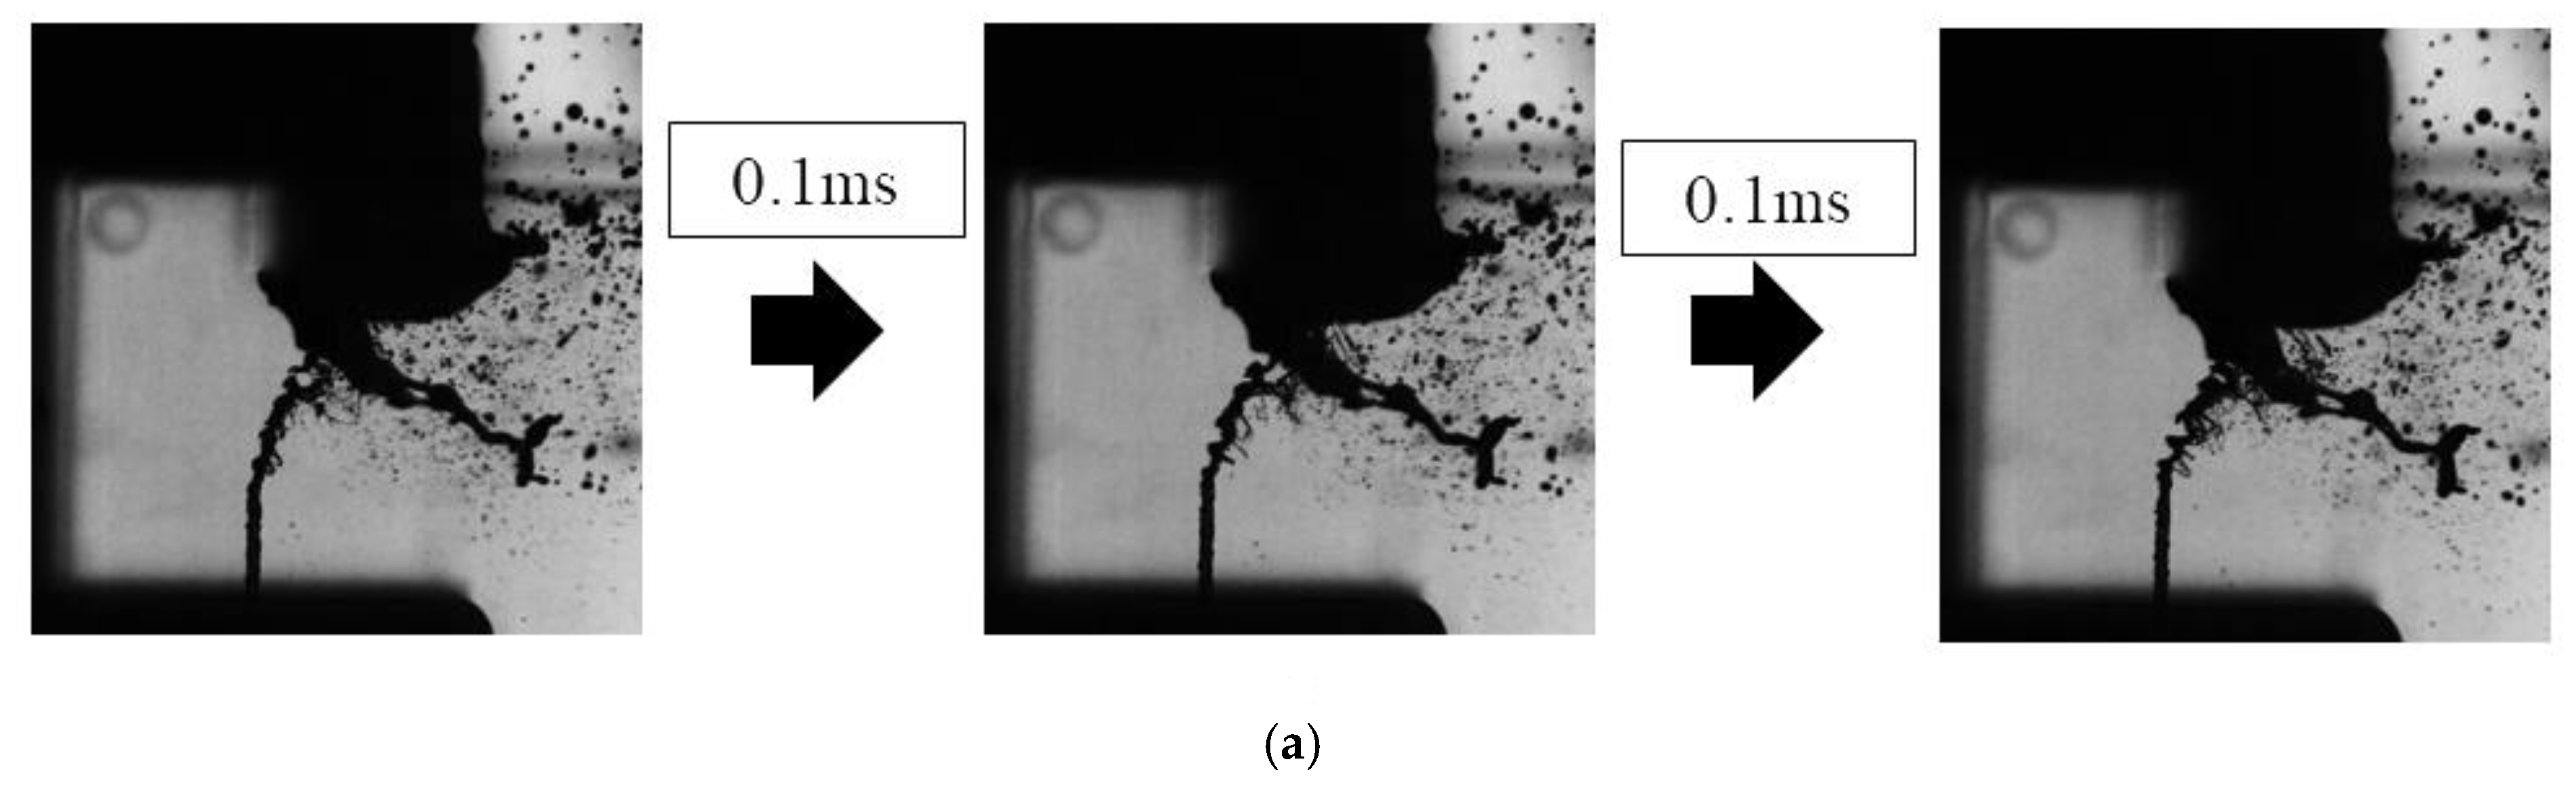
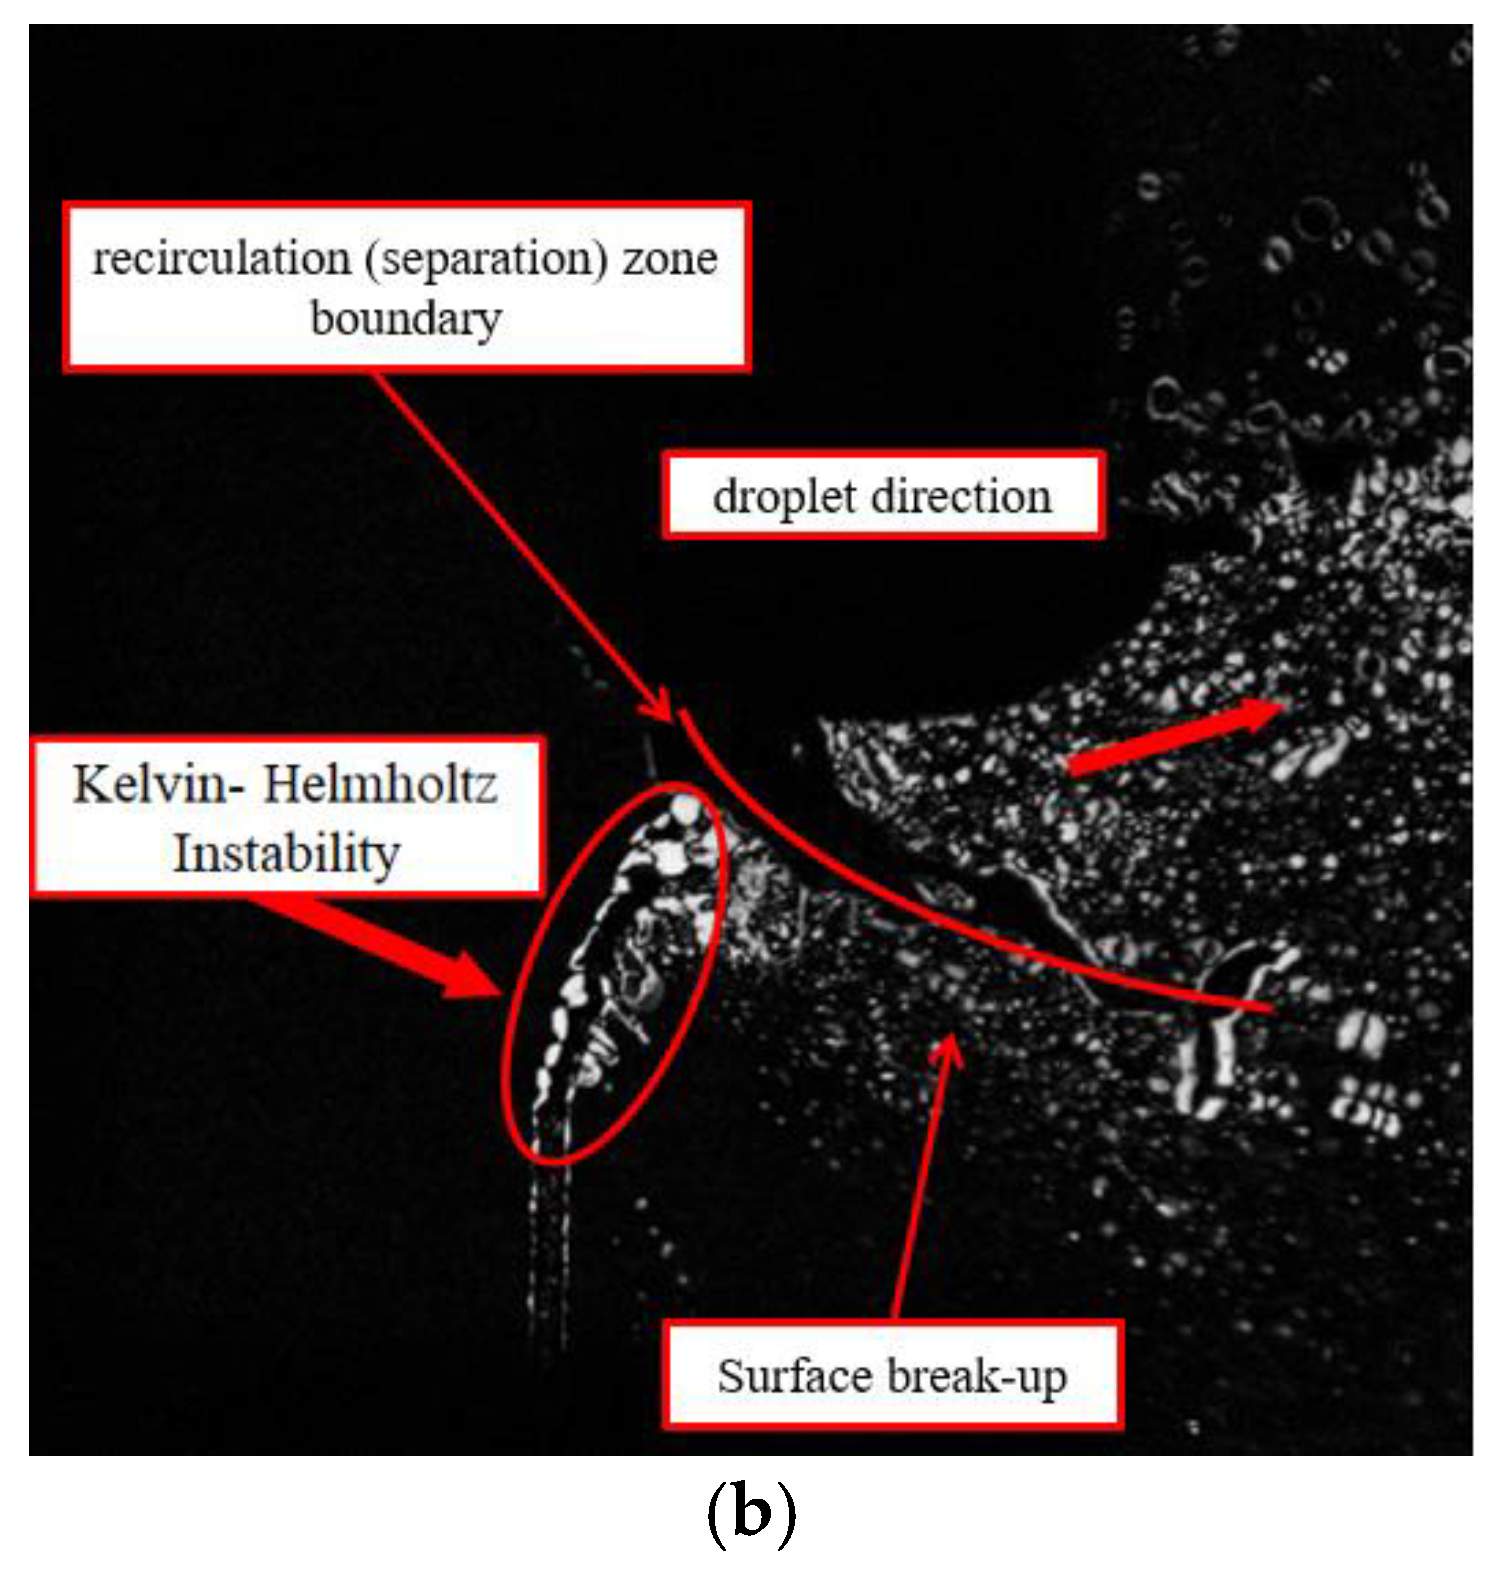
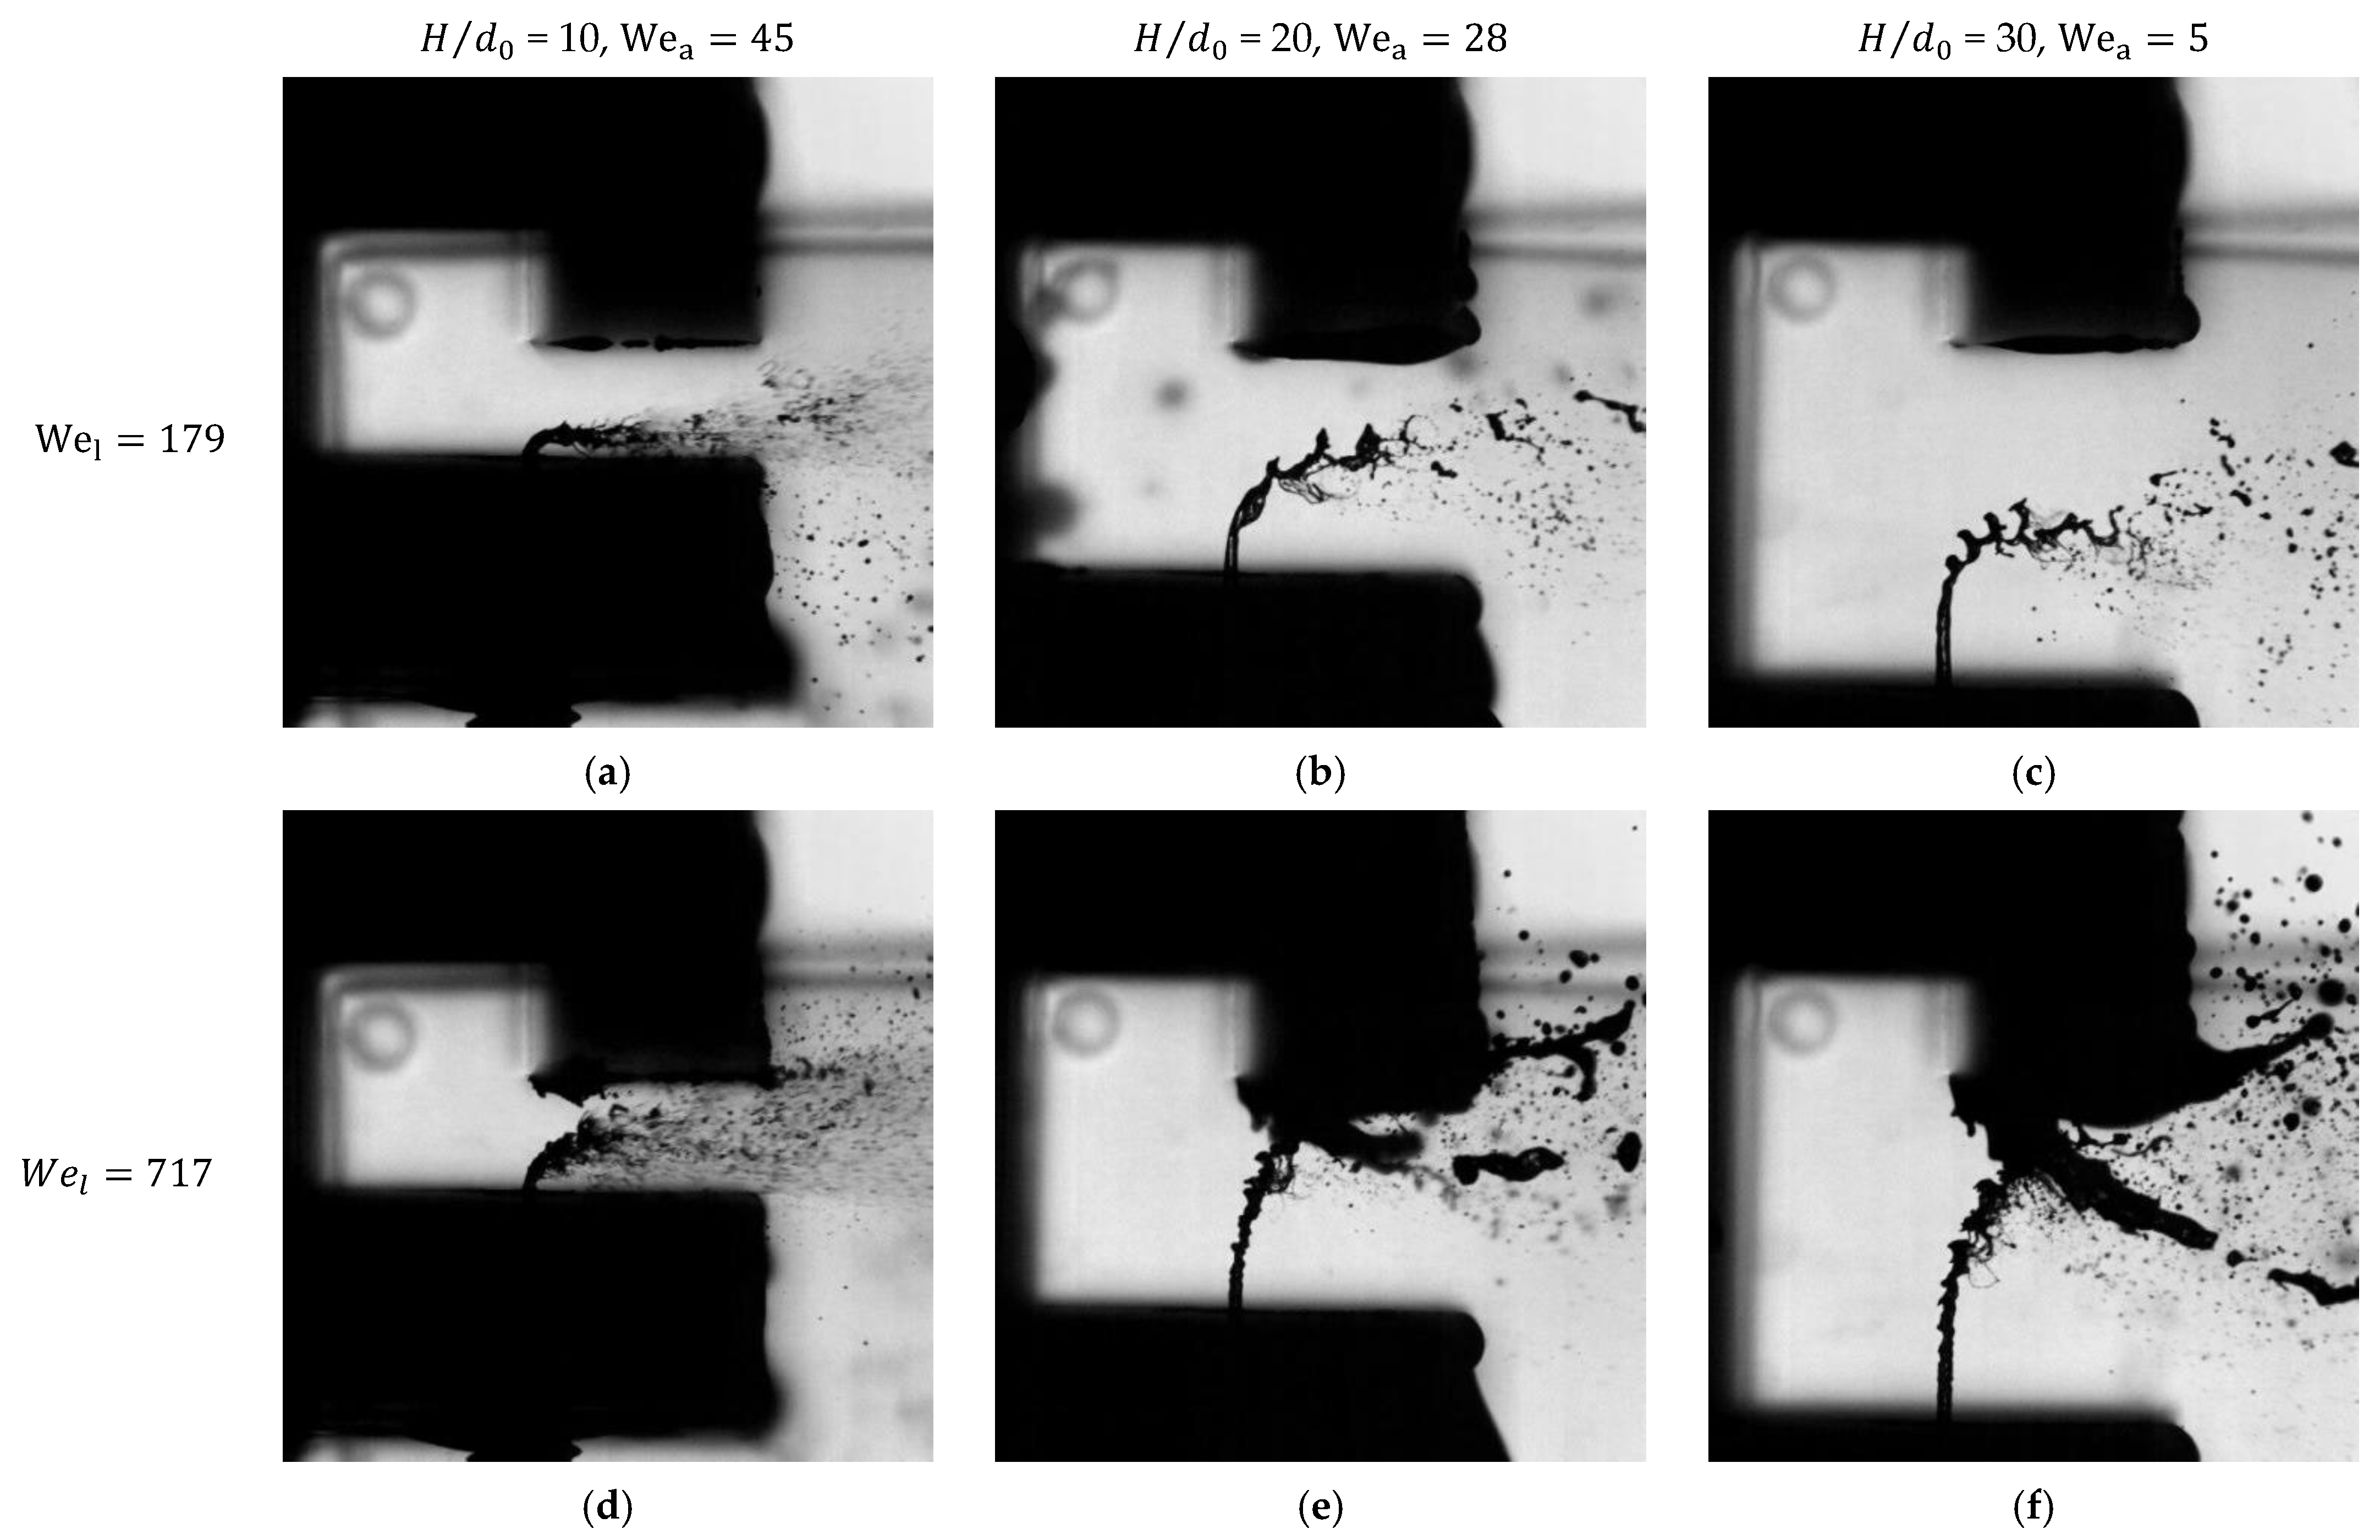
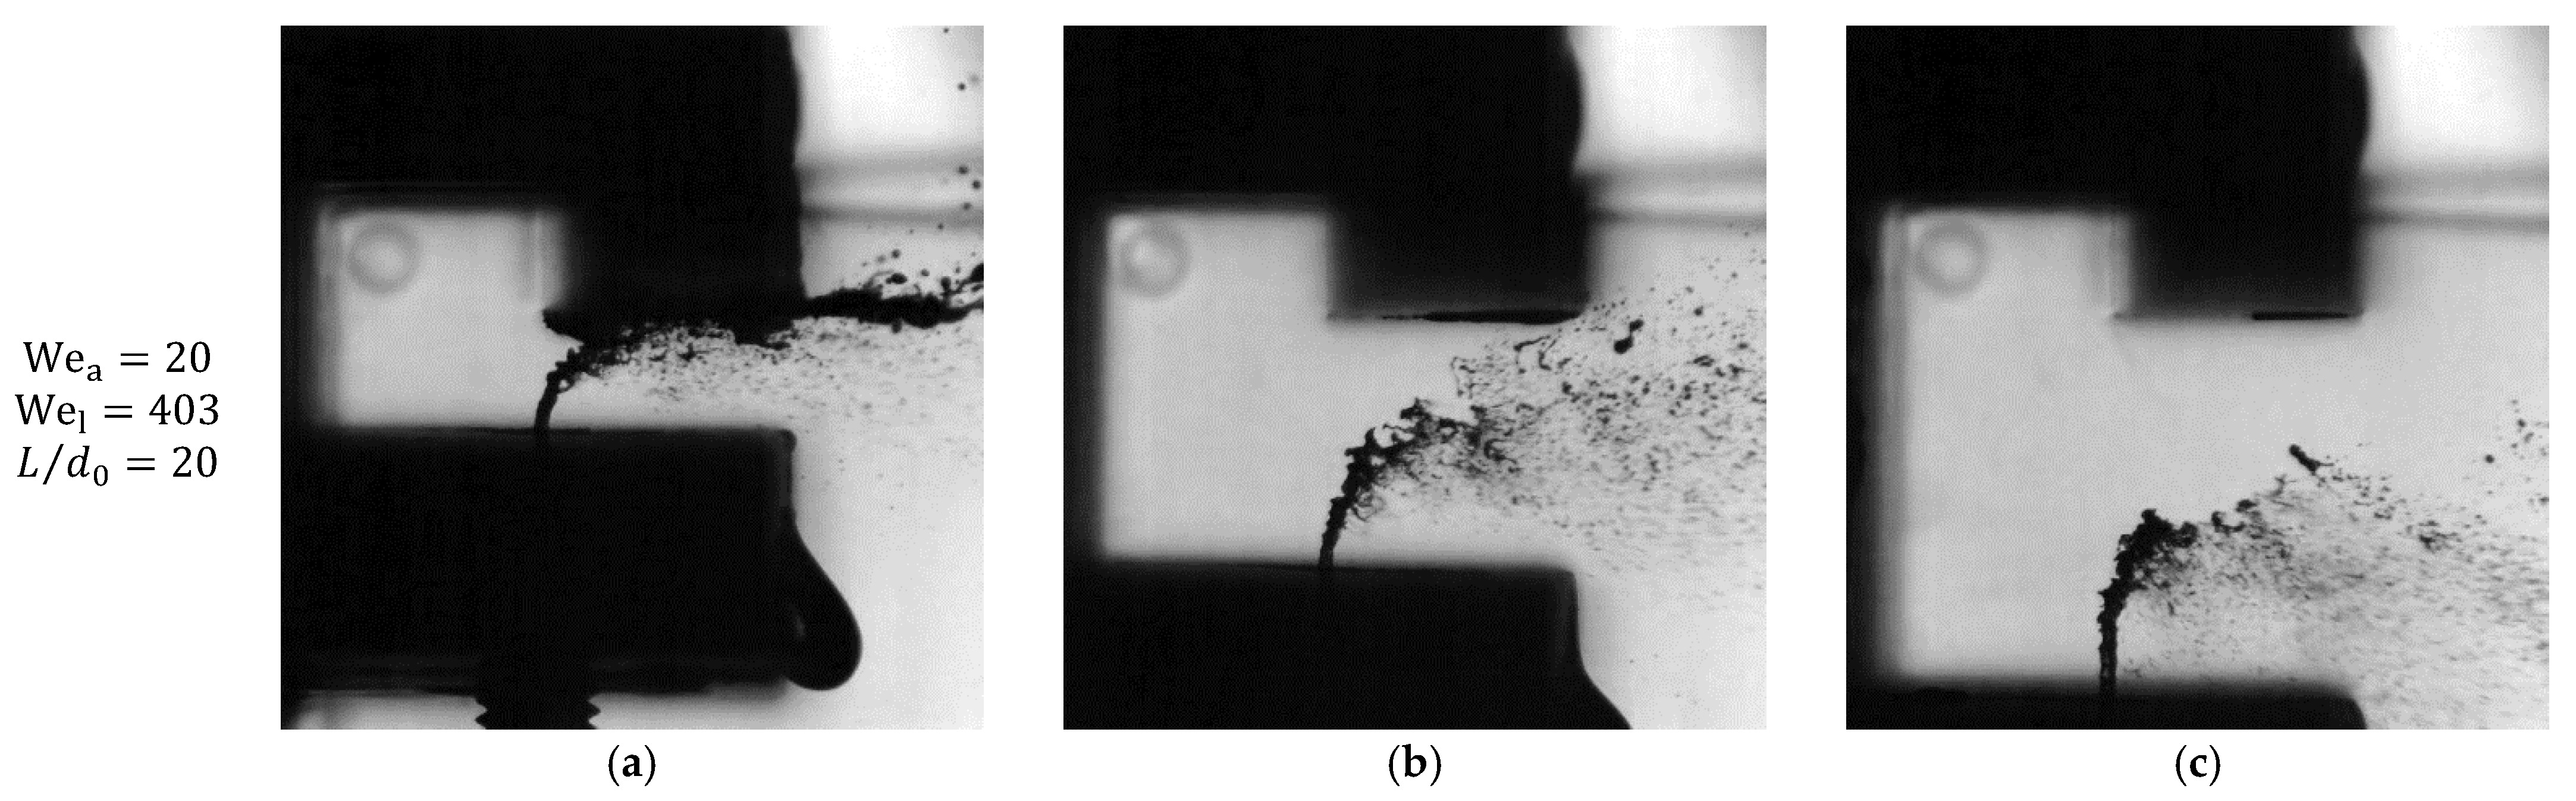
3.2. Macroscopic Jet Characteristics

The high-speed images were averaged and post-processed as density gradient magnitudes, as shown in Figure 9, which showed breakup regimes according to the flow conditions and channel geometries. The density gradient magnitude was described by Davis et al. and Lee et al. [38,39,40]. The density gradient magnitude image was generated by averaging 1500 instant images, and the area with the highest intensity among consecutive density gradients appeared as a bright area in the image. The flow rate of 46 g/s for the crossflow was constantly supplied, and the water mass flow rate was controlled as 1.0, 1.5, and 2.0 g/s (from left to right), corresponding to ALR = 46.0, 30.7, and 23.0. The outlet height ( H / d 0 ) varied between 10, 20, and 30. At the low We l , the jet height was low due to the low jet momentum, and the jet remained on the bottom of the flow path after being sprayed. As the We l increased, the jet collided with the upper wall of the channel, and part of the spray entered the separation area. In addition, when We a increased as H / d 0 decreased, the crossflow momentum strengthened, resulting in low penetration. The entrainment of the jet was observed in the images as bright gradient magnitudes in the separation area. This clearly indicated that H / d 0 affected the jet breakup, as predicted by the simulation results presented in the previous section. As a result, not only the upper recirculation area but also the interference with the bottom wall should be considered.
Figure 10 shows the density gradient images under the condition where W e a , W e l , and H / d 0 were constant and the only variable was L / d 0 . As L / d 0 increased, the height of the jet penetration gradually decreased because as L / d 0 increased, the y-axis air momentum increased and interfered with the jet penetration. These results were identical to those in the previous study by Choi et al. [37,38]. If the momentum of the jet was sufficiently strong to enter the separation area, as L / d 0 increased, the possibility of the jet entering the separation area increased. Like H / d 0 , L / d 0 was a major factor affecting the atomization mechanism in the L shape channel.
The behavior of the spray as it penetrated the recirculation area is shown in Figure 11. These instant images were obtained via high-speed imaging with 0.1-ms intervals. To investigate the jet movements, differences between instant images were post-processed by subtracting the values of each pixel, as shown in Figure 11b. The white pixel denotes the movement of the jet, and vice versa for the black pixel. Two major breakup mechanisms were observed: (1) the shear breakup mechanism in which the jet broke up because of the crossflow parallel to the jet column, and (2) the secondary breakup of the droplet lump trapped in the recirculation zone by the liquid jet collision on the upper wall and bottom of the channel flow. From the first mechanism, the jet-column surfaces fluctuated due to the Kelvin–Helmholtz instability, which is commonly observed in JICF studies [15,18,41,42,43]. From this instability, the droplets were ripped off from the jet column, which was broken by the airflow. In contrast, when small droplets entered the recirculation area, some of them collided with the ceiling and flowed backward in the opposite direction toward the outlet. Consequently, the stagnant droplets formed a huge lump or a ligament, which could be shown as a liquid film, along the boundary layer of the recirculation area. From this mechanism, the broken droplets were larger than the droplets produced by the primary shear breakup mechanism. On the other hand, if there was no interference from the droplets penetrating the recirculation area with the upper wall, these droplets moved to the outlet. These results confirmed that the We and the momentum flux ratio were not the only dependent variables in the case of a jet employing an L-shape channel. An overlap of instant images and velocity contours from Figure 7 is shown in Figure 12. The case in which the droplets collided with the upper wall due to the high We l is shown according to H / d 0 . These overlap images from the computational analysis show that a huge lump or a ligament in the crossflow formed along the boundary of the recirculation area. In other words, weight was added to the explanation of the recirculation boundary shown in Figure 11.
Instantaneous jet breakup images at different injection conditions with different outlet heights are compared in Figure 13. For the same We l value, as H / d 0 increased, the airflow momentum decreased. Thus, jet penetration was relatively high. For the cases at We l = 179, as shown in the first row of Figure 13, jet collision with the upper wall was not observed. When H / d 0 = 20, it could be observed that the jet was almost horizontally broken with respect to the bottom surface of the flow path, and some droplets collided with the bottom surface, resulting in the interference breakup mechanism, but they soon escaped to the direction of the outlet because of the rapid flow. Some droplets leaving the airflow path were free-falling at a relatively slow velocity due to gravity. Even when droplets accumulated on the bottom of the jet column, a different droplet size could be observed then that observed in the shear breakup mechanism. When H / d 0 = 20, the column breakup mechanism could be observed. This is a typical JICF breakup mechanism, which is observed at corresponding We a and MFR values [15,18]. At the bottom of the jet column, a surface breakup mechanism appeared, which then progressed to small droplets. For H / d 0 = 30, the breakup mechanism was similar to that observed at H / d 0 = 20, and shear-layer jet vortices could be observed in the instantaneous images. This is a characteristic of the typical Kelvin–Helmholtz instability, which was observed in all cases where the jet column was sufficiently developed. In addition, the jet penetration increased because the velocity of the crossflow was lower, as predicted by simulation. Therefore, the wider jet column area was affected by the crossflow. The second row of Figure 13 shows jet instantaneous images for We l = 717. For H / d 0 = 10, shear breakup mechanisms could be observed due to the high velocity of the crossflow and the longer penetration of the jet. In contrast to the cases of We l = 179, some droplets collided with the upper wall. In addition, some of the colliding droplets accumulated in the recirculation area and then exited the outlet along the upper wall in the recirculation area. For H / d 0 = 20, the velocity of the crossflow decreased as the outlet area increased. Thus, the jet column height increased, and the column breakup mechanism appeared. Moreover, the jet column directly hit the upper wall, and this collision resulted in the interference breakup mechanism. The droplets that collided flowed back into the recirculation area and circulated, forming the recirculation area interface and ligaments. The remaining small droplets broke up in the jet column and moved to the outlet. For H / d 0 = 30, the largest part of the jet column collided with the upper wall. This phenomenon was similar to that observed for H / d 0 = 20, but this mechanism was particularly strong for H / d 0 = 30. Moreover, the recirculation area boundary could be clearly identified.
Figure 14 demonstrates how the jet characteristics changed with the increase of H / d 0 when other conditions were the same. When H / d 0 = 10, the jets that caused the upper wall collision could be observed, but as H / d 0 increased to 20 and 30, no interaction occurred with the upper wall. Instead, the general JICF mechanism could be seen. It could also be observed that the inclination of the jet column approached vertical as H / d 0 increased to 20 and 30. The behavior of the droplets disintegrated from the jet was also observed to move toward the bottom surface of the channel with the increase of H / d 0 . This result occurred as the variables determining the behavior of the jet were constant except for the change of H / d 0 .
Based on an analysis of the shadowgraph images, a schematic diagram of spray formation in the L-shape crossflow is summarized in Figure 15. When the crossflow bent and met the jet column, the jet breakup occurred according to the We and Re of the crossflow, as well as the MFR. Depending on the outlet height, the size of the recirculation area changed, and thus, it also affected the breakup. When the jet collided with the upper wall, it split into droplets. Where some droplets flowed to the outlet and formed a film, others accumulated along the recirculation area boundary. The accumulated droplet lump moved toward the circulation corner and flowed in the opposite direction toward the crossflow. Subsequently, a film or a ligament along the interface formed, and it flowed toward the outlet. The escaping liquid film or ligament was broken up by the crossflow. In addition, the large droplets, which penetrated the recirculation area, fell due to gravity. When they re-penetrated the interface, they broke up again along the film. The Kelvin–Helmholtz instability could be observed because of the velocity difference between the lower and upper interface surfaces. The image analysis showed that the breakup of this film or ligament resulted in very rough and large-sized droplets. For a uniform jet breakup in a typical radial swirler, it is necessary to design the swirler so that it minimizes the recirculation area or its droplet accumulation effect.

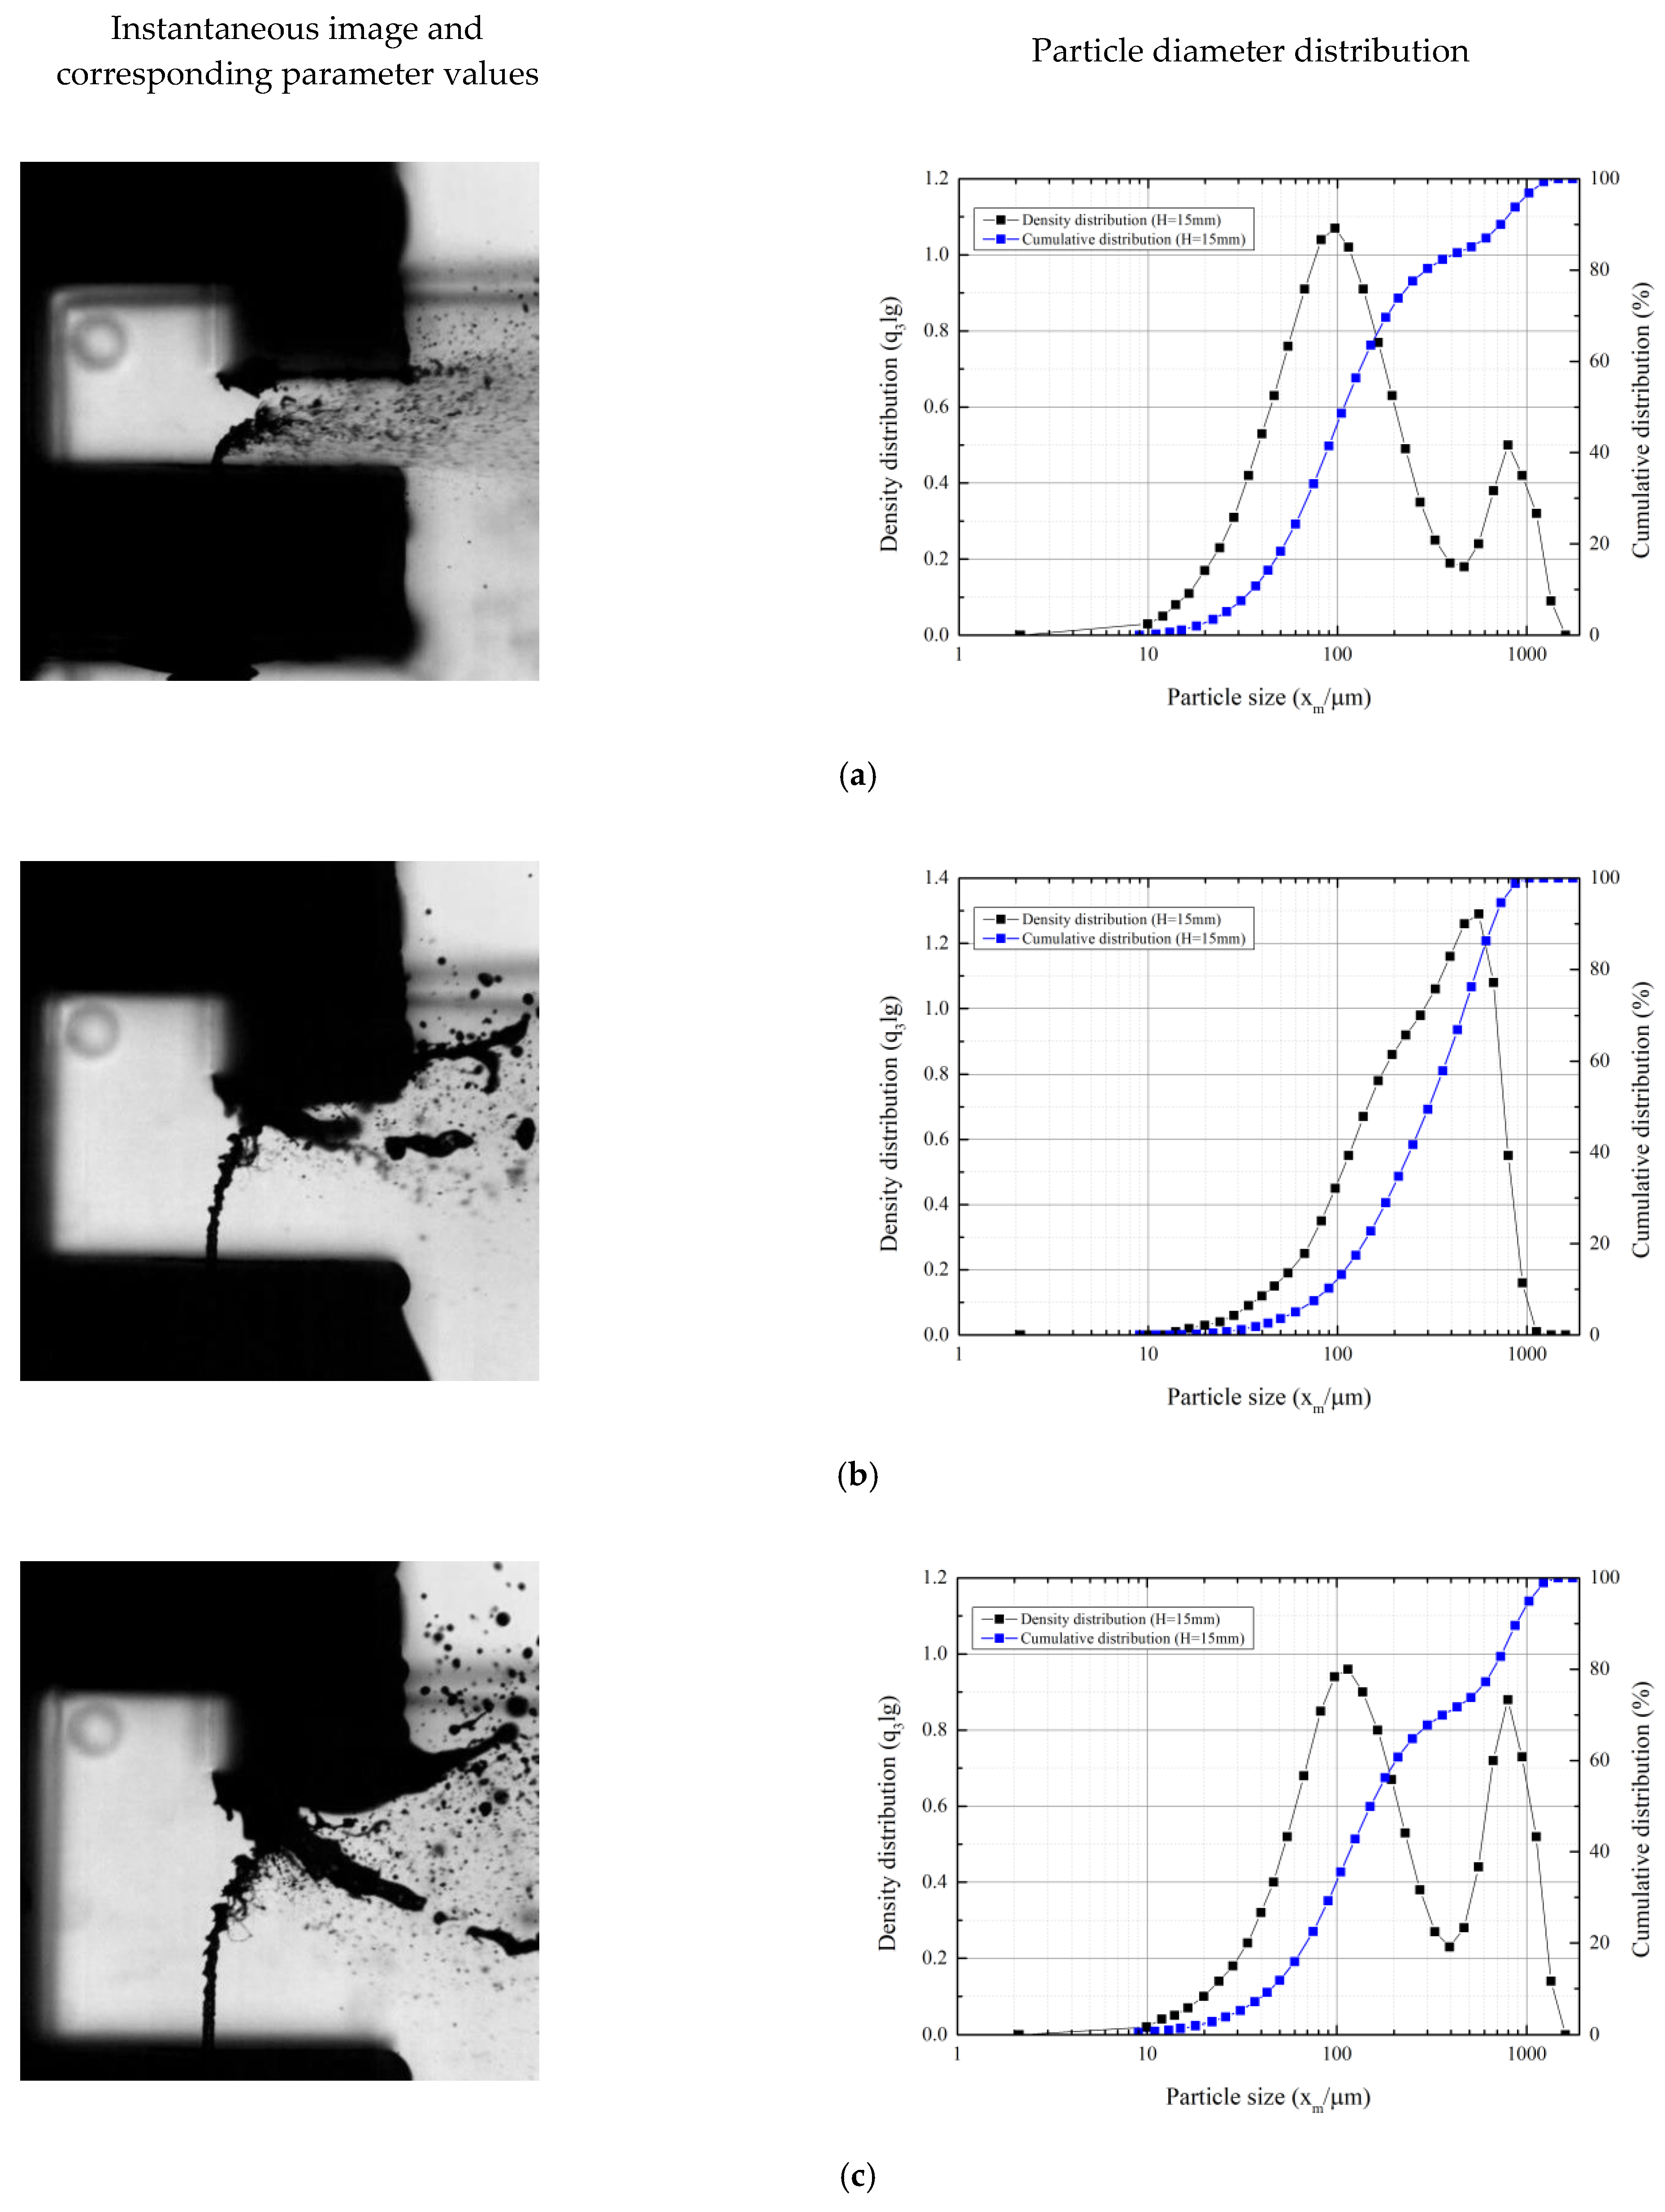
3.3. Effects of Jet Breakup Mechanism on Droplet Sizes

The droplet diameter measurement was conducted to quantitatively analyze the jet breakup mechanisms. Measurements were performed at a 100-mm distance from the outlet. As shown in Figure 6b, droplet measurement was performed for 1 min at the location and the average value was used. Uncertainty analysis was omitted because it showed an error of up to 0.5 μm (less than 0.5%) when re-measured 10 times.
The droplet size distributions of the cases in Figure 13 are compared in Figure 16 and Figure 17. The black dotted line represents the density distribution, which is expressed as a probability density function of a lognormal distribution. The blue dotted line represents the cumulative distribution.
As shown in Figure 16a, two peaks were observed in the density distribution. This is described as a bimodal distribution, which usually appears when the droplets are not sufficiently broken up. This normally means that the liquid jet at the measurement point is in the process of a secondary breakup. However, compared with the single-mode distribution shown in Figure 16b, the major peak of Case (a) had a smaller diameter than that of Case (b). This indicated that the bimodal distribution did not cause the insufficient breakup, whereas the secondary peak reflected the existence of the second breakup mechanisms due to the collision of the jet with the bottom wall [44,45,46]. Similar to Figure 16b, Figure 16c shows only a single mode, and it was observed that jet breakup due to crossflow was dominant. In Figure 16b,c, only one difference in the We a value is visible. It was observed that the difference in he We a value did not significantly affect the jet breakup when compared to the occurrence of the secondary breakup mechanism, as shown in Figure 16a.
Compared with the cases at We l = 179 shown in Figure 16, the jet height increased owing to the We l increase, as shown in Figure 17. Therefore, the number of droplets interacting with the upper wall also increased. For the case in Figure 17a, the size of the recirculation area generated in the upper wall was relatively small, and the accumulated droplets were rapidly broken because of the high We a value due to the outlet height. The droplet size distribution was bimodal, indicating two breakup mechanisms. As demonstrated in Figure 17b, as H / d 0 increased and We a in the crossflow decreased, the jet penetration length increased. This caused the jet to directly contact the upper wall. Some droplets exited the outlet, and other droplets rotated along the recirculation area boundary, forming a thick ligament that exited the outlet. The particle size distribution seemed to almost form a single-mode distribution. However, two distributions were superimposed. That is, the large droplet-size formation from the interaction with the upper wall and the recirculation had a greater effect on fuel atomization than the crossflow jet breakup mechanism. In the cases with H / d 0 = 30, as shown in Figure 17c, the We a value was the lowest, and interference with the upper wall still existed. In this case, the droplet size distribution once again indicated the bimodal shape. Compared with the case in Figure 17b, the major peak appeared at around 100   μ m , which is similar to the case in Figure 17a. This case showed better atomization than in Figure 17b, but the secondary peak with the larger droplet size had a higher distribution proportion than the case in Figure 17a. As a result, as H / d 0 increased, the size of the recirculation area also increased, which increased the possibility of a jet entering the recirculation area.
In summary, at the same air mass flow rate, changes in H / d 0 affected the air velocity, and this consequently influenced We a . This phenomenon was expected, and it was obvious that the average droplet size would decrease as We a increased, and vice versa. However, as H / d 0 increased, the size of the recirculation area increased, and the droplets caused by the jet collision with the upper wall accumulated inside the recirculation area. This meant that two different atomization mechanisms, similar to the breakup of a film or ligament and jet collision, were generated. As a result of these phenomena, droplets with a size of 500 μ m or more were formed, and they not only negatively affected atomization, they also greatly contributed to the formation of large amounts of pollutants due to incomplete combustion.

3.4. Generalization of Effects of Breakup Mechanisms on Atomization

There are various methods for analyzing spray atomization. Among them, the SMD is important for combustion and chemical reactions [11,46,47,48,49,50,51,52,53]. When describing various droplet size distributions, the SMD can characterize the overall atomization very efficiently. In this experiment, the SMD was introduced to describe the spraying of the jet within a specific shape and to identify the spray pattern. The relations between the SMD and spray characteristics have been investigated for a long time. In recent studies, the correlations have been empirically modified according to various spray media and environments surrounding the sprays [11,15,18]. Equation (7) was derived by Ingebo et al., and it represents the relationship between the SMD and the major dimensionless numbers [11]. In this equation, the SMD is proportional to W e and R e . In the later research, the more sophisticated SMD correlation was suggested, which is the product of the We and Re with the exponent, as shown in Equation (8). Based on these correlations, many empirical equations related to the SMD have been intended for the jet breakup, and they have been mainly used to describe jet breakup mechanisms with a low injection pressure drop.
SMD WeRe ,
d 0 SMD = 5.0 ( WeRe ) 0.25 .
However, as shown in Figure 16 and Figure 17, it is hard to agree that flow conditions such as We and Re only control the atomization characteristics in the L-shape crossflow. Therefore, the correlation between the JICF in the L-shape crossflow should be defined, including the geometric shape information of the L-Shape channel. The Buckingham π theorem is used to find the appropriate correlation for the effects of crossflow conditions, injection conditions, and geometric parameters of the L-shape channel on the SMD, which is representative of atomization characteristics. Basically, because the effects of the crossflow and injection conditions on the SMD follow the conventional JICF, the following relationship can be assumed.
SMD = f ( d 0 L , H , V a , V l , μ a , μ l , σ , ρ a , ρ l ) ,
We can rewrite Equation (9) as,
SMD = α ( d 0 ) a ( L ) b ( H ) c ( V a ) d ( V l ) e ( μ a ) f ( μ l ) g ( σ ) h ( ρ a ) i ( ρ l ) j ,
where 𝛼 is a correction constant. Rearranging Equation (10) with the dimensional analysis, the following Equation (11) is obtained.
SMD d 0 = α ( L d 0 ) b ( H d 0 ) c ( V a V l ) e ( μ l ρ l V a d 0 ) f + g ( σ ρ l V a 2 d 0 ) h ( ρ a ρ l ) i ( μ a μ l ) f
Equation (11) suggests that there are seven dimensionless groups that can affect the SMD. The subscripts of each component can then be rearranged to be equal. Therefore, it becomes Equation (12).
SMD d 0 = α ( L d 0 ) b ( H d 0 ) c ( V l V a ) e + f + g ( μ l ρ l V l d 0 ) f + g ( σ ρ a V a 2 d 0 ) h ( ρ a ρ l ) i + h ( μ a μ l ) f
Because the last two terms, which are the density ratio and the viscosity ratio, are assumed as constants in this study, they are neglected. Then, Equation (13) is obtained.
SMD d 0 = α ( L d 0 ) b ( H d 0 ) c ( V l V a ) e + f + g ( μ l ρ l V l d 0 ) f + g ( σ ρ a V a 2 d 0 ) h
The fourth and fifth groups in Equation (13) are similar to Re and We , respectively, meaning that Equation (13) can be expressed as:
SMD d 0 = α ( L H ) b ( V l V a ) e + f + g Re l ( f + g ) We a h ( H d 0 ) b + c .
Equation (14) shows that SMD is related to Re and We , as mentioned. In addition, the first group contains the geometric shapes, which is a ratio of the liquid injection position, L, to the height of the L-shape channel outlet, H. The second group represents the velocity ratio of the liquid jet injection and the crossflow, whereas the last group is the ratio of the height of the channel outlet to the liquid injector diameter, d 0 . Consequently, Equation (14) considers not only the flow condition, but also the geometric parameters. Whether or not the collision phenomenon occurs depends on the relative velocity or momentum of the liquid jet into the L-shape crossflow. For example, if the jet momentum is relatively larger than a certain critical value, it collides with the upper wall, whereas the jet lays on the bottom wall if the jet momentum is too low. Between both conditions, the jet is broken up as per the typical JICF mechanism. In other words, the breakup process changes depending on the time the jet or droplet stays in the crossflow. Therefore, if we assume that exponent b equals (e + f + g), then the first length ratio and the second velocity ratio in Equation (14) can be combined, and the non-dimensional timescale, τ , can be derived as:
τ = t l t a ,   w h e r e   t l = H V l     a n d   t a = L V a .
t l is the timescale for the jet to reach the upper wall, whereas t a is the timescale related to how long the crossflow will affect the jet column in the channel. If τ is relatively large, the droplet quickly escapes from the inside of the channel, and if τ is small, it is likely that the droplet will collide with the upper wall. As shown in Figure 9, the column breakup point was selected using a pixel analysis at the location where the jet column bent rapidly. This location is seen in the density gradient image where the dark pixel boundary becomes bright. And V a is the x-axis velocity expressed in Figure 8. Figure 18 shows the correlation between the column breakup point of each case and τ at H / d 0 = 20. When 10 τ , the column breakup point occurs at a low position, which shows that it collides with the bottom. When 6 τ < 10 , it has the characteristics of a general JICF in which no collision occurs. When τ < 6 , most of the jets collide with the upper wall. These analyses show that the crossflow can be divided into a dominant atomization region and a region in which jet impingement mechanisms exist. Also, these results suggest that the first and second groups in Equation (14) can be expressed as τ.
Therefore, Equation (14) can be rewritten with the newly defined τ as Equation (16).
SMD d 0 = α τ β Re l ( f + g ) We a h ( H d 0 ) b + c .
As shown in Figure 19, τ has a strong relation to the breakup. The new exponent (β) is adopted by combining the exponents of the first and second groups into one exponent, as we assumed. After cleaning up the exponents in Equation (16), Equation (17) is derived as the correlation for the SMD from the present results.
SMD d 0 = α τ β Re l γ We a δ ( H d 0 ) ε ,
According to three different breakup mechanisms, we can derive three empirical correlations as Equations (18)–(20) based on the range of τ.
(1)
Mechanism 1: Collision with the upper wall, τ < 6
SMD d 0 = 0.25 τ 0.85 Re l 1.00 We a 1.13 ( H d 0 ) 1.24 ,
(2)
Mechanism 2: JICF without collision, 6 τ < 10
SMD d 0 = 0.48 τ 0.07 Re l 0.35 We a 0.52 ( H d 0 ) 0.36 ,
(3)
Mechanism 3: Collision with the bottom wall, 10 τ
SMD d 0 = 2.85 τ 0.54 Re l 0.78 We a 1.38 ( H d 0 ) 1.05 .
The correlations for the three mechanisms show good agreement with the measurement data, as shown in Figure 20. From the correlations, the effect of each term on the SMD can be deduced. First, the effects of R e l and W e a on the SMD can be easily understood; increases in the jet and crossflow momentum result in better atomization. τ proportionally affects the SMD and, in addition, τ controls the breakup mechanism. If the jet velocity in mechanism 1 decreases, the jet can avoid the collision with the upper wall. This can be proved with Equation (18); τ increases due to the decrease of the jet velocity, and the breakup mechanism can then change to mechanism 2 or 3. A decrease in the crossflow velocity ( V a ) elicits the same effect as an increase in the jet velocity ( V l ). The effects of the liquid injection position (L) are hidden in τ ; an increase in L allows the longer exposure of the jet in the crossflow, i.e., an increase in t a . The jet can achieve better atomization performance, whereas a decrease in τ can increase the chance of the collision of the jet with the upper wall. Meanwhile, the channel height has more complicated effects on the SMD and the breakup mechanism. When H increases at the constant V a , it causes an increase in τ and a decrease in the last term; the increase in τ allows the jet to avoid the collision with the upper wall, whereas an increase in the SMD occurs because the H in the last term has a larger exponent than the H in τ . When the mass flow rate of the crossflow is fixed with an increase in H, the SMD increases more rapidly because the effects of decreasing V a in We a also contribute. Depending on the exponents of the non-dimensional number in the correlation equations, an effect of the τ term on the SMD can also be compared across the three mechanisms. Compared to mechanisms 1 and 3, the exponent of τ is relatively small at 0.07. This indicates that the effect of τ in mechanism 2 is negligible. If we ignore τ in Equation (19), the correlation is close to the results from Ingebo [12,13]. In other words, the geometrical influences can be neglected.
In summary, the jet breakup mechanisms in the L-shape channel mainly depend on not only H / d 0 , but also the dimensionless number, τ. In addition, the geometric changes, which can affect the separation zone, and the flow conditions can indirectly affect τ, and the mechanism can shift accordingly. In particular, in the range of 6 τ < 10 , the effects of τ are insignificant, and the general JICF spray characteristics are shown.

4. Discussion and Conclusions

In this work, the breakup mechanism characteristics of a jet in a crossflow in an L-shape channel were investigated by analyzing the jet characteristics with consideration given to geometrical factors and by using a high-speed camera and the HELOS. The results of this study can be summarized as follows.
(1)
An L-shape channel was manufactured to simulate a JICF inside a radial swirler.
(2)
In the L-shape channel, the jet characteristics were determined by the dimensionless numbers We and Re, but in addition, the atomization characteristics changed via the geometric dimensionless variables H / d 0 and L / d 0 , and this affected the size of the separation area.
(3)
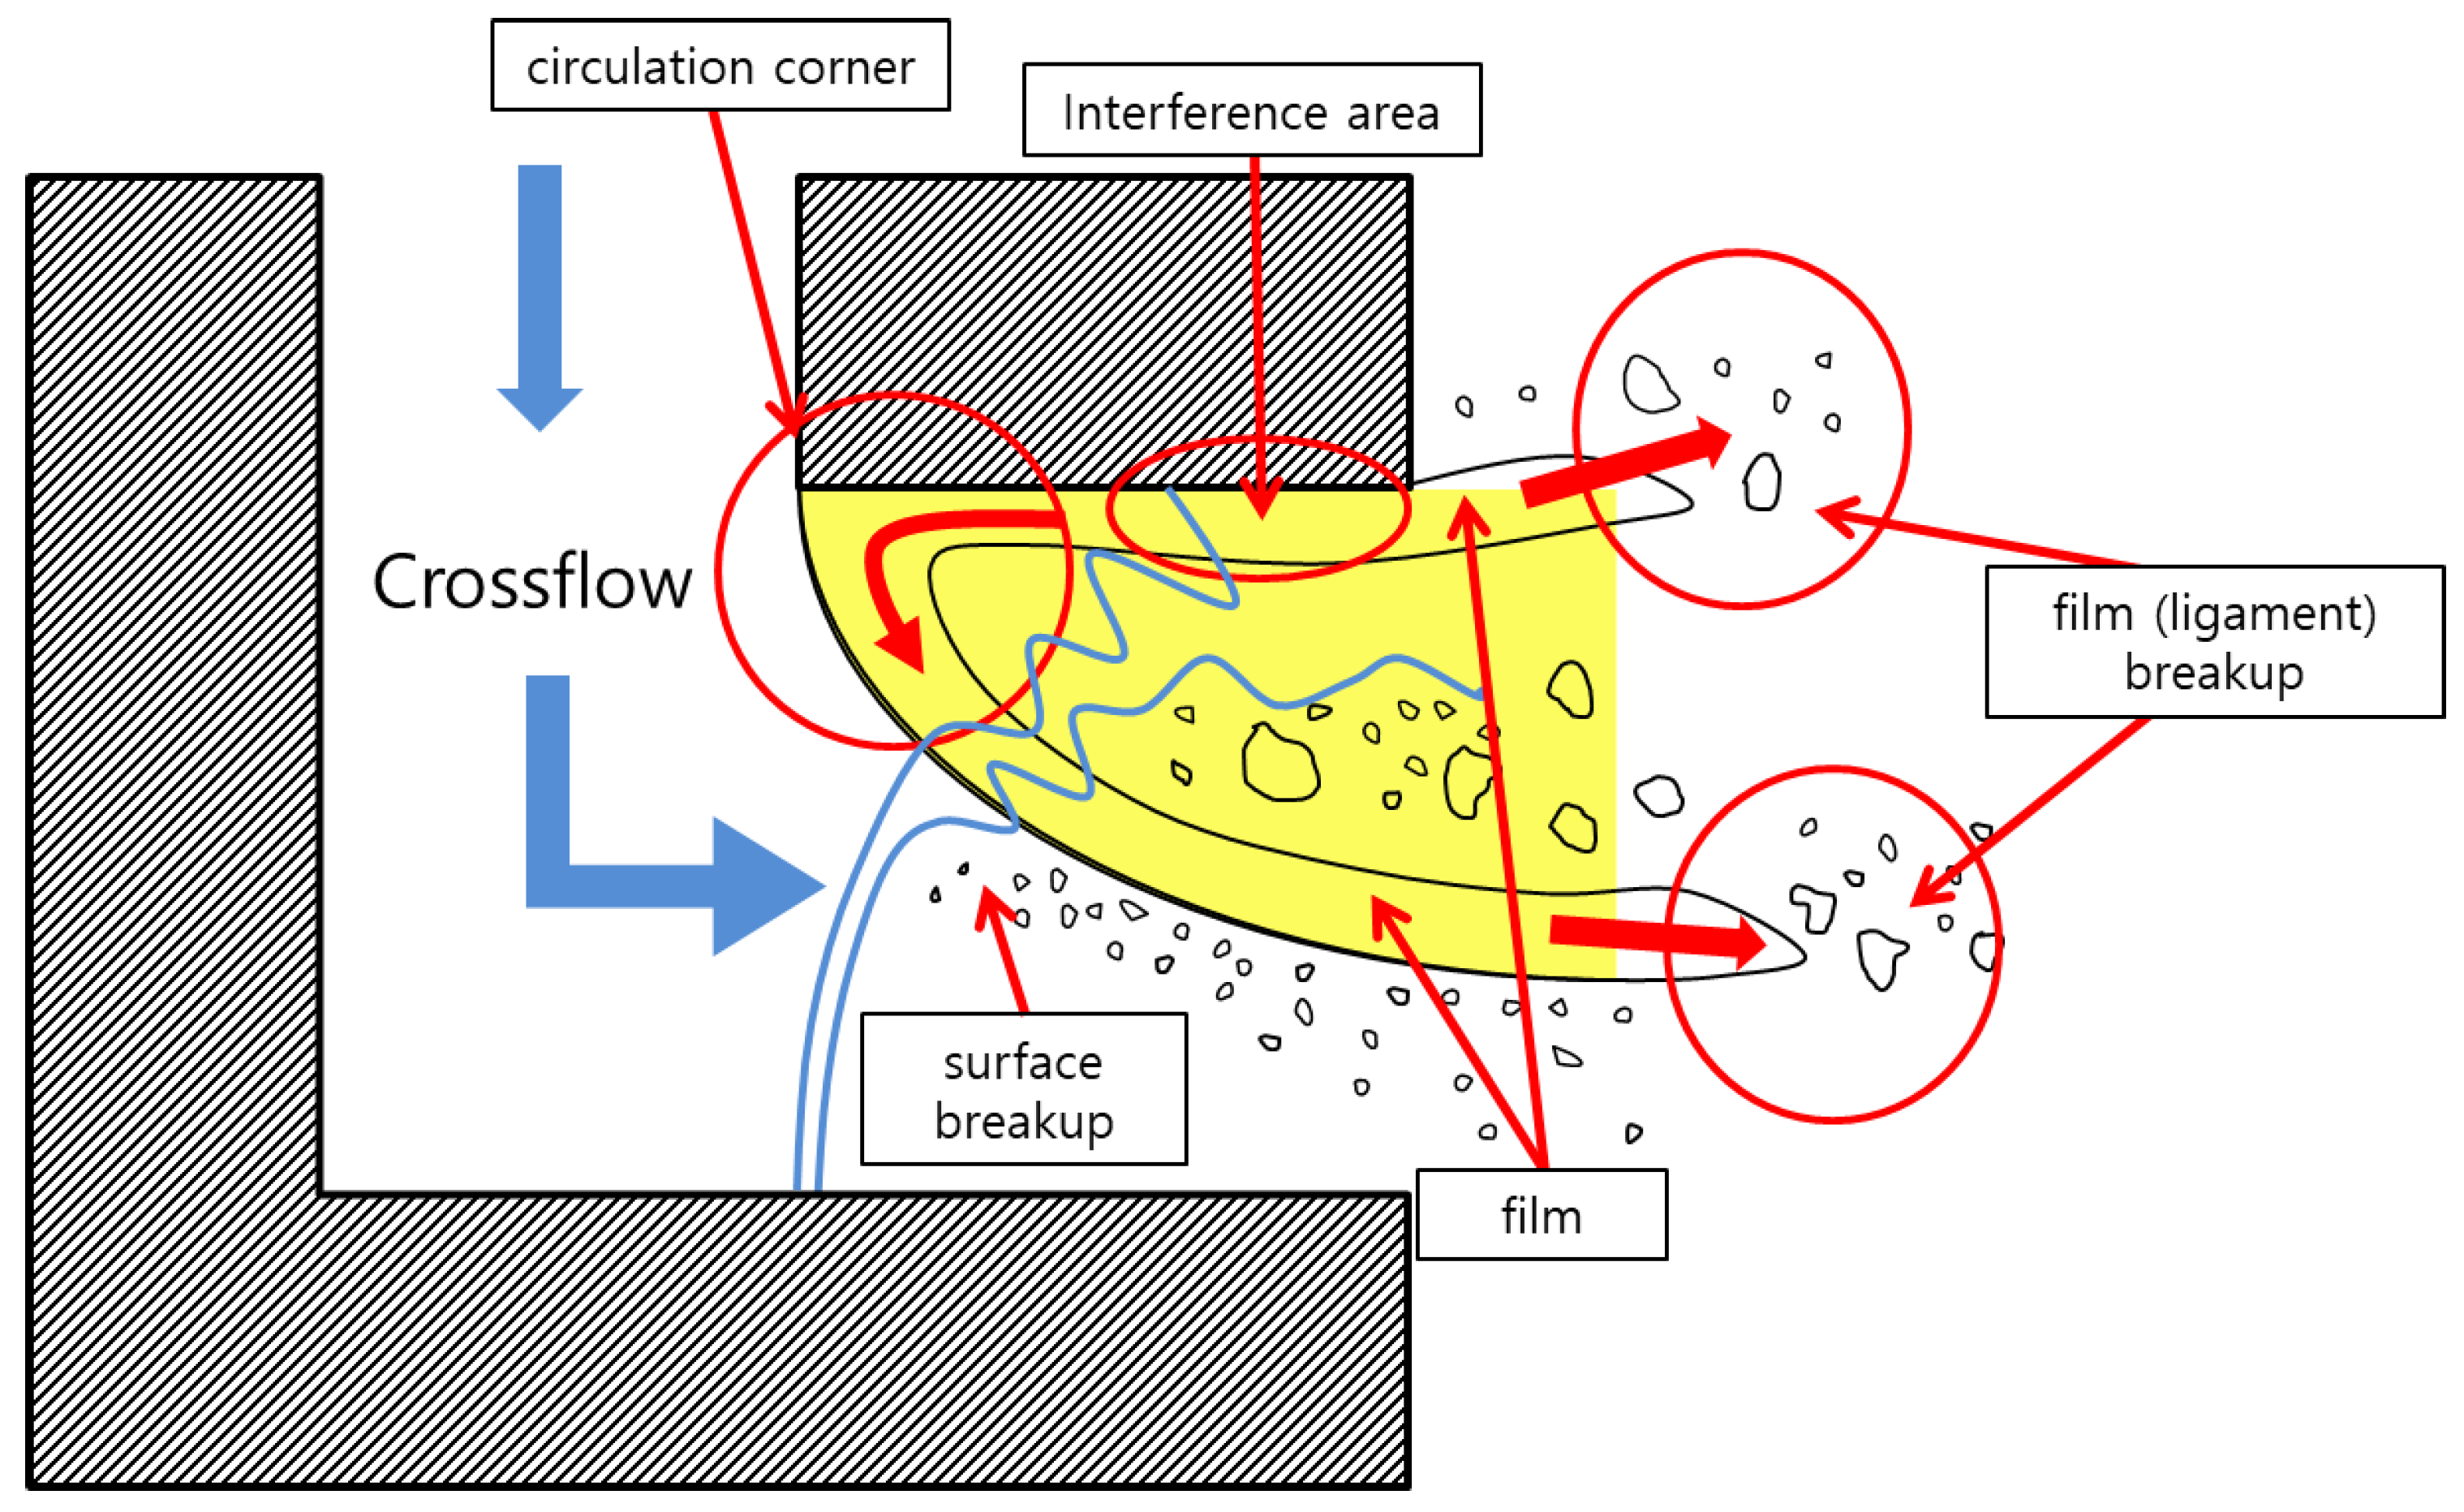
There were three types of jet breakup mechanisms inside the L-shape channel: (1) a general JICF mechanism, (2) jet collision via W e l and H / d 0 , and (3) the formation of ligaments or a film via the jet collision, recirculation, and accumulation of droplets.
(4)
The new dimensionless number τ was introduced through experiment data correlation, and the jet breakup mechanisms presented in (3) were described in three ranges of τ:
  • τ < 6, When the jet collides with the upper wall, the colliding droplet inevitably forms a ligament or film due to the recirculation area. The droplet size distribution creates a bimodal distribution.
  • 6 ≤ τ < 10, The general JICF mechanism is dominant, and no jet collision occurs.
  • 10 ≤ τ, Droplets collide with the bottom of the channel. According to the wall interaction of the droplets, it is possible for the droplet size distribution to create a bimodal distribution.
The experimental data and empirical correlations from this study can be used to predict the atomization characteristics of a jet in an L-shape channel flow that models the radial swirler of gas turbine engines, which can reduce NOx emissions.

Author Contributions

Conceptualization, M.H.C. and J.A.; methodology, M.H.C.; software, M.H.C.; validation, M.H.C. and J.A.; formal analysis, M.H.C.; investigation, M.H.C. and J.A.; resources, M.H.C.; data curation, M.H.C.; writing—original draft preparation, M.H.C.; writing—review and editing, M.H.C.; visualization, M.H.C.; supervision, M.H.C.; project administration, J.K.; funding acquisition, J.K. All authors have read and agreed to the published version of the manuscript.

Funding

This work was supported by the BK21 FOUR program through the National Research Foundation of Korea (NRF), funded by the Korean government (grant number: 5199990714521) and Basic Science Research Program (2016R1D1A1B04934852) through a National Research Foundation of Korea (NRF) grant funded by the Korean government.

Institutional Review Board Statement

Not applicable.

Informed Consent Statement

Not applicable.

Data Availability Statement

The data that support the findings of this study are available from the corresponding author upon reasonable request.

Conflicts of Interest

The authors declare no conflict of interest.

References

  1. Lefebvre, A.H. Gas Turbine Combustion; CRC press: Boca Raton, FL, USA, 1998. [Google Scholar]
  2. Dhanuka, S.K.; Temme, J.E.; Driscoll, J.F.; Mongia, H.C. Vortex-shedding and mixing layer effects on periodic flashback in a lean premixed prevaporized gas turbine combustor. Proc. Combust. Inst. 2009, 32, 2901–2908. [Google Scholar] [CrossRef]
  3. Crocker, D.S.; Nickolaus, D.A.; Smith, C.E. Piloted Airblast Lean Direct Fuel Injector. U.S. Patent 6,272,840, 14 August 2001. [Google Scholar]
  4. Liu, Y.; Sun, X.; Sethi, V.; Nalianda, D.; Li, Y.G.; Wang, L. Review of modern low emissions combustion technologies for aero gas turbine engines. Prog. Aerosp. Sci. 2017, 94, 12–45. [Google Scholar] [CrossRef] [Green Version]
  5. Brandt, D.; Wesorick, R. GE Gas Turbine Design Philosophy; Technical Report; GER-3434; General Electric: Boston, MA, USA, 1994. [Google Scholar]
  6. Dhanuka, S.K.; Temme, J.E.; Driscoll, J.F. Unsteady aspects of lean premixed prevaporized gas turbine combustors: Flame-flame interactions. J. Propuls. Power 2011, 27, 631–641. [Google Scholar] [CrossRef]
  7. Hsieh, S.y.; Hsiao, G.; Li, S.C.; Mongia, H. Air-Assisted Fuel Injector for Mixer Assembly of a Gas Turbine Engine Combustor. U.S. Patent 7,464,553, 16 December 2008. [Google Scholar]
  8. Cowell, L.H.; Rajput, A.; Rawlins, D.C. Development of a Dual-Fuel Injection System for Lean Premixed Industrial Gas Turbines. In Turbo Expo: Power for Land, Sea, and Air; American Society of Mechanical Engineers: Birmingham, UK, 1996; Volume 78743, p. V003T06A034. [Google Scholar]
  9. Lefebvre, A.H. Lean Premixed/Prevaporized Combustion; Number NASA-CP-2016; Workshop: Cleveland, OH, USA, 1977. [Google Scholar]
  10. Foust, M.; Thomsen, D.; Stickles, R.; Cooper, C.; Dodds, W. Development of the GE aviation low emissions TAPS combustor for next generation aircraft engines. In Proceedings of the 50th AIAA Aerospace Sciences Meeting Including the New Horizons Forum and Aerospace Exposition, Nashville, TN, USA, 9–12 January 2012; p. 936. [Google Scholar]
  11. Ingebo, R.D.; Foster, H.H. Drop-Size Distribution for Cross Current Breakup of Liquid Jets in Airstreams; Technical Report; National Advisory Committee for Aeronautics: Cleveland, OH, USA, 1957.
  12. Ingebo, R.D. Capillary and Acceleration Wave Breakup of Liquid Jets in Axial-Flow Airstreams; Technical Report; National Advisory Committee for Aeronautics: Cleveland, OH, USA, 1981.
  13. Song, J.; Cary Cain, C.; Guen Lee, J. Liquid jets in subsonic air crossflow at elevated pressure. J. Eng. Gas Turbines Power 2015, 137, 041502. [Google Scholar] [CrossRef]
  14. Ingebo, R.D. Penetration of Drops into High-Velocity Airstreams; National Aeronautics and Space Administration: Cleveland, OH, USA, 1967.
  15. Schetz, J.; Kush, E., Jr.; Joshi, P. Wave phenomena in liquid jet breakup in a supersonic crossflow. AIAA J. 1980, 18, 774–778. [Google Scholar] [CrossRef]
  16. Wu, P.K.; Kirkendall, K.A.; Fuller, R.P.; Nejad, A.S. Breakup processes of liquid jets in subsonic crossflows. J. Propuls. Power 1997, 13, 64–73. [Google Scholar] [CrossRef]
  17. Yates, C.L. Liquid Injection into a Supersonic Stream; Technical report; Aero Propulsion Lab: Dayton, OH, USA, 1972. [Google Scholar]
  18. Kush Jr, E.A.; Schetz, J.A. Liquid jet injection into a supersonic flow. AIAA J. 1973, 11, 1223–1224. [Google Scholar] [CrossRef]
  19. Baranovsky, S.; Schetz, J. An Experimental Investigation of Methods to Increase the Liquid Jet Penetration into Supersonic Flow; Interim Report Virginia Polytechnic Inst. and State Univ: Fort Belvoir, VA, USA, 1978. [Google Scholar]
  20. Nejad, A.; Schetz, J. Effects of viscosity and surface tension on a jet plume in supersonic crossflow. AIAA J. 1984, 22, 458–459. [Google Scholar] [CrossRef]
  21. Reichenbach, R.; Horn, K. Investigation of injectant properties on jet penetration in a supersonic stream. AIAA J. 1971, 9, 469–472. [Google Scholar] [CrossRef]
  22. Bolszo, C.D.; McDonell, V.G.; Gomez, G.A.; Samuelsen, G.S. Injection of water-in-oil emulsion jets into a subsonic crossflow: An experimental study. At. Sprays 2014, 24, 303–348. [Google Scholar] [CrossRef] [Green Version]
  23. Tan, Z.P. Experimental Study of Spray-Formation Processes in Twin-Fluid Jet-in-Crossflow at Jet-Engine Operating Conditions. PhD Thesis, Georgia Institute of Technology, Atlanta, GA, USA, 2017. [Google Scholar]
  24. Tan, Z.P. The physics of twin-fluid jet-in-crossflow at atmospheric and jet-engine operating conditions. Phys. Fluids 2019, 31, 045106. [Google Scholar] [CrossRef]
  25. Barata, J.; Silva, A. Numerical study of impinging droplets through a crossflow. In Proceedings of the 40th Thermophysics Conference, Seattle, WA, USA, 23–26 June 2008; p. 3923. [Google Scholar]
  26. Makida, M.; Yamada, H.; Kurosawa, Y.; Yamamoto, T.; Matsuura, K.; Hayashi, S. Preliminary Experimental Research to Develop a Combustor for Small Class Aircraft Engine Utilizing Primary Rich Combustion Approach. In Proceedings of the Turbo Expo: Power for Land, Sea, and Air, 8–11 May 2006, Barcelona, Spain; ASME: Barcelona, Spain, 2006; Volume 42363, pp. 835–842. [Google Scholar]
  27. Johnson, S.M. Venturi Nozzle Effects on Fuel Drop Size and Nitrogen Oxide Emissions; Technical Report; National Advisory Committee for Aeronautics: Cleveland, OH, USA, 1982.
  28. Shin, D. A Study on the Spray Characteristics of Pre-filming Air blast Injector with Venturi Shape Design for Gas Turbine Combustor. Master’s Thesis, Korea Aerospace University, Goyang, Korea, 2018. [Google Scholar]
  29. Stouffer, S.; Ballal, D.; Zelina, J.; Shouse, D.; Hancock, R.; Mongia, H. Development & combustion performance of high pressure WSR and TAPS combustor. In Proceedings of the 43rd AIAA Aerospace Sciences Meeting and Exhibit, Reno, NY, USA, 10–13 January 2005; p. 1416. [Google Scholar]
  30. Huang, Y.; Yang, V. Dynamics and stability of lean-premixed swirl-stabilized combustion. Prog. Energy Combust. Sci. 2009, 35, 293–364. [Google Scholar] [CrossRef]
  31. Winterfeld, G.; Eickhoff, H.; Depooter, K. Fuel injectors. Chapter 3. In Design of Modern Gas Turbine Combustors; Academic Press: Cambridge, MA, USA, 1990. [Google Scholar]
  32. Gupta, A.K.; Lilley, D.G.; Syred, N. Swirl Flows; Royal Turnbridge Wells: Kent, UK, 1984. [Google Scholar]
  33. Huang, Y.; Wang, S.; Yang, V. Flow and flame dynamics of lean premixed swirl injectors. Prog. Astronaut. Aeronaut. 2005, 210, 213. [Google Scholar]
  34. Beer, J.M.; Chigier, N.A. Combustion Aerodynamics; Krieger Publishing Company: Malabar, FL, USA, 1983. [Google Scholar]
  35. Etheridge, C. Mars SoLoNOx: Lean Premix Combustion Technology in Production. In Turbo Expo: Power for Land, Sea, and Air; American Society of Mechanical Engineers: The Hague, The Netherlands, 1994; Volume 78859, p. V003T06A013. [Google Scholar]
  36. Choi, M.H.; Shin, D.S.; Radhakrishnan, K.; Son, M.; Koo, J. Spray Characteristics of Jet According to Position of Injector Hole in Crossflow. J. Korean Soc. Propuls. Eng. 2018, 22, 88–96. [Google Scholar] [CrossRef]
  37. Choi, M.H. The Effect of Radial Swirler Geometry and Spray Condition on Jet in Crossflow. Master’s Thesis, Korea Aerospace University, Goyang, Korea, 2018. [Google Scholar]
  38. Madden, P. CAEP Combustion Technology Review Process and CAEP NOx Goals; CAEP Publication: Fergus Falls, MN, USA, 2014. [Google Scholar]
  39. Davis, D.W. On the Behavior of a Shear-Coaxial Jet, Spanning Sub-to Supercritical Pressures, with and without an Externally Imposed Transverse Acoustic Field; Technical Report; The Pennsylvania State University: Philadelphia, PA, USA, 2006. [Google Scholar]
  40. Davis, D.; Chehroudi, B. Shear-coaxial jets from a rocket-like injector in a transverse acoustic field at high pressures. In Proceedings of the 44th AIAA Aerospace Sciences Meeting and Exhibit, Reno, NV, USA, 9–12 January 2006; p. 758. [Google Scholar]
  41. Leong, M.Y.; McDonell, V.G.; Samuelsen, G.S. Effect of ambient pressure on an airblast spray injected into a crossflow. J. Propuls. Power 2001, 17, 1076–1084. [Google Scholar] [CrossRef]
  42. Leong, M.; Smugeresky, C.; McDonell, V.; Samuelsen, G. Rapid liquid fuel mixing for lean-burning combustors: Low-power performance. J. Eng. Gas Turbines Power 2001, 123, 574–579. [Google Scholar] [CrossRef] [Green Version]
  43. Leong, M.Y. Mixing of an Airblast-Atomized Fuel Spray Injected in to a Crossflow of Air. Ph.D. Thesis, University of California, Irvine, CA, USA, 2017. [Google Scholar]
  44. Saha, A.; Lee, J.D.; Basu, S.; Kumar, R. Breakup and coalescence characteristics of a hollow cone swirling spray. Phys. Fluids 2012, 24, 124103. [Google Scholar] [CrossRef] [Green Version]
  45. Harari, R.; Sher, E. Bimodal drop size distribution behavior in plain-jet airblast atomizer sprays. At. Sprays 1998, 8, 349–362. [Google Scholar] [CrossRef]
  46. Lefebvre, A.H.; McDonell, V.G. Atomization and Sprays; CRC Press: Boca Raton, FL, USA, 2017. [Google Scholar]
  47. Lorenzetto, G.; Lefebvre, A.H. Measurements of drop size on a plain-jet airblast atomizer. AIAA J. 1977, 15, 1006–1010. [Google Scholar] [CrossRef]
  48. Lefebvre, A.H. The prediction of Sauter mean diameter for simplex pressure-swirl atomisers. At. Spray Technol. 1987, 3, 37–51. [Google Scholar]
  49. Rizkalla, A.; Lefebvre, A.H. The influence of air and liquid properties on airblast atomization. J. Fluids Eng. 1975, 97, 316–320. [Google Scholar] [CrossRef]
  50. El-Shanawany, M.S.; Lefebvre, A.H. Airblast atomization: Effect of linear scale on mean drop size. J. Energy 1980, 4, 184–189. [Google Scholar] [CrossRef]
  51. Lefebvre, A.H. Airblast atomization. Prog. Energy Combust. Sci. 1980, 6, 233–261. [Google Scholar] [CrossRef]
  52. Fraser, R.; Dombrowski, N.; Routley, J. The production of uniform liquid sheets from spinning cups. Chem. Eng. Sci. 1963, 18, 315–321. [Google Scholar] [CrossRef]
  53. Rizk, N.K.; Lefebvre, A.H. The Influence of Liquid Film Thickness on Airblast Atomization. J. Eng. Power 1980, 102, 706–710. [Google Scholar] [CrossRef]
Figure 1. Comparison of the jet in crossflow with two types of swirlers: (a) cross-section of jet in axial swirler; (b) radial swirler.
Energies 15 03360 g001
Figure 2. Schematic of a lean, premixed, prevaporized combustor employing a radial swirler [2].
Energies 15 03360 g002
Figure 3. Concept of a radial swirler channel simulation to an L-shape channel.
Energies 15 03360 g003
Figure 4. Cross-section schematics of the L-shape channel and the fuel injector.
Energies 15 03360 g004
Figure 5. Schematic diagram of the experimental setup.
Energies 15 03360 g005
Figure 6. (a) Photograph of the helium–neon laser optical system (HELOS); (b) Schematic diagram of the HELOS and the measuring point and method.
Energies 15 03360 g006
Figure 7. Velocity contours and streamlines with the fixed mass flow rate of 77g/s and three different channel heights: (a) H / d 0 = 10; (b) is H / d 0 = 20; and (c) H / d 0 = 30.
Energies 15 03360 g007
Figure 8. Crossflow x and y velocity by H / d 0 at an air mass flow rate of 77g/s: (a) H / d 0 = 10; (b) H / d 0 = 20; and (c) H / d 0 = 30.
Energies 15 03360 g008
Figure 9. Density gradient magnitude images at various flow conditions in three types of geometries.
Energies 15 03360 g009
Figure 10. Density gradient magnitude images at various L / d 0 values for We a = 25 , We l = 179 , and H / d 0 = 10.
Energies 15 03360 g010
Figure 11. (a) Instantaneous jet images for H / d 0 = 30, We a = 6.32 , and We l = 717 at 0.1-ms intervals. (b) Differences between the 0.1-ms interval instantaneous images of (a).
Energies 15 03360 g011aEnergies 15 03360 g011b
Figure 12. Velocity contours and streamlines with the fixed mass flow rate of 77 g/s and three different outlet heights: (a) H / d 0 = 10, (b) H / d 0   = 20, and (c) H / d 0 = 30.
Energies 15 03360 g012
Figure 13. Instantaneous jet images for different parameter values; the mass flow rate of air is 46 g/s, (a,d) for H / d 0 = 10, We a = 45 ; (b,e) for H / d 0 = 20, We a = 28 ; and (c,f) for H / d 0 = 30, We a = 5 .
Energies 15 03360 g013
Figure 14. Instantaneous jet images for three different outlet heights: (a) H / d 0 = 10; (b) H / d 0 = 20; and (c) H / d 0 = 30.
Energies 15 03360 g014
Figure 15. Schematic diagram of the jet breakup mechanism in the L-shape channel, which simulates a radial swirler.
Energies 15 03360 g015
Figure 16. Instantaneous images and particle diameter distribution for H / d 0 = 10, 20, and 30, We l = 179 and air mass flow of 46 g/s: (a) H / d 0 = 10, We a = 45; (b) H / d 0 = 20, We a = 28; and (c) H / d 0 = 10, We a = 5.
Energies 15 03360 g016
Figure 17. Instantaneous images and particle diameter distribution for H / d 0 = 10, 20, and 30, W e l = 717, and air mass flow of 46 g/s: (a) H / d 0 = 10, We a = 45; (b) H / d 0 = 20, We a = 28; and (c) H / d 0 = 10, We a = 5.
Energies 15 03360 g017
Figure 18. (a) Schematic of a typical JICF breakup process [15], and (b) definition of the column breakup point.
Energies 15 03360 g018
Figure 19. Relationship between τ and breakup point when H / d 0 = 20.
Energies 15 03360 g019
Figure 20. Comparison between the measured and predicted SMDs at three types of mechanisms.
Energies 15 03360 g020
Table 1. Test parameter values.
ParameterCrossflow (Air)Fuel (Liquid)
ρ (kg/ m 3 ) 1.211006
σ ( N / m ) -7.28 × 10 2
μ  ( kg / m · s )1.85 × 10 5 8.90 × 10 4
P (atm)1
T ( ) 20
V  ( m / s )27–805–15
Re1100–27002800–5700
We6–55180–720
MFR3–192
ALR (air/liquid ratio)20–51
Publisher’s Note: MDPI stays neutral with regard to jurisdictional claims in published maps and institutional affiliations.

