Abstract
For many applications, the possibility of controlling heat flow by “thermal switching” can be very beneficial. In previous work, we presented a novel approach for thermal switching using a water-loaded adsorbent as part of the evaporator of a heat pipe. The basic idea is that the adsorbent releases water upon exceeding a certain evaporator temperature and thus “activates” the heat pipe by providing the working fluid for thermal transport. In this work, we present an improved version of the heat switch. We found that an ordinary copper heat pipe (i.e., thermosyphon) with outer diameters common in heat pipe applications (10 mm) can be used as a base of the heat switch. The reversibility of the switching effect was proven. The location of heat input relative to the adsorbent position was optimized, leading to improved switching ratios of up to 36 as calculated from thermal resistance change between evaporator and condenser. Furthermore, the role of the insulation on thermal resistance and switching ratio was examined and found to be significant.
1. Introduction
For many applications, the possibility of controlling heat flow by “thermal switching” can be very beneficial. It would enable the user to set a desired thermal resistance for a heat-conducting object or switch between a heat-conducting “on-state” and a heat-blocking “off-state”. Such a heat switch can have great potential in thermal management in a wide variety of applications to improve efficiency and reduce costs, for example, in systems related to energy storage and transport. In addition, effective thermal switching is a necessary prerequisite to enable efficient caloric heat pumps with sufficient cooling power [1]. As detailed, for example, in a recent review article by Wehmeyer et al. [2], numerous concepts exist for such thermal switches.
The basic characteristic of a thermal switch is the achieved on/off ratio or switching ratio (where and are the thermal conductance in the on- and off-state, respectively). The achieved switching ratios can vary over a wide range from 1.1 to over 500. If the device works in the sense of a thermal diode rather than a thermal switch, the rectification (where and are the thermal conductances in forward and reverse direction, respectively) is the characteristic property. Instead of the mentioned thermal conductances , often (and also in this work) the thermal resistances as a ratio of temperature gradient and heat flux along the heat switch are used:
In this case, the switching ratio is
with and as thermal resistance in the heat-conducting “on-state” and heat-blocking “off-state” of the switch, respectively.
A special subgroup of heat switches is thermal switches and diodes based on heat pipes (HPs). The simplest concept is a thermosyphon, in which gravity provides the asymmetry [3]. A heat pipe with an asymmetric shape is one method to realize a thermal diode that does not necessarily depend on gravity. Different thermal diode concepts were proposed in the literature [2,3]. One example is the liquid trap diode proposed by Groll et al. [4]. This diode has an asymmetric shape with a liquid trap appended on one end of a traditional heat pipe. With this design, large rectifications of circa 300 in combination with a high forward-mode conductance of 13.8 W/K are possible. Another approach is to create a jumping droplet thermal diode. In the forward mode, the vapor evaporated from the hot superhydrophilic surface condenses on the cold superhydrophobic surface, and the liquid is efficiently returned to the hot side by droplet jumping or surface tension forces. In the reverse mode, this mechanism of liquid return is blocked. The concept was realized by different research groups, yielding rectifications between 2 and 150 depending on experimental conditions [2,5,6]. For thermal switches, different concepts are used. One widely studied concept is the variable conductance heat pipe (VCHP). Here, a volume of non-condensable gas (NCG) blocks the condenser at low evaporation temperatures, effectively suppressing the recondensation of the fluid. At higher temperatures, the NCG volume is compressed such that the effective area for condensation is increased, with positive effects on the heat pipe’s thermal conductance. Altogether, upon exceeding a certain evaporator temperature threshold, the conductance increases very abruptly, effectively leading to switch ratios of circa 200 [2,6]. Finally, one can combine a heat pipe with a temperature-dependent solid-solid contact to design a thermal switch. [7].
In summary, it can be stated that numerous different concepts can be used to realize a heat switch. However, many of these concepts exhibit drawbacks. For example, the solid-solid contact-based switches tend to be bulky and complex, consist of several moving parts, have a thermal resistance that is too high in the conducting state of the switch or an active element such as an electrical power source is necessary to switch between the conducting and non-conducting state. The heat pipe diode-based concepts were shown to achieve high rectifications; however, it is difficult to exchange the forward and reverse directions of the heat flow, which is necessary to enable a heat switch action effectively. Heat switches were achieved with VCHPs; however, the VCHP performs worse than a standard HP due to the effect of the NCGs. This is particularly evident as soon as the HPs exhibit an adverse-gravity orientation, even for small inclination angles [8].
In previous work [9], we presented a novel approach for thermal switching using a water-loaded adsorbent integrated into a heat pipe, or more exactly, a thermosyphon (Figure 1). The adsorbent releases significant amounts of water by desorption as soon as a certain temperature threshold is exceeded, and the released water can subsequently serve as the working fluid in the heat pipe for latent heat transport. This, in turn, enables a significant reduction in the heat pipe´s thermal resistance as soon as a certain temperature threshold or switching temperature TS is exceeded. This approach to enable a heat switch is passive (for example, it does not require external forces such as mechanical force or electricity), has no moving parts, does not require NCGs, can be miniaturized and is very cost efficient.
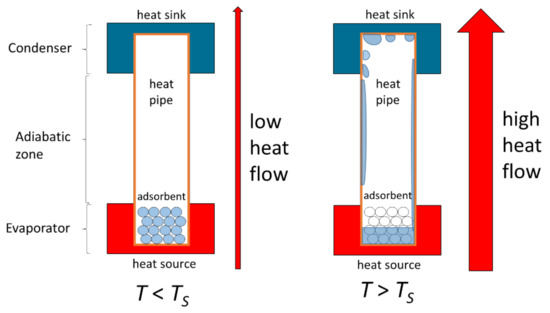
Figure 1.
Basic concept of thermal heat switch. Below the activation temperature or switching temperature , the working fluid is in an adsorbed state and the heat pipe exhibits a high thermal resistance (“off-state”). Above , the working fluid is released by desorption. Latent heat transport is enabled, significantly lowering the thermal resistance of the heat pipe (“on-state”) [9].
Compared to the state of the art as given in reference [9], current work contains several essential improvements to the methodology, experimental setup and theory:
- Numerical model and insulation: In this work, a numerical model is presented and validated to take into account the effects of insulation and parasitic heat currents on the environment. These effects are shown to have a large impact on the obtained switching ratio;
- Wetting behavior: The wetting behavior of the working fluid in the pipe-based heat switch plays an important role and is characterized using an array of thermocouples arranged along the longitudinal axis of the demonstrator and the model mentioned above;
- Adsorbent position vs. heat source size and position: The adsorbent position relative to heat source size and position is examined and optimized. Moreover, a special double heater configuration with variable heat power ratios is used in one of the demonstrators;
- Switching factor: Applying improvements 1 to 3 is shown to enable a greatly improved switching ratio of up to 36;
- Proper amount of sorbent: In this work, two amounts of sorbent are tested and both proven to be suitable for operation (with a slight difference in transition sharpness between conducting and non-conducting states);
- Hysteretic behavior: It is examined if the heat switch exhibits hysteretic behavior, i.e., a thermal resistance that is significantly different when ramping up and ramping down heat powers or, in the worst case, might perhaps not switch off again when heat powers are reduced, and sorbent temperatures fall below . This would be a disadvantage for many practical applications;
- Container material: In this work, a simple heat pipe made of copper with a cylindrical shape and a diameter of 10 mm is used. This represents a non-fragile, bendable and inexpensive container body for a heat switch.
2. Materials and Methods
2.1. Basic Idea and Preparation of Sorbent Material
The basic idea behind using a sorbent to realize a heat switch was already elaborated in our previous work [9] and shall be briefly repeated here.
The amount of adsorptive, e.g., water, bound per mass adsorbent mass is referred to as the loading x of the adsorbent. The loading depends on the adsorbent’s temperature T and the pressure p of the working medium in the gas phase, and x = f(T, p). For the intended application, the adsorbent must release the bound water as abruptly as possible when a specified temperature is reached. This condition is satisfied if the material exhibits so-called type IV and V isotherms [10] that exhibit a sharp change in the adsorbed amount of water in a narrow vapor pressure range. One adsorption material fulfilling these requirements and therefore used in our experiments is a titano-silico-alumino-phosphate (TAPSO-34) from Clariant Produkte GmbH (Germany) (see Figure 2). The basic concept of the heat pipe-based thermal switch is that the activation is governed (i) by the temperature of the evaporator, which contains the loaded adsorbent and (ii) by the temperature and resulting vapor pressure in the condenser, where the condensation of the working fluid takes place.
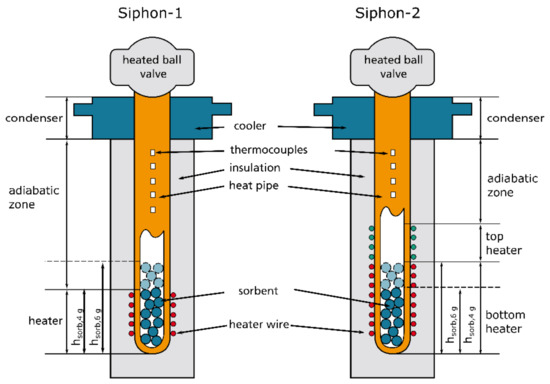
Figure 2.
Heat pipe (i.e., thermosyphon) demonstrators Siphon-1 and Siphon-2.
For preparing the absorbent and saturating it with defined amounts of the working medium water, a similar procedure as in our previous work was used [9]. The adsorbent was first evacuated in a vacuum oven (Memmert, VO400) at 200 °C and absolute pressure of 1 kPa for 3 h to desorb any undesirable substances. Afterward, approximately 50 mL of the material was stored at 20 °C and a relative humidity of 43% for one week to set a defined water loading. The relative humidity was adjusted by a saturated solution of potassium carbonate [11]. A sample container with a volume of approximately 50 mL was filled with granular TAPSO-34 and placed in a bigger sample vessel that contained the salt solution at the bottom. The sample container is equipped with a small fan to provide air circulation through the packed bed and accelerate the humidification process. The whole set-up was placed in an air-conditioned laboratory at a temperature of 20 °C. Altogether, the procedure resulted in a water loading of 24.1%, which was determined by a magnetic suspension balance (Rubotherm, IsoSORP [9]).
2.2. Demonstrator
The setup of the demonstrators used in the experiments is shown in Figure 2. Two different demonstrators were used, Siphon-1 and Siphon-2. We note that these demonstrators are actually thermosyphons but will be called heat pipes in this work for the sake of simplicity. The purpose of using two different demonstrators was to examine the influence of heater length with respect to the height of the sorbent column. Furthermore, the switching ratios obtained with Siphon-1 were not satisfactory (as will be shown below in Section 3), and thus Siphon-2 can be considered a functionally improved version of Siphon-1. The properties of these demonstrators are summarized in Table 1.

Table 1.
Properties of demonstrators Siphon-1 (single heater configuration) and Siphon-2 (double heater configuration). Some of the given variables are used in the equations in the following text.
Siphon-1 had a single heater. The length of the heater was such that the top edge corresponded to the height of a sorbent column with a weight of 4 g.
Siphon-2 had two heaters with separate power supplies, allowing to set the heating power independently. The bottom heater had a length that exceeded the height of the sorbent column for a weight of 4 g ( and 6 g . In the area of the top heater, no sorbent was present. The purpose of this heater was solely to serve as an evaporator for the working fluid.
Both demonstrators were made of an open-ended copper tube (alloy type CW024A, outer diameter of 10 mm, inner diameter of 8 mm and total length of 1 m) by pinching off the ends. All heaters were made of a Constantan (Cu-Ni44) heating wire with a diameter of 0.2 mm. Prior to winding the wire around the heat pipe, thin Kapton tape from CMC Klebetechnik (thickness of 50 µm, thermal conductivity of 0.46 W/mK) was wrapped around the heat pipe as an electrically insulating bottom layer. The heating wires were connected to adjustable electrical power supplies. Cooling at the condenser was accomplished by a water cooling block with a length of 12 cm into which the heat pipe was fully inserted (i.e., the condenser length was also 12 cm). The cooling block consisted of a cuboid box with a water inlet and outlet and no separate cooling channels, i.e., the cooling water flowed directly around the heat pipe. Cooling water with a temperature of 21 °C was provided by a circulating cooler “Unichiller 007 Olé” from Huber. The heater and adiabatic zone were insulated by a tubular insulation sleeve made of HT/Armaflex, an elastomer foam provided by Armacell Enterprises [12]. The insulation had a nominal thermal conductivity of 0.042 W/mK at 40 °C and an insulation thickness of 35 mm. The temperature along the demonstrator was measured by calibrated fine wire thermocouples arranged along the axis of the heat switch. The thermocouples were obtained from TC Mess- und Regeltechnik GmbH and were attached to the heat pipe wall using Kapton tape. The temperature was recorded in dependence of time with data loggers from Graphtec and a sampling interval of 200 ms. All obtained thermal data were processed with MATLAB scripts.
Prior to the experiments, the used sorbent TAPSO-34 was prepared as described in Section 2.1 and filled into an air-tight container. At the site of the experiment, the sorbent was taken out of the container and immediately filled into the demonstrator. Then, the demonstrator was evacuated for ca. 15 min via a turbopump connected by the ball valve shown in Figure 2. During the evacuation sequence, the adsorbent was kept at a temperature below 0 °C to avoid water desorption and subsequent removal from the system by the vacuum pump system. After the evacuation was finished, the ball valve was closed. During the experiments with the heat pipe, the valve was heated to a temperature of 55 °C in order to avoid water deposition in the valve. For Siphon-2, prior to each experimental session, the ball valve was opened for ca. 1 s to extract non-condensable gases that potentially accumulated in the demonstrator between subsequent experimental sessions. Experiments with Siphon-1 were carried out for sorbent fillings corresponding to saturated sorbent weights of 4 g, 5 g and 6 g. The absolute amounts of water contained in the sorbent can be calculated from the sorbent’s loading of 24.1%.
2.3. Determination of Measured Thermal Resistance
The measured thermal resistance of the heat switch system is given as . It is determined by taking the temperature difference between the temperature at the condenser and the temperature where the heat input is “centered” (see below), divided by the total electrical heat power . In the actual experiments, was determined from the electrical resistance of the heater wire and the applied heater voltage .
If two heaters are used, consists of the combined heat power of bottom heater and top heater , i.e., .
For the determination of the “center of heat input” where is taken, we consider that in our experiment, the heat is applied to the heat switch by wire heaters with lengths as given in Table 1. If only one heater is present, the center of heat input is simply in the middle of the heater. For two heaters, the center of the heat input has a more complicated expression.
with and as length of the bottom and top heater as given in Table 1 and assuming that the heat flux is applied uniformly along the length of each heater. When increasing relative to , the center of the heat input shifts upward, i.e., toward the condenser.
The center of heat input varies with heat power and typically does not coincide with the thermocouple positions indicated in Table 1. Therefore, a continuous temperature distribution was generated from the discrete temperatures measured at the thermocouple positions by a spline interpolation (details see below). From , can be extracted for each axial position .
2.4. Calculation of Ideal Thermal Resistance without Parasitic Thermal Losses
In the off-state, an ideal heat pipe-based heat switch will only conduct heat from the hot to the cold side directly along the heat pipe´s cylindric wall. However, in reality, there are considerable heat losses to the surrounding environment even when the heat pipe is thermally insulated. These losses are important since they reduce the thermal resistance in the off-state and thus reduce the switching ratio. Therefore, in this section, a one-dimensional stationary model is presented for analyzing the heat flows in the thermal switch. It is possible, using the model, to predict the thermal resistance and switching ratio for different types of insulation with different thermal conductivities and dimensions, and for the case that “perfect” insulation is present, which entirely prevents heat losses to the environment.
The parameters in the following list are used for the models described below, and some of them are illustrated in Figure 3:
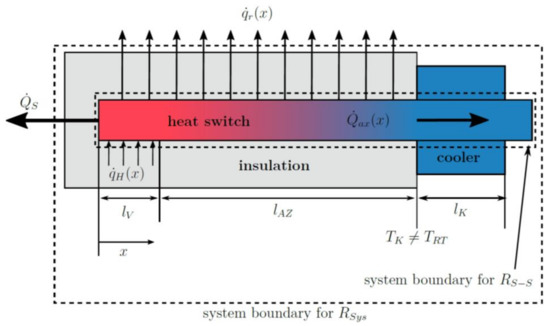
Figure 3.
Illustration of heat fluxes and other relevant parameters in the heat switch used for modeling the ideal thermal resistance (i.e., without parasitic thermal losses). The respective system boundaries for and are also given.
- as parasitic radial heat flux from the heat switch through the insulation to the environment at coordinate x;
- as parasitic heat flux from the bottom of the evaporator to the environment;
- as heat flux input by the heaters at coordinate x in evaporator zone;
- as total axial heat flux along the thermal switch;
- as total length of the evaporator, i.e., heater;
- as length of the adiabatic zone;
- as length of the condenser with attached cooler;
- as cooler and condenser temperature;
- as ambient room temperature;
- as radius of the insulated heat pipe;
- as heat transfer coefficient of natural convection;
- as outer radius of the heat pipe without insulation;
- as thermal conductivity of the insulation (obtained indirectly by fit, see Appendix A.1).
The total axial heat flow along the thermal switch is given by the total heat flux from the heaters minus the total parasitic heat flux to the environment :
has a piecewise definition corresponding to the two heaters:
As described in the equations below, the parasitic heat flux consists of (i) the axial heat flux from the bottom of the evaporator zone and (ii) the radial heat flux by heat conduction over the insulation material and natural convection at the outer side of the insulation, depending on the axial temperature distribution along the heat switch. The relevant thermal resistances are as thermal resistance of the bottom of the evaporator zone to the environment and as thermal resistance in radial direction to the environment. It consists of the thermal resistance given by the insulation (direct heat conduction) and the thermal resistance by natural convection at the outer boundaries of the insulation . Numerical values for and were determined by a fitting procedure as described in Appendix A.1.
If only the axial heat flux was inserted into Equation (1), the resulting thermal resistance would represent the thermal resistance that was determined only considering the axial flux, i.e., without parasitic heat fluxes. This effectively corresponds to the thermal resistance of a hypothetic ideal heat switch without thermal losses to the environment.
The relevant heat fluxes depend on the location on the heat switch. For a numerical determination of , the thermal switch was discretized into small segments (in this work, n = 10,000) with the same length, individual temperature differences and axial heat fluxes calculated as given in Equation (5). This corresponds to small partial discrete thermal resistances in series. Adding these up yields the total thermal resistance :
Using the equations given above, the following procedure is applied to calculate :
- 8.
- Apply a certain heat power and measure the temperatures along the thermal switch at the locations given in Table 1.
- 9.
- From the measured temperatures, obtain a continuous temperature distribution by a modified Akima spline interpolation [13] (also called “Makima splines”) using MATLAB.
- 10.
- Discretize to obtain discrete values for .
- 11.
- Insert for in Equation (7) to obtain and calculate from Equation (6).
- 12.
- Insert and into Equation (5) and discretize the obtained axial heat flux to obtain discrete values for .
- 13.
- Input the obtained and into Equation (11) and add up all discrete thermal resistances to yield the total thermal resistance .
3. Results and Discussion
3.1. General Experimental Procedure
The experimental procedure used to obtain the results below was the same for all experiments in this work. In consecutive steps and in ascending order, different heat powers were applied and held for 90 min each (ramp-up phase). Afterward, the same heat powers were applied in descending order (ramp-down phase) to check if the heat switch returns to the off-state again and to check if there is a hysteresis between the ramp-up and ramp-down phases. The heat powers were chosen such that the heat switch was in the off-state for the first two heat powers and in the on-state for the last two heat powers. During the whole experiment, the temperatures measured by the thermocouples were recorded continuously. This resulted in plots of temperatures vs. time (for example, Figure 3). The temperatures measured by the thermocouples were averaged over the last 60 s at the end of each heat power step and then used to calculate the measured thermal resistance, including thermal losses as given in Equation (3) and the idealized thermal resistance without thermal losses as obtained by the procedure given in Section 2.4. The switching ratio was calculated based on both and in the off-state (i.e., at the first heat power in the ramp-up phase and the last heat power in the ramp-down phase) and in the on-state (i.e., at the last heat power in the ramp-up-phase and first heat power in the ramp-down phase). The error bars in the respective plots are based on the uncertainties calculated as described in Appendix A.2.
3.2. Results for Demonstrator Siphon-1
The obtained experimental data on Siphon-1 for a sorbent weight of 4 g are shown in Figure 4. We noted that during the ramp down of the heat powers, the temperatures were not exactly constant but showed a slight drift that was very likely caused by the presence of non-condensable gases (NCGs) that accumulated over time in the system.
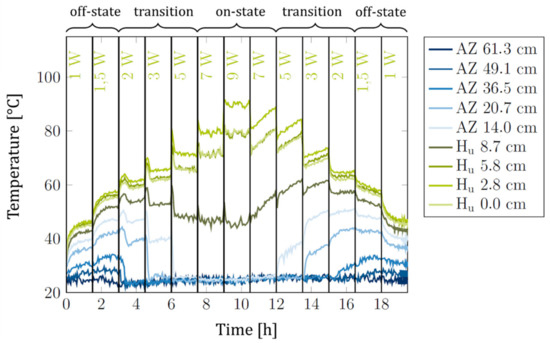
Figure 4.
Siphon-1 with 4 g of sorbent: Temperatures measured along the heat switch versus time. Blue lines: Temperatures in adiabatic zone (AZ). Green lines: Temperatures in heater area (Hu). The legend indicates the thermocouple positions along the heat switch, going down from the upmost thermocouple near the condenser to the downmost thermocouple at the evaporator bottom at 0.0 cm. The respective heat power is indicated below the upper x-axis. Each heat power was held for 90 min. At the top, the regime of operation is indicated (the regimes of operation are explained below).
For Figure 5, the thermal resistances and were calculated from the data in Figure 4 and plotted versus the average sorbent temperature , which corresponded to the average temperature of all thermocouples in the heater area (green lines in Figure 4). Clearly, the heat switch effect was reversible: The heat switch first switched from the off-state to the on-state during heat power ramp-up and also switched back to the off-state during heat power ramp-down. A certain degree of hysteresis (difference in thermal resistance between ramp-up and ramp-down phases) was evident. Above = 60 °C, the thermal resistances dropped sharply due to the thermal switch transitioning from the off- to the on-state (see below). We note that this “switching” temperature corresponds very well to the switching temperature of 62 °C observed in our previous work with the same sorbent [9].

Figure 5.
Siphon-1 with 4 g of sorbent: Thermal resistances (orange lines) and (green lines) vs. average sorbent temperature . and are given for the ramp-up phase (full lines) and ramp-down phase (dashed lines) of the heat power.
Furthermore, as already mentioned in Section 2.4, there is a large difference between and in the off-state of the heat switch since the parasitic heat flux to the environment is large compared to the axial heat flux along the heat switch . The parasitic heat flux leads to a reduction of the thermal resistance in the off-state by a factor of ca. 4, even though the demonstrator is equipped with a thick insulation (Table 1). In the on-state, increases strongly, becomes less dominant and and are converging. Table 2 summarizes the results from Figure 5 and gives . It is evident that thermal losses to the environment are unfavorable since they reduce the thermal resistance in the off-state and thus reduce .
Table 2.
Thermal resistances and switching ratios, taken from Figure 5. For calculation, the average and from ramp-up and ramp-down phases were used.
From the experimental data shown, different operation regimes are evident (Figure 6). For a heat power of 1 and 1.5 W, all temperatures along the thermal switch are rising continuously. In this state, the working fluid is bound in the sorbent, and the switch is in the off-state (Figure 6a). From 2 to 5 W, the temperature differences in the adiabatic zone reduce drastically and approach the cooler temperature of 21 °C. The closer the thermocouples are to the cooled condenser, the earlier the temperature drop is observed. This can be clearly correlated to the behavior shown in Figure 6b. The heat switch is in the transition state and the length wetted with working fluid increases with heat power and sorbent temperature. As soon as a certain thermocouple is reached by the wetted area, latent heat transport takes place, and the measured temperature converges with the condenser temperature. At a heat power of 7 and 9 W, the heat switch is finally in the on-state, the majority of the heat switch is wetted and the thermal resistance reaches a plateau and remains more or less constant (Figure 6c).
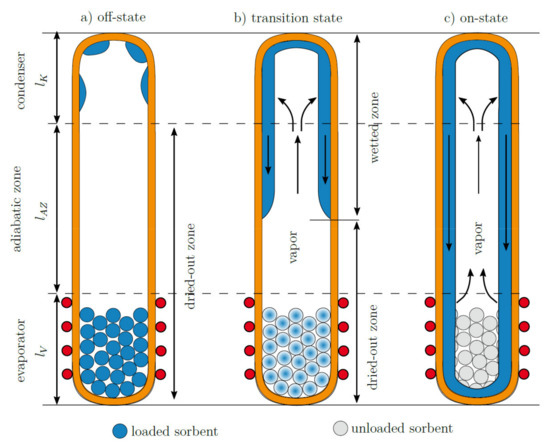
Figure 6.
Operating regimes of heat switch. (a) No water has yet desorbed from the sorbent and no latent heat transport is taking place (off-state). (b) Some water has desorbed from the sorbent and increasingly wets the adiabatic zone. In the wetted area, latent heat transport can take place. The thermal resistance is changing continuously in dependence of the length of the wetted zone (transition state). (c) The majority of the heat switch is wetted and can sustain latent heat transport (on-state).
The heat switch basically worked as intended; however, the switching ratio (Table 2) was low even when thermal losses to the environment were excluded (). In the off-state, corresponded to the thermal resistance of evacuated demonstrator Siphon-1 without working fluid or sorbent of 85 K/W (see Table A1 in Appendix A). This indicates that, as intended, no latent heat transport in the off-state takes place. The problem that reduces is that the thermal resistance in the on-state is relatively high. In order to investigate the reason for that, the same thermosiphon body (with a similar heater length of 13 cm) was filled with pure water instead of the sorbent, i.e., with a water amount of 0.8 g corresponding to the water amount that was bound in the same 4 g of sorbent that was used in the experiments. For the water-filled thermosiphon, a thermal resistance of 1.5 K/W resulted, which was significantly lower than that of the heat switch in the on-state.
Upon further investigation, it was found that the high thermal resistance of the heat switch is connected to the unusually large temperature gradient along the evaporator zone (Figure 4). The gradient was particularly expressed for the lower sections of the evaporator and was not present in the water-filled thermosiphon. The gradient indicates that the description of the operation regimes according to Figure 6 is too simple. In reality, the evaporator zone of the heat switch apparently remained dried out in the experiments, and thus no latent heat transport could take place directly from the heater. This was confirmed by finding a good agreement in the evaporator zone between (i) the axial temperature distribution of Siphon-1 and (ii) the calculated temperature distribution of the empty evacuated tube body of Siphon-1 (Figure 7, left).
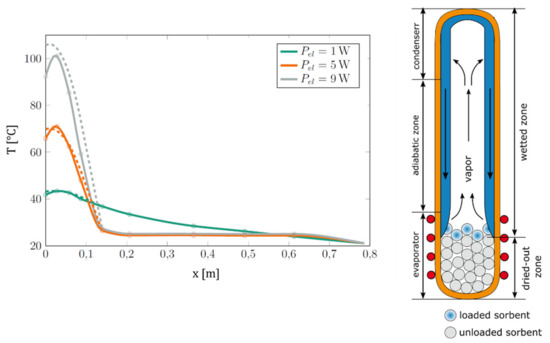
Figure 7.
Left: Measured temperature distribution of Siphon-1 (full lines) compared to the modeled temperature distribution of the empty evacuated tube body of Siphon-1 (dashed lines) for different heat powers. Model data were obtained as described in Appendix A.1. Right: Illustration of heater dryout in Siphon-1 in the on-state, explaining the observed high temperature gradient in the heater area and the high thermal resistance in the on-state.
We assume that the reason for the heater dryout is based on the relation of the sorbent column height to the heater height, as illustrated in Figure 7 (right). When fluid flows back from the condenser, it wets the uppermost layers of sorbent. Due to the latent heat transport, the uppermost sorbent layer equilibrates thermally with the condenser, its temperature drops, and it adsorbs water. Thus, the fluid is “taken away” by the sorbent and cannot reach the lower sections of the heater; the heater zone remains dried out and cannot participate in the latent heat transport. In contrast to this, the adiabatic zone is wetted, latent heat transport can take place, leading to a lower thermal resistance and low temperature gradient in the adiabatic zone (Figure 4).
This hypothesis was tested by increasing the sorbent amount to 5 and 6 g. Even though this should potentially increase the total amount of water available in the system, increase the wetted area in the heat switch and help to decrease the thermal resistance in the on-state, a decrease in thermal resistance was not observed. We conclude that the additional amount of sorbent was protruding into the wetted area, decreased in temperature and thus adsorbed water from the system instead of contributing it to the latent heat transport cycle.
3.3. Results for Demonstrator Siphon-2
Due to the problems with high thermal resistance in the on-state and resulting low switching factors, the demonstrator setup was improved, yielding Siphon-2. As described in Section 2.2 (Figure 2 and Table 1), a two-heater configuration was used, with the total heater length being significantly higher than for Siphon-1 and significantly higher than all possible sorbent filling heights. With this setup, the mentioned hypothesis of heater dryout observed in Siphon-1 was tested. Due to the heater being significantly longer than the sorbent column, the fluid coming back from the condenser should not be adsorbed by the sorbent and instead, wet the heater zone directly and improve latent heat transport from the heater, leading to lower thermal resistances in the on-state. This hypothesis could be proven by the experiments shown below. In the experiments, the two heaters were supplied with different ratios of heat powers, i.e., different ratios of heat power densities of 0, 1, 5 and 10. This was done to vary the effective location of the heat input, i.e., the “center of heat input”, which shifts upward when the ratio is increased. When ramping heat powers up and down in each experimental sequence, the heat power ratios were kept constant. Each power level was kept for 90 min.
The experimental data obtained for a heat power density ratio of 10 are shown in Figure 8. Compared to Figure 4, a distinctly smaller temperature gradient in the heater area in the on-state was evident even though the heater was longer and the used heat powers were higher.
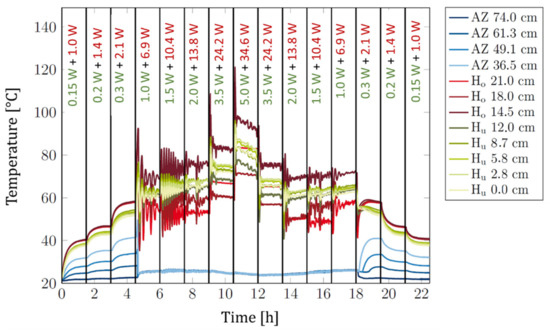
Figure 8.
Siphon-2 with 4 g of sorbent: Temperatures measured along the heat switch at different positions (as indicated in the legend) versus time for a constant heat power density ratio of 10. Blue lines: Temperatures in adiabatic zone (AZ). Red lines: Temperatures in top heater area (Ho). Green lines: Temperatures in bottom heater area (Hu). The used heat powers are indicated below the upper x-axis. Green number: Total heat power of bottom heater. Red number: Power of top heater. Each set of heat powers was held for 90 min.
We note that upon setting a new power level, a temperature spike followed by temperature oscillations is evident. These phenomena occur likely due to the center of heat input being above the sorbent. Due to the relatively large thermal resistance and small thermal mass of the thin heat pipe wall, there is a time delay until the applied heat reaches the sorbent below and a burst of water desorption occurs. As soon as this happens, the temperatures of the top and bottom heater drop sharply, simultaneously reducing the amount of water released until a new temperature peak has built up, and the next burst of water is released with a delay. After a few of these cycles, there is enough water available in the system to ensure a continuous operation and stable temperatures. The oscillations can very likely be prevented by a better thermal coupling of heater and sorbent zone and increasing thermal mass, e.g., by using a solid heated copper block instead of the used thin wire heaters.
The thermal resistances were calculated from the data of all tested heat power density ratios and summarized in Figure 9 for a sorbent weight of 4 g and 6 g. The obtained results for the two sorbent weights were similar, and the switching effect was evident in both cases. In comparison, 6 g of sorbent yielded a sharper transition between off- and on-state.
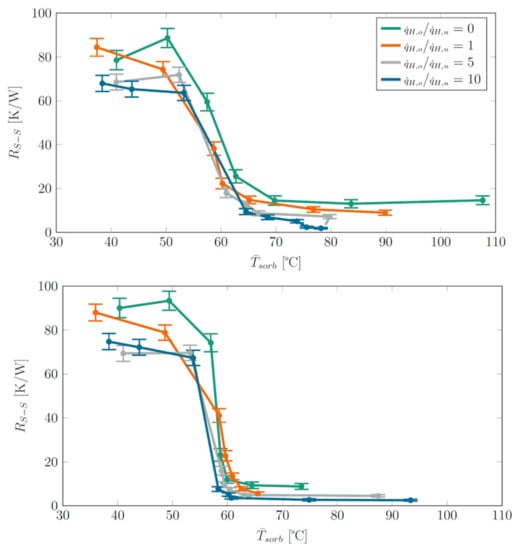
Figure 9.
Siphon-2 with sorbent weight of 4 g (top) and 6 g (bottom): Thermal resistance vs. average sorbent temperature for different heat power density rations . For visual clarity, only data for and from the ramp-up phase of heat powers are shown.
With increasing ratio , the center of the heat input moved more and more away from the sorbent column and the thermal resistances in the on-state decreased. This is a clear indication that latent heat transport only took place above the sorbent column and that it is favorable for the operation of the heat switch if the heat input is centered as far as possible above the sorbent column. The lowest thermal resistance of 1.9 K/W was achieved for the highest ratio of 10. We note that this value is very similar to the thermal resistance of 1.5 K/W of the mentioned thermosiphon filled only with water, particularly when the different evaporator lengths are taken into account (Siphon 2: effectively 9 cm, water-filled thermosiphon: 13 cm). Besides a drop of in the on-state, was also lower in the off-state for increasing ratios . This is because, in the off-state, no latent heat transport took place and therefore, the thermal resistance over the heat pipe wall governed . As the center of heat input moved upward with increasing ratio, the distance of the center of heat input to the condenser decreased, and thus the thermal resistance over the heat pipe wall decreased.
Just as in Siphon-1, the thermal resistance dropped sharply due to the thermal switch transitioning from the off- to the on-state at around = 60 °C. We note that this switching temperature corresponds very well to the switching temperature of 62 °C observed in our previous work with the same sorbent [9].
Figure 10 represents a “hysteresis plot”. It shows of selected heat power ratios for both heat power ramp-up (full lines) and ramp-down (dashed lines). Data for a sorbent weight of 4 g, Siphon-2 and for selected heat power density rations of 0, 1 and 10 are given. Clearly and for all heat power density ratios, the switching effect is reversible and works both ways, i.e., when going from low to high power and temperature and in reverse direction. The heat power density ratios that yielded the lowest and highest values of during heat power ramp-up also yielded the lowest and highest values during ramp-down. For the same heat power ratio (same color in the plot), there was a slight difference between obtained in ramp-up and ramp-down phases at the same temperature. In most cases, is higher during ramp-down. We suspect that NCGs that accumulated in the demonstrator during the experimental sequence were responsible for the difference in .
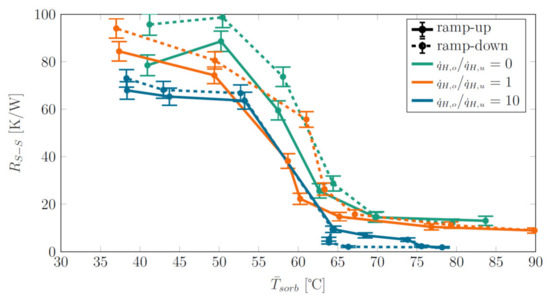
Figure 10.
“Hysteresis plot”: Thermal resistance vs. average sorbent temperature for both heat power ramp-up (full lines) and ramp-down (dashed lines). Data are given for selected heat power density rations as obtained from Siphon-2 with a sorbent weight of 4 g.
The resulting switching ratios for (modeled ideal thermal resistance without parasitic heat losses to the environment, see Figure 9) and (directly measured thermal resistance) are given in Figure 11. For each heat power ratio, was calculated from and in the off-state and on-state using data from both ramp-up and ramp-down phases. The off-state was defined by the first and last three power levels in the ramp-up and ramp-down phases, respectively (see also Figure 8), and the on-state was defined by the remaining power levels.
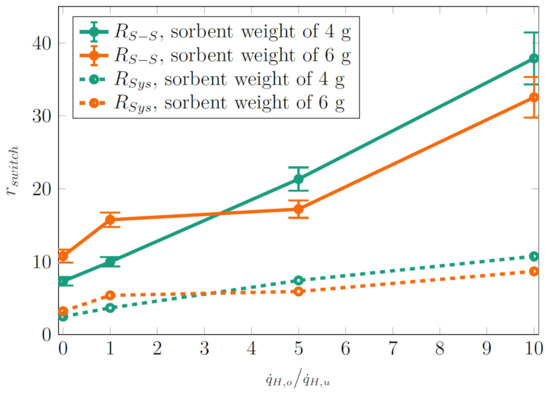
Figure 11.
Switching ratio calculated from (Figure 9) and for different heat power ratios and sorbent weights.
As can be seen from Figure 9 and explained above (fluid coming back from the condenser is not retaken by the sorbent and instead wets the heater zone directly), higher ratios resulted in a significantly lower thermal resistance in the on-state. At the same time, the thermal resistance in the off-state remained high. Altogether, higher resulted in higher switching ratios. No systematic difference was found when comparing the switching ratios for sorbent weights of 4 and 6 g. The highest obtained switching ratio was 36 for and 10 for , which is a clear improvement to the thermal resistances obtained for demonstrator Siphon-1 (Table 1).
3.4. Outlook: Improvements of Thermal Switch
During the investigations, several starting points for improvements were found. One of these is the reduction of thermal resistance in the on-state. As can be seen from Figure 8, the temperature drop between the evaporator and adiabatic zone is very large compared to the temperature drop between the adiabatic zone and condenser. Thus, it can be concluded that the total thermal resistance (here, ) is clearly dominated by the thermal resistance of the evaporator . We now consider the heat transfer coefficient of the evaporator that is given by , the heater/evaporator area and assuming that fluid evaporation mainly takes place in the top heater. Altogether:
Inserting the lowest obtained thermal resistance of 1.9 K/W from Siphon-2 into Equation (12) results in = 186 W/m2K. This heat transfer coefficient is significantly lower than heat transfer coefficients of up to 10,000 W/m2K reported for evaporation in conventional heat pipes [3]. Apparently, there are further contributions to the evaporation thermal resistance that reduce . We suspect that the thermal coupling of the wire heater to the outer wall of the heat pipe is not optimal and causes a large additional thermal resistance. The windings of the heater were spaced relatively far apart in the experiments, and the heater wire had a circular cross-section, leading to small point contacts with the heat pipe wall. We assume that increasing heater winding density and using thermal paste to improve thermal contact should improve , leading to lower thermal resistances in the on-state and thus higher switching ratios.
Furthermore, the thermal resistance in the off-state can be increased by replacing the container material copper with metals with lower thermal conductivity, such as steel.
For applications where the evaporator is not always below the condenser, it is important to ensure that the heat switch also works independently of gravity. For this, the sorbent must be integrated into a heat pipe with an integrated wick structure for gravity-independent return of the condensed fluid to the evaporator.
Furthermore, new sorbent types can be considered to yield defined switching temperatures that are adapted to the individual requirements of the technical application to be addressed (i.e., battery systems, fuel cells, etc.) or to yield even more sharply defined switching temperatures.
Finally, an active thermal switch can be realized by reserving a dedicated “sorbent heater” and then thermally separating the sorbent column with the sorbent heater from the rest of the system. In this case, the sorbent heater can be used to desorb water from the sorbent independently from the rest of the system, which would make it possible to set the amount of water in the system and switch latent heat transport on and off at will.
4. Conclusions
In this work, we presented improved demonstrators for thermal switching using a water-loaded adsorbent in the evaporator of a heat pipe (thermosyphon). From the obtained results, we conclude that:
- The basic working principle of a sorbent-based heat switch can be adapted to a heat pipe (thermosyphon) made of copper with outer diameters that are common in heat pipe applications (in this work, 10 mm);
- 4 g or 6 g of sorbent loaded with 24.1% of water is a suitable amount for the operation of the heat switch;
- The switching effect is reversible. The heat switch switches from the off- to the on-state if heat powers are ramped up and switches back from the on- to the off-state if heat powers are ramped down afterward;
- A comparison between thermal resistances for different insulations is made, i.e., between (i) , obtained from actual measurements and (ii) , obtained from a numerical model that “simulates” a perfect thermal insulation of the heat switch against parasitic heat fluxes into the environment. A large difference between these thermal resistances became evident, particularly in the off-state of the heat switch. This leads to a strong dependence of the obtained thermal switching ratios on the insulation of the heat switch. For a better insulation, higher can be expected;
- For an efficient operation of the heat switch with high , it is very important to input the heat primarily above the sorbent column rather than directly at the sorbent column. This was concluded from experiments with different heater lengths and centers of heat inputs that were varied using a stacked two-heater configuration and different ratios of heat powers for the top and bottom heater. Inputting heat directly at the sorbent column led to a dryout of the evaporator, high thermal resistance in the on-state and, consequently, a low switching ratio. If the heat was input mainly by the top heater, i.e., above the sorbent column, the switching ratio could be increased to up to 36 for and 10 for . This is a clear improvement from the switching ratios obtained in our previous work.
We were also able to identify several possible improvements to the heat switch:
- Optimizing the heater should lead to a lower thermal resistance in the on-state, and choosing a heat pipe container material with lower thermal conductivity should lead to a higher thermal resistance in the off-state. Thus, the switching ratio can be increased;
- Gravity-independent operation can be realized by using a heat pipe with an integrated wick structure;
- Optionally, an active thermal switch can be realized by providing a dedicated “sorbent heater” and then thermally separating the sorbent column plus sorbent heater from the rest of the system.
5. Patents
The concept of realizing a thermal switch based on an adsorption material in a heat pipe was filed for patent (reference EP20180665.0).
Author Contributions
Conceptualization, J.S., M.W., C.T. and K.B.; methodology, J.S., C.T., A.P. and M.W.; investigation, J.S., M.W., P.C., A.P. and C.T.; writing—original draft preparation, M.W., J.S. and C.T.; writing—review and editing, K.B., O.S.-W. and S.P.; visualization, J.S., M.W. and C.T.; supervision, K.B., O.S.-W. and S.P.; project administration, M.W.; funding acquisition, M.W. and K.B. All authors have read and agreed to the published version of the manuscript.
Funding
This research was funded by the Fraunhofer Cluster of Excellence Programmable Materials.
Institutional Review Board Statement
Not applicable.
Informed Consent Statement
Not applicable.
Data Availability Statement
All data presented and discussed in this study are represented in the figures shown in this work, and thus is publicly available.
Conflicts of Interest
The authors declare no conflict of interest.
Appendix A
Appendix A.1. Obtaining the Necessary Thermal Resistances for Calculating
For the procedure given in Section 2.4 to obtain , numerical values for the mentioned thermal resistances and are needed. The problem is that has a strong dependence on the individual shape of the bottom of the evaporator zone, i.e., the bottom of the used heat pipe. In the experiment, the heat pipe (i.e., a thermosyphon) was home made by a copper tube with mechanically pinched-off ends and irregular shape. Furthermore, the insulation material consists of tubular sleeves of elastomer foam with a sponge-like structure. For mounting the insulation sleeves, they have to be slightly compressed to get a tight fit to the heat pipe and it is not guaranteed that the thermal conductivity then still corresponds to the nominal value given by the data sheet. Additionally, it is be helpful to know the axial thermal resistance of the “bare” evacuated heat pipe tube without integrated sorbent in order to compare it to the thermal resistance of the switch in the “off-state”. depends on and as length of the heater and adiabatic zone, = 2.83 × 10⁻⁵ m2 (see also Table 1) as cross section area of the heat pipe wall and as thermal conductivity of the heat pipe copper wall:
Concerning , it has to be taken into account that the container material of the heat pipe is the copper alloy CW024A, also called Cu-DHP. For this alloy, a wide range of thermal conductivities (ca. 290–360 W/mK according to data sheet [14]) is possible, depending on exact alloy composition and pre-treatment, and the exact value of and consequently is not known. Thus, for obtaining all mentioned thermal resistances in a reliable manner a model with data fit as described below was developed.
It can be shown that the system can be modeled by the differential Equation (A2) [15]. The equation corresponds to the one-dimensional stationary inhomogeneous heat equation with as heat flux density of the heater flowing into the thermal switch over the evaporator length :
The general solution to Equation (A2) has a piecewise definition for the area with heater and the area without heater .
with . The coefficients can be determined by assuming boundary conditions (A4) and matching conditions (A5).
For the bottom of the evaporator zone, the following equation and boundary condition applies:
Altogether, the given boundary and transition conditions can be written in a compact matrix form:
The given equation system is solved using MATLAB, yielding the coefficients . Inserting these into Equation (A2) yields an expression for .
Afterward, from Equation (A2) was fitted to actual experimental data obtained from the empty evacuated tube body of Siphon-1 with , and as fitting parameters and the Matlab function “fminunc”, which uses an algorithm based on Newton´s method. The fit was achieved by minimizing the error between the temperatures given by the model and the experimentally obtained temperatures , divided by the electrical heat power for normalization:
The values for were obtained from the empty evacuated tube body of the single heater demonstrator Siphon-1, a condenser temperature of 21 °C and heat powers of 1 W, 2 W, 3 W and 4 W. The resulting temperatures were in a range which is similar to the temperature range of the actual heat switches in this work. Table A1 shows the results obtained with the fitting procedure in comparison with nominal expected values calculated from parameters given e.g., in data sheets and Table 1. A good agreement is evident. For , due to the irregular shape of the bottom of the evaporator zone no nominal value could be calculated.
Table A1.
Thermal resistances , , obtained by fitting compared to nominal expected values.
Table A1.
Thermal resistances , , obtained by fitting compared to nominal expected values.
| Thermal Resistance | Value Obtained by Fit | Expected Values |
|---|---|---|
| 84.7 K/W | 84.9 K/W 1 | |
| 10.6 K/W | 10.9 2–13.1 3 K/W 4 | |
| 88.4 K/W | - |
1 Calculated with Equation (A1) with = 305 W/mK [14]; 2 Calculated with Equation (8) with = 0.05 W/mK at 82 °C [12]; 3 Calculated with Equation (8) with = 0.04 W/mK at 30 °C [12]; 4 Calculated with Equation (8) assuming = 3 W/m2K; Further necessary parameters for calculation in Equations (8) and (A1) were taken from Table 1.
Appendix A.2. Determination of Measurement Uncertainty for , and
Several measured properties (temperatures, heat powers etc.) have a measurement uncertainty as shown in Table A2. The thermocouple positions and electrical resistance of the heater wire are assumed to stay constant between different measurements, while the temperatures measured by the thermocouples and the heater voltages are assumed to vary between different measurements.
Table A2.
Uncertainties taken into account for determining the uncertainties on and .
Table A2.
Uncertainties taken into account for determining the uncertainties on and .
| Property | Symbol | Value of Uncertainty |
|---|---|---|
| Temperatures measured by thermocouples | 0.33 K (Siphon-1, type K) 1 0.11 K (Siphon-2, type T) 1 | |
| Thermocouple positions | 3 mm | |
| Electrical resistance of heater wire | 0.01 Ohms | |
| Heater voltages | 0.2% |
1 Uncertainties on the temperature measurement were taken from the calibration data of the respective thermocouple type (standard deviation of actual temperatures taken by the thermoelements vs. reference temperatures). The calibration was carried out by the suppliers TC Regeltechnik and Dostmann electronic.
Appendix A.2.1. Measurement Uncertainty on
The uncertainty on is simply given by Gaussian error propagation applied to Equation (3) and the mentioned uncertainties from Table A2:
Appendix A.2.2. Measurement Uncertainty on
For , the determination of uncertainty is more complicated. Here, a Monte Carlo method is used to propagate uncertainties through the models presented in Appendix A.1 and Section 2.4 with the following steps:
- A random parameter distribution is generated for the parameters given in Table A2 with a variation width corresponding to the uncertainties as given in the table. It is assumed that the given uncertainties are uncorrelated and normally distributed.
- A fit according to Equation (A8) is carried out to data resulting from each parameter distribution, yielding different values for , , for each distribution.
- For the parameters that change between measurements in Table A2, a new random distribution is generated.
- Using all generated parameters, is determined according to Equation (11) and the model procedure given in Section 2.4.
These steps are repeated 1000 times with one different parameter distribution each. This yields 1000 different values for , , and . With these, an uncertainty for can be given (Equation (A10)). The uncertainty corresponds to an average scattering of the around the mean value of obtained with all random parameter distributions. We note that this uncertainty is only valid for an evacuated heat pipe tube without fluid and sorbent.
To determine the uncertainty on for actual heat switch with sorbent, we define an auxiliary parameter that relates and :
The uncertainty on is determined by propagating the uncertainty on from Equation (A9) and on as determined by the mentioned Monte Carlo method and Equation (A10) into in Equation (A11). Then, using , the uncertainty of is given by Gaussian error propagation applied to Equation (A11):
Appendix A.2.3. Measurement Uncertainty on
The uncertainty on is given by Gaussian error propagation applied to Equation (2), where and are the uncertainties on the thermal resistance in the off- and on-state, respectively.
Appendix A.3. Note on Switching Temperature as Described in Section 2.1
We note that the assumption that the vapor pressure in the heat pipe is determined by the condenser temperature (Section 2.1) is a simplification that holds as long as the thermal resistance for fluid evaporation
is large compared to the thermal resistance for fluid condensation. This condition is fulfilled in the experimental setups used in this work. If is reduced, the vapor pressure in the heat pipe will also depend on the evaporator temperature to some extent.
References
- Blumenthal, P.; Raatz, A. Classification of electrocaloric cooling device types. EPL 2016, 115, 17004. [Google Scholar] [CrossRef]
- Wehmeyer, G.; Yabuki, T.; Monachon, C.; Wu, J.; Dames, C. Thermal diodes, regulators, and switches: Physical mechanisms and potential applications. Appl. Phys. Rev. 2017, 4, 41304. [Google Scholar] [CrossRef] [Green Version]
- Reay, D.A.; Kew, P.A.; McGlen, R.J. Heat Pipes: Theory, Design and Applications, 6th ed.; Butterworth-Heineman: Oxford, UK, 2013. [Google Scholar]
- Groll, M.; Munzel, W.D.; Supper, W.; Savage, C.J. Development of a Liquid-Trap Heat Pipe Thermal Diode. J. Spacecr. Rocket. 1979, 16, 195–202. [Google Scholar] [CrossRef]
- Boreyko, J.B.; Zhao, Y.; Chen, C.-H. Planar jumping-drop thermal diodes. Appl. Phys. Lett. 2011, 99, 234105. [Google Scholar] [CrossRef] [Green Version]
- Tsukamoto, T.; Hirayanagi, T.; Tanaka, S. Micro thermal diode with glass thermal insulation structure embedded in a vapor chamber. J. Micromech. Microeng. 2017, 27, 45001. [Google Scholar] [CrossRef]
- Benafan, O.; Notardonato, W.U.; Meneghelli, B.J.; Vaidyanathan, R. Design and development of a shape memory alloy activated heat pipe-based thermal switch. Smart Mater. Struct. 2013, 22, 105017. [Google Scholar] [CrossRef]
- Leriche, M.; Harmand, S.; Lippert, M.; Desmet, B. An experimental and analytical study of a variable conductance heat pipe: Application to vehicle thermal management. Appl. Therm. Eng. 2012, 38, 48–57. [Google Scholar] [CrossRef]
- Winkler, M.; Teicht, C.; Corhan, P.; Polyzoidis, A.; Bartholomé, K.; Schäfer-Welsen, O.; Pappert, S. Thermal Switch Based on an Adsorption Material in a Heat Pipe. Energies 2021, 14, 5130. [Google Scholar] [CrossRef]
- Thommes, M.; Kaneko, K.; Neimark, A.V.; Olivier, J.P.; Rodriguez-Reinoso, F.; Rouquerol, J.; Sing, K.S.W. Physisorption of gases, with special reference to the evaluation of surface area and pore size distribution (IUPAC Technical Report). Pure Appl. Chem. 2015, 87, 1051–1069. [Google Scholar] [CrossRef] [Green Version]
- Greenspan, L. Humidity fixed points of binary saturated aqueous solutions. J. Res. Natl. Bur. Stan. Sect. A 1977, 81A, 89. [Google Scholar] [CrossRef]
- Armacell Enterprise GmbH & Co. KG. Technical Data-HT/Armaflex. Available online: https://local.armacell.com/en/armacell-germany/products/htarmaflex/ (accessed on 8 February 2022).
- Akima, H. A new method of interpolation and smooth curve fitting based on local procedures. J. ACM 1970, 17, 589–602. [Google Scholar] [CrossRef]
- Deutsches Kupferinstitut Berufsverband e.V. Werkstoff-Datenblatt Cu-DHP. Available online: https://www.kupferinstitut.de/mediathek/datenblaetter/ (accessed on 7 February 2022).
- Schipper, J. Charakterisierung und Modellierung Passiver Heatpipe-Basierter Wärmeschalter. Master’s Thesis, Technische Universität Braunschweig, Institut für Thermodynamik, Braunschweig, Germany, 2022. [Google Scholar]
Publisher’s Note: MDPI stays neutral with regard to jurisdictional claims in published maps and institutional affiliations. |
© 2022 by the authors. Licensee MDPI, Basel, Switzerland. This article is an open access article distributed under the terms and conditions of the Creative Commons Attribution (CC BY) license (https://creativecommons.org/licenses/by/4.0/).