Article

Simulation of China’s Carbon Emission based on Influencing Factors

1
School of Economics and Management, Nanjing University of Science & Technology, Nanjing 210094, China
2
School of Business, Jiangsu Vocational College of Electronics and Information, Huai’an 223001, China
3
School of Business, Jiangsu Open University, Nanjing 210000, China
4
School of Management Science and Engineering, Nanjing University of Information Science & Technology, Nanjing 210044, China
5
Office of Financial Affairs, Hu’nan Moderen Logistics College, Changsha 410131, China
*
Authors to whom correspondence should be addressed.
Energies 2022, 15(9), 3272; https://doi.org/10.3390/en15093272
Submission received: 14 April 2022 / Revised: 26 April 2022 / Accepted: 27 April 2022 / Published: 29 April 2022

Abstract

:
China is one of the world’s largest energy consumers and carbon emitters, and the situation of carbon emission reduction is serious. This paper forecasts the future trend of China’s carbon emissions by constructing a system dynamics model of China’s carbon emissions. The results show that China cannot fulfill its commitment to peak its carbon emissions in 2030 as scheduled. Secondly, the Logarithmic Mean Divisia Index model (LMDI) was used to analyze the influencing factors of China’s carbon emissions. The contribution rates of the five factors to China’s carbon emissions are as follows: economic development (226.30%), technological innovation (−105.92%), industrial structure (−26.55%), population scale (11.44%) and energy structure (−5.28%). Finally, this paper formulates five carbon emission reduction paths according to the size and direction of various factors that affect China’s carbon emissions. The paths of carbon emission reduction were simulated by using the system dynamics model of China’s carbon emissions. It is found that technological innovation is the key pathway for China to realize its commitment to carbon emission reduction. Slowing economic growth will delay the arrival time of peak carbon emissions and increase the intensity of carbon emissions. Optimizing the industrial structure, reducing the population scale and adjusting the energy structure can reduce the peak and carbon emissions in China, but the effect is small.

Graphical Abstract

1. Introduction and Research Status

Since China’s reform and opening up in 1978, China’s economic and social development has made remarkable progress. China faces the problem of air pollution caused by its high consumption of fossil energy and is presently one of the world’s largest energy consumers and carbon dioxide emitters. Massive energy consumption and environmental pollution have become the biggest obstacles to economic development [1,2]. In recent years, the Chinese government has vigorously developed a low-carbon economy, promoted the low-carbon development of the regional economy and actively participated in international cooperation in carbon emission reduction. At the 2009 Copenhagen climate conference, the Chinese government promised to reduce China’s carbon dioxide emission intensity to 40–45% by 2020 compared with 2005 [3]. Under the framework of the Paris Agreement in 2015, the Chinese government made another commitment to reduce China’s carbon dioxide emission intensity to 60–65% by 2030 compared with 2005, reach the peak of carbon dioxide emissions, and strive to reach the peak ahead of time [4]. China is facing great pressure to reduce carbon emissions, and relevant carbon emission reduction work is imminent. How to realize the commitment to reduce carbon emissions has become the issue of most concern to the government. System dynamics (SD) is an engineering technology research model closely associated with system science and computer technology. This model describes system variables from qualitative and quantitative aspects and carries out system simulation. The analysis results can focus on the system structure and grasp the system’s development trend [5,6]. A system dynamics model is closely related to a scenario analysis model. By setting the parameters of relevant factors, various development paths are designed to simulate future development scenarios [7] to provide references and suggestions for policy making. Therefore, system dynamics models have been gradually introduced to the study of carbon emission paths [8,9].
Firstly, system dynamics models have been applied to the study of regional carbon emissions. Taking Malaysian cities as an example, Fong et al. used a system dynamics model to predict the future carbon dioxide emission trend under the influence of various urban policies to provide guidance for Malaysian urban planning [10]. Mirzaei et al. used a system dynamics model to model Iran’s energy consumption and carbon dioxide emission trend from 2000 to 2025. This paper analyzes the impact of different energy consumption factors on Iran’s carbon emissions [11]. Liu D. et al. constructed an extended STIRPAT model and combined it with a system dynamics model to analyze China’s carbon emissions, peak carbon emission and Environmental Kuznets Curve. The results show an obvious inverted U-shaped curve between China’s per capita GDP and carbon dioxide emissions. Secondly, system dynamics models have been applied to the study of industrial carbon emissions. Taking Beijing industry in China as the research object, Lei W. et al. constructed a system dynamics model of industrial carbon emissions in Beijing based on four subsystems: economy, population, environment and energy. Through this model, the industrial carbon emissions of Beijing under different policy backgrounds were simulated, and suggestions for carbon emission reduction were put forward [12]. Kim et al. constructed a carbon emission system dynamics model of the iron and steel industry based on energy, materials and process flow. By introducing six different carbon dioxide reduction technologies, the impact of technological progress on carbon emission reduction in the iron and steel industry was analyzed [13]. In addition, some scholars have carried out corresponding research on road traffic [14], residents’ lives [15], industrial structure [16], carbon emission trading policy [17] and other topics by using models of system dynamics. These research results have important guiding significance for formulating a carbon emission reduction path.
By combing the existing literature, it is found that more and more scholars have carried out extensive research on carbon emissions by using system dynamics models and achieved fruitful results. It provides great reference value and theoretical guidance for this research. However, it is found that the existing research results are worthy of further research on parameter settings. When formulating the carbon emission reduction path, the existing research results lack a basis for setting parameters, which are only based on theoretical analysis. Therefore, based on a constructed system dynamics model of carbon emissions, this study uses the Logarithmic Mean Divisia Index model (LMDI) to analyze the influencing factors of carbon emissions. Based on the role and direction of various factors on carbon emissions, the model in this paper quickly and accurately determines the optimal carbon emission path, providing a reference for the Chinese government to fulfill its carbon emission reduction commitments on schedule.

2. Research Model and Data Processing

2.1. Carbon Emission Calculation

Before constructing a system dynamics model of China’s carbon emissions, we must first calculate China’s carbon emissions. Referring to the general model of IPCC (2006) guidelines, this paper calculates the amount of carbon dioxide generated during the combustion of fossil energy. The formula is as follows [18]:
C ij = E ij × F j
where I represents the i-th industry, I = 1, 2, …6; J represents the j-th energy, j = 1, 2, …8; C represents carbon emissions; E represents energy consumption; and F represents energy carbon emission coefficient.

2.2. System Dynamics Model

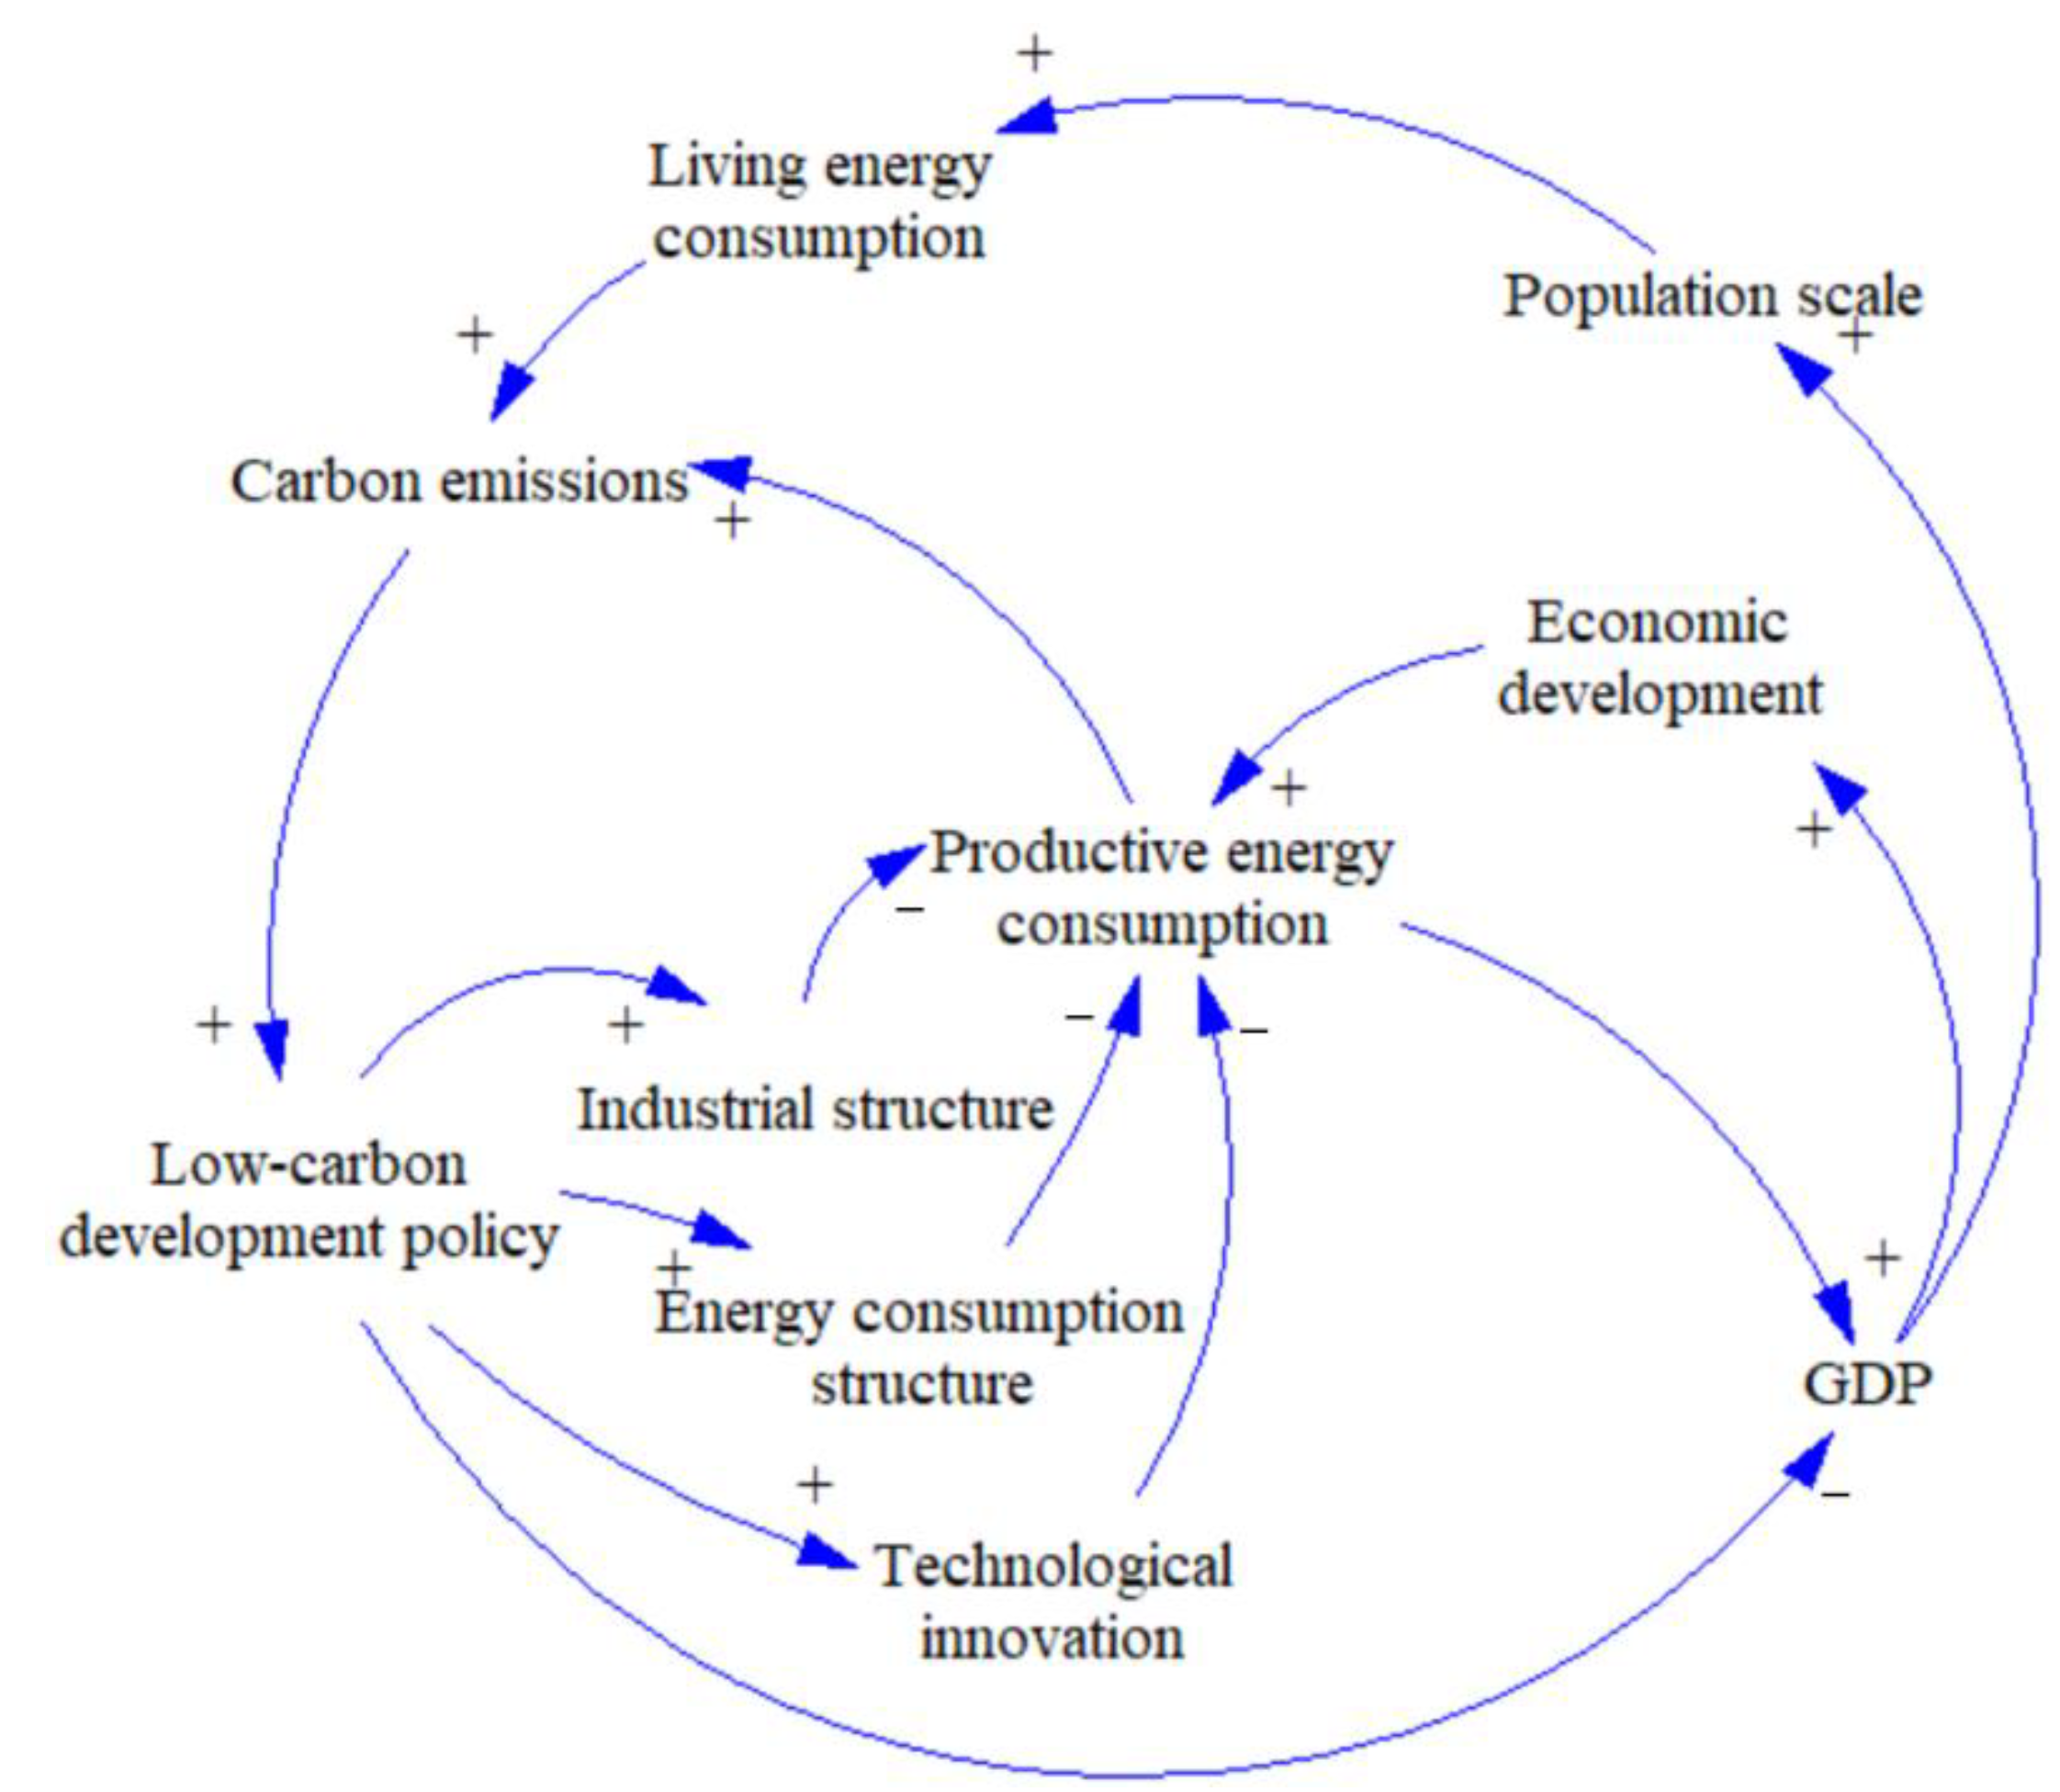
2.2.1. Causality Diagram

A causality diagram of system dynamics can clearly describe the interaction between China’s carbon emission system variables and determine the system boundary [19,20]. According to the action mechanism of carbon emission influencing factors, a causality diagram of China’s carbon emission SD model was constructed, as shown in Figure 1. The causality of the model mainly includes: (1) carbon emissions → (+) low-carbon development policy → (+) industrial structure → (−) productive energy consumption → (+) carbon emissions; (2) carbon emissions → (+) low-carbon development policy → (+) energy consumption structure → (−) productive energy consumption → (+) carbon emissions; (3) carbon emissions → (+) low-carbon development policy → (+) technological innovation → (−) productive energy consumption → (+) carbon emissions; (4) carbon emissions → (+) low-carbon development policy → (−) GDP → (+) economic development → (+) productive energy consumption → (+) carbon emissions; (5) carbon emissions → (+) low-carbon development policy → (−) GDP → (+) population scale → (+) living energy consumption → (+) carbon emissions.

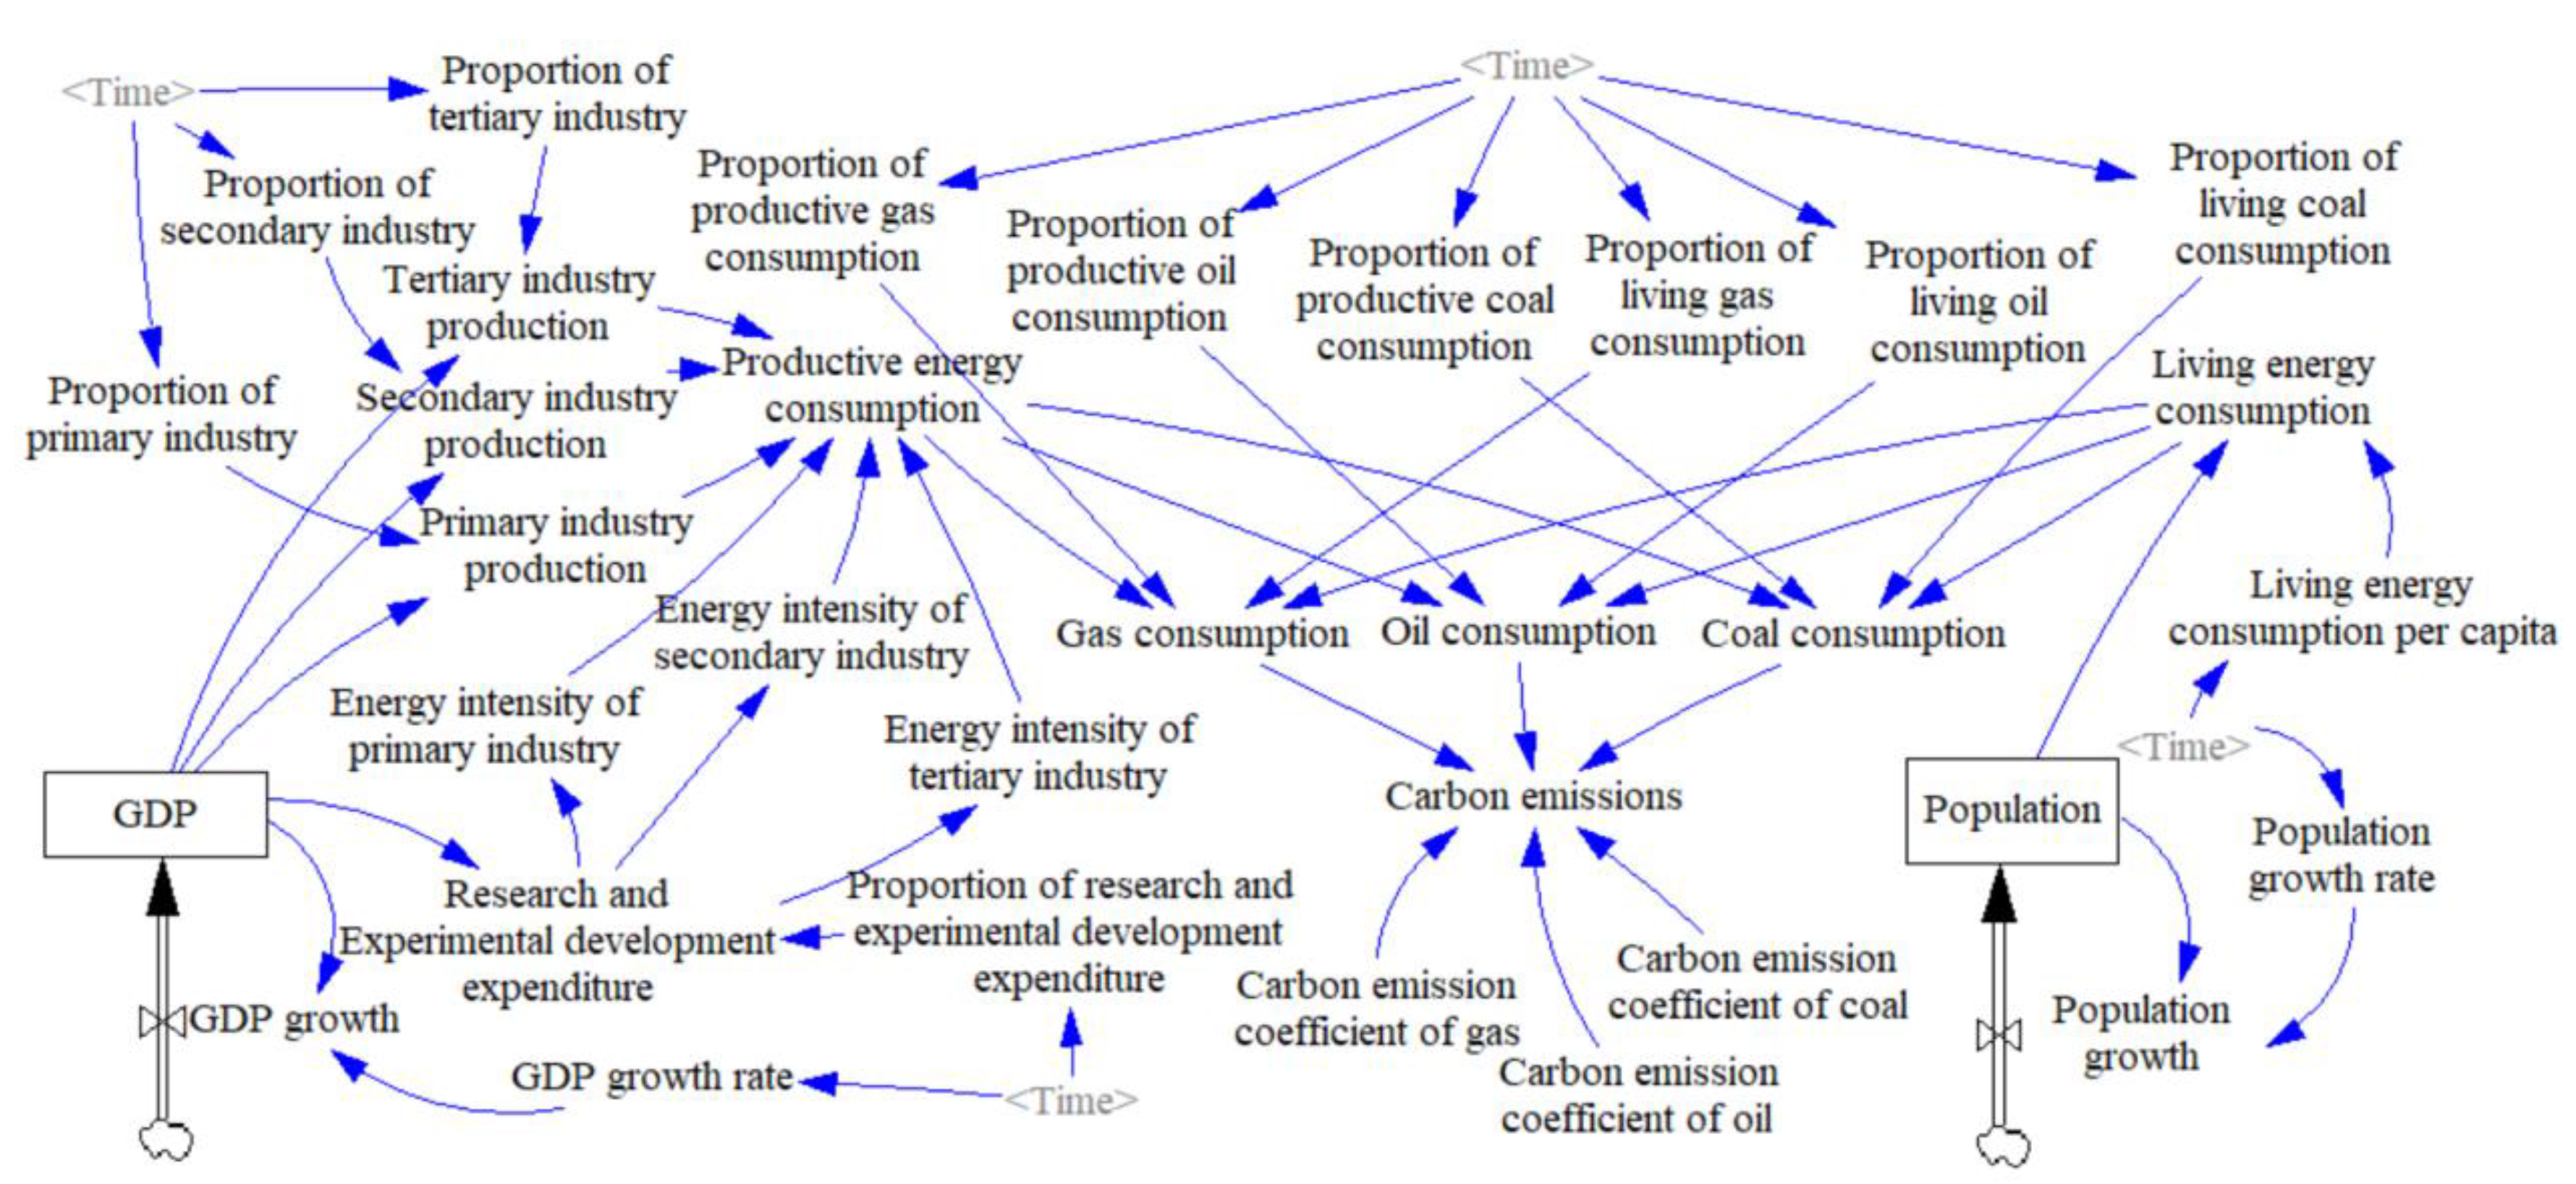
2.2.2. Stock-Flow Diagram

A causality diagram can intuitively show the causality in China’s carbon emission system. A stock-flow diagram further describes variables based on the causality diagram and determines the relationship between variables in a functional way. It can more intuitively reflect the logical relationship between elements of China’s carbon emissions and transform China’s complex carbon emission system into a measurable system dynamics model [21]. China’s carbon emission system is a complex system involving society, the economy and the environment. According to the causality diagram, this paper deeply analyzes the impact of the population, economy, industrial structure, energy structure and technology on carbon emissions. Relevant data were obtained from the China Statistical Yearbook and China Energy Statistical Yearbook. The model parameters were determined by using a table function model, linear regression model, empirical formula model, logical function and other models. The stock-flow diagram of China’s carbon emission system was established using Vensim-PLE software, and the results are shown in Figure 2. By constantly adjusting and modifying the system dynamics model of China’s carbon emissions, the simulation results are more in line with the current situation of China’s carbon emissions [22].

2.3. Formatting of Mathematical Components

Compared with other models, the Logarithmic Mean Divisia Index model (LMDI) does not produce redundant items, and the value 0 is allowed to exist. This model can overcome the problem of the residual term after factor decomposition by the Arithmetic Mean Index model (AMDI) [23,24]. Therefore, according to the current situation of China’s carbon emissions, based on the improved Kaya model, this paper uses LMDI to analyze the influencing factors of China’s carbon emissions [25]. The size and direction of the impact of various influencing factors on China’s carbon emissions are identified to provide a reference for exploring the parameter setting of China’s carbon emission reduction path [26].
Firstly, this paper selects the influencing factors applicable to China’s carbon emissions to expand the Kaya model further, as shown in Equation (2) [27]:
C = i = 1 6 j = 1 8 C ij E ij × E ij E i × E i G i × G i G × G P × P = i = 1 6 j = 1 8 n ij × m ij × q i × r i × g × p
where C represents carbon emissions; E represents energy consumption; G represents gross domestic product; P represents the population; i represents the i-th industry; and j represents the j-th energy. Carbon emissions are decomposed into six influencing factors: n_ij represents the carbon emission coefficient, m_ij represents the energy consumption structure, q_i represents technological innovation, r_i represents industrial structure, g represents the economic development level, and p represents the population scale.
Secondly, according to the extended Kaya model, the additive decomposition model in LMDI is used to establish the carbon emission factor decomposition equation [28]:
Δ C tot = C t C o = i = 1 6 j = 1 8 n ij × m ij × q i × r i × g × p t i = 1 6 j = 1 8 n ij × m ij × q i × r i × g × p o = Δ Cn ij + Δ Cm ij + Δ Cq i + Δ Cr i + Δ Cg + Δ Cp  
The decomposition formula of each influencing factor is as follows:
Δ Cn ij = i j C ij t C ij 0 lnC ij t lnC ij 0 × ln n ij t n ij 0
Δ Cm ij = i j C ij t C ij 0 lnC ij t lnC ij 0 × ln m ij t m ij 0
Δ Cq i = i j C ij t C ij 0 lnC ij t lnC ij 0 × ln q i t q i 0
Δ Cr i = i j C ij t C ij 0 lnC ij t lnC ij 0 × ln r i t r i 0
Δ Cg = i j C ij t C ij 0 lnC ij t lnC ij 0 × ln g t g 0
Δ Cp = i j C ij t C ij 0 lnC ij t lnC ij 0 × ln p t p 0
where C o and C t represent carbon emissions in the initial year and carbon emissions in the t-th year, respectively; Δ C tot represents the difference in carbon emissions in year t; Δ Cn ij represents the effect of the carbon emission coefficient. Since the carbon emission coefficient of energy is a constant value, C t is always 0; Δ Cm ij represents the effect of the energy consumption structure; Δ Cq i represents the technology effect; Δ Cr i represents the industrial structure effect; Δ Cg represents the effect of economic development; and Δ Cp represents the population effect. Excluding the influencing factors of a carbon emission coefficient of 0, Equation (3) can be simplified as:
Δ C tot = Δ Cn ij + Δ Cm ij + Δ Cq i + Δ Cr i + Δ Cg + Δ Cp

2.4. Data Processing

This paper studies the path of carbon emission reduction in China by using a system dynamics model and LMDI. From the introduction of the above models, it can be seen that the data needed to build the system dynamics model of China’s carbon emissions include: China’s energy consumption data from 1995 to 2019, output value of various industries and population. The data involved in this study are from direct calculations or indirect calculations from the China Energy Statistical Yearbook (1996–2020) [29] and China Energy Statistical Yearbook (1996–2020) [30]. According to data availability, this paper selects eight main energy consumption types for carbon emission research, namely, raw coal, coke, crude oil, gasoline, kerosene, diesel, fuel oil and gas. According to the statistical data of energy consumption of various industries in the China Energy Statistical Yearbook, this paper reports statistics on the energy consumption data of China’s agriculture, industry, construction, transportation, catering and six other industries. The reference coefficients of various energy types converted into standard coal come from the China Energy Statistical Yearbook. The carbon emission coefficients of different energy types were derived from the 2006 IPCC guidelines for national greenhouse gas inventories.

3. Results and Discussion

According to the system dynamics model of China’s carbon emissions, this paper forecasts the trend of China’s carbon emissions in the future and judges whether China can fulfill its carbon emission reduction commitments on time. Secondly, it discusses the direction and size of various factors on China’s carbon emissions to provide a reference for China’s carbon emission reduction path. Finally, according to the analysis results of influencing factors of China’s carbon emissions, the development path of China’s carbon emission reduction is formulated. The trend of China’s carbon emissions for each development path is discussed on the basis of data simulation.

3.1. China’s Carbon Emission Forecast Results

3.1.1. Validity Test

GDP, population, productive energy consumption, living energy consumption and carbon emissions were selected as test variables to test the system dynamics model of China’s carbon emissions [31]. The results are shown in Table 1. The relative error rates of the five indicators are within 10%. Therefore, the carbon emission description of the system dynamics model of China’s carbon emissions is consistent with the actual state. The peak value of China’s carbon emissions can be predicted by adjusting key parameters to simulate different scenarios.

3.1.2. Parameter Setting

This paper takes 2019 as the base period to forecast the trend of China’s carbon emissions in 2050 by setting the parameters of variables such as population growth rate, GDP growth rate, industrial structure, energy consumption structure and the proportion of research and development expenditure [32].
(1)
Setting population growth rate.
Based on population development planning documents issued by the Chinese government, China’s population growth rate was set from 2020 to 2050. The national population development plan (2016–2030) issued by the Chinese government mentioned that after the 14th Five-Year Plan, China’s population growth slowed down due to the reduction in the number of women of childbearing age and the aging of the population [33]. However, with the implementation of the “two child policy” and other fertility-encouraging policies, the birth rate will rise slightly. Therefore, the natural growth rate of China’s population will present an inverted U-shaped curve in the future. By 2030, a trend of balanced development of China’s population will take shape. The coordination between the population, economy, society, resources and environment has further improved. China’s population has reached a peak of about 1.45 billion. It also shows that the natural population growth rate may be negative in 2031. In addition, the United Nations Population Division predicts that China’s population will decrease to about 1.3 billion in 2050 [34]. The population of China in 2019 was 50 million less than that predicted for 2030. If the expected population development goal of the Chinese government is to be achieved, the average growth rate of China’s population from 2020 to 2030 needs to be about 0.36%. Therefore, this paper assumes that China’s population will peak in 2030, and the population growth rate will gradually decline to 0 from 2020 to 2029. China’s population will experience negative growth after 2030 and will drop to about 1.3 billion by 2050.
(2)
Setting GDP growth rate.
As the world’s largest developing country, China’s GDP growth rate has gradually declined since 2017. With the end of its GDP growth rate of more than 10%, China’s economic development has gradually entered a new stage. The Development Research Center of the Chinese government predicts that China’s economy will maintain an annual GDP growth rate of 4%–6% from 2020 to 2030 [35]; after 2030, an annual GDP growth rate of 1%–4% will be maintained, and the speed will gradually decline. In addition, the Chinese government and Goldman Sachs, a world-famous enterprise, predict that China’s total GDP will reach 400 trillion yuan in 2050 [36]. Therefore, this paper sets the average GDP growth rate of China in 2020–2025, 2026–2030, 2031–2035, 2036–2040, 2041–2045 and 2046–2050 as 5.5%, 4.5%, 4%, 3.5%, 3% and 2.5%.
(3)
Setting industrial structure.
The Research Report on China Industry issued by China’s Energy Research Institute and the United Nations Development Division points out that by 2050, the proportion of China’s secondary industry will be about 35–37% [37]. According to the development history of China’s industrial structure, the tertiary industry became the largest industry in China’s economy for the first time in 2014. The proportion of the tertiary industry exceeded 50% for the first time in 2015 and reached 59.4% in 2019. The tertiary industry has become the driving force of China’s economic growth. In the 14th Five-Year Plan, China pays attention to improving industrial innovation ability, accelerating the development of the modern service industry and continuously optimizing industrial structure [38]. Therefore, the proportion of the secondary industry will continue to show a downward trend. Many research results show that in the national industrial structure, the optimal proportion of the secondary industry is 35%, and the optimal proportion of the tertiary industry is 62%. According to the change data on China’s industrial structure, the proportion of China’s secondary industry decreased from 0.468 in 1995 to 0.392 in 2019, with an average annual decrease of 0.003. According to the decline rate, the proportion of China’s secondary industry will reach the ideal value of 35%, and the proportion of tertiary industry will reach the ideal value of 62% in 2033. From 2033 to 2050, China’s industrial structure will remain unchanged.
(4)
Setting energy consumption structure.
China’s energy consumption is predicted in World and China Energy Outlook 2050 released by the China Petroleum Economic and Technological Research Institute [39]. The results show that China’s proportion of coal consumption will drop to 17% in 2050; gas will rise to 15%; oil will remain at about 20%; non-fossil energy will account for about 50%. Therefore, this paper assumes that in the future, China’s energy structure will be adjusted from coal (65.19%), oil (28.63%) and gas (6.18%) in 2019 to coal (32.69%), oil (38.46%) and gas (28.85%).
(5)
Setting the proportion of research and development expenditure.
China’s Development and Reform Commission proposed that during the “14th five year plan” period, China’s research and development expenditure will exceed 2.4% of GDP, and China’s total research and development expenditure will reach 3758.2 billion yuan by 2025. In addition, the Ministry of Science and Technology of China mentioned at the press conference that “China will become an innovative country in 2020, enter the forefront of scientific and technologically innovative countries in 2035, and enter the world’s scientific and technological power in 2050” [40]. This shows that China’s investment in science and technology shows an upward trend of gradual increase. In 2019, the R&D funds of South Korea, Sweden, Japan, Austria, Germany and the United States accounted for 4.64%, 3.40%, 3.24%, 3.19% and 3.18% of GDP, respectively, all exceeding 3%. [41]. Therefore, this paper assumes that the proportion of China’s future research and development expenditure in GDP will increase at a constant rate from 2.24% in 2019 to 4% in 2050.

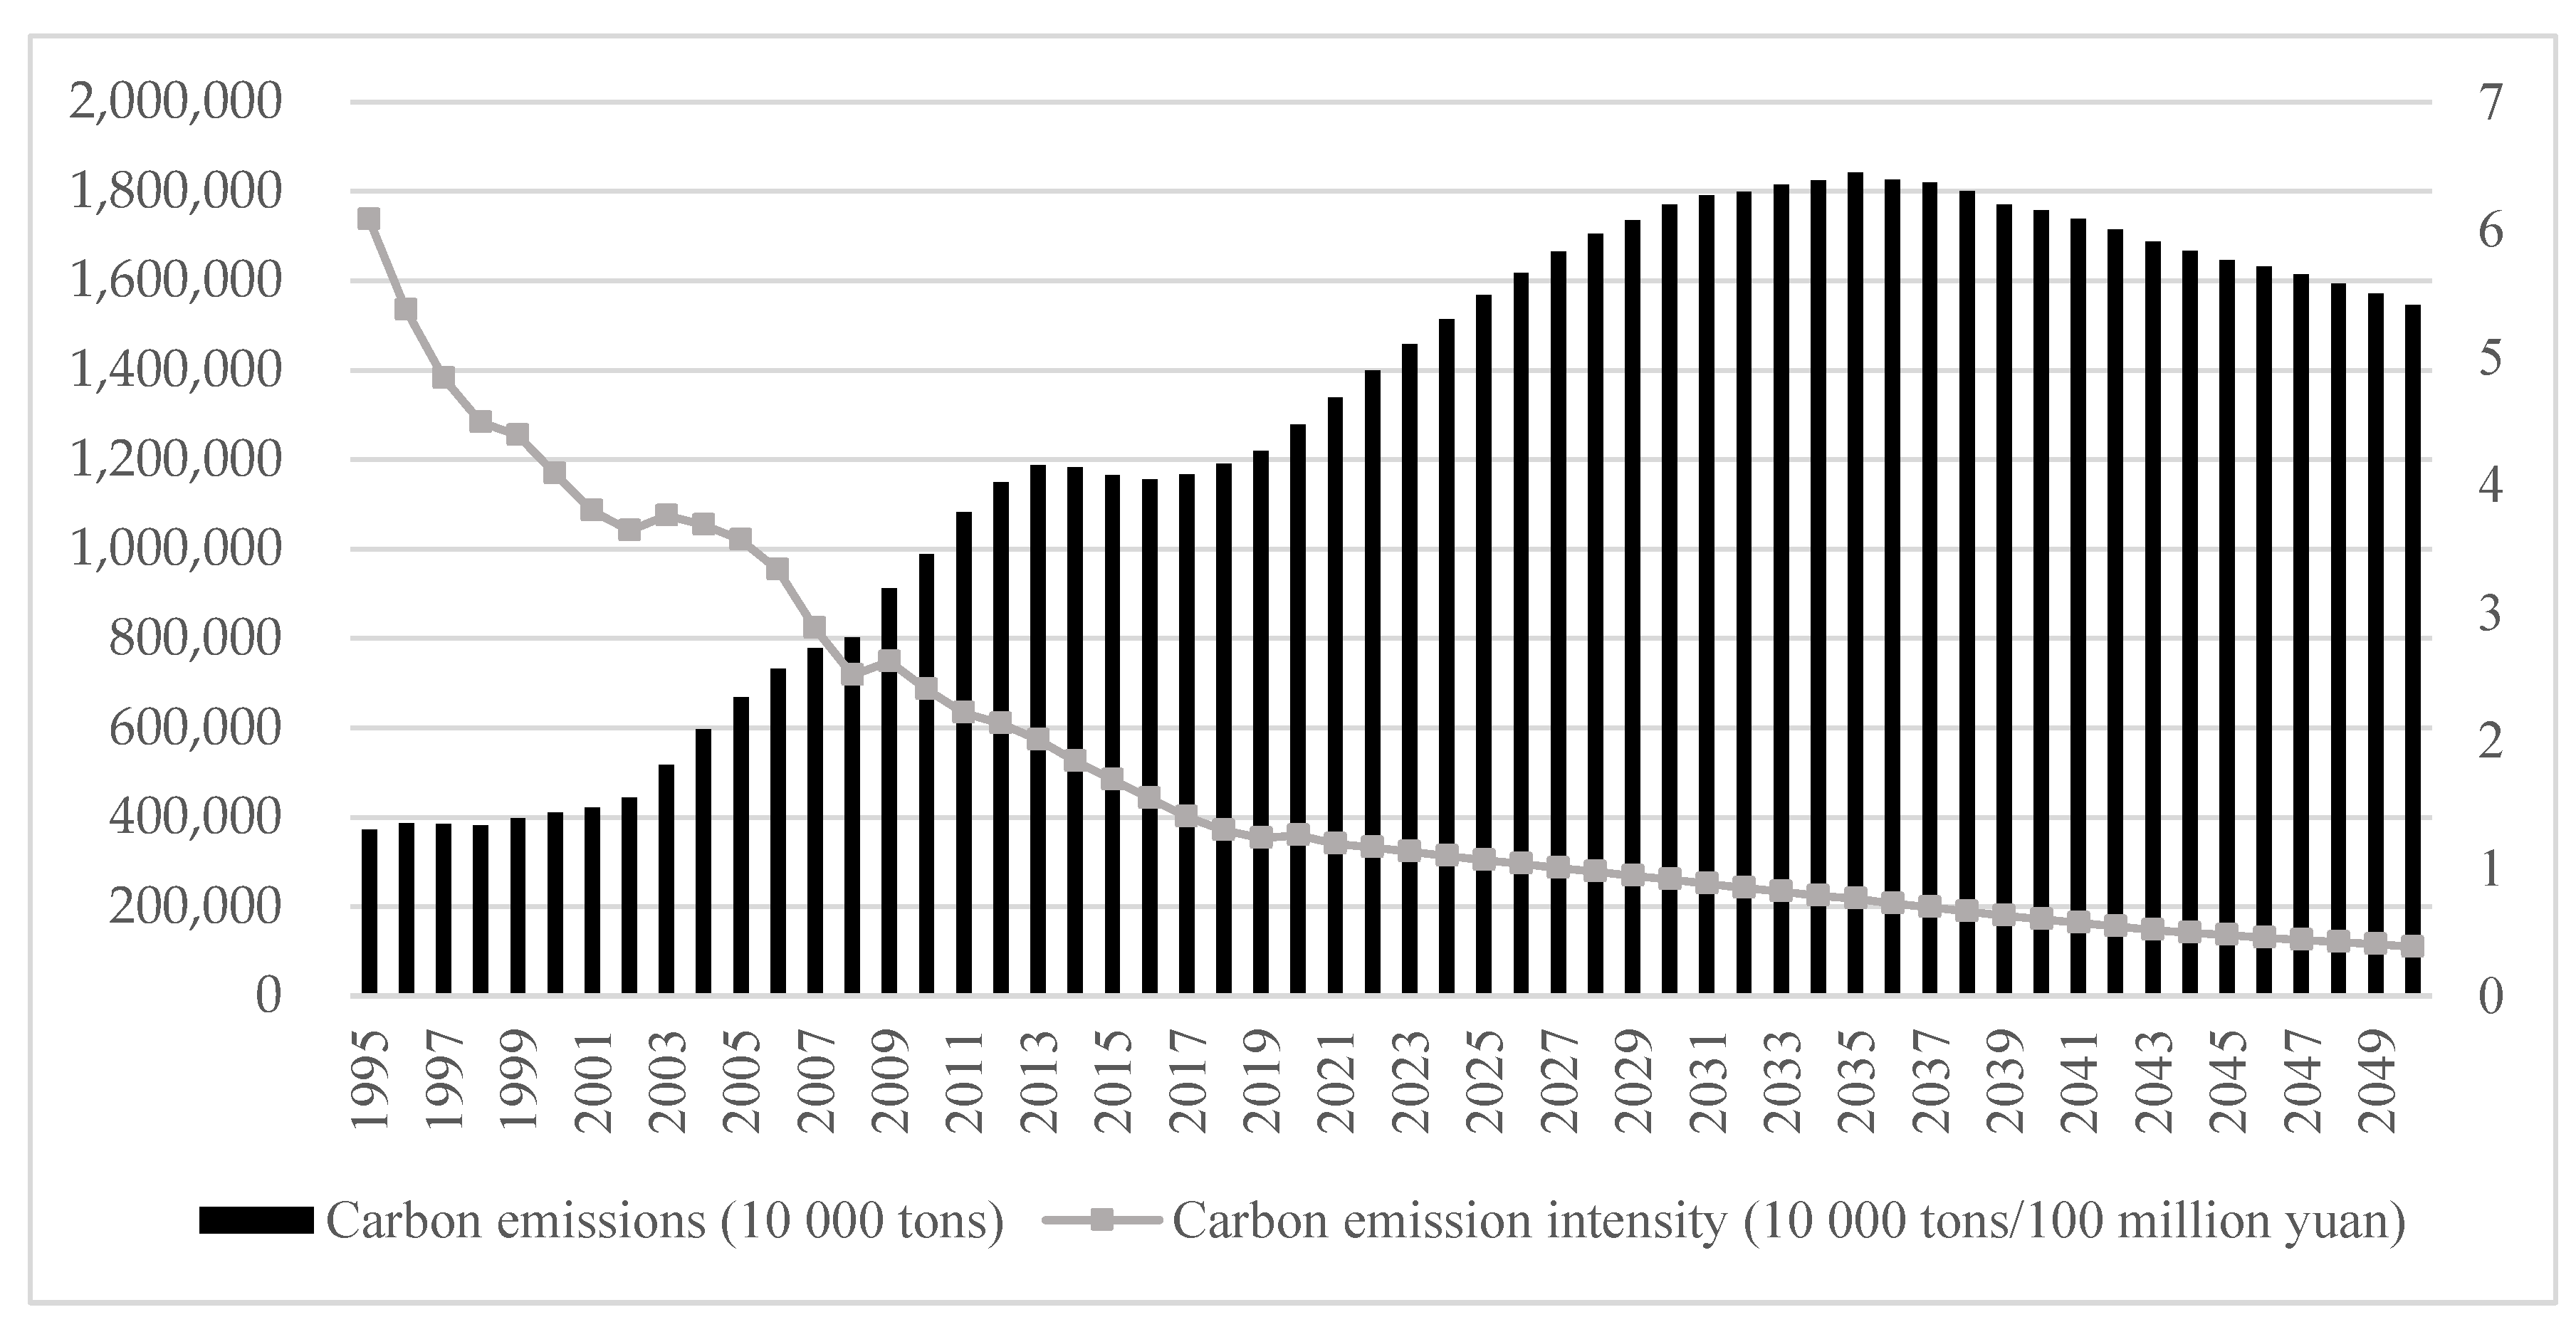
3.1.3. Discussion on Peak Prediction Results

The prediction results of China’s carbon emissions are shown in the Figure 3. From 2020 to 2050, China’s carbon emissions show an inverted U-shaped development curve from growth to decline. Carbon emissions will increase from 12191.77 million tons in 2019 to 18427.2 million tons in 2035 and then decrease to 15454.2 million tons in 2050. The peak of carbon emissions will occur in 2035 and fail to fulfill the carbon emission reduction commitment of reaching the peak in 2030. In 2005, 2020 and 2030, China’s carbon emission intensity was 3.57, 1.26 and 0.91, respectively. The carbon emission intensity in 2020 and 2030 will be reduced by 64.7% and 74.5%, respectively, compared with 2005. The commitment to reducing carbon emission intensity in 2020 and 2030 will be fulfilled on time. According to the current development trend, China’s carbon emission reduction situation will remain grim in the future.

3.2. Analysis of China’s Carbon Emission Factors

According to the above additive decomposition model in LMDI, China’s carbon emissions from 1995 to 2019 are divided into an energy structure comprising carbon emissions, technological innovation carbon emissions, industrial structure carbon emissions, economic development carbon emissions and population-scale carbon emissions. This paper considers the small change between adjacent years and decomposes it into three years regarding the existing research results. The contribution value and contribution rate of each influencing factor to China’s carbon emission changes in the eight time periods from 1995 to 2019 are shown in Table 2 and Figure 4.
Overall, China’s carbon emissions increased from 3727.95 million tons in 1995 to 12191.77 million tons in 2019. Although the growth rate of carbon emissions has gradually decreased since 2011, the task of carbon emission reduction is still severe due to China’s large base of carbon emissions. From 1995 to 2019, China’s carbon emissions increased by 8463.82 million tons, of which the energy structure decreased by 446.53 million tons; technological innovation has the best effect on carbon emission reduction, with a cumulative reduction of 8964.59 million tons of carbon emissions. The industrial structure reduced carbon emissions by 2247.15 million tons; economic development and population scale are the promoting factors of carbon emissions, increasing carbon emissions by 19153.96 million tons and 968.13 million tons, respectively. From 1995 to 2019, the absolute contribution rates of the five influencing factors to the growth of China’s carbon emissions, from large to small, are economic development (226.30%), technological innovation (−105.92%), industrial structure (−26.55%), population scale (11.44%) and energy structure (−5.28%). The specific analysis of each influencing factor is as follows:
(1)
Economic development factors have always shown a significant increasing effect on China’s carbon emissions. The impact of economic development on China’s carbon emissions rose from 132.223 million tons to 2948.27 million tons, an increase of 122.98%. The contribution rate of economic development is greater than that of other factors. From the perspective of development, China’s economy has developed rapidly since 1995. However, the rough and resource consumption-based economic development model relies heavily on energy consumption, so the factor of economic development is always promoting the growth of China’s carbon emissions. At present, China’s urbanization construction is not over; the living standards of residents need to be further improved, and economic development is still China’s first task. Therefore, while developing its economy rapidly, China should not only ensure quantity but also improve quality to achieve more economic growth with lower carbon emissions. China’s low-carbon development still has a long way to go.
(2)
Technological innovation factors have always shown a significant reducing effect on China’s carbon emissions. From 1995 to 2019, technological innovation factors reduced carbon emissions by 8964.59 million tons, and the contribution rate of carbon emission reduction exceeded 100%, far higher than those of other influencing factors. It is the best way to achieve China’s carbon emission reduction target. Since the beginning of the 21st century, China has formulated relatively strict ecological and environmental protection policies due to the challenges posed by high energy consumption to environmental and economic sustainable development. Improving energy efficiency has become key to reducing carbon emissions and energy dependence. In 2010, driven by China’s policies of accelerating the adjustment of heavy industry, reducing overcapacity and eliminating technologically backward industrial enterprises, China’s economic development gradually reduced its energy dependence, forming an economic development model with low pollution, low energy consumption and high output value. China’s energy intensity decreased from 2.43 in 1995 to 0.53 in 2019. In the future, China should learn from Japan, Germany and other technologically strong countries and implement more measures to reduce energy intensity.
(3)
The effect of industrial structure factors on China’s carbon emissions is mainly a reducing effect. The phase analysis shows the change trend from negative to positive and then to negative. From 1996 to 2001, China’s urbanization construction still needed to be improved. At this time, the industrial structure factor showed a weak downward effect. Since 2002, China has accelerated the construction of urbanization and focused on developing industries. In just six years, relying on its unique geographical location and population advantages, China has become a major country in the world’s economic development. To develop rapidly, many industrial enterprises do not carry out technological innovation and consume too much energy, resulting in the rapid growth of carbon emissions. However, after 2008, China gradually realized that consuming a lot of energy for economic development was not the best choice. China has formulated a series of industrial structure optimization policies to increase the proportion of the tertiary industry. Therefore, the contribution rate of industrial structure to carbon emission reduction has gradually increased.
(4)
The population-scale factor increases China’s carbon emissions; its influence degree is relatively stable, and its contribution rate is low. From 1995 to 2019, the population-scale factor increased carbon emissions by 968.13 million tons, with a contribution rate of 11.44%. The population scale has an increasing effect on carbon emissions, but it is relatively small. The impact of population scale on China’s carbon emissions will be limited in the future. First, the long-term implementation of the one-child policy has led to a gradual decline in China’s natural birth rate and slow population growth. The carbon emissions caused by the new population are gradually decreasing. Second, at this stage, residents pay attention to the improvement of quality of life and the construction of the spiritual world. Consumption tends to be in tertiary industries such as high-tech industries, and the increased effect on carbon emissions will continue to weaken.
(5)
Energy structure factors have a slight reducing effect on China’s carbon emissions.
(6)
There are two periods in which the energy structure cannot reduce China’s carbon emissions but shows a growth effect. This is mainly related to China’s energy reserves of “rich coal, poor oil and less gas”. From 2002 to 2007, China accelerated its economic and social construction and consumed a large amount of coal and oil, making China’s energy structure show a growth effect. After 2008, China accelerated upgrading its energy structure, with a substantial increase in gas consumption and a decline in the proportion of coal and oil consumption. China’s energy structure is developing towards low carbon. However, due to the impact of China’s energy resources, the energy structure shows only a slight reducing effect. In the future, China needs to continue to optimize its energy structure, increase the use of clean energy such as electricity, gas, wind energy and solar energy, and achieve China’s carbon emission reduction target.

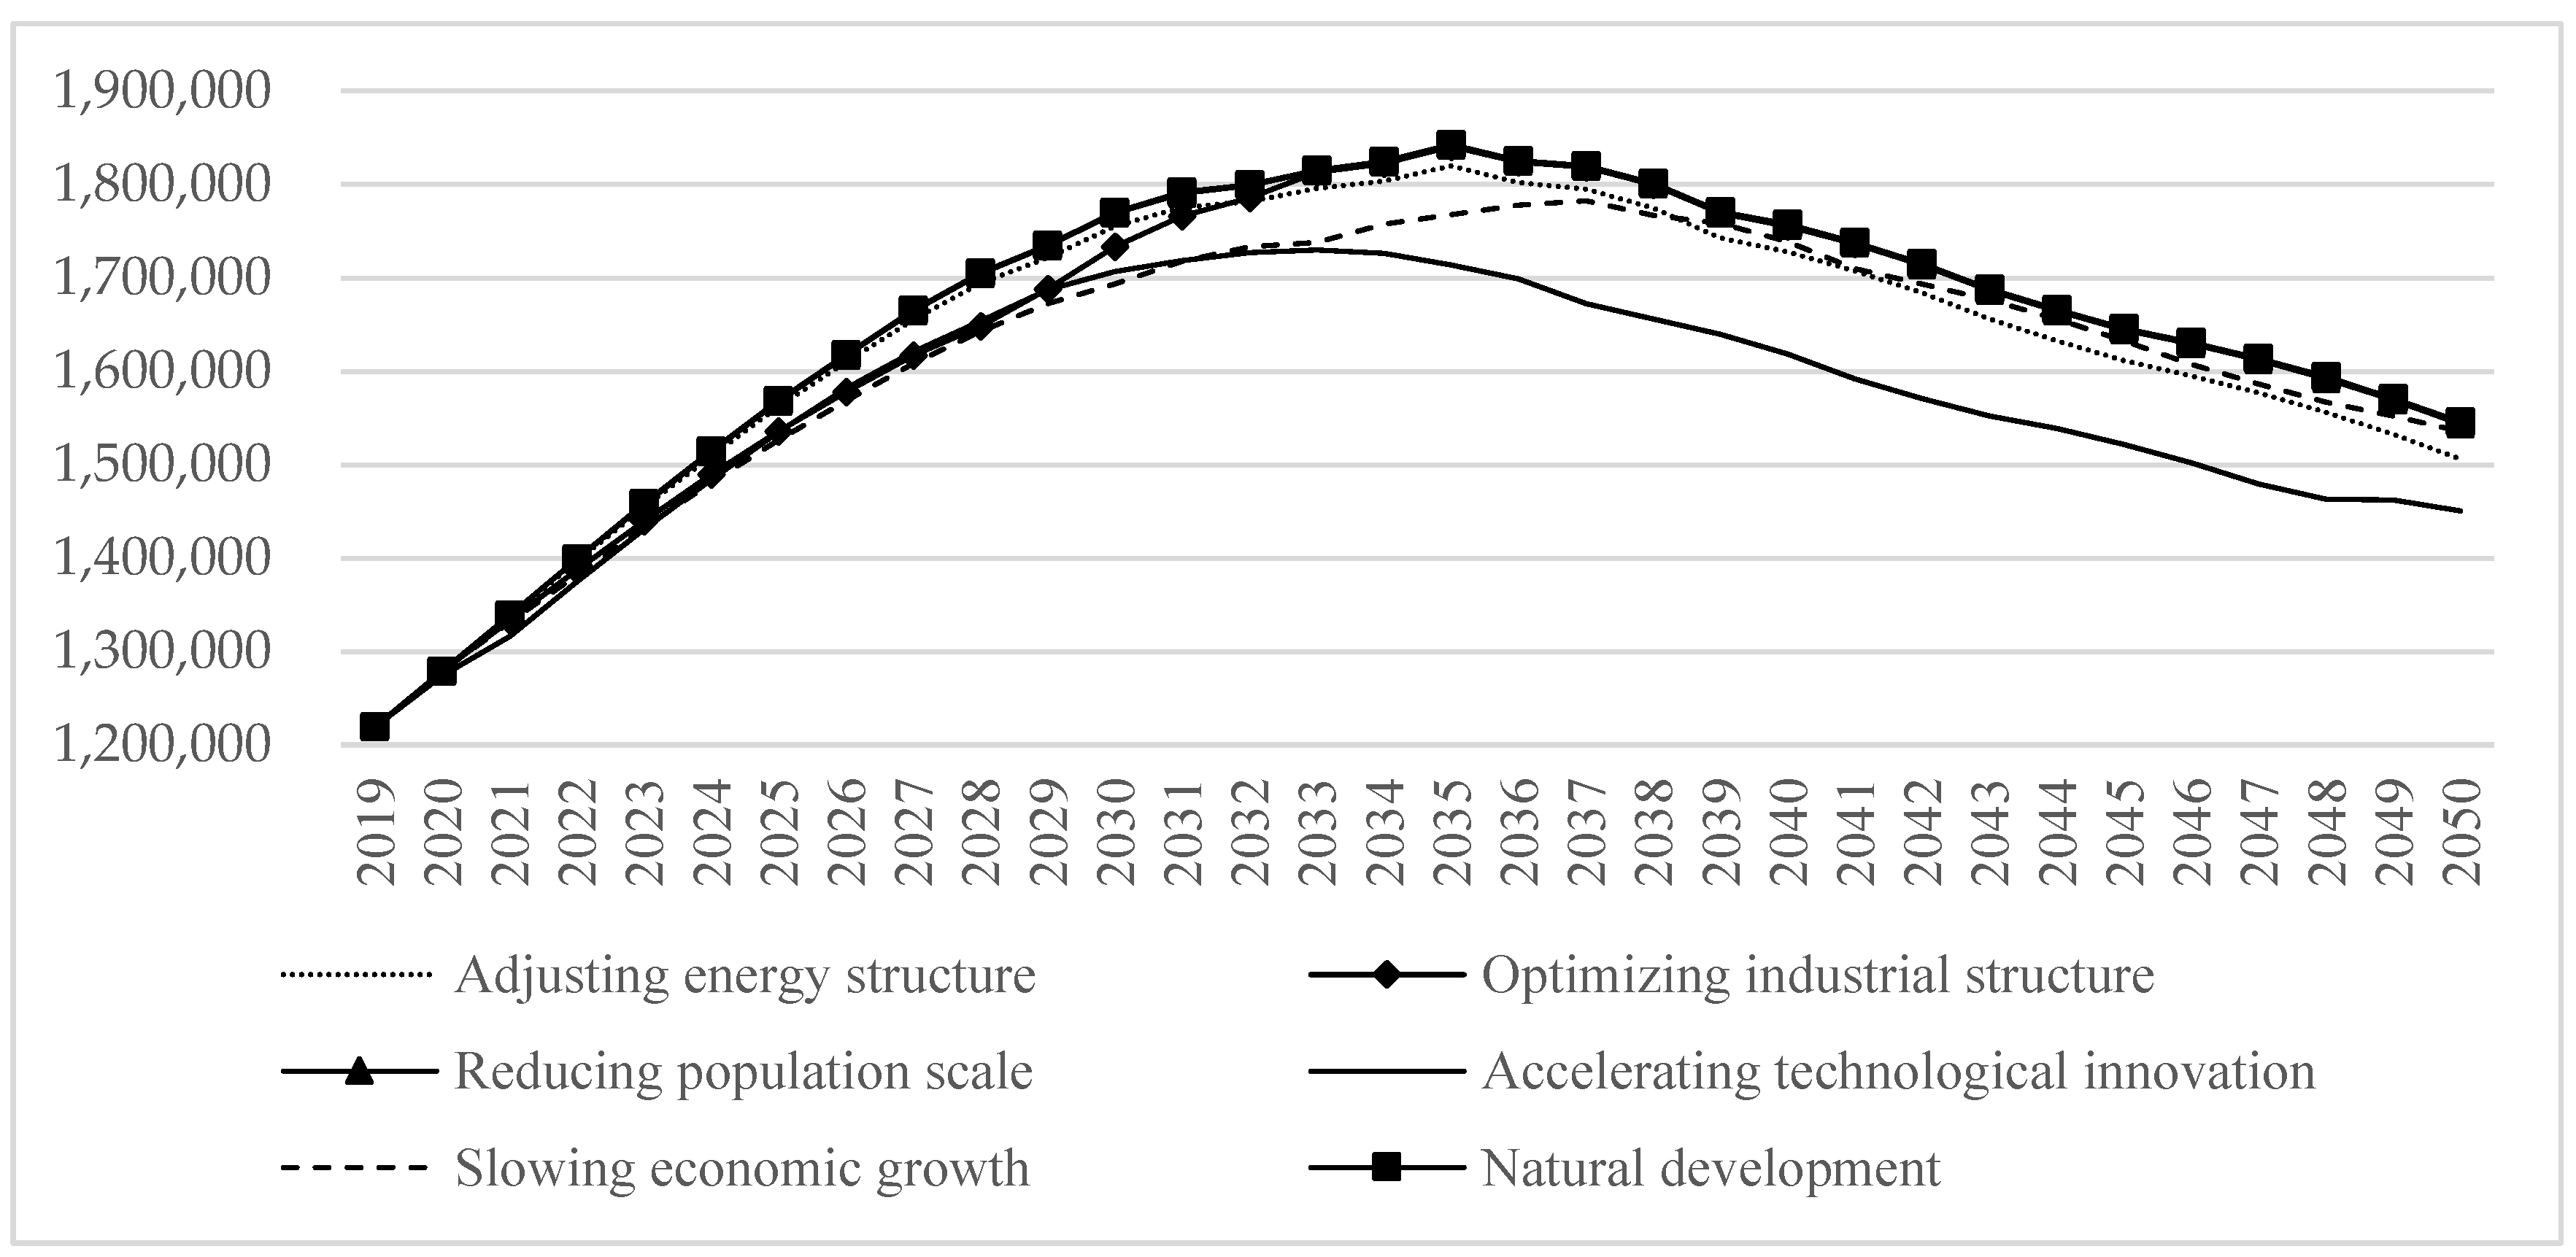
3.3. Analysis of Carbon Emission Path in China

To determine the best path to achieve China’s carbon emission target, based on the analysis conclusion of China’s carbon emission factors, this paper sets five development paths for China’s carbon emission reduction according to the influence direction and size of each factor. The five paths are: slowing economic growth, accelerating technological innovation, optimizing the industrial structure, reducing the population scale and adjusting the energy structure.
(1) In the path of slowing economic growth, China’s GDP will be adjusted from 400 trillion yuan in the natural development path to 350 trillion yuan in 2050; (2) in the path of accelerating technological innovation, the proportion of China’s research and development expenditure in GDP will be adjusted from 4% in the natural development path to 4.5% in 2050; (3) in the path of optimizing industrial structure, China’s industrial structure will reach the ideal structure five years ahead of schedule, compared with the natural development path; (4) in the path of reducing population scale, China’s population scale will be adjusted from 1.33 billion in the natural development path to 1.26 billion in 2050; (5) in the path of adjusting the energy structure, China’s energy structure will be adjusted from coal (32.69%), oil (38.46%) and gas (28.85%) in the natural development path to coal (25.14%), oil (40.05%) and gas (34.81%) in 2050.
The parameters of the five development paths are used in the system dynamics model of China’s carbon emissions to calculate the future trend of China’s carbon emissions for different paths. The results are shown in the Figure 5 and Table 3 below.
It can be seen from the Figure 5 and Table 3 that within the prediction range, China’s carbon emissions can peak under the five development paths. However, the size and timing of China’s carbon emission peaks in different development paths are also different. First, compared with the natural development path, the path of slowing economic growth can reduce the peak and total amount of China’s carbon emissions. It will not make the peak of carbon emissions arrive in advance but will delay the arrival time of the peak of carbon emissions and improve the intensity of carbon emissions. Secondly, compared with the natural development path, accelerating technological innovation can reduce China’s peak and carbon emissions. It can allow the peak of carbon emissions to be reached in advance and reduce carbon emission intensity. Finally, compared with the natural development path, the paths of optimizing the industrial structure, reducing the population scale and adjusting the energy structure can reduce China’s peak and carbon emissions, but the effect is small. At the same time, they will not accelerate the arrival time of peak carbon emissions.
Combined with China’s economic and social development policies and the actual situation in recent years, this paper explains the results of three paths: optimizing the industrial structure, reducing the population scale and adjusting the energy structure. First, since 2008, China has realized that there are hidden dangers in achieving rapid economic development through the consumption of a large amount of energy. The Chinese government has implemented a series of industrial structure optimization measures, the proportion of tertiary industry has gradually increased, and the industrial structure has become more and more reasonable. China’s industrial structure has been transformed. Second, China’s energy structure adjustment has been implemented for several years, and gas consumption has increased significantly. However, due to China’s energy endowment of “rich coal, poor oil and little gas”, the adjustment range of China’s energy structure will not be very large. Third, the long-term implementation of the family planning policy has led to a gradual decline in China’s natural birth rate, or even negative growth. In recent years, Chinese residents have paid attention to improving their quality of life and spiritual enjoyment, and their consumption tends toward tertiary industries, such as high-tech industries. China’s per capita carbon emissions are also declining. Therefore, optimizing the industrial structure, reducing the population scale and adjusting the energy structure have little impact on China’s carbon emission reduction.
To sum up, technological innovation is the key model for China to realize its carbon emission reduction commitment. If China wants to fulfill its previous commitments, it should not slow economic growth but accelerate economic growth. This will help increase investment in technological innovation, improve the energy intensity of tertiary industry, reduce product energy consumption and improve energy utilization. Further, economic and ecological progress can be achieved together.

4. Conclusions

(1) Adhere to the leading role of technological innovation, guide and encourage technological upgrading.
The results show that technological innovation is the key to accelerating China’s carbon emission reduction. First, while increasing investment in technological innovation, the government encourages enterprises and social organizations to increase investment in technological innovation so as to make full use of private capital. Second, the media should guide society to form an environment that is proud of technological innovation and enhances the pride of scientific and technological innovation personnel. Third, the key to the success of technological innovation is for the government to build a technological innovation platform and set up a scientific and technological innovation fund to provide a good environment for innovation. Fourth, according to the current situation of unbalanced regional development in China, China needs to strengthen regional cooperation and enhance the cooperation effect of technological innovation.
(2) Pay attention to the quality of economic development and achieve an all-win result for the economy and environment.
The results show that China should continue to strengthen the quality of economic development, increase GDP and slow GDP growth. First, to improve the government performance appraisal index system, we should not only evaluate the government’s performance through GDP. A beautiful life requires not only material consumption but also a beautiful natural environment. Therefore, the Chinese government should add environmental protection, ecological governance and other indicators to the government performance appraisal system. Second, the government strictly evaluates and takes environmental protection as an important assessment index when introducing foreign investment. Higher investment access requirements need to be set for enterprises with serious pollution. Efforts should be made to actively attract industries with advanced technology and no environmental pollution to settle in and reduce environmental pollution while developing the economy. We should abandon the old model of “developing the economy first and then governing the environment” and explore a new model of coordinated development of the economy.
(3) Continue to adjust the energy structure, optimize the industrial structure and stabilize the development of the population scale.
The results show that adjusting the energy consumption structure, optimizing the industrial structure and reducing the population scale can reduce the peak value of carbon emissions, reduce the total amount of carbon emissions and promote China’s carbon emission reduction. First, China needs to accelerate the optimization of the industrial development structure, cancel preferential policies for enterprises with high carbon emissions and ban enterprises with low energy efficiency. It should upgrade industrial enterprises, merge or close high-carbon-emission enterprises and promote the gradual development of the secondary industry to lower carbon emissions. The government should increase its support for high-tech industries and increase the proportion of high-tech manufacturing in industrial enterprises. Second, it should continue to expand the proportion of oil and gas consumption and reduce the proportion of coal consumption. However, affected by its own energy endowment, China can actively develop solar energy, wind energy and other clean energy to reduce coal consumption. Third, it should pay attention to the population and population structure changes and integrate population structure indicators and relevant economic and social indicators into China’s carbon emission system so as to study the relationship between the population and carbon emissions and promote the development of China’s low-carbon economy.

Author Contributions

Conceptualization, H.K., D.D., L.S. and Z.L.; methodology, L.S. and Z.L.; software, L.S. and Z.L.; validation, D.T., Z.L. and W.X.; formal analysis, D.T. and Z.L.; investigation, Z.L., D.T. and H.K.; resources, H.K., L.S. and D.D.; data curation, Z.L.; writing—original draft preparation, H.K., D.D. and Z.L.; writing—review and editing, H.K., D.D., D.T. and Z.L.; visualization, L.S. and W.X.; supervision, D.T. and W.X.; project administration, D.T. All authors have read and agreed to the published version of the manuscript.

Funding

This research received no external funding.

Institutional Review Board Statement

Not applicable.

Informed Consent Statement

Not applicable.

Data Availability Statement

Not applicable.

Acknowledgments

We would like to thank Valentina Boamah for her contributions in polishing the language and content of the paper.

Conflicts of Interest

The authors declare no conflict of interest.

References

  1. Wu, L.; Zhu, Q. Impacts of the carbon emission trading system on China’s carbon emission peak: A new data-driven approach. Nat. Hazards 2021, 107, 2487–2515. [Google Scholar] [CrossRef]
  2. Tang, J.; Wang, Q.; Choi, G. Efficiency assessment of industrial solid waste generation and treatment processes with carry-over in China. Sci. Total Environ. 2020, 726, 138274. [Google Scholar] [CrossRef] [PubMed]
  3. Liu, J.; Li, S.; Ji, Q. Regional differences and driving factors analysis of carbon emission intensity from transport sector in China. Energy 2021, 224, 120178. [Google Scholar] [CrossRef]
  4. Li, B.; Han, S.; Wang, Y.; Wang, Y.; Li, J.; Wang, Y. Feasibility assessment of the carbon emissions peak in China construction industry: Factor de-composition and peak forecast. Sci. Total Environ. 2020, 706, 135716.1–135716.13. [Google Scholar] [CrossRef] [PubMed]
  5. Whitman, T.; Nicholson, C.F.; Torres, D.; Lehmann, J. Climate Change Impact of Biochar Cook Stoves in Western Kenyan Farm House-holds: System Dynamics Model Analysis. Environ. Sci. Technol. 2011, 45, 3687–3694. [Google Scholar] [CrossRef]
  6. He, C.; Okada, N.; Zhang, Q.; Shi, P.; Zhang, J. Modeling urban expansion scenarios by coupling cellular automata model and system dynamic model in Beijing, China. Appl. Geogr. 2006, 26, 323–345. [Google Scholar] [CrossRef]
  7. Tobias, M.I.; Cavana, R.Y.; Bloomfield, A. Application of a System Dynamics Model to Inform Investment in Smoking Cessation Services in New Zealand. Am. J. Public Health 2010, 100, 1274–1281. [Google Scholar] [CrossRef]
  8. Liu, D.; Xiao, B. Can China achieve its carbon emission peaking? A scenario analysis based on STIRPAT and system dynamics model. Ecol. Indic. 2018, 93, 647–657. [Google Scholar] [CrossRef]
  9. Feng, Y.Y.; Chen, S.Q.; Zhang, L.X. System dynamics modeling for urban energy consumption and CO2 emissions: A case study of Beijing, China. Ecol. Model. 2013, 252, 44–52. [Google Scholar] [CrossRef]
  10. Fong, W.K.; Matsumoto, H.; Lun, Y.F. Application of System Dynamics model as decision making tool in urban planning process toward stabilizing carbon dioxide emissions from cities. Build. Environ. 2009, 44, 1528–1537. [Google Scholar] [CrossRef]
  11. Mirzaei, M.; Bekri, M. Energy consumption and CO2 emissions in Iran, 2025. Environ. Res. 2017, 154, 345–351. [Google Scholar] [CrossRef] [PubMed]
  12. Lei, W.; Lu, B.; Zhang, E. System dynamic modeling and scenario simulation on Beijing industrial carbon emissions. Environ. Eng. Res. 2016, 21, 355–364. [Google Scholar]
  13. Kim, K.S.; Cho, Y.J.; Jeong, S.J. Simulation of CO2 emission reduction potential of the iron and steel industry using a system dy-namics model. Int. J. Precis. Eng. Manuf. 2014, 15, 361–373. [Google Scholar] [CrossRef]
  14. Lei, W.; Lu, B. System Dynamics Modeling and Policy Simulation for Urban Traffic: A Case Study in Beijing. Environ. Modeling Assess. 2017, 22, 363–378. [Google Scholar]
  15. Xie, Z.; Xuenong, G.; Wenhui, Y.; Jundong, F.; Zongbin, J. Decomposition and prediction of direct residential carbon emission indicators in Guangdong Province of China. Ecol. Indic. 2020, 115, 106344. [Google Scholar]
  16. Mao, G.; Dai, X.; Wang, Y.; Guo, J.; Cheng, X.; Fang, D.; Song, X.; He, Y.; Zhao, P. Reducing carbon emissions in China: Industrial structural upgrade based on system dynamics. Energy Strat. Rev. 2013, 2, 199–204. [Google Scholar] [CrossRef]
  17. Pan, X.; Li, M.; Xu, H.; Guo, S.; Guo, R.; Lee, C.T. Simulation on the effectiveness of carbon emission trading policy: A system dynamics approach. J. Oper. Res. Soc. 2020, 71, 1447–1460. [Google Scholar] [CrossRef]
  18. Dong, Y.; Xia, B.; Chen, W. Carbon footprint of urban areas: An analysis based on emission sources account model. Environ. Sci. Policy 2014, 44, 181–189. [Google Scholar] [CrossRef]
  19. Homer, J.B.; Hirsch, G.B. System Dynamics Modeling for Public Health: Background and Opportunities. Am. J. Public Health 2006, 96, 452–458. [Google Scholar] [CrossRef]
  20. Butts, M.; Drews, M.; Larsen, M.A.; Lerer, S.; Rasmussen, S.H.; Grooss, J.; Overgaard, J.; Refsgaard, J.C.; Christensen, O.B.; Christensen, J.H. Embedding complex hydrology in the regional climate system–Dynamic coupling across different modelling domains. Adv. Water Resour. 2014, 74, 166–184. [Google Scholar] [CrossRef]
  21. Guan, D.; Gao, W.; Su, W.; Li, H.; Hokao, K. Modeling and dynamic assessment of urban economy–resource–environment system with a coupled system dynamics–Geographic information system model. Ecol. Indic. 2011, 11, 1333–1344. [Google Scholar] [CrossRef]
  22. Forrester, J.W. System dynamics—The next fifty years. Syst. Dyn. Rev. 2010, 23, 359–370. [Google Scholar] [CrossRef]
  23. Ang, B.W. Decomposition analysis for policymaking in energy: Which is the preferred method? Energy Policy 2004, 32, 1131–1139. [Google Scholar] [CrossRef]
  24. Tang, D.; Zhang, Y.; Bethel, B.J. An Analysis of Disparities and Driving Factors of Carbon Emissions in the Yangtze River Economic Belt. Sustainability 2019, 11, 2362. [Google Scholar] [CrossRef] [Green Version]
  25. Yang, J.; Cai, W.; Ma, M.; Li, L.; Liu, C.; Ma, X.; Li, L.; Chen, X. Driving forces of China’s CO2 emissions from energy consumption based on Kaya-LMDI methods. Sci. Total Environ. 2019, 711, 134569. [Google Scholar] [CrossRef] [PubMed]
  26. Tang, D.; Ma, T.; Li, Z.; Tang, J.; Bethel, B.J. Trend Prediction and Decomposed Driving Factors of Carbon Emissions in Jiangsu Province during 2015–2020. Sustainability 2016, 8, 1018. [Google Scholar] [CrossRef] [Green Version]
  27. Jiang, J.; Ye, B.; Xie, D.; Tang, J. Provincial-level carbon emission drivers and emission reduction strategies in China: Combining multi-layer LMDI decomposition with hierarchical clustering. J. Clean. Prod. 2017, 169, 178–190. [Google Scholar] [CrossRef]
  28. Liu, L.; Wang, S.; Wang, K.; Zhang, R.; Tang, X. LMDI decomposition analysis of industry carbon emissions in Henan Province, China: Comparison between different 5-year plans. Nat. Hazards 2015, 80, 997–1014. [Google Scholar] [CrossRef]
  29. State Statistical Bureau. China Energy Statistical Yearbook 2020; China Statistic Press: Beijing, China, 2020. (In Chinese)
  30. State Statistical Bureau. China Statistical Yearbook 2020; China Statistic Press: Beijing, China, 2020. (In Chinese)
  31. He, C.; Shi, P.; Li, J. Scenarios simulation land use change in the northern China by system dynamic model. Acta Geogr. Sin. 2004, 59, 599–607. [Google Scholar]
  32. El-Gafy, I.K. System Dynamic Model for Crop Production, Water Footprint, and Virtual Water Nexus. Water Resour. Manag. 2014, 28, 4467–4490. [Google Scholar] [CrossRef]
  33. State Council of China. National Population Development Plan (2016–2030). 2016. Available online: http://www.gov.cn/zhengce/content/2017-01/25/content_5163309.htm (accessed on 26 April 2022).
  34. Tencent. The United Nations Predicts that China’s Future Population May Fall to Less than 1.4 Billion by 2050? But Is It Really the Case? 2022. Available online: https://xw.qq.com/amphtml/20220423A073C300 (accessed on 26 April 2022).
  35. Xinmin Evening News. Lin Yifu’s Outlook on the “Top of Shanghai”: China Can Achieve an Annual Growth of 5~6% by 2030. 2021. Available online: https://baijiahao.baidu.com/s?id=1697440100659195427&wfr=spider&for=pc (accessed on 26 April 2022).
  36. Yan, H. GDP Forecast of Major Countries in The World in 2050. 2018. Available online: https://www.bizchinalaw.com/archives/1926 (accessed on 26 April 2022).
  37. United Nations Development Program (UNDP). China and a Sustainable Future: Towards a Low Carbon Economy and Society; China Human Development Report; United Nations Development Program (UNDP): Geneva, Switzerland, 2009; pp. 47–73. [Google Scholar]
  38. Communist Party Member Network. The 14th Five Years Plan for National Economic and Social Development of The People’s Republic of China and The Outline of Long-Term Objectives for 2035. 2021. Available online: https://www.12371.cn/2021/03/13/ARTI1615598751923816.shtml (accessed on 26 April 2022).
  39. Global Network. PetroChina Released the 2020 Version of World and China Energy Outlook: China’s Path of Carbon Neutralization from the Perspective of Energy. 2020. Available online: https://baijiahao.baidu.com/s?id=1686314611374759683&wfr=spider&for=pc (accessed on 26 April 2022).
  40. Qilu Network. Wang Zhigang, Minister of Science and Technology: An Innovative Country Is a Very Important Part of the “Three Steps” of China as a Whole. 2019. Available online: https://baijiahao.baidu.com/s?id=1627674804257603313&wfr=spider&for=pc (accessed on 26 April 2022).
  41. State Statistical Bureau. China Statistical Yearbook on Science and Technology 2016; China Statistic Press: Beijing, China, 2020. (In Chinese)
Figure 1. China’s carbon emission system: causality diagram.
Energies 15 03272 g001
Figure 2. China’s carbon emission system: stock-flow diagram.
Energies 15 03272 g002
Figure 3. Simulation of China’s carbon emissions from 2020 to 2050.
Energies 15 03272 g003
Figure 4. Contribution rate of influencing factors of China’s carbon emissions from 1996 to 2019.
Energies 15 03272 g004
Figure 5. China’s carbon emission forecast for different paths from 2020 to 2050 (Unit: 10,000 tons).
Energies 15 03272 g005
Table 1. Test of main variables of system dynamics model of China’s carbon emissions from 1995 to 2019.
YearGDP (100 Million Yuan)Population (10,000 Persons)Productive Energy Consumption (10,000 tce)Living Energy Consumption (10,000 tce)Carbon Emissions (10,000 Tons)
Simulation
Value
Actual ValueError (%)Simulation
Value
Actual ValueError (%)Simulation
Value
Actual ValueError (%)Simulation
Value
Actual
Value
Error (%)Simulation
Value
Actual ValueError (%)
199561,34061,3400.00%121,121121,1210.00%138,557138,5500.00%10,23510,240−0.05%370,520372,795−0.61%
199671,81171,8140.00%122,393122,3890.00%146,225146,0820.10%821581111.28%383,007385,815−0.73%
199779,71079,715−0.01%123,629123,6260.00%148,267147,1660.75%779777270.91%380,028385,331−1.38%
199885,19485,1960.00%124,766124,7610.00%147,376146,3780.68%759875500.64%377,609382,553−1.29%
199990,56190,5640.00%125,789125,7860.00%152,193153,196−0.65%748473811.39%391,353397,474−1.54%
2000100,278100,2800.00%126,745126,7430.00%157,255159,242−1.25%71637267−1.44%402,688410,012−1.79%
2001110,858110,8630.00%127,633127,6270.00%164,805163,7720.63%72157410−2.62%411,717421,405−2.30%
2002121,711121,717−0.01%128,462128,4530.01%173,637172,6350.58%74017456−0.74%436,171443,168−1.58%
2003137,411137,422−0.01%129,233129,2270.00%207,102201,1212.97%809080850.07%510,115517,040−1.34%
2004161,829161,840−0.01%129,995129,9880.01%234,248232,2710.85%925291521.09%581,318596,534−2.55%
2005187,301187,319−0.01%130,762130,7560.00%257,798259,811−0.77%962496230.01%663,737669,146−0.81%
2006219,424219,438−0.01%131,456131,4480.01%286,885284,8990.70%10,32210,1271.93%728,545732,307−0.51%
2007270,067270,092−0.01%132,139132,1290.01%309,652303,6761.97%10,65610,761−0.97%777,279777,806−0.07%
2008319,219319,245−0.01%132,813132,8020.01%311,896314,903−0.95%10,79810,803−0.05%804,170802,7030.18%
2009348,491348,518−0.01%133,464133,4500.01%356,600356,633−0.01%11,47111,1722.67%917,269912,0280.57%
2010412,091412,119−0.01%134,104134,0910.01%389,607388,6020.26%12,38412,2780.86%995,092988,8480.63%
2011487,915487,940−0.01%134,748134,7350.01%423,328426,339−0.71%13,41313,3150.74%1,097,1101,082,8661.32%
2012538,561538,5800.00%135,422135,4040.01%443,305453,319−2.21%14,14314,0410.73%1,175,3401,148,7742.31%
2013592,955592,9630.00%136,085136,0720.01%471,667470,6680.21%14,76114,857−0.65%1,208,1701,187,8801.71%
2014643,535643,5630.00%136,793136,7820.01%473,065471,0510.43%15,53015,4350.62%1,202,8101,182,6151.71%
2015688,839688,8580.00%137,477137,4620.01%465,147466,153−0.22%16,38016,578−1.19%1,222,2501,165,2984.89%
2016746,357746,395−0.01%138,288138,2710.01%467,793464,7880.65%16,74016,935−1.15%1,163,9301,156,4300.65%
2017831,965832,036−0.01%139,021139,0080.01%478,115473,1121.06%17,40317,506−0.59%1,190,6001,167,3631.99%
2018919,238919,2810.00%139,549139,5380.01%478,192488,201−2.05%17,16017,356−1.13%1,222,6501,191,0962.65%
2019986,434986,515−0.01%140,010140,0050.00%501,371502,400−0.20%17,24717,342−0.55%1,254,0601,219,1772.86%
Table 2. Calculation results of China’s carbon emission factor analysis from 1995 to 2019.
YearEnergy StructureTechnological InnovationIndustrial StructureEconomic DevelopmentPopulation ScaleTotal
1995000000
1996–1998−4478−129,973−1869132,22313,8559758
1999–2001−3239−59,262−242294,979879538,852
2002–20042398−22,83510,650176,2458670175,129
2005–20072139−176,3856503337,99011,024181,272
2008–2010−1200−114,914−28,027342,85812,325211,042
2011–2013−5010−116,228−69,744373,99016,025199,032
2014–2016−12,430−98,843−94,741162,28512,280−31,450
2017–2019−22,834−178,020−45,067294,82713,84062,747
1996–2019−44,653−896,459−224,7151915,39696,813846,382
Table 3. China’s carbon emission forecast for different paths from 2020 to 2050.
PathsPeak Year (Year)Peak Value (10,000 Tons)Accumulative Carbon Emissions (10,000 Tons)Carbon Emission Intensity (10,000 Tons/100 Million Yuan)
202020302050
Natural development20351,842,72052,726,0571.260.910.39
Slowing economic growth20371,782,34051,585,2971.260.930.44
Accelerating technological innovation20331,729,74049,914,4571.250.880.36
Optimizing industrial structure20351,840,60052,334,5971.260.890.39
reducing population scale20351,841,55052,691,8771.260.910.39
Adjusting energy structure20351,819,85052,066,1671.260.90.38
Publisher’s Note: MDPI stays neutral with regard to jurisdictional claims in published maps and institutional affiliations.

