Review

Techno-Economic Assessment of Half-Cell Modules for Desert Climates: An Overview on Power, Performance, Durability and Costs

1
AE SOLAR, Research and Development Department, 86343 Koenigsbrunn, Germany
2
Fraunhofer Center for Silicon Photovoltaics (CSP), 06120 Halle, Germany
3
Fraunhofer Institute for Microstructure of Materials and Systems (IMWS), 06120 Halle, Germany
4
Dubai Electricity and Water Authority (DEWA), Research and Development Center, MBR Solar Park, Dubai P.O. Box 564, United Arab Emirates
5
Laboratory Networked Energy Systems, Leipzig University of Applied Sciences (HTWK), 04107 Leipzig, Germany
*
Author to whom correspondence should be addressed.
Energies 2022, 15(9), 3219; https://doi.org/10.3390/en15093219
Submission received: 5 April 2022 / Revised: 22 April 2022 / Accepted: 25 April 2022 / Published: 28 April 2022
(This article belongs to the Special Issue Frontiers in Photovoltaic Modules)

Abstract

:
Photovoltaic modules in desert areas benefit from high irradiation levels but suffer from harsh environmental stress factors, which influence the Levelized Cost of Electricity by decreasing the lifetime and performance and increasing the maintenance costs. Using optimized half-cell module designs mounted in the most efficient orientation according to the plant requirements can lead to reduced production costs, increased energy yield and longer service lives for PV modules in desert areas. In this work, we review the technical advantages of half-cell modules in desert regions and discuss the potential gains in levelized costs of electricity due to reduced material consumption, a higher cell-to-module power ratio, lower module temperatures, better yields, reduced cleaning cycles and finally, reduced fatigue in interconnection due to thermal cycling. We show that half-cell modules are the most cost-effective option for desert areas and are expected to have a relevant lower Levelized Cost of Electricity.

1. Introduction

Desert areas benefit from high irradiation levels [1], and the photovoltaics power potential in these areas exceeds 2100 kWh/kWp [2]. This means only a small area of desert covered by PV modules can potentially cover today’s world’s need for electricity [3], and this drives the major installation market to these areas [1]. However, desert areas suffer from harsh environmental stress factors, such as high UV doses [4,5,6,7,8,9], high ambient temperatures [10,11,12,13,14,15], significant temperature changes between night and day [8,16,17,18] and a high soiling ratio [8,19,20,21,22,23,24,25,26,27,28,29,30,31,32,33,34]. Looking at the differences between these stress factors and comparing them with moderate climate, about twice higher irradiance, 5.4 times higher UV dose, 1.6 times higher temperature change between night and day, 25 times higher soiling ratio and 3 times higher average ambient temperature is measured in the desert compared to the moderate climate (see Figure 1) [8]. PV modules are expected to last at least 25 years in the field to achieve the economic goals of the project [35]. Depending on the module manufacturers, there are different product warranties varying between 5 and 12 years and performance guarantees between 20 and 35 years [36]. However, it should be considered that most of these standards and plans are developed for moderate climates [8]. The increased environmental stress factors [8,37] lead to durability issues such as breakage of tabs and solar cells [16,18,38], degradation of polymer encapsulants in the form of discoloration or delamination [5,6,39,40] and sand abrasion [24,41,42] and performance issues such as energy losses due to homogeneous [8] or inhomogeneous soiling [34,35] and high module temperatures [10,11,13], which influence the energy production of the system and therefore directly impact the Levelized Cost of Electricity (LCOE) [43,44,45], which is the net price for the electricity.
The Levelized Cost of Electricity LCOE can be calculated from Equation (1).
L C O E P V = I P V + t = 1 n A t ( 1 + i ) t + R n t = 1 n M e l × ( 1 d P V ) t ( 1 + i ) t
where L C O E P V   [ EUR / W P e a k   or   EUR / kWh ] is the Levelized Cost of Electricity/Energy, I P V   [ EUR ] is the investment costs, A t   [ EUR ] is the annual total costs, i [ ] is the discount rate, t   [ ] is the operating year, R n   [ EUR ] is removal costs, M e l   [ W   o r   kWh ] is the electricity output, n   [ years ] is the lifetime of the PV module/plant, and d P V   [ ] is the degradation rate from the unity.
Reduced module lifetimes and increased maintenance costs increase the LCOE, while increased module efficiency and reduced systems costs reduce this factor.
Half-cell modules are the new standard module, and they have become popular in the market [46]. According to International Roadmap for Photovoltaics, all modules in the market are expected to use half-cell or third-cell modules by the end of 2025 [47], and this transition can be seen clearly in the new product series from tier-1 module manufacturers in 2021. In this work, firstly, we present a review on the advantage of using half-cell modules with proper design on module efficiency, durability and performance. Furthermore, we present our results on the techno-economic assessment and cost factors of half-cell modules in desert areas and how the half-cell modules can influence the relative LCOE, especially in desert areas. This can justify why module manufacturers are leaning more and more toward partial-cell module production.

2. Technical Assessment

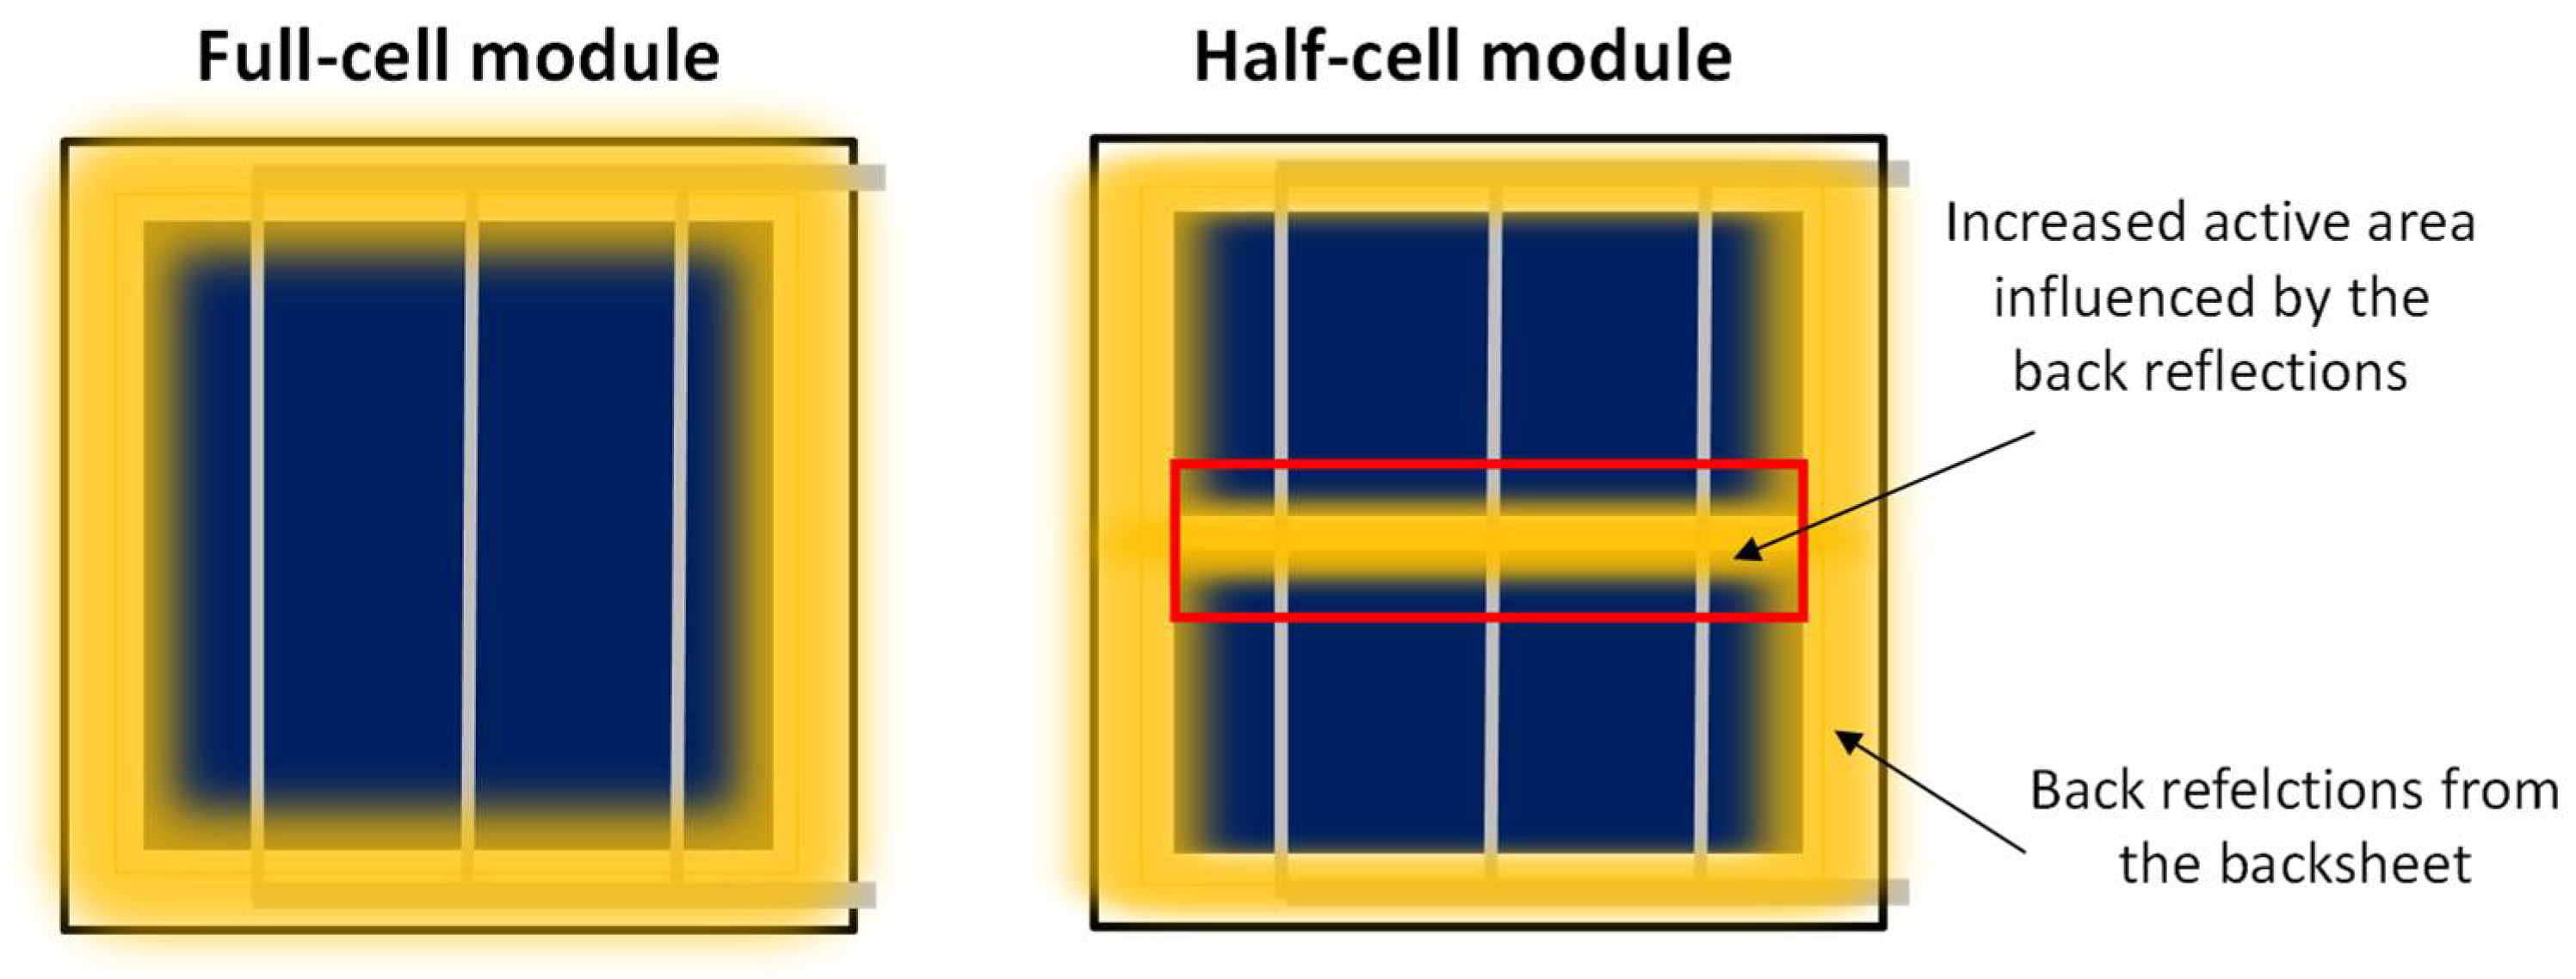
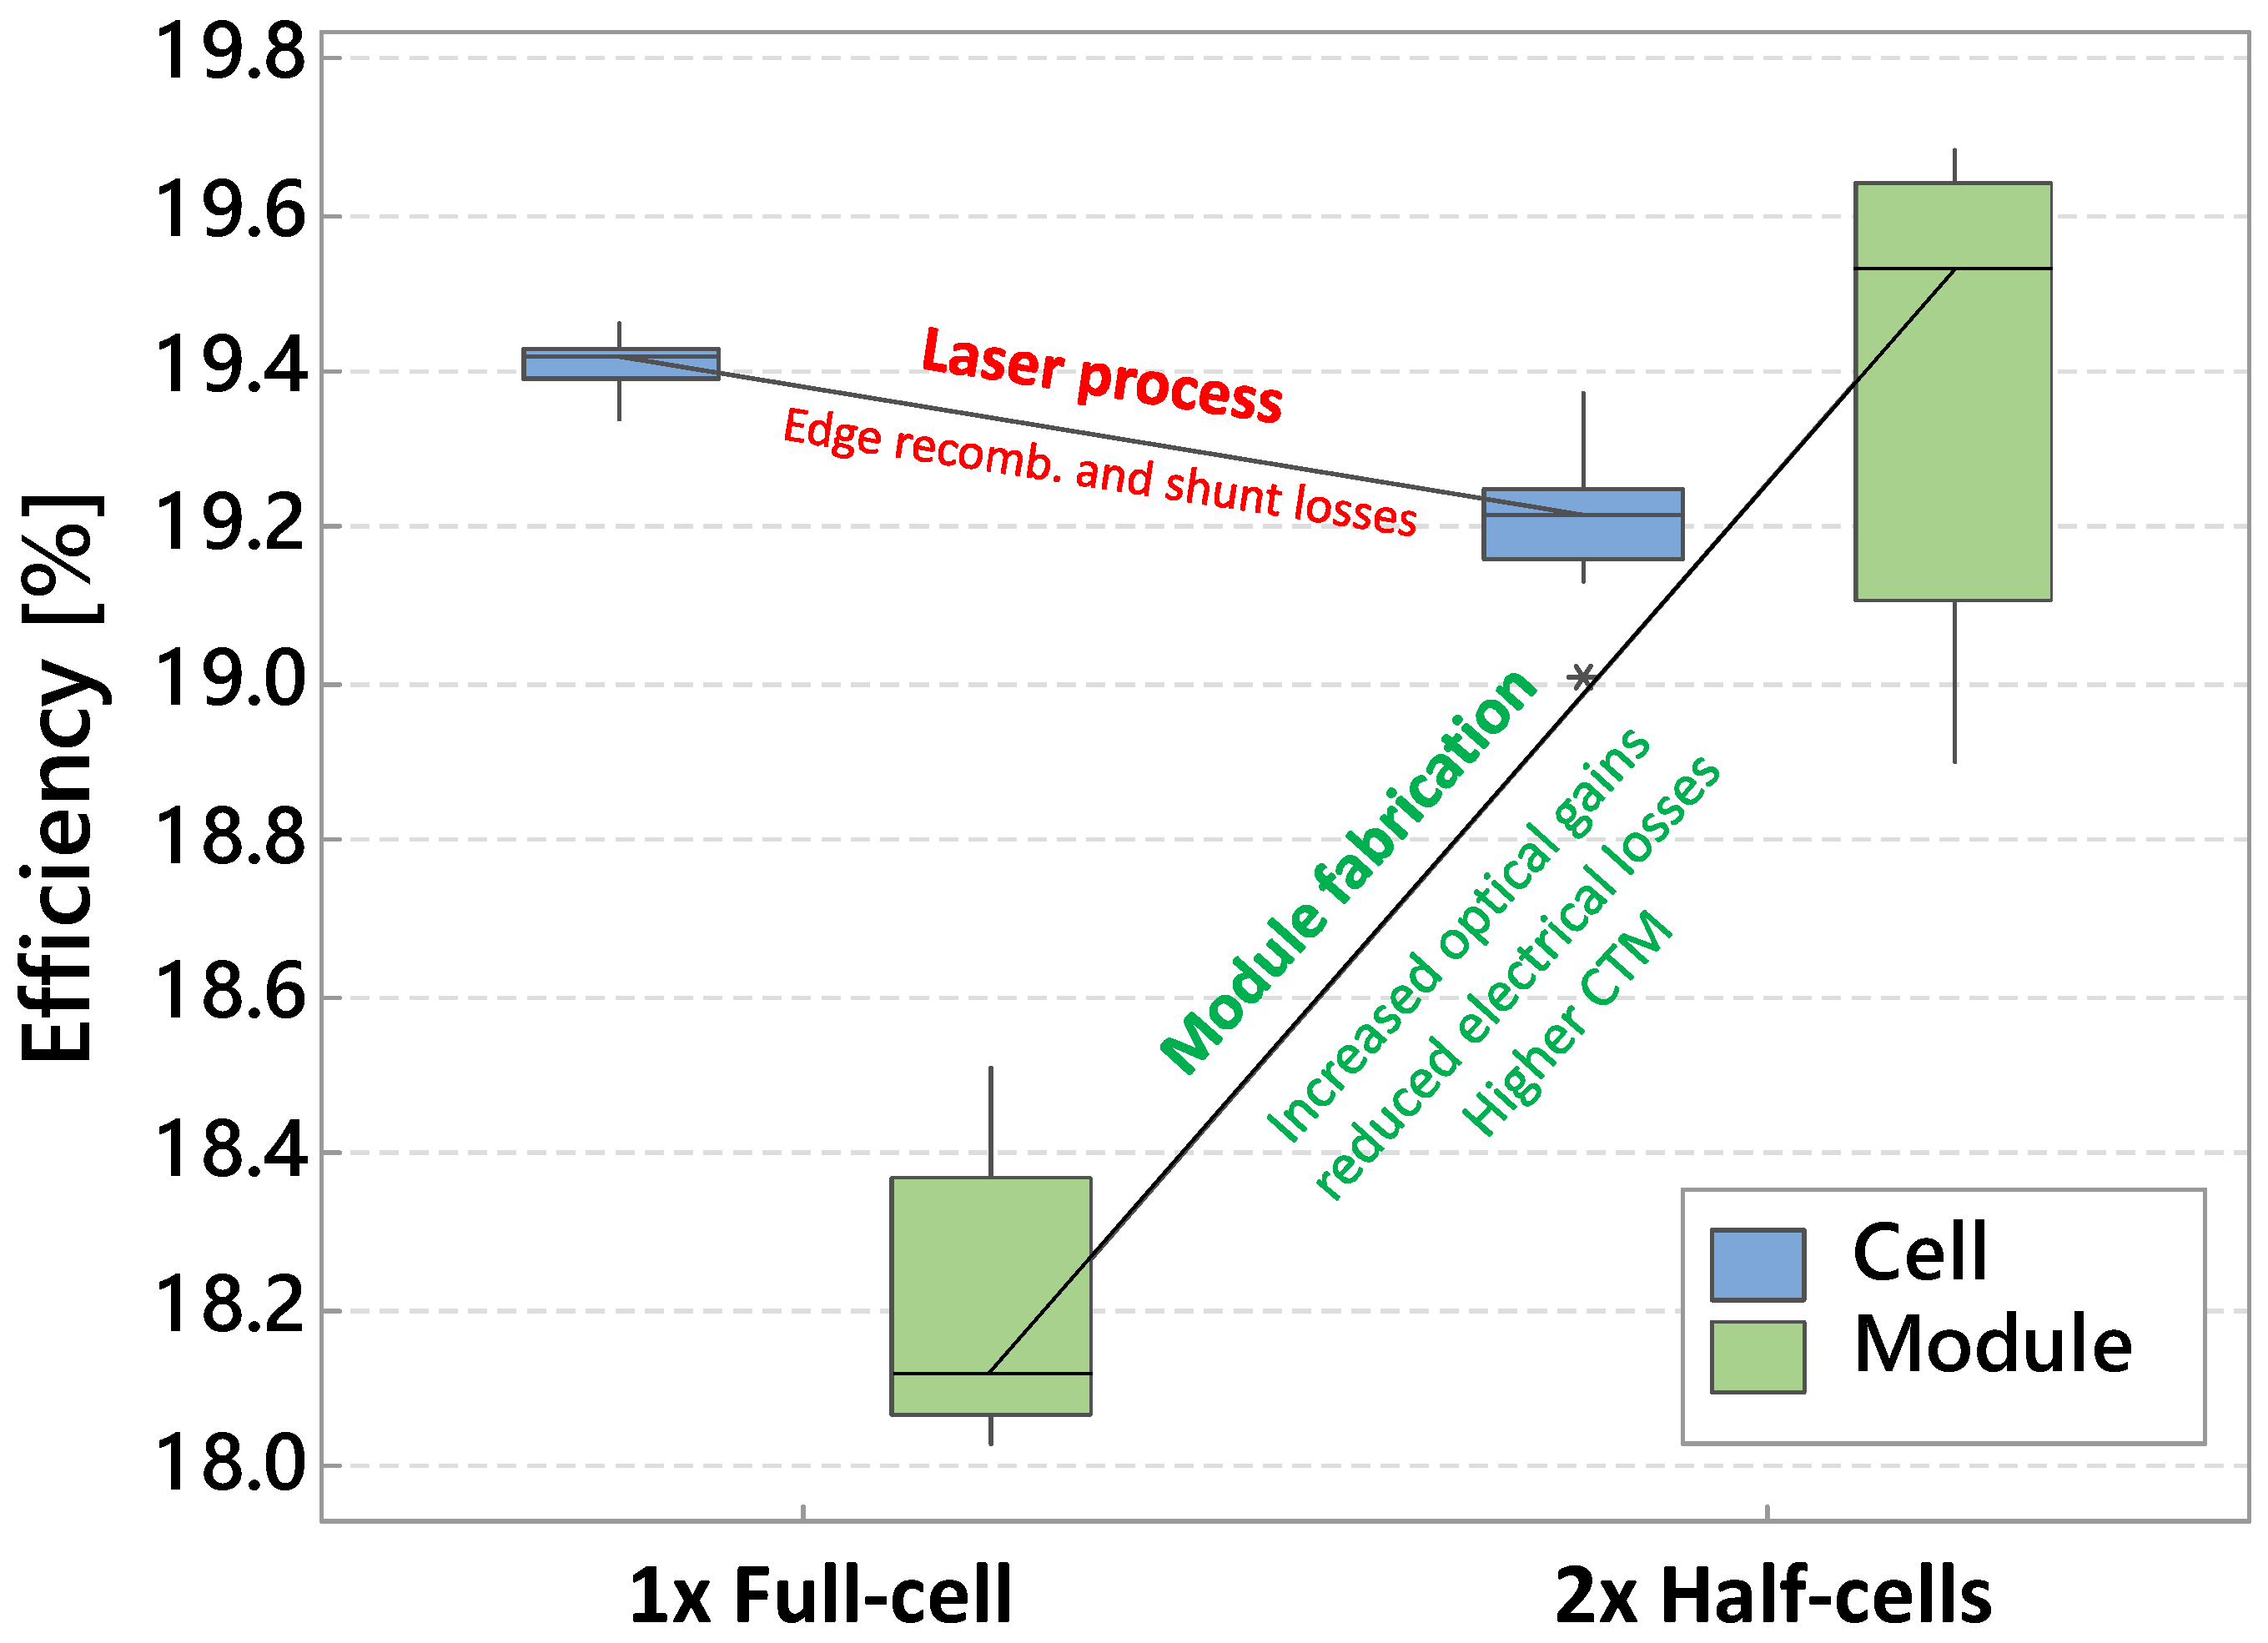
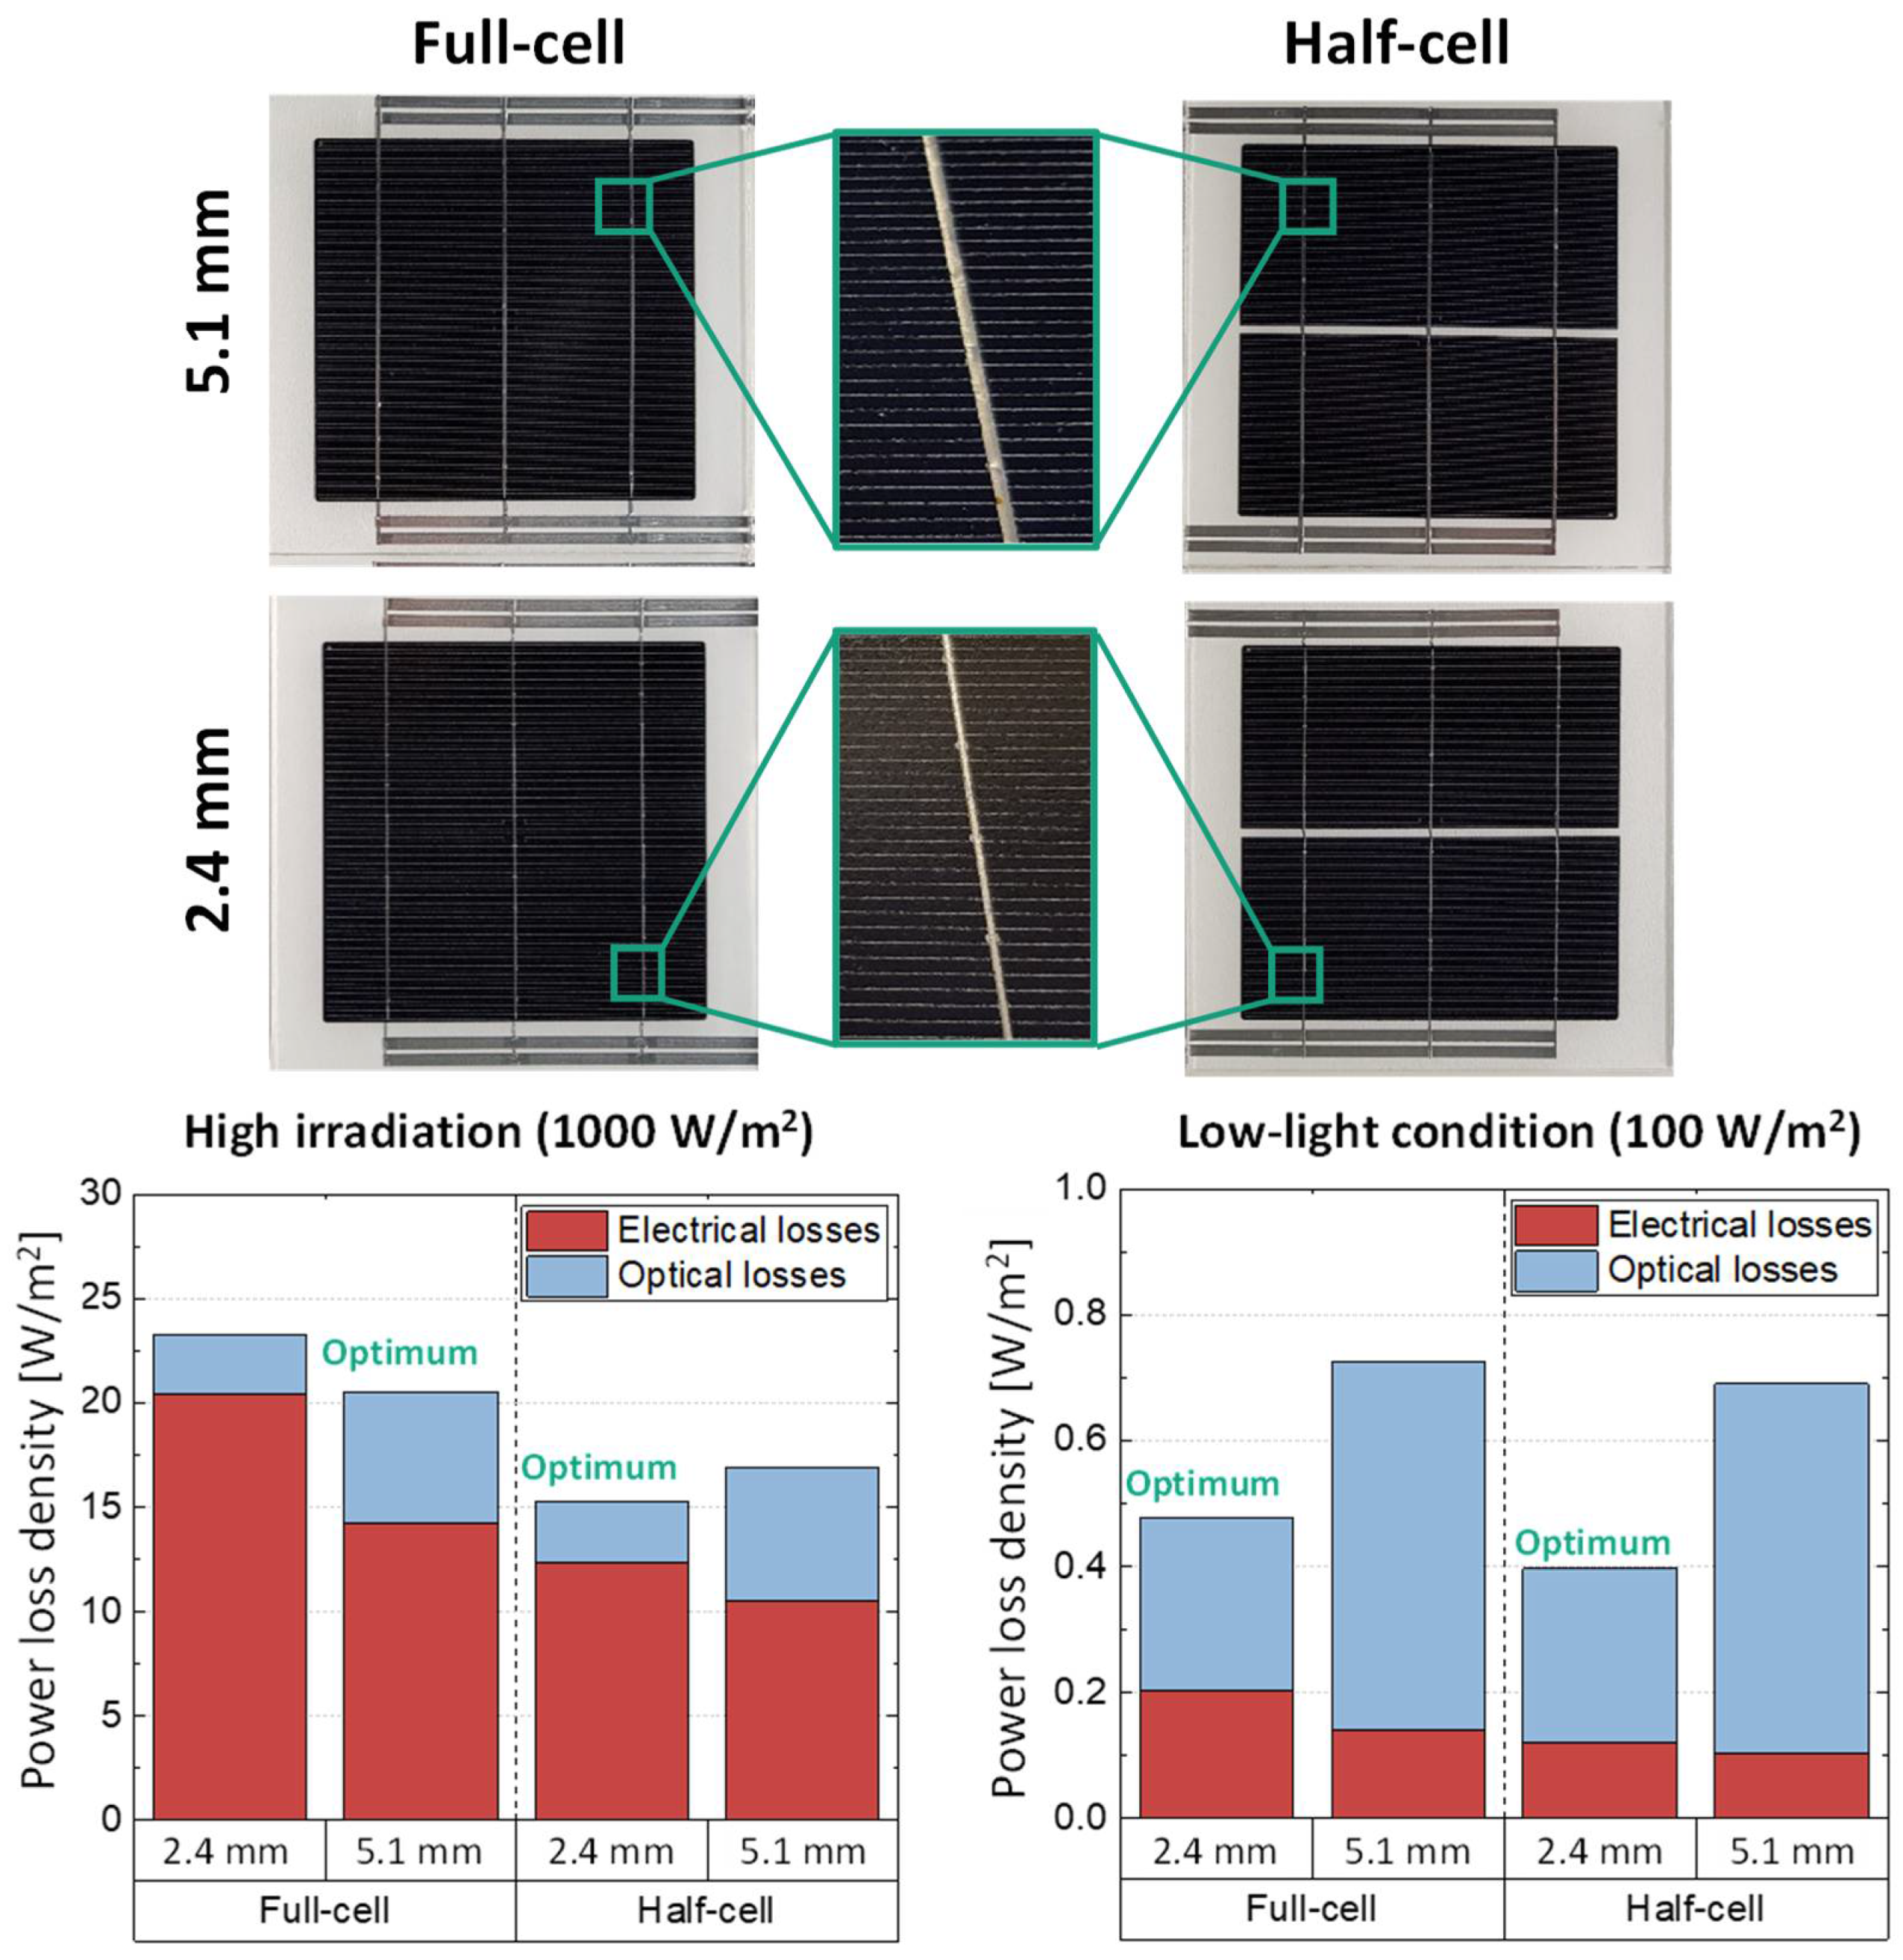
2.1. Increased Optical Gains and Reduced Electrical Losses

The electrical current of a solar cell has a linear dependence on its area [48], and the ohmic losses in conducting parts have a quadratic relationship with the current flowing through them [49,50]. By cutting the solar cells in half, the electrical current is reduced by half, consequently leading to four times lower ohmic losses and a better fill factor [8,49,50,51,52]. This is the one of the best designs for the emerged large-size wafers, which produce a high current and consequently higher ohmic losses.
Furthermore, the back reflection of light rays inside the PV laminates can lead to a slight gain in the short-circuit current by influencing the edges of the solar cells [50,53,54]. The half-cell modules benefit from an increased gain in the short-circuit current due to the increased active area influenced by the back reflections from cell spacing between the half cells [50].
Figure 2 depicts the schematic comparison of the back-reflected light over the edges of the solar cells in both full-cell and half-cell module layouts and highlights the increased active area influenced by the back reflections in the half-cell design compared to the full-cell design.
To compare the influence of the design transition from full-cell to half-cell, two PV modules with 72-cell full cells and an equivalent half-cell module with 144 half cells were fabricated from the exact same bill of materials (BOM). Indoor characterization results under Standard Test Conditions (STC) with an AAA sun simulation show that the half-cell modules benefited from a gain of up to 3% in the short-circuit current due to the increased optical gains and a 1.4% gain in fill factor due to the reduced electrical losses [55]. This led to a relative gain of almost 4.5% in power for the half-cell module compared to the equivalent and comparable full-cell module [55]. Figure 3 demonstrates the comparison between the fabricated full-cell and half-cell modules as well as their current–voltage (IV) curves and electrical characteristics.
However, cutting solar cells leads to a slight efficiency loss in solar cells due to recombination and shunt losses induced by the laser-cutting process [56,57]. Yet, at the module level, the efficiency loss due to the laser process is not only compensated for but also leads to an extra gain in efficiency due to the optical gains, and reduced electrical losses are achieved [8,46,49,58]. Figure 4 demonstrates the efficiency loss due to cutting single cells into two half cells and the efficiency gain at the module level for the PV modules manufactured from the same solar cells [46,58]. Using other laser technologies such as Thermal Laser Separation (TLS) has proven less efficiency losses compared to the state-of-the-art nano-second laser technology by avoiding defects induced by laser ablation along with the edges of the solar cell and using mechanical cleavage by thermal laser instead to decrease edge losses [46,59,60].

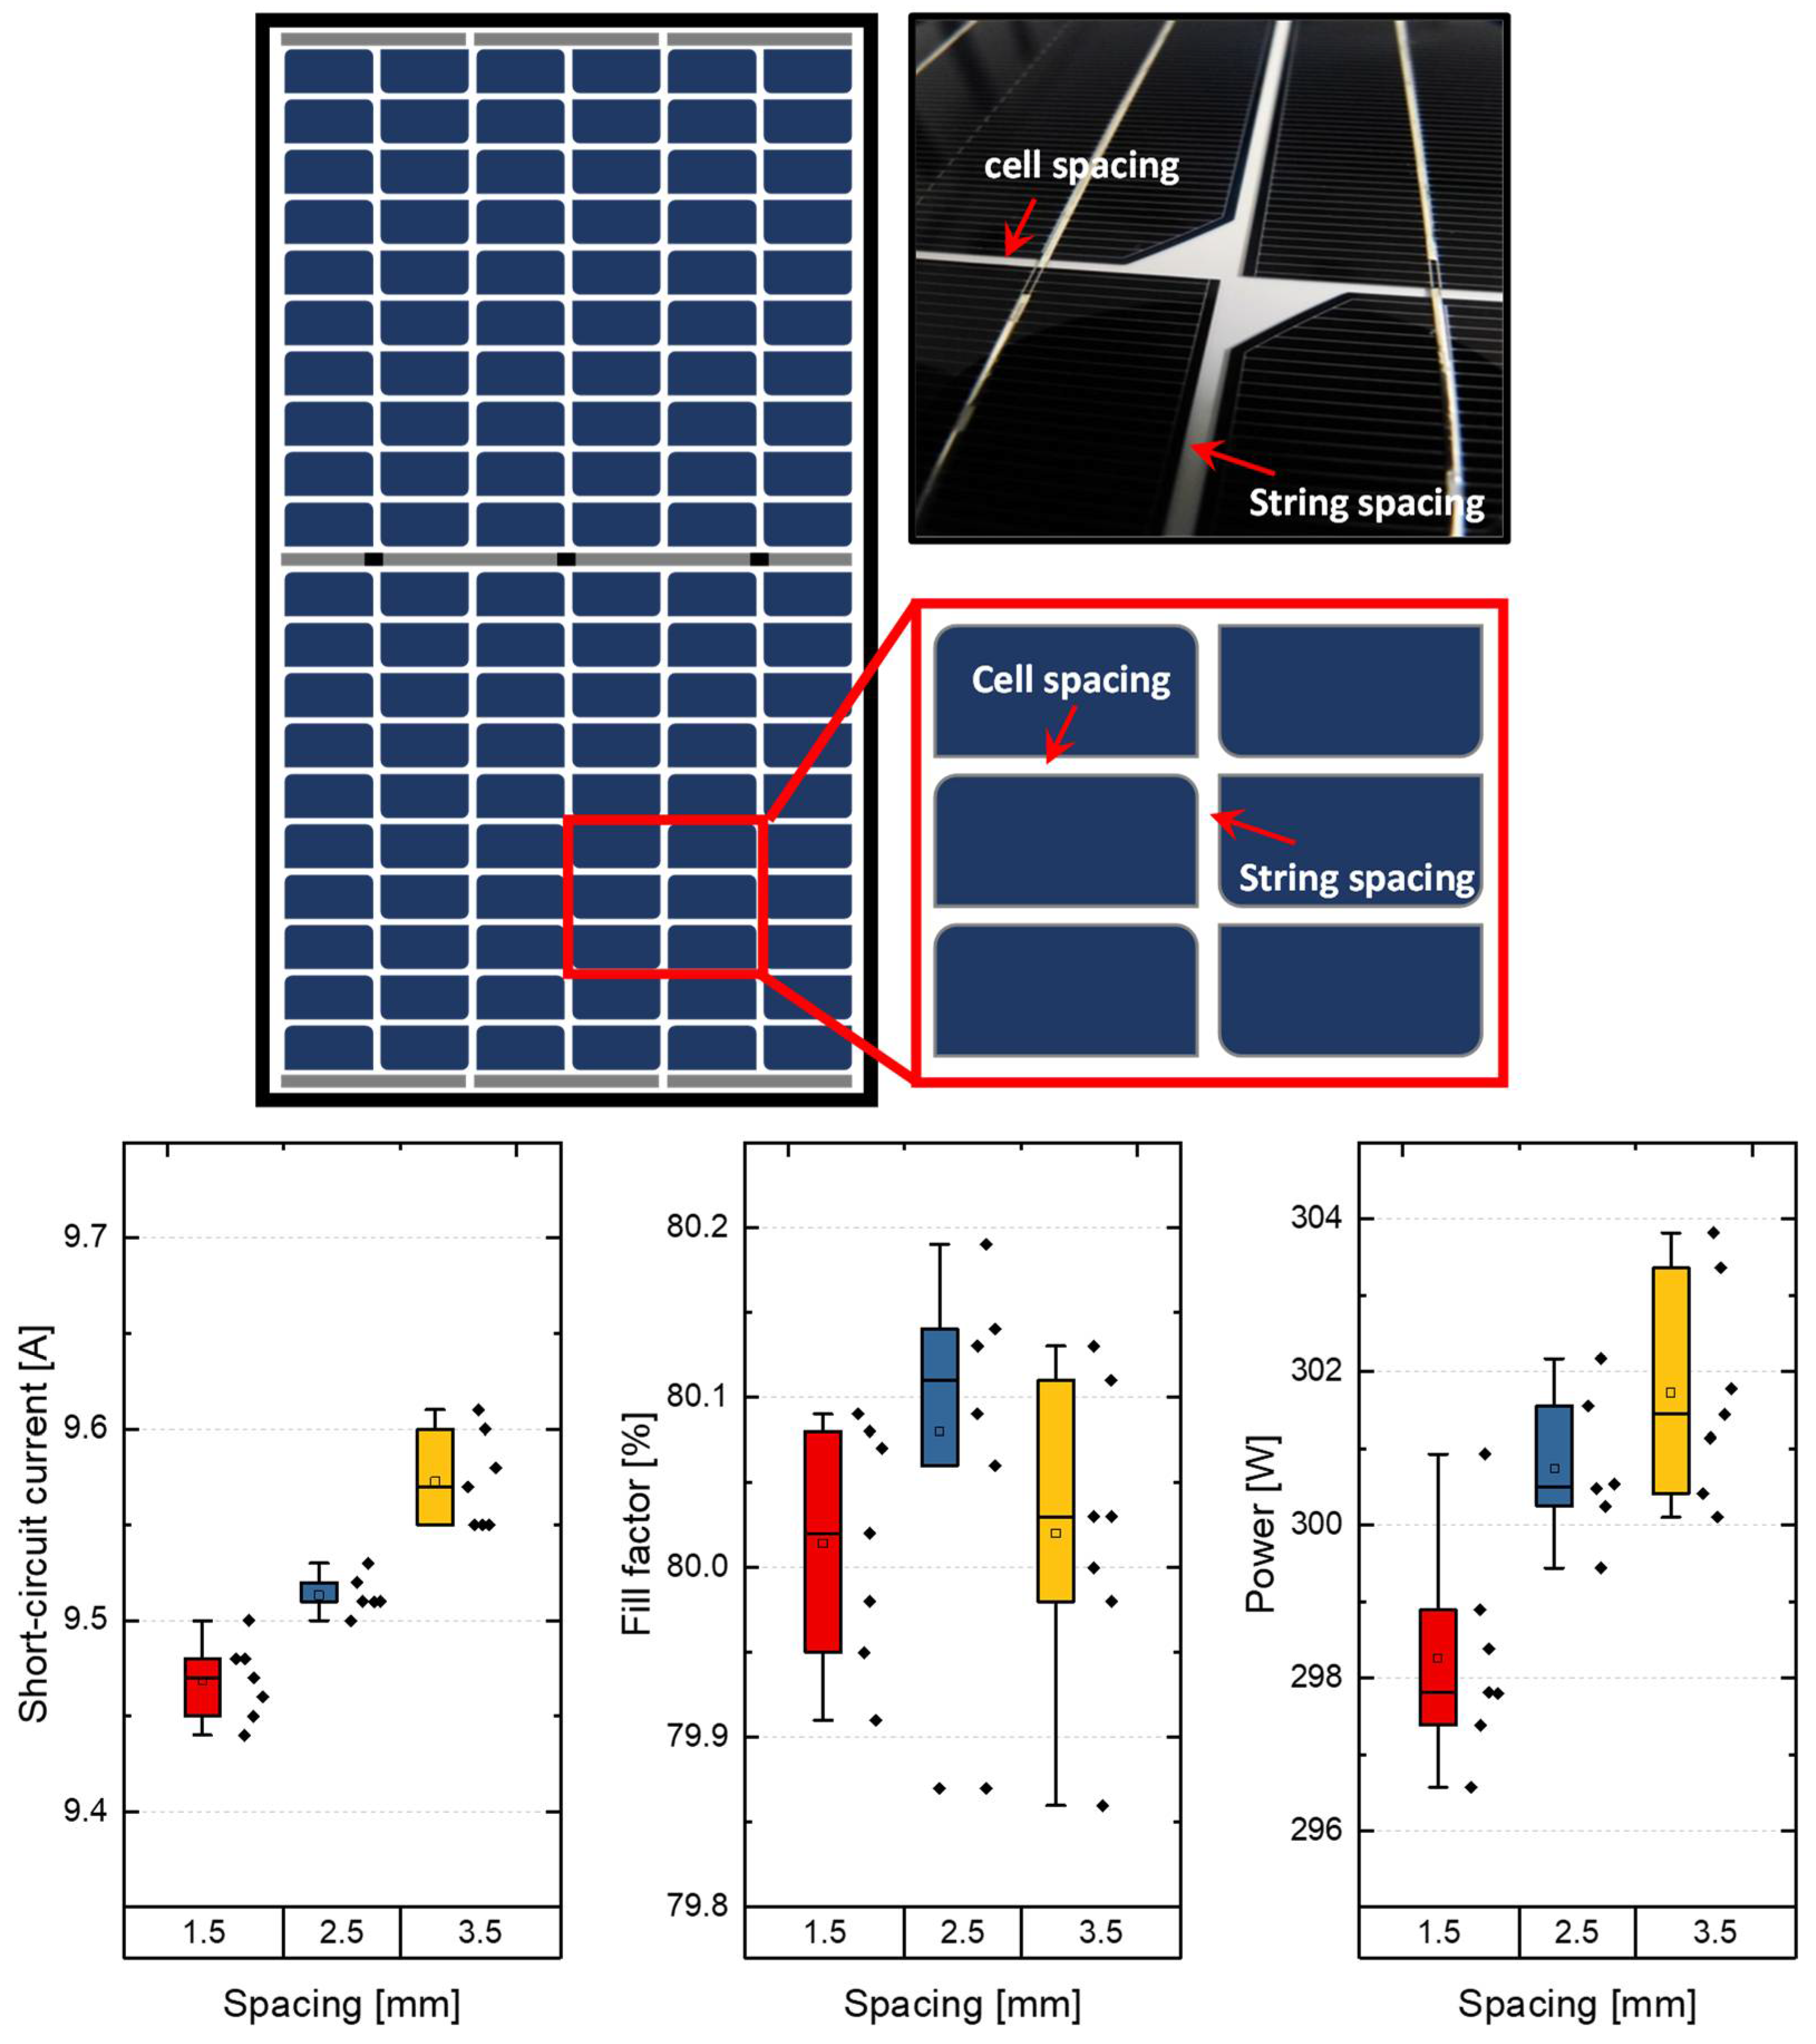
2.2. Effect of Spacing in Module Level

By considering the current gain which can be gained from optical reflections between cell/string spacing, further optimization is limited to the glass sizes available in the market by considering the 61730-1 [61] for electrical safety can be performed. We fabricated and studied 20 PV modules with 120 half-sized solar cells in three groups with 1.5 mm, 2.5 mm and 3.5 mm cell and string spacings. The 61730-1 standard ensures electrical safety for the electrically conductive module components at the module edge. The total inner inactive area of the module, by considering the area shaded by the module frame, was calculated.
After electrical characterization, the modules with more spacing between the cells and strings showed a higher gain in the short-circuit current. The measured short-circuit current of PV modules increased between 0.4–0.6% by for every 1 mm more spacing between the cells and strings and contributed up to nearly 1.2% gain in module power from 1.5 mm to 3.5 mm spacing group (see Figure 5). It should be noted that the stack design and bill of materials (glass and backsheet properties) can influence this gain significantly [62,63].

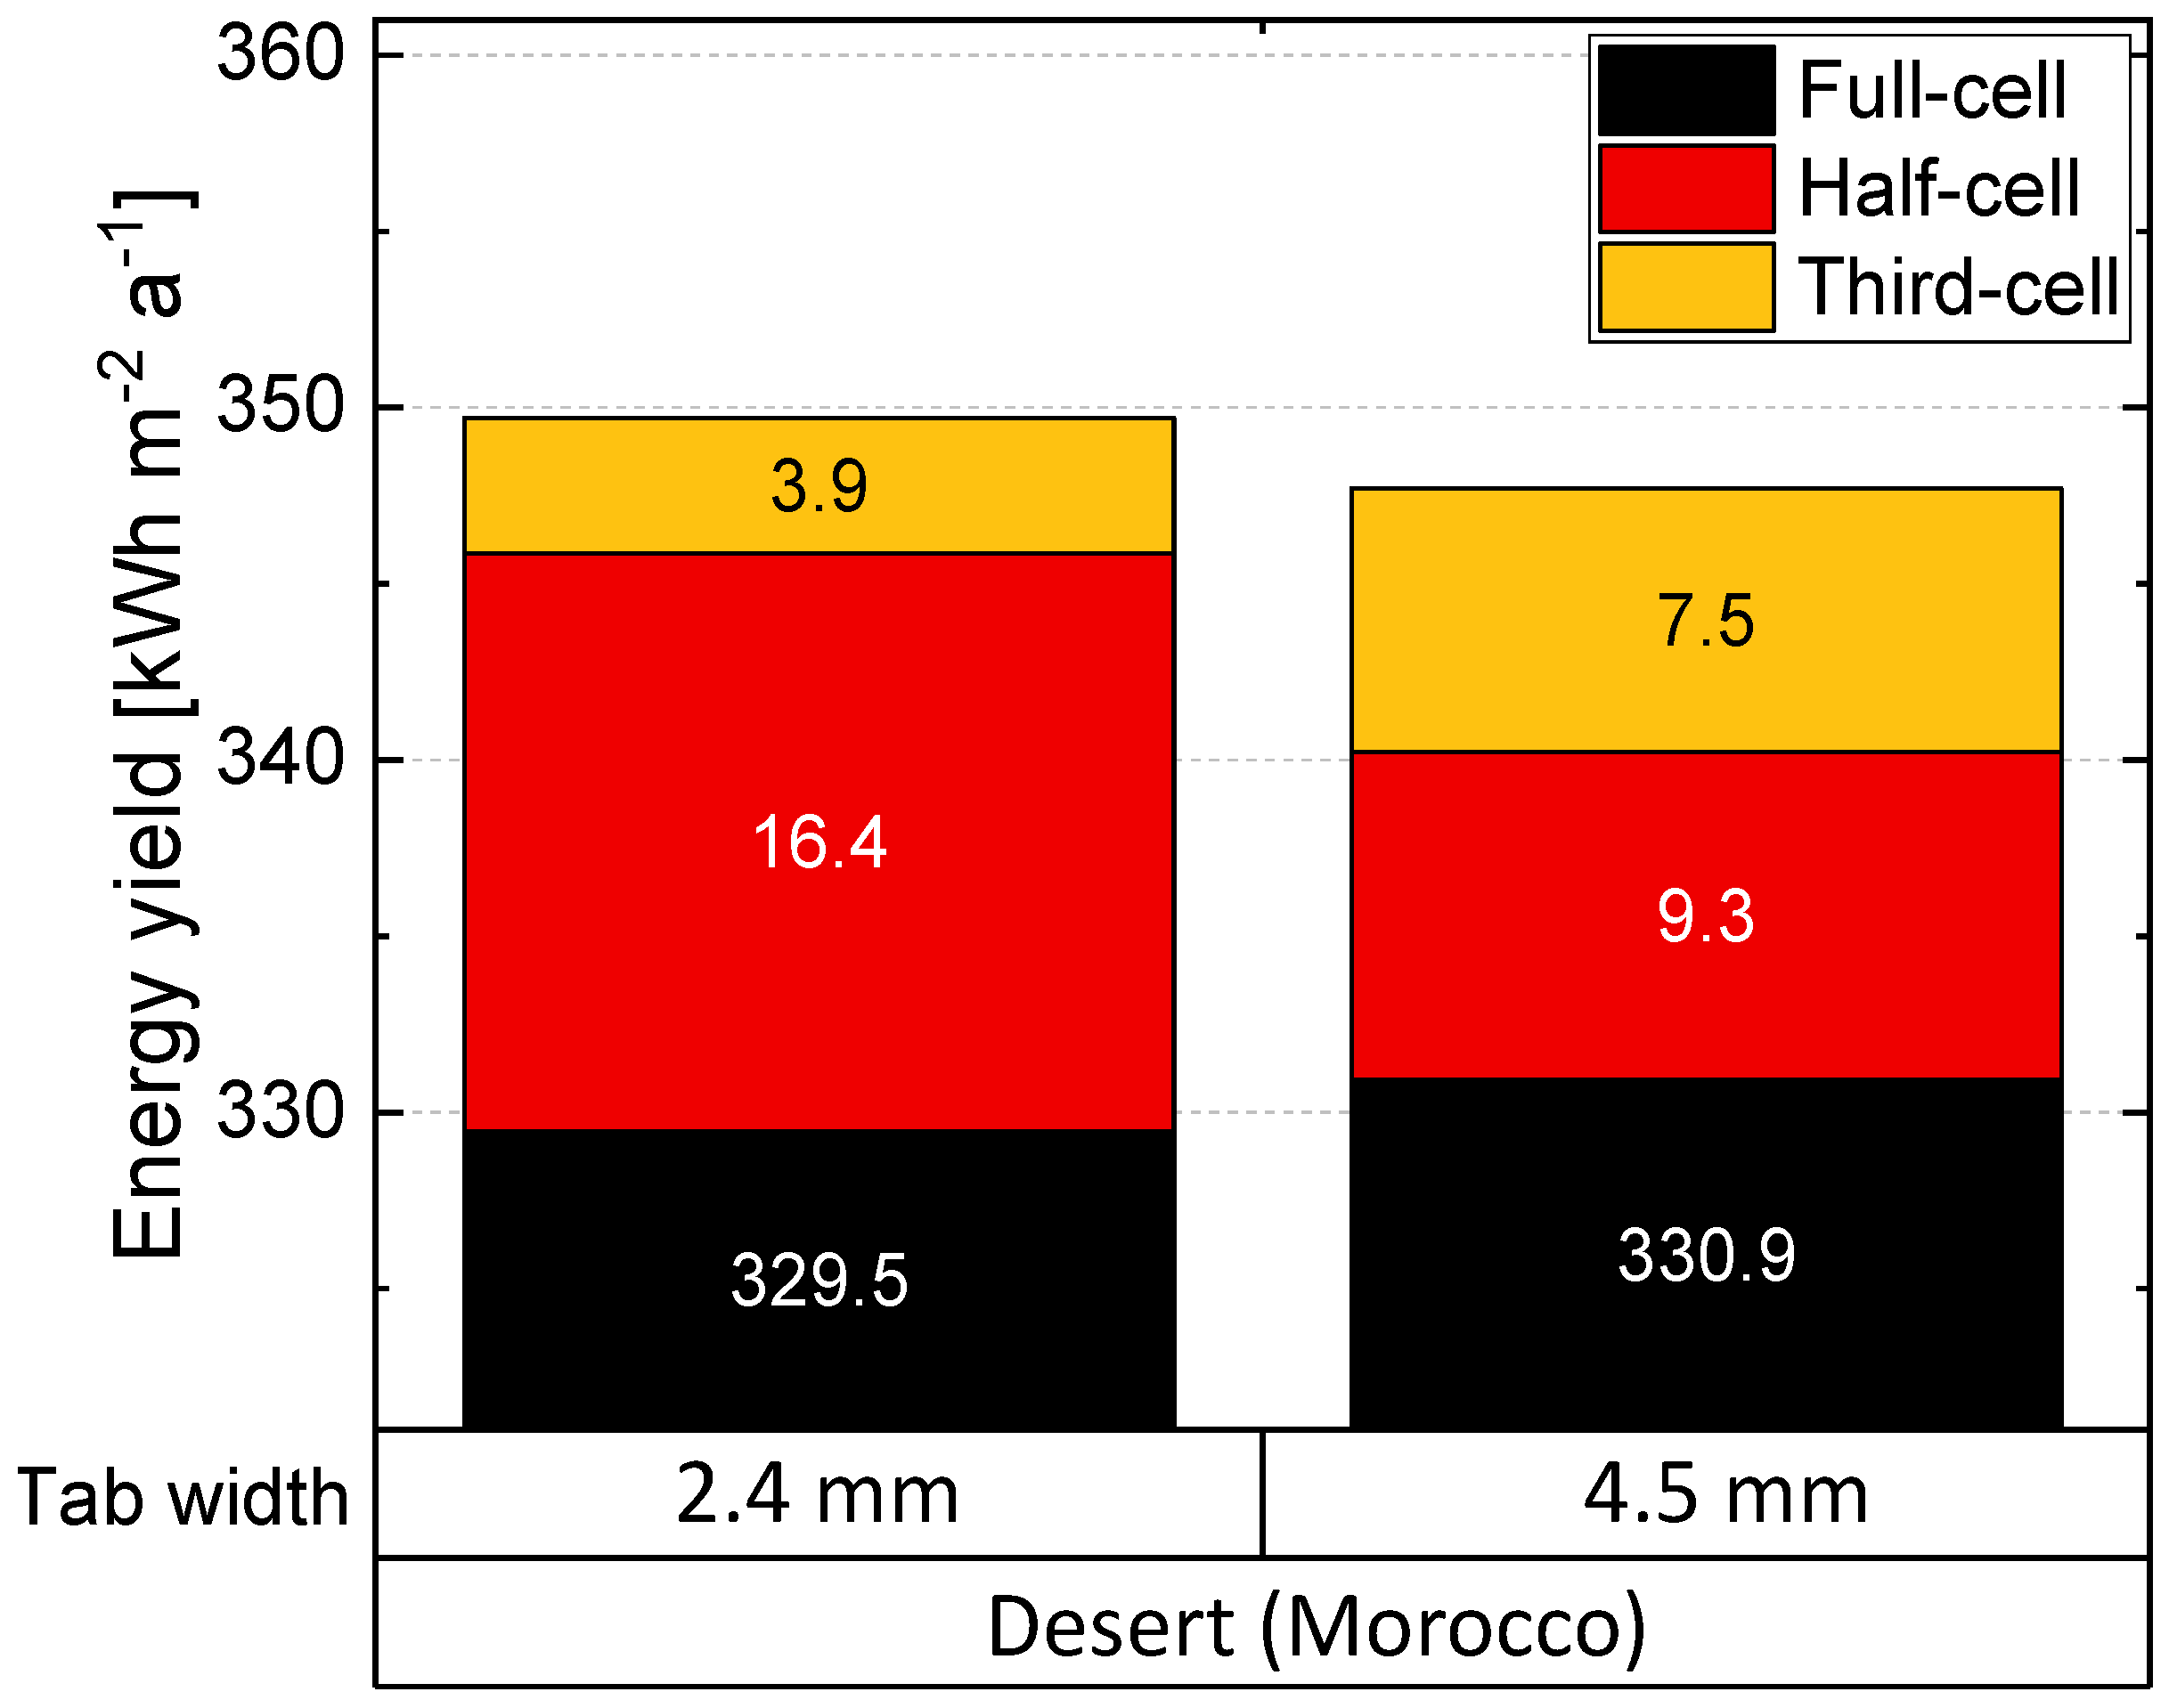
2.3. Optimized Tab Width

Reduced electrical losses in interconnecting tabs of the half-cell modules due to the halved flowing current through the tabs open up an opportunity for further reduction in tab width and release the active area of the solar cell shaded below the tab (optical losses) by accepting slight ohmic losses (electrical losses) [8,49,58]. Figure 6-left demonstrates the schematic view of the half-cell module with a reduced tab width, as well as the additional illuminated area, which was previously shaded under the tab. Our previous works on the optimization of tab width for half-cell and full-cell modules show that the optimized tab width of half-cell modules is half of the width used for an equivalent full-cell module (see Figure 6-right) [8,14,46,49]. This leads to a gain in the short-circuit current by releasing the active area below the tab as well as a significant decrease in components’ costs due to the reduced price per kilograms paid for the copper tabs. The optimized tab width is relevant to the number of busbars and the nominal current of the solar cell.
The advantage of reduced electrical losses and increased optical gains are even more important in places with high irradiation levels. In places with high irradiation levels, such as deserts, the current generated over time is significantly higher than in places with low-light conditions. In places with high irradiation levels, the dominant loss mechanism is electrical losses in the interconnecting tabs, and therefore, the full-cell module with a wider tab width shows a better efficiency compared to the same layout with a narrower tab width. However, due to four-times reduced electrical losses in half-cell modules, the half-cell module with a wider tab width shows reduced electrical losses but higher overall losses compared to the half-cell module with a narrower tab width. Under high irradiation levels, the half-cell module with a narrower tab width shows the least overall power loss. In low-light conditions, the optical losses from shading of the active area of the cell by the tab is the dominant loss mechanism, and the optimized tab width for both half-cell and full-cell modules is the narrower tab width [49].

2.4. Cell-to-Module Power Ratio and Increased Yield

Shifting to the half-cell module and optimizing the tab width leads to an increased gain in the efficiency of PV modules. However, increased spacing between the solar cells leads to a larger module size, which decreases the total efficiency of PV modules. In [59], the inactive perimeters inside the PV modules were kept constant, and 100 mini-modules were fabricated from solar glass with no anti-reflective coating, solar cells with the dimension of 156 mm × 156 mm, two tab dimensions with the widths of 0.8 mm and 1.5 mm and finally two module layouts of full cells and half cells (see Figure 7).
Then, the PV modules were measured, and the cell-to-module power ratio (CTM) of the PV modules, which is the ratio of the PV module power over the total power of the solar cells inside the module before fabrication, was revealed [62,64,65]. A comparison of the cell-to-module (CTM) results show while the cell-to-module power ratios of the full-cell modules ranged between 93% and 97%, the cell-to-module power ratios over 100% were achieved for the half-cell modules made from the same materials (see Figure 8) [58]. The half-cell module with a narrower tab width could gain an extra 2% in CTM value compared to the wider tab width, achieving 102% for the half cell.
Further energy yield evaluations including the third-cell modules with M2-size wafers and the above-mentioned tab dimensions were performed in Morocco [58].
The measurement results of the third cell showed a gain up to 103% for third-cell modules. However, due to technological limits of the width of the busbar print over the solar cells, narrowing the tabs below the width of the busbar had no impact on optical gains and only increased the electrical losses. Therefore, by looking at the energy yield evaluation data, the total gain from the full cell to half cell was significantly higher (four times) than the gain from the full cell to third cell (see Figure 9) [46]. However, it should be noted that third-cell modules can harvest more relative energy compared to the half-cell modules by utilizing a larger wafer size, above M10, and by using alternative tabbing technologies such as wires over very narrow busbars.

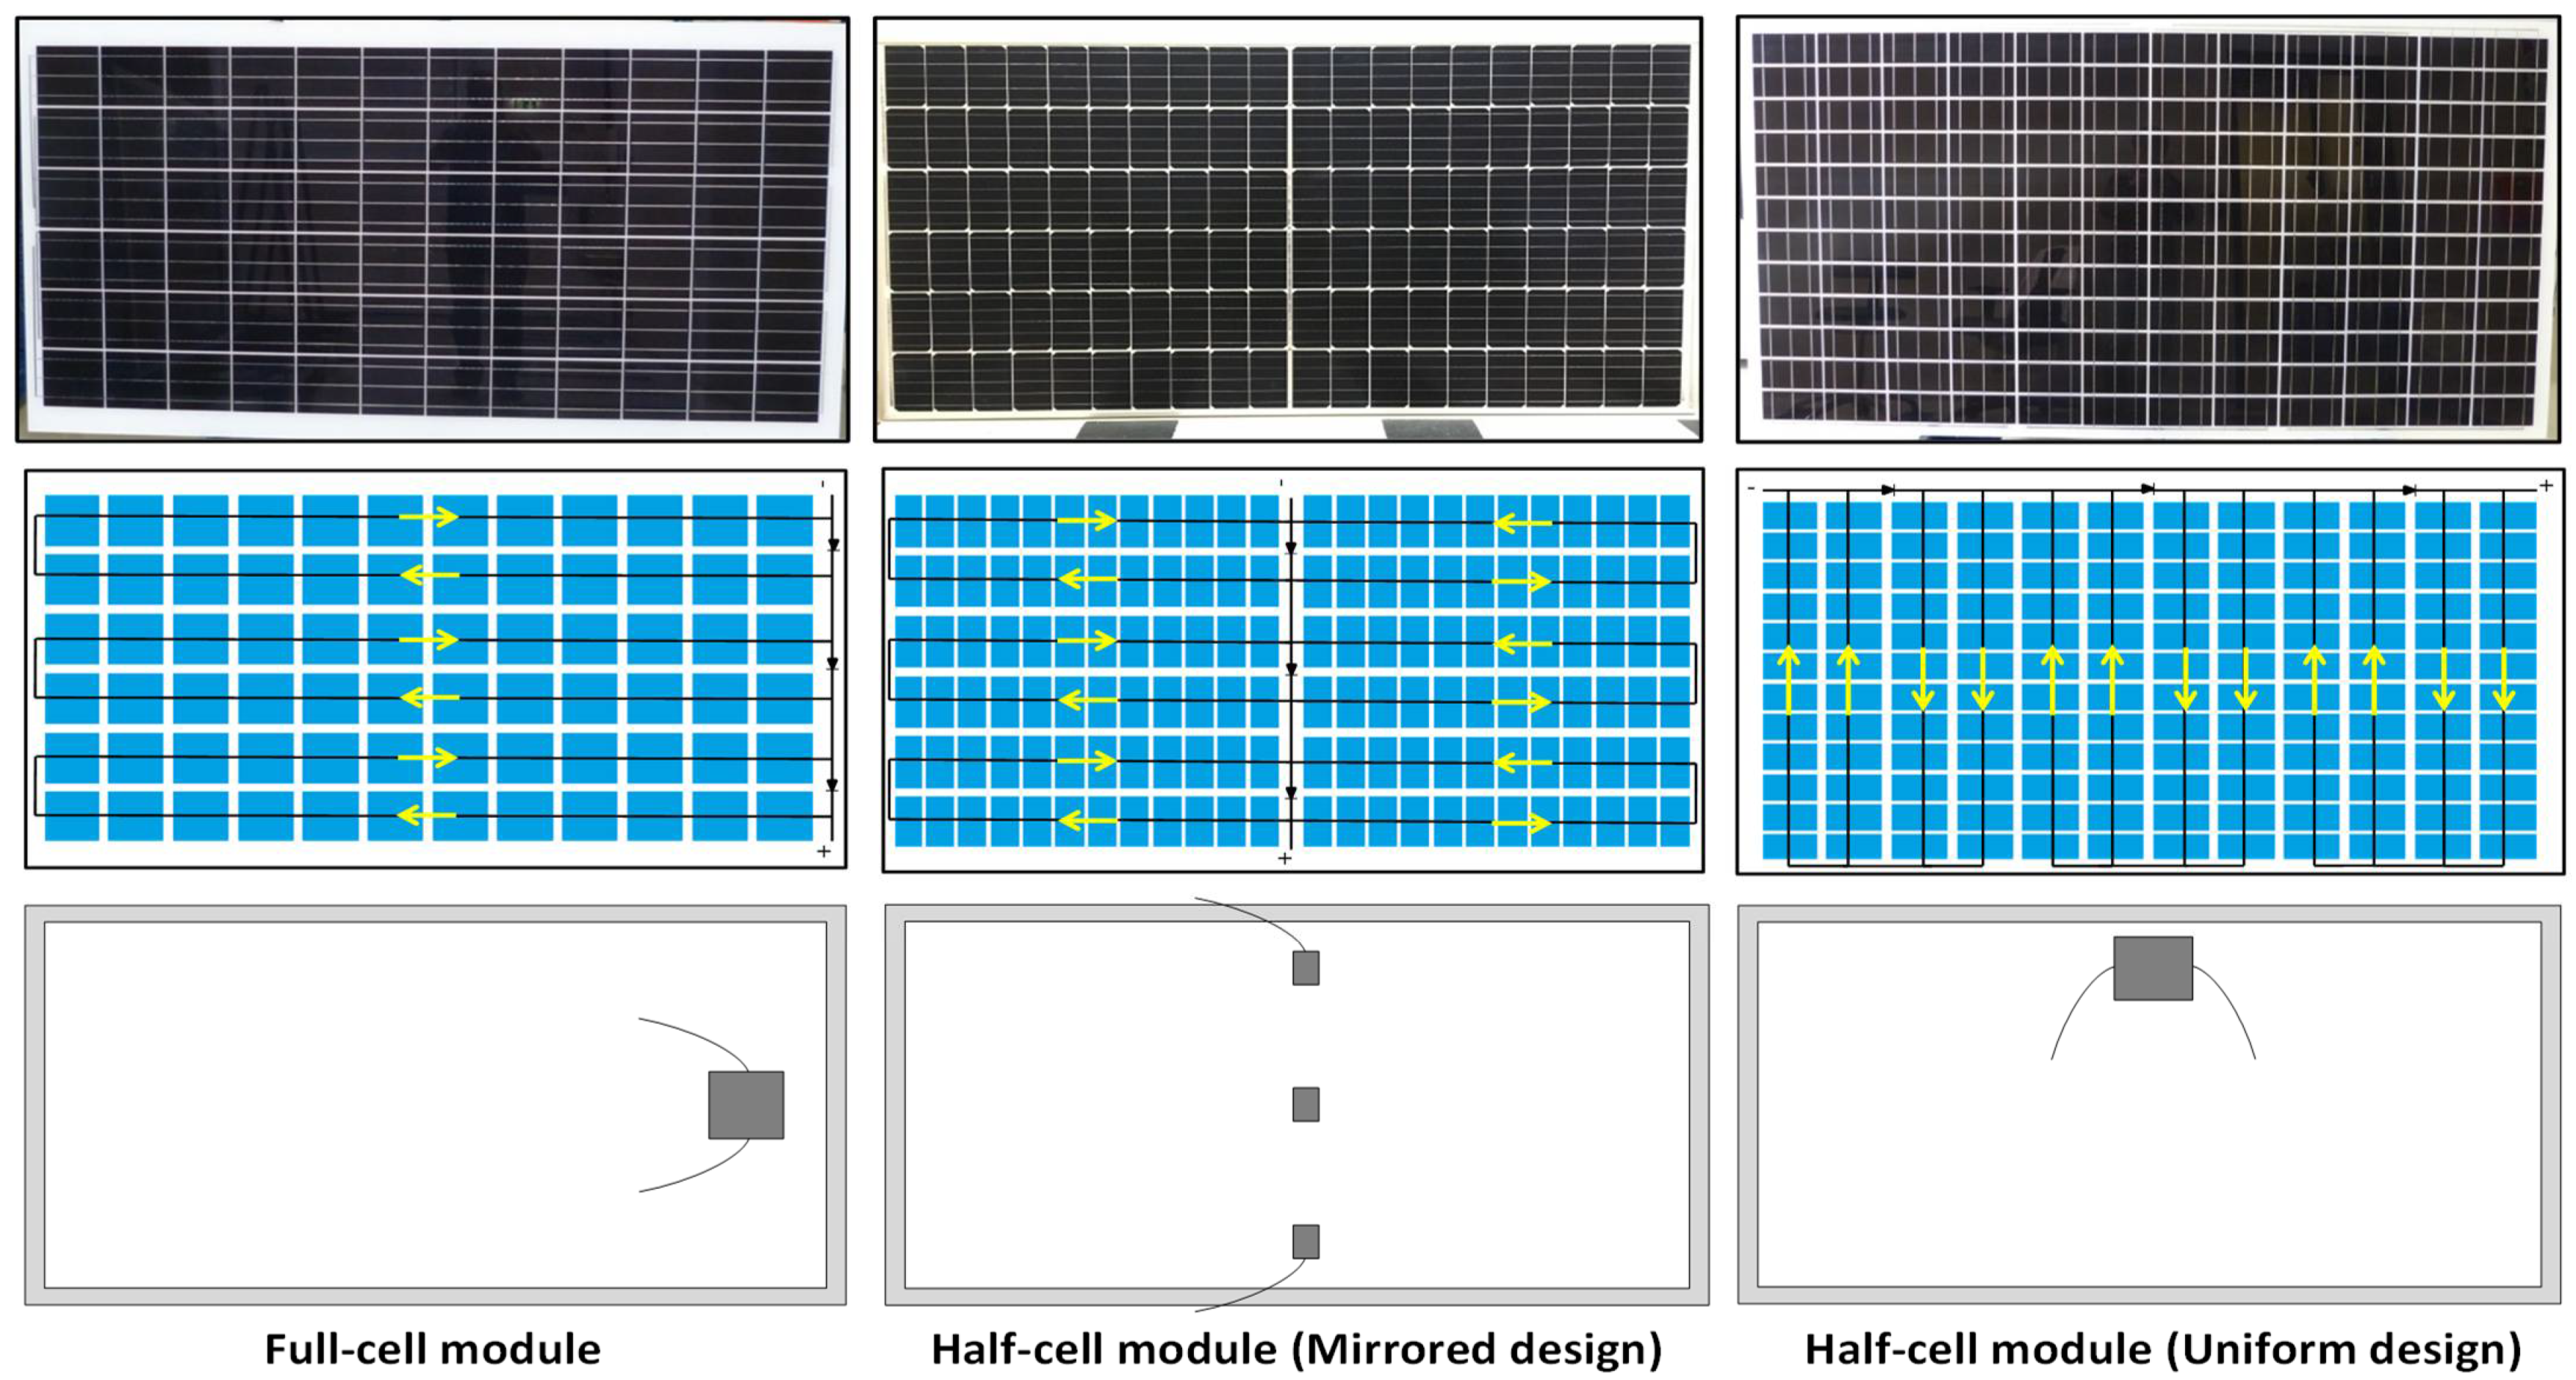
2.5. Interconnection Design and Manufacturing Feasibility

The typical full-cell PV modules are made from 60 or 72 full-size solar cells, which are all connected in series. Typically, 20 or 24, or, as has been seen in some modules, 26 solar cells, in a series are protected by a bypass diode which is in a junction box mounted on the rear side of the PV module (see Figure 10). The state-of-the-art half-cell modules (mirrored design) in the market follow the interconnection design shown in Figure 10. The half cells are connected to each other in a series in both the top and bottom half of the PV module. Then, both series-connected half-cell blocks are connected in parallel in the terminals to the junction boxes. Due to special design of this module, the bypass diodes and, consequently, the junction boxes, need to be distributed and decentralized in three small junction boxes, each containing one bypass diode mounted in the middle of the PV module. Having three junction boxes requires extra cutting and modified lay-up processes, and slightly higher costs due to use of three but much smaller junction boxes. Another design of half-cell modules is the half-cell modules with a uniform design, where the solar cells are connected in series in each sub-string. Every sub-string is connected in parallel with the neighboring sub-string. Finally, all twin sub-strings are connected in series. This design has more flexibility for positioning the junction box. The junction box in this design can be both decentralized (similar to standard the half cell with a mirrored design) or centralized (similar to the standard junction boxes for full-cell modules) (see Figure 10).

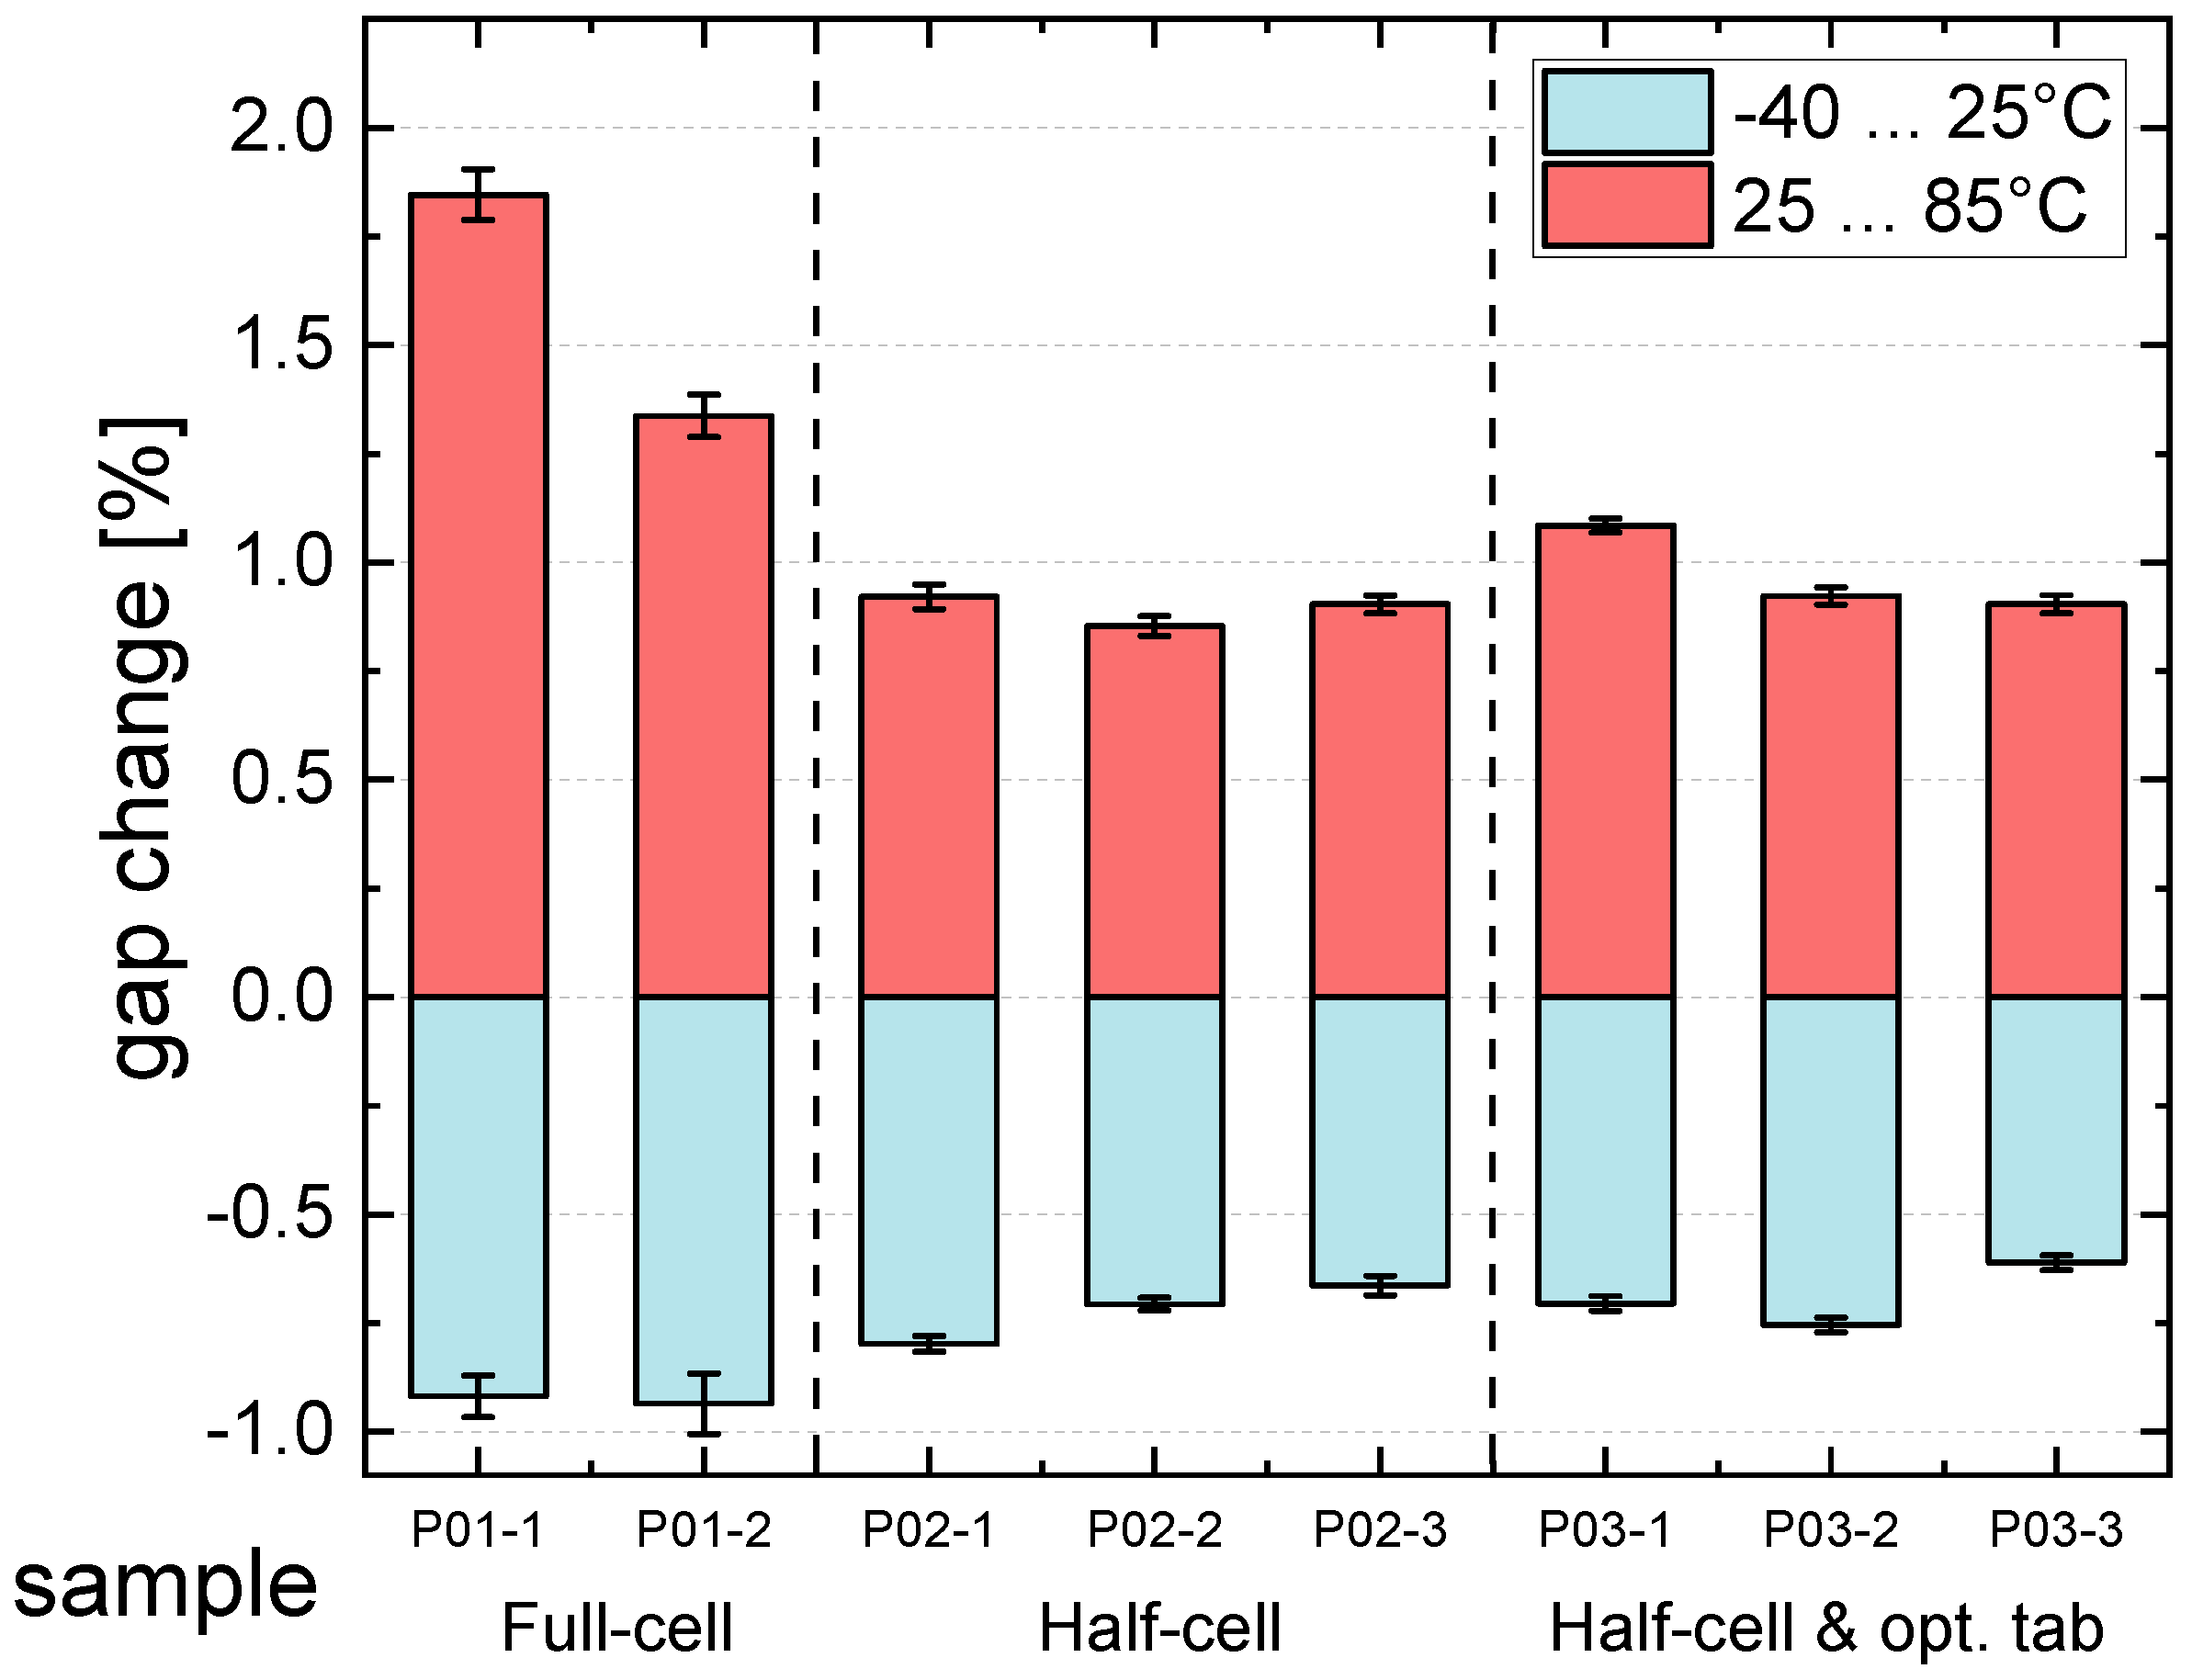
2.6. Durability and Fatigue of Interconnecting Tabs

As shown in Figure 1, in desert areas, the temperature changes between night and day are up to two times higher than in moderate climates, leading to the breakage of tabs due to thermal cycling [8,67]. In [8], cell displacement due to thermal cycling for PV modules with different designs was evaluated. The samples were mini-modules with three four-busbar full-size equivalent solar cells (or six half-cut cells) and two tab dimensions of 1.2 mm and 0.8 mm per tab piece. Sample groups of P01, P02 and P03 represent a full cell (1.2 mm tab width), half cell (with a 1.2 mm tab width) and half cell with optimized tabs (0.8 mm tab width). The simulations showed that the optimized tab width for this specific four-busbar half cell could even be reduced by up to 0.6 mm, but due to manufacturing restrictions, a 0.8 mm tab width was used.
The thermal cycling test (TCT) is the standard test per the IEC 61215-2 [68] standard for checking the resistance of PV modules for the fatigue of interconnectors, solder joints, and cracks grown in crystalline solar cells. In a test procedure, the module temperature is changed by between −40 and 85 °C with a maximum rate of change of 100 K/h and a dwell time of at least 10 min at the end temperatures. The minimum number of cycles is 200, as suggested by the IEC 61215-2 type approval [68]. To evaluate module designs, the important information is the amplitude of stress applied during a thermal cycle. A possible quantification of the connector load is made by measuring the cell shifts [16,18,69]. An image correlation approach is used to evaluate the cell shifts between the gaps [8].
The comparison results between the full-cell and half-cell modules showed up to 50% less displacement between the solar cells due to reduced cell size (see Figure 11) [8]. A comparison between the half-cell modules with different tab sizes indicates that the tab width is not a big influencing factor. This makes the half-cell module with a narrower tab width a choice with a higher yield and durability [8]. This factor will be even more important for larger-size wafers over M12, leading to more reliability for third-cut cells as well.

2.7. Performance

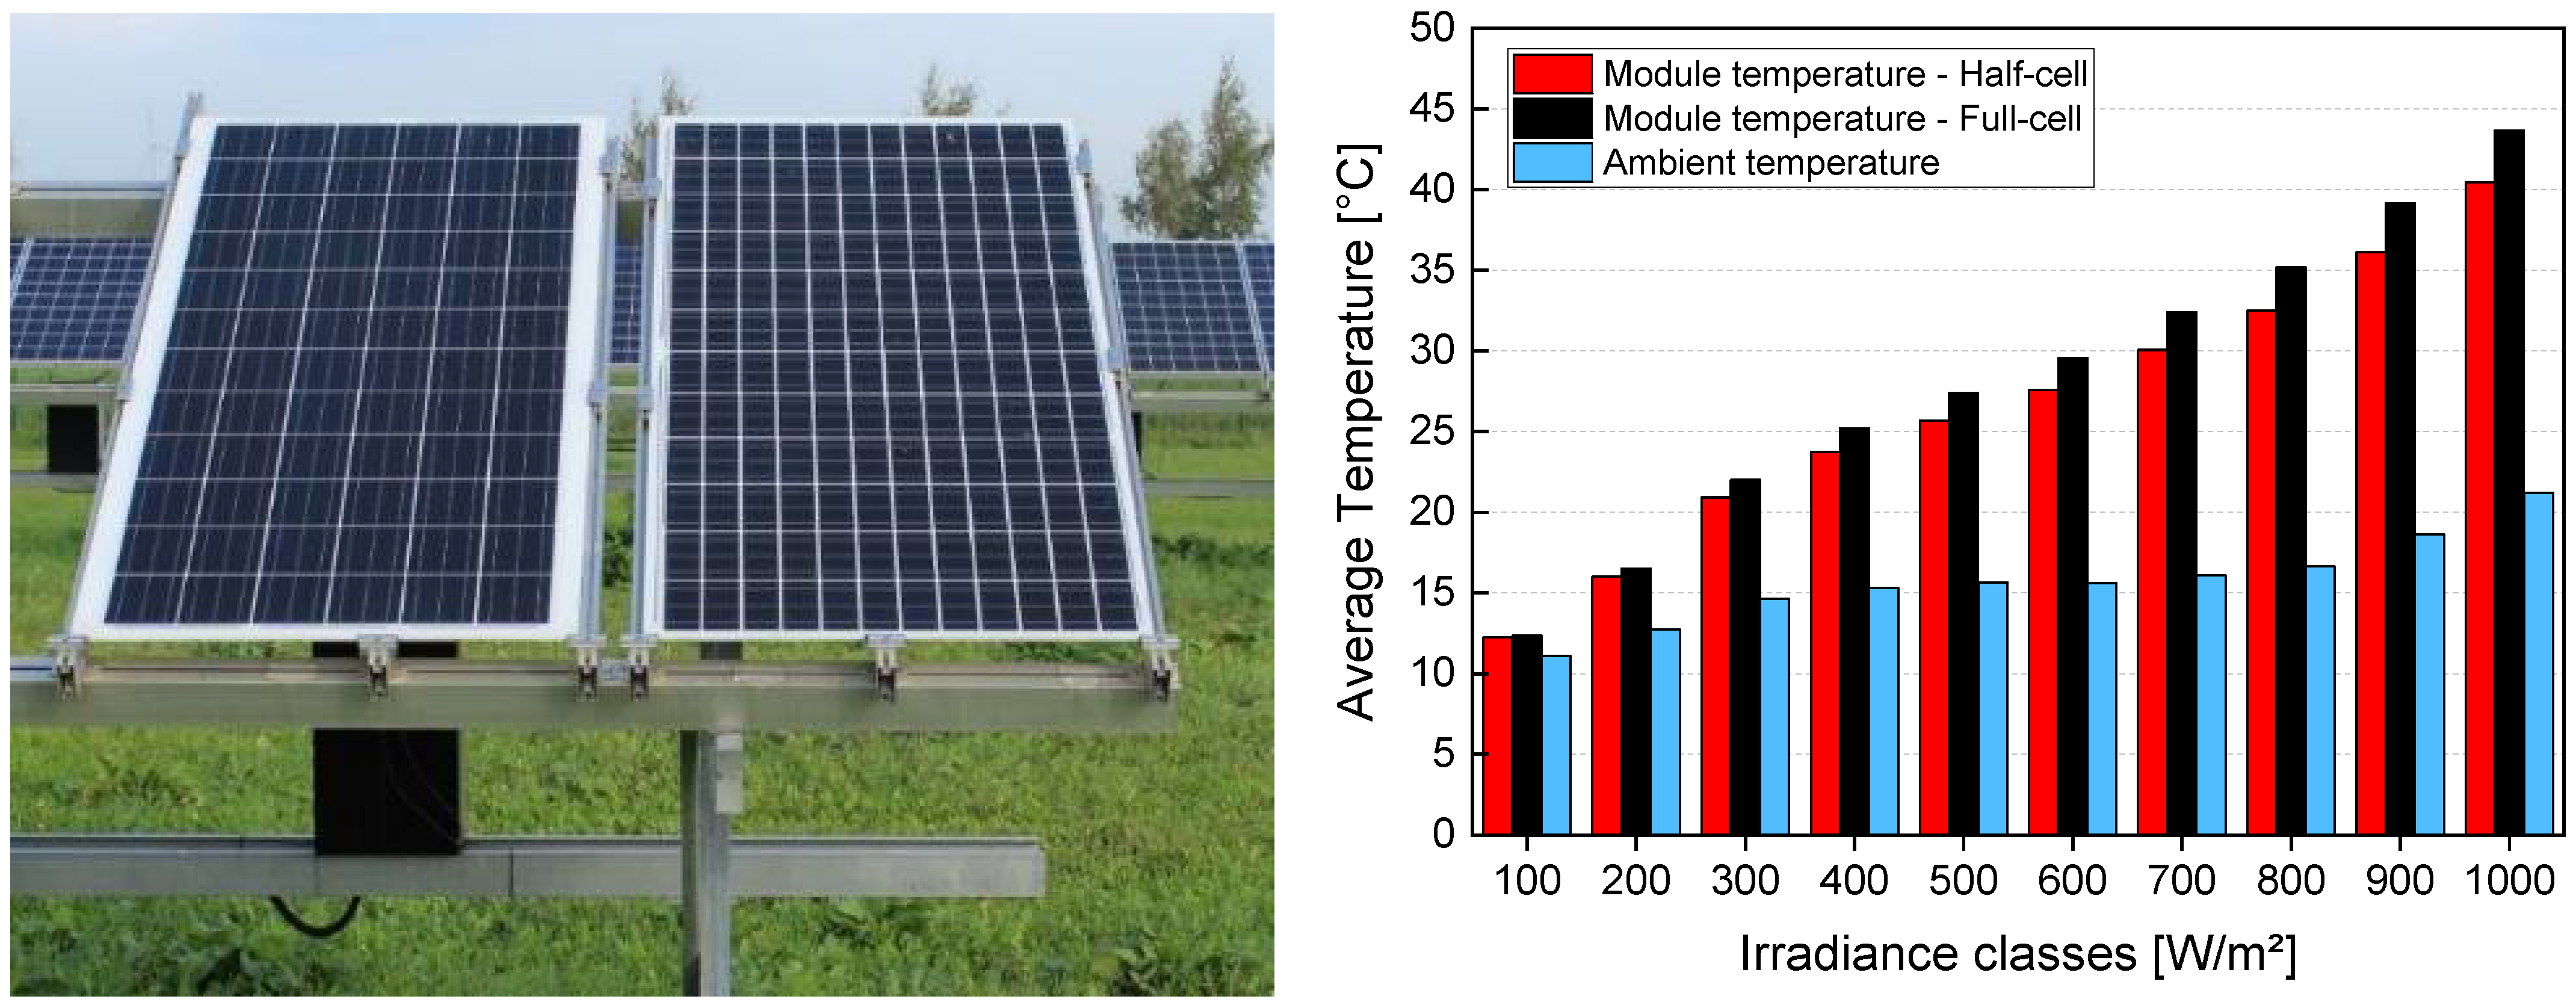
2.7.1. Thermal Performance

Half cells operate with half of the operating current of the full-cell modules, leading to almost four-times-greater ohmic losses in the interconnecting tabs. Malik et al. [70] tested the full-cell and equivalent half-cell modules with a similar bill of materials in Halle (Saale), Germany. The average module temperature (half-size and full-size cell module) was measured from 2014 to 2018 (see Figure 12). The comparison of the results shows that the half-cell module operated cooler than the full-cell module. The difference in temperature between these two modules increased further at higher irradiation levels, representing the desert conditions [49,70]. This could be related to the reduced ohmic losses in the interconnecting tab, which contributes to the module temperature [14,49,70].
Optimization of tab width for half-cell modules increases the efficiency by releasing the active area below the tabs [14,46,49,58] but also leads to higher ohmic losses. Using solar cells with a greater number of busbars can reduce the ohmic losses and consequent module temperature [14].

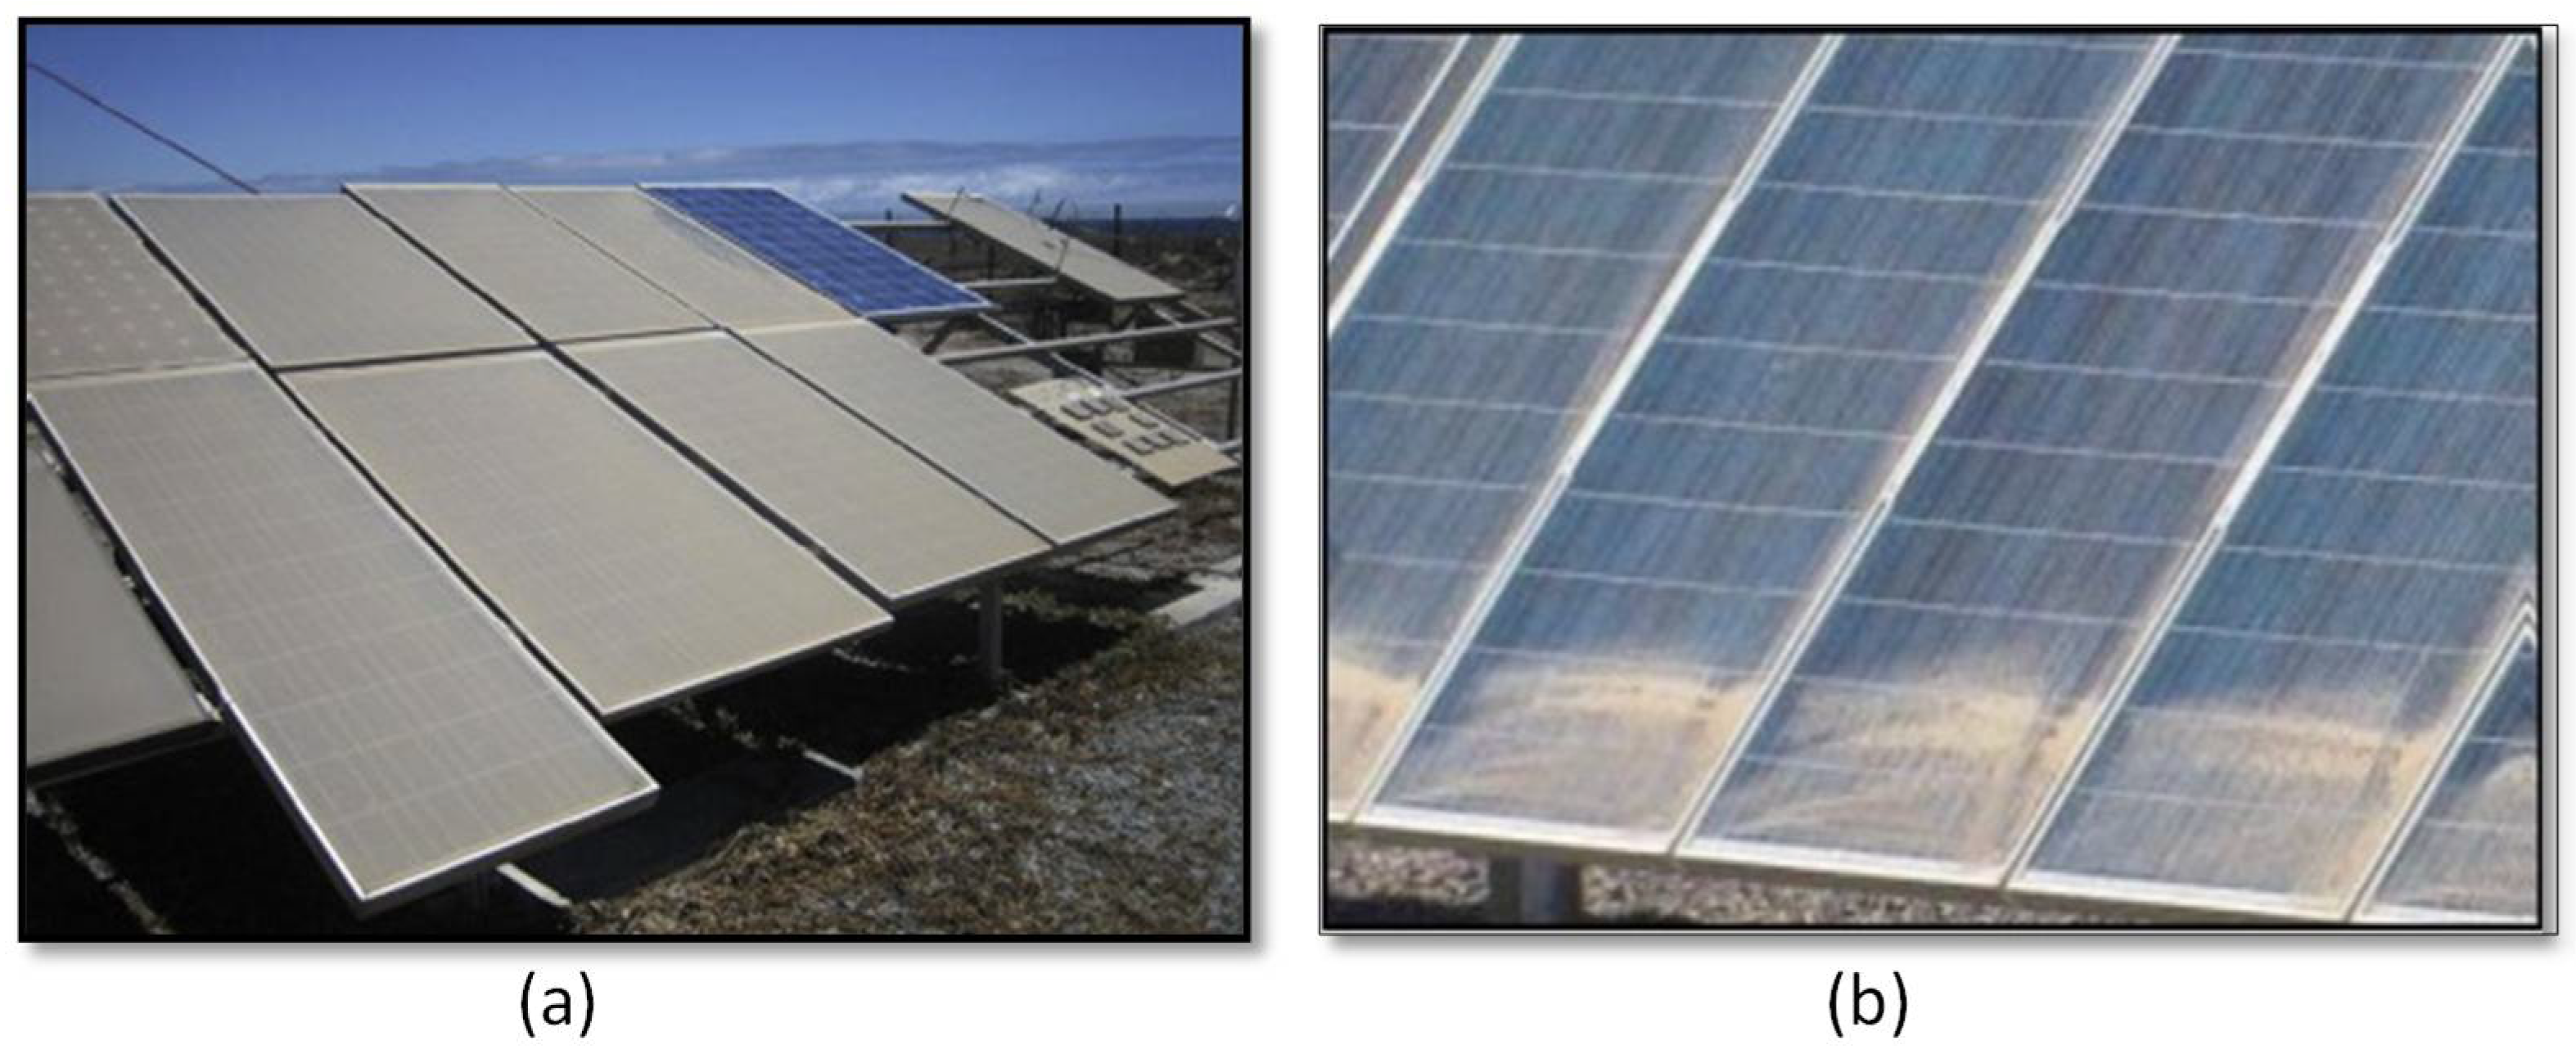
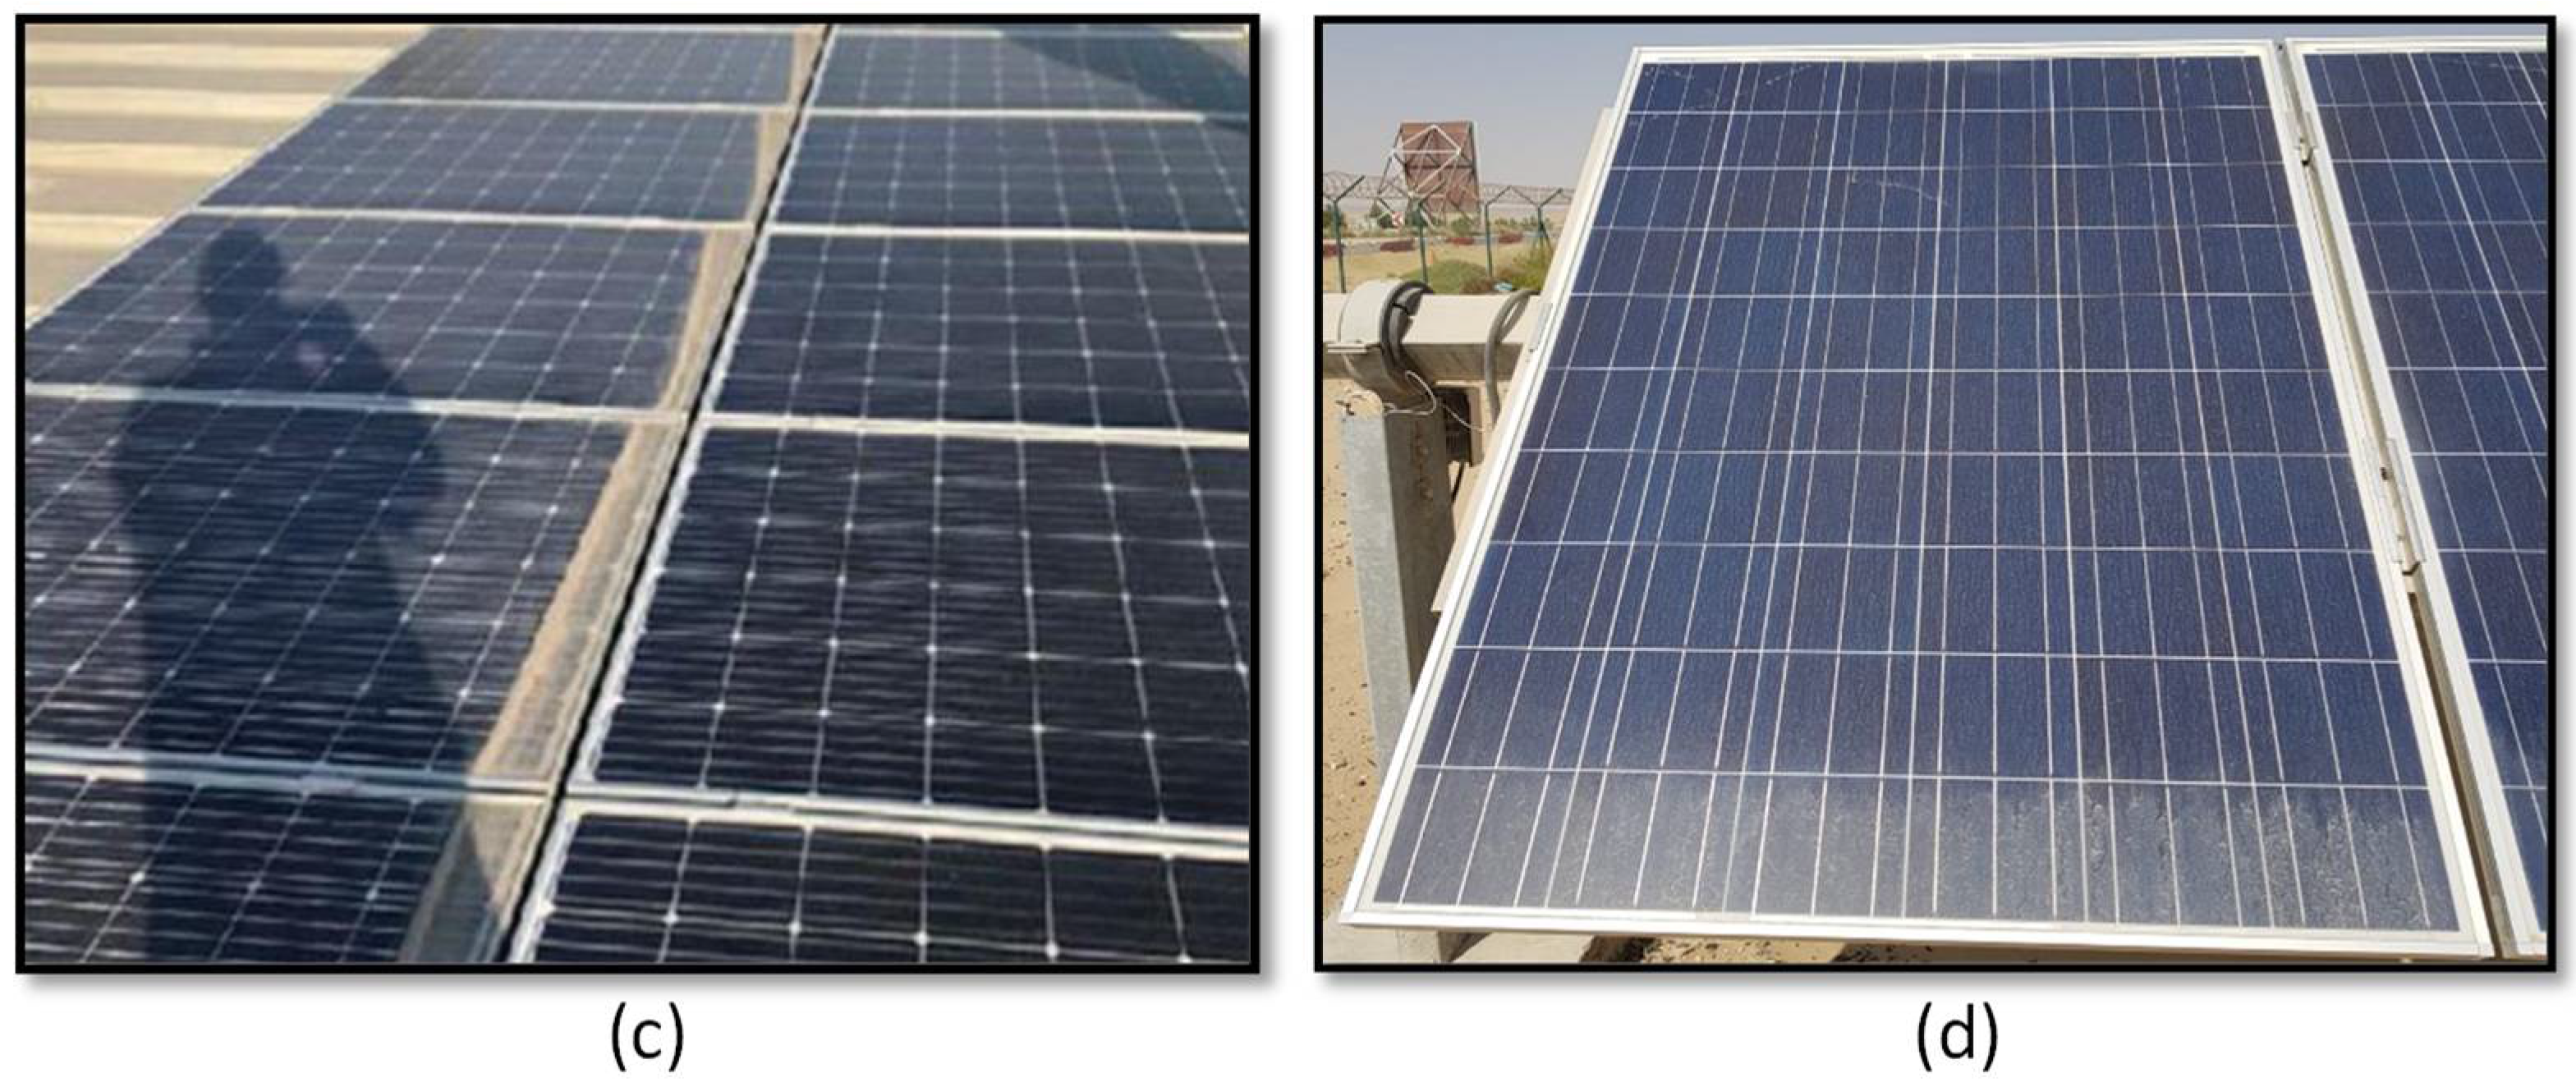
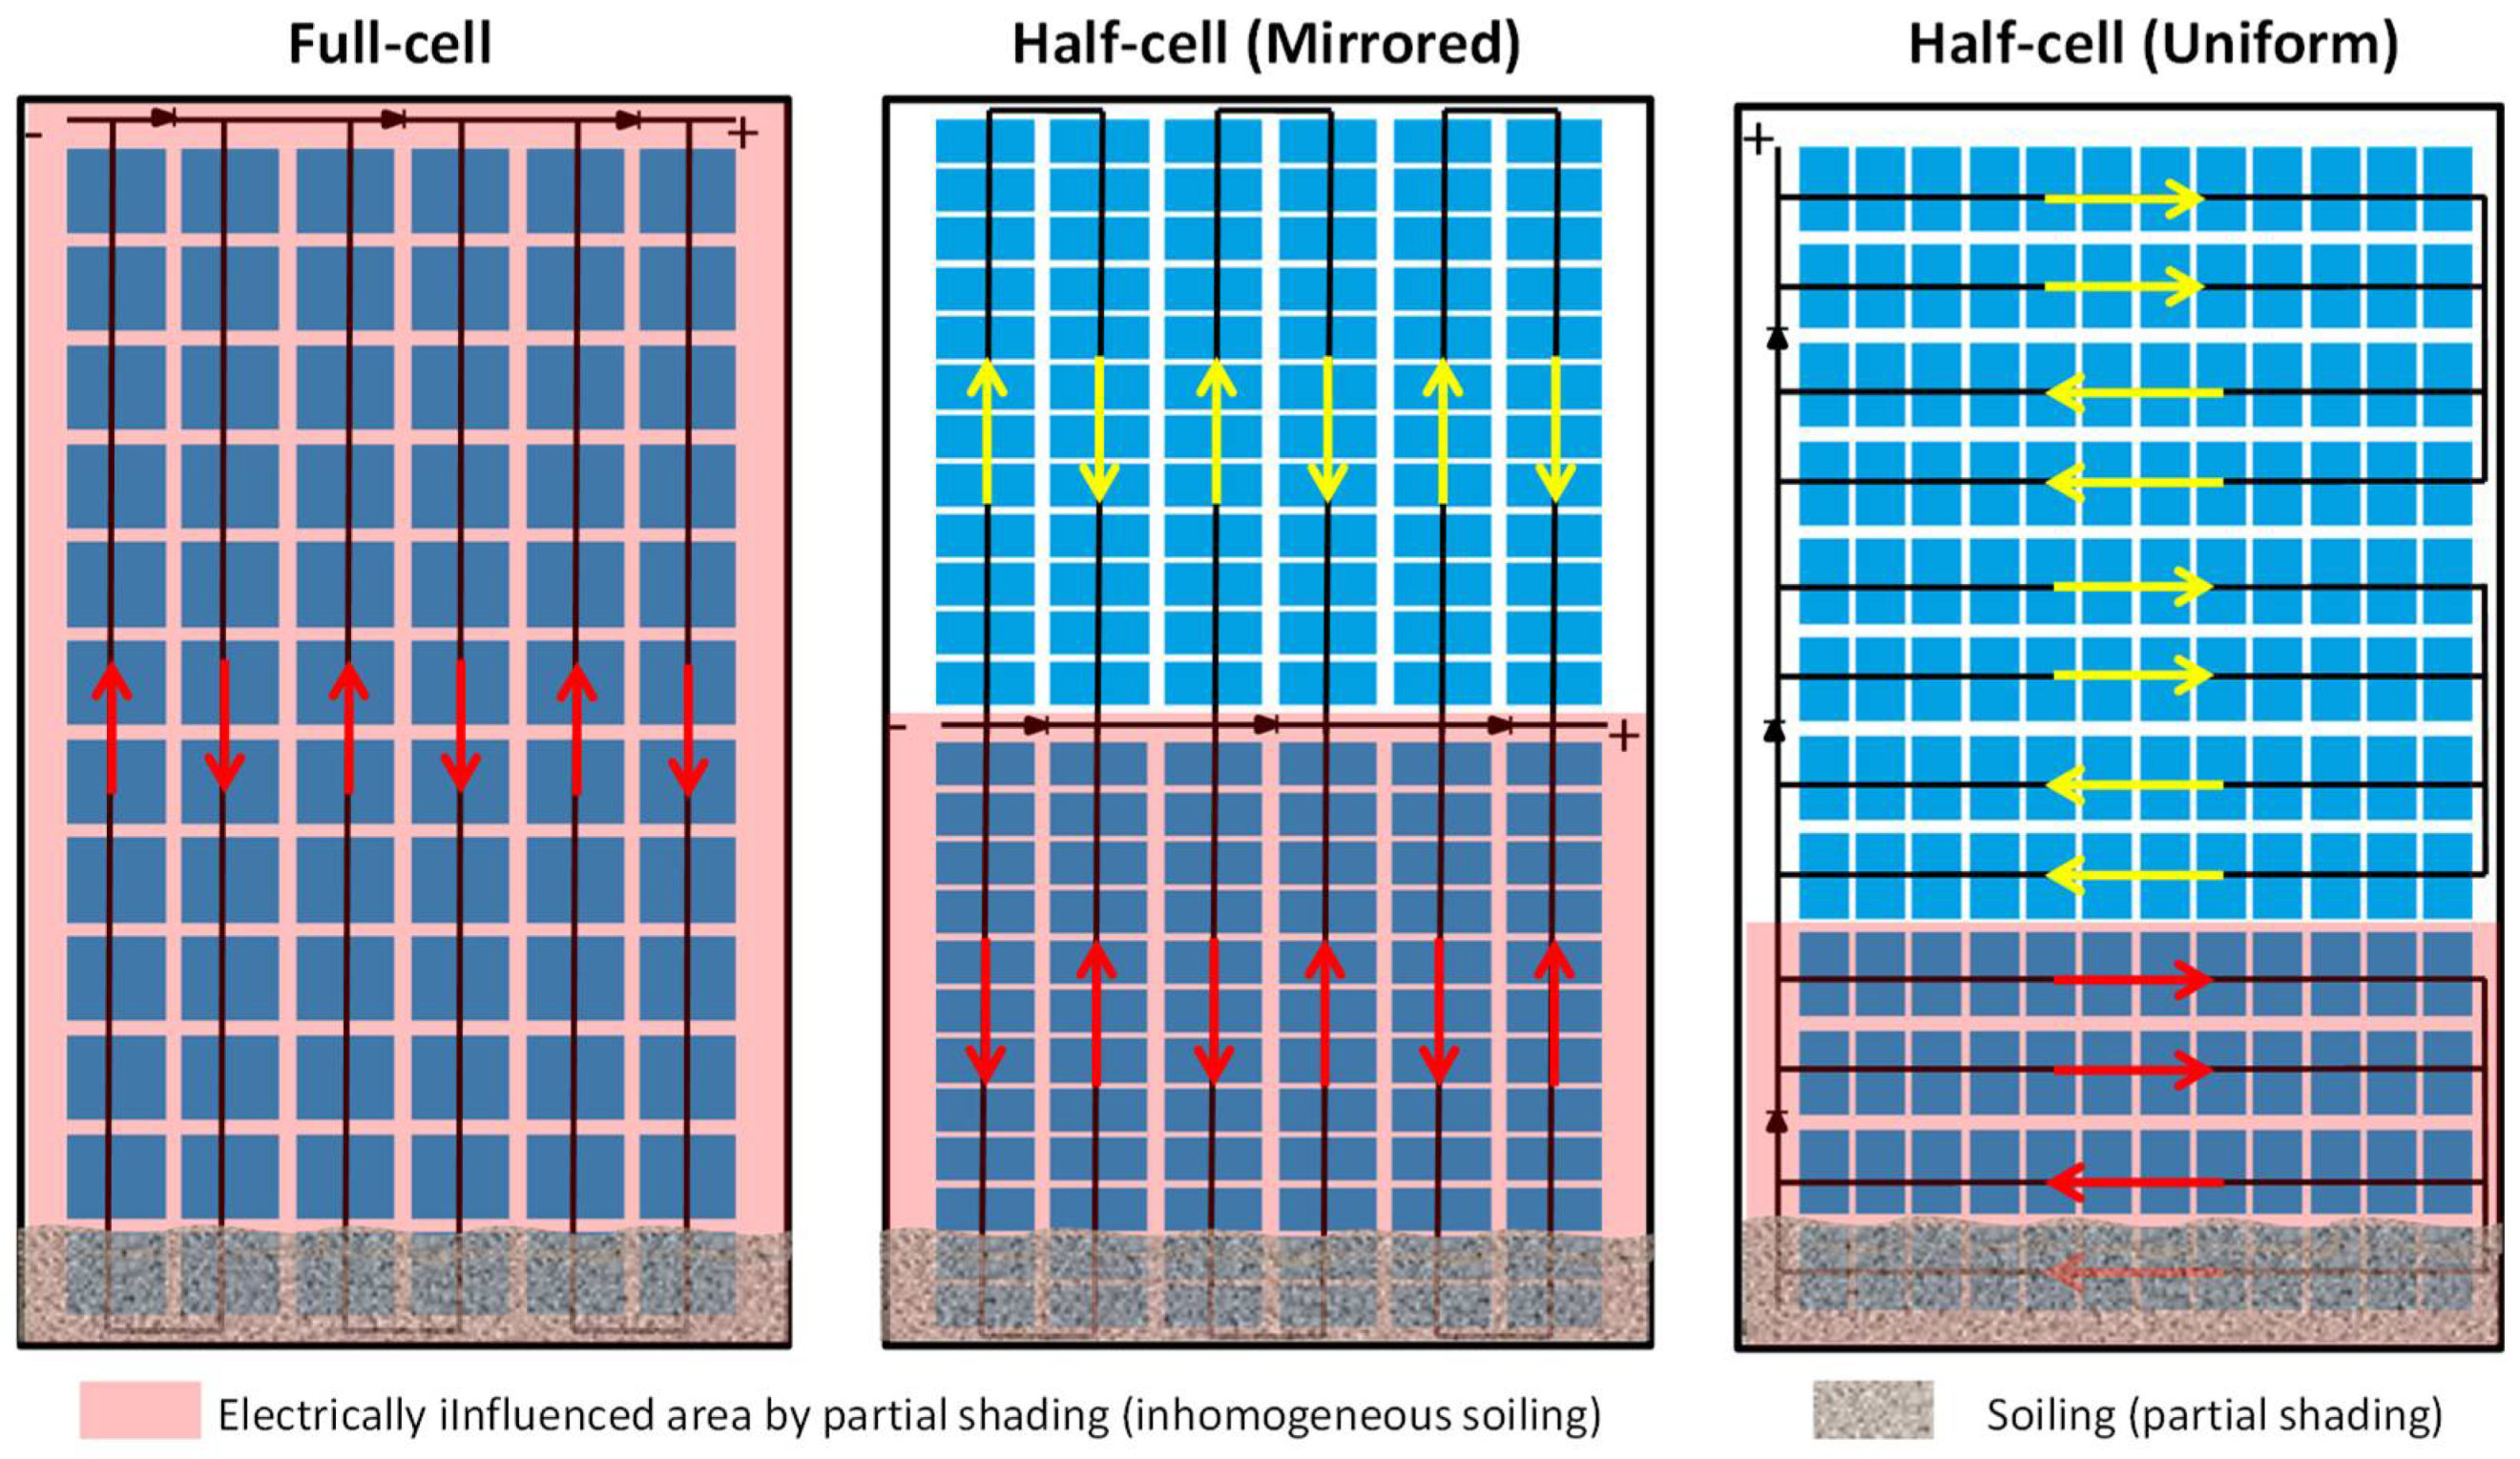
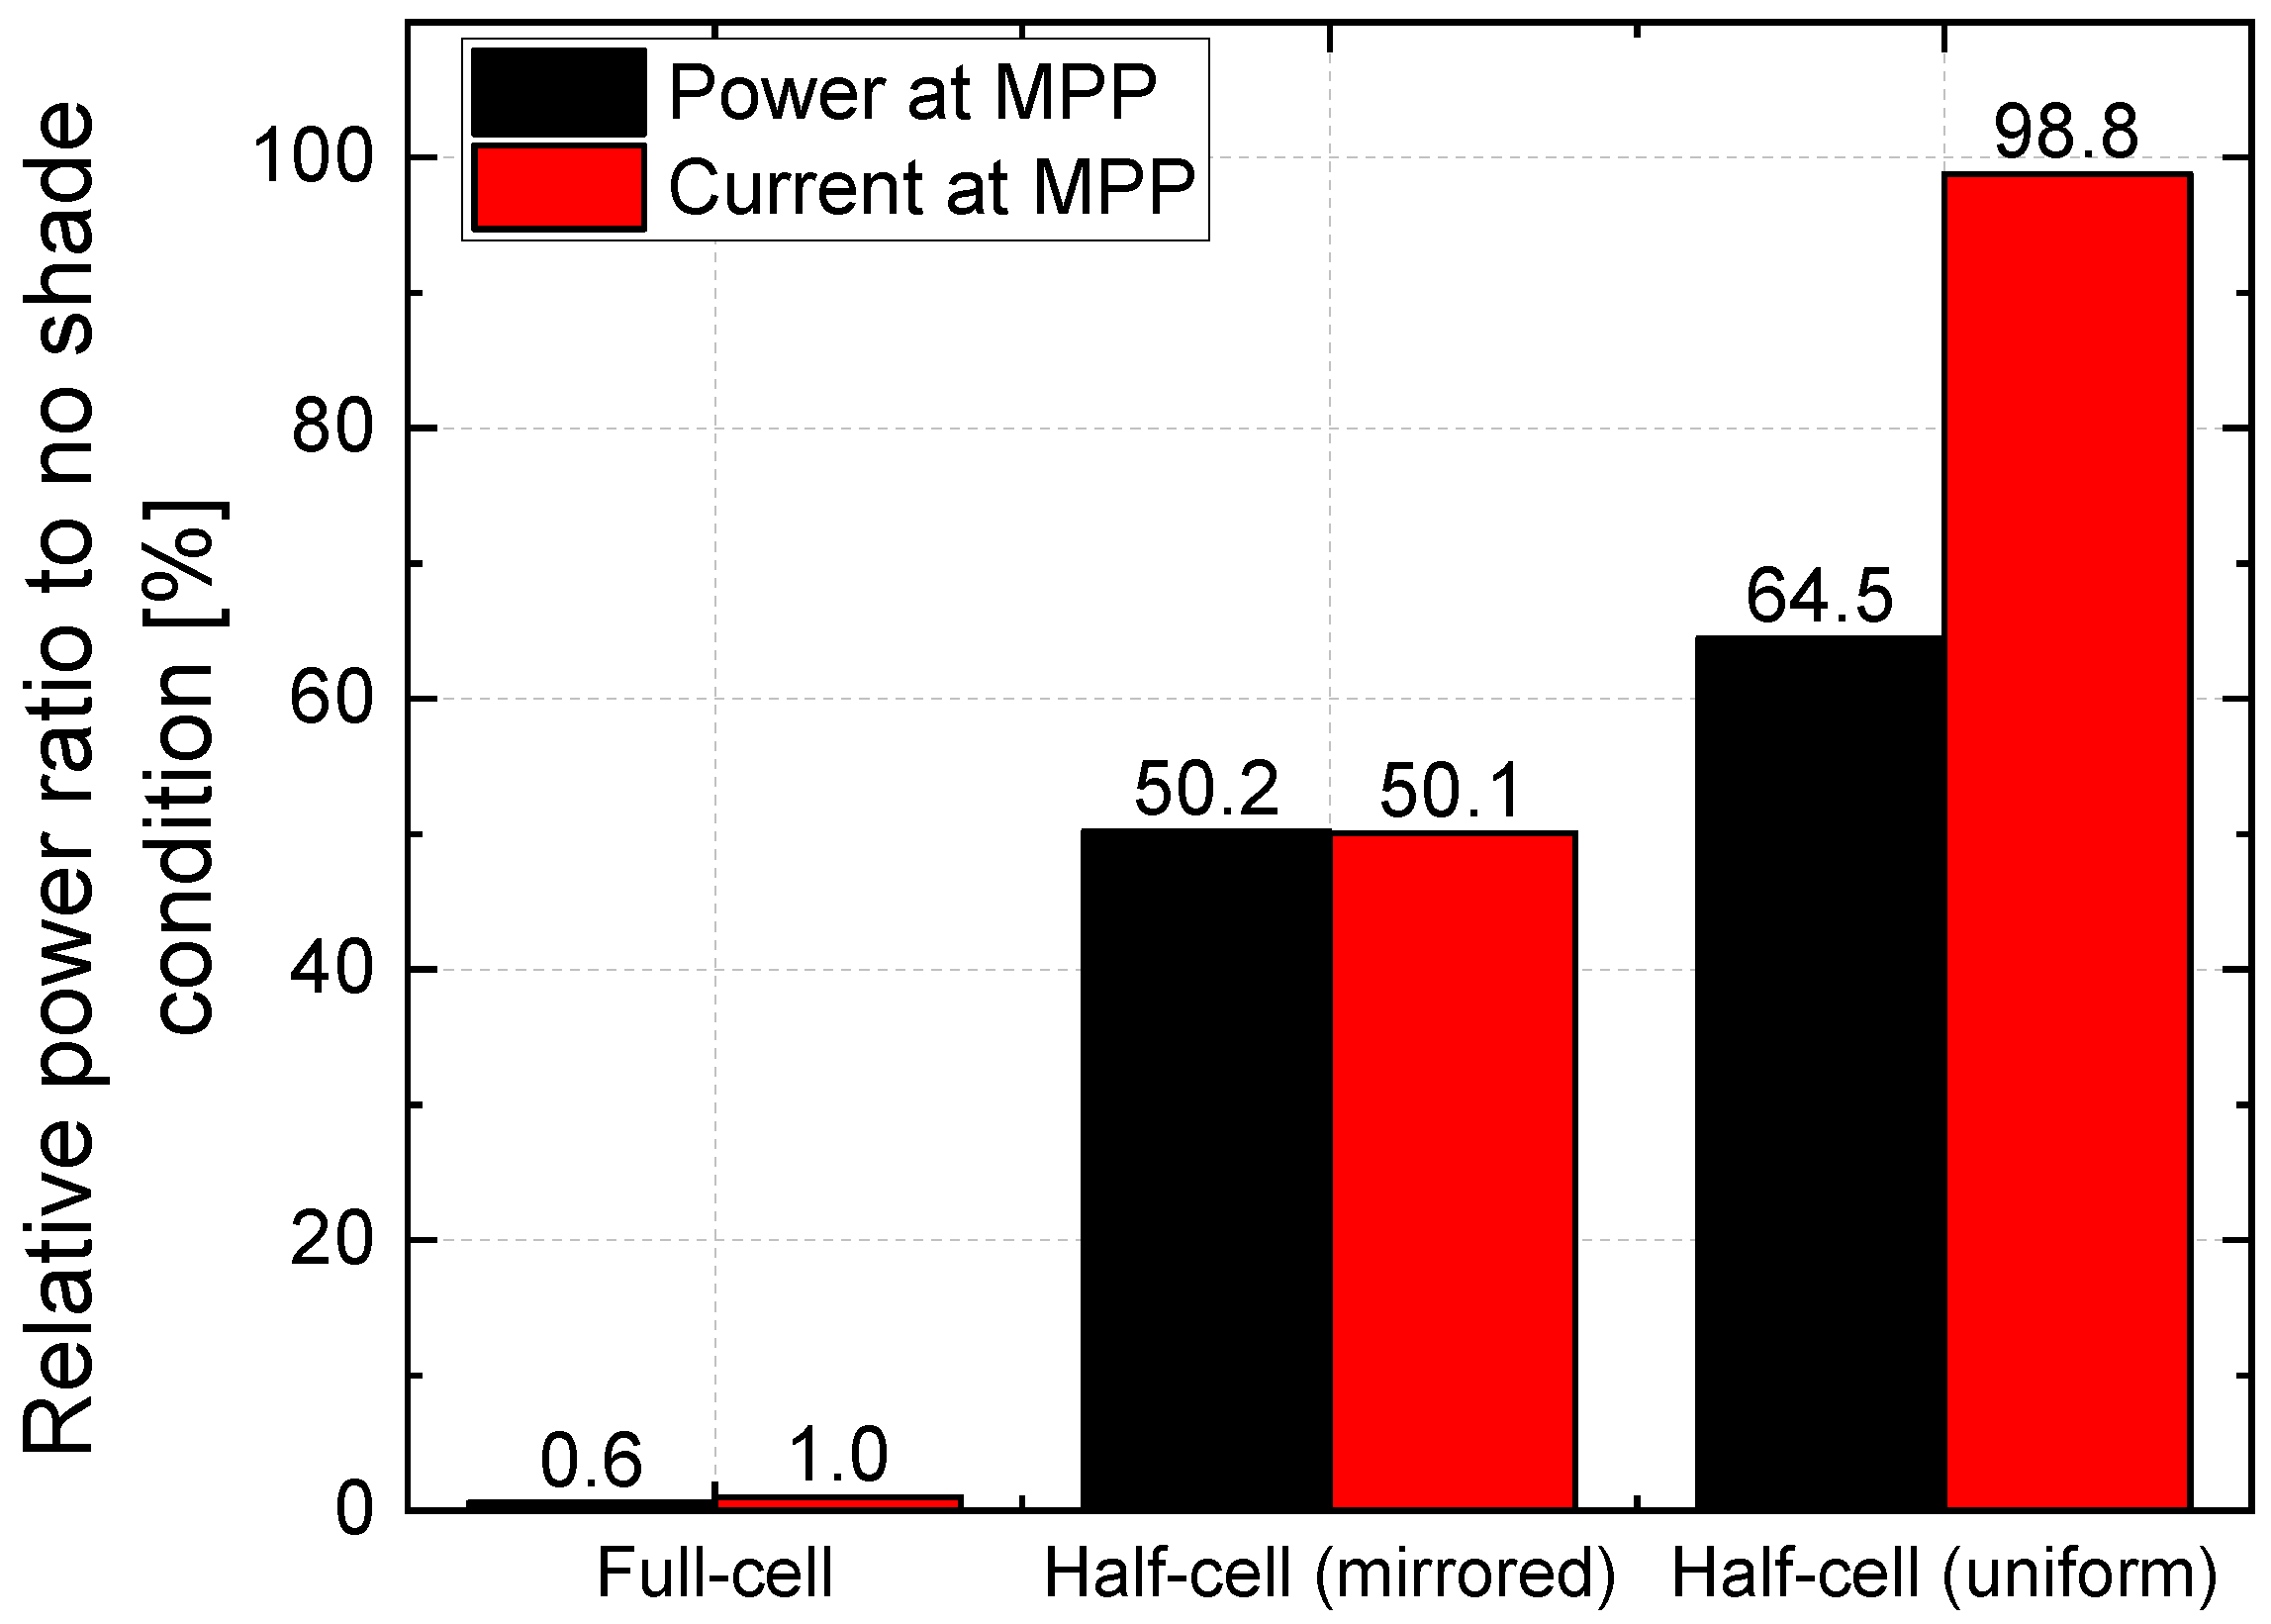
2.7.2. Partial Shading and Soiling Challenge

As shown in Figure 1, the soiling ratio in desert climates is up to 50 times higher than in moderate climates [8]. Solutions such as anti-soiling coatings [71] can decrease the homogeneous soiling on the glass surface [33,72,73,74,75]. However, inhomogeneous soiling due to the accumulation of dust on the bottom edge of PV modules, when it occurs, can lead to a drastic power loss and total shutdown of the PV module due to partial shading and increases the risk of hot spots [8,34]. In an extreme situation, shading of less than 5% of the active module area can lead to the total shut down of the PV module [76]. Figure 13 demonstrates different homogeneous and inhomogeneous soiling scenarios with different ratios in desert areas.
An adapted interconnection design and mounting orientation can increase the tolerance of PV modules under partial-shading conditions [35,46,51,55,66,80].
A half-cell module with a uniform design (see Figure 14) mounted in portrait orientation, which was evaluated in [66], showed up to a 65% better power output compared to the full-cell module when the bottom row of the module was shaded. The module performed up to 15% better compared to the half-cell module with a mirrored design and showed a significantly better performance under lower partial-shading rates [66]. Furthermore, in the extreme case of 100% shading of the bottom row, the full-cell module lost all its power, and the half-cell module with a mirrored design lost up to 50% of the nominal operating current, while the half-cell module with a uniform deign lost voltage instead and operated near the current at the nominal operating MPP and showed less current mismatch with other modules within the string [66]. Figure 15 compares the measured power and current ratios of the three module designs according to Figure 14 after shading the bottom row of the PV modules completely [66].

3. Economic Assessment

3.1. Large-Size Wafers

The M2 wafer size of monocrystalline PV modules remained almost unchanged for a decade [81,82]. After developments in the crystallization process, larger wafer sizes were introduced to the market in 2019 [83]. At the moment, solar cell wafer sizes range between M2 (156.75 mm × 156.75 mm) and M12 (210 mm × 210 mm), and it is expected that the M2 wafers will fade out very fast, as the tier-1 manufacturers no longer include them in their production plans [84].
A study shows that, for PV projects over 100 MW, larger size wafers show the advantage in Levelized Cost of Electricity from 2.9% to 3.5% [85]. However, shifting to larger-size wafers leads to higher nominal currents and consequent high ohmic losses. Therefore, half-cell modules are the best choice for high-current PV modules, especially with bifacial technology. The International Technology Roadmap for Photovoltaics (ITRPV) estimated that for the wafers below the M10 size, the half-cell modules will dominate the market (see Figure 16) [47].
For the wafer sizes above M10, third-cell modules could be a better choice [47] to control the current and ohmic losses without increasing the tab costs, or even smaller-size partial-cell modules with different concepts, such as shingled modules. The resulting currents to consider for module concepts are summarized below (see Table 1).

3.2. Cell-Cutting Costs

For the fabrication of half-cell modules, cutting full-size cells in half is necessary. To evaluate the surplus costs for cutting cells, the costs in Table 2 were considered. It was assumed that the splitting device was working 24/7 and was operated by three full-time technicians in three shifts. The operation and maintenance costs were calculated based on Germany (see Table 2).
The production of the full-cell module and half-cell module design proposed in this work differed mainly in the extra cutting and cleaving processes. The price of a cell-splitting device (laser and cleaving) is nearly 300,000 EUR/pcs. Considering the lifetime of the device and operation costs, including the total costs of a laser machine, labor, maintenance and electricity, can be estimated at 73,000 EUR/year. In the case of using solar cells with 5 W power, the total capacity of the factory for the production of half-cell modules with only one laser machine and considering a 0.1% breakage rate reaches 157.5 MW. In this case, the total cutting costs per solar cell can be reached by calculating the ratio of total splitting costs per year to the total cuts per year, which is a surplus of 0.00232 EUR/cell and 0.14 EUR/module for a 120-half-cell PV module for module manufacture. It should be noted that these assumptions were made based on the costs in Germany (labor, maintenance, electricity, etc.) and might be significantly lower in other countries.

3.3. Module Costs and System Benefits

The tab width obtained for half-cell modules was half of the tab width optimized for full-cell modules, leading to a 50% reduction in consumed tab material [14,49]. For a better comparison, the material costs of half-cell modules and full-cell modules were calculated based on the component prices given in Table 3.
A scenario of PV module production with the state-of-the-art solar cells and tabs with five-busbar solar cells and a 1.0 mm tab width was considered. The total tab consumption for the five-busbar solar cells was calculated for 179.7 g for a 60-cell PV module. Assuming the nominal power of 5 W for the solar cell and by considering a 50% reduced tab size for the half-cell design, the total costs to fabricate full-cell and half-cell modules are EUR 68.97 and EUR 67.94, respectively (see Figure 17). The corresponding EUR/Wp was determined using Equation (2) and CTM values of 98% and 103% according to the estimation of the International Technology Roadmap for Photovoltaics [36] for full-cell and half-cell designs, respectively.
M o d u l e   p r i c e     = C o s t m o d u l e   P c e l l × N c e l l s × C T M
where Module price [EUR/Wp] can be calculated by considering C o s t m o d u l e   [EUR] as the component costs, P c e l l [W] as the rated power of the solar cells, N c e l l s [-] as the number of cells and C T M [%] as the cell-to-module ratio. Since the overhead costs of labor and maintenance for PV production are similar for both module designs, this factor was excluded from the calculations.
The total costs of the full-cell and half-cell modules with 60 solar cells (120 half cells) were estimated at 0.235 EUR/Wp and 0.220 EUR/Wp, making the half-cell modules 0.015 EUR/Wp less expensive than the equivalent full-cell module. This calculation excludes the extra price, which needs to be paid to upgrade the tabber–stringer to adapt it to half-cell technology. The results show that although splitting solar cells to fabricate half-cell modules leads to a slight surplus of module costs, these extra costs are highly compensated for by saving costs due to reducing tab consumption by half and the increased CTM gain of half-cell modules.
Concerning performance, half-cell modules show lower module temperatures, especially in sunny areas with high irradiation levels, due to reduced electrical losses. Furthermore, the half-cell module with uniform design is less sensitive to partial-shading conditions and performs up to 65% better compared to the standard module under partial-shading conditions induced by inhomogeneous soiling on the bottom rows and corners of the PV modules. This leads to reduced cleaning cycles and a higher generated energy yield.
Adding the durability advantages due to 50% reduced cell displacement, it is expected that the module will last longer than the full-cell module, which is an advantage for the module manufacturer in respect to the warranty and benefit for the site owner due to the longer service life of the module in the plant.
Figure 18 shows the techno-economic advantages of half-cell modules regarding initial costs and stress factors such as high inhomogeneous soiling ratios and durability issues due to cell displacement and fatigue of interconnection because of the significant temperature differences between night and day in desert.

4. Discussion

Since 2018, there have been rapid developments in PV module technology and module designs. Several aspects led to this fast development. On one hand, there is a high focus on cost reduction for PV module components while avoiding critical failures such as ribbon fatigue or defective backsheets. Since 2020, the development of large wafers and therefore larger solar cells was accelerated significantly. While, for a long time, M1 and M2 solar cells were the standard cell size, PV modules with M4 and M6 wafers, as well as the new M10/M12 cell-size modules, have already been presented to the market. As mentioned, the majority of modules will use half cells. However, the growing market share of wafers above M10 will lead to more cut cells. For wafer sizes above M10, using a third-cell layout can be an option to deal with the strongly increased currents (see Table 1). After the process of cutting solar cells into three parts, the middle third cell out of a pseudo-square wafer size will have a slight difference in area compared to the other two third cells, which might induce some current mismatch. However, other module designs, such as shingle modules utilizing 1/5 for 1/6 of cut cells accept this mismatch. Finally, lower losses and increased reliability have led tier-1 module producers to increase their product and performance warranties up to 15 and 30 years, respectively [86].
The economic analysis for cutting costs and module prices addressed the M2 solar cells, which were state of the art at the time of this calculation. Utilizing wafers larger than the M2 size in module production can influence all aspects of fabrication, shipment and transport and mounting to achieve a lower LCOE, as pointed out in the reports. A cost analysis for PV modules made from different wafers would be an interesting topic to investigate. The trend toward newer solar cell technologies, such as heterojunction, perovskite or tandem solar cells as well new metallization layouts for half-cells, can change the final cost of PV modules independent of the design.

5. Summary and Conclusions

In this paper, the techno-economic aspects of half-cell modules, especially in harsh climates, are evaluated. We reviewed the advantages of the power, reliability, durability and performance of half-cell modules, evaluated the costs of the production and discussed the advantages of the LCOE at both the module and system levels.
Half-cell modules’ designs (uniform and mirrored) show reduced component consumption, a cell-to-module power ratio over 100%, about 50% less cell displacement and fatigue and up to 65% better performance than full-cell modules for the uniform design under inhomogeneous soiling or partial-shading conditions and lower module temperatures. These advantages address the thermal cycling due to significant temperature changes between night and day, high ambient temperatures, high ohmic losses due to high irradiation levels and drastic power losses due to partial shading of the module induced by inhomogeneous soiling scenarios.
Furthermore, half-cell modules have require half the EUR/kg costs for tabs and a total lower price (EUR/Wpeak) compared to full-cell modules due to generally higher CTM ratios and decreased ohmic losses. A cost advantage due to material consumption, combined with a power increase of over 6% can be expected. Due to the better performance in the inhomogeneous soiling case (possibly due to less required cleaning cycles) combined with a higher energy yield, a lower LCOE is expected for half-cell module designs. Additionally, half-cell modules are expected to have a longer service life compared to full-cell modules, especially addressing the high temperature differences between night and day, the long-term module reliability will be improved. This will be an extra investment in securement for PV power plant assets.

Funding

This research was funded by AE SOLAR and German Ministry of Economy and Energy (BMWi) under the CTS1000+ project with the contract number 03EE1028A.

Informed Consent Statement

Not applicable.

Acknowledgments

The authors thank AE SOLAR and the German Ministry of Economy and Energy (BMWi) for financing this work under the CTS1000+ project with the contract number 03EE1028A.

Conflicts of Interest

The authors declare no conflict of interest.

References

  1. Komoto, K.; Xu, H.; Lv, F.; Wang, S.; Sinha, P.; Cunow, E.; Wade, A.; Faiman, D.; Araki, K.; Perez, M.; et al. Energy from the Desert: Very Large Scale PV Power Plants for Shifting to Renewable Energy Future; Report IEA-PVPS T8-01:2015; International Energy Agency: Paris, France, 2015. [Google Scholar]
  2. Global Solar Atlas. Available online: https://globalsolaratlas.info/map (accessed on 14 March 2021).
  3. We Could Power The Entire World By Harnessing Solar Energy From 1% Of The Sahara. Available online: https://www.forbes.com/sites/quora/2016/09/22/we-could-power-the-entire-world-by-harnessing-solar-energy-from-1-of-the-sahara/?sh=1838c43d4406 (accessed on 14 March 2021).
  4. Hanifi, H.; Jaeckel, B.; Schneider, J. Simulation of Optical and Electrical Losses of PV Modules in Moderate and Desert Conditions. In Proceedings of the 2019 IEEE 46th Photovoltaic Specialists Conference (PVSC), Chicago, IL, USA, 16–21 June 2019; pp. 1255–1259. [Google Scholar] [CrossRef]
  5. Schlothauer, J.; Jungwirth, S.; Köhl, M.; Röder, B. Degradation of the encapsulant polymer in outdoor weathered photovoltaic modules: Spatially resolved inspection of EVA ageing by fluorescence and correlation to electroluminescence. Sol. Energy Mater. Sol. Cells 2012, 102, 75–85. [Google Scholar] [CrossRef]
  6. Czanderna, A.W.; Pern, F.J. Encapsulation of PV modules using ethylene vinyl acetate copolymer as a pottant: A critical review. Sol. Energy Mater. Sol. Cells 1996, 43, 101–181. [Google Scholar] [CrossRef]
  7. Osterwald, C.R.; Benner, J.P.; Pruett, J.; Anderberg, A.; Rummel, S.; Ottoson, L. Degradation in weathered crystalline-silicon PV modules apparently caused by UV radiation. In Proceedings of the 3rd World Conference on Photovoltaic Energy Conversion, Osaka, Japan, 11–18 May 2003; Volume C. [Google Scholar]
  8. Hanifi, H.; Pander, M.; Zeller, U.; Ilse, K.; Dassler, D.; Mirza, M.; Bahattab, M.A.; Jaeckel, B.; Hagendorf, C.; Ebert, M.; et al. Loss analysis and optimization of PV module components and design to achieve higher energy yield and longer service life in desert regions. Appl. Energy 2020, 280, 116028. [Google Scholar] [CrossRef]
  9. Bouraiou, A.; Hamouda, M.; Chaker, A.; Neçaibia, A.; Mostefaoui, M.; Boutasseta, N.; Ziane, A.; Dabou, R.; Sahouane, N.; Lachtar, S. Experimental investigation of observed defects in crystalline silicon PV modules under outdoor hot dry climatic conditions in Algeria. Sol. Energy 2018, 159, 475–487. [Google Scholar] [CrossRef]
  10. Cabrera-Tobar, A.; Fernández, Y.F.; Huaca, J.; Pozo, M.; Bellmunt, O.G.; Pavan, A.M. The effect of ambient temperature on the yield of a 3 MWp PV plant installed in Ecuador. In Proceedings of the 2019 IEEE International Conference on Environment and Electrical Engineering and 2019 IEEE Industrial and Commercial Power Systems Europe, Genova, Italy, 11–14 June 2019. [Google Scholar] [CrossRef]
  11. Kawajiri, K.; Oozeki, T.; Genchi, Y. Effect of Temperature on PV Potential in the World. Environ. Sci. Technol. 2011, 45, 9030–9035. [Google Scholar] [CrossRef]
  12. Skoplaki, E.; Palyvos, J.A. On the temperature dependence of photovoltaic module electrical performance: A review of efficiency/power correlations. Sol. Energy 2009, 83, 614–624. [Google Scholar] [CrossRef]
  13. Dubey, S.; Sarvaiya, J.N.; Seshadri, B. Temperature Dependent Photovoltaic (PV) Efficiency and Its Effect on PV Production in the World-A Review. Energy Procedia 2013, 33, 311–321. [Google Scholar] [CrossRef] [Green Version]
  14. Regondi, S.; Hanifi, H.; Schneider, J. Modeling and Simulation of the Influence of Interconnection Losses on Module Temperature in Moderate and Desert Regions. IEEE J. Photovolt. 2019, 9, 1449–1455. [Google Scholar] [CrossRef]
  15. Hanifi, H.; Regondi, S.; Jaeckel, B.; Schneider, J. Determination of electrical characteristics and temperature of PV modules by means of a coupled electrical-thermal model. J. Renew. Sustain. Energy 2020, 12, 023501. [Google Scholar] [CrossRef]
  16. Meier, R.; Pander, M.; Großer, S.; Dietrich, S. Microstructural Optimization Approach of Solar Cell Interconnectors Fatigue Behavior for Enhanced Module Lifetime in Extreme Climates. Energy Procedia 2016, 92, 560–568. [Google Scholar] [CrossRef]
  17. Aly, S.P.; Ahzi, S.; Barth, N.; Abdallah, A. Numerical analysis of the reliability of photovoltaic modules based on the fatigue life of the copper interconnects. Sol. Energy 2020, 212, 152–168. [Google Scholar] [CrossRef]
  18. Pander, M.; Dietrich, S.; Meier, R.; Ebert, M. Fatigue Analysis of Solar Cell Interconnectors due to Cyclic Mechanical Loading. In Proceedings of the 32nd European Photovoltaic Solar Energy Conference and Exhibition, Munich, Germany, 20–24 June 2016; pp. 1589–1597. [Google Scholar] [CrossRef]
  19. Cordero, R.R.; Damiani, A.; Laroze, D.; MacDonell, S.; Jorquera, J.; Sepúlveda, E.; Feron, S.; Llanillo, P.; Labbe, F.; Carrasco, J.; et al. Effects of soiling on photovoltaic (PV) modules in the Atacama Desert. Sci. Rep. 2018, 8, 13943. [Google Scholar] [CrossRef] [PubMed] [Green Version]
  20. Darwish, Z.A.; Kazem, H.A.; Sopian, K.; Al-Goul, M.; Alawadhi, H. Effect of dust pollutant type on photovoltaic performance. Renew. Sustain. Energy Rev. 2014, 41, 735–744. [Google Scholar] [CrossRef]
  21. Mekhilef, S.; Saidur, R.; Kamalisarvestani, M. Effect of dust, humidity and air velocity on efficiency of photovoltaic cells. Renew. Sustain. Energy Rev. 2012, 16, 2920–2925. [Google Scholar] [CrossRef]
  22. El-Nashar, A.M. Seasonal effect of dust deposition on a field of evacuated tube collectors on the performance of a solar desalination plant. Desalination 2009, 239, 66–81. [Google Scholar] [CrossRef]
  23. Asl-Soleimani, E.; Farhangi, S.; Zabihi, M. The effect of tilt angle, air pollution on performance of photovoltaic systems in Tehran. Renew. Energy 2001, 24, 459–468. [Google Scholar] [CrossRef]
  24. Sarver, T.; Al-Qaraghuli, A.; Kazmerski, L.L. A comprehensive review of the impact of dust on the use of solar energy: History, investigations, results, literature, and mitigation approaches. Renew. Sustain. Energy Rev. 2013, 22, 698–733. [Google Scholar] [CrossRef]
  25. Mejia, F.A.; Kleissl, J. Soiling losses for solar photovoltaic systems in California. Sol. Energy 2013, 95, 357–363. [Google Scholar] [CrossRef] [Green Version]
  26. Jiang, H.; Lu, L.; Sun, K. Experimental investigation of the impact of airborne dust deposition on the performance of solar photovoltaic (PV) modules. Atmos. Environ. 2011, 45, 4299–4304. [Google Scholar] [CrossRef]
  27. El-Nashar, A.M. Effect of dust deposition on the performance of a solar desalination plant operating in an arid desert area. Sol. Energy 2003, 75, 421–431. [Google Scholar] [CrossRef]
  28. Cuddihy, E.F. Theoretical considerations of soil retention. Sol. Energy Mater. 1980, 3, 21–33. [Google Scholar] [CrossRef]
  29. Al-Hasan, A.Y.; Ghoneim, A.A. A new correlation between photovoltaic panel’s efficiency and amount of sand dust accumulated on their surface. Int. J. Sustain. Energy 2005, 24, 187–197. [Google Scholar] [CrossRef]
  30. Dhaouadi, R.; Al-Othman, A.; Aidan, A.A.; Tawalbeh, M.; Zannerni, R. A characterization study for the properties of dust particles collected on photovoltaic (PV) panels in Sharjah, United Arab Emirates. Renew. Energy 2021, 171, 133–140. [Google Scholar] [CrossRef]
  31. Maghami, M.R.; Hizam, H.; Gomes, C.; Radzi, M.A.; Rezadad, M.I.; Hajighorbani, S. Power loss due to soiling on solar panel: A review. Renew. Sustain. Energy Rev. 2016, 59, 1307–1316. [Google Scholar] [CrossRef] [Green Version]
  32. Mani, M.; Pillai, R. Impact of dust on solar photovoltaic (PV) performance: Research status, challenges and recommendations. Renew. Sustain. Energy Rev. 2010, 14, 3124–3131. [Google Scholar] [CrossRef]
  33. Ilse, K.K.; Figgis, B.W.; Naumann, V.; Hagendorf, C.; Bagdahn, J. Fundamentals of soiling processes on photovoltaic modules. Renew. Sustain. Energy Rev. 2018, 98, 239–254. [Google Scholar] [CrossRef]
  34. Ilse, K.; Micheli, L.; Figgis, B.W.; Lange, K.; Daßler, D.; Hanifi, H.; Wolfertstetter, F.; Naumann, V.; Hagendorf, C.; Gottschalg, R.; et al. Techno-Economic Assessment of Soiling Losses and Mitigation Strategies for Solar Power Generation. Joule 2019, 3, 2303–2321. [Google Scholar] [CrossRef] [Green Version]
  35. International Finance Corporation. Utility-Scale Solar Photovoltaic Power Plants. Available online: https://www.ifc.org/wps/wcm/connect/a1b3dbd3-983e-4ee3-a67b-cdc29ef900cb/IFC+Solar+Report_Web+_08+05.pdf?MOD=AJPERES&CVID=kZePDPG (accessed on 25 March 2021).
  36. International Technology Roadmap for Photovoltaics ITRPV—The Mechanical Engineering Industry Association VDMA. International Technology Roadmap for Photovoltaics Report 2019. Available online: https://itrpv.vdma.org/ (accessed on 15 March 2021).
  37. Bouaichi, A.; Merrouni, A.A.; Hajjaj, C.; Zitouni, H.; Ghennioui, A.; El Amrani, A.; Messaoudi, C. In-situ inspection and measurement of degradation mechanisms for crystalline and thin film PV systems under harsh climatic conditions. Energy Procedia 2019, 157, 1210–1219. [Google Scholar] [CrossRef]
  38. Bosco, N.; Silverman, T.; Wohlgemuth, J.; Kurtz, S.; Inoue, M.; Sakurai, K.; Shioda, T.; Zenkoh, H.; Miyashita, M.; Tadanori, T.; et al. Accelerating Fatigue Testing for Cu Ribbon Interconnects Espec 2013 Photovoltaic Module Reliability Workshop; NREL/TP-5200-60167; National Renewable Energy Laboratory: Golden, CO, USA, 2013. Available online: https://digital.library.unt.edu/ark:/67531/metadc828825/ (accessed on 22 March 2021).
  39. de Oliveira, M.C.C.; Cardoso, A.S.A.D.; Viana, M.M.; Lins, V.D.F.C. The causes and effects of degradation of encapsulant ethylene vinyl acetate copolymer (EVA) in crystalline silicon photovoltaic modules: A review. Renew. Sustain. Energy Rev. 2018, 81, 2299–2317. [Google Scholar] [CrossRef]
  40. Meena, R.; Kumar, S.; Gupta, R. Comparative investigation and analysis of delaminated and discolored encapsulant degradation in crystalline silicon photovoltaic modules. Sol. Energy 2020, 203, 114–122. [Google Scholar] [CrossRef]
  41. Toth, S.; Muller, M.; Miller, D.C.; Moutinho, H.; To, B.; Micheli, L.; Linger, J.; Engtrakul, C.; Einhorn, A.; Simpson, L. Soiling and cleaning: Initial observations from 5-year photovoltaic glass coating durability study. Sol. Energy Mater. Sol. Cells 2018, 185, 375–384. [Google Scholar] [CrossRef]
  42. Miller, D.C.; Alnuaimi, A.; John, J.J.; Simpson, L.J.; Engtrakul, C.; Einhorn, A.; Lanaghan, C.L.; Newkirk, J.M.; To, B.; Holsapple, D.; et al. The Abrasion of Photovoltaic Glass: A Comparison of the Effects of Natural and Artificial Aging. IEEE J. Photovoltaics 2019, 10, 173–180. [Google Scholar] [CrossRef]
  43. Asset Management Best Practice Guidelines/Version 1.0 2019. Available online: https://www.solarpowereurope.org (accessed on 13 June 2021).
  44. The Power to Change: Solar and Wind Cost Reduction Potential to 2025. 2016. Available online: https://www.irena.org/publications/2016/Jun/The-Power-to-Change-Solar-and-Wind-Cost-Reduction-Potential-to-2025 (accessed on 13 June 2021).
  45. Renewable Power Generation Costs in 2020. Available online: https://www.irena.org/publications/2020/Jun/Renewable-Power-Costs-in-2019 (accessed on 13 June 2021).
  46. Schneider, J.; Hanifi, H.; Dassler, D.; Pander, M.; Kaule, F.; Turek, M. Half-Cell Solar Modules: The New Standard in PV Production? 2019. Available online: https://www.pv-tech.org/technical-papers/halfcell-solar-modules-the-new-standard-in-pv-production/ (accessed on 30 March 2021).
  47. International Technology Roadmap for Photovoltaics ITRPV—The Mechanical Engineering Industry Association VDMA, International Technology Roadmap for Photovoltaics report of 2021. Available online: https://itrpv.vdma.org/en/ (accessed on 30 March 2021).
  48. Luque, A.; Hegedus, S. Handbook of Photovoltaic Science and Engineering; John Wiley & Sons: Chichester, UK, 2010. [Google Scholar] [CrossRef]
  49. Hanifi, H.; Dassler, D.; Schneider, J.; Turek, M.; Schindler, S.; Bagdahn, J. Optimized Tab Width in Half-cell Modules. Energy Procedia 2016, 92, 52–59. [Google Scholar] [CrossRef]
  50. Guo, S.; Schneider, J.; Lu, F.; Hanifi, H.; Turek, M.; Dyrba, M.; Peters, I.M. Investigation of the short-circuit current increase for PV modules using halved silicon wafer solar cells. Sol. Energy Mater. Sol. Cells 2015, 133, 240–247. [Google Scholar] [CrossRef]
  51. Guo, S.; Singh, J.P.; Peters, I.M.; Aberle, A.G.; Walsh, T.M. A Quantitative Analysis of Photovoltaic Modules Using Halved Cells. Int. J. Photoenergy 2013, 2013, 1–8. [Google Scholar] [CrossRef]
  52. Muller, J.; Hinken, D.; Blankemeyer, S.; Kohlenberg, H.; Sonntag, U.; Bothe, K.; Dullweber, T.; Kontges, M.; Brendel, R. Resistive Power Loss Analysis of PV Modules Made from Halved 15.6 × 15.6 cm2 Silicon PERC Solar Cells with Efficiencies up to 20.0%. IEEE J. Photovolt. 2014, 5, 189–194. [Google Scholar] [CrossRef]
  53. Kim, N.; Lee, S.; Zhao, X.G.; Kim, D.; Oh, C.; Kang, H. Reflection and durability study of different types of backsheets and their impact on c-Si PV module performance. Sol. Energy Mater. Sol. Cells 2016, 146, 91–98. [Google Scholar] [CrossRef]
  54. Saw, M.H.; Khoo, Y.S.; Singh, J.P.; Wang, Y. Cell-to-module optical loss/gain analysis for various photovoltaic module materials through systematic characterization. Jpn. J. Appl. Phys. 2017, 56, 08MD03. [Google Scholar] [CrossRef]
  55. Hanifi, H.; Schneider, J.; Bagdahn, J. Reduced Shading Effect on Half-Cell Modules—Measurement and Simulation. In Proceedings of the 31st European Photovoltaic Solar Energy Conference and Exhibition, Hamburg, Germany, 14–18 September 2015; pp. 2529–2533. [Google Scholar] [CrossRef]
  56. Eiternick, S.; Kaufmann, K.; Schneider, J.; Turek, M. Loss Analysis for Laser Separated Solar Cells. Energy Procedia 2014, 55, 326–330. [Google Scholar] [CrossRef]
  57. Xia, L.; Chen, J.; Liao, K.; Huang, L.; Li, Q.; Luo, X. Influence of laser cutting conditions on electrical characteristics of half-size bifacial silicon solar cells. Mater. Sci. Semicond. Process. 2019, 105, 104747. [Google Scholar] [CrossRef]
  58. Hanifi, H.; Dassler, D.; Turek, M.; Schneider, J. Evaluation and Comparison of PV Modules With Different Designs of Partial Cells in Desert and Moderate Climates. IEEE J. Photovolt. 2018, 8, 1266–1273. [Google Scholar] [CrossRef]
  59. Eiternick, S.; Kaule, F.; Zühlke, H.-U.; Kießling, T.; Grimm, M.; Schoenfelder, S.; Turek, M. High Quality Half-cell Processing Using Thermal Laser Separation. Energy Procedia 2015, 77, 340–345. [Google Scholar] [CrossRef]
  60. Kaule, F.; Pander, M.; Turek, M.; Grimm, M.; Hofmueller, E.; Schoenfelder, S. Mechanical damage of half-cell cutting technologies in solar cells and module laminates. AIP Conf. Proc. 2018, 1999, 020013. [Google Scholar] [CrossRef]
  61. IEC 61370-1: Photovoltaic (PV) Module Safety Qualification-Part 1: Requirements for Construction 2016. Available online: https://webstore.iec.ch/publication/25674 (accessed on 15 April 2021).
  62. Haedrich, I.; Eitner, U.; Wiese, M.; Wirth, H. Unified methodology for determining CTM ratios: Systematic prediction of module power. Sol. Energy Mater. Sol. Cells 2014, 131, 14–23. [Google Scholar] [CrossRef]
  63. Dupré, O.; Levrat, J.; Champliaud, J.; Despeisse, M.; Boccard, M.; Ballif, C. Reassessment of cell to module gains and losses: Accounting for the current boost specific to cells located on the edges. AIP Conf. Proc. 2018, 1999, 090001. [Google Scholar] [CrossRef]
  64. Hanifi, H.; Pfau, C.; Dassler, D.; Schindler, S.; Schneider, J.; Turek, M.; Bagdahn, J. Investigation of cell-to-module (CTM) ratios of PV modules by analysis of loss and gain mechanisms-PV Tech. Photovolt. Int. 2016, 32, 90–98. Available online: https://www.pv-tech.org/technical-papers/investigation-of-celltomodule-ctm-ratios-of-pv-modules-by-analysis-of-loss-and-gain-mechanisms/ (accessed on 9 May 2021).
  65. Mittag, M.; Pfreundt, A.; Shahid, J.; Wöhrle, N.; Neuhaus, D.H. Techno-Economic Analysis of Half-Cell Modules—The Impact of Half-Cells on Module Power and Costs. In Proceedings of the 36th European Photovoltaic Solar Energy Conference and Exhibition, Marseille, France, 9–13 September 2019; pp. 1032–1039. [Google Scholar] [CrossRef]
  66. Hanifi, H.; Khan, M.Z.; Jaeckel, B.; Hagendorf, C.; Schneider, J.; Abdallah, A.; Ilse, K. Optimum PV module interconnection layout and mounting orientation to reduce inhomogeneous soiling losses in desert environments. Sol. Energy 2020, 203, 267–274. [Google Scholar] [CrossRef]
  67. Herrmann, W.; Bogdanski, N. Outdoor weathering of PV modules—Effects of various climates and comparison with accelerated laboratory testing. In Proceedings of the 37th IEEE Photovoltaic Specialists Conference, Seattle, WA, USA, 19–24 June 2011; pp. 002305–002311. [Google Scholar] [CrossRef]
  68. IEC 61215-2: Terrestrial Photovoltaic (PV) Modules—Design Qualification and Type Approval-Part 2: Test Procedures. Available online: https://webstore.iec.ch/publication/61350 (accessed on 19 May 2021).
  69. Pander, M.; Meier, R.; Sander, M.; Dietrich, S.; Ebert, M. Lifetime Estimation for Solar Cell Interconnectors. In Proceedings of the 28th European Photovoltaic Solar Energy Conference and Exhibition, Paris, France, 30 September–4 October 2013; pp. 2851–2857. [Google Scholar] [CrossRef]
  70. Malik, S.; Dassler, D.; Froebel, J.; Schneider, J.; Ebert, M. Outdoor Data Evaluation of Half-/Full-Cell Modules with Regard to Measurement Uncertainties and the Application of Statistical Methods. In Proceedings of the 29th European Photovoltaic Solar Energy Conference and Exhibition, Amsterdam, The Netherlands, 23–25 September 2014; pp. 3269–3273. [Google Scholar] [CrossRef]
  71. Isbilir, K.; Lisco, F.; Womack, G.; Abbas, A.; Walls, J.M. Testing of an Anti-Soiling Coating for PV Module Cover Glass. In Proceedings of the 2018 IEEE 7th World Conference on Photovoltaic Energy Conversion (WCPEC) (A Joint Conference of 45th IEEE PVSC, 28th PVSEC & 34th EU PVSEC), Waikoloa, HI, USA, 10–15 June 2018; pp. 3426–3431. [Google Scholar] [CrossRef] [Green Version]
  72. Huang, Z.-S.; Shen, C.; Fan, L.; Ye, X.; Shi, X.; Li, H.; Zhang, Y.; Lai, Y.; Quan, Y.-Y. Experimental investigation of the anti-soiling performances of different wettability of transparent coatings: Superhydrophilic, hydrophilic, hydrophobic and superhydrophobic coatings. Sol. Energy Mater. Sol. Cells 2021, 225, 111053. [Google Scholar] [CrossRef]
  73. Ilse, K.K.; Figgis, B.W.; Werner, M.; Naumann, V.; Hagendorf, C.; Pöllmann, H.; Bagdahn, J. Comprehensive analysis of soiling and cementation processes on PV modules in Qatar. Sol. Energy Mater. Sol. Cells 2018, 186, 309–323. [Google Scholar] [CrossRef]
  74. Simsek, E.; Williams, M.J.; Pilon, L. Effect of dew and rain on photovoltaic solar cell performances. Sol. Energy Mater. Sol. Cells 2020, 222, 110908. [Google Scholar] [CrossRef]
  75. de Jesus, M.A.M.L.; Timò, G.; Agustín-Sáenz, C.; Braceras, I.; Cornelli, M.; de Mello Ferreira, A. Anti-soiling coatings for solar cell cover glass: Climate and surface properties influence. Sol. Energy Mater. Sol. Cells 2018, 185, 517–523. [Google Scholar] [CrossRef]
  76. Hanifi, H.; Pander, M.; Jaeckel, B.; Schneider, J.; Bakhtiari, A.; Maier, W. A novel electrical approach to protect PV modules under various partial shading situations. Sol. Energy 2019, 193, 814–819. [Google Scholar] [CrossRef]
  77. Schill, C.; Brachmann, S.; Koehl, M. Impact of soiling on IV-curves and efficiency of PV-modules. Sol. Energy 2015, 112, 259–262. [Google Scholar] [CrossRef]
  78. Gostein, M.; Duster, T.; Thuman, C. Accurately measuring PV soiling losses with soiling station employing module power measurements. In Proceedings of the 2015 IEEE 42nd Photovoltaic Specialist Conference, New Orleans, LA, USA, 14–19 June 2015; pp. 1–4. [Google Scholar] [CrossRef]
  79. Cui, Y.-Q.; Xiao, J.-H.; Xiang, J.-L.; Sun, J.-H. Characterization of Soiling Bands on the Bottom Edges of PV Modules. Front. Energy Res. 2021, 9, 665411. [Google Scholar] [CrossRef]
  80. Lu, F.; Guo, S.; Walsh, T.M.; Aberle, A.G. Improved PV Module Performance under Partial Shading Conditions. Energy Procedia 2013, 33, 248–255. [Google Scholar] [CrossRef] [Green Version]
  81. Mittag, M.; Pfeundt, A.; Shahid, J. Impact of Solar Cell Dimensions on Module Power, Efficiency and Cell-To-Module Losses. In Proceedings of the 30th PV Solar Energy Conference (PVSEC-30), Jeju, Korea, 13 November 2020; pp. 1–6. [Google Scholar]
  82. TaiyangNews Webinar on PV Industry Trends to Design Modules with Higher Power Ratings Taiyang News. 2019. Available online: http://taiyangnews.info/webinars/Nov-18-Larger-Wafer-Based-Solar-Module/ (accessed on 21 March 2021).
  83. Sylvia, T. Manufacturers Call for Module Size Standardization-Pv Magazine International. PV Magazine. 2021. Available online: https://www.pv-magazine.com/2021/01/05/Manufacturers-Call-for-Module-Size-Standardization/ (accessed on 21 March 2021).
  84. Bhambhani, A. LONGi Stops Mass Production Of M2 Wafer Size|TaiyangNews. Taiyang News. 2020. Available online: http://taiyangnews.info/technology/Longi-Stops-Mass-Production-of-m2-Wafer-Size/ (accessed on 21 March 2021).
  85. Largest Wafer Offers Lowest LCOE, Finds DNV GL-Pv Magazine International. Available online: https://www.pv-magazine.com/2020/12/04/Largest-Wafer-Offers-Lowest-Lcoe-Finds-Dnv-Gl/ (accessed on 30 May 2021).
  86. AE Solar Launches New Solar Module Series, Increases Warranties-Pv Magazine International. Available online: https://www.pv-magazine.com/2022/03/02/AE-Solar-Launches-New-Solar-Module-Series-Increases-Warranties/ (accessed on 22 April 2022).
Figure 1. Comparison of environmental stress factors between moderate (Halle, Germany) and desert (Dubai, United Arab Emirates) climates.
Energies 15 03219 g001
Figure 2. Schematic view of the area influenced by the back reflections of light rays from the backsheet over on the edges of the solar cells in both (left) full-cell and (right) half-cell layouts.
Energies 15 03219 g002
Figure 3. Comparison of (a) the IV characteristics and (b) electrical characteristics of measured (c) full-cell (72 cells) and (d) half-cell modules (144 half cells) with a similar bill of materials.
Energies 15 03219 g003
Figure 4. Efficiency loss due to laser process after separation of single cells into two half cells and overcompensation of losses at the module level fabricated from the same solar cells due to reduced electrical losses and increased optical gains (adapted from [46]).
Energies 15 03219 g004
Figure 5. (top) Schematic and picture of the PV modules and (bottom) electrical characterization data of the PV modules with three different cell/string spacing groups of 1.5 mm, 2.5 mm and 3.5 mm.
Energies 15 03219 g005
Figure 6. (left) Schematic view of the half-cell module made from cells with M2-size wafers and a magnification on tab section which shows the reduced tab size and related released active area, which was shaded below the tab; and (right) simulated electrical, optical and overall power loss densities related to the total active width covered by tab on the solar cells. The optimum tab width might vary according to the number of busbars and electrical characteristics of the solar cells.
Energies 15 03219 g006
Figure 7. (top) Picture of half-cell and full-cell single-cell PV modules with wide and narrow tab widths which covered 2.4 mm and 5.1 mm of the cell width; and (bottom) the optical, electrical and overall power loss densities of the modules under high irradiation and low-light conditions.
Energies 15 03219 g007
Figure 8. Cell-to-module power ratio of 100 PV modules (25 per each group) with full-cell and half-cell designs and two total tab widths of 2.4 mm and 4.5 mm.
Energies 15 03219 g008
Figure 9. The cumulative energy yield based on full-cell, half-cell and third-cell modules with the same module perimeter and inactive area for two tab width values in Morocco.
Energies 15 03219 g009
Figure 10. Module picture, interconnection schematics and rear-side shematics of the full-cell module, half-cell module with mirrored design and half-cell module with uniform design (adapted with permission from [66]).
Energies 15 03219 g010
Figure 11. Gap change between the 4-busbar solar cells laminated into mini-modules with 3 full-size equivalent solar cells and fabricated with the same bill of materials. The half-cell and full-cell groups differ only in the cell size, and the half cell and half cell with optimized tab differ only in tab width (adapted from [8]).
Energies 15 03219 g011
Figure 12. (left) Measurement of full-cell and half-cell modules with uniform design on the outdoor test field in Germany, and (right) average measured temperature of the ambient, half-cell and full-cell modules between 2014 and 2018.
Energies 15 03219 g012
Figure 13. (a) Homogeneous soiling in Gran Canaria, Spain (Reprinted with permission from [77]), and inhomogeneous soiling of PV modules mainly in lower parts of the PV modules in (b) United States (Reprinted from the presentation in the conference related to [78]), (c) Xi’an, China (Reprinted with permission from [79]), and (d) Dubai, United Arab Emirates.
Energies 15 03219 g013aEnergies 15 03219 g013b
Figure 14. Influenced area under inhomogeneous partial shading induced by dust accumulation for (left) full cell, (middle) half cell with a mirrored design and (right) half cell with uniform design (adapted with permission from [66]).
Energies 15 03219 g014
Figure 15. Comparison of measured power and current ratios of the the full cell, half cell (mirrored) and half cell (uniform) when the bottom row of the modules were 100% shaded.
Energies 15 03219 g015
Figure 16. Market share of PV modules with full-, half- and third-cell layouts with wafer sizes below M10 [47].
Energies 15 03219 g016
Figure 17. (left) Comparison of component costs for half-cell and full-cell modules with five-busbar solar cells and (right) a magnification of the left diagram between 65 and 70 EUR/module to highlight the difference in components’ costs between the modules.
Energies 15 03219 g017
Figure 18. Techno-economical advantages of half-cell modules for initial costs, performance and soiling issues and cell displacement. These advantages indicate a lower LCOE for half-cell modules in desert climates.
Energies 15 03219 g018
Table 1. Different wafer dimensions and their related short-circuit current for partial cells.
TypeLength [mm]Width [mm]Area [cm2]ISC [A]ISC-Full-cell [A]ISC-Half-cell [A]ISC-Third-cell [A]
M1156156243.49.39.34.73.1
M2156.75156.75245.79.49.44.73.1
M3158.75158.75252.09.69.64.83.2
M4161.7161.7261.510.010.05.03.3
M5165165272.310.410.45.23.5
M66666275.610.510.55.33.5
M10182182331.212.712.76.34.2
M12210210441.016.916.98.45.6
Table 2. Specifications of the splitting device, factory capacity and operating costs within the lifetime of the device for a company using M2 wafers.
Specification of the Splitting Device
Laser machine life span10 years
Laser unit time span5 years
Electricity consumption3 kW
Cutting speed1 cut/s
Breakage rate0.1%
Total cuts per year31,504,464
Factory capacity
Solar cell power 5 W
Yearly factory capacity 157.52 MW
Total costs per year (for 10 years)
Laser machine 300,000 EUR
Laser unit1000 EUR
Electricity7776 EUR
Maintenance 3000 EUR
Labor31,200 EUR
Table 3. Costs of module components [65]; it should be noted that the numbers below, especially the solar cell prices, are subject to rapid changes.
Specification of the Splitting Device
Laser machine life span10 years
Laser unit time span5 years
Electricity consumption3 kW
Cutting speed1 cut/s
Breakage rate0.1%
Total cuts per year31,504,464
Factory capacity
Solar cell power5 W
Yearly factory capacity157.52 MW
Total costs per year (for 10 years)
Laser machine300,000 EUR
Laser unit1000 EUR
Electricity7776 EUR
Maintenance3000 EUR
Labor31,200 EUR
Publisher’s Note: MDPI stays neutral with regard to jurisdictional claims in published maps and institutional affiliations.

