Article

A Novel TSA-PSO Based Hybrid Algorithm for GMPP Tracking under Partial Shading Conditions

1
Department of Electrical and Electronics Engineering, Ariel University, Ariel 40700, Israel
2
Department of Electrical and Electronics Engineering, University of Petroleum and Energy Studies, Dehradun 248007, India
3
Department of Physics, University Centre for Research and Development, Chandigarh University, Mohali 140431, India
4
MCAST Energy Research Group (MCAST Energy), Institute of Engineering and Transport, Malta College of Arts, Science and Technology (MCAST), Triq Kordin, PLA 9032 Paola, Malta
*
Authors to whom correspondence should be addressed.
Energies 2022, 15(9), 3164; https://doi.org/10.3390/en15093164
Submission received: 23 March 2022 / Revised: 21 April 2022 / Accepted: 24 April 2022 / Published: 26 April 2022
(This article belongs to the Special Issue Future Integration of Photovoltaic Systems)

Abstract

:
In this paper, a new hybrid TSA-PSO algorithm is proposed that combines tunicate swarm algorithm (TSA) with the particle swarm optimization (PSO) technique for efficient maximum power extraction from a photovoltaic (PV) system subjected to partial shading conditions (PSCs). The performance of the proposed algorithm was enhanced by incorporating the PSO algorithm, which improves the exploitation capability of TSA. The response of the proposed TSA-PSO-based MPPT was investigated by performing a detailed comparative study with other recently published MPPT algorithms, such as tunicate swarm algorithm (TSA), particle swarm optimization (PSO), grey wolf optimization (GWO), flower pollination algorithm (FPA), and perturb and observe (P&O). A quantitative and qualitative analysis was carried out based on three distinct partial shading conditions. It was observed that the proposed TSA-PSO technique had remarkable success in locating the maximum power point and had quick convergence at the global maximum power point. The presented TSA-PSO MPPT algorithm achieved a PV tracking efficiency of 97.64%. Furthermore, two nonparametric tests, Friedman ranking and Wilcoxon rank-sum, were also employed to validate the effectiveness of the proposed TSA-PSO MPPT method.

1. Introduction

A photovoltaic (PV) system offers the lowest cost, highest payback, and cleanest source of power compared with any other energy option available in today’s market [1]. Integration of variable renewable energy into the power system may result in higher integration expenses for both energy systems and customers [2]. However, dependency on weather conditions and high construction costs are the current PV power system’s significant issues [3]. PV systems are frequently harmed by dirt, dust, or shadowing from nearby factors such as trees and buildings. Partially shaded circumstances can be caused by shadows [4]. The impacts of real-world situations on the performance and efficiency of solar panels were investigated in [5]. In another study, a long-term reliability assessment approach was employed to study the implications of climate change on the structural level of PV systems [6]. The production of electricity from a PV system is affected by temperature and irradiance, and its P–V curve has a singular peak known as a maximum power point (MPP) [7]. The maximum power point (MPP) varies as the solar irradiance changes, and it should be found for each new condition by a special electronic controller called a maximum power point tracker (MPPT) [8,9]. The MPPT is a key element for the effective operation of any PV-powered system. As a result, global maximum development has centered on developing best-fit MPPT approaches for achieving optimal PV tracked power [10,11]. There are numerous MPPT methods available, including perturb and observe (P&O) [12], hill climbing (HC) [13], incremental conductance (INC) [14], and others.
PV arrays are made up of modules [10], each of which is made up of a series of parallel connections of solar cells. Because of clouding changes, shade from trees, tall buildings, and neighboring objects, the PV array can obtain varying solar radiation on each module. During partial shading conditions (PSCs), some modules hinder the flow of energy from other normally irradiated solar panels; thus, much less power is provided to consumers [15,16]. To avert this, bypass diodes are connected across the PV modules. Under PSCs, the voltage across shaded modules is much lower than that across others. As a result, the PV array has various peaks on the P–V curve [17]. The maximum recognized peak among multiple peaks is known as the “global maximum power point” (GMPP), while the other peaks are known as local maximum power points (LMPPs). These local and global MPPs are affected by changes in solar insolation and PV array patterns. Traditional MPPT algorithms are incapable of tracking the GMPP on several peaks on the P–V curve; they are only best suited for tracking a single peak on the P–V curve [18]. The main disadvantages of traditional methods are energy loss during steady-state and poor efficiency. This issue can be solved by employing appropriate optimization methods under PSCs [19].
Previously developed MPPT (P&O, INC, etc.) methods were based explicitly on deterministic approaches, functioning quite effectively in the conditions characterized by homogeneous insolation [20]. However, deterministic approaches fail in PSCs since they most frequently find local instead of global maximums [21]. More successful methods for PSCs can be based on heuristic algorithms that imitate wildlife behavior [22]. Following this methodology, bio-inspired swarm optimization algorithms have provided a real-time solution to address the problem of MPPT under PSCs with rapid convergence, and accurate confirmations of this optimal solution have been developed [23,24]. Among these new methodologies, the particle swarm optimization (PSO) technique is significant as it provides a substantial solution to find a global maximum with greater precision and rapid convergence [25]. The main disadvantage of PSO methods is the occurrence of convergence under huge iterations and swarm alteration with a high updating pace. In [26], the authors proposed a modified version of PSO that has both deterministic and adaptive heuristic entities. This modification improved the intrinsic randomness in the classic PSO algorithm, providing an increased velocity of global maximum finding. However, a comparison with advanced MPPT techniques was missing in this research work. In another research investigation [11], the authors employed the ant colony optimization (ACO) technique to track the GMPP under PSCs. This research paper, however, lacked an experimental discussion on the MPPT controller under various operating climates.
In [12], Shi et al. anticipated an improved cuckoo search (ICS) optimization technique and proved its efficiency over PSO, P&O, and the standard version of CS through a simulation and experimental setup under PSCs. Nonetheless, in this study, a traditional buck converter was used to design a PV emulator-based power schematic. Furthermore, MPPT algorithms based on the latest methods were not covered in this work.
In another study [13], the authors utilized the bat algorithm (BA) for MPPT tracking under four different patterns of PSCs and validated performance through their experimental setup. Nonetheless, MPPT operation under various operating conditions was not explored using recent algorithms. Other algorithms such as hybrid GSA-PSO [14], improved differential evolutionary (IDE) [24], and flower pollination algorithm (FPA) [25] achieve the global peak rapidly. Recently, various improvements of PSO such as OD-PSO [26] and hybrid ELPSO-P&O [27] were anticipated for tracking the GMPP under several peaks on the P–V curve.
Retaining the previously mentioned limitations in mind, the primary goals of the suggested hybrid tunicate swarm algorithm and particle swarm optimization (TSA-PSO) technique were to have the shortest tracking and settling time, the highest efficiency, the lowest cost, and the fewest oscillations and fluctuations. Our suggested TSA-PSO has the following features to meet these requirements:
  • The suggested TSA-PSO can be implemented for the PV system under different weather conditions.
  • The proposed TSA-PSO can address the issues related to previously implemented metaheuristics techniques such as slow convergence, slow settling time, and abrupt oscillation behavior. It also evades the local maxima. In addition, complex partial shading is successfully addressed by the proposed TSA-PSO method.
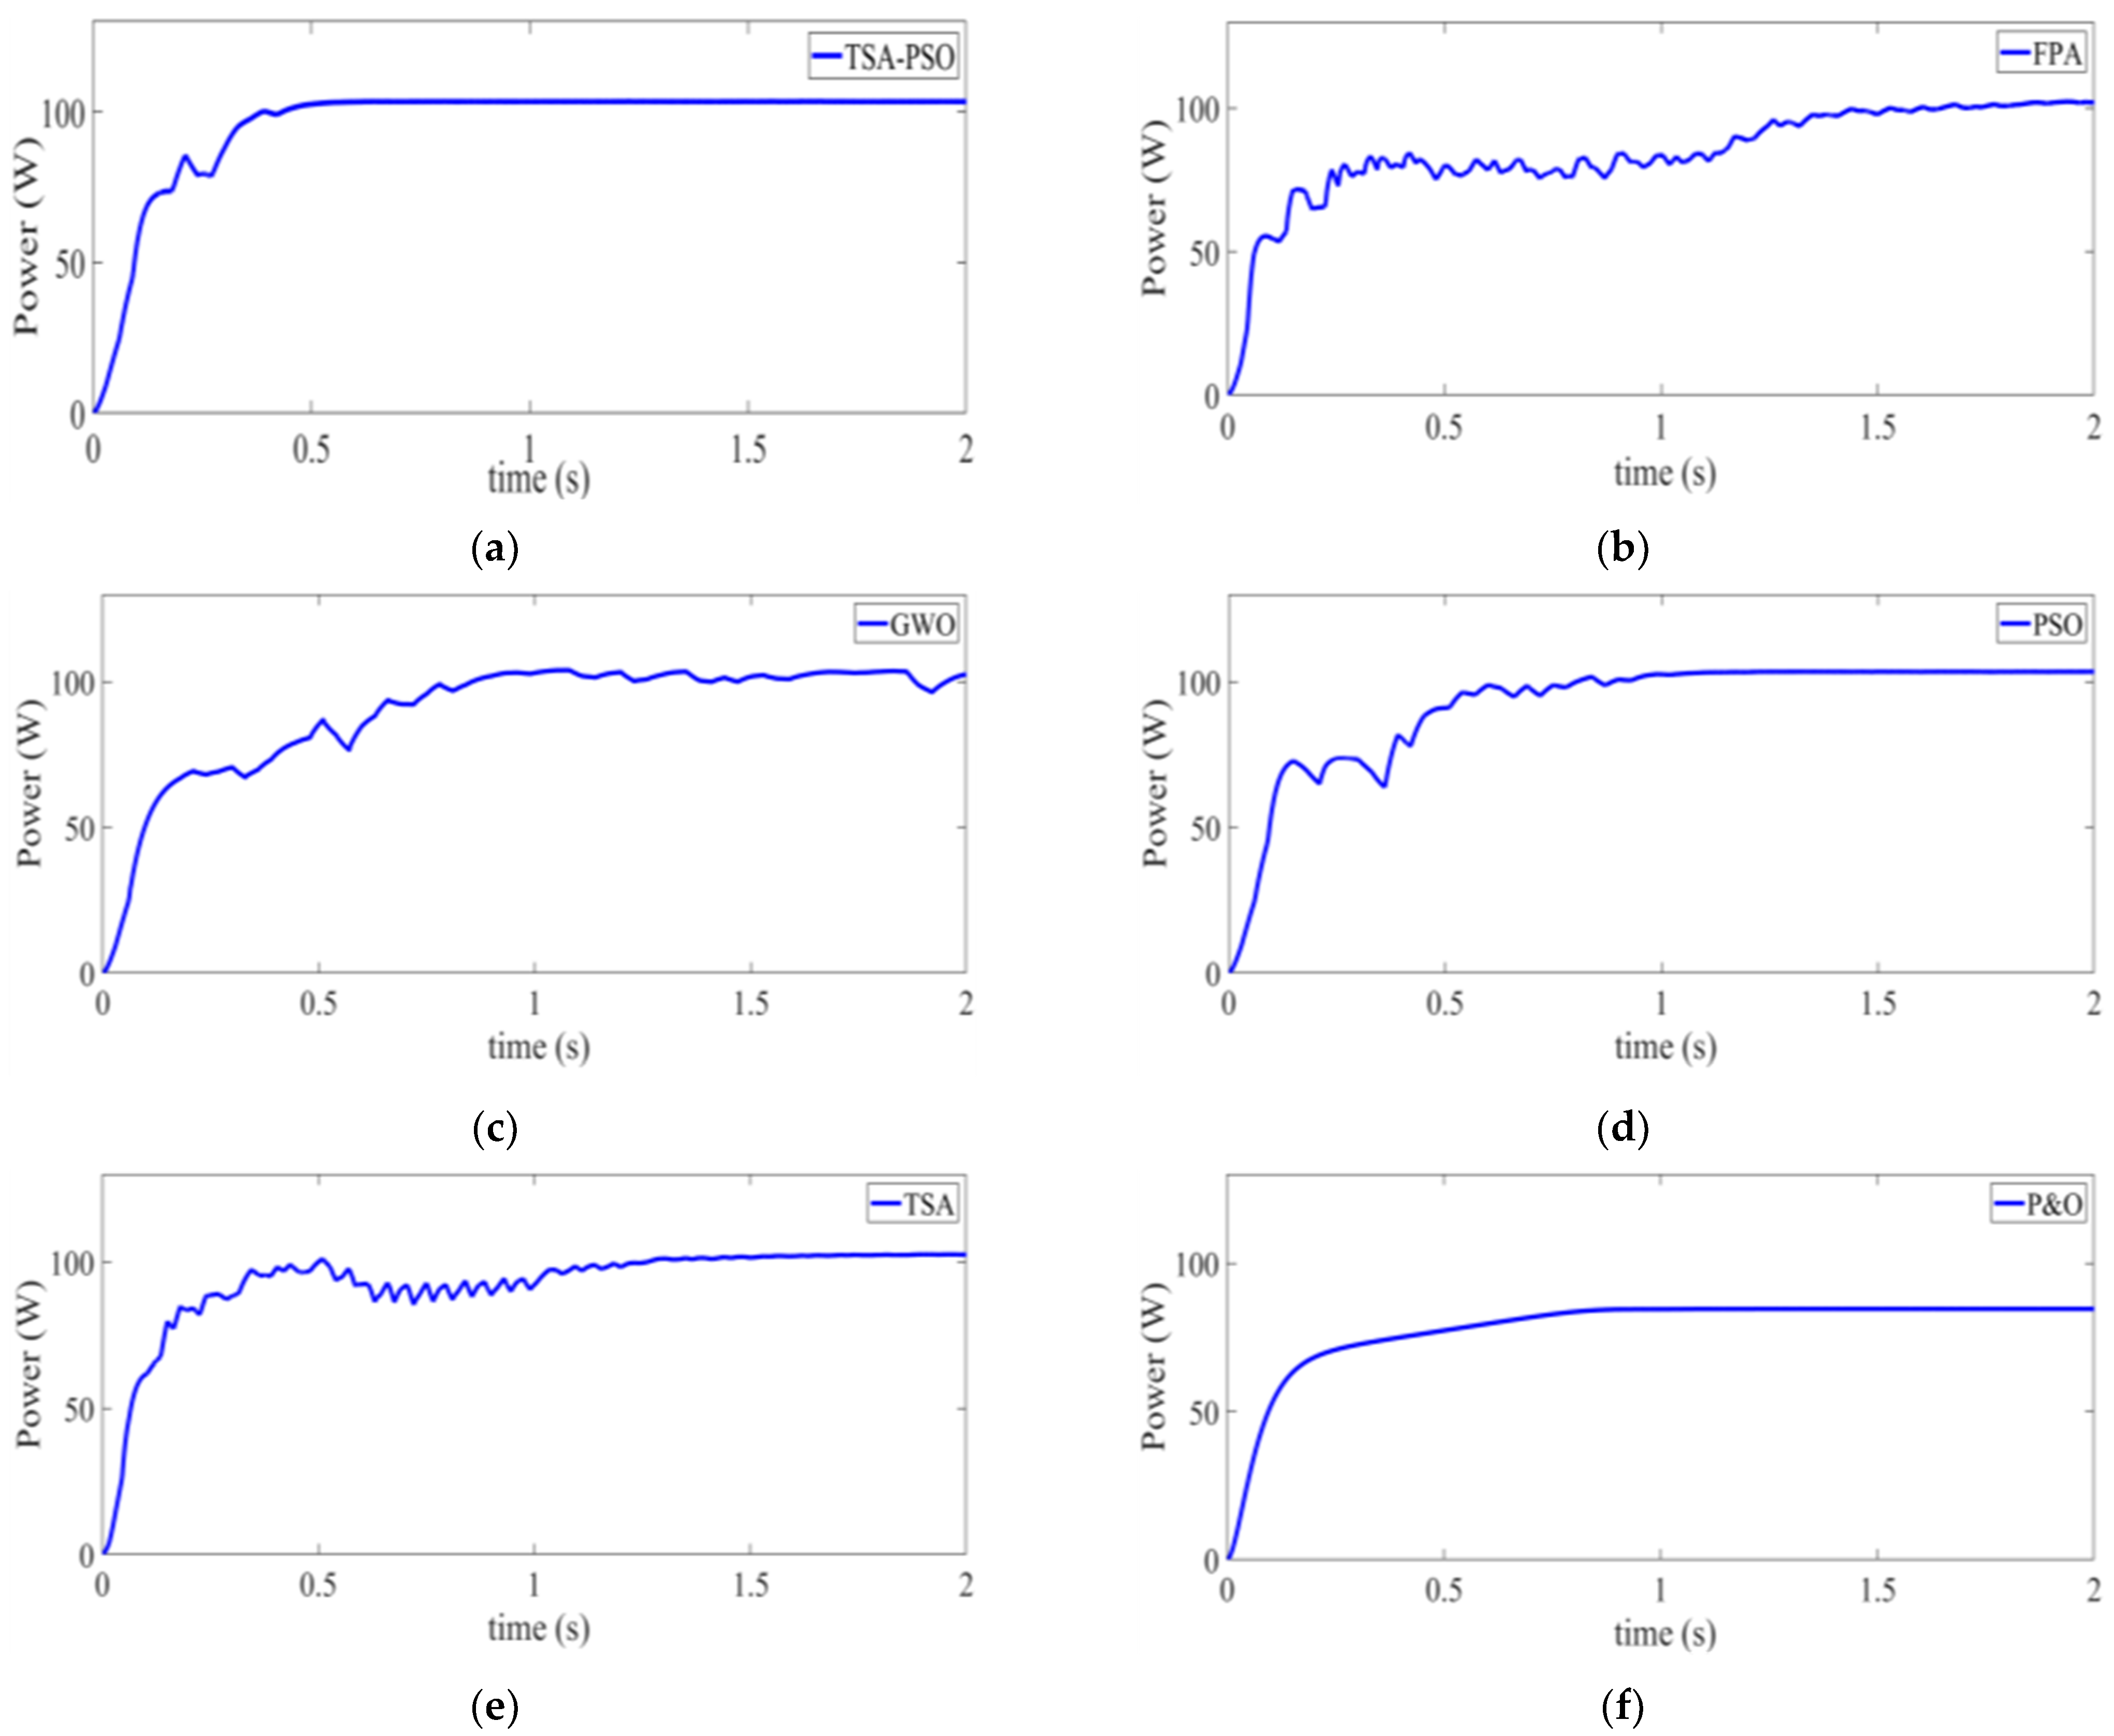
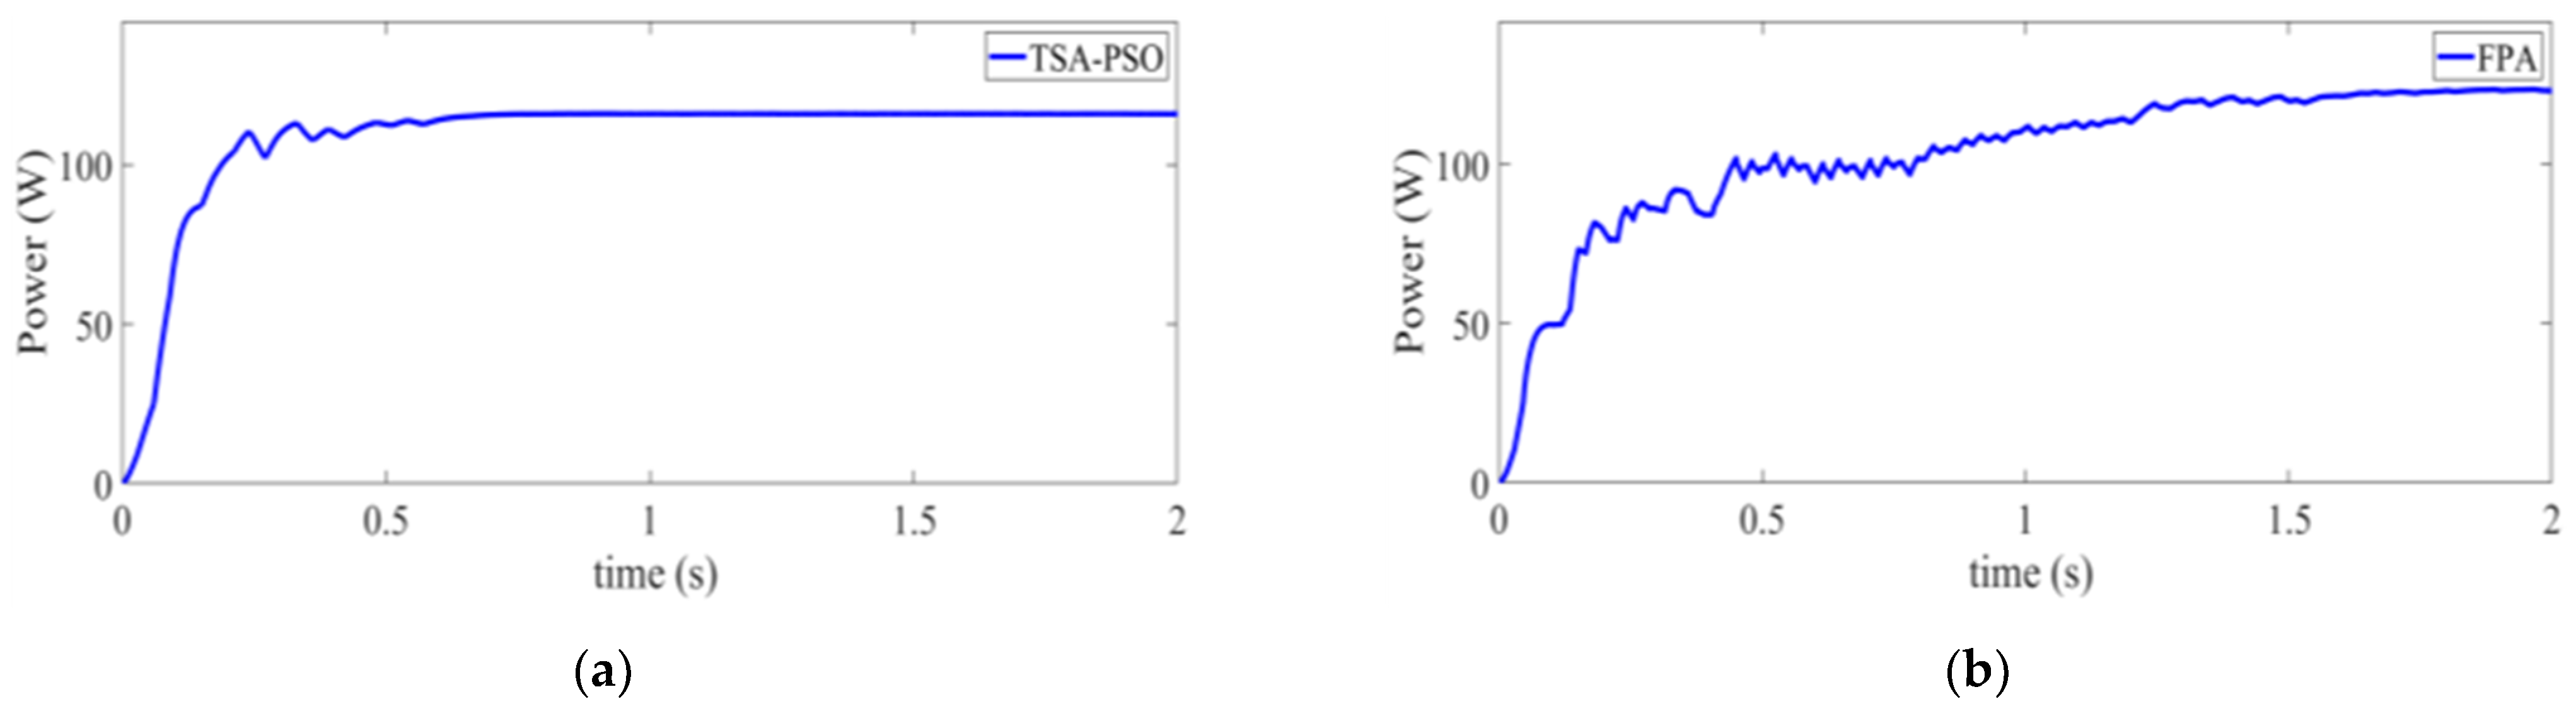
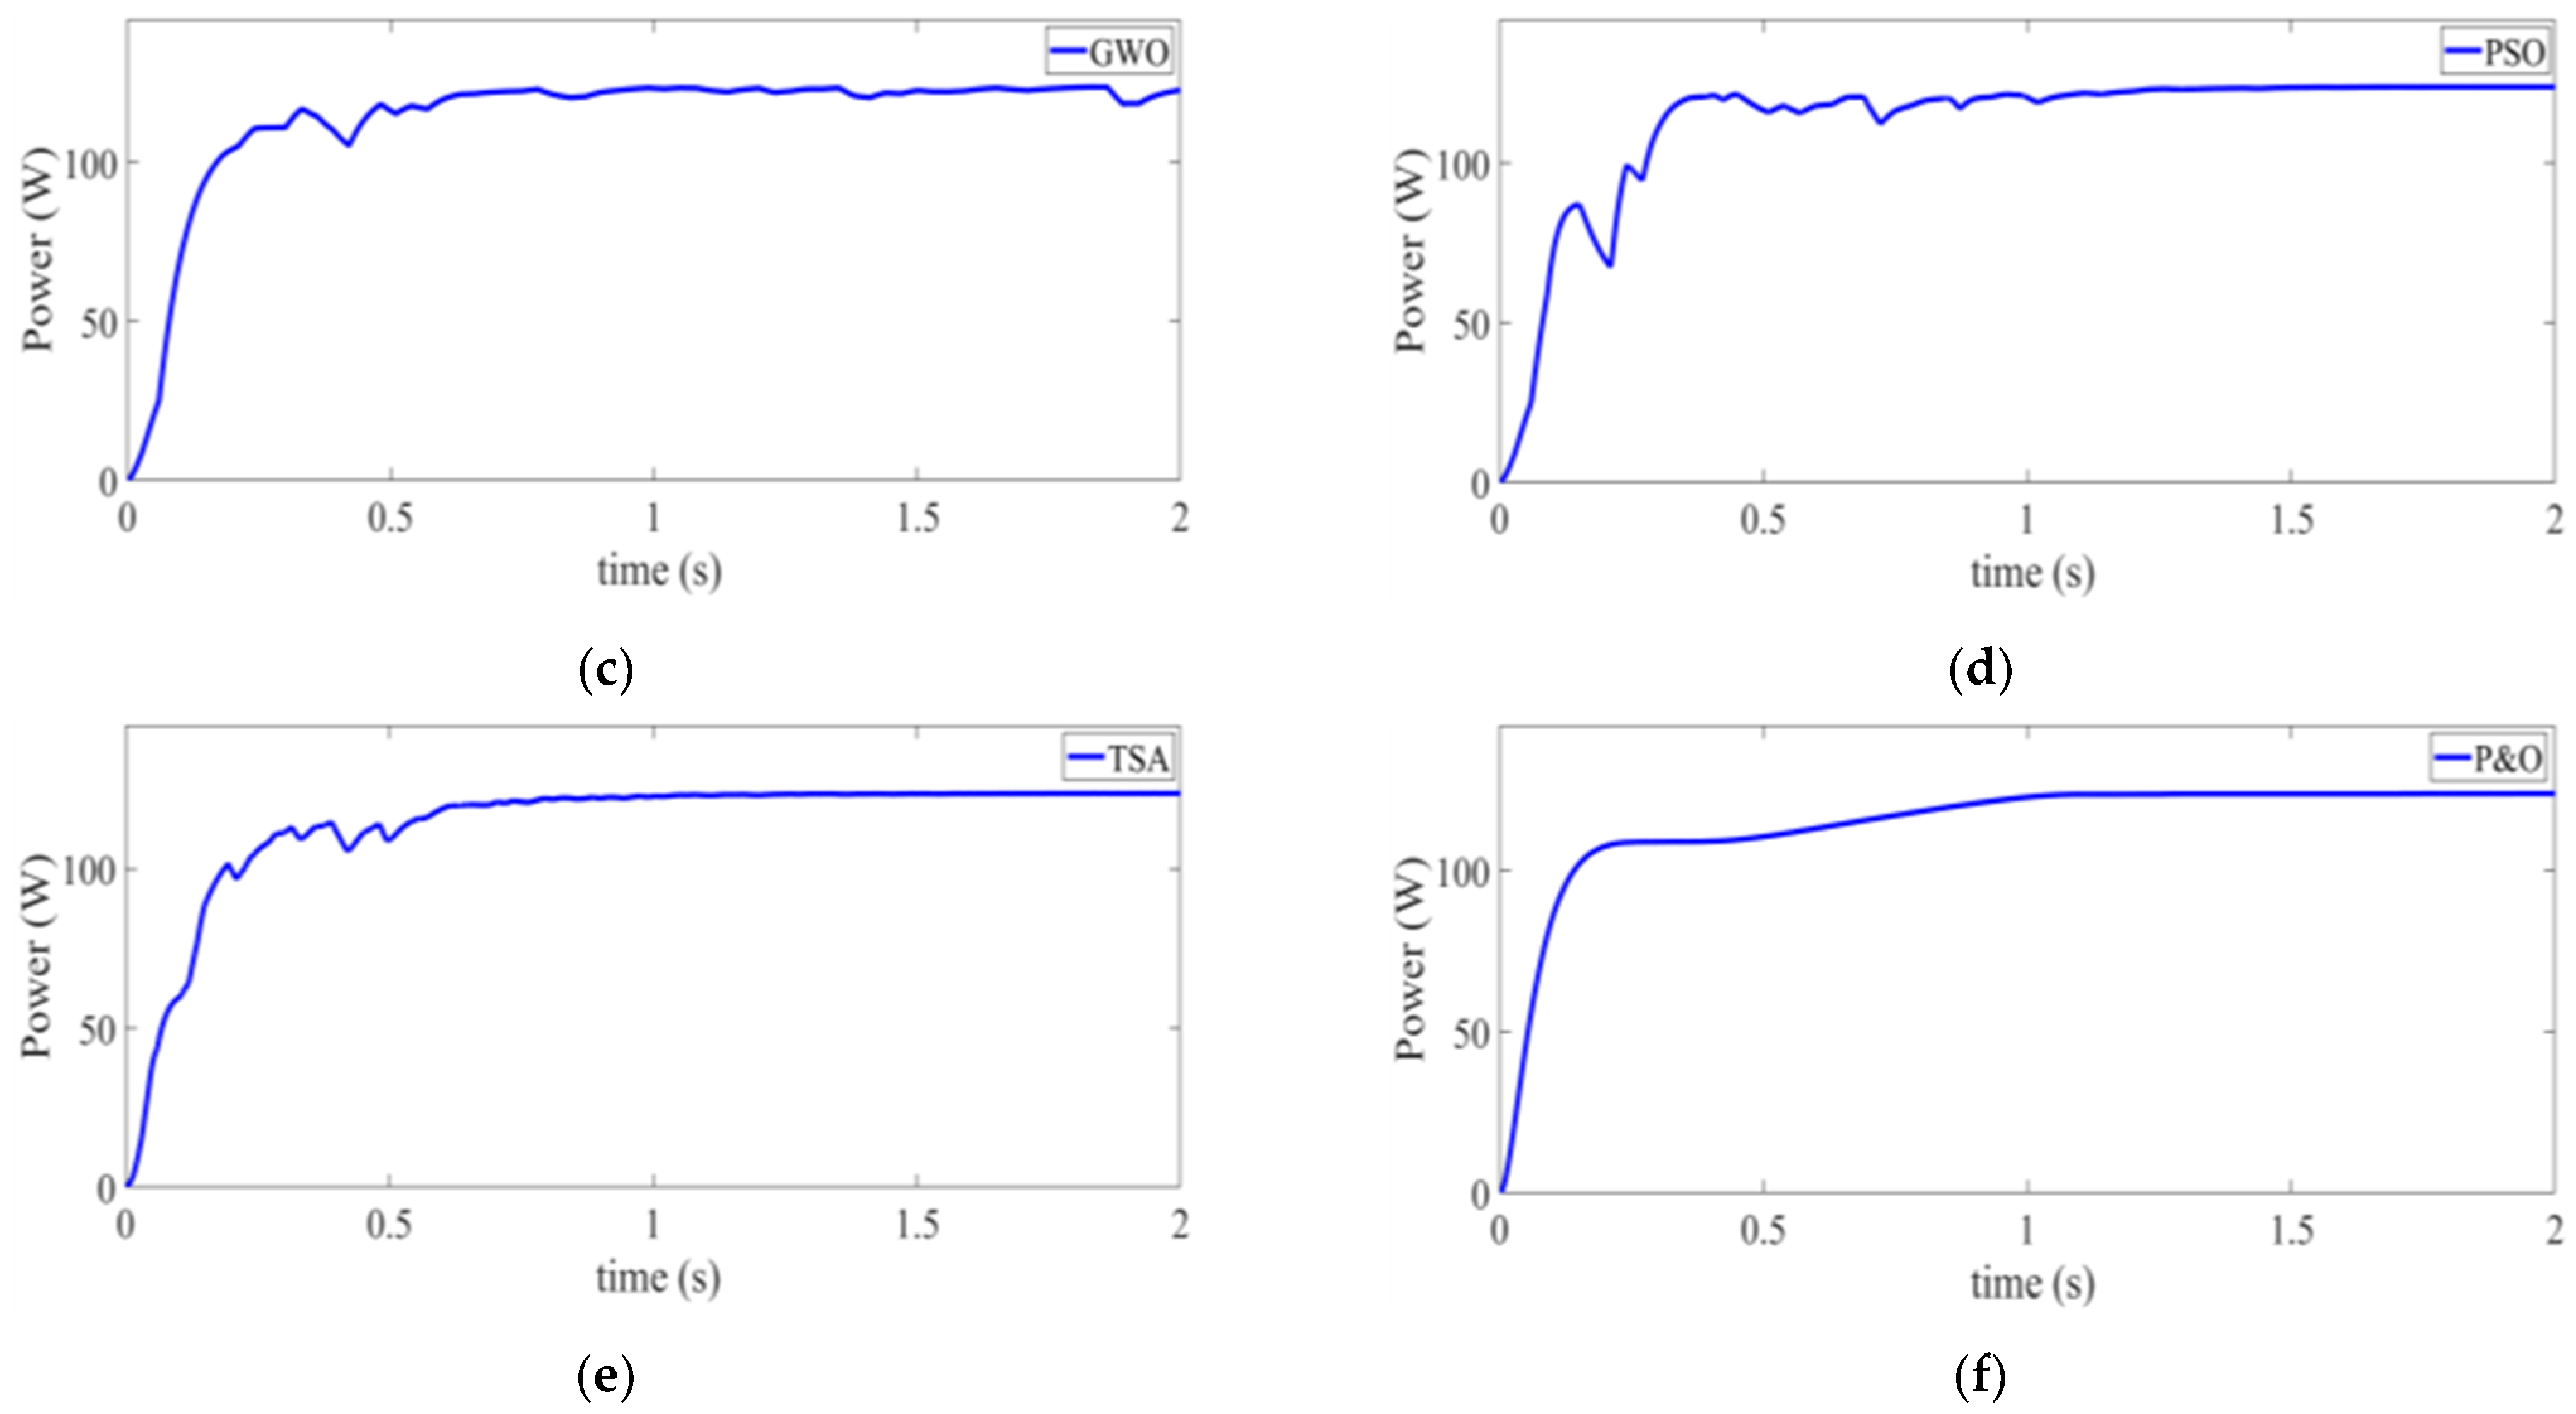
  • The effectiveness of the suggested technique was demonstrated experimentally under various partial shading patterns; it was compared to the FPA, GWO, PSO, TSA, and P&O algorithms, which were all executed in the same circuit circumstances and evaluated under identical environments.
The rest of the paper is organized as follows: Section 2 discusses the PV characteristics in terms of PSCs. Section 3 provides an outline of the proposed hybrid TSA-PSO algorithm and the GMPPT assessment. Section 4 presents the experimental verification, results, and discussion. Section 5 provides the conclusive remarks and future scope.

2. Recently Published Metaheuristics-Based GMPPT Algorithms

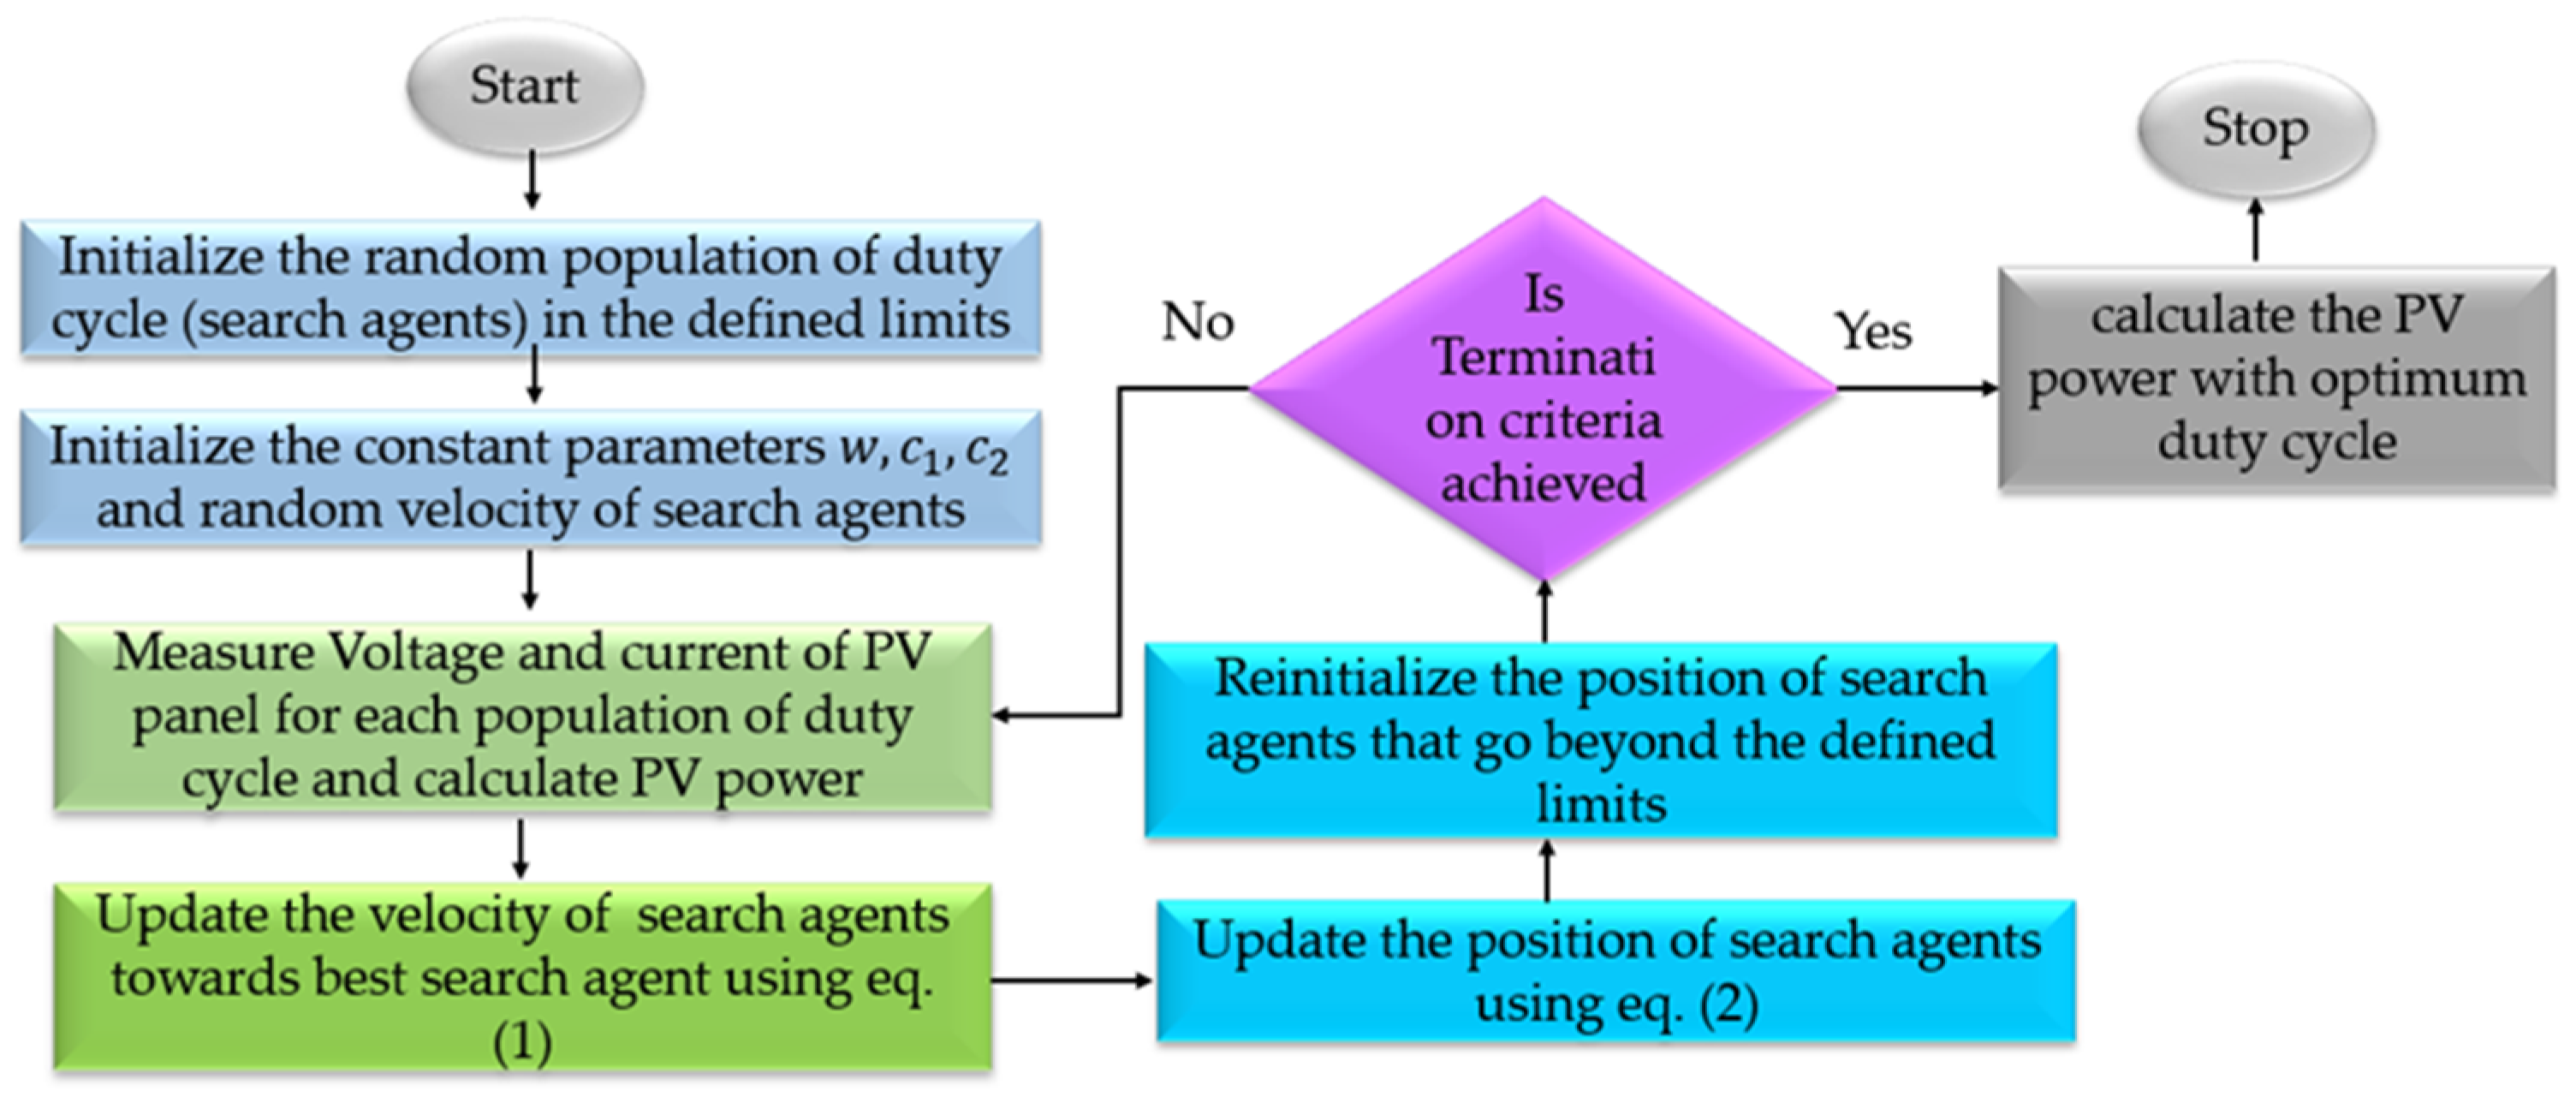
2.1. Particle Swarm Optimization (PSO)

Environmental researcher Russell C. Eberhart and social researcher James Kennedy proposed and officially invented the particle swarm optimization (PSO) technique [28]. This approach has a lot to do with some of the social relationships, assumptions, and behaviors that come from the mathematical modeling of the generalized socialist structure of a bird flock that is looking for food. Figure 1 depicts a general representation of the PSO technique.
In this method, each possible solution is denoted as a particle with a random speed and location in the search space. The search space is the set of all possible solutions to the problem that needs to be solved. Each particle moves and positions itself in the best way possible in the solution space. The mth particle in the PSO algorithm changes its speed and location at every Tth step according to the mathematical formulation given below.
V m T + 1 = W   *   V m T + r 1     C 1   ( P b e s t X m T ) + r 2     C 2   ( G b e s t X m T )
XmT+1 = XmT + VmT+1
where XmT and VmT symbolize the position and velocity vectors of the mth particle in the swarm, W signifies the inertia weight to sustain the stability between local and global search capability, and C1 and C2 represent the acceleration constant and are predefined by the user. r1 and r2 are random numbers generated in the range [0, 1]. Pbest is the personal best location of the mth particle at time T, and Gbest is the global best location of the mth particle within the swarm. A process flowchart of the PSO GMPPT algorithm is illustrated in Figure 2.

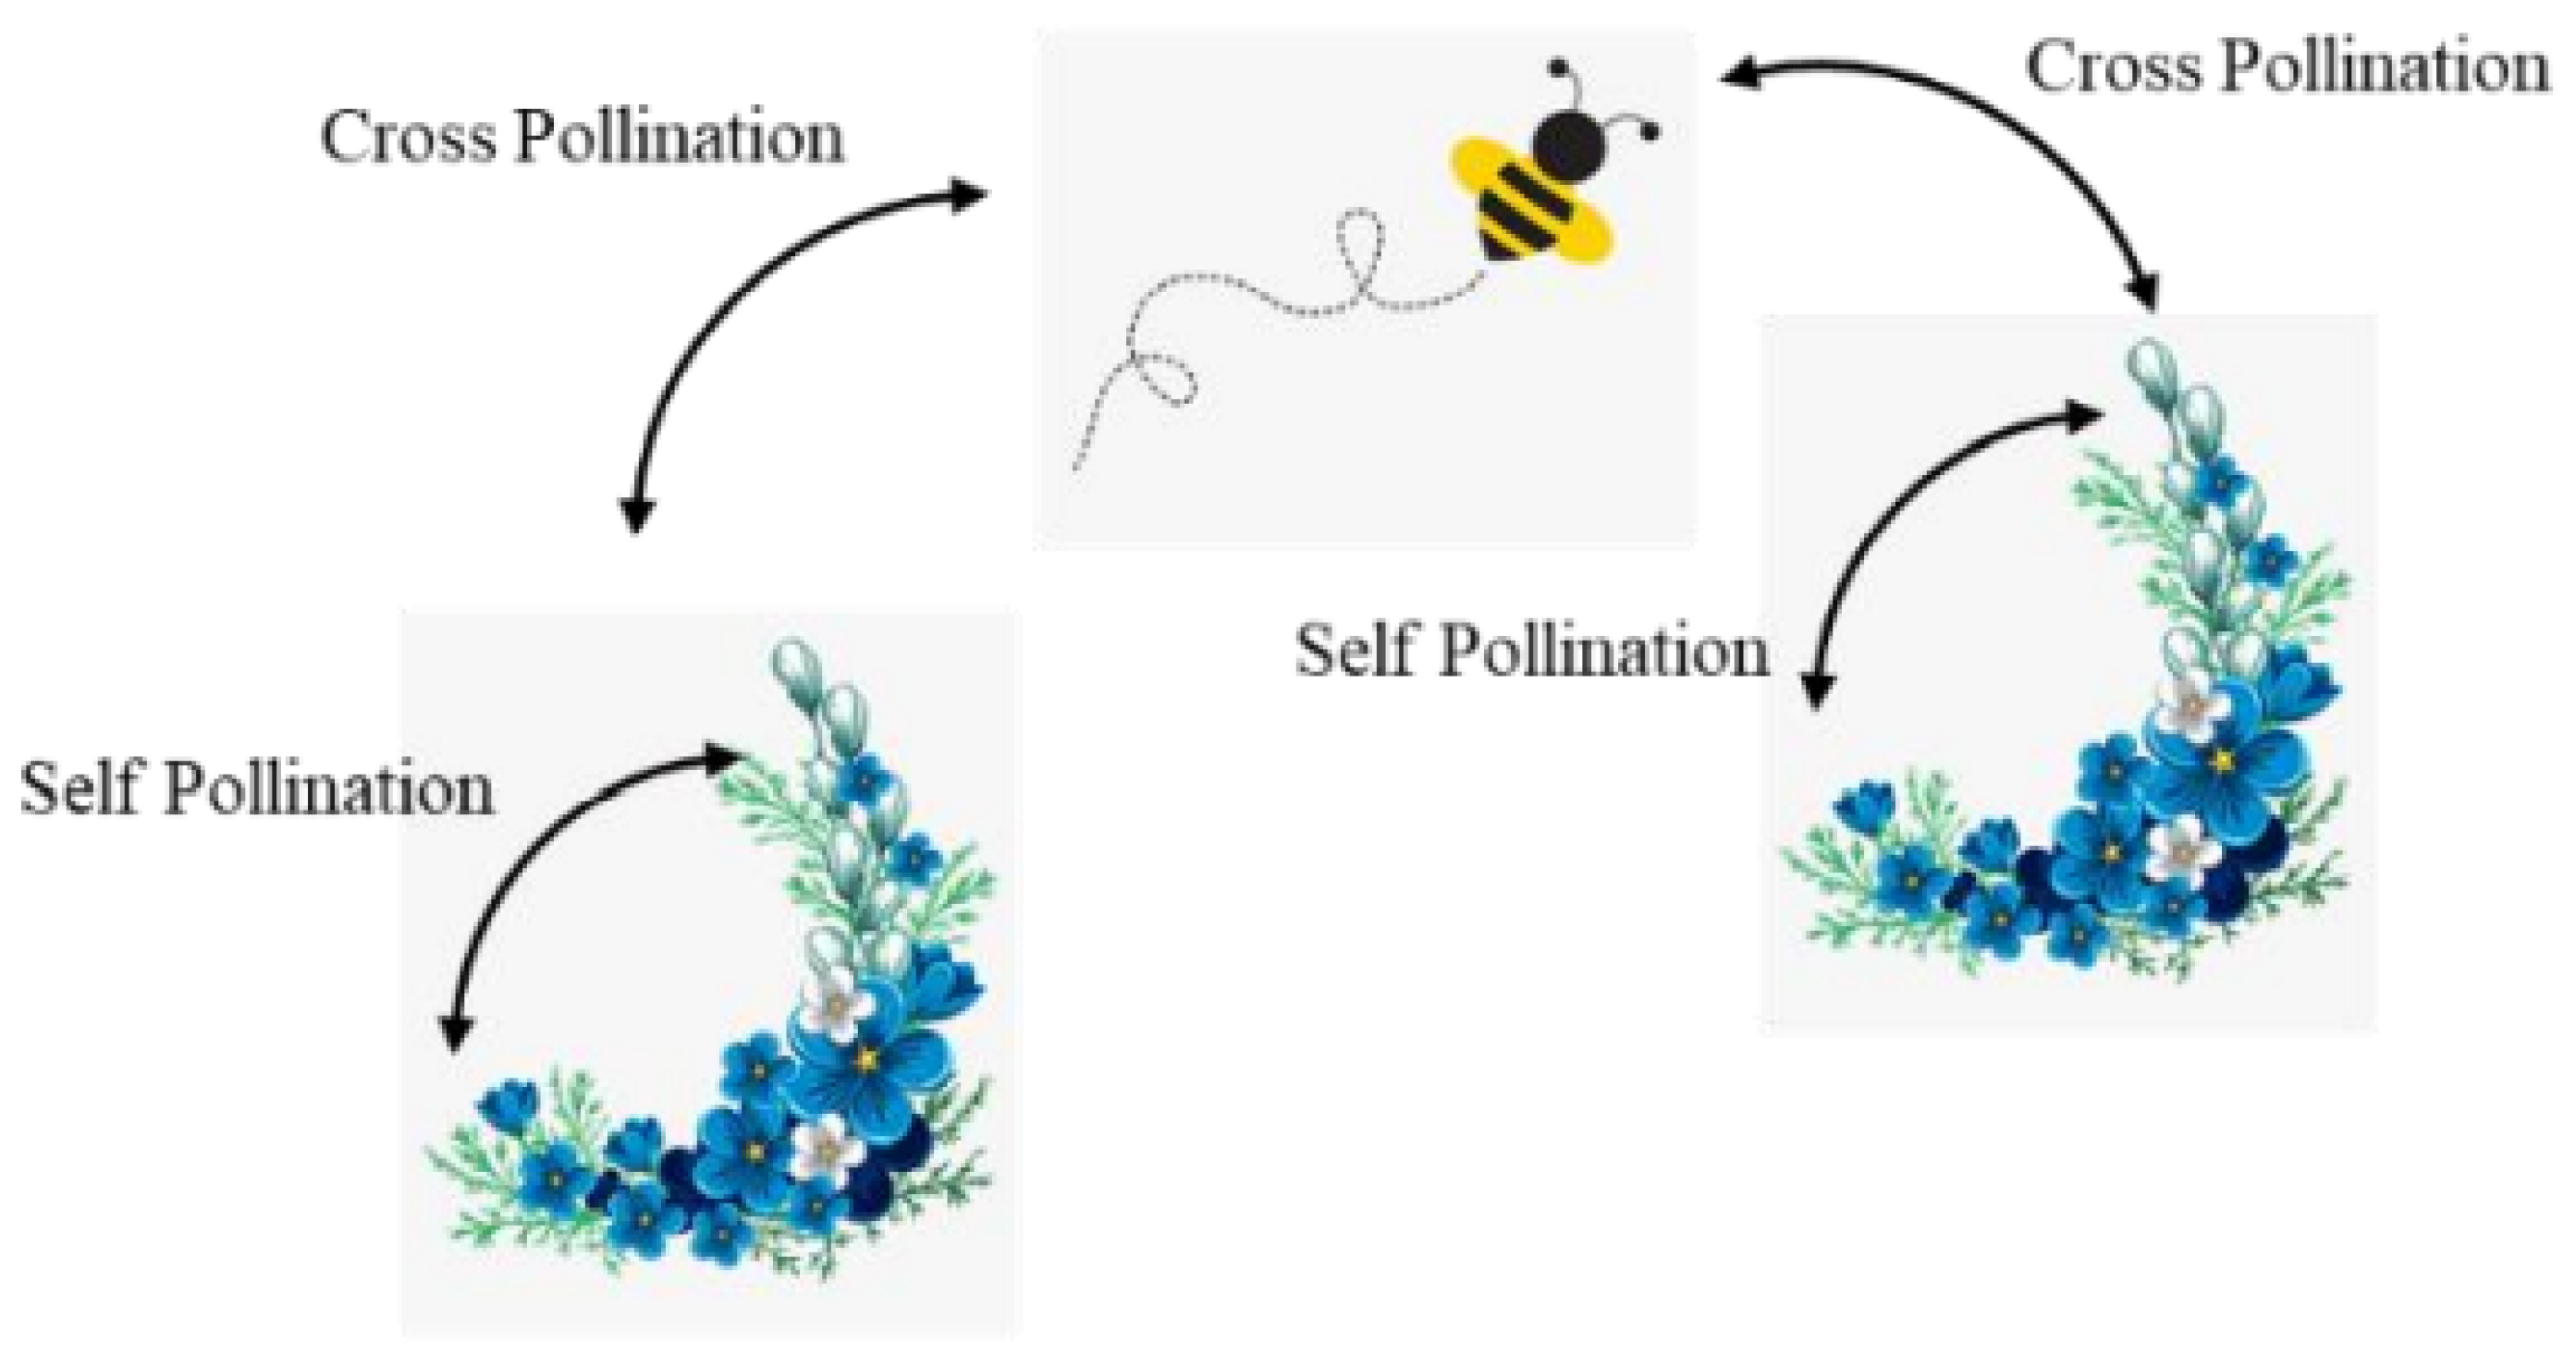
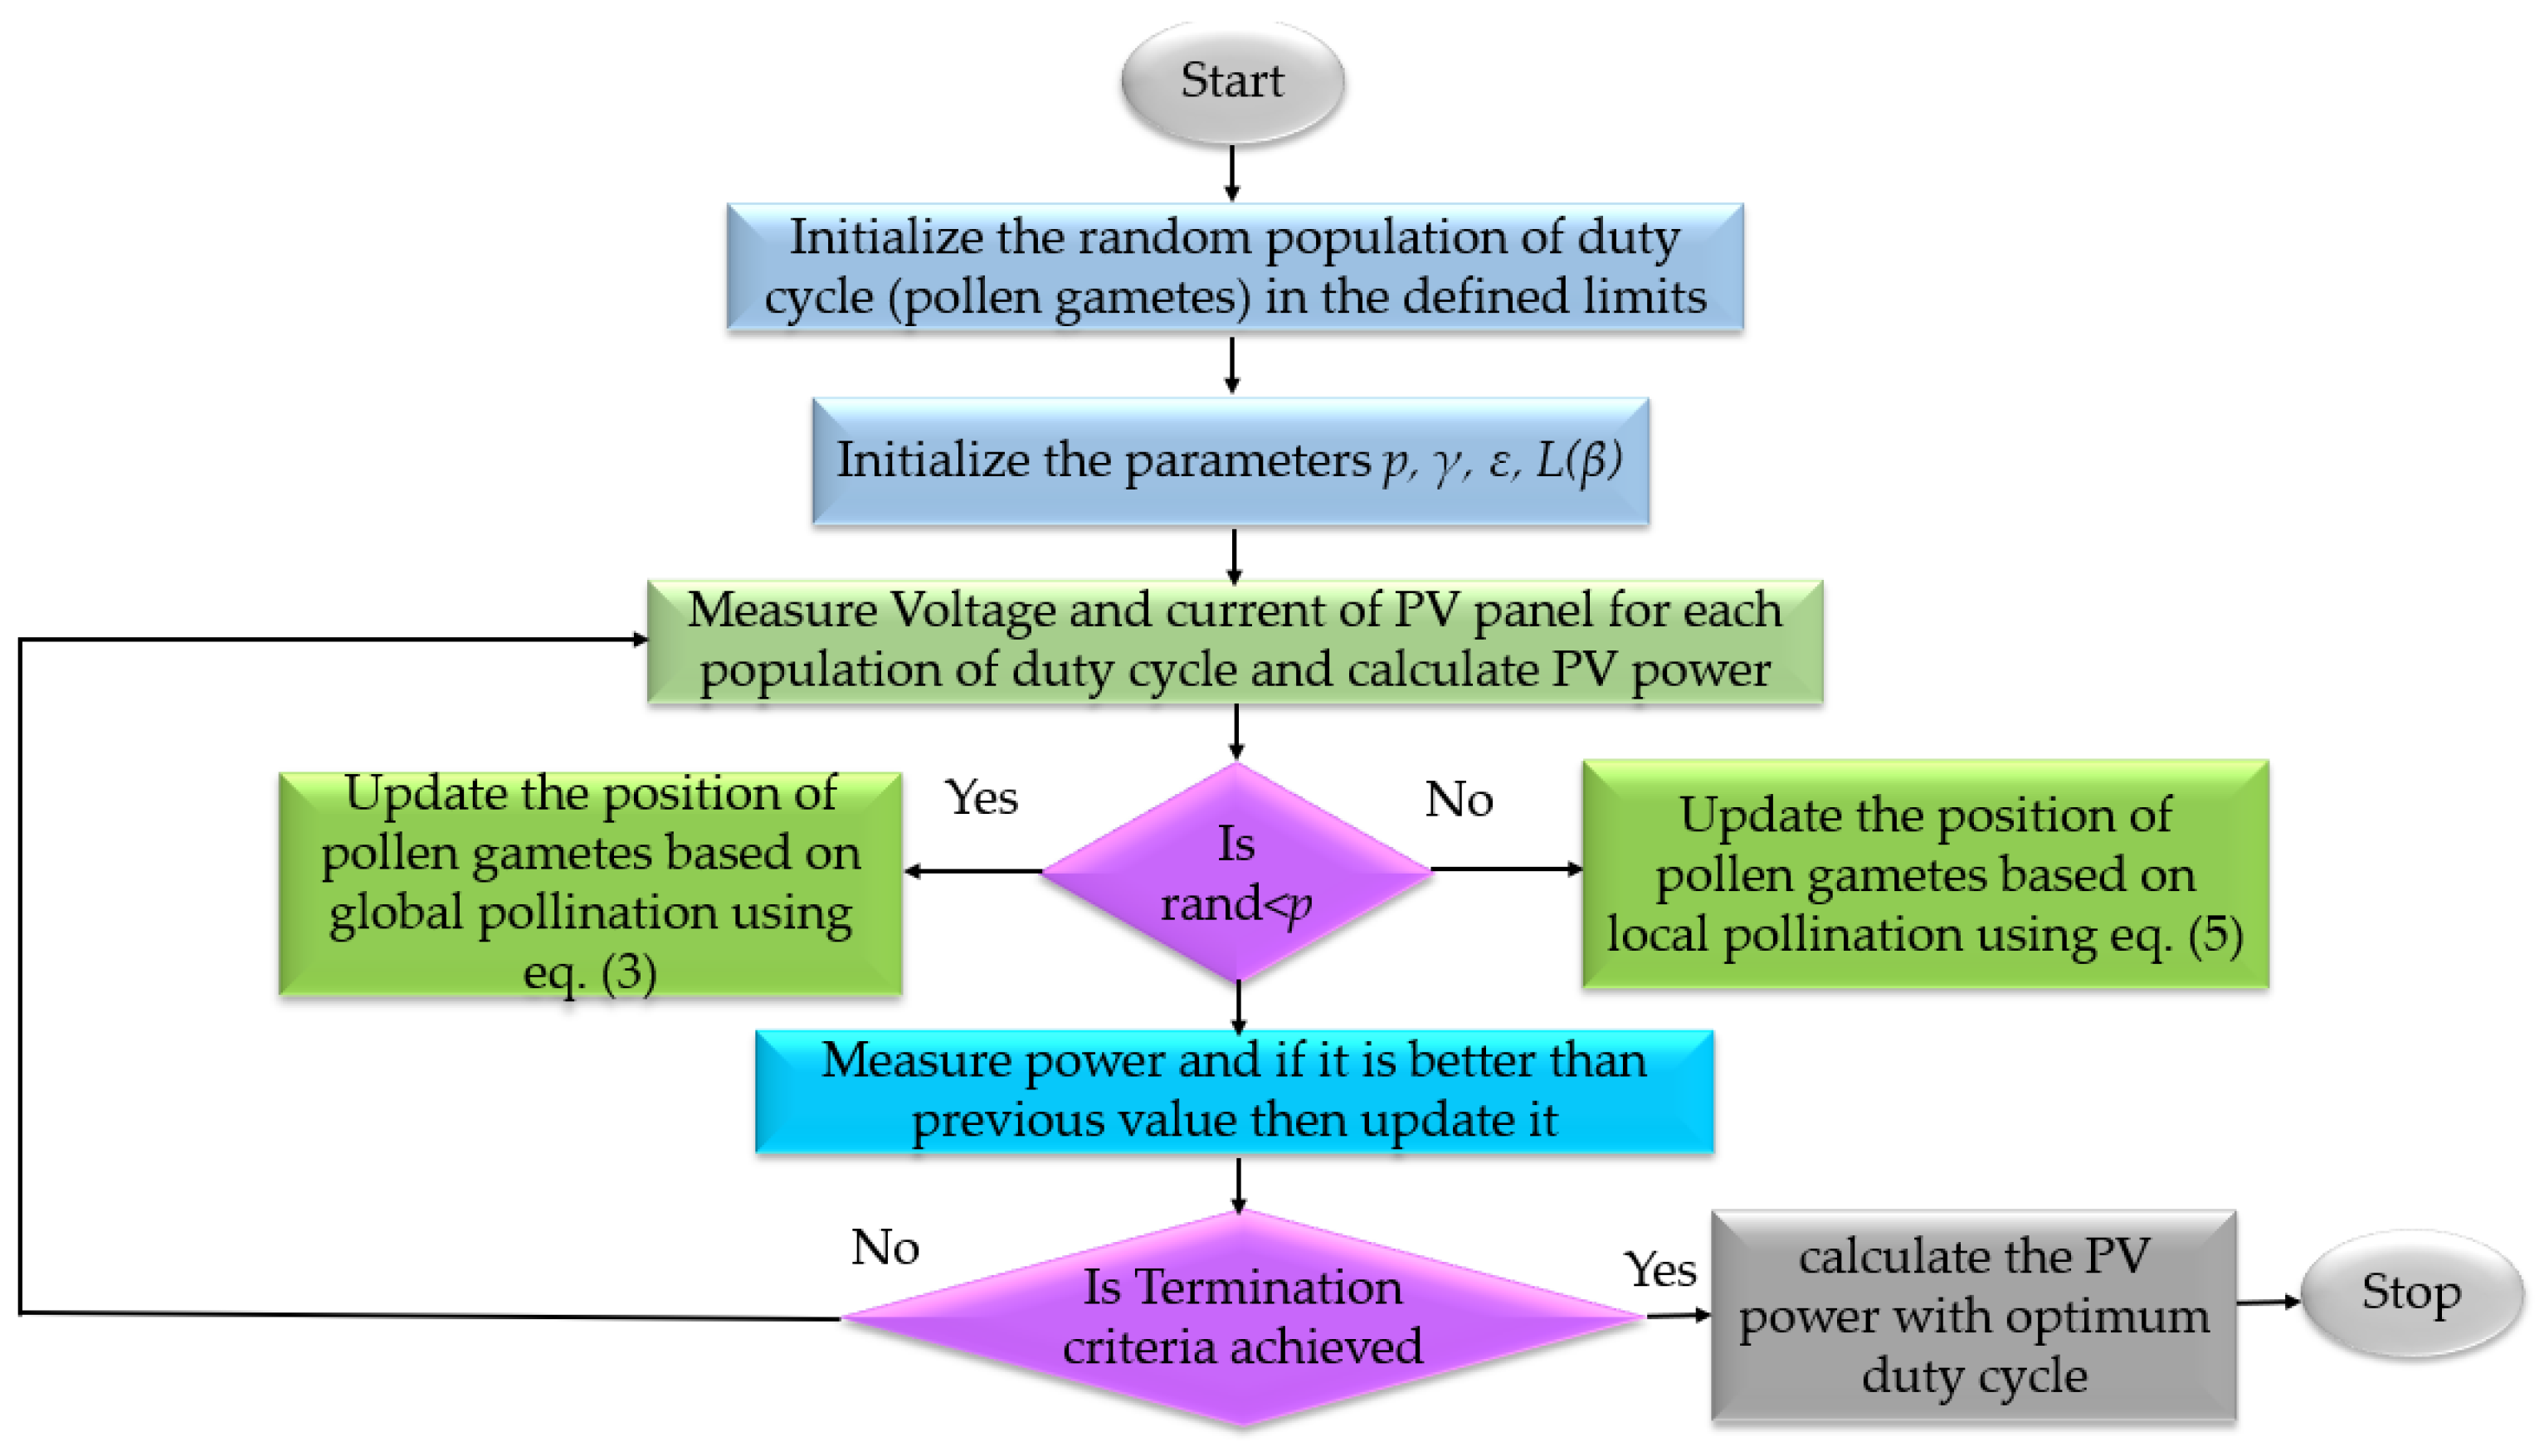
2.2. Flower Pollination Algorithm

Flower pollination algorithm (FPA) is a nature-inspired population-based algorithm developed by Xin-She Yang in 2012 [30]. The algorithm mimics the pollination process of flowers where the evolution of new offspring occurs through the transfer of pollen grains from the male anther to the female stigma. In nature, there are two types of pollination: abiotic and biotic pollination. Pollination is also categorized as self- or cross-pollination. In FPA, biotic and cross-pollination are defined as global pollination and abiotic and self-pollination are defined as local pollination. Figure 3 shows a pictorial representation of FPA.
In global pollination, pollen grains are carried over longer distances through small flying insects, which are mathematically modeled as:
x i t + 1 = x i t + L x i t g b e s t
where x i t is the pollen or the solution at the current generation t and g b e s t is the best solution among all the solutions in the current generation. L is the step size, which is defined using Lévy flight distribution as:
L ~ λ Ґ λ sin π λ / 2 π 1 s 1 + λ
where Ґ λ is the standard gamma function and s is the step size for which the value is considered to be greater than zero.
Local pollination is mathematically modeled as:
x i t + 1 = x i t + x j t x k t
where x j t and x k t refer to pollens from different flowers of the same plant and is obtained through uniform distribution [0, 1]. Local and global pollination are carried out in FPA through switch probability, and its value lies in the range [0, 1]. Figure 4 shows a process flow diagram of the FPA GMPPT algorithm.

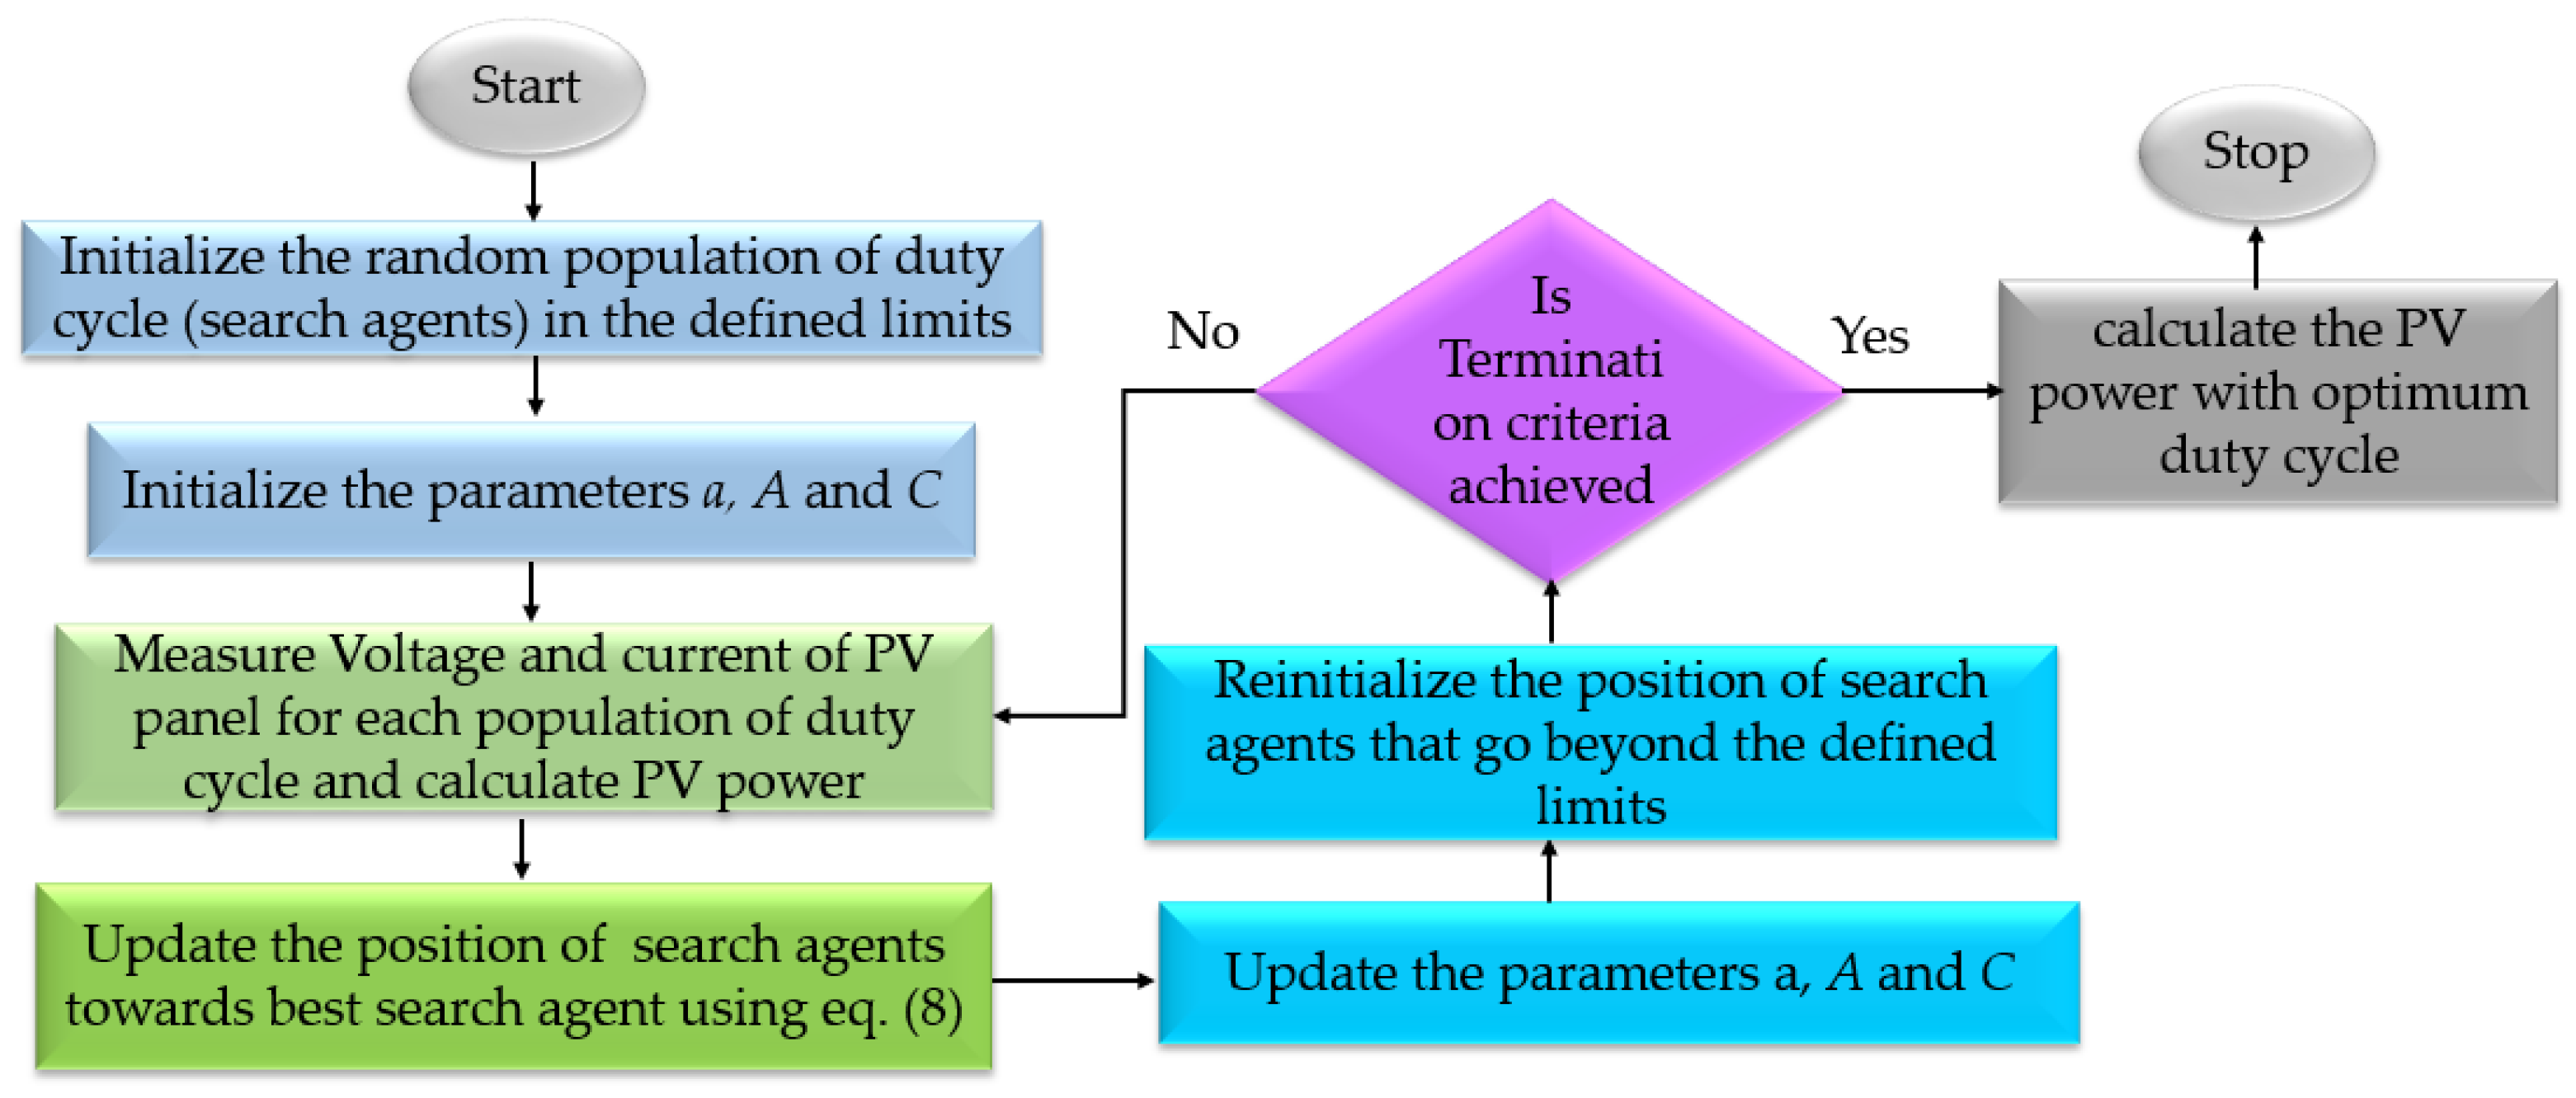
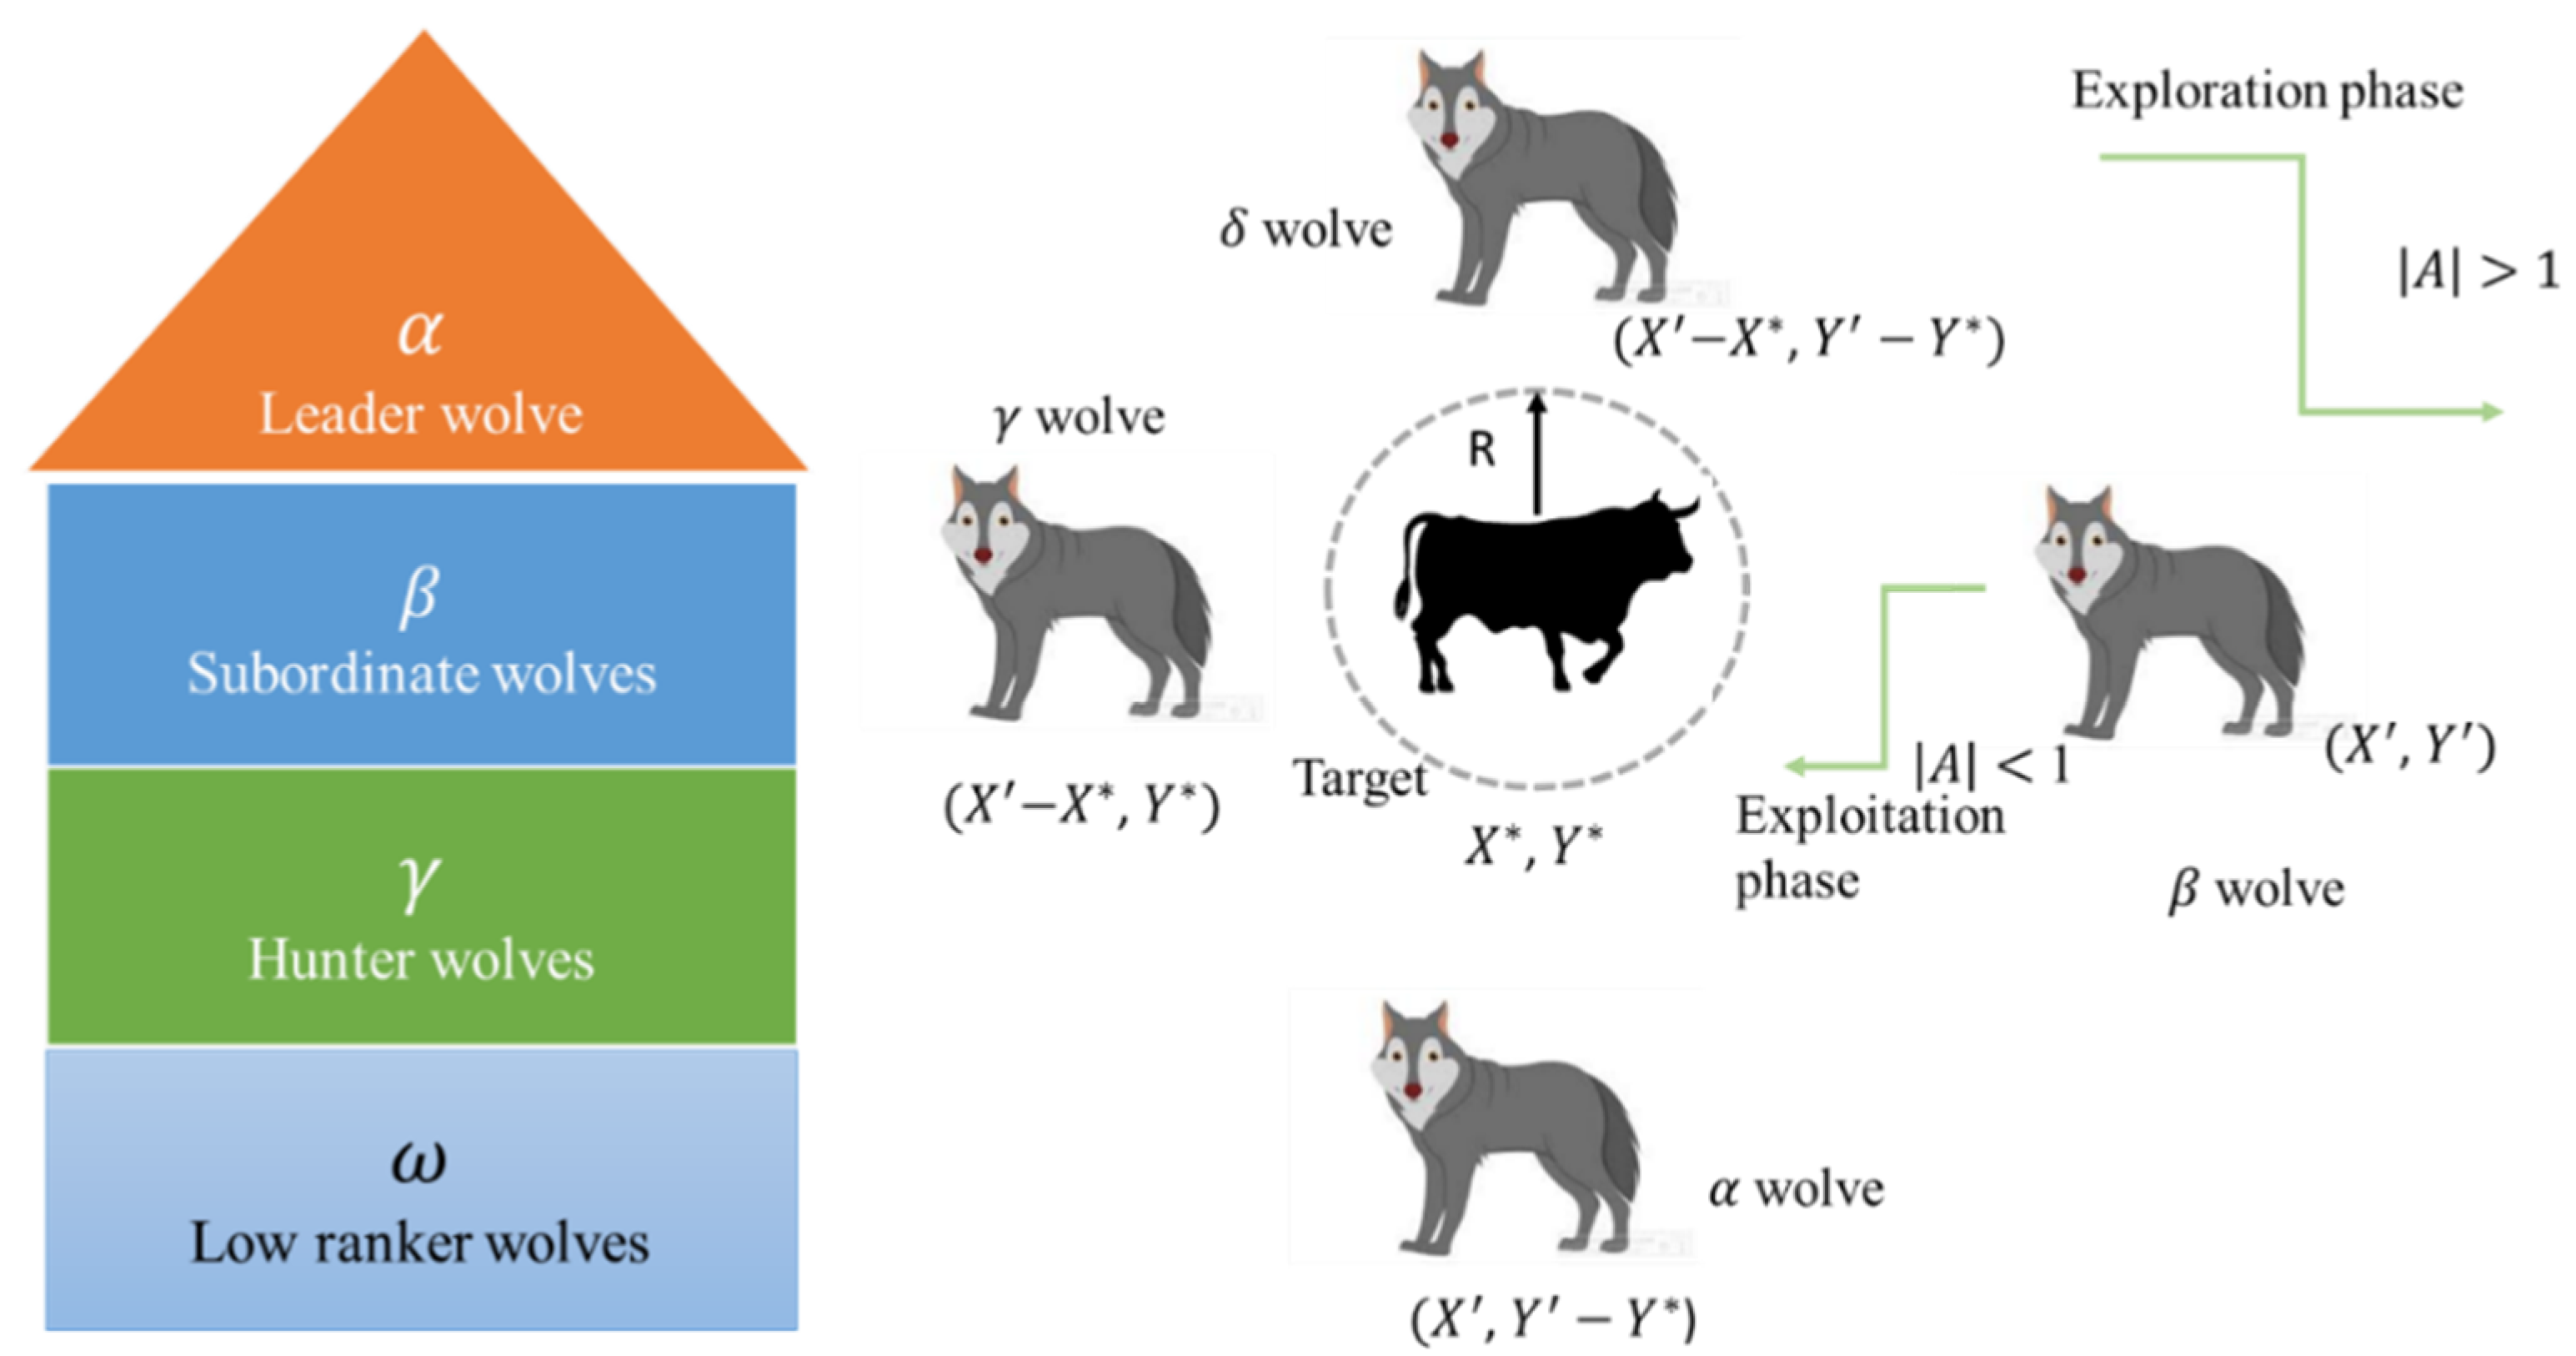
2.3. Grey Wolf Optimization

Grey wolf optimization (GWO) is a stochastic population-based swarm intelligence algorithm proposed by Mirjalili in 2014 [32]. GWO is inspired by the social hierarchy and hunting mechanism of grey wolves. These wolves are categorized based on their dominance and hierarchy as alpha, beta, delta, and omega. Alpha is the leader of the group, beta is subordinate to alpha, delta is the follower of alpha and beta, while omega is the babysitter in the pack and has to follow all other three dominant wolves. Grey wolves hunt in a group where they first track and chase the prey; then, they harass and encircle the prey; finally, they attack the prey. Figure 5 illustrates a pictorial representation of the GWO algorithm.
The encircling and attacking behavior of grey wolves is mathematically modeled based on the following equations:
D α = C 1 X α X ,           D β = C 2 X β X ,         D δ = C 3 X δ X
X 1 = X α A 1 D α ,         X 2 = X β A 2 D β ,         X 3 = X δ A 3 D δ
X t + 1 = X 1 + X 2 + X 3 3
where X α , X β , and X δ are the positions of alpha, beta, and delta grey wolves; X is the position of prey; A 1 , A 2 , and A 3 and C 1 , C 2 , and C 3 are the coefficients of α ,     β ,     and   δ wolves; and t denotes the current iteration.
The coefficients A and C are expressed as:
A = 2 a r 1 a
C = 2 r 2
where r 1   and   r 2 are random numbers in the range [0, 1] and a is a constant that is iteratively decreased from 2 to 0. Figure 6 presents a process flow diagram of the GWO GMPPT algorithm.

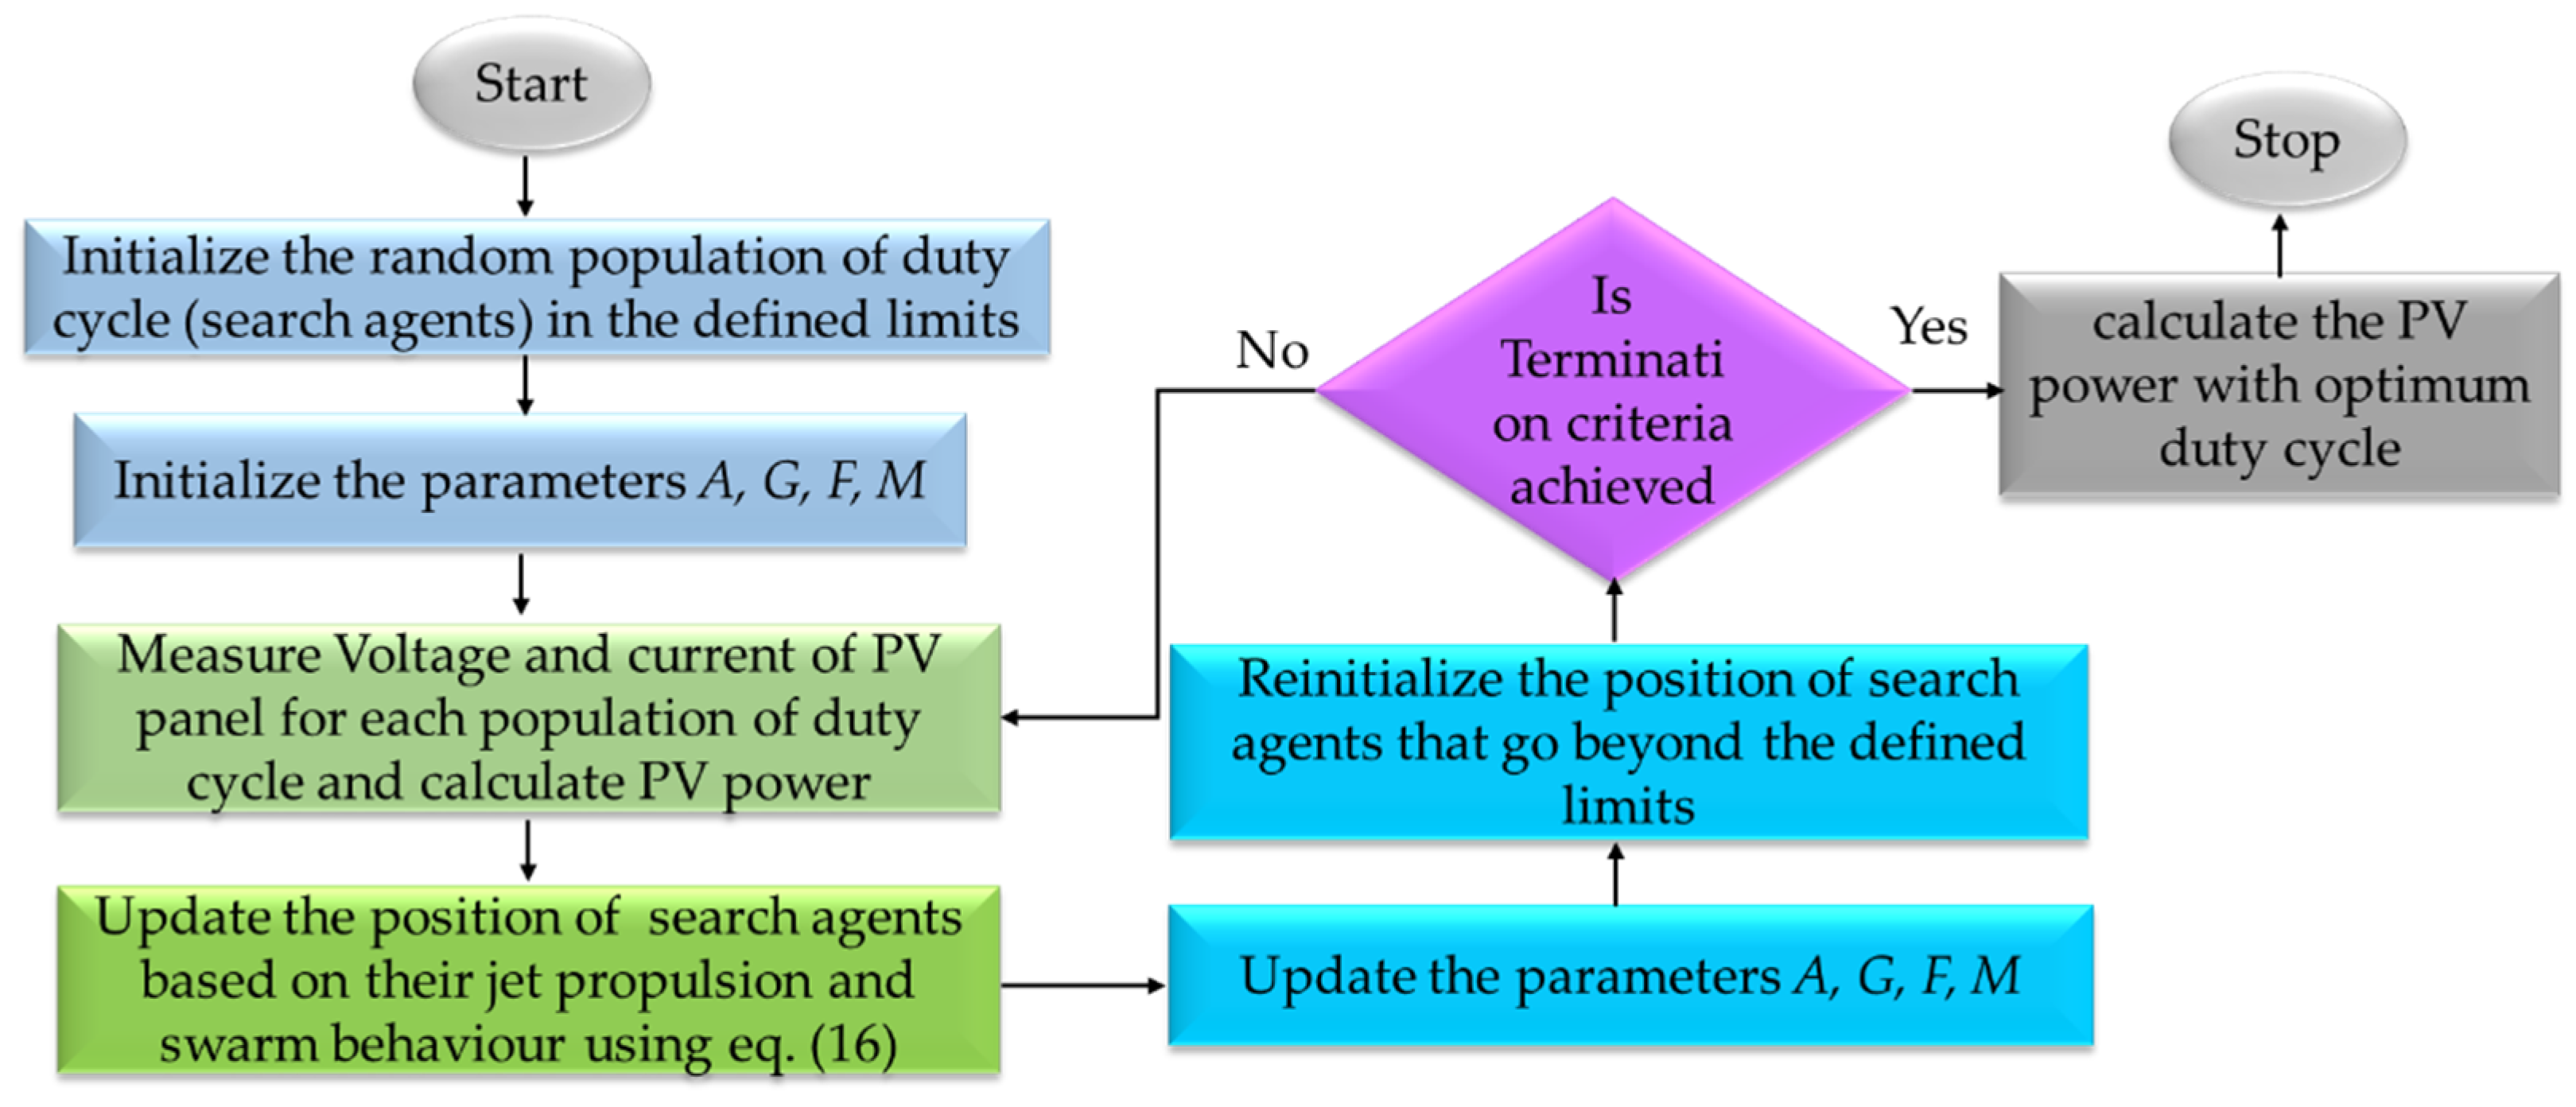
2.4. Tunicate Swarm Optimization

Kaur et al. [32] were the first to present the tunicate swarm algorithm in the year 2020. The algorithm is inspired by the swarming behavior of tunicates. These are recognizable from a few meters away, producing a pale, blue-green bioluminescent light that is powerful. These are cylindrical in structure and only open at one end, growing to a size of a few millimeters. However, each tunicate produces jet propulsion from its entrance by obtaining water from the adjacent sea via atrial siphons. To fully comprehend the behavior of jet propulsion using the computational model, the tunicate must meet three conditions: avoid collisions between candidate solutions, move closer to the best solution’s location, and stay as near as possible to the best solution. Figure 7 depicts a pictographic illustration of the TSA algorithm. The behavior of tunicates can be modelled mathematically as:

2.4.1. Prevent Collisions between Candidate Solutions

We can initialize the parameters A (constant), gravity force ( G ), water flow advection in the deep ocean ( F ), social force M , and the maximum number of iterations as:
A = G M
G = c 2 + c 3 F
F = 2 c 1
M = P m i n + c 1 P m a x P m i n
where c 1 , c 2 , and c 3 are random numbers in the range [0, 1] and P m i n and P m a x are considered as 1 and 4.

2.4.2. Step More toward the Location of the Best Solution

The search agents are moved in the direction of the finest neighbors after successfully preventing a conflict with neighbors:
  P D = F S r a n d P p x
where P D is the total distance between the search agent and food source, r a n d is a random number in the range [0, 1], x indicates the current iteration, F S indicates the position of the food source, and P p x is the position of the tunicates.

2.4.3. Stick Close to the Best Solution

The search agent can even establish its position as the leading search agent.
P p x = F S + A P D ,   i f   r a n d 0.5 F S A P D ,   i f   r a n d < 0.5
The position of all the tunicates is updated concerning the position of the first two tunicates as follows:
P p x + 1 = P p x + P p x + 1 2 + c 1
where P p x + 1 represents the updated position of the tunicates. Figure 8 depicts the TSA GMPPT algorithm’s process flow schematic.

2.5. Perturb and Observe

Perturb and observe (P&O) is the most commonly used MPPT algorithm due to its live tracking nature and ease of implementation. As the name implies, the P&O algorithm performs perturbation and then observes its outcome to determine the next direction of perturbation. This process is repeatedly carried out until the desired outcome is achieved. As the MPPT algorithm is implemented with the help of DC/DC or DC/AC converters, the MPP can be tracked with the help of three parameters, i.e., duty, voltage, and current [34].
The P&O MPPT algorithm measures the voltage and current of two subsequent iterations to determine changes in voltage, current, and power. The change in power is observed to determine whether the power has increased or decreased. Based on the observation regarding a change in power, the duty cycle is incremented or decremented to further improve or rectify the direction of tracking [35]. This process is repeatedly carried out until the point of operation reaches the MPP. The duty-based P&O algorithm is given by (17).
D(k) = D(k − 1) ± ∆D
It can be seen from (17) that a high tracking speed can be achieved if a large perturbation step size (∆D) is taken. However, the use of a large step size also results in large steady-state oscillations. On the other hand, the use of a small step size limits the steady-state oscillations but also slows down the tracking process. Hence, there exists a trade-off between the tracking speed and steady-state power oscillations. Another major drawback of the P&O algorithm is its inability to track the GMPP under partial shading conditions. The P&O algorithm can get easily trapped in the local maxima if multiple power peaks are present. A process flow diagram of the P&O algorithm is described in Figure 9.

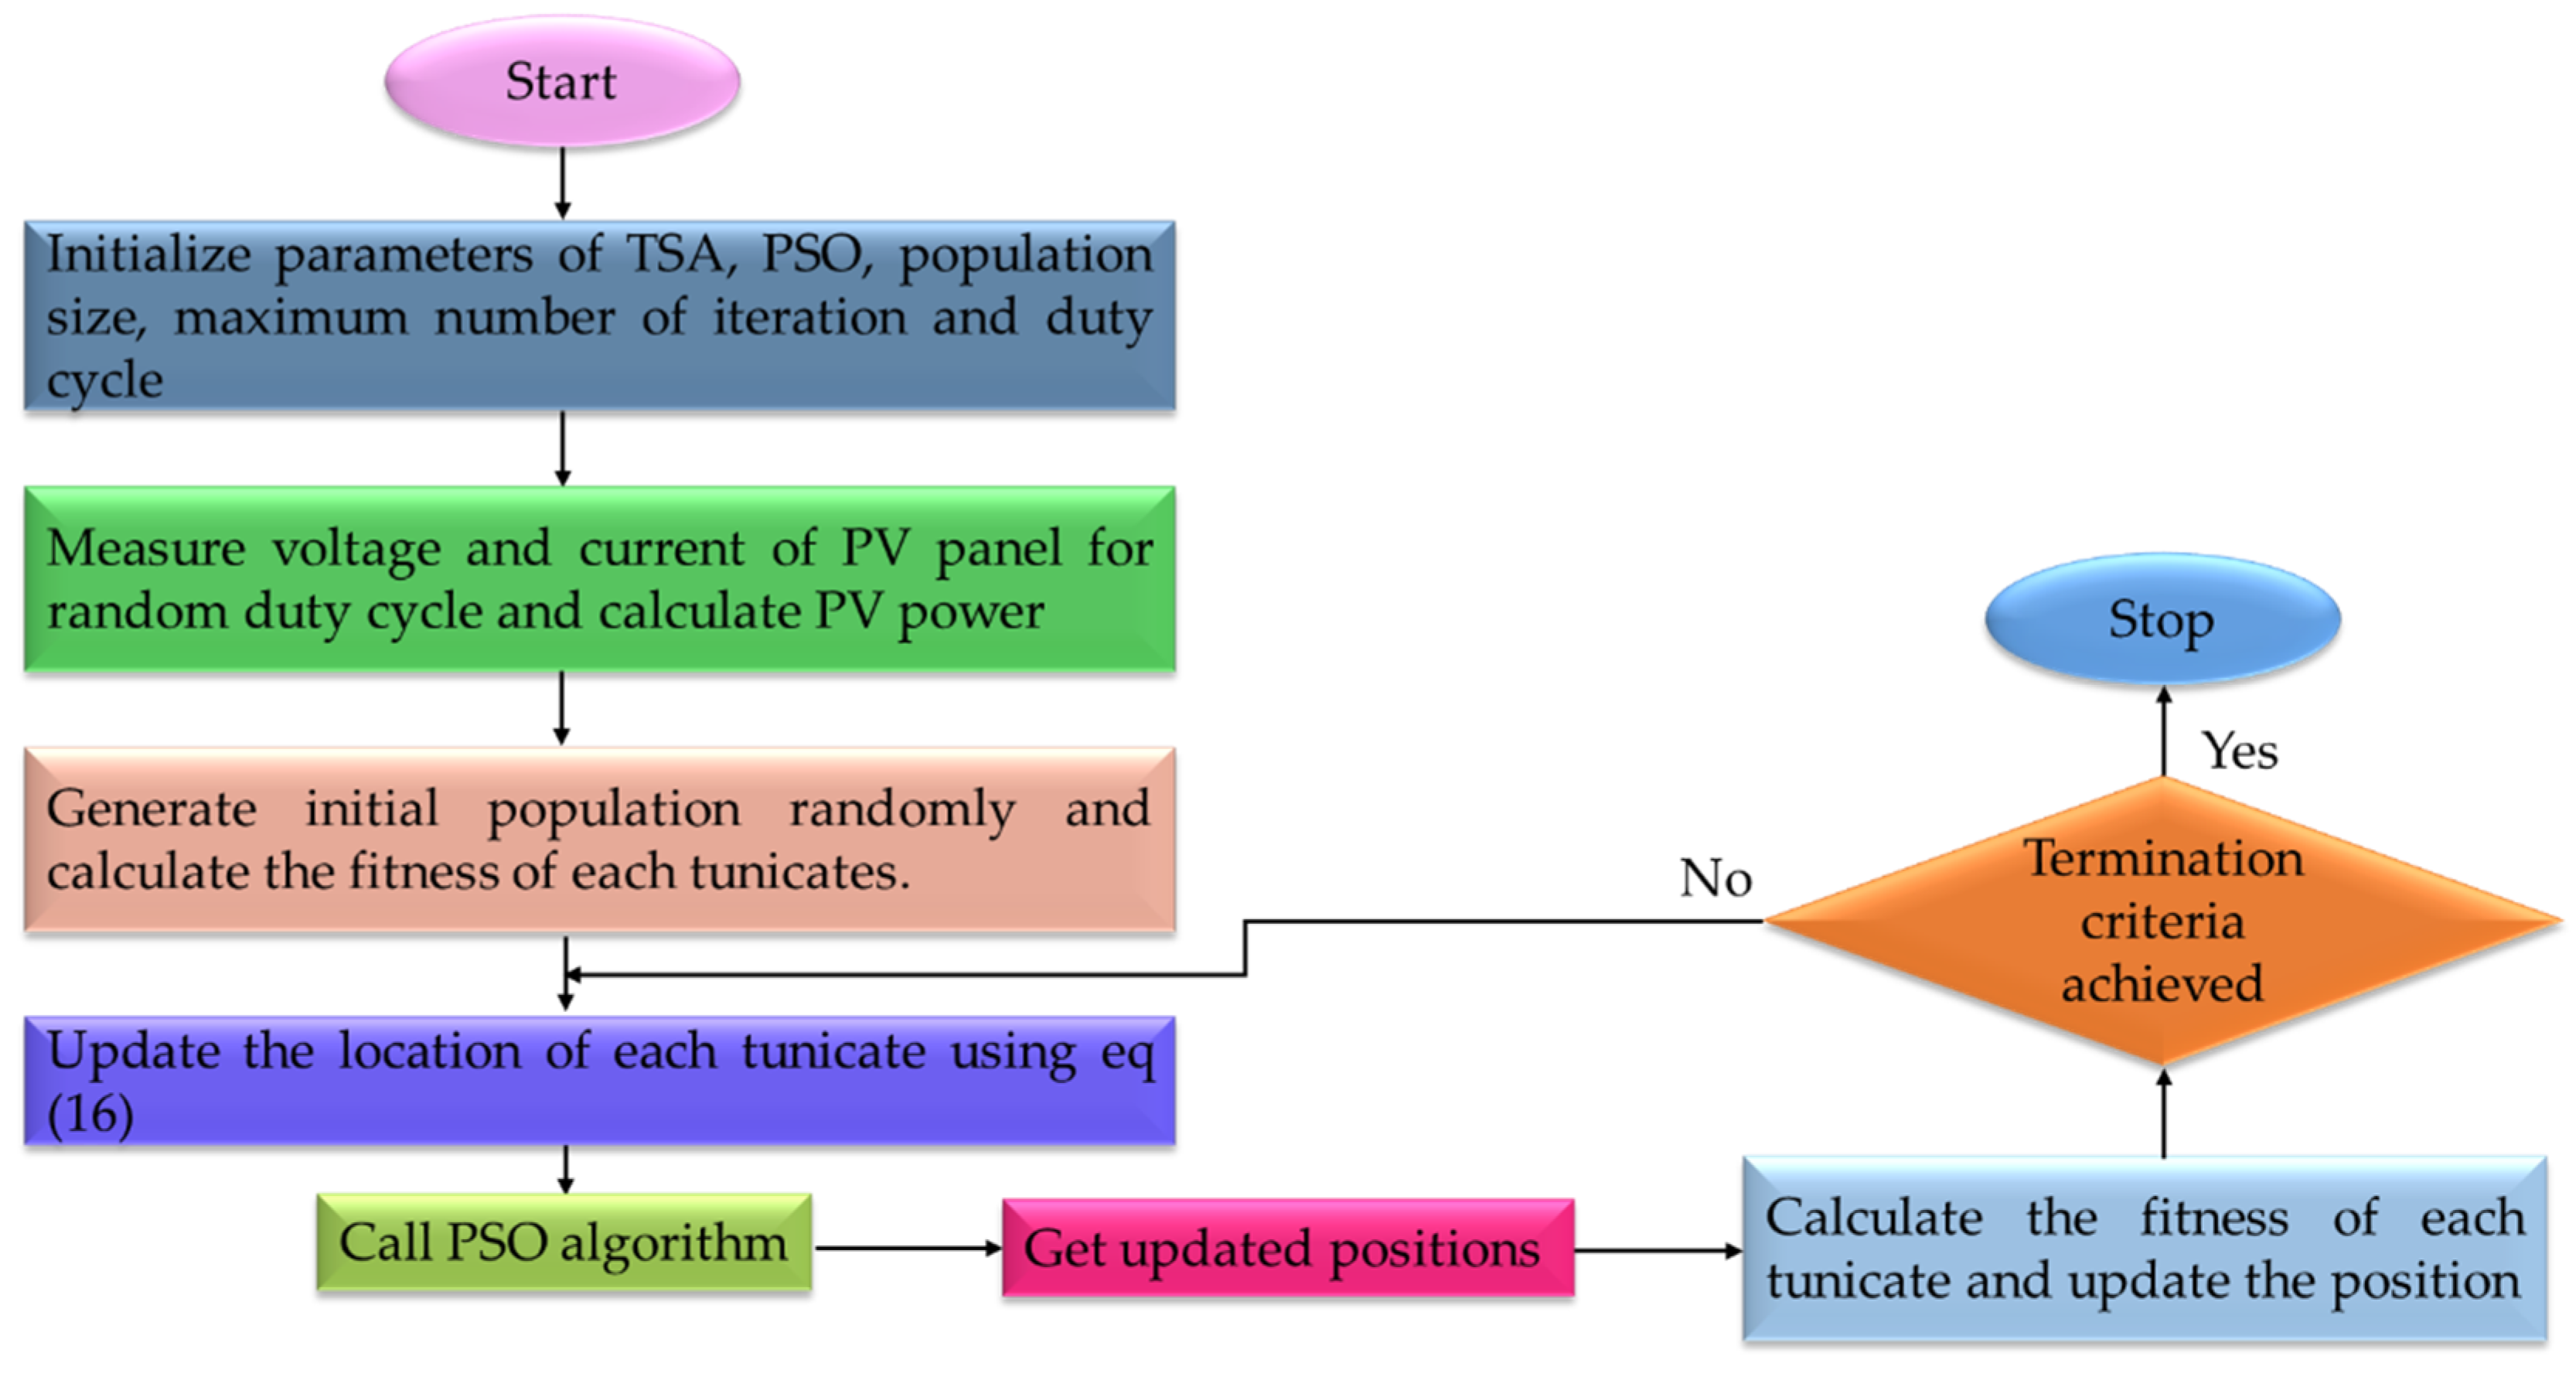
3. Proposed TSA-PSO-Based GMPPT Algorithm

The proposed TSA-PSO hybrid MPPT approach is a smart computational technique that eliminates the uncertainty that can occur during homogeneous-to-nonhomogeneous transformations and vice versa, i.e., during PSCs, TSA has good exploration capability and the PSO algorithm has good exploitation capability; therefore, this hybrid approach utilizes the best capabilities of both algorithms. In the proposed hybrid algorithm, TSA first explores the search space to obtain initial solutions for the PSO algorithm; thereafter, the PSO algorithm exploits the search space and obtains a global optimal solution. The hybrid MPPT tracks the GMPPT by first initializing the TSA and then using PSO. As the tunicates get closer to each other, the PSO MPPT begins at the position of the best tunicate in the TSA process.
The anticipated TSA-PSO hybrid MPPT can be implemented in a PV system that works under complex PSCs as illustrated in algorithm 1: TSA-PSO. The location of a tunicate in the proposed MPPT algorithm refers to the duty ratio of the boost converter employed for GMPPT implementation. This simplifies the controller and minimizes the computational burden of adjusting the controller gain.
The greater the number of tunicates, the greater the MPP accuracy, but this results in a significantly larger computational burden. As a result, the number of tunicates may be reduced to three to lessen computational time. The workflow of the proposed hybrid GMPPT method is shown in Figure 10. The proposed GMPPT Algorithm 1 is implemented using the steps outlined below.
Algorithm 1 TSA-PSO
Stage1. Initialize the tunicates’ locations on stabilized locations with equal space to reside between 10% and 90% of the duty ratio.
Stage2. Initiate the converter and observe the output power “P” of the PV array at each tunicate location. P p v = I p v × V p v
Stage 3. Make the adjustment for each duty as follows:
D p x + 1 = D p x + D p x + 1 2 + c 1
where D is the current value of the duty, x is the number of iterations, and c 1 represents the coefficient.
Stage 4. Repeat Stages 3 and 4 until all the tunicates converge to the MPP.
Stage 5. Begin the PSO loop after retrieving the MPP to track the maximum power (GMPP). Choose a small step size to mitigate oscillations in PV output power and to improve tracking performance.
Stage 6. Repeat these stages until the stopping point is met.

4. Experimental Setup

A small-scale experimental prototype, shown in Figure 11, was used to compare the performance of the proposed algorithm with other state-of-the-art algorithms. Table 1 displays the values of tuning parameters for all algorithms. The proposed algorithm was tested on a Sun-Earth Solar Power 255 W polycrystalline PV array (TPB125x125-36-P, 85 W), which was programmed in an Ecosense PV emulator (IGE-PV4C400-001). The datasheet of the PV module is given in Table 2. A current sensor (WCS2702) was used to measure PV array current, while each module voltage of a potential divider was sensed. The MPPT algorithms were implemented in a low-cost ATMEGA-32 microcontroller. A DC-DC boost converter was designed for the implementation of the MPPT algorithms. A rheostat with a range of 250 Ω was connected as a load to evaluate the performance of the MPPT algorithms. Fluke 287 multimeters and a TDS2000C digital storage oscilloscope were used to store the experimental data in csv format. The experimental power curves of the MPPT algorithms were traced in a MATLAB/Simulink environment.

5. Experimental Results and Discussion

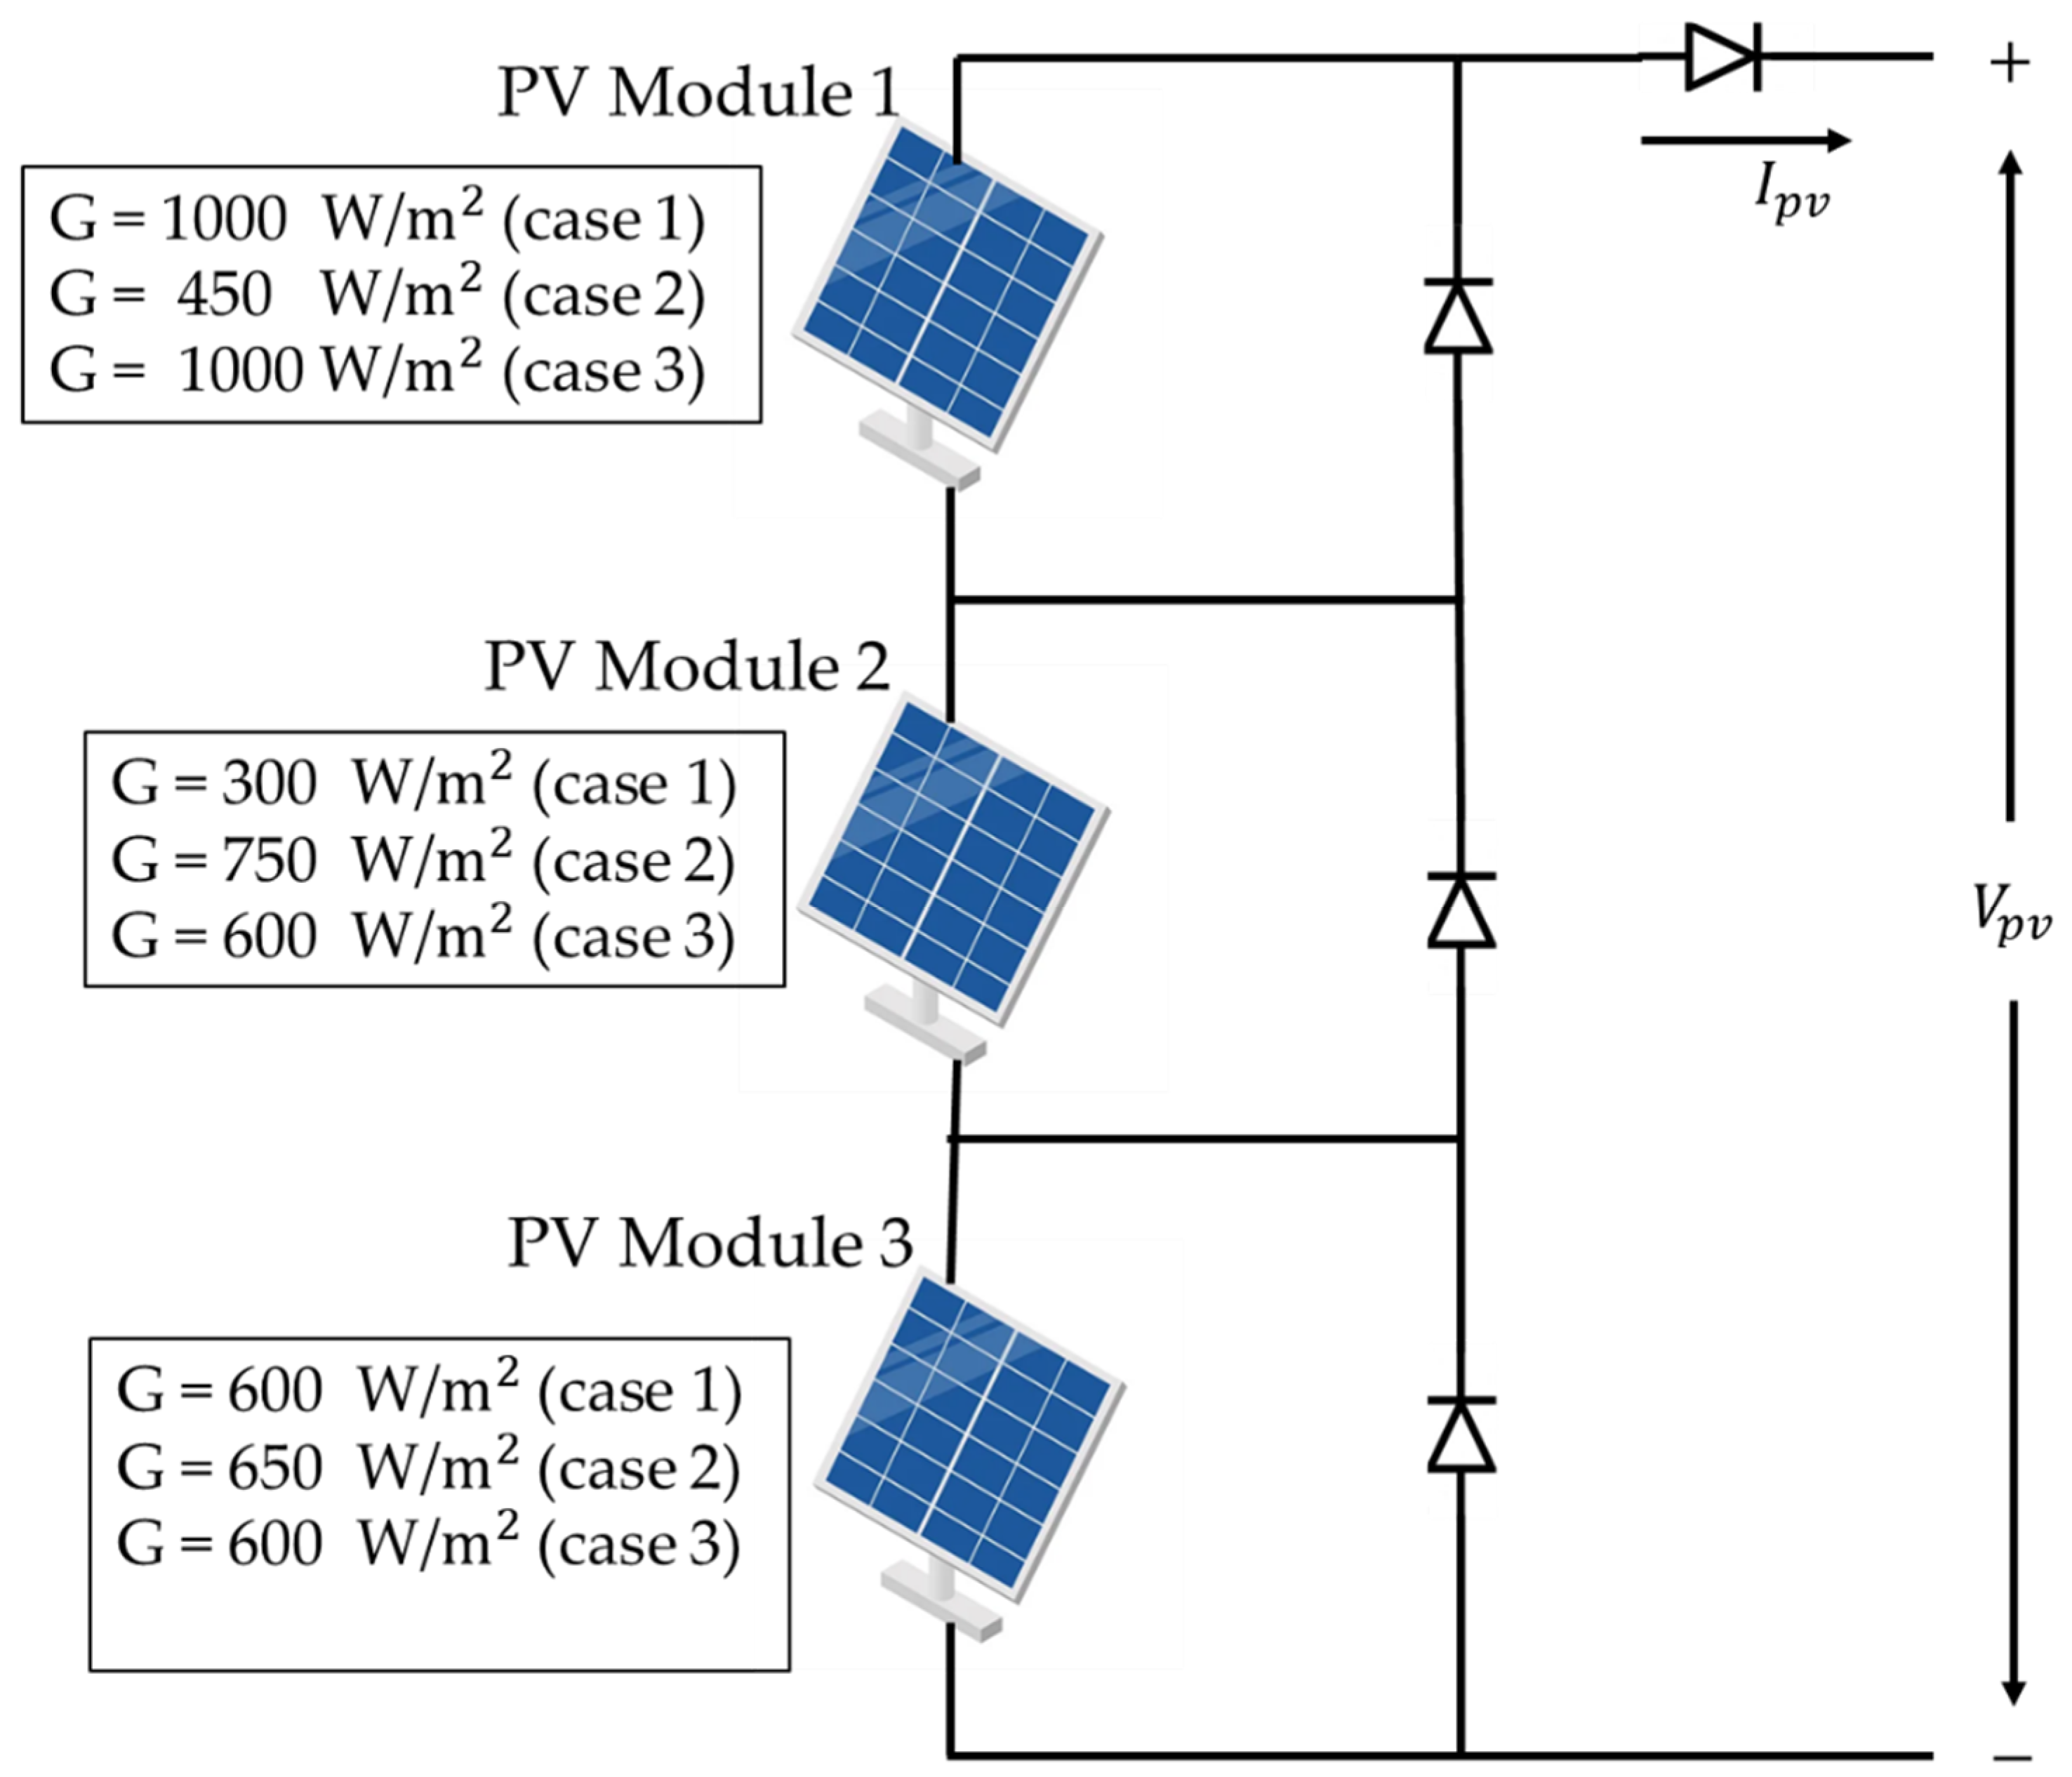
5.1. Problem Formulation

The presented maximum power retrieval can be expressed as an optimization challenge in the following way:
Maximize   P   D
Subjected   to   D m i n D   D m a x
where P (D) represents the output power of the PV module, D signifies the duty ratio of the boost converter, Dmin is the lower bound of the duty ratio taken as 10%, and Dmax is the upper bound of the duty ratio with a value of 90%.
Figure 12 depicts a 3S configuration with three modules attached in series. The P–V curve of three different shading patterns with clearly distinct global power (GP) locations for the 3S configuration is shown in Figure 13.
Experiments were carried out for the 3S configuration (pattern-1, pattern-2, and pattern-3) to confirm the efficacy of the suggested hybrid TSA-PSO MPPT for the 3S configuration under rapidly changing insolation levels, as shown in Figure 12. For pattern-1, the proposed hybrid TSA-PSO method converged to the GMPPT within 0.38 s; for pattern-2, the convergence time reached 0.54 s; in the case of pattern-3, it also gave the low convergence time of 0.40 s with low oscillations as compared with other MPPT techniques.
  • Pattern-1:
In this partial shading pattern, the algorithms were tested on a 250 W PV array under relatively constant temperatures measured between T = 25 and 25.5 °C. At t = 0 s, the GMPPT algorithms were activated in succession with an irradiance of G = 1000, 300, and 600 W/m2 on the first, second, and third PV modules, respectively. The experimental waveforms of the GMPPT algorithms for this case study are shown in Figure 14.
The observed response times of the GMPPT algorithms to reach steady-state conditions around the GMPP are given in Table 3. It is evident from Figure 14 that the proposed hybrid TSA-PSO GMPPT method outperformed other state-of-the-art GMPPT methods as this fusion increased the exploitation ability of the conventional TSA, which resulted in fast convergence. Due to the low exploration capability of the PSO algorithm, it came in second with a tracking time of 0.94 s. On the other hand, the conventional TSA algorithm took third place due to its poor exploitation ability. Although both GWO and FPA have similar tracking times, large oscillations were observed with FPA compared to GWO because of the improper trade-off between exploration and exploitation ability in FPA. Finally, a low tracking time was observed during the execution of the P&O algorithm on account of reduced power extraction from the PV array as the P&O algorithm got stuck in the local maxima.
  • Pattern-2:
In this partial shading pattern, the GMPPT algorithms were activated in succession with an irradiance of G = 450, 750, and 650 W/m2 on the first, second, and third PV modules, respectively. The experimental waveforms of the GMPPT algorithms for this case study are depicted in Figure 15. The observed response times of the GMPPT algorithms to reach steady-state conditions around the GMPP are provided in Table 4. In this case, the value of global peak power was 123.88 W. The suggested TSA-PSO procedure was implemented in a PV system, and the tracking time was 0.54 s to obtain a global peak in fifteen iterations, with a maximum power of 122.88 W obtained by the proposed TSA-PSO algorithm; a power vs. time waveform is shown in Figure 15. The PV power extracted by the GWO algorithm was 122.73 W, as illustrated in Figure 15. Based on observation from GWO, the tracking time was 0.80 s, but the number of iterations was more because of a large number of tuning parameters. The maximum power obtained by the FPA algorithm was 121.30 W, and the time taken to reach the global peak was 1.40 s along with 22 iterations. However, there was a loss of power during tracking and steady-state oscillations were also observed.
The power obtained by the PSO algorithm was 121.45 W, and its tracking time was 0.95 s with 23 iterations. Because of the slow convergence, the tracking time and iterations required to reach the global peak were longer. Based on the observations from TSA, the maximum power extracted was 120.68 W with a tracking time of 0.68 s. Here, the tracking time was low, but a large number of steady-state oscillations were also identified. Furthermore, it was observed that P&O took a smaller number of iterations, i.e., 12, but was not able to reach the GMPPT. The reason is that it was trapped in local maxima. When comparing these five algorithms, TSA-PSO outperformed FPA, GWO, TSA, PSO, and P&O.
  • Pattern-3:
In pattern-3, irradiances of each module were G = 1000, 600, and 600 W/m2 on the first, second, and third PV modules, respectively. The P–V curve of shading pattern-3 had two peaks where the second peak was the global peak while the leftmost peak represented the local peak. Pattern-3 had a maximum power output of 157.95 W. Pattern-3 was subjected to the standard FPA algorithm, with a tracking time and GMPP value of 1.31 s and 156.67 W, respectively. Figure 16 depicts the waveforms of pattern-3 using the standard FPA algorithm. It is clear from the power waveform that the number of iterations was greater, and it also had steady-state oscillations similar to pattern-1 and pattern-2. The PSO algorithm was applied to pattern-3, with a tracking time of 1.02 s to obtain the GMPP with 15 iterations and a global peak power of 138.66 W. The tracking time and iterations were less compared to those of FPA. However, the PSO algorithm was not able to achieve the true value of the GMPP because of getting stuck in local maxima.
The results of the TSA method took 1.19 s to locate a GP of 150.29 W; steady-state oscillations were observed near the GMPP. The tracking time to reach global power using GWO was 1.03 s, and the maximum power was 156.56 W with 18 iterations. While P&O took 12 iterations, the tracking time was larger compared to all other algorithms because of the small step size. Within 11 iterations, the proposed TSA-PSO method had a tracking time of 0.40 s and a global peak power of 156.84 W. As a result, the TSA-PSO algorithm had a faster tacking time and fewer iterations than the PSO, TSA, GWO, FPA, and P&O algorithms; the corresponding results are shown in Table 5.

5.2. Robustness and Statistical Analysis

This section compares the effectiveness of the anticipated TSA-PSO algorithm with other pre-existing MPPT techniques by utilizing quantitative assessments, i.e., mean, minimum, maximum, and standard deviation of the retrieved power. The mean was used to evaluate the exactness of the various MPPT algorithms, whereas the standard deviation was used to decide the quantity of dispersion within the power data sets. To assess the overall effectiveness of each MPPT algorithm, two nonparametric evaluations, the Wilcoxon rank-sum and Friedman ranking tests, were executed.
To check the rank of the proposed algorithm, a nonparametric Friedman ranking test was carried out. Figure 17 reveals the results of the Friedman ranking test, which also illustrates that the TSA-PSO algorithm outperformed other algorithms in terms of tracking the GMPPT under complex PSCs.
The Wilcoxon rank-sum assessment is a nonparametric measure that compares the outcomes of two methods. The null hypothesis signifies that the ranks of the comparative methods’ results are not noticeably distinct. The alternative hypothesis investigates whether the comparative method results can be characterized by rank. Here, the Wilcoxon rank-sum was calculated at a significance level of 5%. The sign “+” denotes that the TSA-PSO algorithm outperformed the other algorithm remarkably, the sign “≈” implies that the TSA-PSO algorithm was similar to the other algorithm, and the sign “−” reveals that the TSA-PSO algorithm had poor performance compared with the other algorithm. Table 6 displays the statistical results obtained from testing all six algorithms under all three shading patterns.

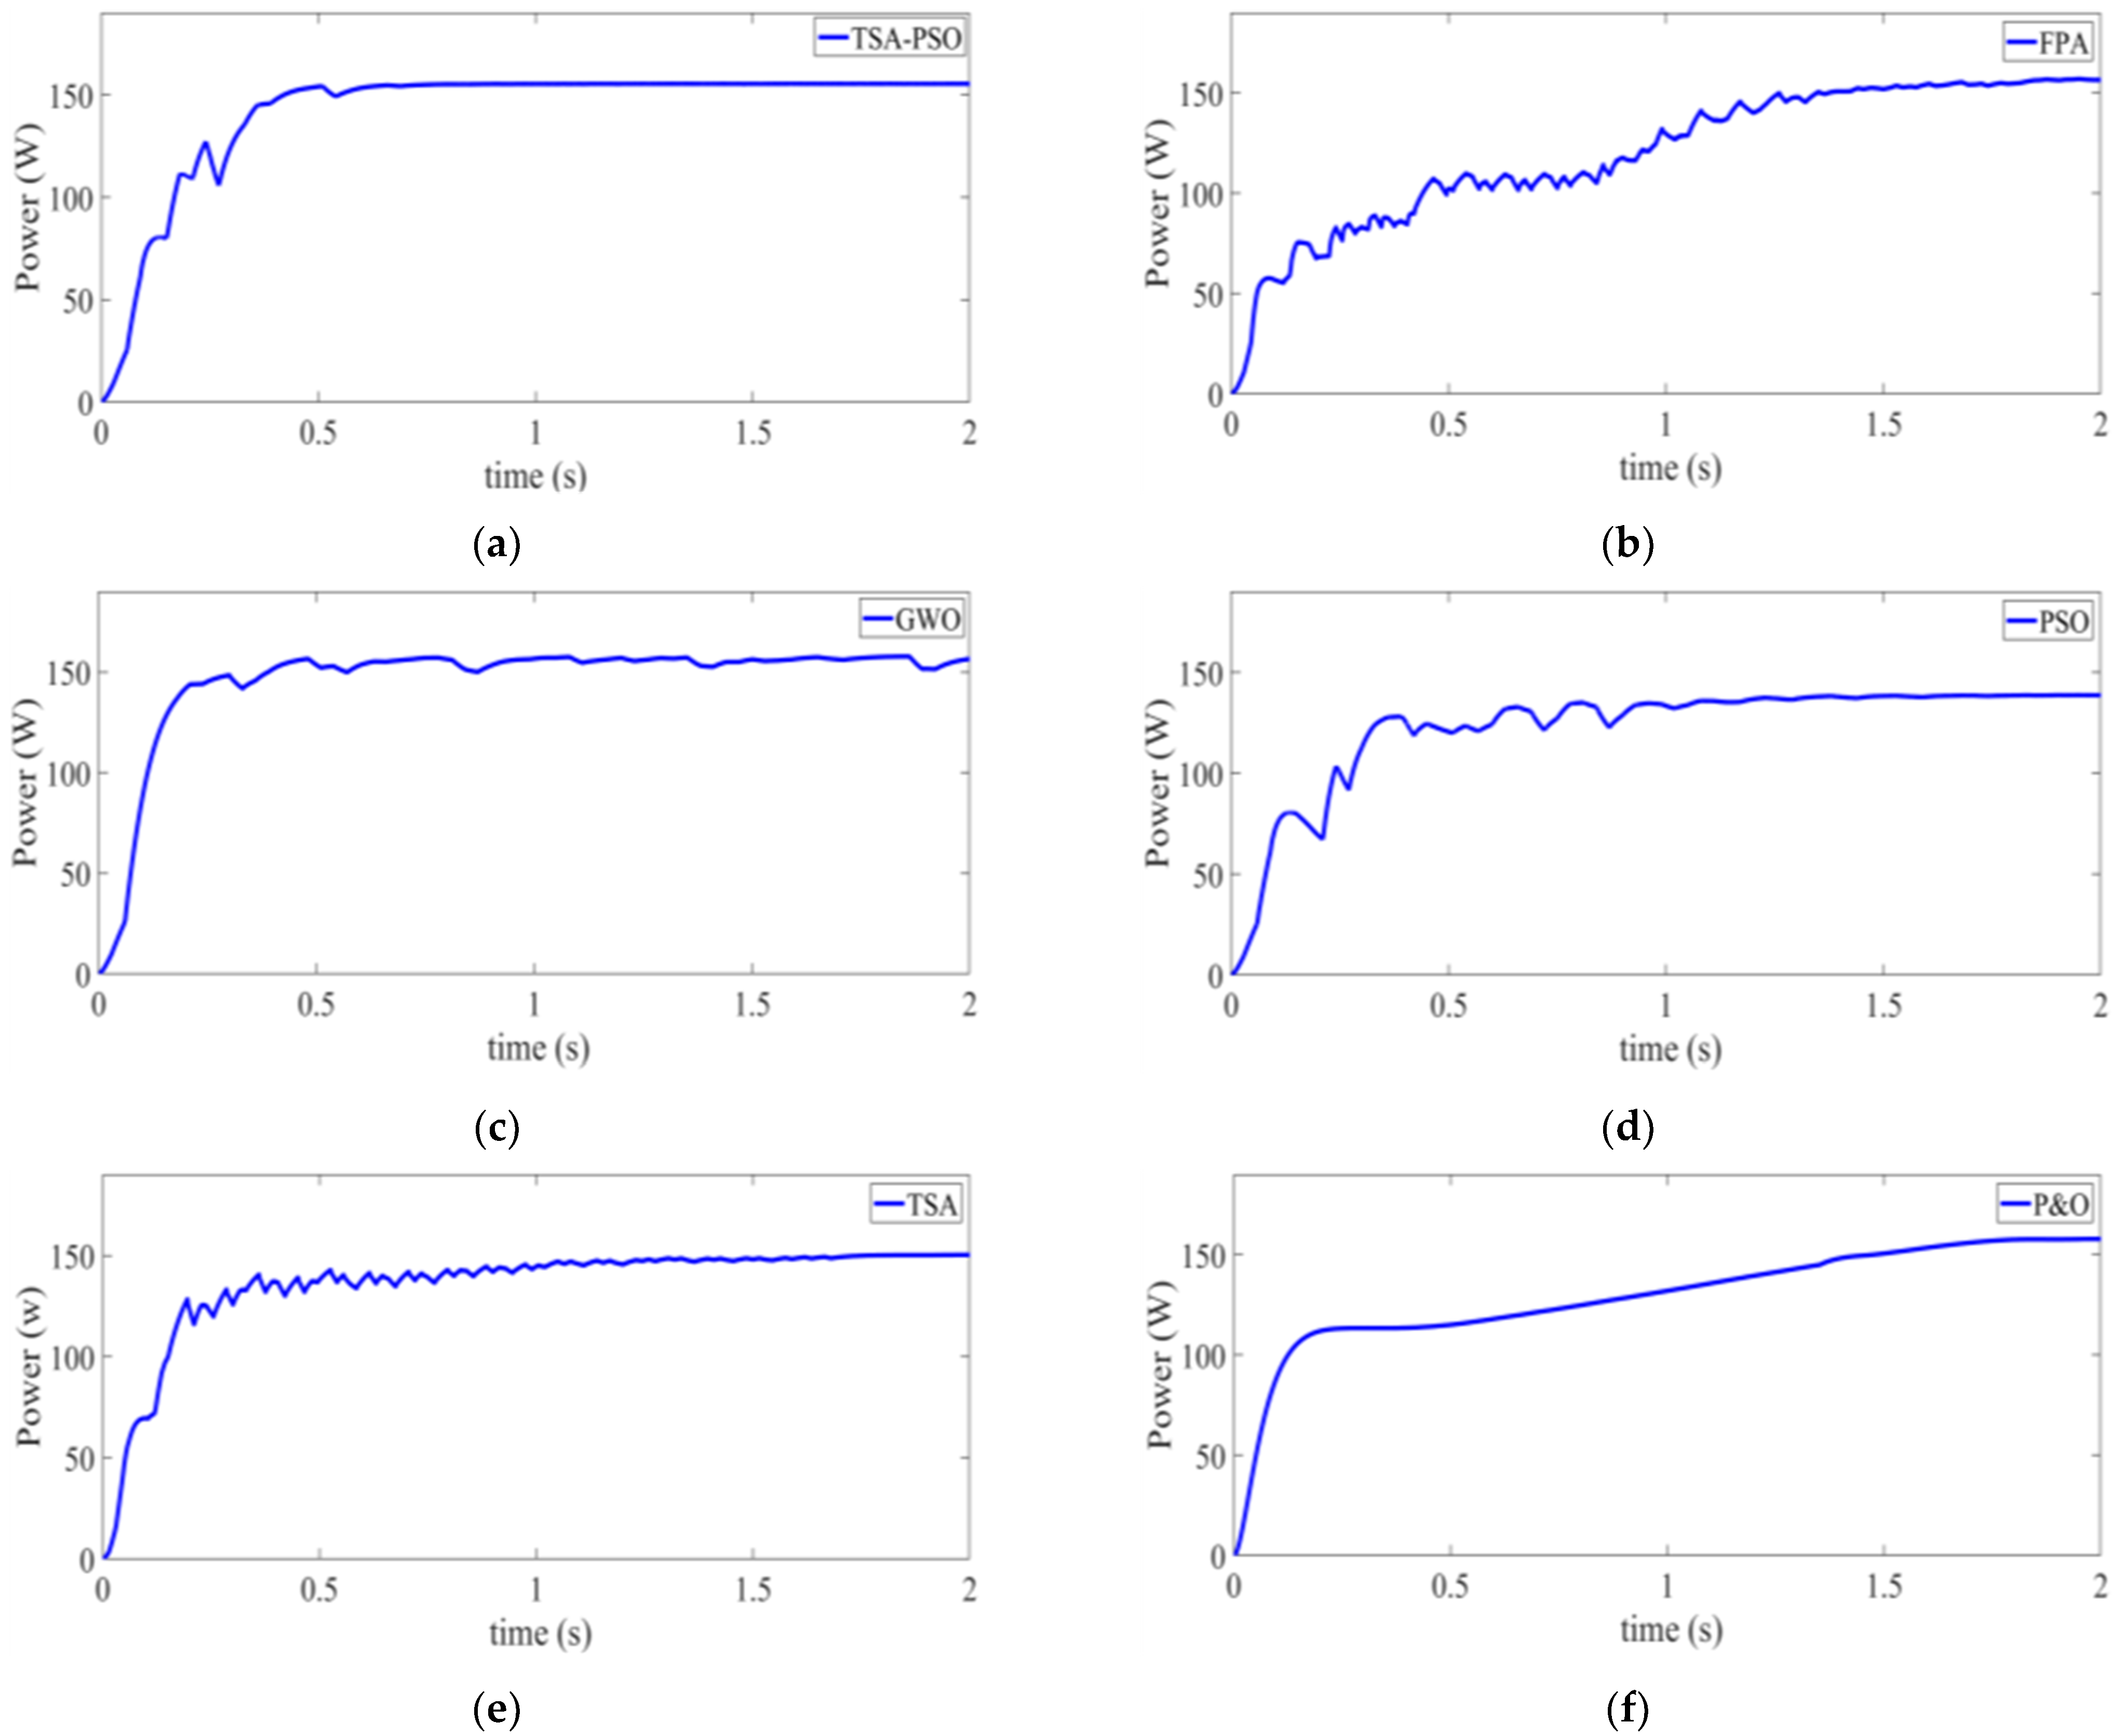
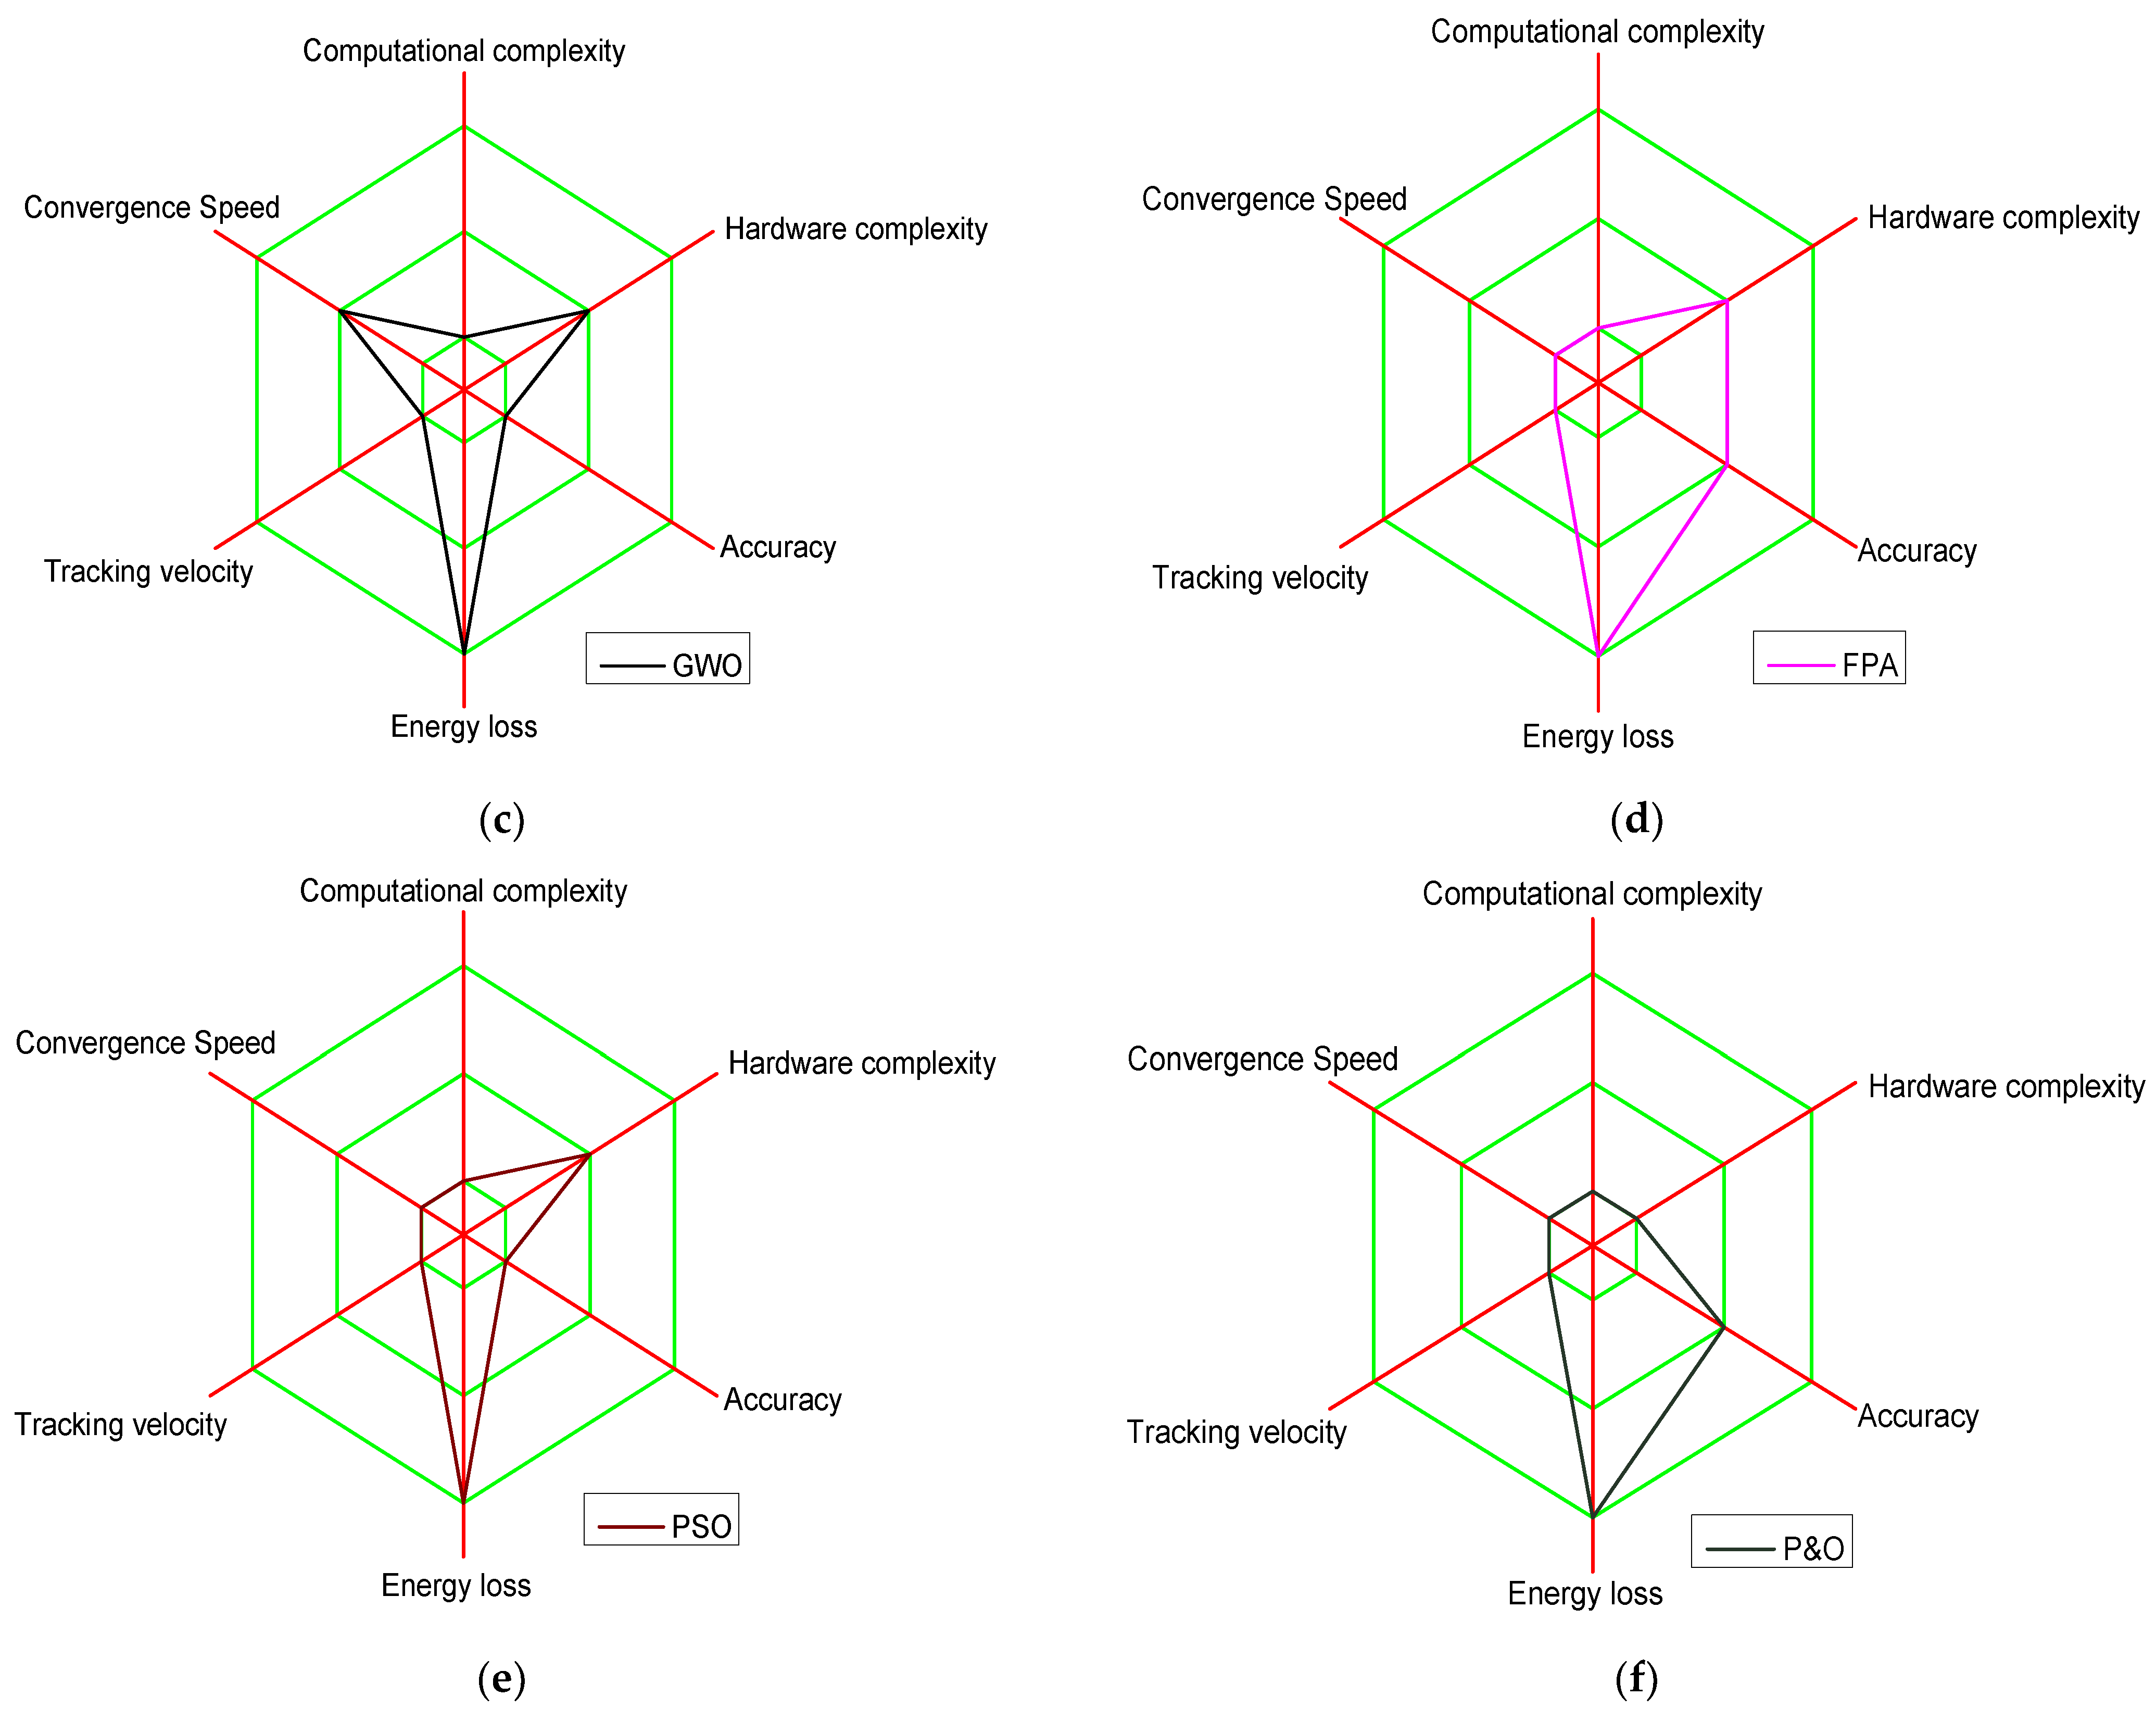
5.3. Qualitative Analysis of the Proposed TSA-PSO Hybrid MPPT

To assess the competitiveness of the proposed hybrid fusion, a few unique criteria that are required in any MPPT method were evaluated and provided in a radar chart, as shown in Figure 18. Furthermore, this analysis is intended to technically assess the efficacy of any bio-inspired technique for MPPT implementation. The following are the various criteria taken into account for the analysis: (i) computational complexity, (ii) hardware complexity, (iii) accuracy, (iv) energy loss, (iv) tracking velocity, and (v) convergence speed. The traditional radar chart interpretation can be understood as follows: the bio-inspired techniques that occupy the majority of the space in the radar chart have higher recommendations for MPPT potential application, and vice versa. Considering the aforementioned criteria, TSA-PSO secured the first place. Meanwhile, TSA, GWO, FPA, P&O, and PSO secured the second, third, fourth, fifth, and sixth places, respectively.

6. Conclusions

This paper proposed a new hybrid TSA-PSO algorithm to accurately track the GMPP of PV arrays under PSCs. The effectiveness of TSA-PSO on PV systems was observed through analytical correlations and was validated for three distinct PSCs. The findings illustrated that TSA-PSO can efficiently handle PS conditions and can accurately reach the GMPP under various PS scenarios. When compared to P&O, the most substantial decrease in oscillations was obtained at 93.5% in the steady-state condition by the TSA-PSO algorithm. The tracking time was observed to be 10–20% lower as compared to the PSO, TSA, GWO, FPA, and P&O algorithms. The increase in tracking speed and fewer oscillations helped in increasing the average power by around 4–5%. As a result, the proposed TSA-PSO-based MPPT controller successfully addressed the complications of arbitrary oscillations and PSCs. The increased efficiency of the TSA-PSO MPPT algorithm contributes to the techno-economic validity of solar PV systems.
In the near future, the authors plan to test the proposed TSA-PSO MPPT technique on a grid-connected PV system to validate the performance of the proposed algorithm in a real-world topology.

Author Contributions

Conceptualization, A.S. (Abhishek Sharma) and A.S. (Abhinav Sharma); methodology and formal analysis, A.S. (Abhishek Sharma), M.A., and S.R.; investigation, A.S. (Abhinav Sharma) and S.R.; writing—original draft preparation, A.S. (Abhishek Sharma), V.J., and A.S. (Abhinav Sharma); writing—review and editing, A.S. (Abhinav Sharma), M.A. and V.J.; supervision, M.A. and B.A.; fund acquisition, B.A. All authors have read and agreed to the published version of the manuscript.

Funding

This work was supported in part by the European Commission H2020 TWINNING JUMP2Excel (Joint Universal activities for Mediterranean PV integration Excellence) project under Grant 810809.

Institutional Review Board Statement

Not applicable.

Informed Consent Statement

Not applicable.

Data Availability Statement

Not applicable.

Acknowledgments

The authors are thankful to anonymous reviewers and editors for their suggestions.

Conflicts of Interest

The authors declare no conflict of interest.

Abbreviations

ACOAnt Colony Optimization
BABat Algorithm
CSCuckoo Search
FPAFlower Pollination Algorithm
GMPPGlobal Maximum Power Point
GPGlobal Power
GWOGrey Wolf Optimization
HCHill Climbing
ICSImproved Cuckoo Search
INCIncremental Conductance
LMPPLocal Maximum Power Points
MPPMaximum Power Point
MPPTMaximum Power Point Tracker
P&OPerturb and Observe
PSCPartial Shading Conditions
PSOParticle Swarm Optimization
PVPhotovoltaic
TSATunicate Swarm Algorithm
TSA-PSOTunicate Swarm Algorithm-Particle Swarm Optimization

References

  1. Priyadarshi, N.; Padmanaban, S.; Bhaskar, M.S.; Blaabjerg, F.; Holm-Nielsen, J.B.; Azam, F.; Sharma, A.K. A hybrid photovoltaic-fuel cell-based single-stage grid integration with Lyapunov control scheme. IEEE Syst. J. 2019, 14, 3334–3342. [Google Scholar] [CrossRef]
  2. Yao, X.; Yi, B.; Yu, Y.; Fan, Y.; Zhu, L. Economic analysis of grid integration of variable solar and wind power with conventional power system. Appl. Energy 2020, 264, 114706. [Google Scholar] [CrossRef]
  3. Mousavi, S.B.; Ahmadi, P.; Pourahmadiyan, A.; Hanafizadeh, P. A comprehensive techno-economic assessment of a novel compressed air energy storage (CAES) integrated with geothermal and solar energy. Sustain. Energy Technol. Assess. 2021, 47, 101418. [Google Scholar] [CrossRef]
  4. Rajput, S.; Averbukh, M.; Yahalom, A.; Minav, T. An Approval of MPPT Based on PV Cell’s Simplified Equivalent Circuit During Fast-Shading Conditions. Electronics 2019, 8, 1060. [Google Scholar] [CrossRef] [Green Version]
  5. Chepp, E.D.; Krenzinger, A. A methodology for prediction and assessment of shading on PV systems. Sol. Energy 2021, 216, 537–550. [Google Scholar] [CrossRef]
  6. Farahmand, M.Z.; Nazari, M.E.; Shamlou, S.; Shafie-khah, M. The Simultaneous Impacts of Seasonal Weather and Solar Conditions on PV Panels Electrical Characteristics. Energies 2021, 14, 845. [Google Scholar] [CrossRef]
  7. Altamimi, A.; Jayaweera, D. Reliability of power systems with climate change impacts on hierarchical levels of PV systems. Electr. Power Syst. Res. 2021, 190, 106830. [Google Scholar] [CrossRef]
  8. Rajput, S.; Averbukh, M. Chapter 1: MPPT Control Systems for PV Power Plants. In Applied Soft Computing and Embedded System Applications in Solar Energy, 1st ed.; CRC Press: London, UK, 2021. [Google Scholar]
  9. Babes, B.; Boutaghane, A.; Hamouda, N. A novel nature-inspired maximum power point tracking (MPPT) controller based on ACO-ANN algorithm for photovoltaic (PV) system fed arc welding machines. Neural Comput. Appl. 2021, 34, 299–317. [Google Scholar] [CrossRef]
  10. Sharma, A.; Dasgotra, A.; Tiwari, S.K.; Sharma, A.; Jately, V.; Azzopardi, B. Parameter extraction of photovoltaic module using tunicate swarm algorithm. Electronics 2021, 10, 878. [Google Scholar] [CrossRef]
  11. Jiang, L.L.; Maskell, D.L.; Patra, J.C. A novel ant colony optimization-based maximum power point tracking for photovoltaic systems under partially shaded conditions. Energy Build. 2013, 58, 227–236. [Google Scholar] [CrossRef]
  12. Shi, J.-Y.; Xue, F.; Qin, Z.-J.; Zhang, W.; Ling, L.-T.; Yang, T. Improved global maximum power point tracking for photovoltaic system via cuckoo search under partial shaded conditions. J. Power Electron. 2016, 16, 287–296. [Google Scholar] [CrossRef] [Green Version]
  13. Eltamaly, A.M.; Al-Saud, M.; Abokhalil, A.G. A novel bat algorithm strategy for maximum power point tracker of photovoltaic energy systems under dynamic partial shading. IEEE Access 2020, 8, 10048–10060. [Google Scholar] [CrossRef]
  14. Priyadarshi, N.; Ranjana, M.S.B.; Sanjeevikumar, P.; Blaabjerg, F.; Azam, F. New CUK–SEPIC converter based photovoltaic power system with hybrid GSA–PSO algorithm employing MPPT for water pumping applications. IET Power Electron. 2020, 13, 2824–2830. [Google Scholar] [CrossRef]
  15. Sharma, A.; Sharma, A.; Dasgotra, A.; Jately, V.; Ram, M.; Rajput, S.; Averbukh, M.; Azzopardi, B. Opposition-based tunicate swarm algorithm for parameter optimization of solar cells. IEEE Access 2021, 9, 125590–125602. [Google Scholar] [CrossRef]
  16. Etarhouni, M.; Chong, B.; Zhang, L. A combined scheme for maximising the output power of a Photovoltaic array under partial shading conditions. Sustain. Energy Technol. Assess. 2022, 50, 101878. [Google Scholar] [CrossRef]
  17. Chalh, A.; El Hammoumi, A.; Motahhir, S.; El Ghzizal, A.; Derouich, A.; Masud, M.; AlZain, M.A. Investigation of Partial Shading Scenarios on a Photovoltaic Array’s Characteristics. Electronics 2022, 11, 96. [Google Scholar] [CrossRef]
  18. Yang, Z.; Zhang, N.; Wang, J.; Liu, Y.; Fu, L. Improved non-symmetrical puzzle reconfiguration scheme for power loss reduction in photovoltaic systems under partial shading conditions. Sustain. Energy Technol. Assess. 2022, 51, 101934. [Google Scholar] [CrossRef]
  19. Javed, S.; Ishaque, K. A comprehensive analyses with new findings of different PSO variants for MPPT problem under partial shading. Ain Shams Eng. J. 2022, 13, 101680. [Google Scholar] [CrossRef]
  20. Molleti, V.P.L.; Kasibhatla, R.; Rajamahanthi, V. Modeling and Implementation of Statechart for MPPT Control of Photovoltaic System in FPGA. In Machine Learning, Advances in Computing, Renewable Energy and Communication; Springer: Singapore, 2022; pp. 293–304. [Google Scholar]
  21. Jiang, Y.; Xu, J.; Leng, X.; Eghbalian, N. A novel hybrid maximum power point tracking method based on improving the effectiveness of different configuration partial shadow. Sustain. Energy Technol. Assess. 2022, 50, 101835. [Google Scholar] [CrossRef]
  22. Roni, M.; Karim, H.; Rana, M.S.; Pota, H.R.; Hasan, M.; Hussain, M. Recent trends in bio-inspired meta-heuristic optimization techniques in control applications for electrical systems: A review. Int. J. Dyn. Control 2022, 1–13. [Google Scholar] [CrossRef]
  23. Sarwar, S.; Javed, M.Y.; Jaffery, M.H.; Arshad, J.; Ur Rehman, A.; Shafiq, M.; Choi, J.G. A Novel Hybrid MPPT Technique to Maximize Power Harvesting from PV System under Partial and Complex Partial Shading. Appl. Sci. 2022, 12, 587. [Google Scholar] [CrossRef]
  24. Tey, K.S.; Mekhilef, S.; Seyedmahmoudian, M.; Horan, B.; Oo, A.T.; Stojcevski, A. Improved differential evolution-based MPPT algorithm using SEPIC for PV systems under partial shading conditions and load variation. IEEE Trans. Ind. Inform. 2018, 14, 4322–4333. [Google Scholar] [CrossRef]
  25. Ram, J.P.; Rajasekar, N. A novel flower pollination based global maximum power point method for solar maximum power point tracking. IEEE Trans. Power Electron. 2016, 32, 8486–8499. [Google Scholar]
  26. Li, H.; Yang, D.; Su, W.; Lu, J.; Yu, X. An overall distribution particle swarm optimization MPPT algorithm for photovoltaic system under partial shading. IEEE Trans. Ind. Electron. 2018, 66, 265–275. [Google Scholar] [CrossRef]
  27. Ram, J.P.; Pillai, D.S.; Rajasekar, N.; Strachan, S.M. Detection and identification of global maximum power point operation in solar PV applications using a hybrid ELPSO-P&O tracking technique. IEEE J. Emerg. Sel. Top. Power Electron. 2019, 8, 1361–1374. [Google Scholar]
  28. Kennedy, J.; Eberhart, R. Particle swarm optimization. In Proceedings of the ICNN’95-International Conference on Neural Networks, Perth, WA, Australia, 27 November–1 December 1995; IEEE: Piscataway, NJ, USA, 1995. [Google Scholar]
  29. Sharma, A.; Shoval, S.; Sharma, A.; Pandey, J.K. Path Planning for Multiple Targets Interception by the Swarm of UAVs based on Swarm Intelligence Algorithms: A Review. IETE Tech. Rev. 2021, 1–23. [Google Scholar] [CrossRef]
  30. Yang, X.-S. Flower pollination algorithm for global optimization. In Proceedings of the International Conference on Unconventional Computing and Natural Computation, Orléan, France, 3–7 September 2012; Springer: Berlin/Heidelberg, Germany, 2012. [Google Scholar]
  31. Sharma, A.; Sharma, A.; Pandey, J.K.; Ram, M. Swarm Intelligence: Foundation, Principles, and Engineering Applications; CRC Press: Boca Raton, FL, USA, 2022. [Google Scholar]
  32. Mirjalili, S.; Mirjalili, S.M.; Lewis, A. Grey wolf optimizer. Adv. Eng. Softw. 2014, 69, 46–61. [Google Scholar] [CrossRef] [Green Version]
  33. Kaur, S.; Awasthi, L.K.; Sangal, A.; Dhiman, G. Tunicate Swarm Algorithm: A new bio-inspired based metaheuristic paradigm for global optimization. Eng. Appl. Artif. Intell. 2020, 90, 103541. [Google Scholar] [CrossRef]
  34. Jately, V.; Azzopardi, B.; Joshi, J.; Venkateswaran, V.B.; Sharma, A.; Arora, S. Experimental Analysis of hill-climbing MPPT algorithms under low irradiance levels. Renew. Sustain. Energy Rev. 2021, 150, 111467. [Google Scholar] [CrossRef]
  35. Jately, V.; Bhattacharya, S.; Azzopardi, B.; de Montgareuil, A.G.; Joshi, J.; Arora, S. Voltage and current reference based MPPT under rapidly changing irradiance and load resistance. IEEE Trans. Energy Convers. 2021, 36, 2297–2309. [Google Scholar] [CrossRef]
Figure 1. A representation of particle swarm optimization (PSO) model [29].
Energies 15 03164 g001
Figure 2. Flowchart of PSO GMPPT algorithm.
Energies 15 03164 g002
Figure 3. A representation of flower pollination algorithm (FPA) [31].
Energies 15 03164 g003
Figure 4. Process flow diagram of FPA GMPPT algorithm.
Energies 15 03164 g004
Figure 5. General representation of grey wolf optimization (GWO) algorithm [33].
Energies 15 03164 g005
Figure 6. Process flow diagram of GWO GMPPT algorithm.
Energies 15 03164 g006
Figure 7. Representation of tunicate swarm algorithm (TSA) [31].
Energies 15 03164 g007
Figure 8. Process flow diagram of TSA GMPPT algorithm.
Energies 15 03164 g008
Figure 9. Process flow diagram of P&O MPPT algorithm.
Energies 15 03164 g009
Figure 10. Flowchart of proposed hybrid TSA-PSO MPPT algorithm.
Energies 15 03164 g010
Figure 11. Laboratory prototype of MPPT controller.
Energies 15 03164 g011
Figure 12. The 3S configuration of PV modules.
Energies 15 03164 g012
Figure 13. The current-voltage and power-voltage characteristics of PV system under PS conditions.
Energies 15 03164 g013
Figure 14. Power vs. time curve for shading pattern-1: (a) TSA-PSO, (b) FPA, (c) GWO, (d) PSO, (e) TSA, and (f) P&O.
Energies 15 03164 g014
Figure 15. Power vs. time curve for shading pattern-2: (a) TSA-PSO, (b) FPA, (c) GWO, (d) PSO, (e) TSA, and (f) P&O.
Energies 15 03164 g015aEnergies 15 03164 g015b
Figure 16. Power vs. time curve for shading pattern-3: (a) TSA-PSO, (b) FPA, (c) GWO, (d) PSO, (e) TSA, and (f) P&O.
Energies 15 03164 g016
Figure 17. Friedman ranking of all compared algorithms.
Energies 15 03164 g017
Figure 18. Qualitative assessment of various soft computing methods existing in the literature.
Energies 15 03164 g018aEnergies 15 03164 g018b
Table 1. Parameters of algorithms.
AlgorithmsParameters
FPASwitching probability = 0.8
Lévy step size scaling factor = 0.01
λ = 1.5
GWOAll parameters updated during iteration
TSAPmin = 1, Pmax = 4
PSOC1 = [1, 2], C2 = [1, 2], w = [0.1, 1]
P&OΔd = 0.001, dmax = 0.65, dmin = 0.32
Table 2. Electrical specifications of 85 W polysilicon PV module.
ParametersValue
Maximum power, Pmax (W)85 W
Voltage MPP, VMP (V)17.6 V
Current MPP, IMP (A)4.83 A
Open-circuit voltage, Voc (V)21.9 V
Short-circuit current MPP, ISC (A)5.24 A
Temperature coefficient of Voc (%/°C)−0.3
Temperature coefficient of Isc (%/°C)0.05
Table 3. Performance analysis of the proposed TSA-PSO along with other metaheuristics algorithms for PS pattern-1.
TechniqueRated Power (W)Maximum
Extracted Power (W)
Tracking Time (s)Number of IterationsMaximum
Efficiency
Extracted from PV Panels (%)
TSA-PSO104.50103.360.381297.44
FPA102.001.602385.85
GWO102.631.571590.63
TSA102.501.092093.52
PSO102.730.941793.38
P&O84.580.811077.07
Table 4. Performance analysis of the proposed TSA-PSO algorithm along with other metaheuristics algorithms for PS pattern-2.
TechniqueRated Power (W)Maximum
Extracted Power (W)
Tracking Time (s)Number of IterationsMaximum
Efficiency
Extracted from PV Panels
TSA-PSO123.88122.880.541598.20
FPA121.301.402294.34
GWO122.730.801881.80
TSA120.680.681692.13
PSO121.450.952393.36
P&O115.950.811281.80
Table 5. Performance analysis of the proposed TSA-PSO algorithm along with other metaheuristics algorithms for PS pattern-3.
TechniqueRated Power (W)Maximum
Extracted Power (W)
Tracking Time (s)Number of IterationsMaximum
Efficiency
Extracted from PV Panels
TSA-PSO157.95156.840.401197.36
FPA156.671.312489.39
GWO156.561.031896.37
TSA150.291.192087.52
PSO138.661.021595.14
P&O155.351.641294.20
Table 6. Statistical results using Wilcoxon rank-sum test.
Shading PatternsAlgorithmPower (W)
MaxMeanSDRank-Sum
Pattern-1TSA-PSO103.3677.0714.07
FPA102.0087.7315.77(+)
GWO102.6390.6316.73(+)
TSA102.5093.5214.69(+)
PSO102.7393.3818.17(+)
P&O84.5897.4415.13(+)
Pattern-2TSA-PSO122.88106.0217.55
FPA121.30114.8321.13(+)
GWO122.73115.4718.75(+)
TSA120.68115.3919.30(+)
PSO121.45114.4620.75(+)
P&O115.95110.3018.63(+)
Pattern-3TSA-PSO156.84124.4723.89
FPA156.67144.7532.58(+)
GWO156.56148.3523.99(+)
TSA150.29137.2827.62(+)
PSO138.66125.3524.30(+)
P&O155.35129.6326.23(+)
Publisher’s Note: MDPI stays neutral with regard to jurisdictional claims in published maps and institutional affiliations.

