
The Experimental Investigation of a New Panel Design for Thermoelectric Power Generation to Maximize Output Power Using Solar Radiation


Abstract
:
1. Introduction
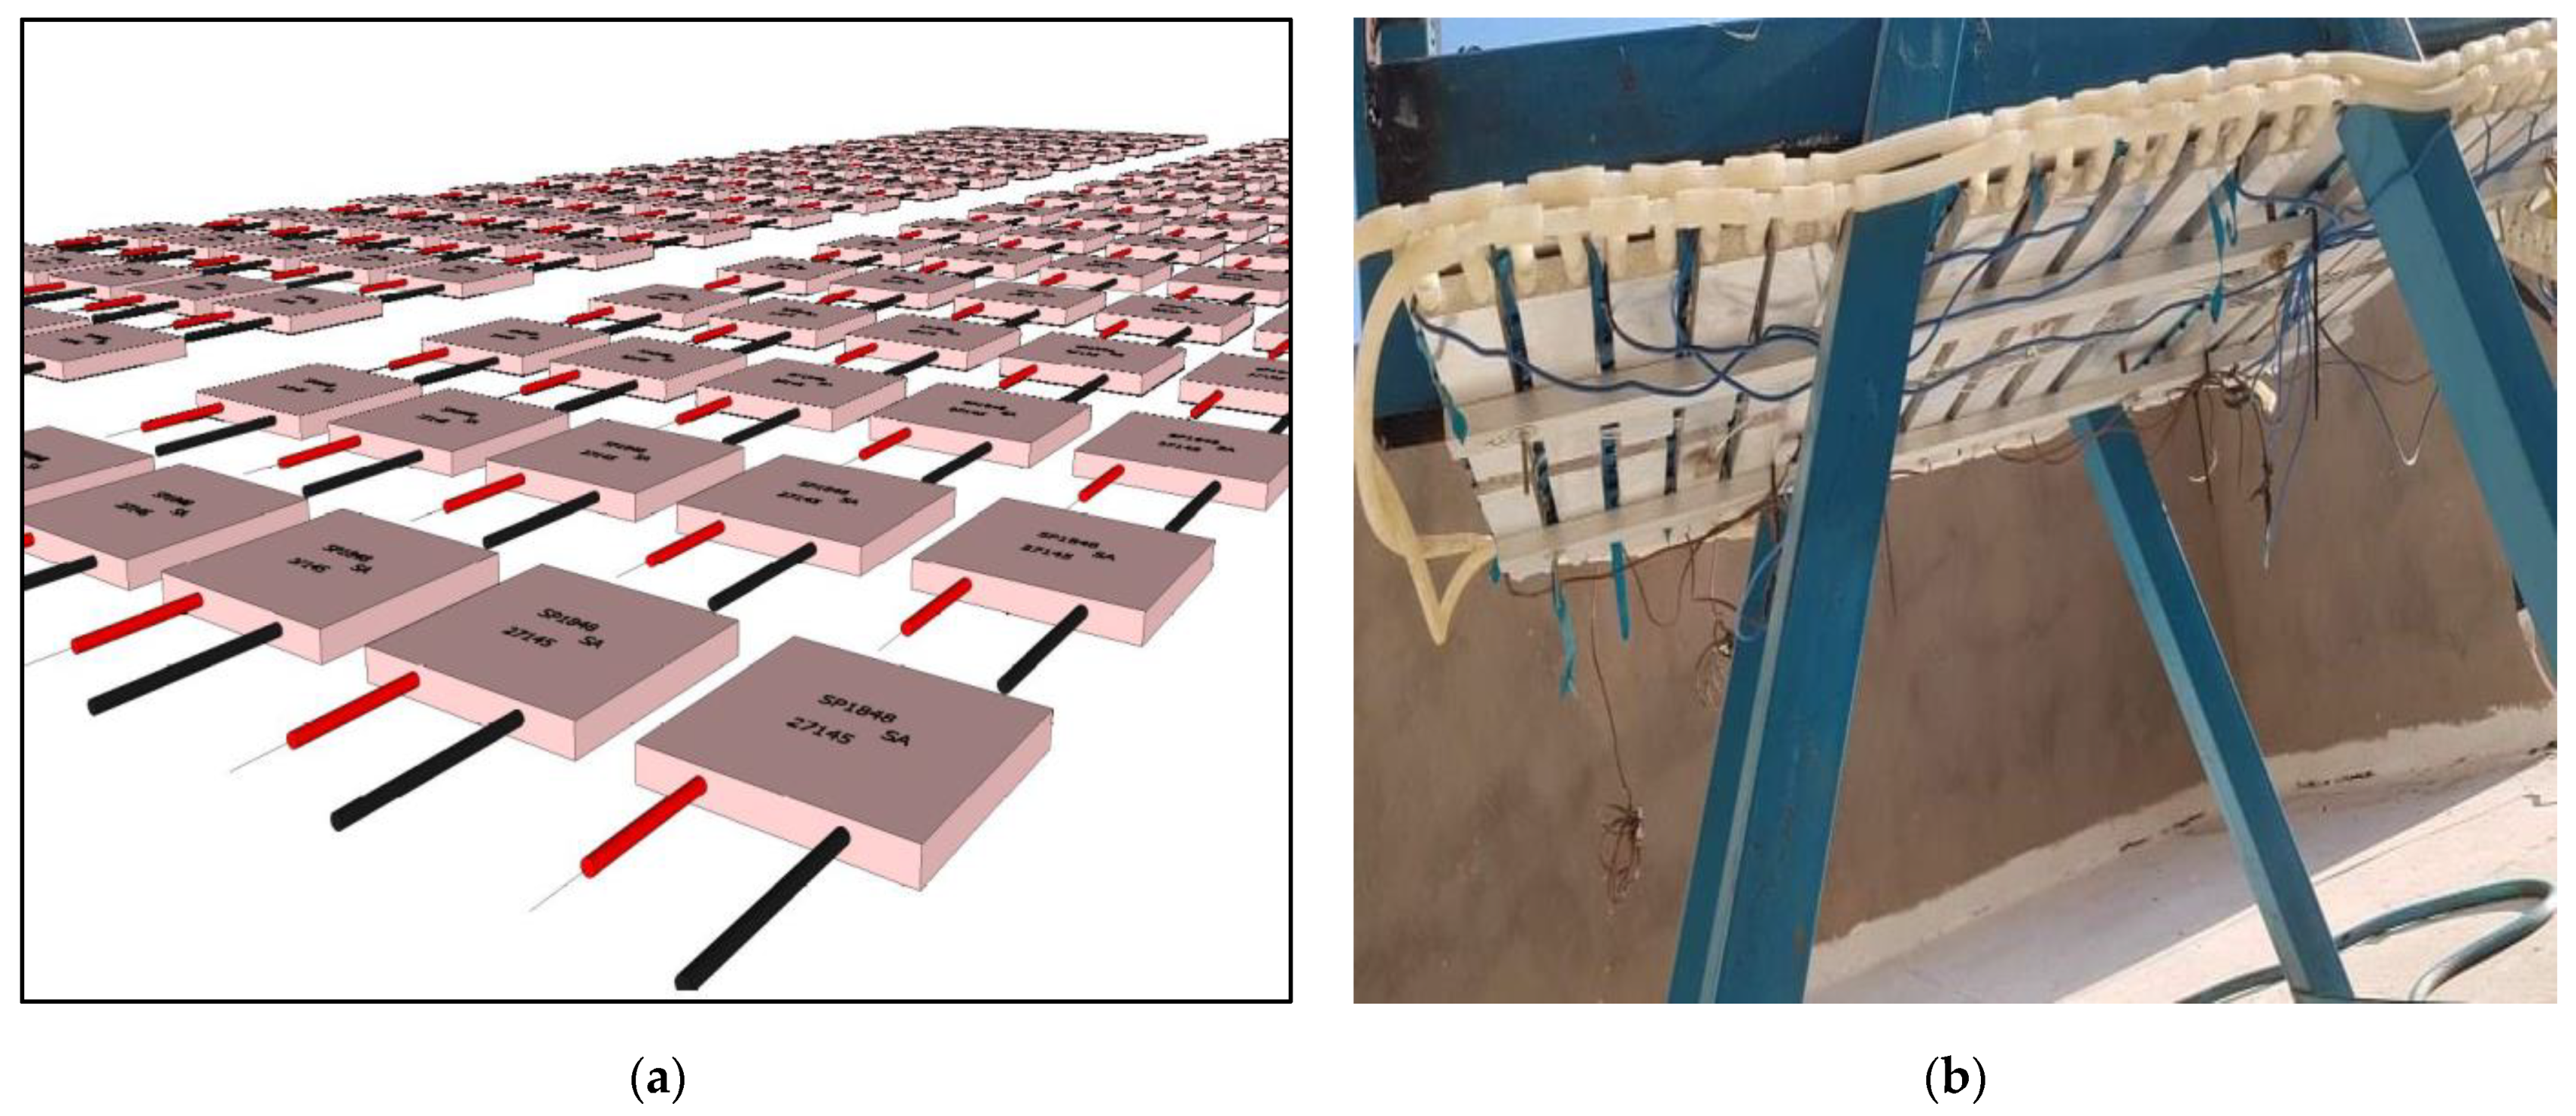
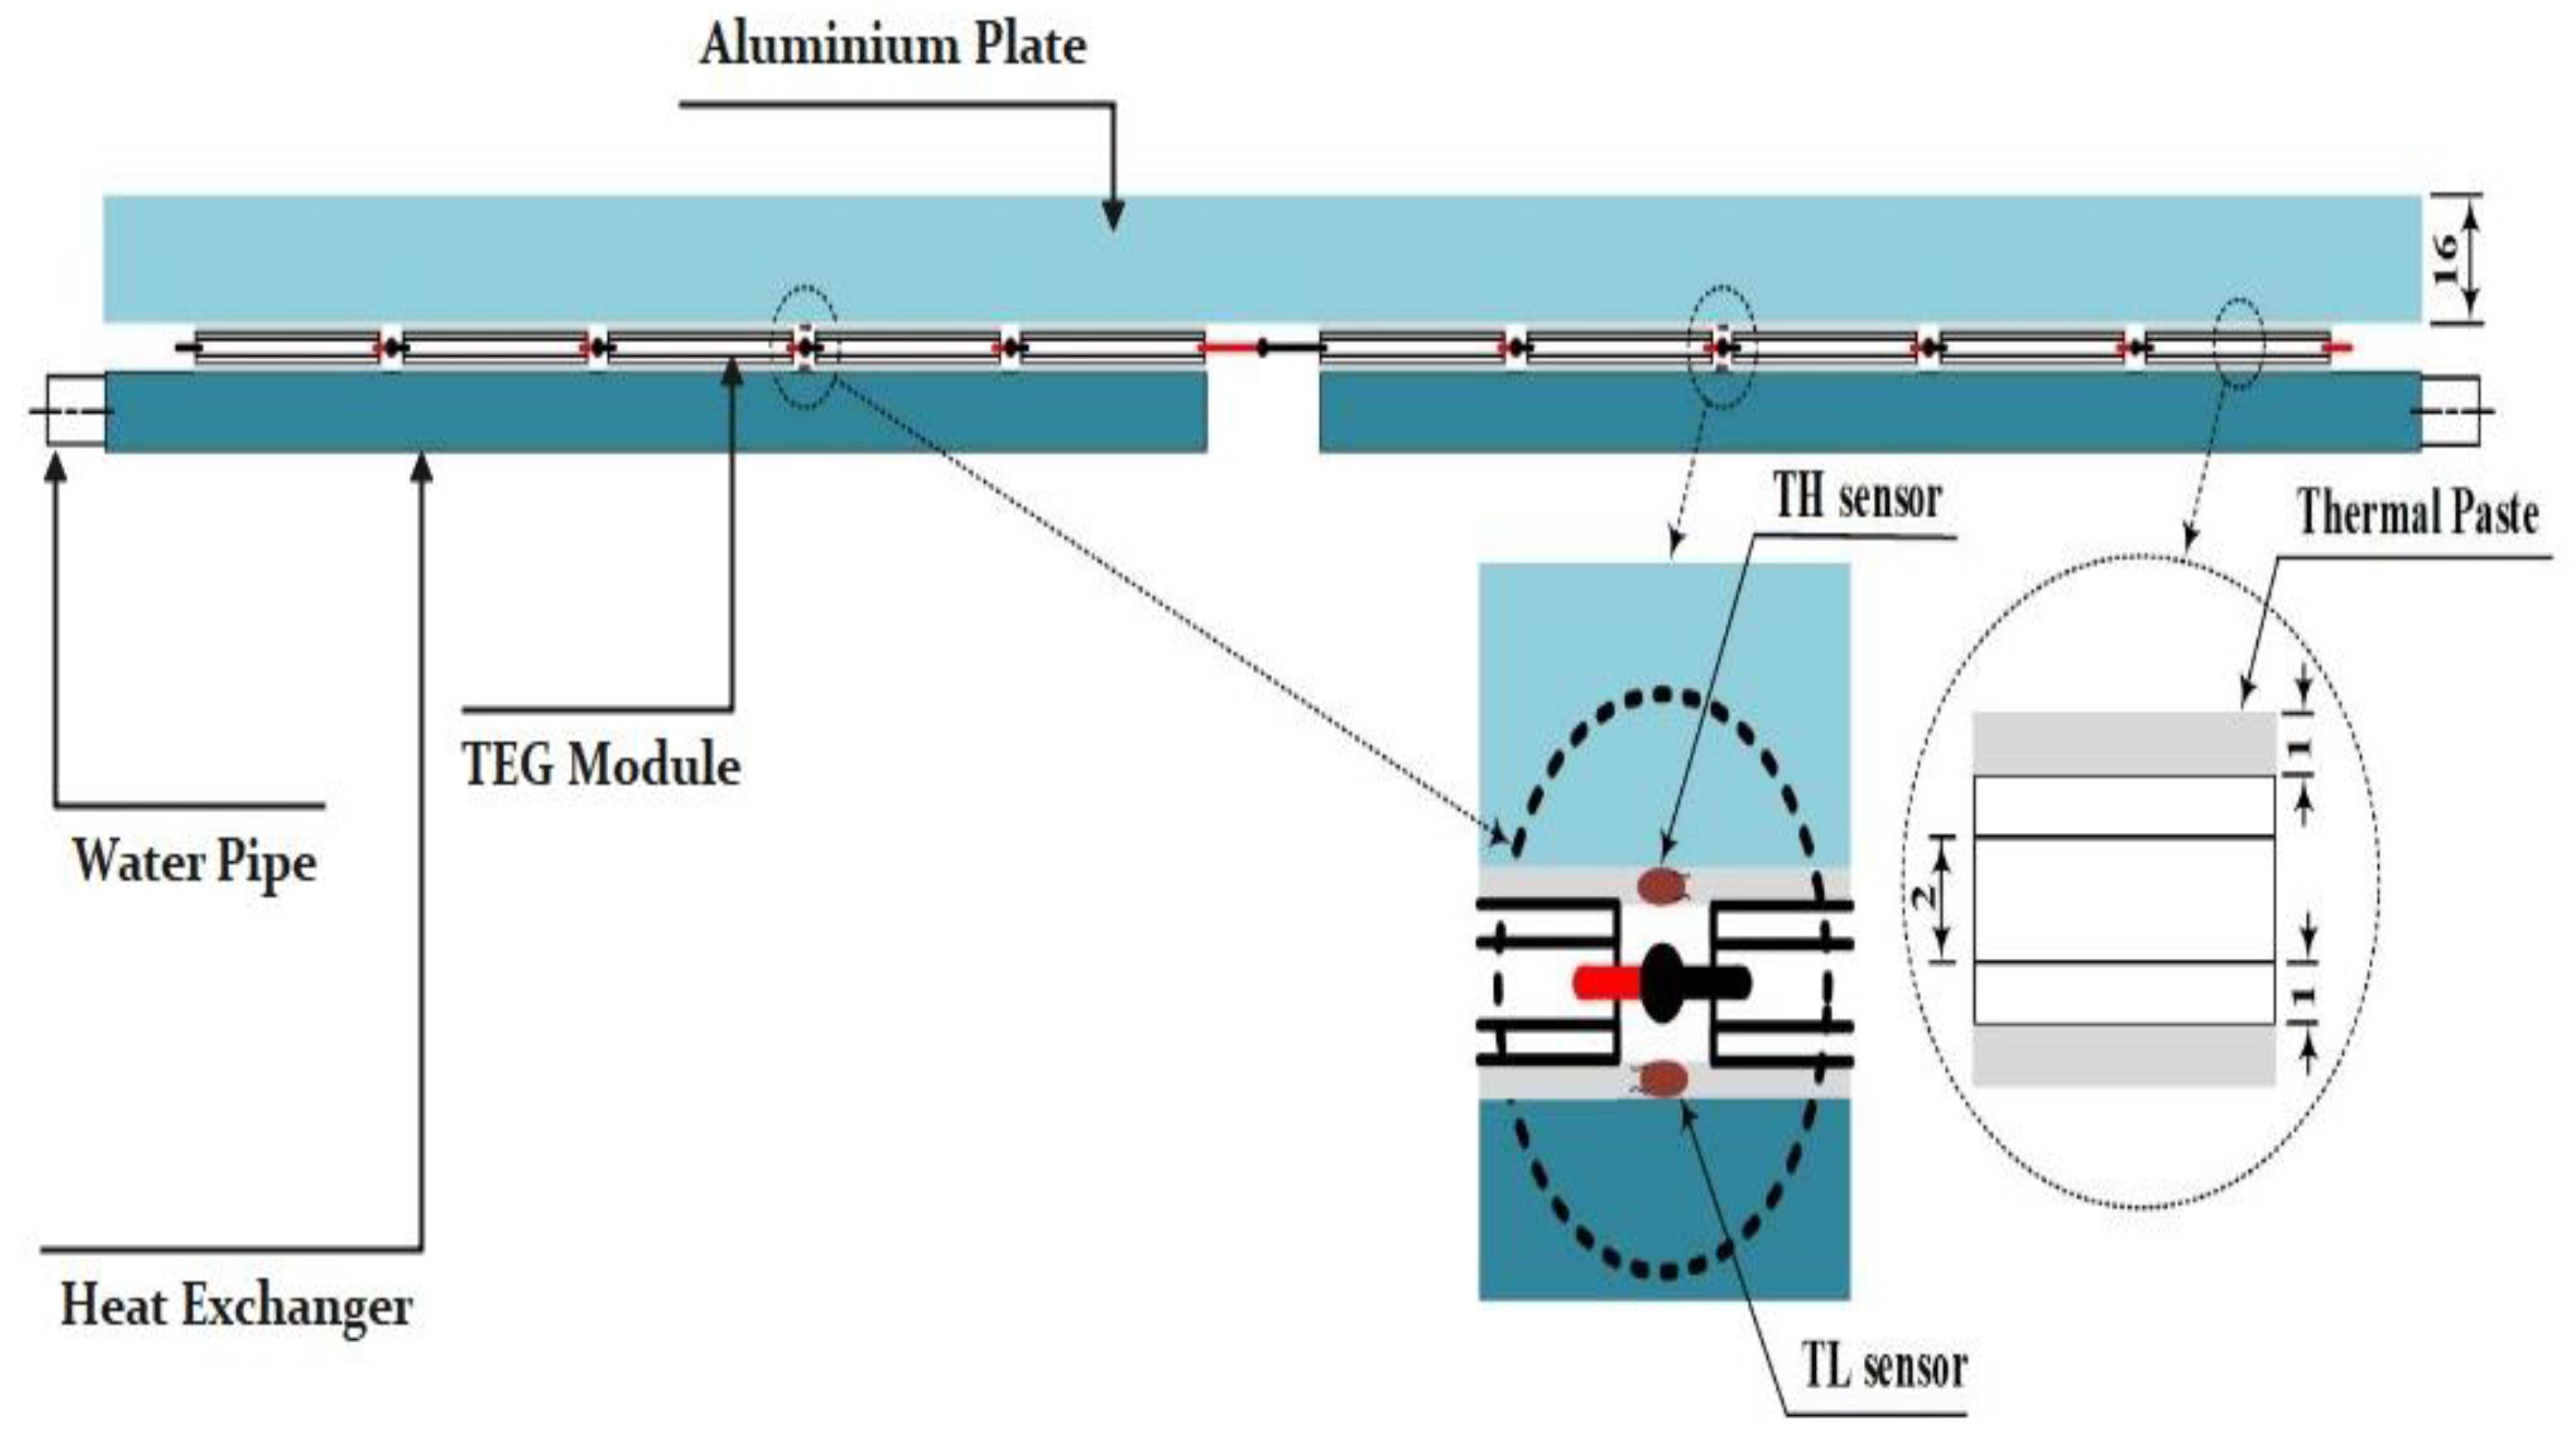
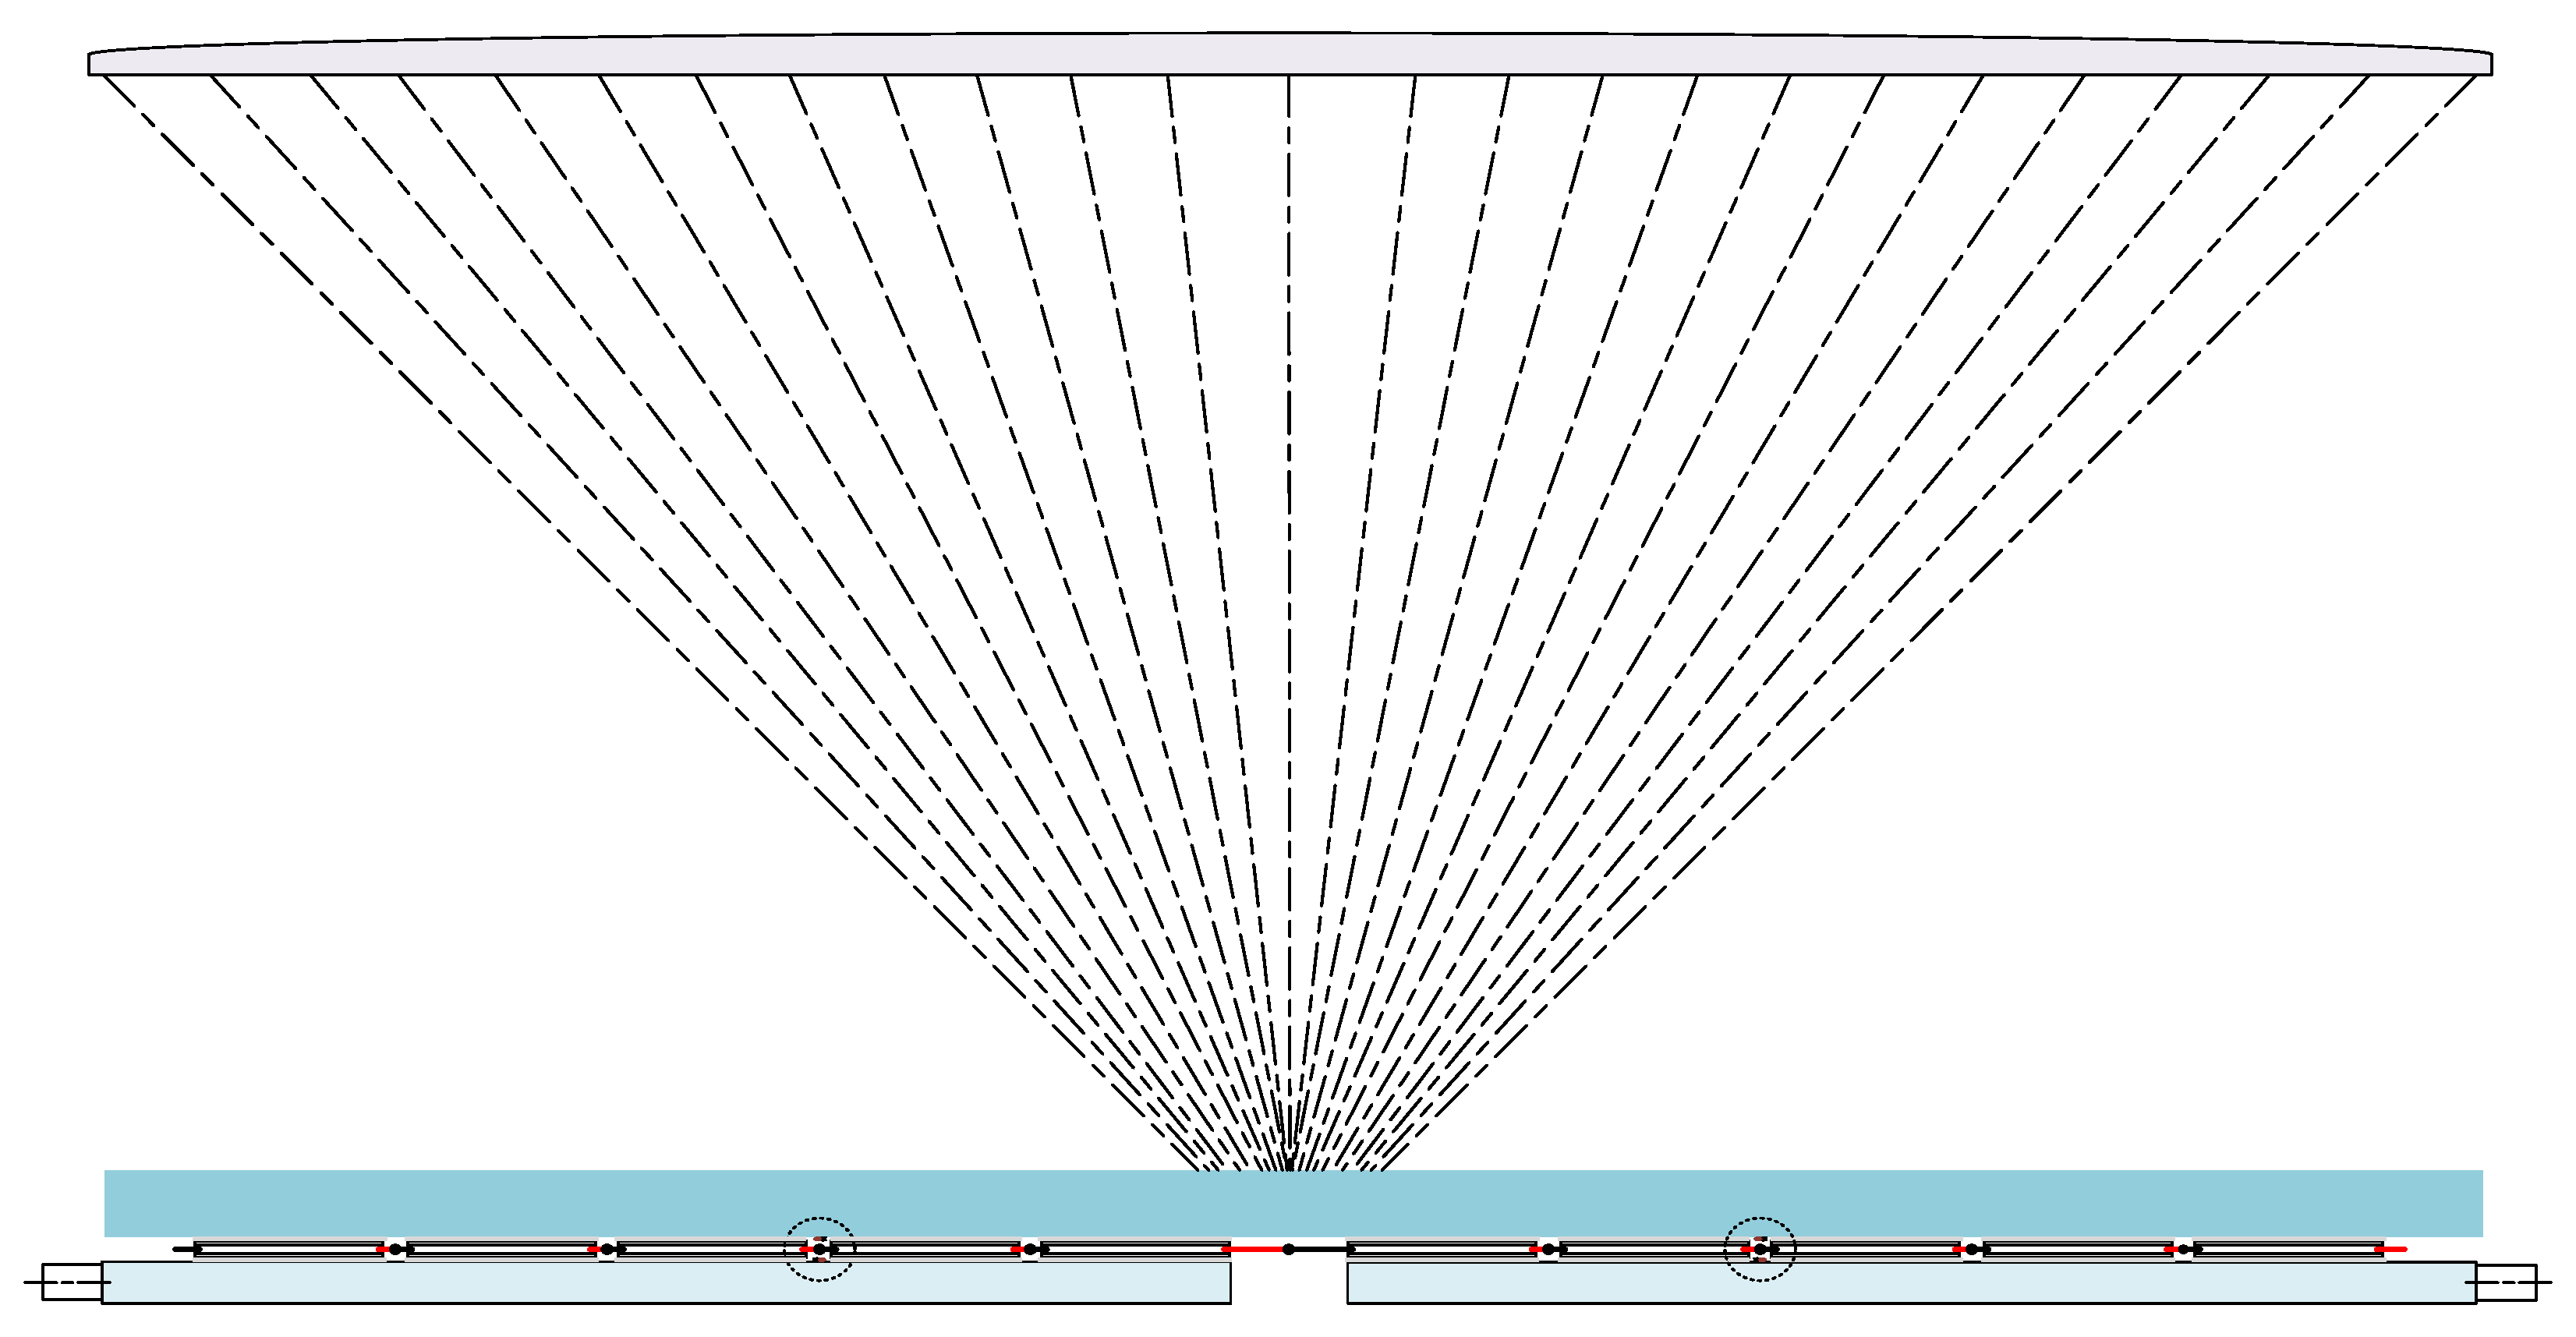
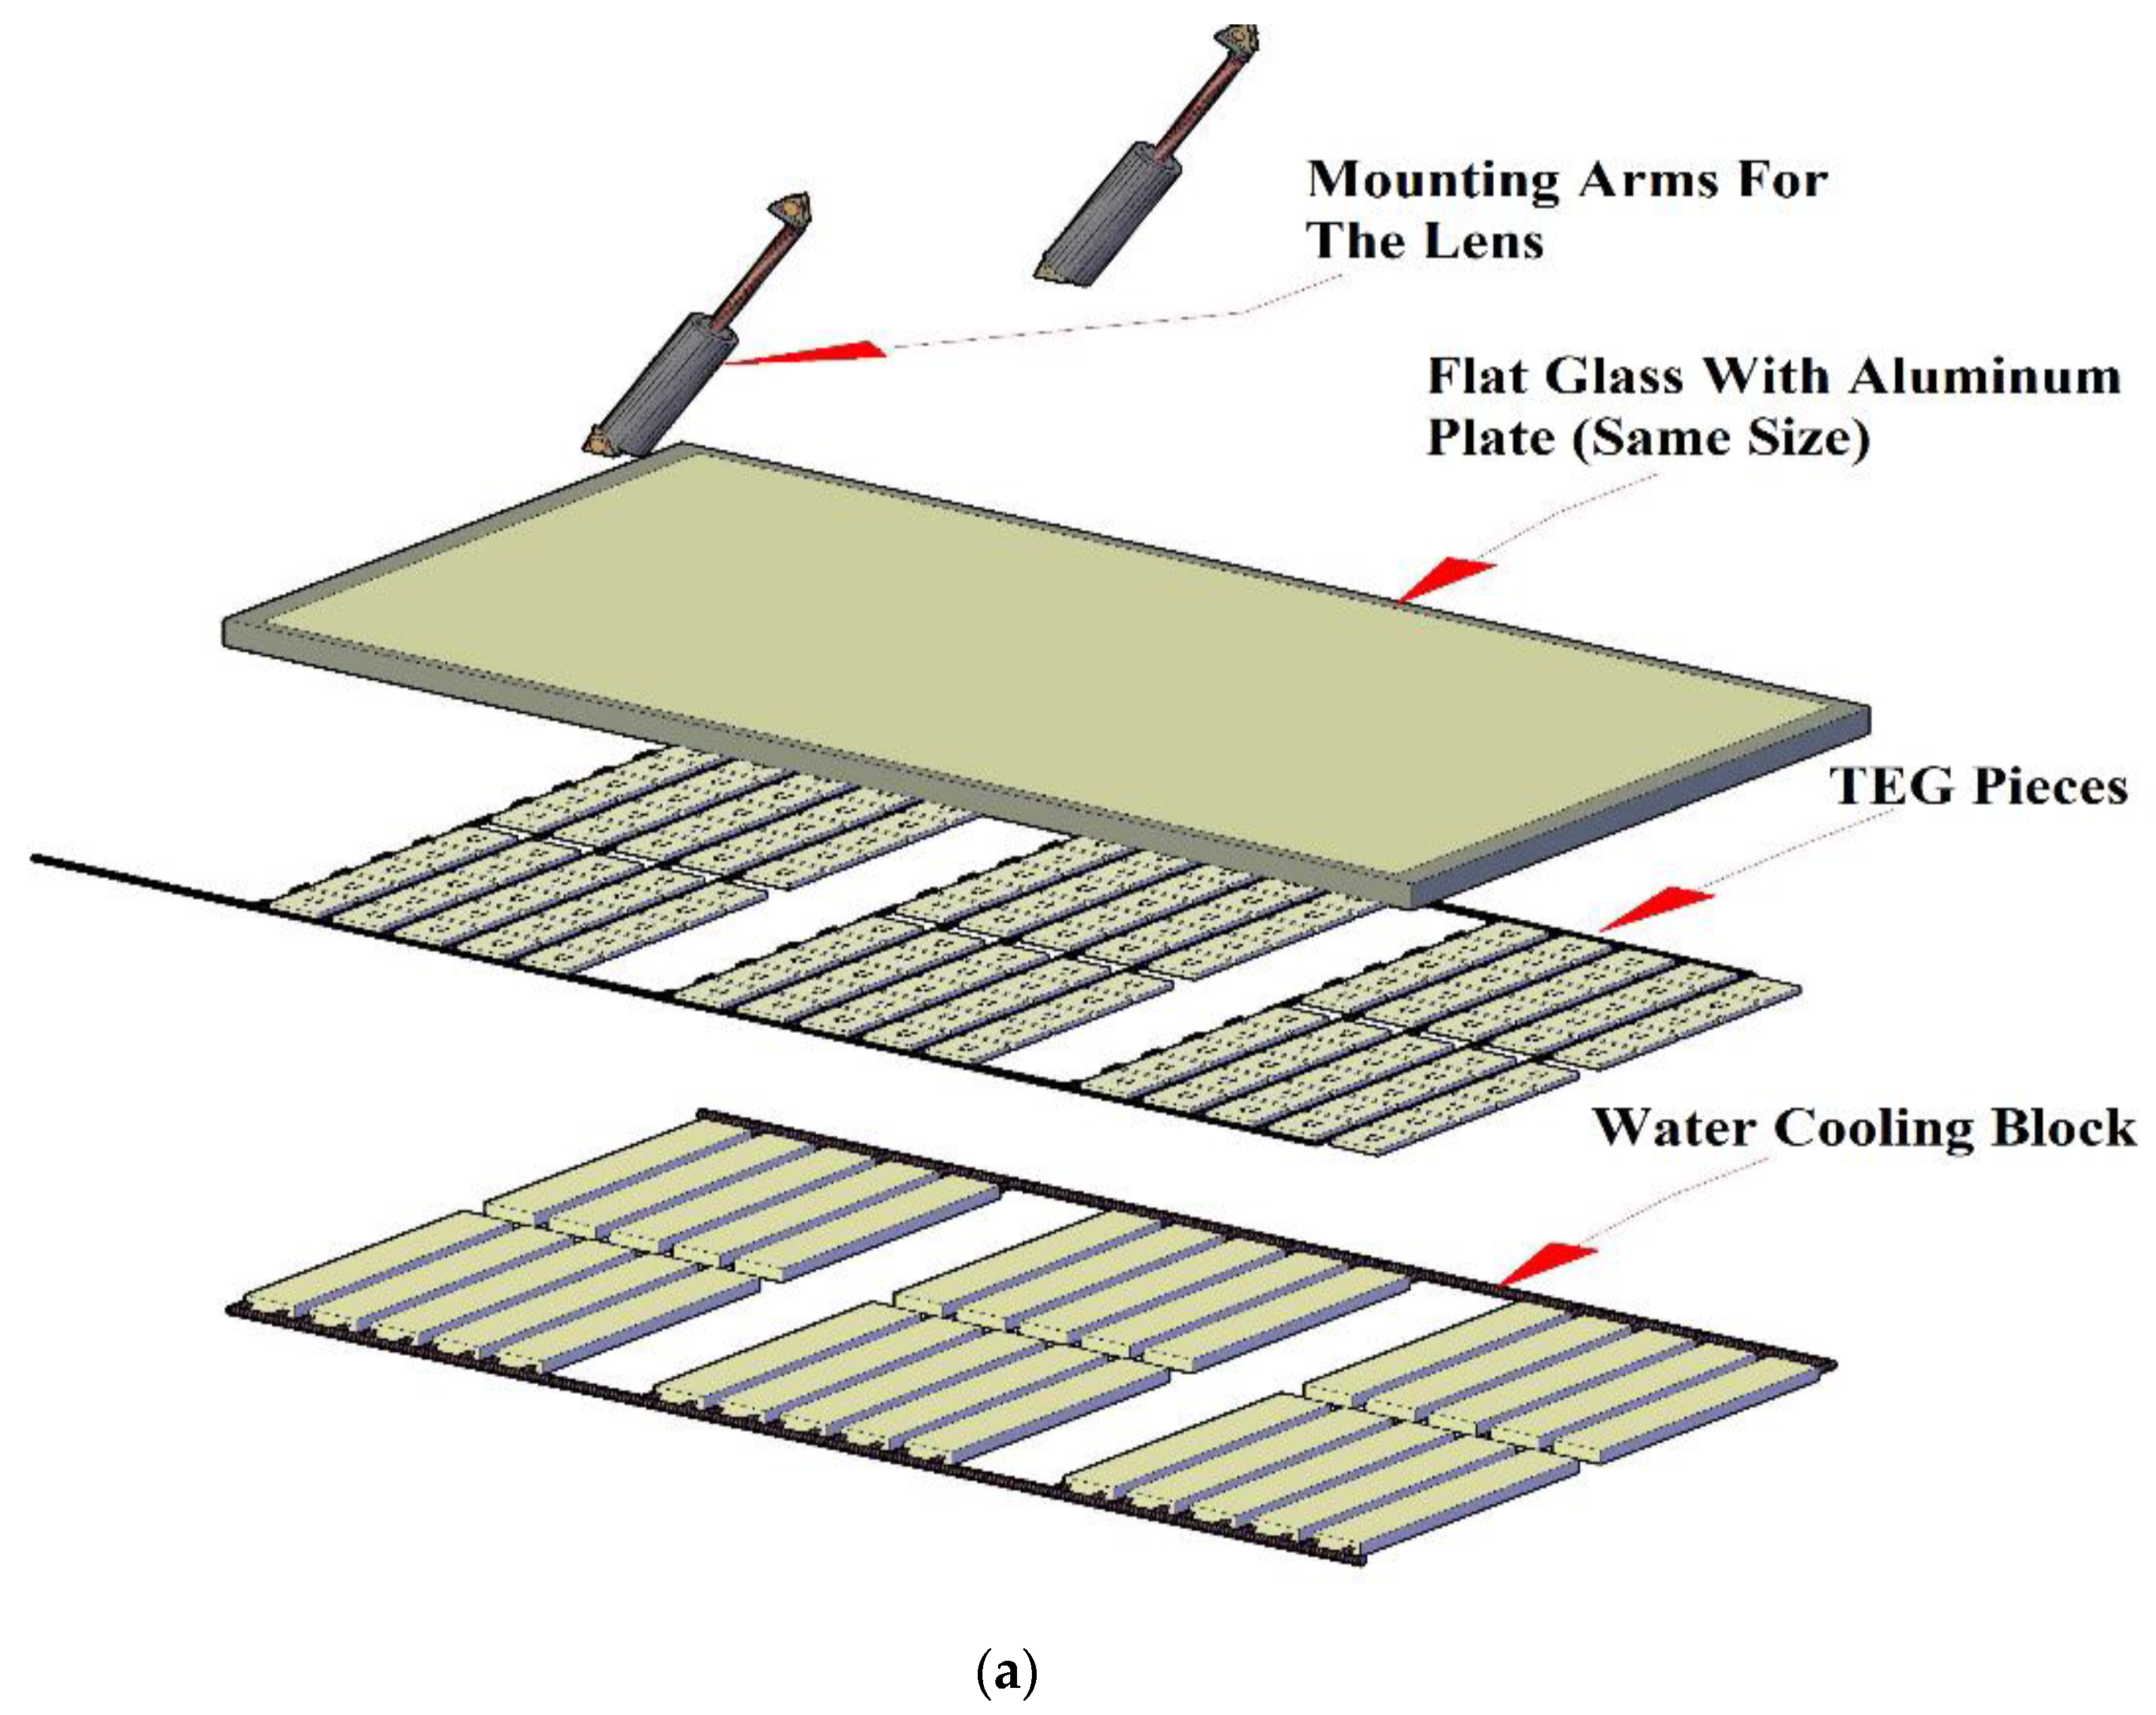
2. TEG Panel Design
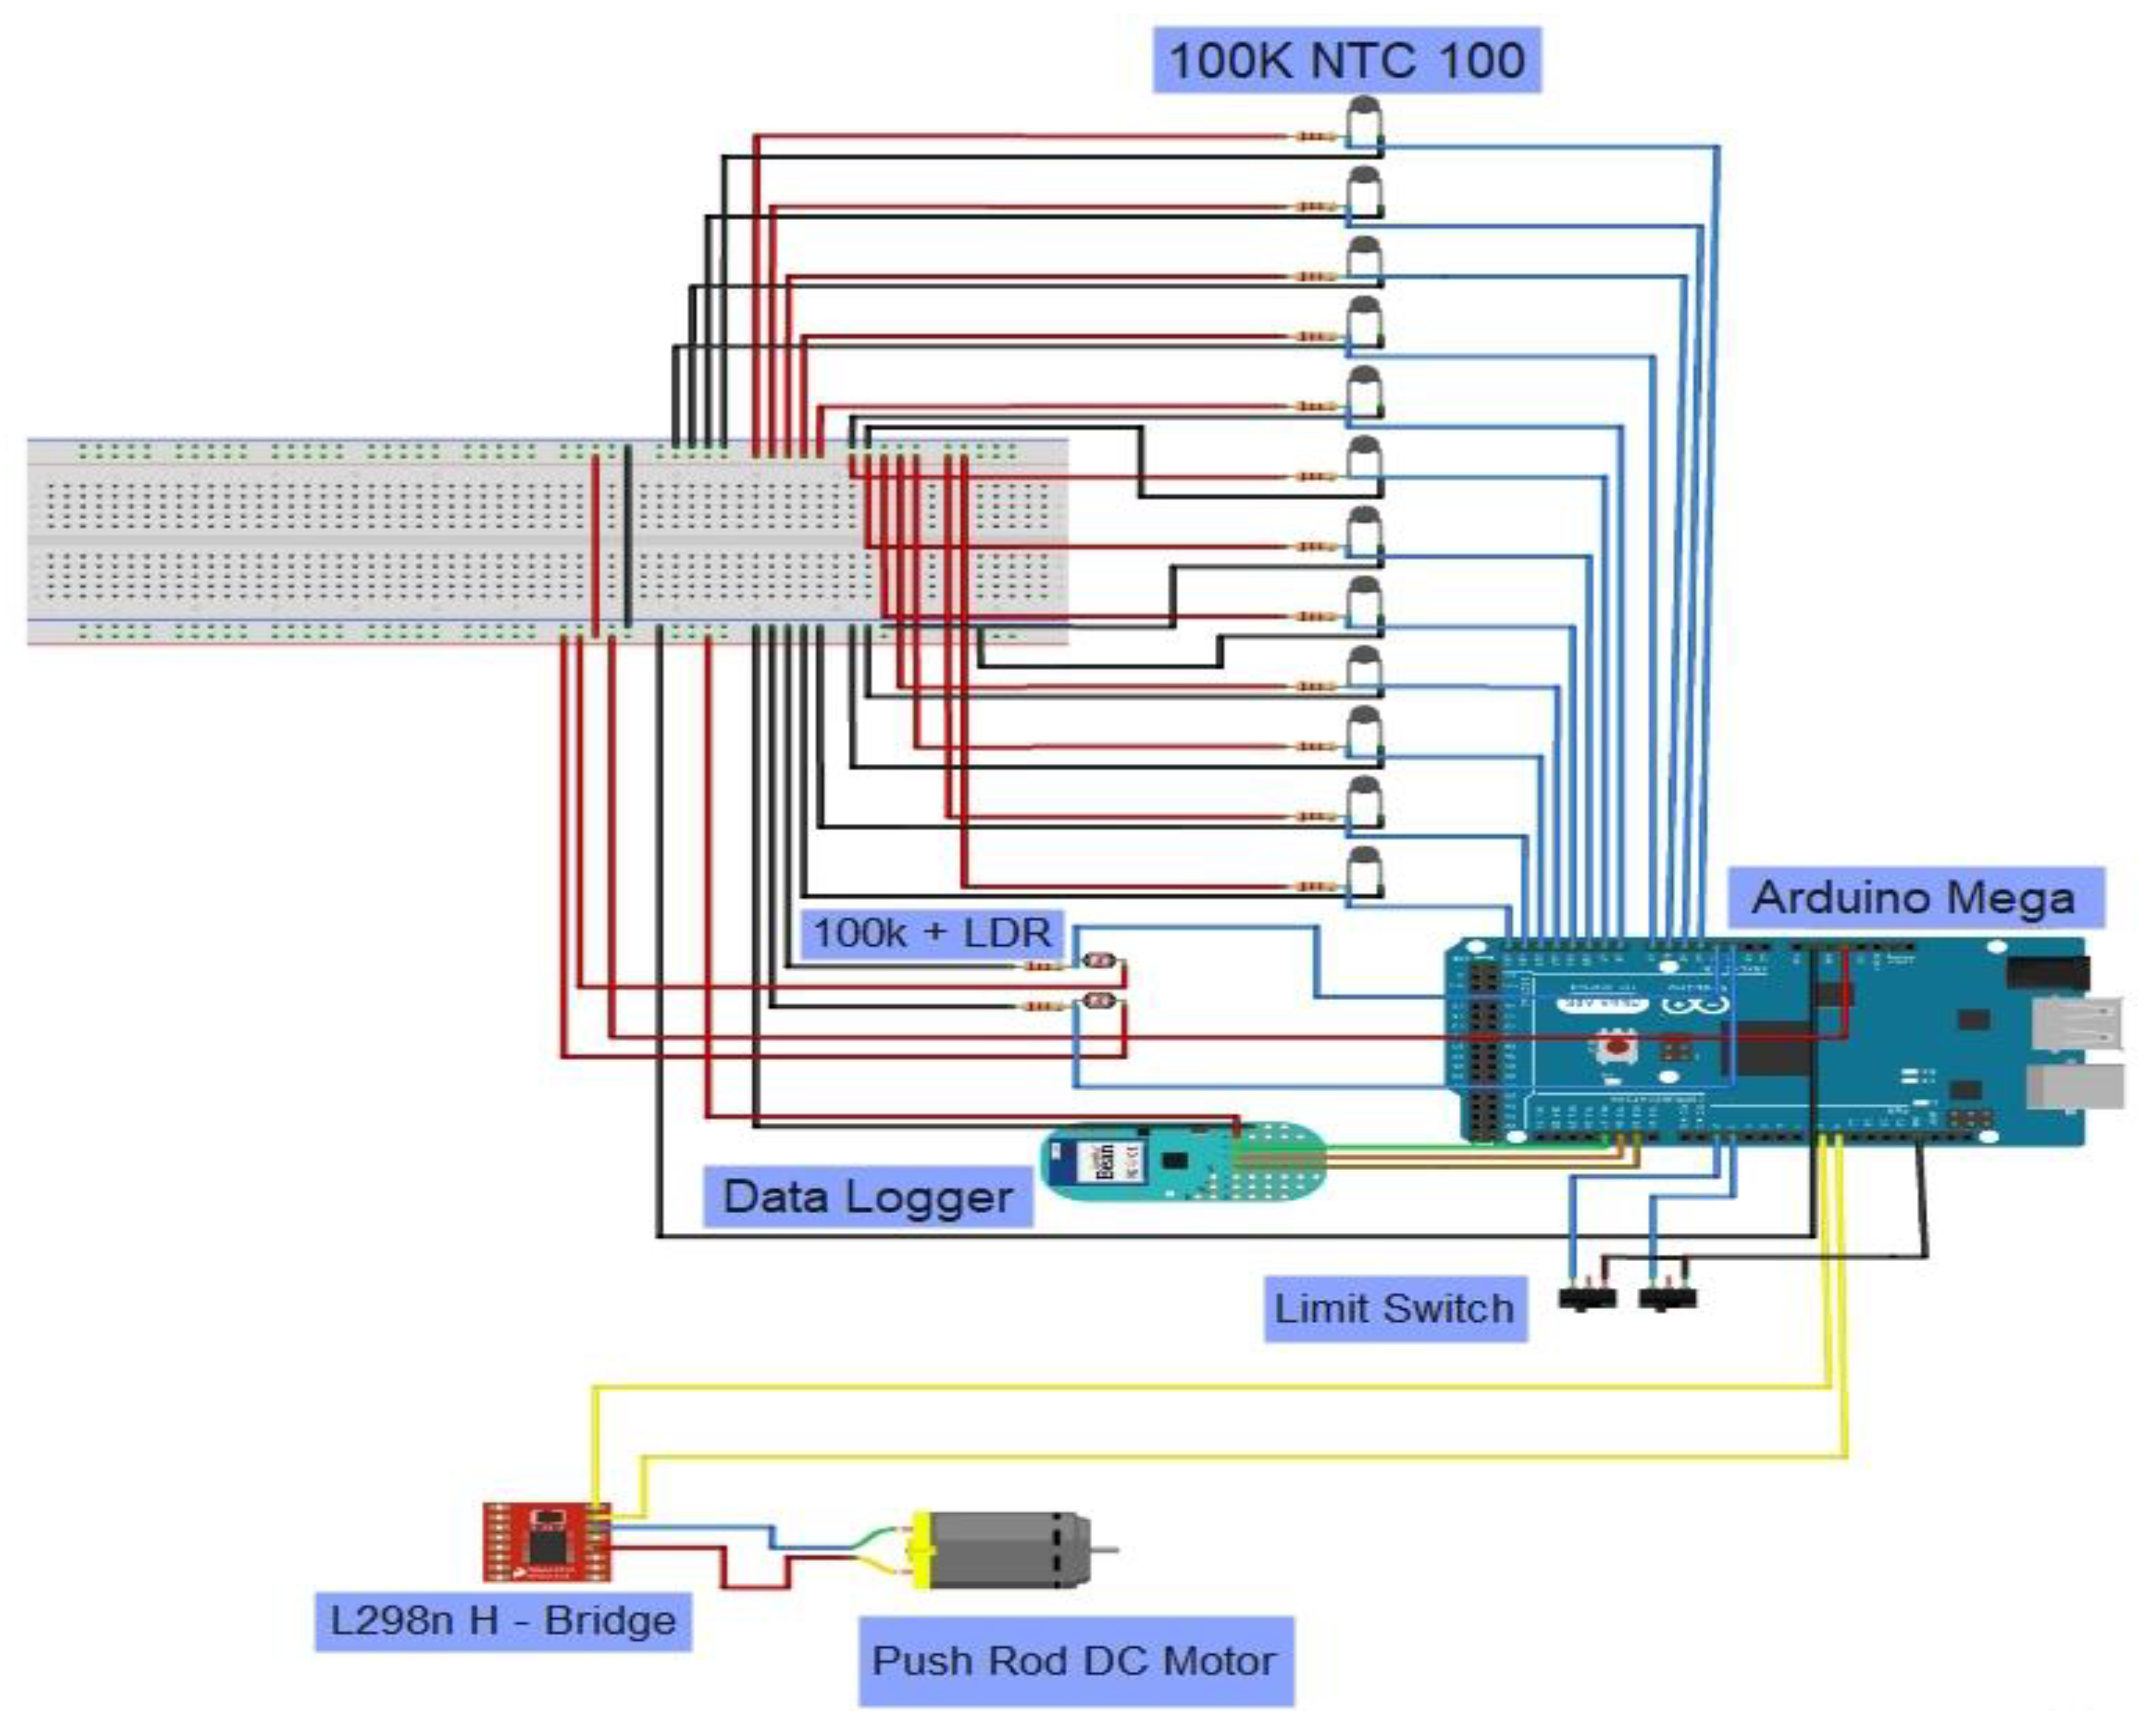
3. Experimental Methods
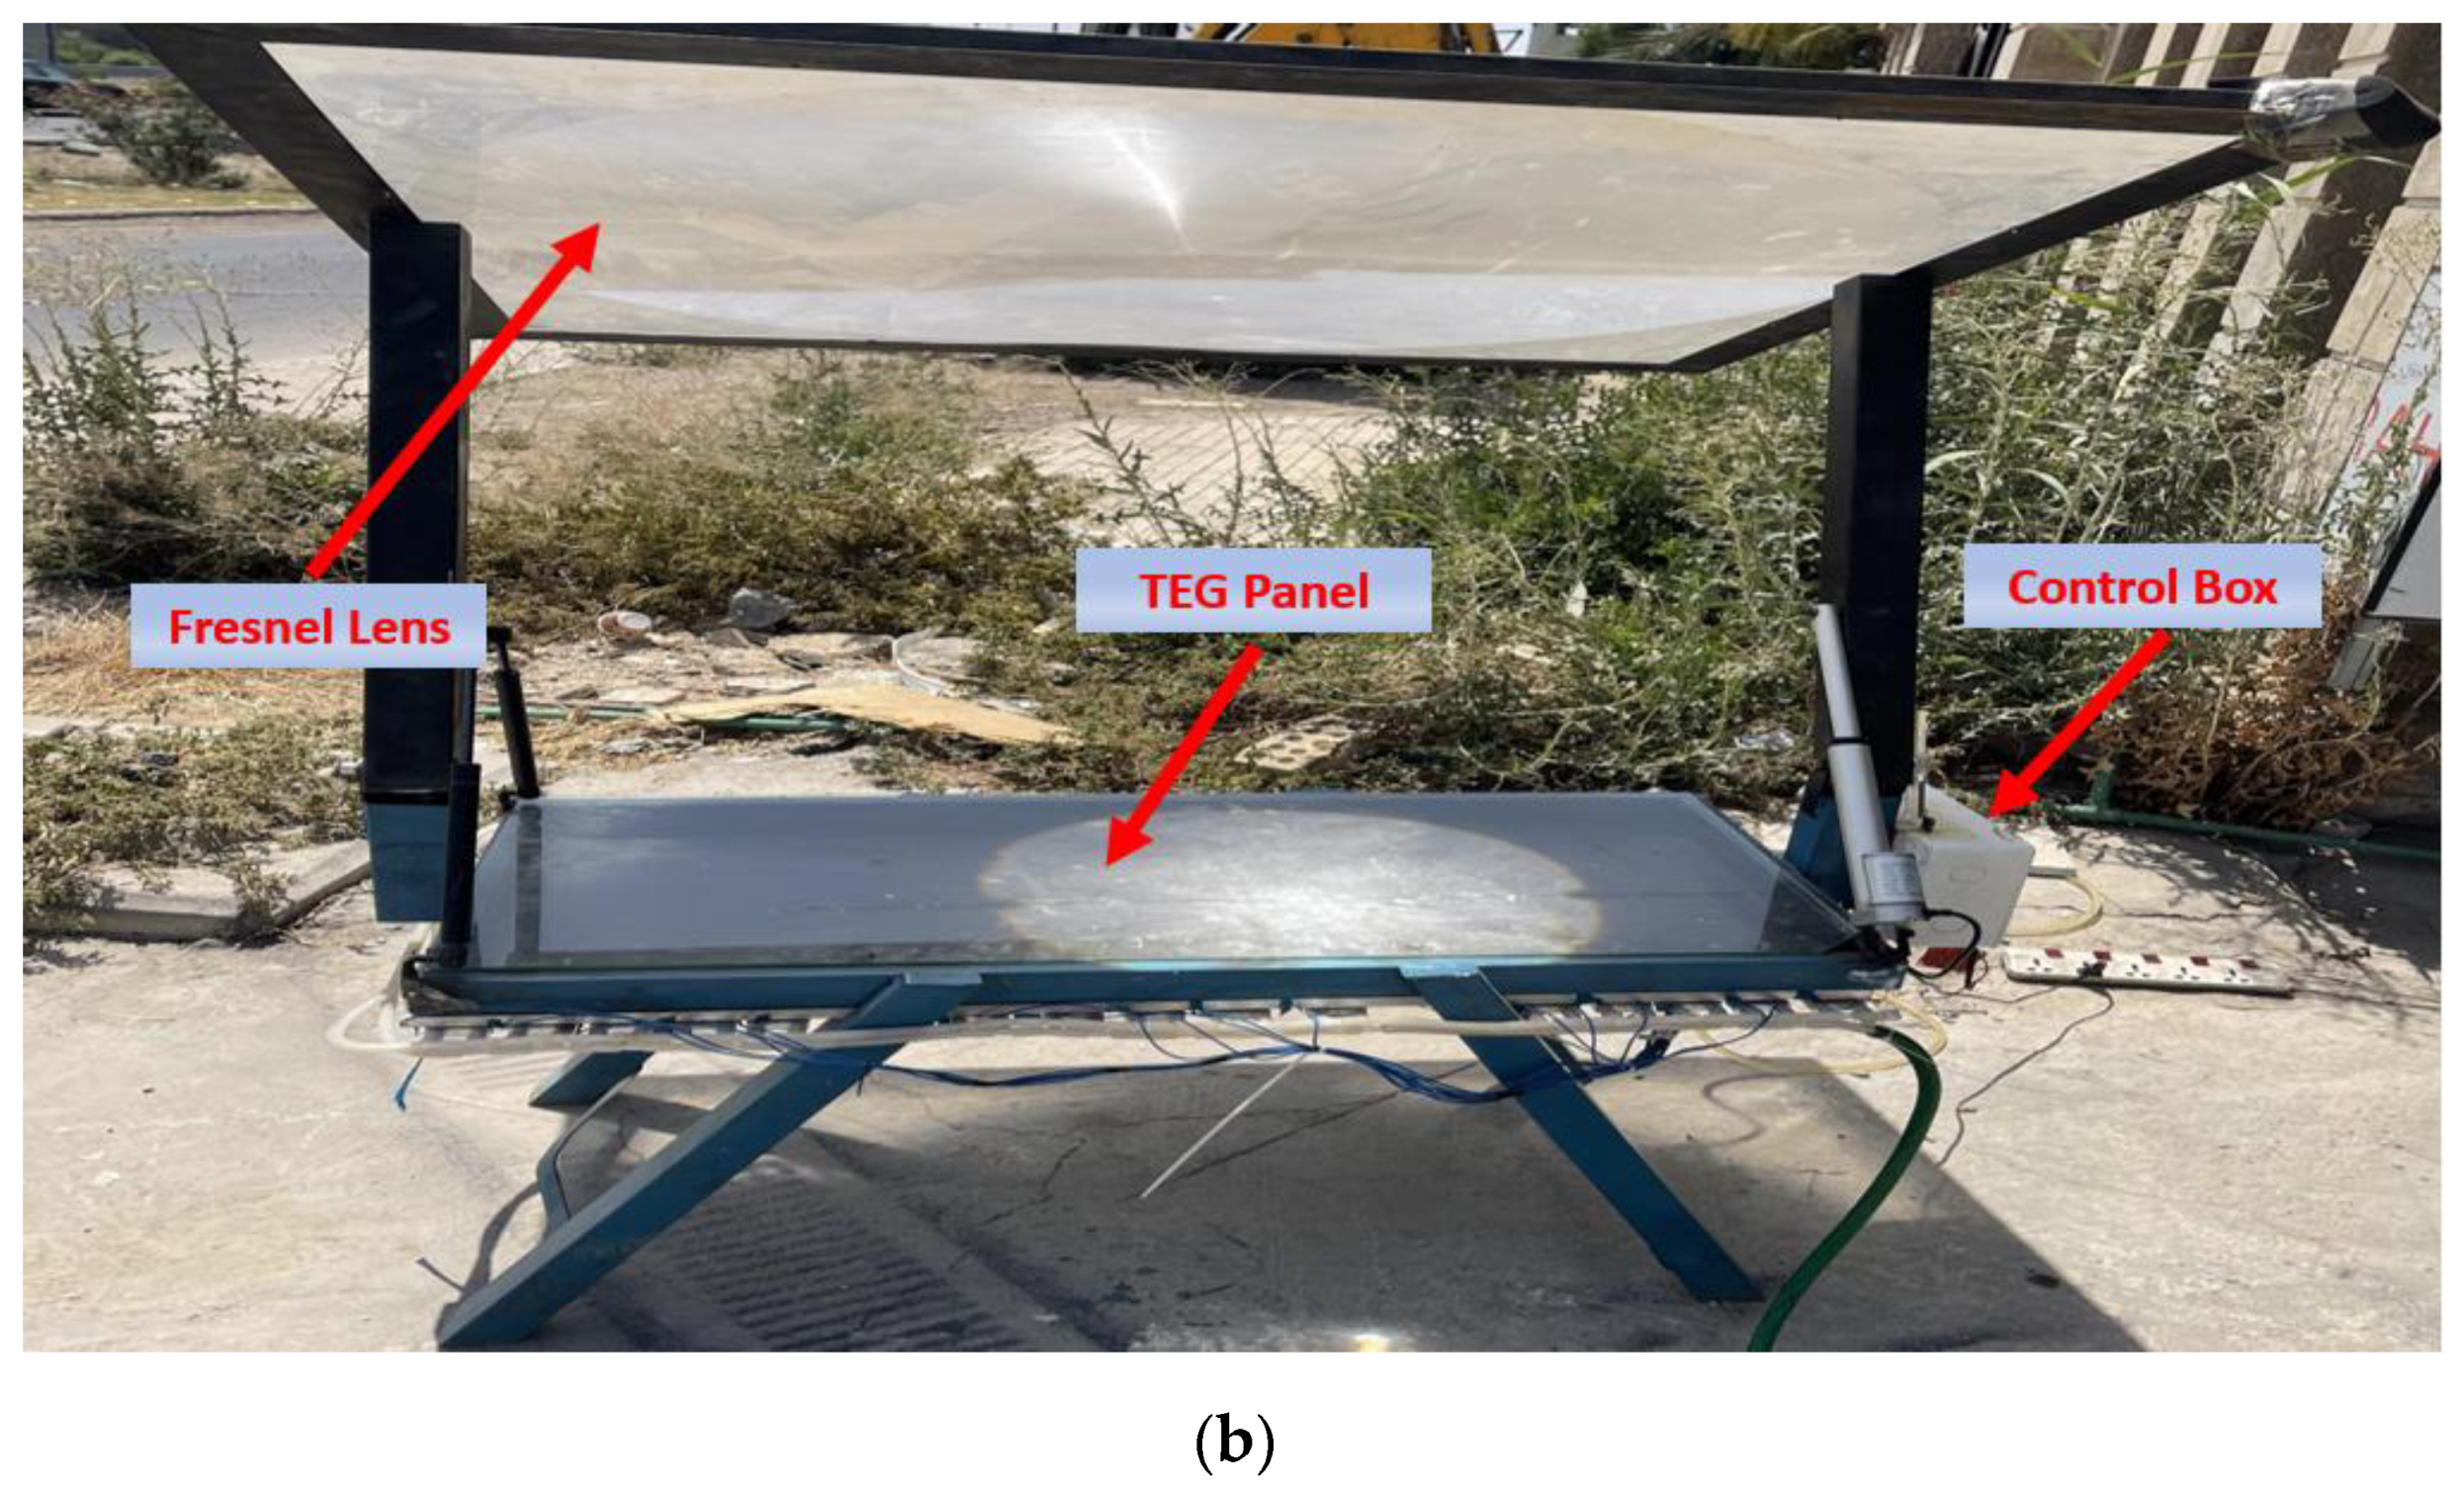
3.1. Applying Solar Radiation to a TEG Panel through a Fresnel Lens (L-TEG Panel)
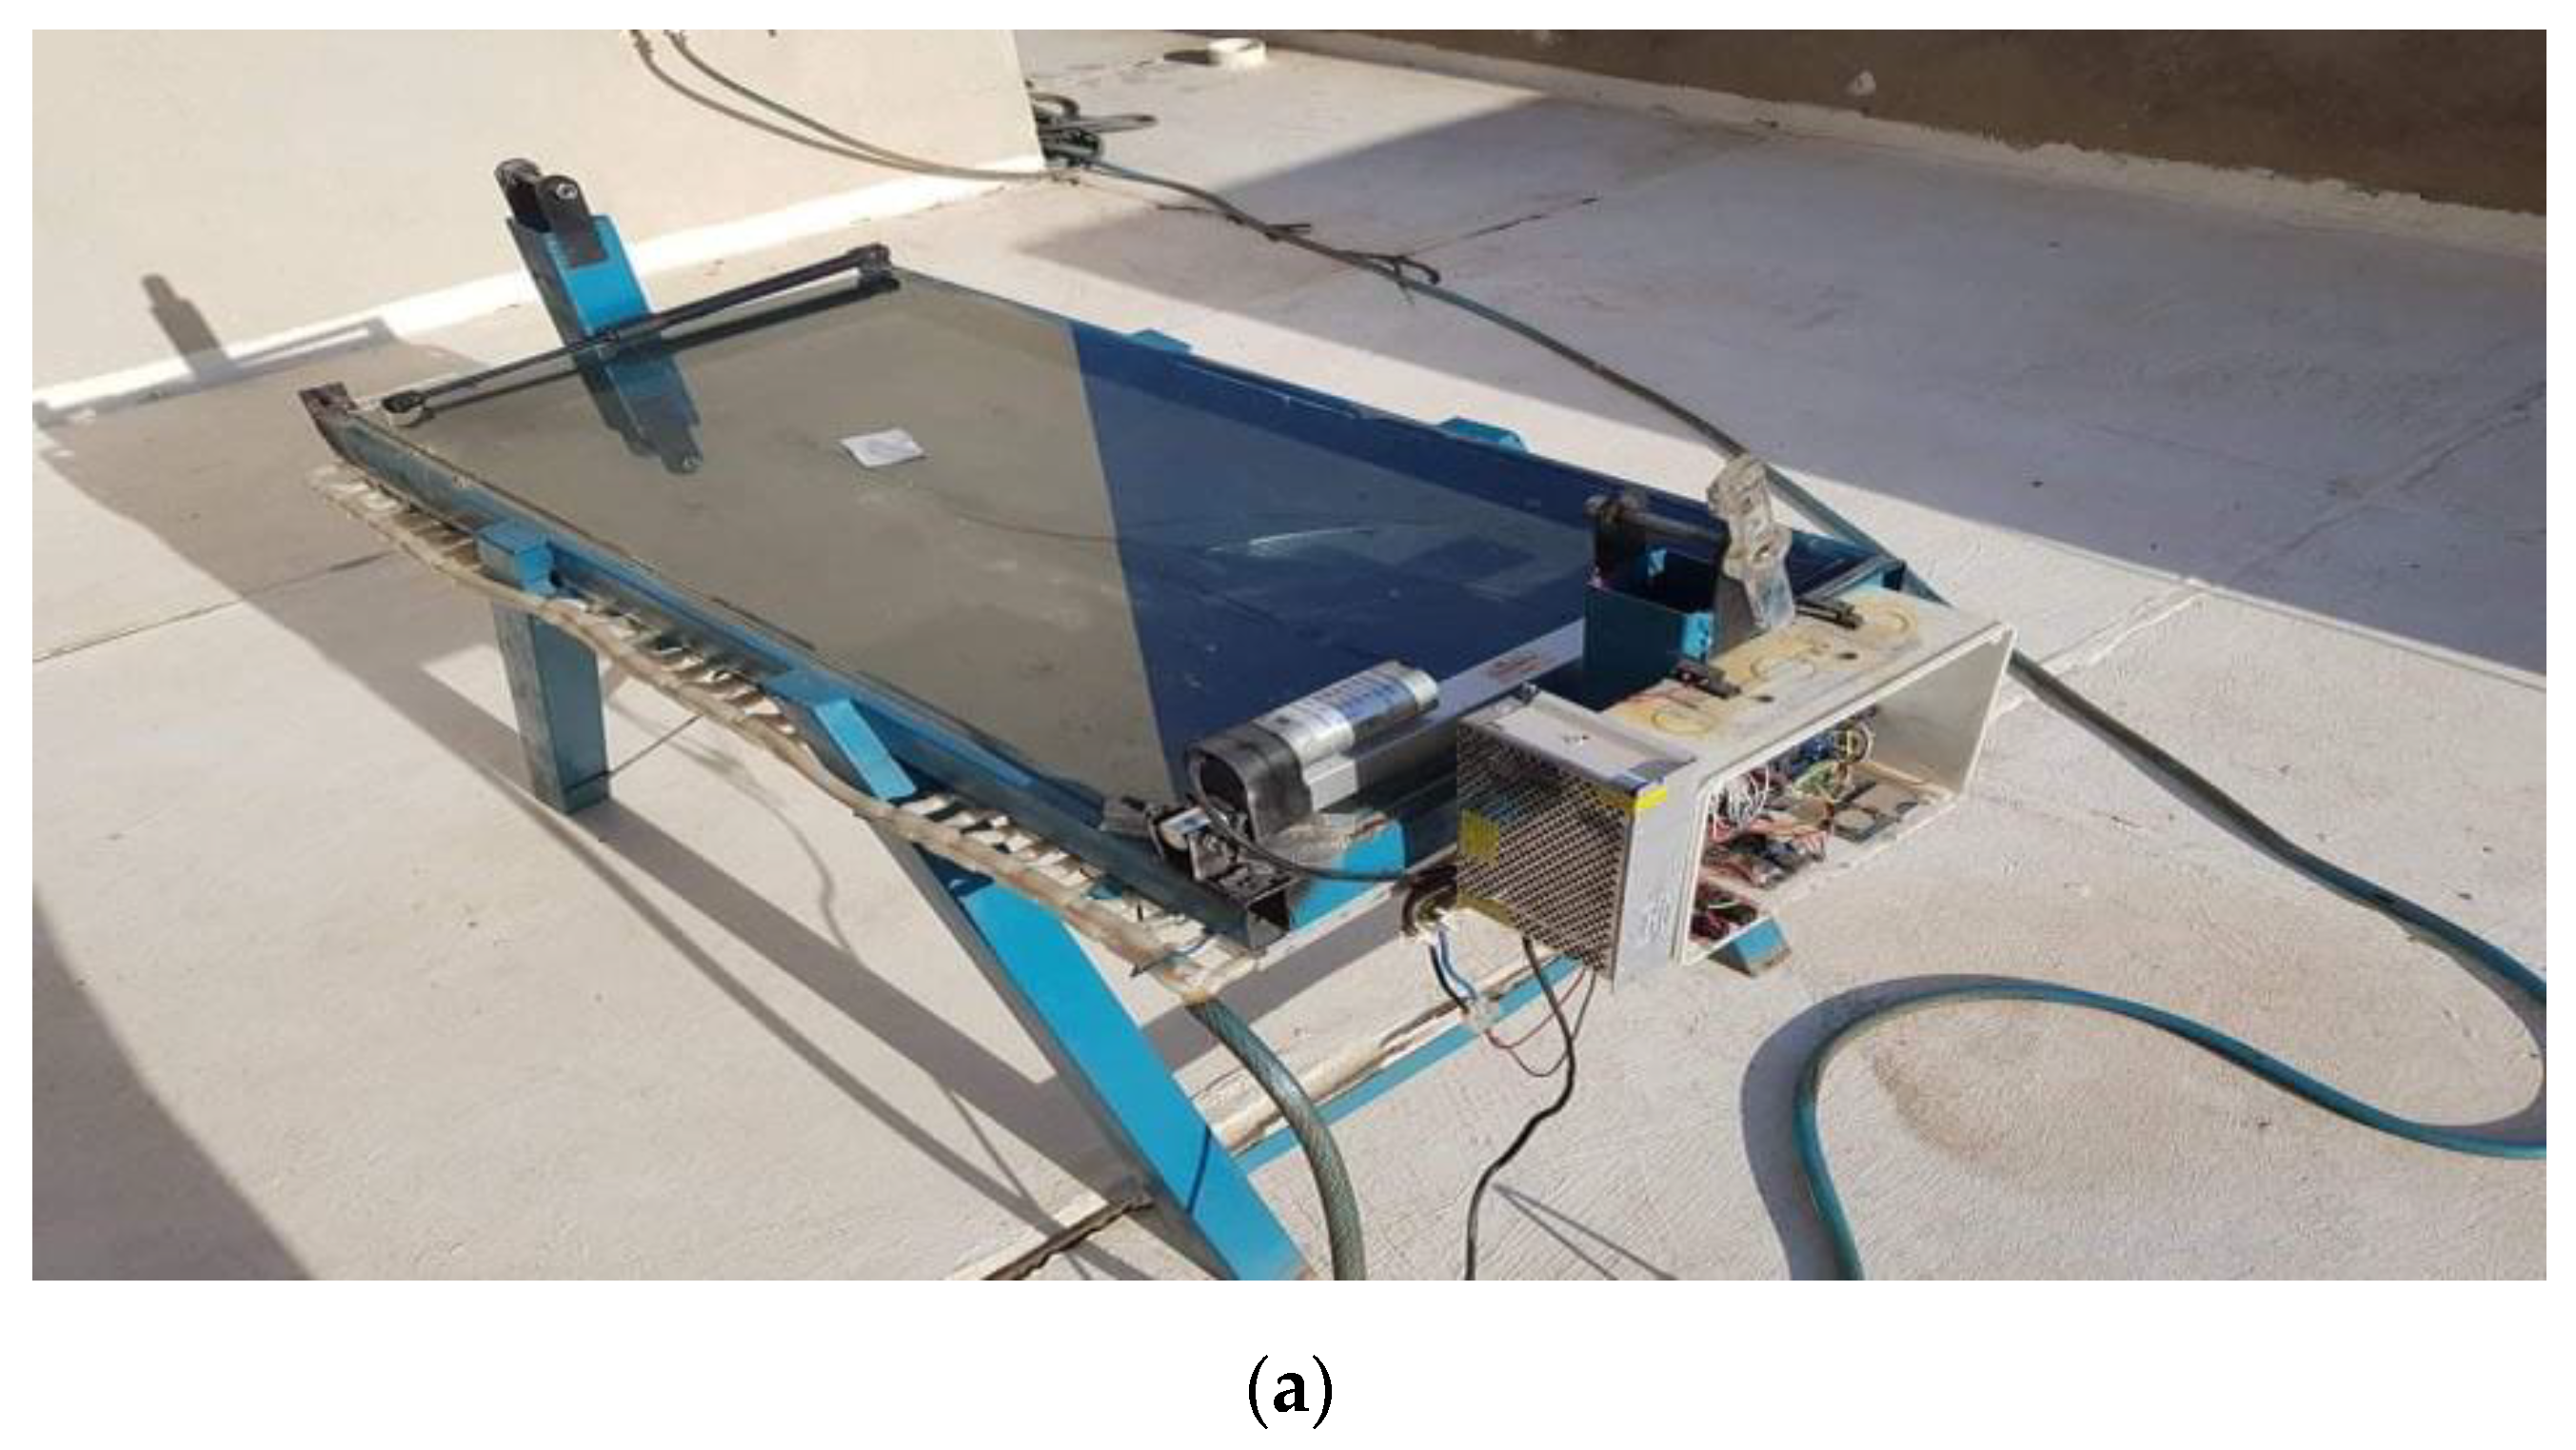
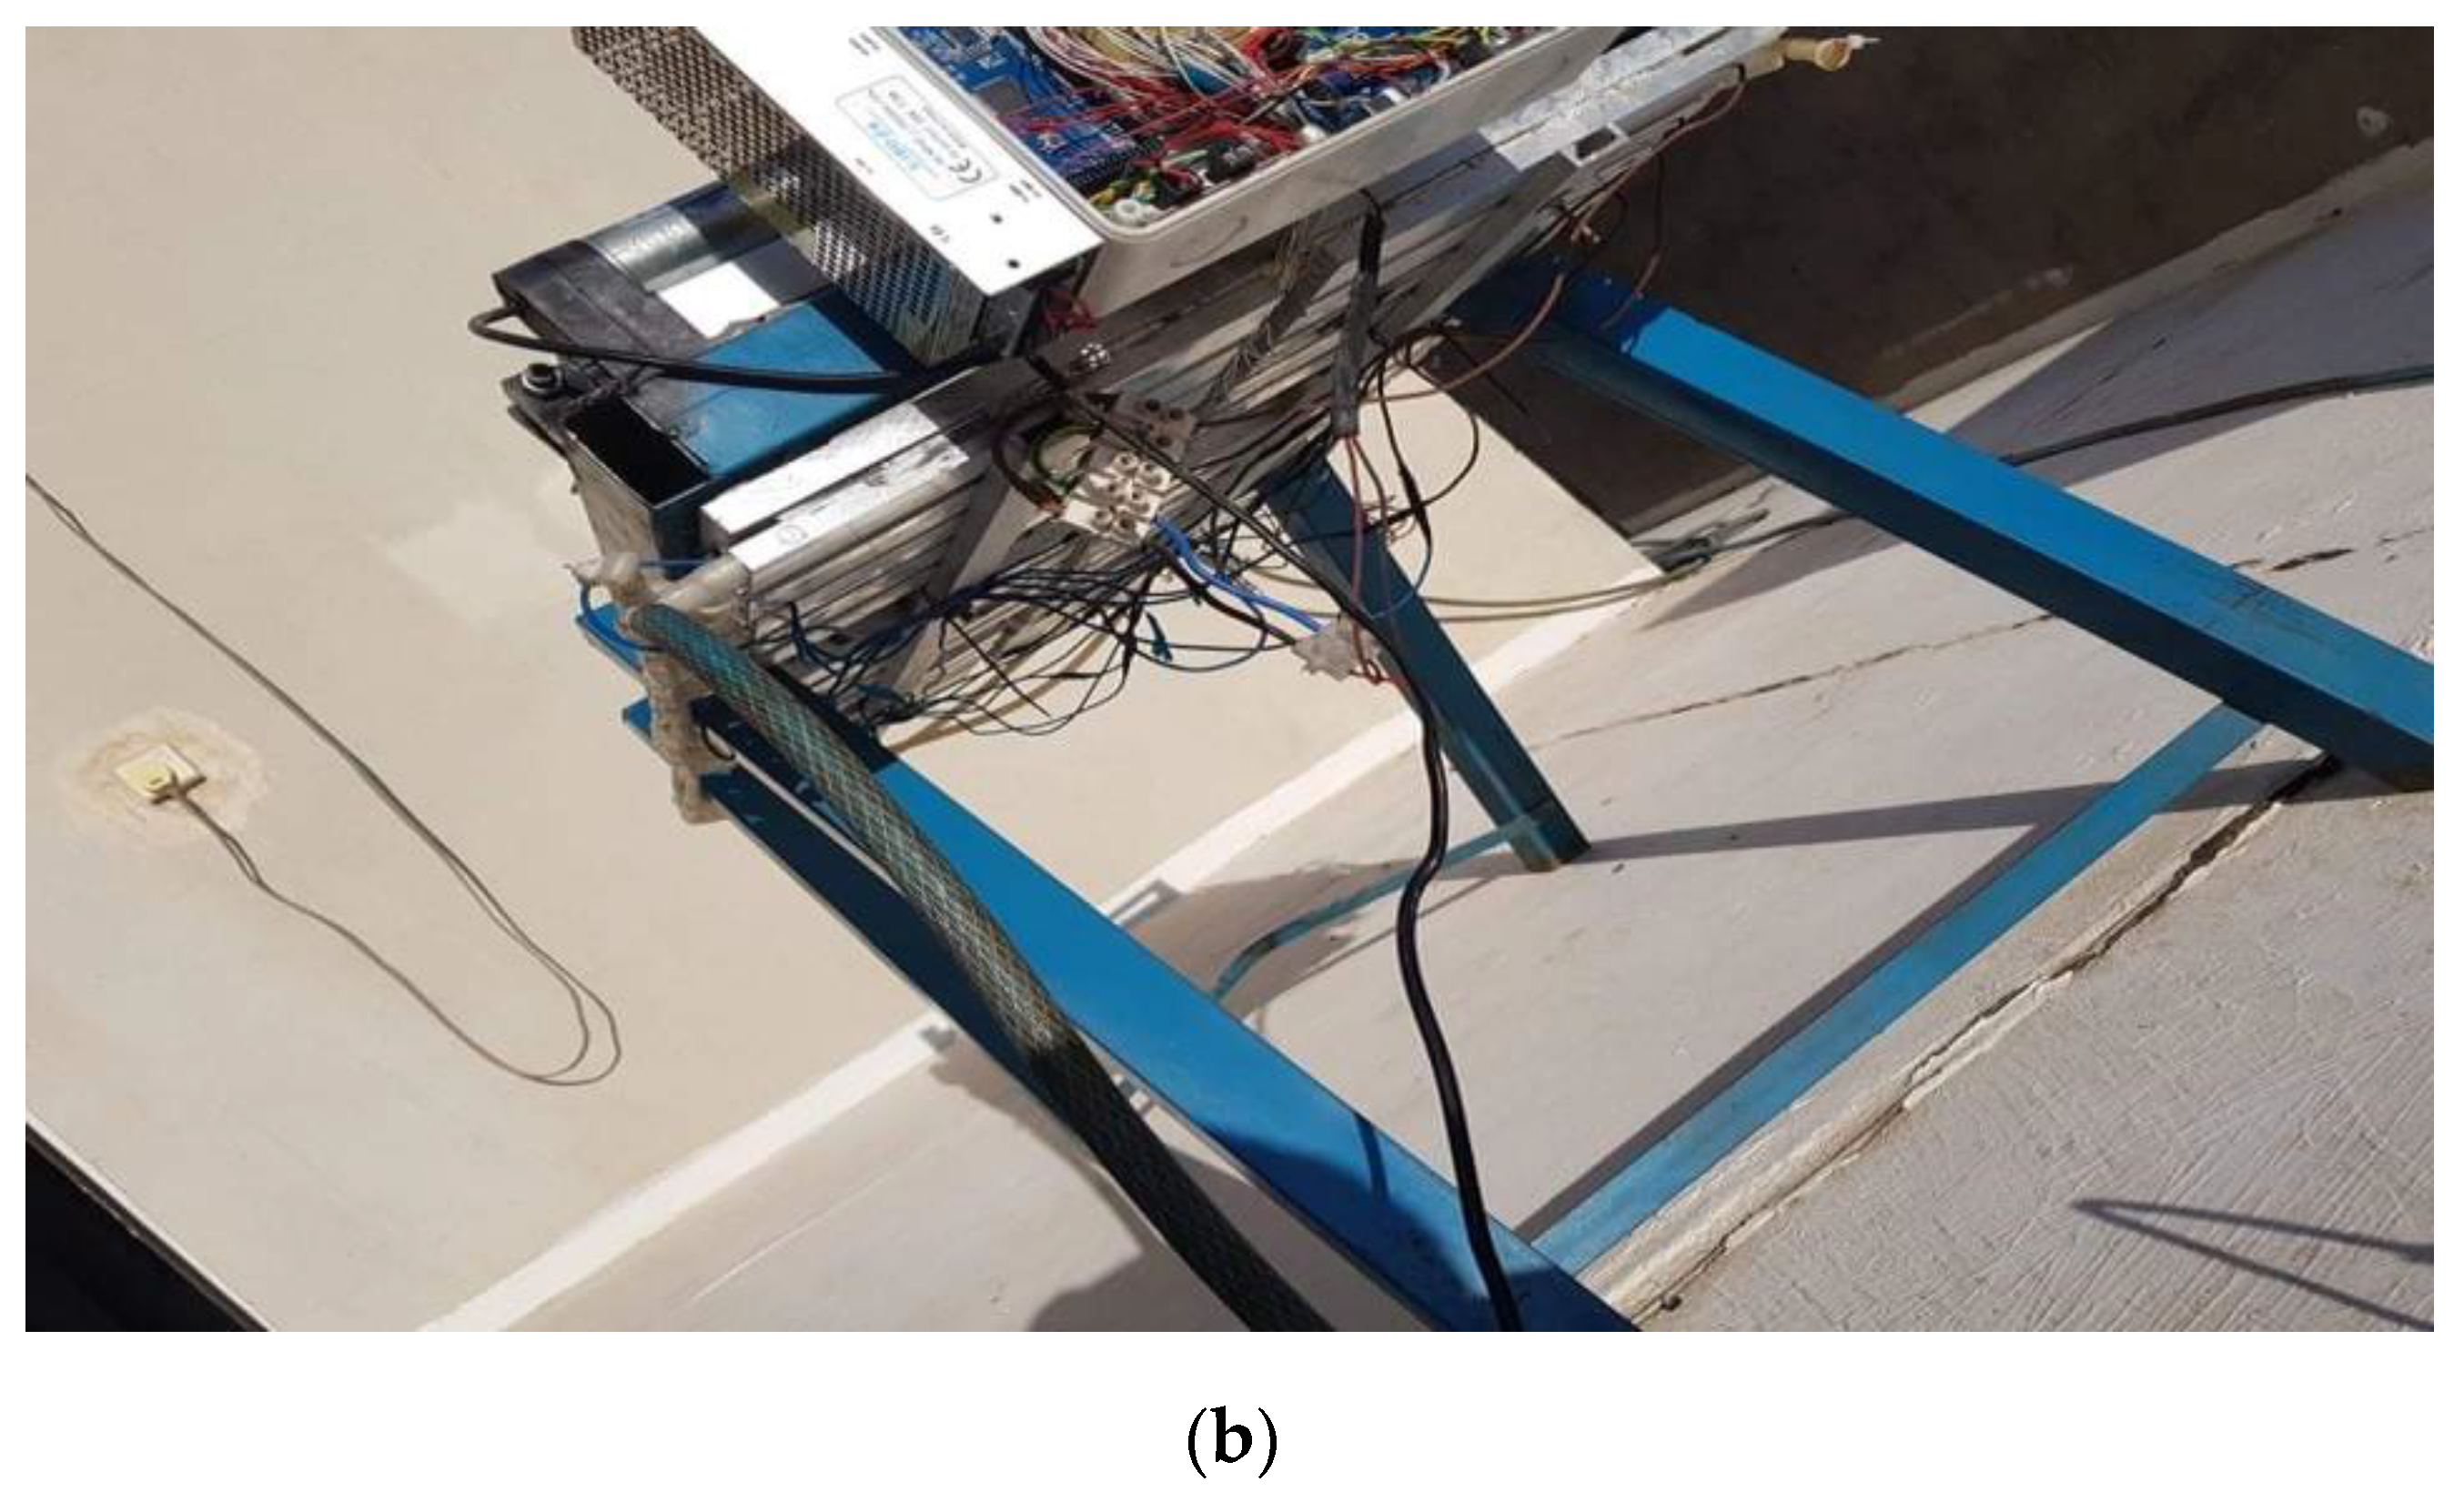
3.2. Applying Solar Radiation to a TEG Panel Directly with No Lens (NL-TEG Panel)
3.3. Data Reduction
4. Analysis of Measurement Errors
5. Results and Discussion
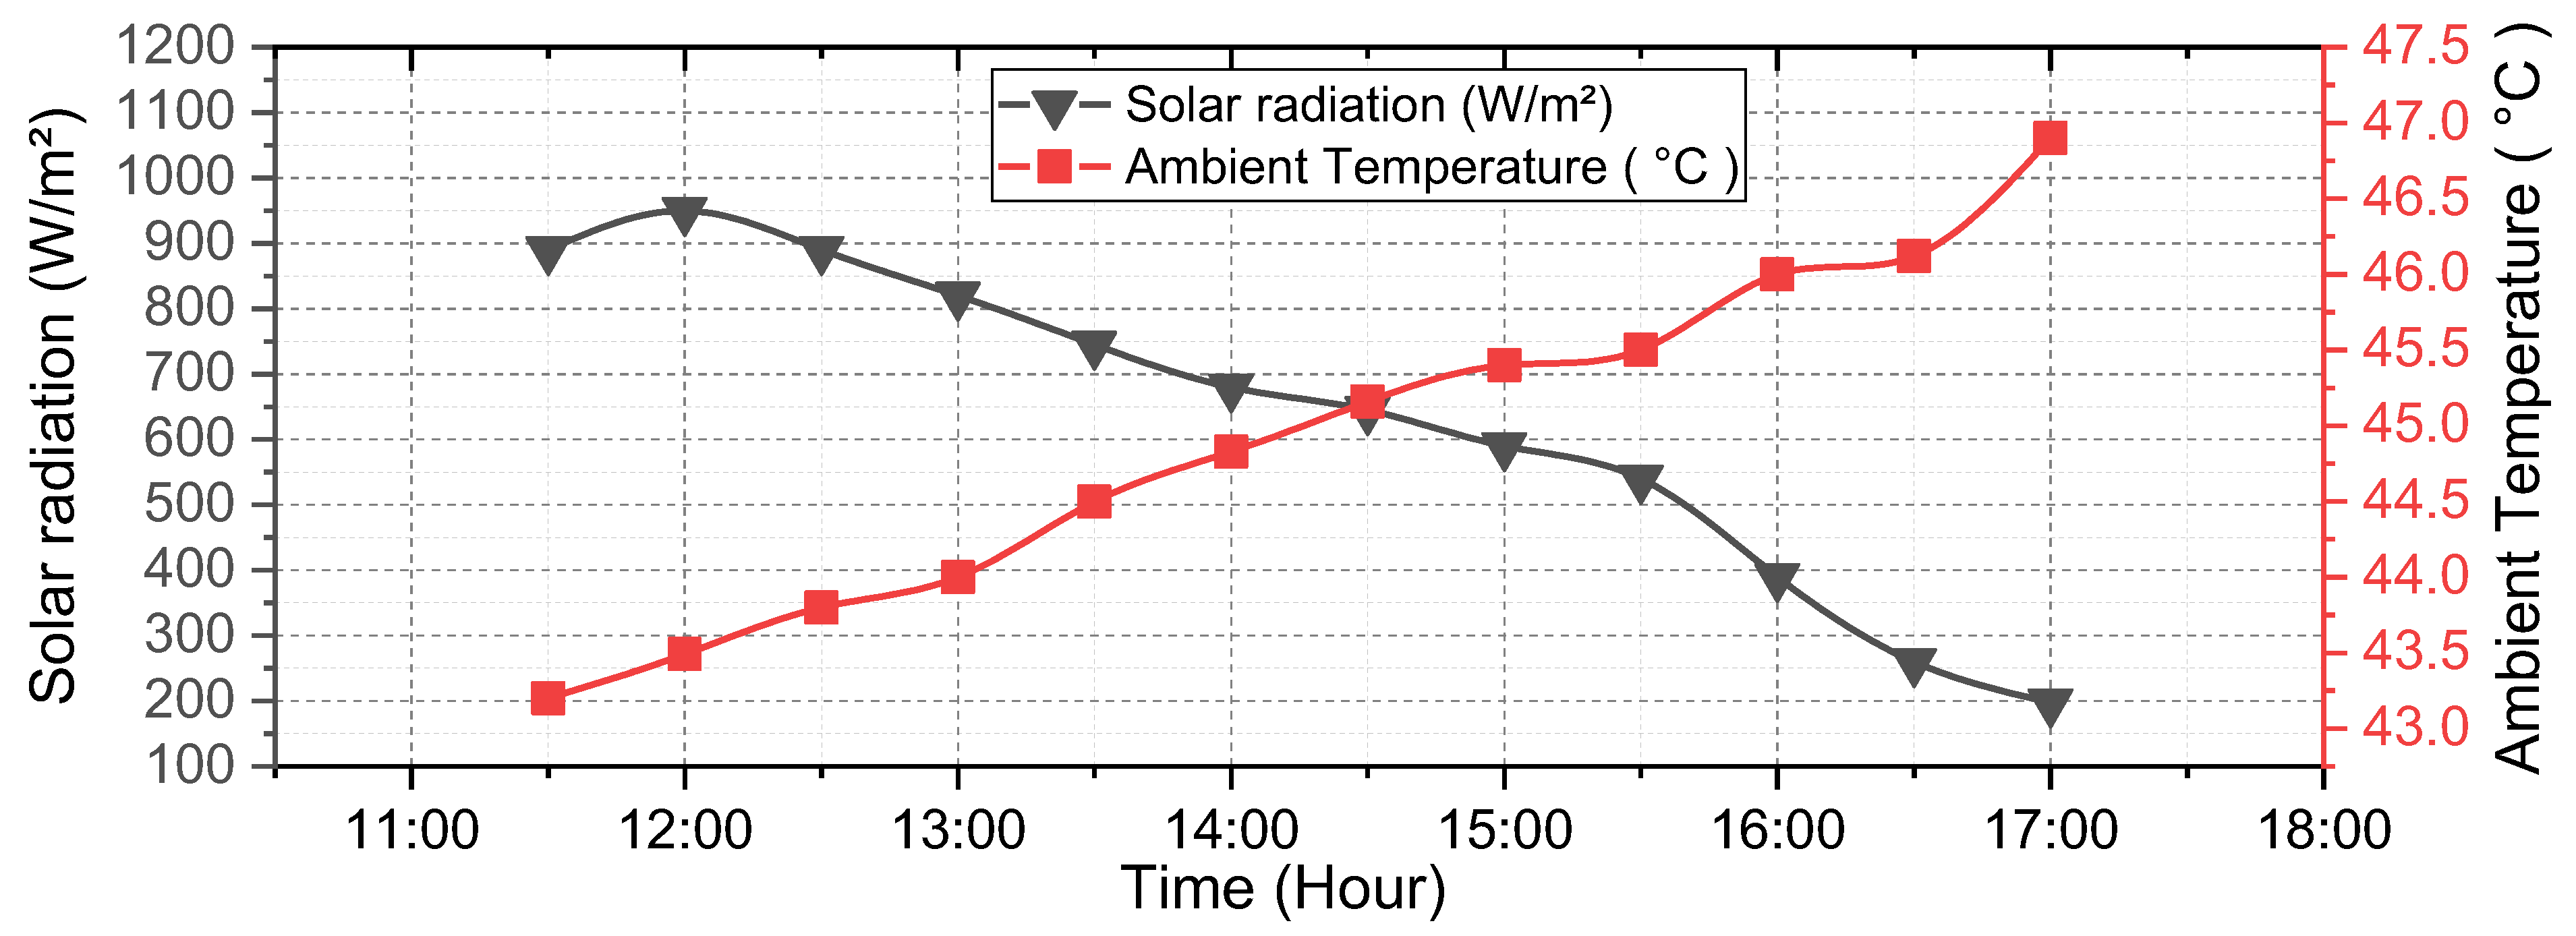
5.1. Weather during the Experiments
5.2. Effect of Fresnel Lens at Different Values on the TEG System
5.3. Electrical Performance of the Module
5.4. Maximum Electrical Efficiency for TEG Related to Thermoelectric Materials
5.5. Economic Analysis and Cost Estimation of System Implementation
6. Conclusions and Future Work
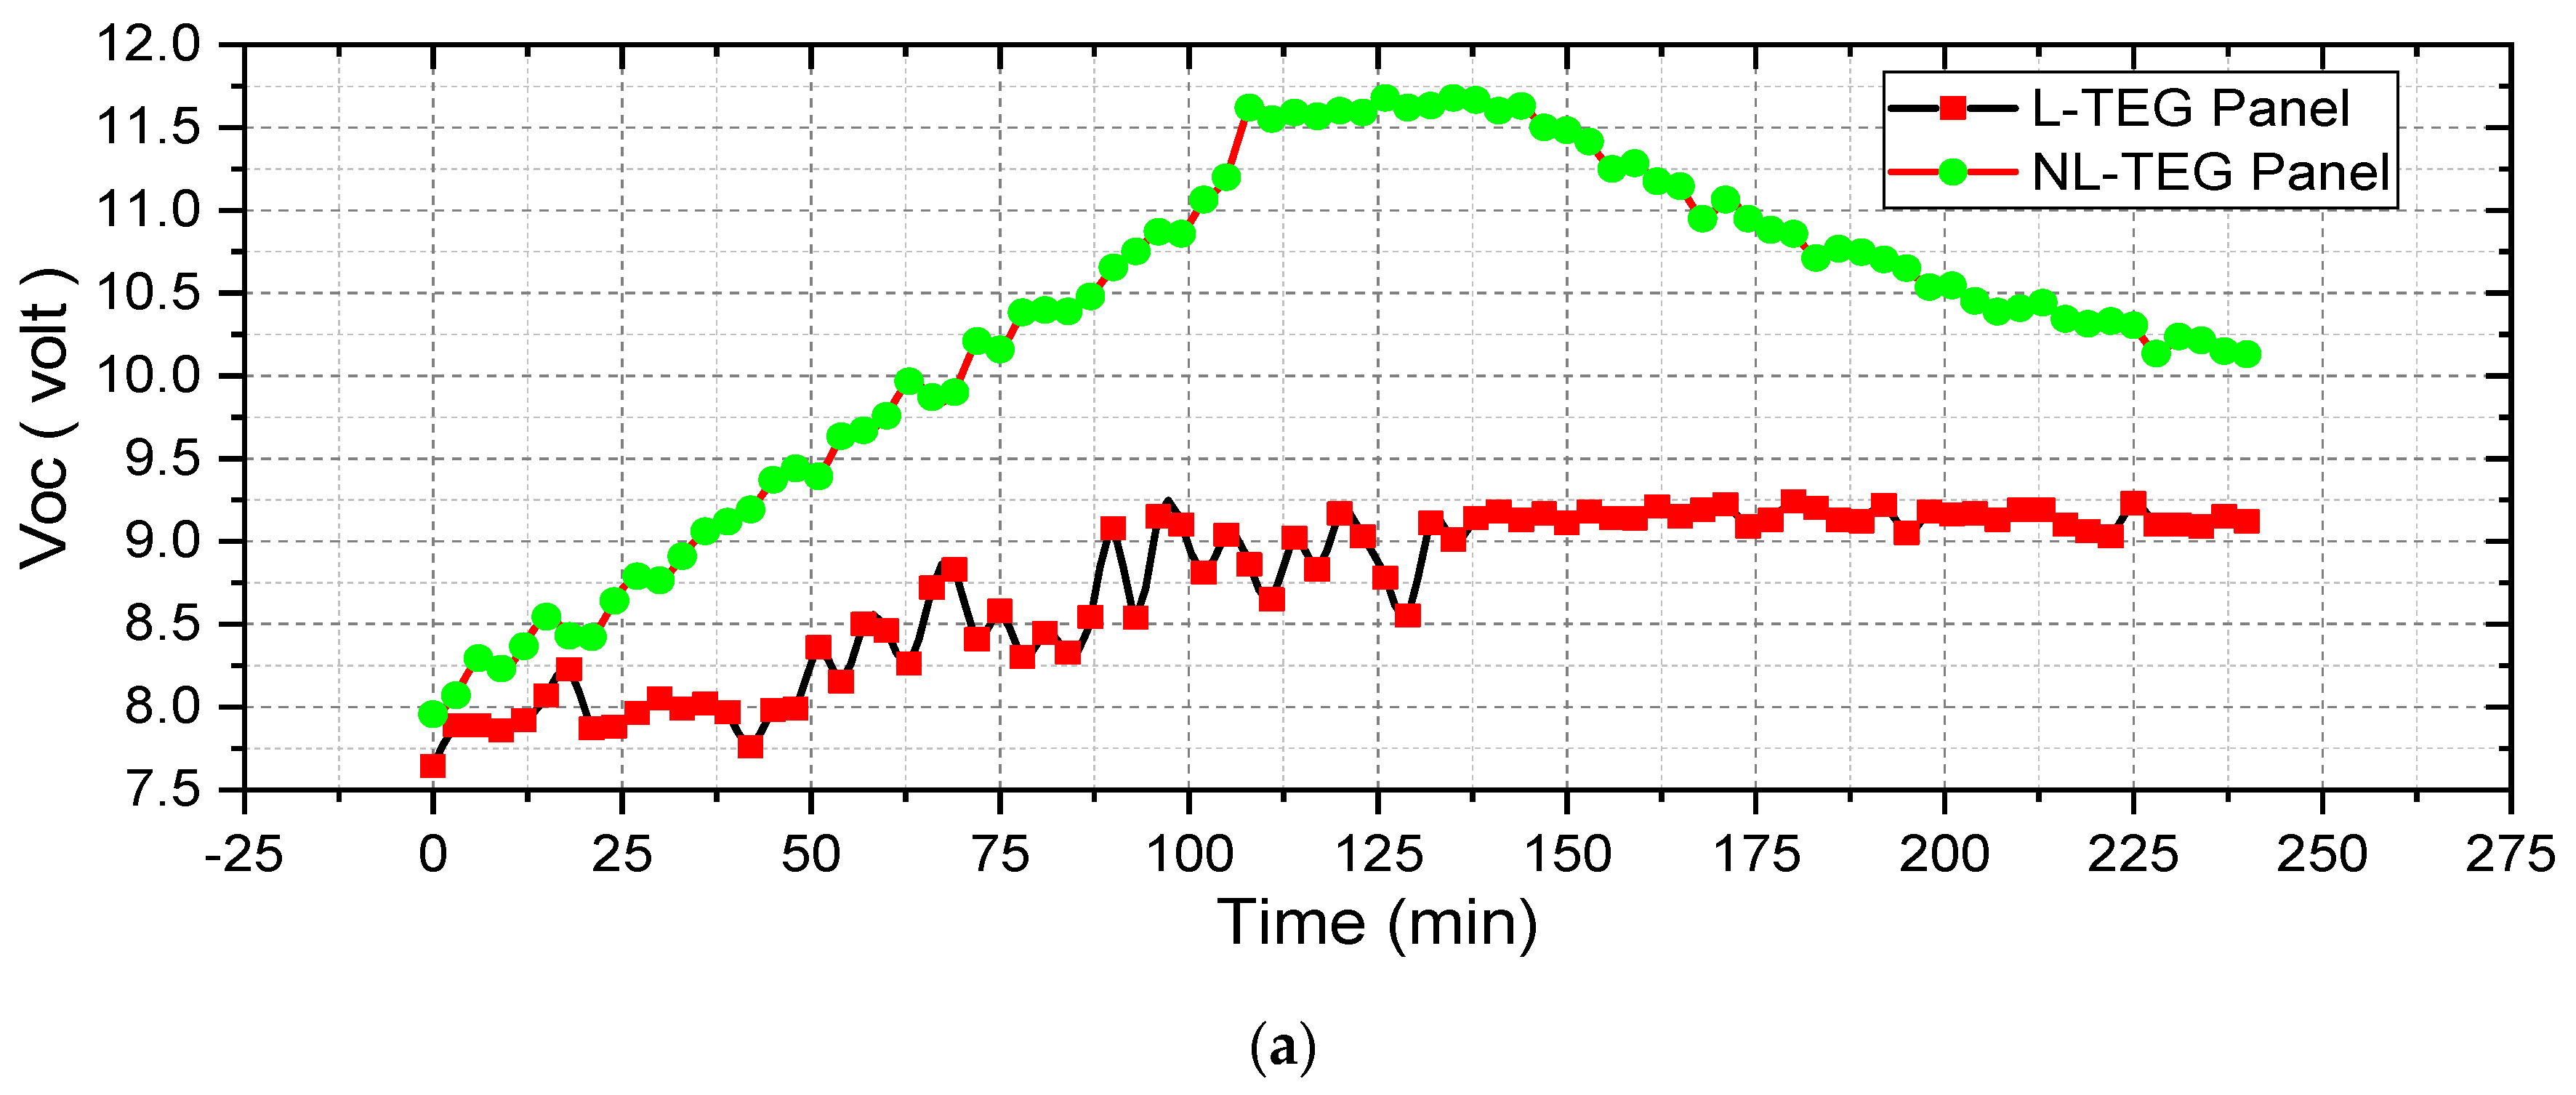
- Throughout a sunny day, even if the solar radiation is decreasing, the ambient temperature is increasing. Normally at 13:00 h., the TEG panel achieves its maximum at both sides, for both systems (NL-TEG) or (L-TEG). This yields a maximum value of terminal voltage for the TEG panel;
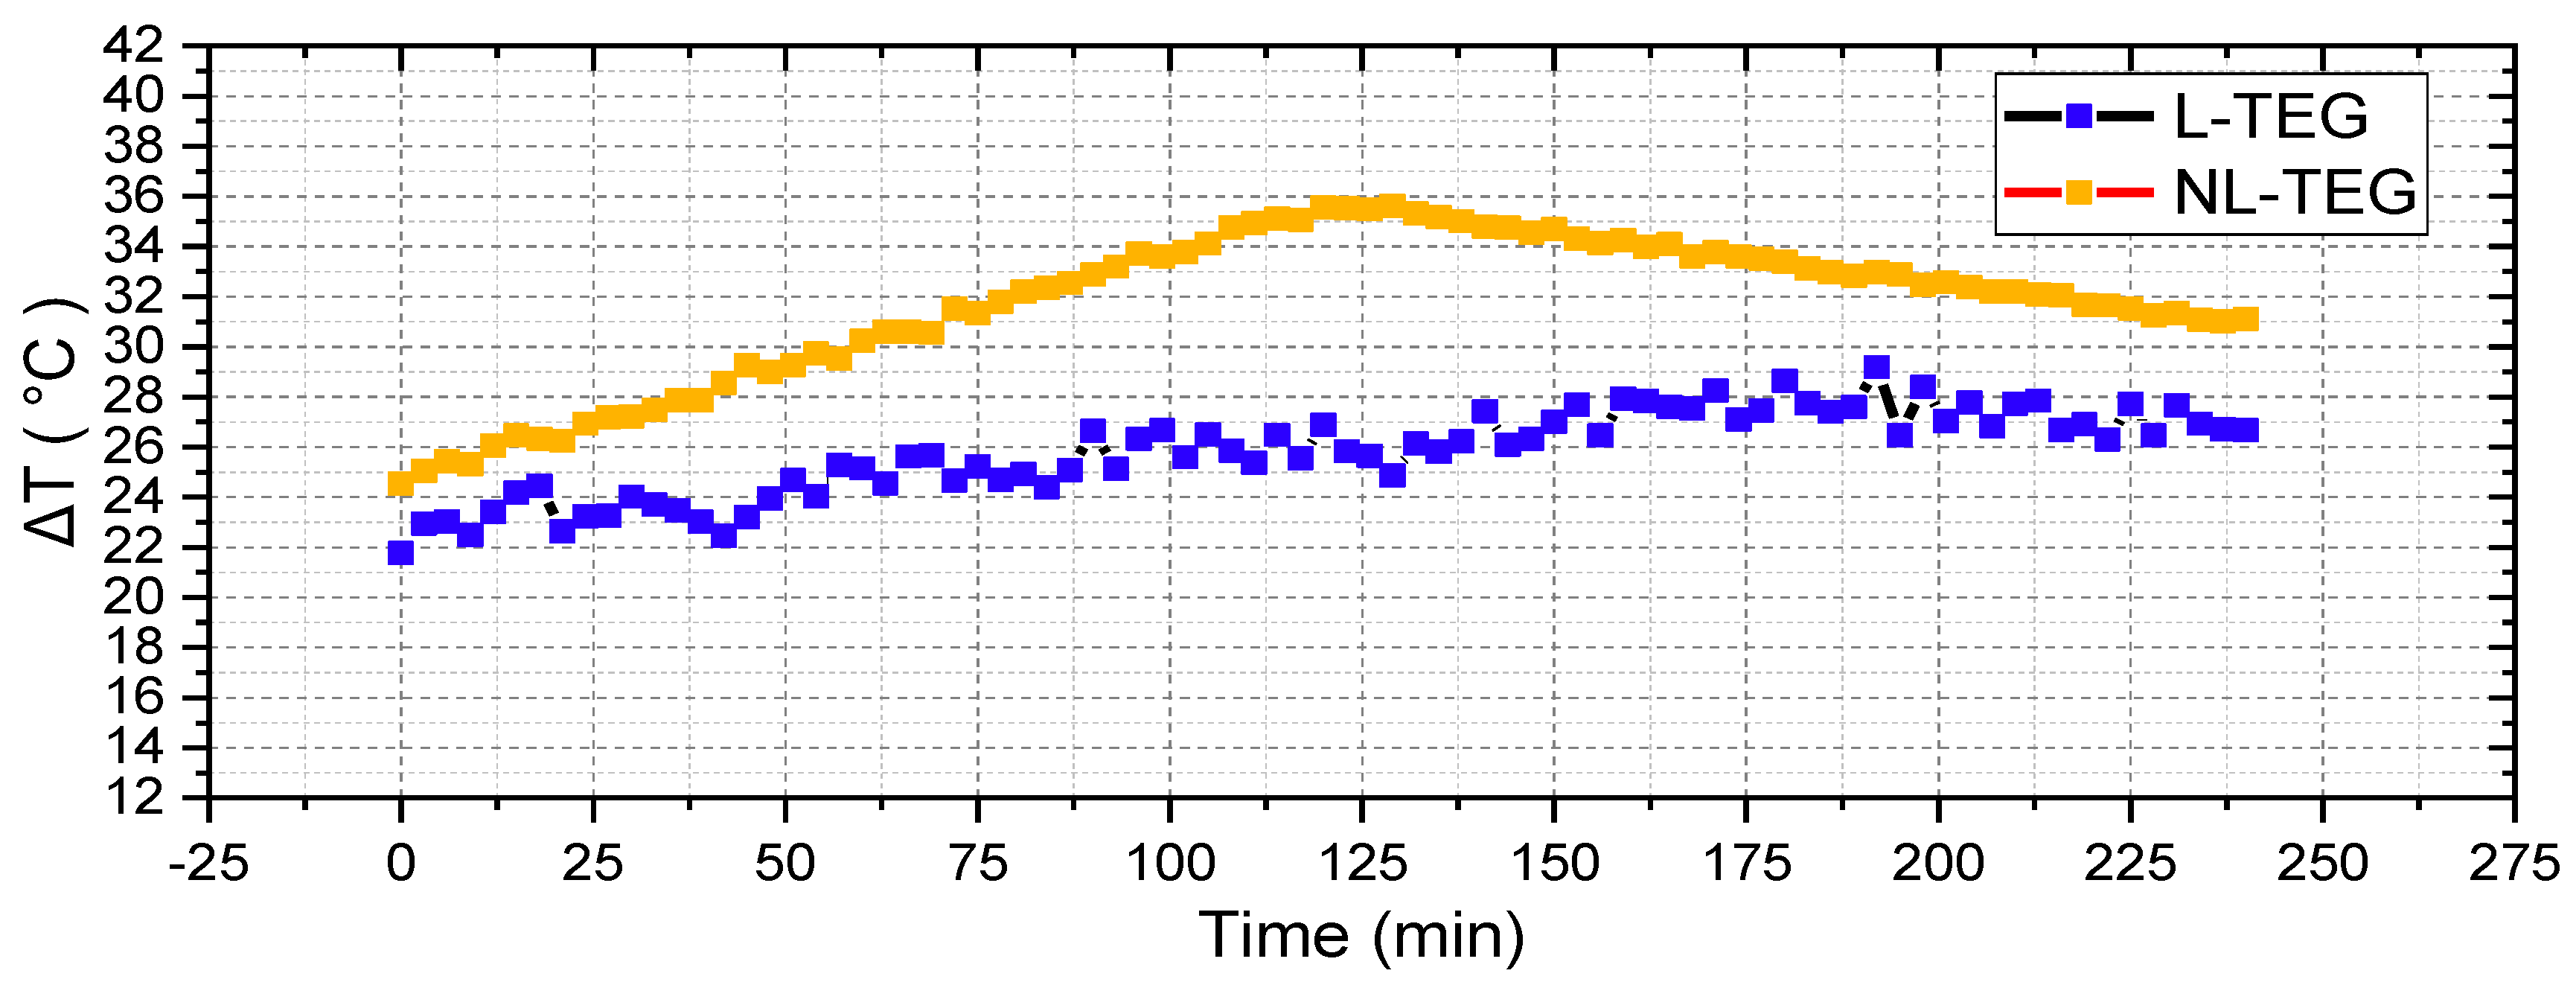
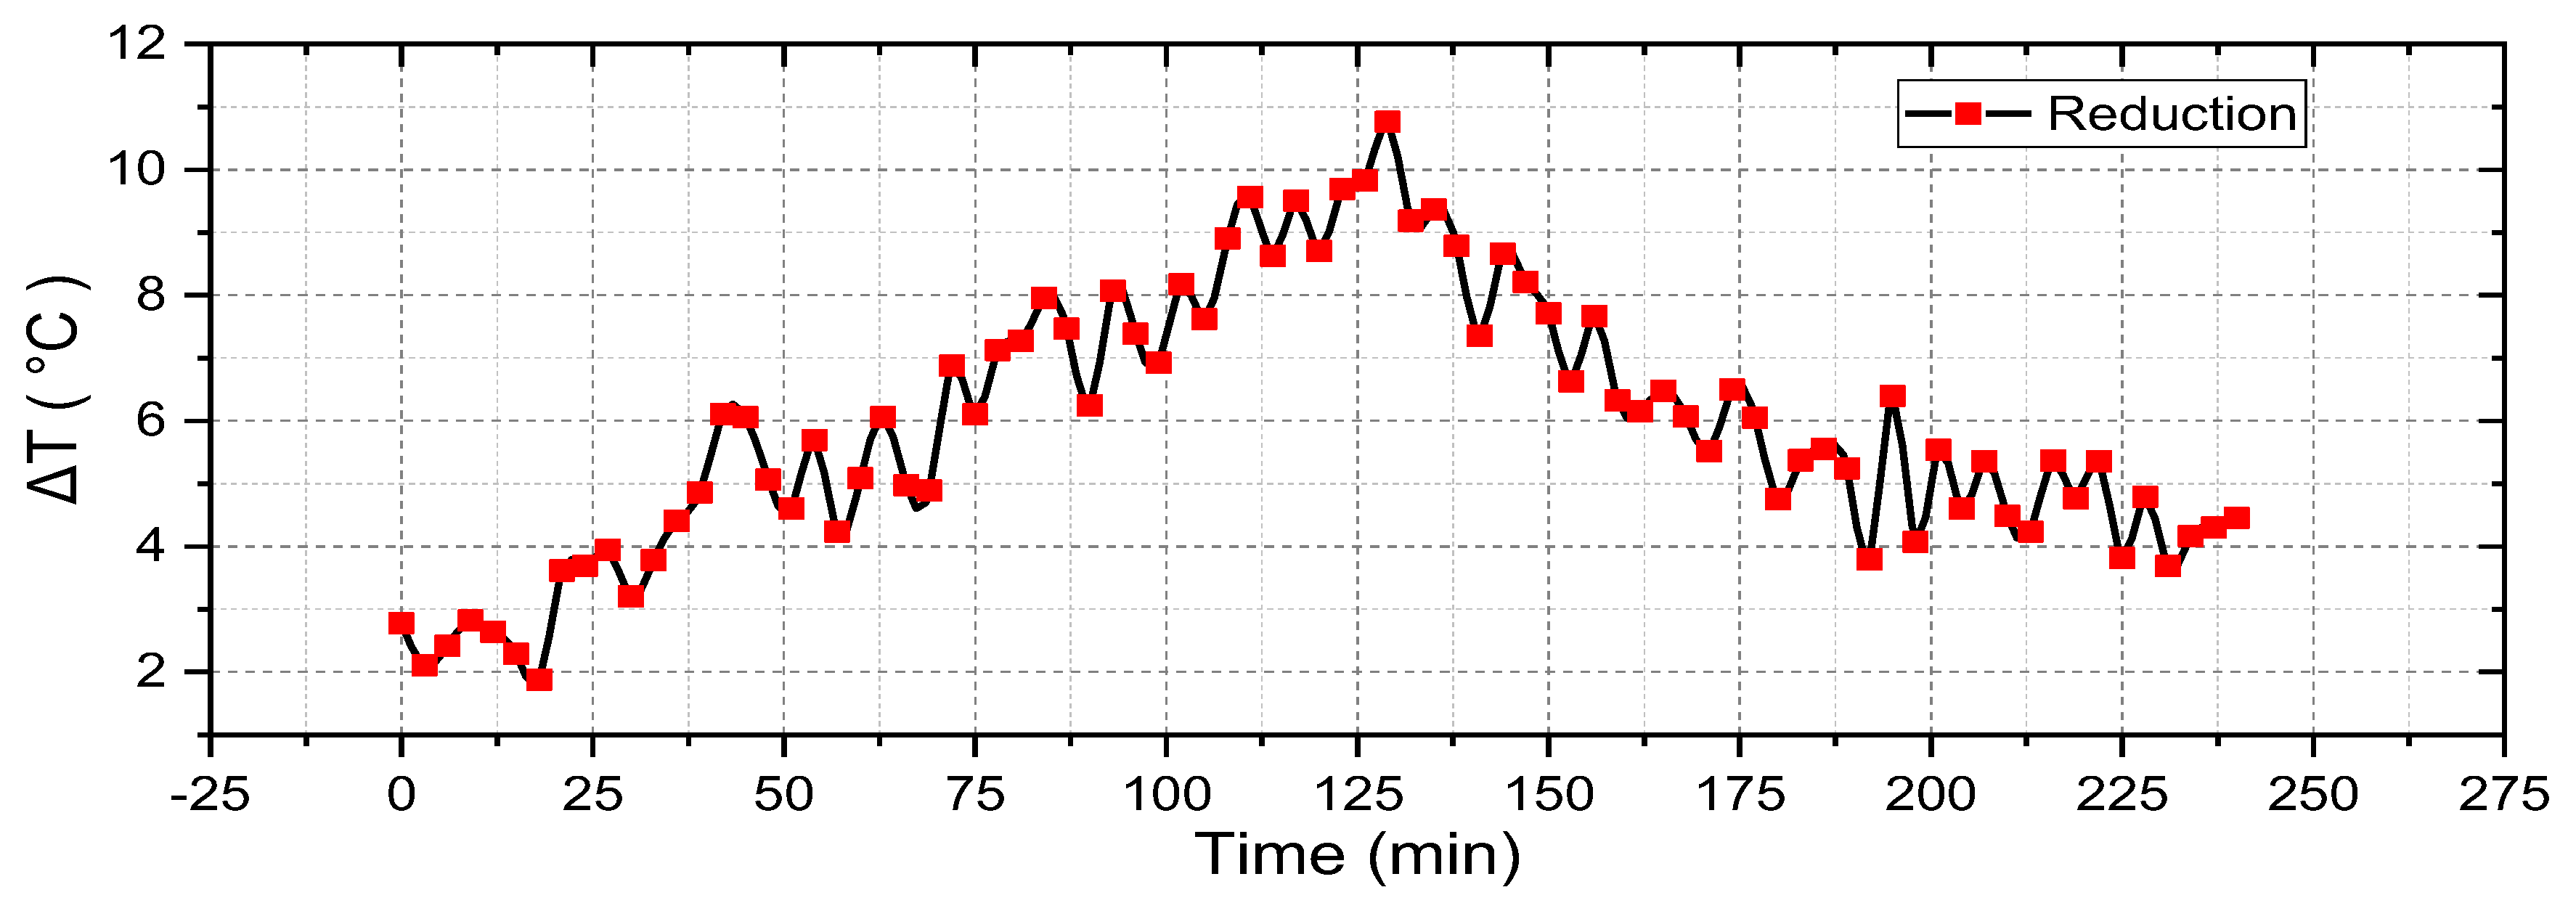
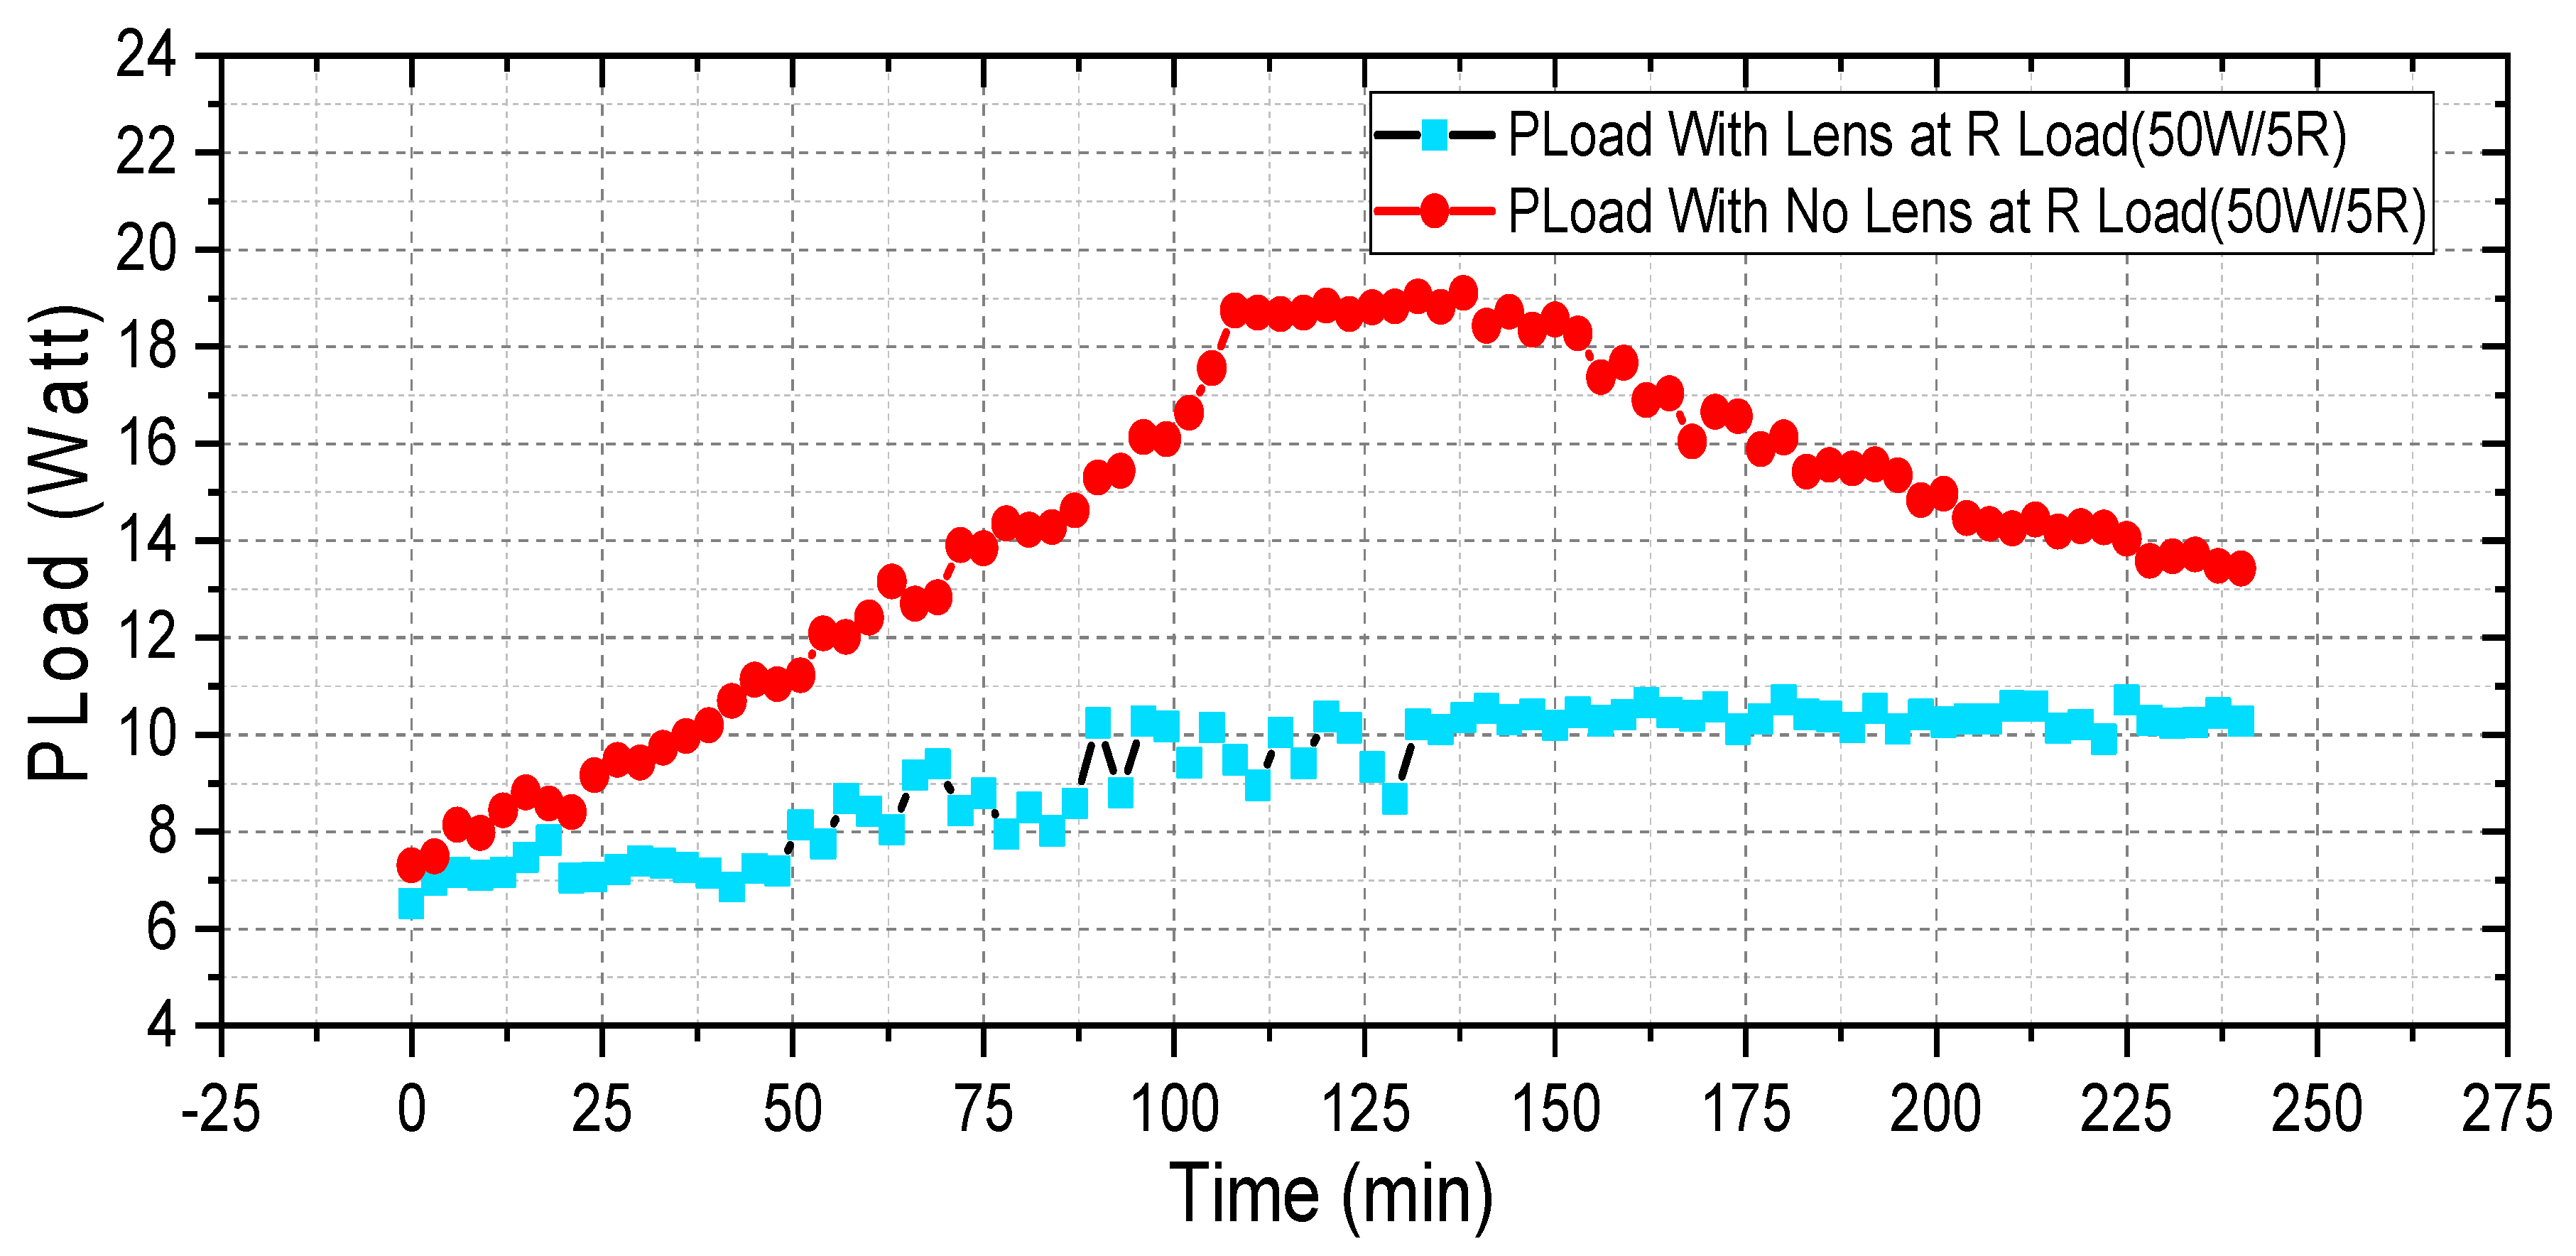
- In an L-TEG system, the change is not uniform since a Fresnel lens focuses solar radiation over a small area. This creates a nonuniform temperature distribution at the hot side of a TEG panel. Thus, the output power of an NL-TEG is 35.52% higher than for an L-TEG;
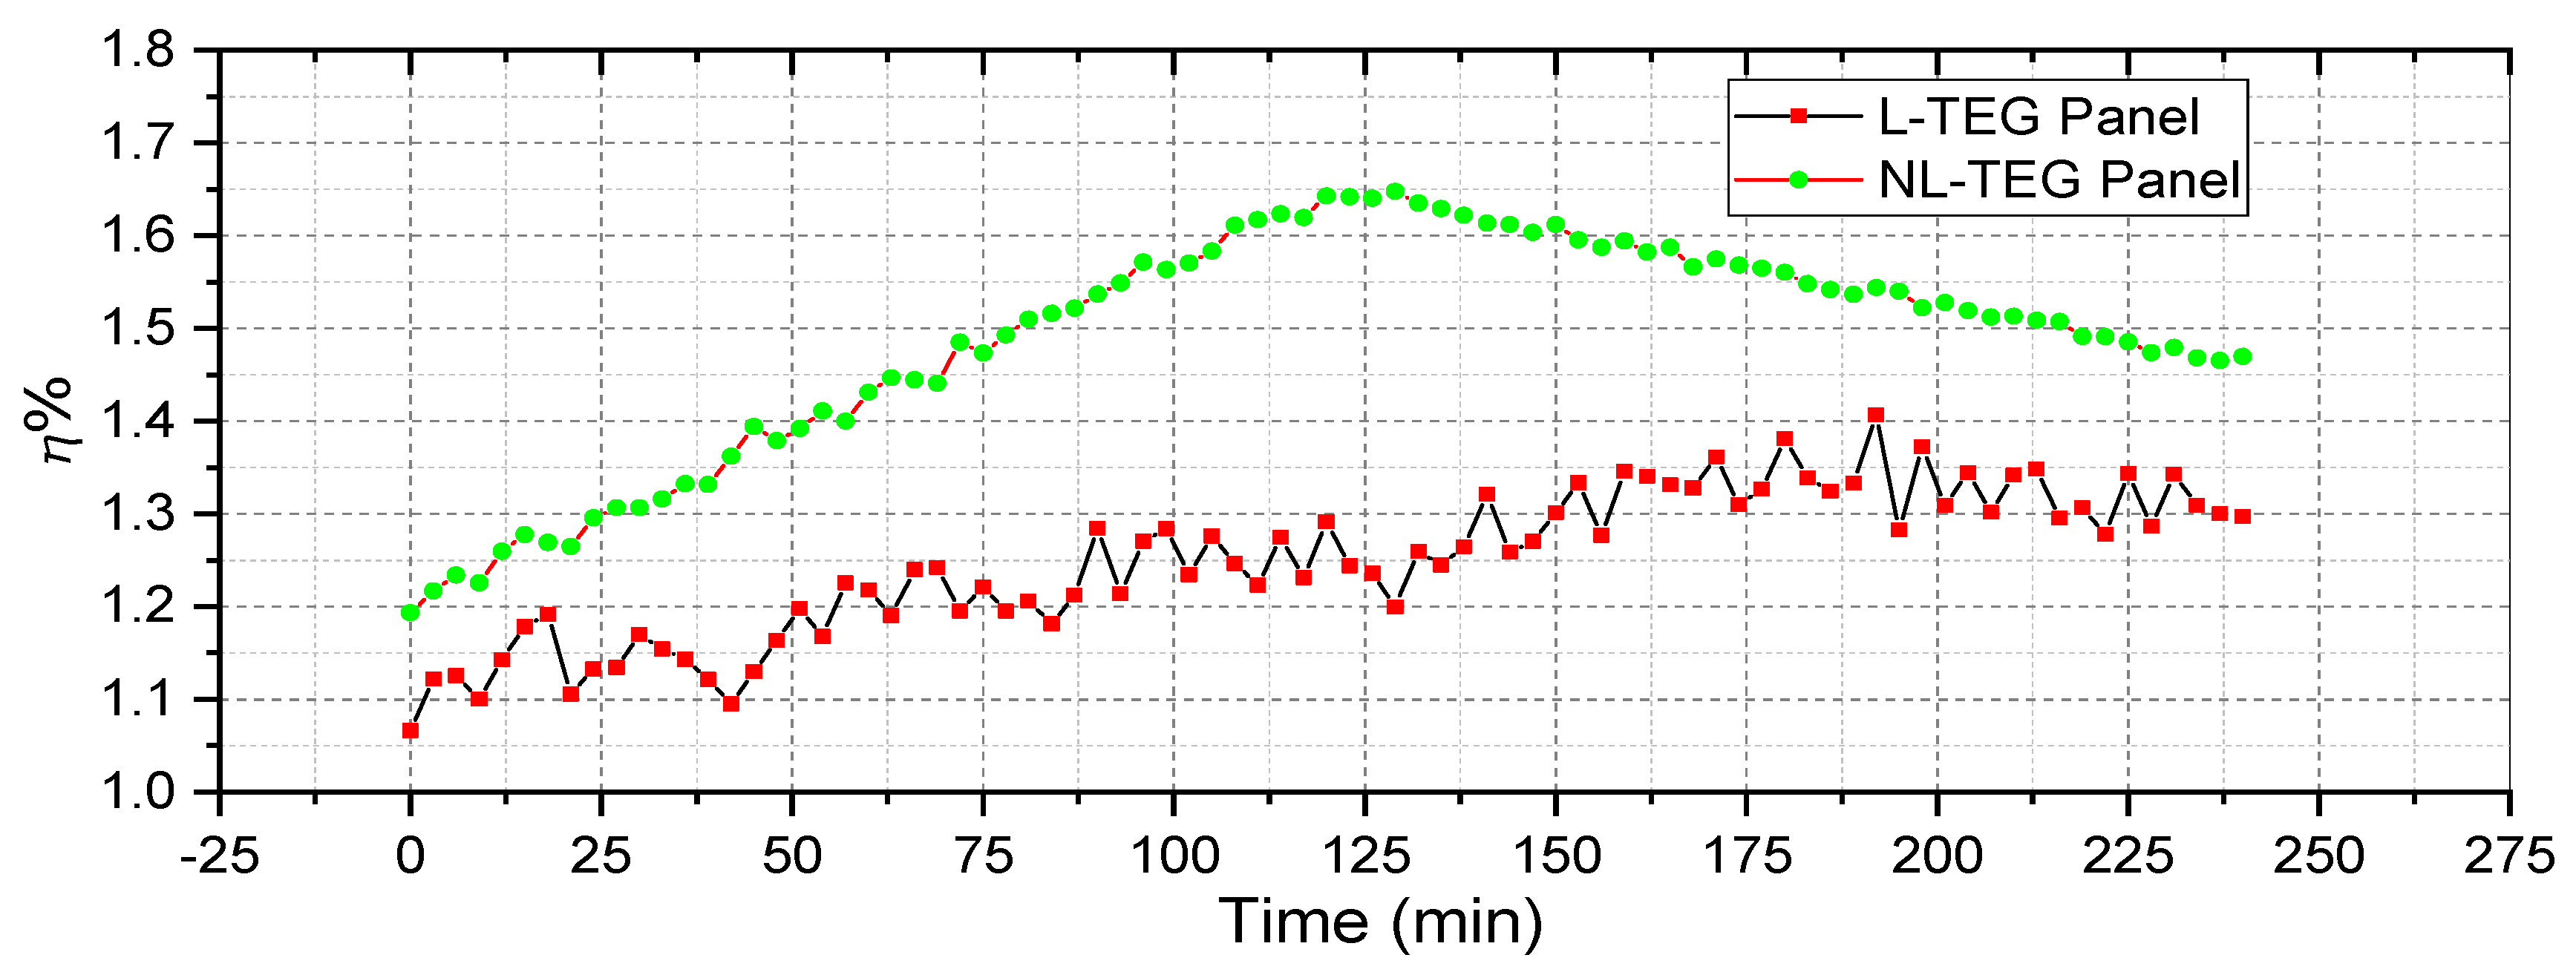
- The efficiency of an NL-TEG system is 16.09% higher than an L-TEG system. This efficiency may be increased by more effective cooling.
Author Contributions
Funding
Data Availability Statement
Acknowledgments
Conflicts of Interest
References
- Parida, B.; Iniyan, S.; Goic, R. A review of solar photovoltaic technologies. Renew. Sustain. Energy Rev. 2011, 15, 1625–1636. [Google Scholar] [CrossRef]
- Luque, A.; Hegedus, S. Handbook of Photovoltaic Science and Engineering, 2nd ed.; Wiley: Chichester, UK, 2011. [Google Scholar]
- Riffat, S.B.; Ma, X.L. Thermoelectrics: A review of present and potential applications. Appl. Therm. Eng. 2003, 23, 913–935. [Google Scholar] [CrossRef]
- Tritt, T.M. Thermoelectric Phenomena, Materials, and Applications. Annu. Rev. Mater. Res. 2011, 41, 433–448. [Google Scholar] [CrossRef]
- Bjork, R.; Sarhadi, A.; Pryds, N.; Lindeburg, N.; Viereck, P. A thermoelectric power generating heat exchanger: Part I—Experimental realization. Energy Convers. Manag. 2016, 119, 473–480. [Google Scholar] [CrossRef] [Green Version]
- Emin, D. Seebeck Effect; Wiley Online Library: Hoboken, NJ, USA, 2014; pp. 1–14. [Google Scholar]
- Qasim, M.A.; Alwan, N.T.; Kumar, S.P.; Velkin, V.I.; Agyekum, E.B. A New Maximum Power Point Tracking Technique for Thermoelectric Generator Modules. Inventions 2021, 6, 88. [Google Scholar] [CrossRef]
- Kossyvakis, D.N.; Voutsinas, G.D.; Hristoforou, E.V. Experimental analysis and performance evaluation of a tandem photovoltaic-thermoelectric hybrid system. Energy Convers. Manag. 2016, 117, 490–500. [Google Scholar] [CrossRef]
- Li, Y.H.; Wu, Z.H.; Xie, H.Q.; Xing, J.J.; Mao, J.H.; Wang, Y.Y.; Li, Z. An experimental investigation of a thermoelectric power generation system with different cold-side heat dissipation. In Proceedings of the 2nd International Conference on New Material and Chemical Industry (NMCI2017), Sanya, China, 18–20 November 2017; IOP Conf. Series; Materials Science and Engineering. 2017; Volume 292, pp. 1–9. [Google Scholar]
- Teffah, K.; Zhang, Y. Modeling and experimental research of hybrid PV-thermoelectric system for high concentrated solar energy conversion. Sol. Energy 2017, 157, 10–19. [Google Scholar] [CrossRef]
- Haiping, C.; Jiguang, H.; Heng, Z.; Kai, L.; Haowen, L.; Shuangyin, L. Experimental investigation of a novel low concentrating photovoltaic/thermal-thermoelectric generator hybrid system. Energy 2018, 166, 83–95. [Google Scholar] [CrossRef]
- Marandi, O.F.; Ameri, M.; Adelshahian, B. The experimental investigation of a hybrid photovoltaic-thermoelectric power generator solar cavity-receiver. Sol. Energy 2018, 161, 38–46. [Google Scholar] [CrossRef]
- Karthick, K.; Suresh, S.; Grashin, C.J.; Dhanuskodi, R. Experimental investigation of solar reversible power generation in Thermoelectric Generator (TEG) using thermal energy storage. Energy Sustain. Dev. 2019, 48, 107–114. [Google Scholar] [CrossRef]
- Wang, J.; Liu, S.; Li, L. Experiments and modeling on thermoelectric power generators used for waste heat recovery from hot water pipes. Energy Procedia 2019, 158, 1052–1058. [Google Scholar] [CrossRef]
- Riahi, A.; Ali, A.B.H.; Fadhel, A.; Guizani, A.; Balghouthi, M. Performance investigation of a concentrating photovoltaic thermal hybrid solar system combined with thermoelectric generators. Energy Convers. Manag. 2020, 205, 1–15. [Google Scholar] [CrossRef]
- Susanto, F.; Salim, A.T.A.; Romandoni, N.; Wahyudi, N.; Indarto, B.; Junaedi, Z.M.A.; Basyar, K.A.; Furqan, J.A.; Putra, G.A.B. Application of Thermoelectric Generator TEG Type Parallel Series Electric Circuit Produces Electricity from Heat Rocket Stove. J. Phys. Conf. Ser. 2021, 1845, 1–8. [Google Scholar] [CrossRef]
- Zoui, M.A.; Bentouba, S.; Stocholm, J.G.; Bourouis, M. A Review on Thermoelectric Generators: Progress and Applications. Energies 2020, 13, 3606. [Google Scholar] [CrossRef]
- Electrical4U. Seebeck Effect and Seebeck Coefficient; Last Updated in 31 August 2020 by Electrical4U. Available online: https://www.electrical4u.com/seebeck-effect-and-seebeck-coefficient/ (accessed on 17 April 2022).
- Qasim, M.A.; Velkin, V.I.; Hassan, A.K. Seebeck Generators and Their Performance in Generating Electricity. J. Oper. Autom. Power Eng. 2022, 10, 200–205. [Google Scholar] [CrossRef]
- Hsu, C.T.; Huang, G.Y.; Chu, H.S.; Yu, B.; Yao, D.J. An effective Seebeck coefficient obtained by experimental results of a thermoelectric generator module. Appl. Energy 2011, 88, 5173–5179. [Google Scholar] [CrossRef]
- Thermoelectric Power Generator TEG Peltier (SP1848-27145). Available online: https://www.amazon.com/SP1848-27145-Thermoelectric-Generator-Temperature-Generation/dp/B07J54H41F (accessed on 17 April 2022).
- Clyxgs Aluminum Water Cooling Block. Available online: https://www.newegg.com/p/2YM-0045-00255 (accessed on 17 April 2022).
- Wu, Y.; Eames, P.; Mallick, T.; Sabry, M. Experimental characterisation of a Fresnel lens photovoltaic concentrating system. Sol. Energy 2012, 86, 430–440. [Google Scholar] [CrossRef] [Green Version]
- Rajkrishna, A. Solar Geyser Using Spot Fresnel Lens. J. Fundam. Renew. Energy Appl. 2016, 6, 1–8. [Google Scholar] [CrossRef] [Green Version]
- National Geospatial-Intelligence Agency; Bethesda, M.D. Handbook of Magnetic Compass Adjustment; Defense Mapping Agency Hydrographic/Topographic Center: Washington, DC, USA, 2004. [Google Scholar]
- Amin, S.; Hanania, J.; Stenhouse, K.; Yyelland, B.; Donev, J. Energy Education—Solar Panel Orientation, 2018. Available online: https://energyeducation.ca/encyclopedia/Solar_panel_orientation (accessed on 17 April 2022).
- Gaurav, K.; Pandey, S.K. Efficiency calculation of thermoelectric generator by extracting waste heat, for practical applications. J. Renew. Sustain. Energy 2017, 7, 1–4. [Google Scholar]
- Yan, Z.; Song, K.; Xu, L.; Tan, X.; Hu, H.; Sun, P.; Liu, G.; Pan, C.; Jiang, J. Effects of interfacial properties on conversion efficiency of Bi2Te3-based segmented thermoelectric devices. Appl. Phys. Lett. 2021, 119, 233902. [Google Scholar] [CrossRef]
- Qian, D.; Ye, Z.; Pan, L.; Zuo, Z.; Yang, D.; Yan, Y. The Mechanical and Thermoelectric Properties of Bi2Te3-Based Alloy Prepared by Constrained Hot Compression Technique. Metals 2021, 11, 1060. [Google Scholar] [CrossRef]
- Memon, S.; Tahir, K.N. Experimental and Analytical Simulation Analyses on the Electrical Performance of Thermoelectric Generator Modules for Direct and Concentrated Quartz-Halogen Heat Harvesting. Energies 2018, 11, 3315. [Google Scholar] [CrossRef] [Green Version]
- Tritt, T.M.; Subramanian, M.A. Thermoelectric materials, phenomena, and applications: A bird’s eye view. MRS Bull. 2006, 31, 188–198. [Google Scholar] [CrossRef] [Green Version]
- Chandrika, V.S.; Karthick, A.; Kumar, N.M.; Kumar, P.M.; Stalin, B.; Ravichandran, M. Experimental analysis of solar concrete collector for residential buildings. Int. J. Green Energy 2021, 18, 615–623. [Google Scholar] [CrossRef]
- Kline, S.J. Describing uncertainty in single sample experiments. Mech. Eng. 1953, 75, 3–8. [Google Scholar]
- Pfeiffelmann, B.; Benim, A.C.; Joos, F. Water-Cooled Thermoelectric Generators for Improved Net Output Power: A Review. Energies 2021, 14, 8329. [Google Scholar] [CrossRef]
- Hendricks, T.J.; Yee, S.; LeBlanc, S. Cost Scaling of a Real-World Exhaust Waste Heat Recovery Thermoelectric Generator: A Deeper Dive. J. Electron. Mater. 2016, 45, 1751–1761. [Google Scholar] [CrossRef]
- Lv, S.; He, W.; Jiang, Q.; Hu, Z.; Liu, X.; Chen, H.; Liu, M. Study of different heat exchange technologies influence on the performance of thermoelectric generators. Energy Convers. Manag. 2008, 156, 167–177. [Google Scholar] [CrossRef]


| Specification | Value |
|---|---|
| Material | Ceramic/bismuth telluride |
| Parametric model | SP1848-27145 |
| Temperature | 150 °C |
| Open-circuit voltage | 4.8 V |
| Color | White |
| Weight | 25 g |
| Size | (4 × 4 × 0.4) cm (Length × Width × Height) |
| Instrument | Range | Accuracy | Uncertainty, % |
|---|---|---|---|
| Digital Temperature Humidity Meter, ℃, RH% | 0.58 | ||
| AC/DC Digital Clamp Meter, V | |||
| 0.40 | |||
| Pro HVAC Anemometer Handheld CFM Meter Wind Speed Meter, m/s | 1.73 | ||
| NTC single-end glass seal thermistor temperature sensor | 0.58 |
| Components | Cost US $ |
|---|---|
| TEG module | 1.70 |
| Aluminum alloy 6063 | 15.00 |
| Water cooling Block (Heat Exchanger) | 1.10 |
| Glass | 2.00 |
| Metal stand | 10.00 |
| Flexible plastic water pipes | 5.00 |
Publisher’s Note: MDPI stays neutral with regard to jurisdictional claims in published maps and institutional affiliations. |
© 2022 by the authors. Licensee MDPI, Basel, Switzerland. This article is an open access article distributed under the terms and conditions of the Creative Commons Attribution (CC BY) license (https://creativecommons.org/licenses/by/4.0/).
Share and Cite
Qasim, M.A.; Velkin, V.I.; Shcheklein, S.E. The Experimental Investigation of a New Panel Design for Thermoelectric Power Generation to Maximize Output Power Using Solar Radiation. Energies 2022, 15, 3124. https://doi.org/10.3390/en15093124
Qasim MA, Velkin VI, Shcheklein SE. The Experimental Investigation of a New Panel Design for Thermoelectric Power Generation to Maximize Output Power Using Solar Radiation. Energies. 2022; 15(9):3124. https://doi.org/10.3390/en15093124
Chicago/Turabian StyleQasim, Mohammed A., Vladimir I. Velkin, and Sergey E. Shcheklein. 2022. "The Experimental Investigation of a New Panel Design for Thermoelectric Power Generation to Maximize Output Power Using Solar Radiation" Energies 15, no. 9: 3124. https://doi.org/10.3390/en15093124
APA StyleQasim, M. A., Velkin, V. I., & Shcheklein, S. E. (2022). The Experimental Investigation of a New Panel Design for Thermoelectric Power Generation to Maximize Output Power Using Solar Radiation. Energies, 15(9), 3124. https://doi.org/10.3390/en15093124