Article

Use of Recurrent Neural Network with Long Short-Term Memory for Seepage Prediction at Tarbela Dam, KP, Pakistan

1
Key Laboratory of Metallogenic Prediction of Nonferrous Metal of the Ministry of Education, School of Geoscience, and Info-Physics, Central South University, Changsha 410083, China
2
Key Laboratory of Non-Ferrous Resources and Geological Hazard Detection, Central South University, Changsha 410083, China
3
Department of Computer Science, Comsat University Islamabad, Abbottabad Campus, Abbottabad 22060, Pakistan
4
Department of Civil Engineering, Islamic International University, Islamabad 44000, Pakistan
5
School of Geoscience, and Info-Physics, Central South University, Changsha 410083, China
6
Department of Geology, Shaheed Benazir Bhutto University, Dir (U), Sheringal 18050, Pakistan
*
Author to whom correspondence should be addressed.
Energies 2022, 15(9), 3123; https://doi.org/10.3390/en15093123
Submission received: 4 March 2022 / Revised: 13 April 2022 / Accepted: 23 April 2022 / Published: 25 April 2022

Abstract

:
Estimating the quantity of seepage through the foundation and body of a dam using proper health and safety monitoring is critical to the effective management of disaster risk in a reservoir downstream of the dam. In this study, a deep learning model was constructed to predict the extent of seepage through Pakistan’s Tarbela dam, the world’s second largest clay and rock dam. The dataset included hydro-climatological, geophysical, and engineering characteristics for peak-to-peak water inflows into the dam from 2014 to 2020. In addition, the data are time series, recurring neural networks (RNN), and long short-term memory (LSTM) as time series algorithms. The RNN–LSTM model has an average mean square error of 0.12, and a model performance of 0.9451, with minimal losses and high accuracy, resulting in the best-predicted dam seepage result. Damage was projected using a deep learning system that addressed the limitations of the model, the difficulties of calculating human activity schedules, and the need for a different set of input data to make good predictions.

1. Introduction

The emerging artificial intelligence technology in hydrological science has improved the scientific problem in the last decades; mathematical models and computers are basic instruments for scientists, engineers, and planners involved in water resources and hydrological operations. Artificial intelligence models are now used in river water outflow, dam water inflow, and dam seepage problems. Global warming and climate change have increased the complexity of the hydrological cycle, resulting in greater unpredictability in water reservoirs all across the world [1]. The increase in Asia’s population will have an immediate impact on water, food, and energy. Global warming, climate changes, rise in population, floods, and droughts have a direct effect on the water resources management system. A key water resource management structure is the dam, which has multiple purposes, including direction for the stability of irrigation system, power generation, and water distribution for communities’ developments. In the northern region of Pakistan, glacier melting and rainfall concentration increases in summer, which affects the stability and safety of the world’s 2nd largest earth and rockfill dam (Tarbela) downstream, in terms of an increase in the seepage problem. Seepage is the slow percolation of the water from the body of the dam or foundation that affects the soil properties, and threatens the stability and safety of the dam. The 30–40% of dam failure caused by seepage is highlighted in the earth-fill dam. Controlled seepage is good for the health of the dam, but uncontrolled seepage may cause dam failure, which affects the local communities and economies [2]. For this purpose, there is a need for a method that can effectively predict the amount of seepage from a multi-purpose dam, using artificial intelligence. The scarcity of water resources is a prominent issue restricting human development, but artificial intelligent plays an important role in managing this problem in the near future [3].
Artificial intelligence (AI) is a rapidly expanding field that uses soft computing approaches to simulate seepage phenomena, and detect or predict trends of seepage if they exist. Since 1980, the artificial neural network (ANN) has been a hotspot of study across many fields [4]. Many researchers have used various approaches for dam seepage modeling in artificial intelligence, machine learning, and deep learning, such as artificial neural network (ANN), logistic regression (LR), multiple linear regression (MLR), support vector machine (SVM), adaptive neuro-fuzzy inference system (ANFIS), and the Gaussian process (GP) model [5,6,7,8,9]. The BPNN–GA dam seepage prediction model was developed by Zhang et al. [10], who used a genetic algorithm (GA) to optimize the weights and thresholds of a backpropagation neural network (BPNN). According to Rehamnia et al. [11], the daily seepage flow of an embankment dam in Algeria was computed using an extended Kalman filter, in conjunction with a feed-forward artificial neural network that included MLP. Traditional machine learning methods interpret natural raw data without needing any changes to internal data [12]. Deep learning, used for time series data, sparked a lot of interest in hydrological time series forecasting interpretation in recent years [13]. For early prediction, hydrological issues are modeled using time series datasets [14]. Salmasi and Nouri [15], for example, investigate the influence of seepage on an upstream semi-impervious blanket with the hydraulic condition, by calculating the permeability coefficient, thickness, and length using a numerical model. The findings show that installing an impermeable covering at the right length and thickness upstream of an earthen dam decreases seepage, and improves dam stability. The superposition of reservoir water level and rainfall is thought to be the primary cause of dam body seepage. According to Xu et al. [16], the seepage volume and reservoir water level are positively and significantly connected. It is difficult to forecast how a dam’s seepage will develop since it is usually complex and unpredictable. The influence of several factors on the reservoir’s water level may be used to predict seepage levels [17].
Deep learning is a type of learning algorithm that uses a large number of layers and a large number of learning parameters to model nonlinear data and predict time series issues accurately for water resources problems. For time series data, such as hydrological prediction, RNNs are a particularly well-suited neural network architecture [18,19]. The literature shows a limited amount of research conducted on large time series data in dam seepage problems. Apaydin et al. [20] use RNN to predict water inflow in the Ermenek dam reservoir in Turkey, using daily observation flow data from 2012 to 2018. RNN outperforms ANN in terms of accuracy, with 90% in training and 87% in testing, and 86% in training and 87% in testing, respectively. Similarly, using 15-year dam inflow and meteorological data, Lee and Kim [21] use a combined sequence-by-sequence machine learning (ML) and bidirectional LSTM technique to accurately anticipate the two-day influx rate at the Soyang River dam in South Korea. For dam seepage prediction, no evidence has been found for using a combination of RNN and LSTM. On the other hand, RNN and LSTM are preferable solutions for dam seepage prediction when the data are time series.
The most significant research on the time series dataset of two dams was conducted by Apaydin, Feizi, Sattari, Colak, Shamshirband, and Chau [20]. To evaluate water inflow time series data from 2012 to 2018 at the Earmark hydroelectric dam in Turkey, Ouled, Sghaier, et al. [22] use deep learning model recurrent neural network architecture, including simple RNN, LSTM, Bi-LSTM, and GRU. The study’s major purpose was compare and assess model correctness. As a geoscientist, seepage is a key concern for dam safety and stability. The dam operation monitoring section forecasts seepage using dam vernier gauge data from seepage galleries in a dam. Our technical solution to the dam seepage issue differs from the one described above. It focused on enhancing hydropower’s electric efficiency, rather than that of a thermal power plant, which has an environmental impact. For this, they used water inflow data. In contrast, we used 49 variables of observable information data for dam seepage prediction, using deep learning to concentrate on the structural safety and stability of dams. Lee and Kim [21] look into the water input at the Soyang dam in South Korea, which is affected by global warming and climate change. The study looks at the impact of water influx on future floods, droughts, and power outages in the Seoul metropolitan area. To estimate the inflow rate, they use a sequence-to-sequence mechanism combined with a bidirectional long short-term memory (LSTM), using a 15-year time series dataset. Their primary focus is on accuracy and forecasting for the next two days. While these two authors employ water input for power production and global climate change, our research focuses on dam seepage issues, structural stability and safety triggered by global climatic changes, and future planning improvements for dam seepage concerns.
To address this issue, water resource management authorities must construct dam infrastructure that allows water to be stored for a long period. Dam infrastructure is connected to socio-economic development, which is impacted by global warming and climate change. There have been almost 1600 dam collapses described in the literature, with earth-fill dams accounting for 1065 of them. Earth-fill dam collapse may result in overtopping, leaking, and seepage from the foundation and body of the dam [23]. The problem of seepage in earth-fill dams affects 30–40% of all instances [24]. Soil properties and climatic elements such as soil permeability, soil compaction, temperature, precipitation, and evaporation, among others, influence the point of seepage failure. Dam officials monitor daily observations to prevent the possibility of seepage failure, since seepage failure has a direct impact on dam stability and safety [25]. The observation is a time series dataset, combined with artificial intelligence and deep learning, to forecast dam seepage and provide a mechanism to deal with the possibility of disaster before it happens. In observations in the above discussed literature, it is concluded that there is a research gap for seepage problems with respect to RNN and LSTM. There is no use of the RNN and LSTM combined algorithms to monitor the dam seepage.
RNN–LSTM deep learning is used to evaluate the model’s accuracy and performance in predicting seepage from a dam. This study is divided into four sections: (1) Emphasize the importance of artificial intelligence and deep learning in solving the seepage from the earth-fill dam, (2) Discuss the use of RNN–LSTM for time series prediction to address the problem, (3) Exhibit data preparation and experiment outcomes, and (4) Discuss the study’s findings.

2. Materials and Methods

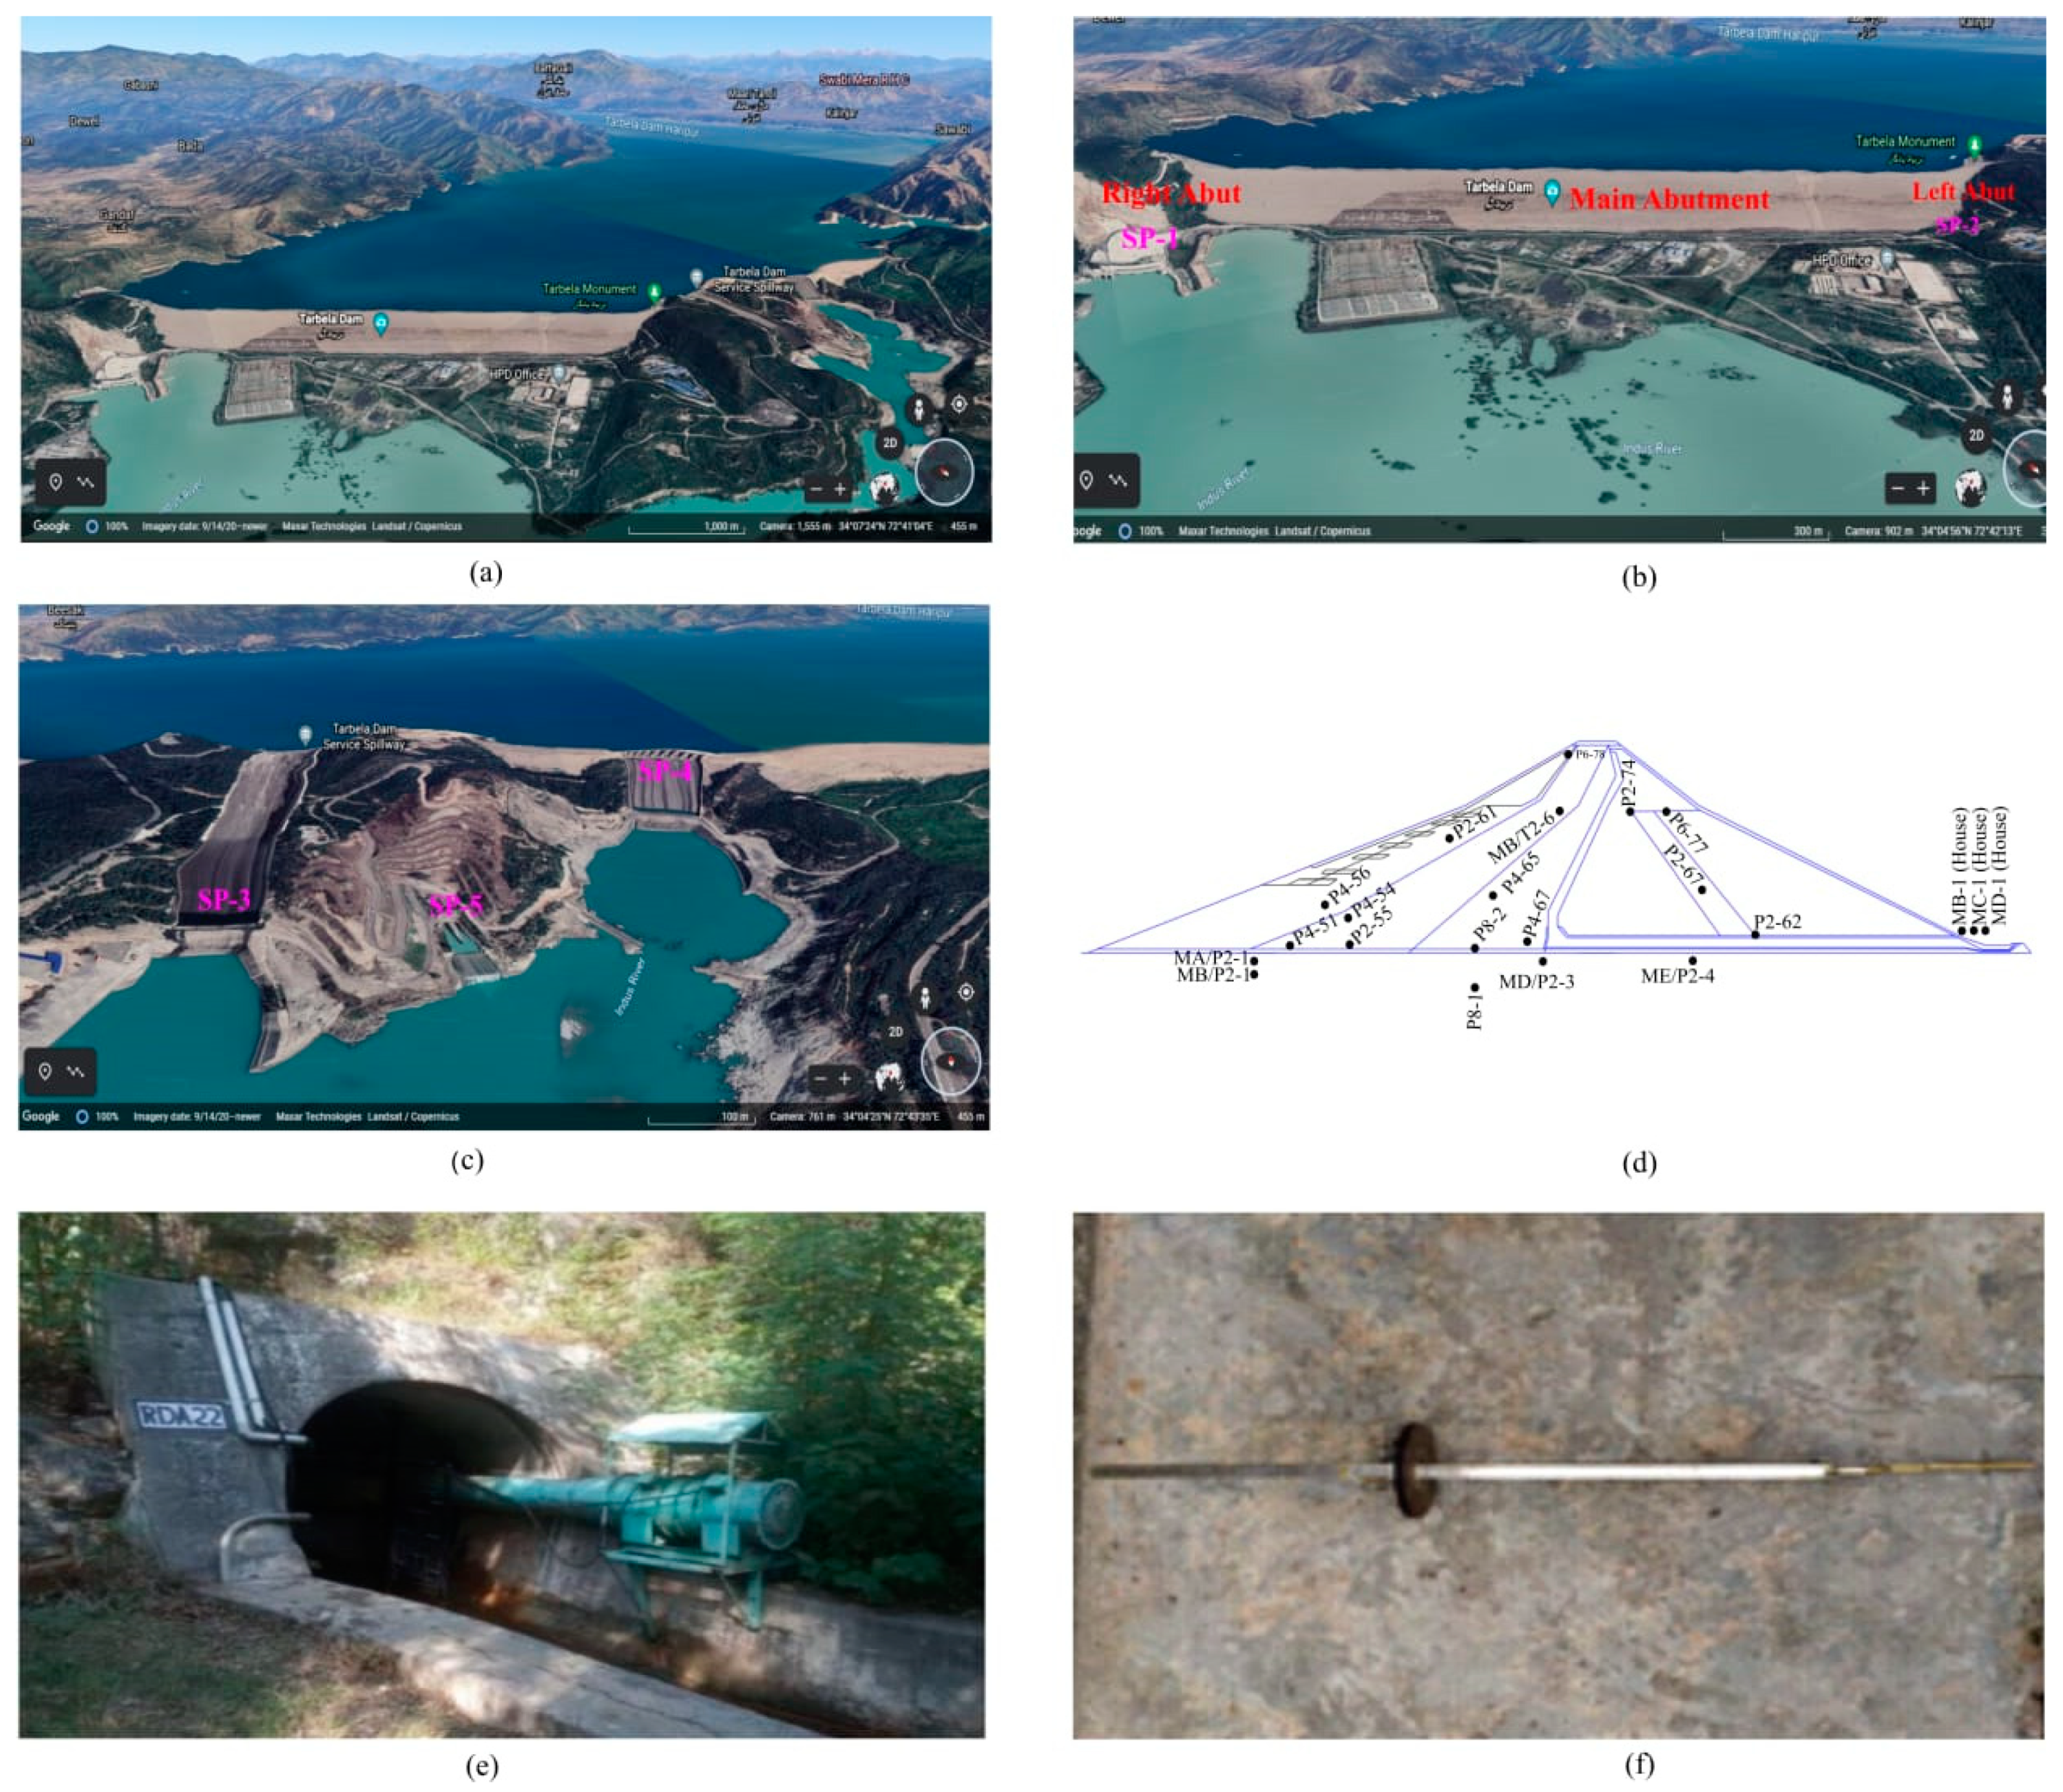
2.1. Description of Case Study

The Tarbela Dam is one of the largest earth-fill dams in the world [26]. The dam is located on the Indus River, some 130 km north of Islamabad, in Khyber Pakhtunkhwa (KP) (Figure 1). Under the supervision of Pakistan’s Water and Power Development Authority (WAPDA), the dam was constructed in 1970 and completed in 1974. The dam’s construction purpose was to improve Pakistan’s low-cost hydroelectric power, flood control, and agricultural water storage system [27,28]. This dam is a vital national resource, providing 52% of Pakistan’s total irrigation and 30% of the country’s power needs [29,30]. The reservoir behind the dam is more than 100 km long and encompasses 260 square kilometers when full. The reservoir’s initial live storage capacity was 11.9 billion m3, but due to floods and erosion during the previous 35 years of operation, it has reduced to 6.8 billion m3. With two spillways carved into the left bank and pouring into a lateral valley, the Tarbela dam is 2743 m long and 143 m high above the riverbed. The reservoir’s main characteristics include a catchment area of 169,600 km², an annual discharge at Tarbela of 64 MAF, a lake area of 259 km², a design live storage of 9680 MAF, existing live storage of 6849 MAF, a maximum depth of 137 m, a maximum elevation of 472.44 m, a minimum operating elevation of 420.01 m, a crest elevation of 477 m, a crest elevation of 2743 m, and a maximum height above the riverbed of 147.82. The dam has two spillways, one of which serves as a service spillway and has seven gates, while the other has nine gates and serves as an auxiliary spillway. The World Bank and the Asian Infrastructure Investment Bank are supporting the 5th extension project, which will increase the Tarbela dam hydroelectric facility’s installed capacity from 4888 MW to 6298 MW.

2.2. Data Description

Real-time monitoring data is gathered on a daily basis, to ensure the smooth functioning of the Tarbela dam in Pakistan. Daily real-time sensor information of the reservoir water level is acquired in feet, water input from Indus River in Cusic feet per second, water outflow from the dam Cusic feet per second, and barrage level in feet; piezometers gauge measures the pressure, and seepage data is taken from audits galleries; maximum temperature, minimum temperature, and various other information from installed dam devices were gathered from the 2014 to 2020 summer seasons, as shown in Table 1. This data can also be used in other scientific applications such as civil engineering for structural stability and engineering design rehabilitation; geotechnical engineering for seepage treatment with relatively stable dam structure reforms; environmental hazard assessment of risk of disaster in case of dam failure; and artificial intelligence application, which can help dam management authorities make decisions and design policies. For LSTM–RNN model mapping and training, a time series dataset with 49 variables was used. The dataset has 49 features with a one-day timestamp. The window used for training purposes was 10 days’ data, which means 10 days’ history was used for prediction. The input sequence had a dimension of (49 × 10), where 49 feature and 10 days’ data was used for extracting contexts. As an output label, five seepage values were employed, and these seepage values were averaged to generate single seepage values. The data collection points of the other parameters are shown in Figure 2d, and the seepage data collection point is shown in Figure 2a–c. Figure 3 shows the research for this algorithmic study for dam seepage prediction.

2.3. Recurrent Neural Network

A wide range of water resource challenges were solved using recurrent neural network (RNN) approaches [31]. RNNs are built to operate with arbitrary input data throughout extended sequences, performing the same job for each element in the series and depending on the output calculation from the previous calculation [29,32]. The model application, many-to-one model, many-to-many model, and other aspects all influence RNN design. The problem of the statement, which is dependent on phenomena, determines the eventual structure. Given all of the former seepage values as input, we used a many-to-one one-step prediction model to estimate the current seepage value.
RNN is a fully convolutional model with interconnections that uses internal memory to simulate temporal interactions between inputs with unknown durations and outputs. Figure 4 show the basic structure of RNN. The distinction between RNNs and loops is that RNNs do not have a direct information flow between neurons. As a result, until the sequential time series is completed, the influence of information for a variable may be maintained for a specific period. The output of each neuron is coded by the recurrent connections, whereas the memory of the RNN is coded by the recurrent connections [33].
The input time is denoted by the letter t. The hidden state at time step t in Figure 4 is represented by the black square, which receives input from other neurons at a previous time step. The network’s “memory” is calculated using the previous concealed state and the current step’s input. Equation (1) gives further details regarding what happened in each of the prior stages.
S t = C M t + V S t 1
For example, a vector of probabilities over the time series may be used to forecast the next sequence in the time series. Typically, the function is a nonlinear activation function, such as tanh. RNNs have many parameters in common (C, D, V). Figure 4 depicts the same task conducted with various inputs in each phase.

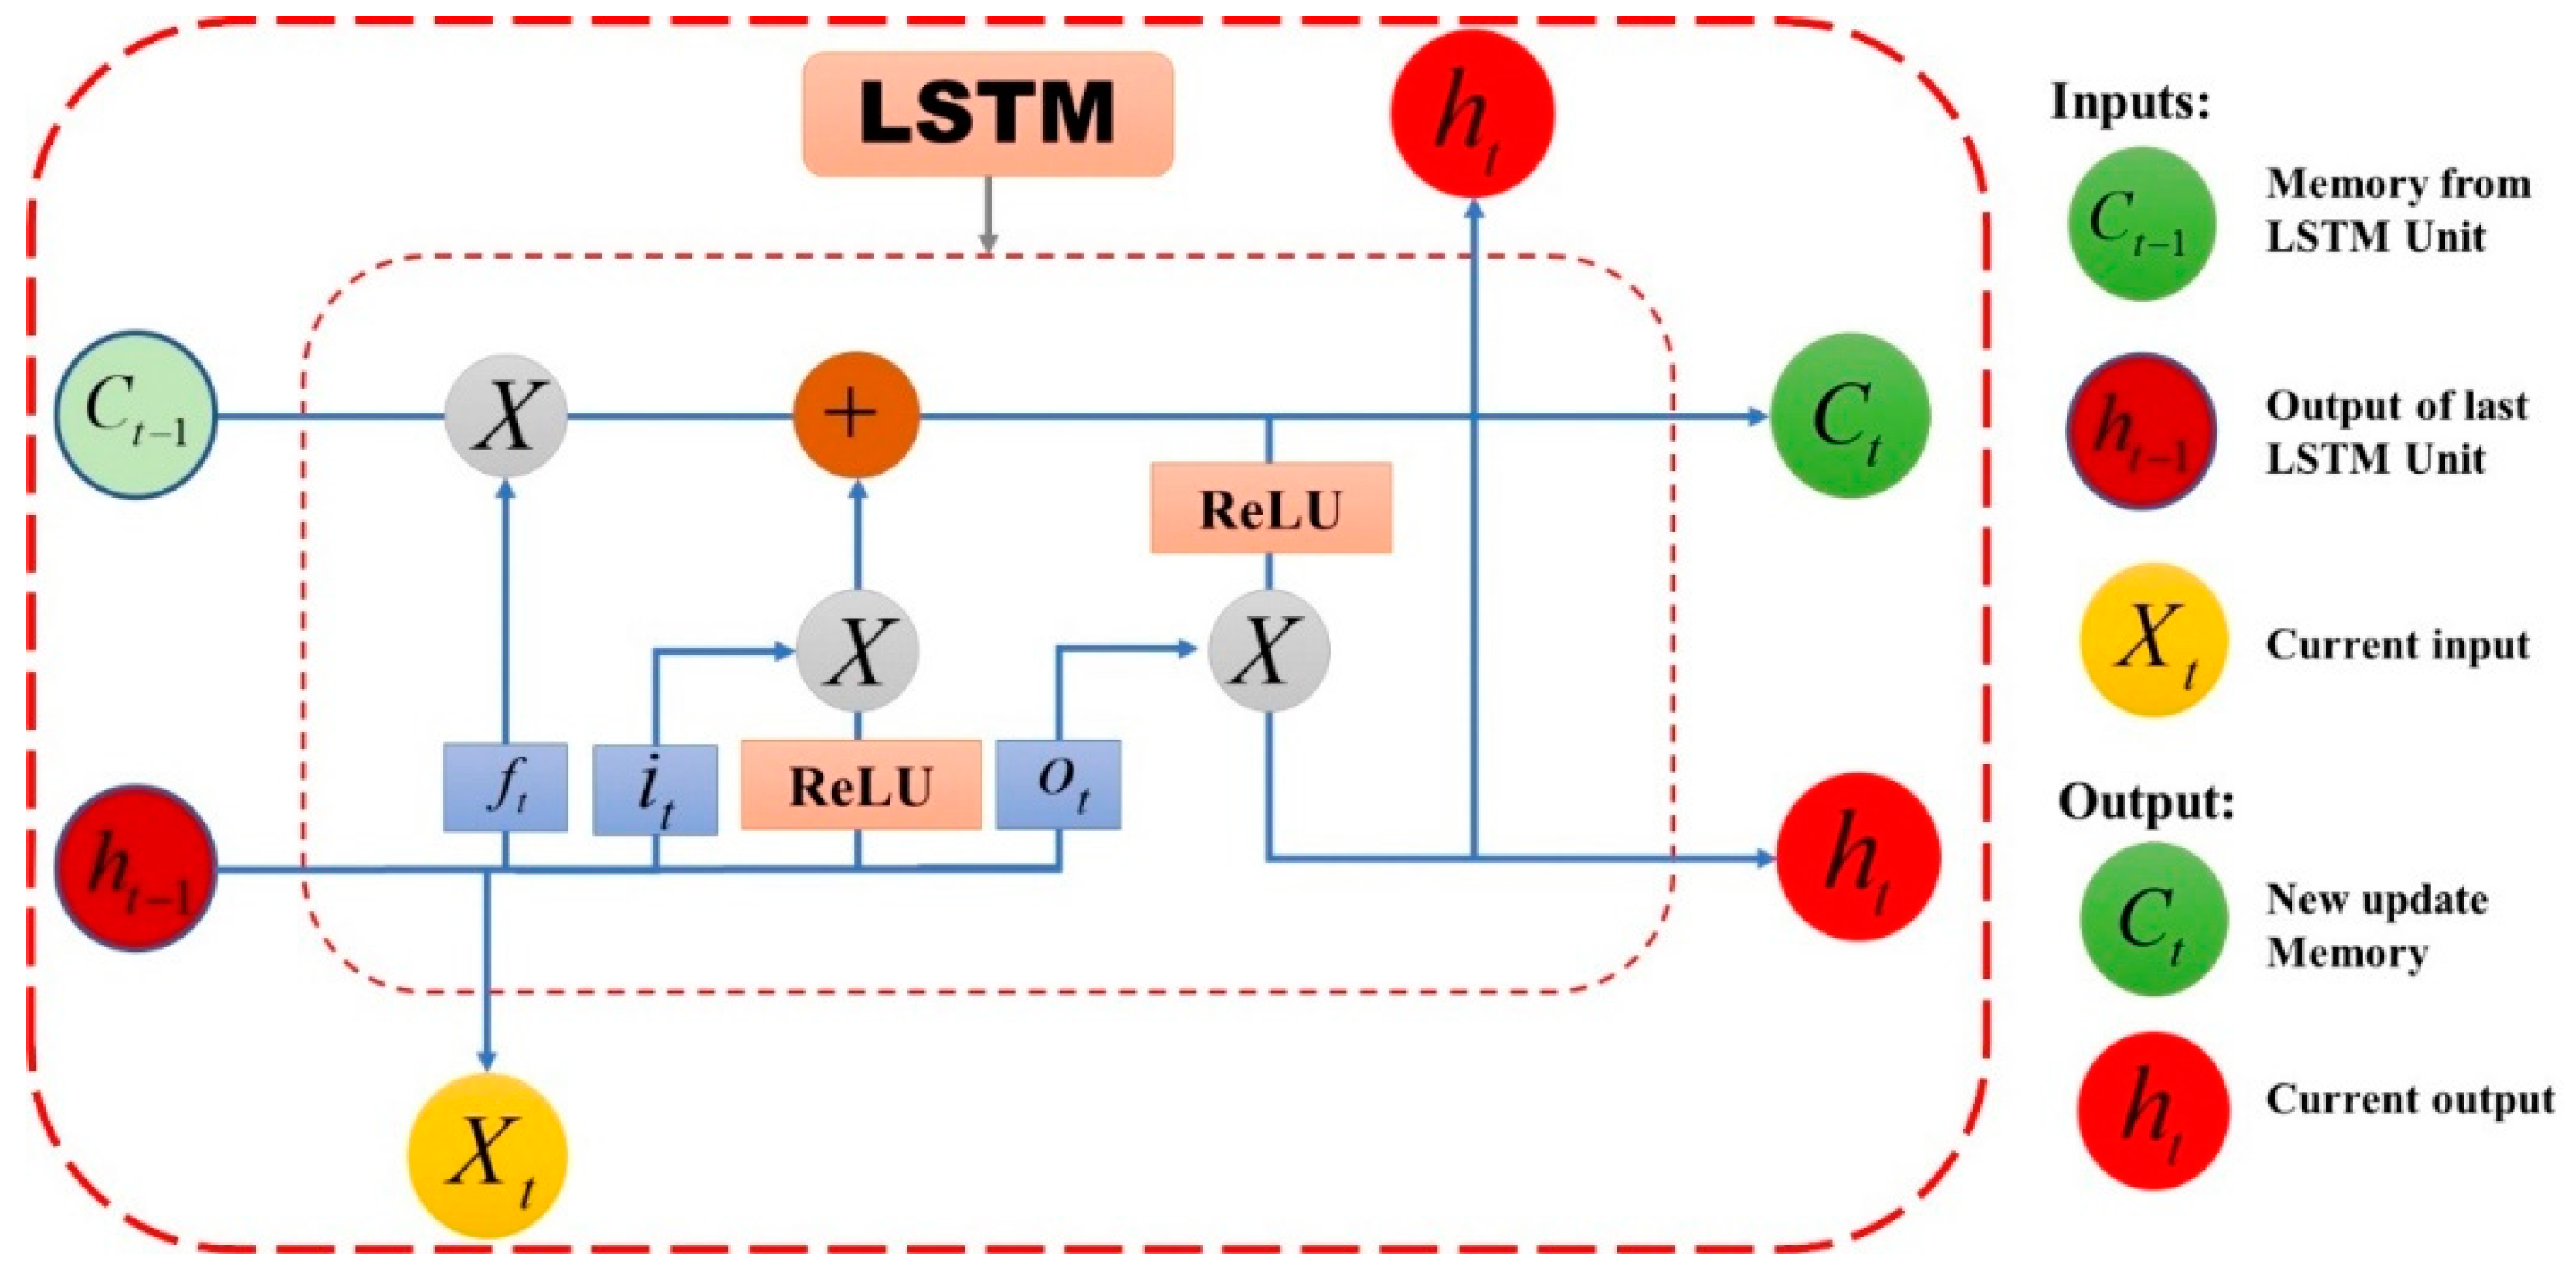
2.4. Long Short-Term Memory Network (LSTM)

The RNN handles time series data correctly. However, there is still a significant gradient vanishing issue with the training log time lag for time series prediction, particularly for hydrological time series data [35,36]. As a result, a LSTM–RNN model was employed to forecast dam seepage in this study to overcome the limitations of RNN. The LSTM–RNN model was presented by Hochreiter and Schmidhuber as a state-of-the-art technique [37]. An input gate, a neuron with a self-recurrent connection (a link to itself), a forget gate, and an output gate are the four basic parts of an LSTM, much as an RNN, as shown below (Figure 5). One of the three nonlinear gates in the block is the summing unit, which governs the inside–outside movement of information via activation cells using multiplications. The memory cell’s self-recurrent connection is multiplied by the gates of the input and output cells. The forget gate, on the other hand, doubles the prior state (the memory cell’s self-recurrent connection), and uses the activation function to enable it to forget or recall its previous state [38].
The gate activation function (ft) is typically represented as a logistic ReLU, as gate activation is between 0 and 1 (gate close and open). In contrast, the output activation function (‘Ot’) is typically represented as a tanh or logistic sigmoid to overcome the vanishing gradient problem, with a second derivative that sustains for a long period before going to 0. Furthermore, based on the various issue formulations, there is an amplification relationship between the two parties. Figure 5 shows the connection between the cell and the gates, which is made up of weighted weights (the ‘peephole’ connection), with the remainder of the connection being unweighted (or equivalently, a fixed weight). The output of the memory block is connected to the remainder of the network through the use of output gate multiplication. The model input is denoted as   x = ( C t 1 ) , and the output sequence is denoted as y = ( h t 1 ) where t is the prediction period, and t′ is the next time step prediction. In the case of seepage prediction, x is considered historical input data, and y is the single lag period series. The purpose of LSTM–RNN is to predict dam seepage in the next time step using previous data, and it is computed using the equation:
i n p u t   g a t e   i t = σ ( W i x x i + W i h . h t 1 + W i c . c t 1 + b c )  
f o r g e t   g a t e   f t = σ ( W f x . x t + W f h . h t 1 + W f c . c t 1 + b f )  
C e l l   s t a t e   c t = f i . c t 1 + i t . g ( W c x . x t + W c h . h t 1 + b c )  
o u t p u t   g a t e   o t = σ ( W o x . x t + W o h . h t 1 + W o c . c t + b )  
h i d d e n   g a t e   h t = o t . h ( c t )  
o u t p u t   l a y e r   y t = W y h . h t + b y  
where   σ denotes the ReLU activation function.
The memory block is made up of three gates: an input gate, an output gate, and a forget gate. The outputs of the three gates are shown in this way: i t ,   o t ,   f t . For each cell or memory block, the activation vectors are indicated as   c t and h t . The weight matrices W, and the bias vectors b, are used to build connections between the input layer, the output layer, and the memory block.

2.5. Swish Activation Function

Kahraman [39] developed the Swish function, which is as computationally efficient as ReLU, but outperforms it in more complicated models. The following is the definition of this function:
f ( x ) = x   s i g m o i d ( x )
Swish has values ranging from negative infinity to infinity, which helps during the model optimization phase, and is one of the reasons why Swish is better than ReLU. The swish activation function is used to activate the net input in mathematical form:
f ( x ) = x ( 1 1 + e x )
Looking into different functions, such as tanh and sigmoid, both are bounded above and below. The ReLU function is bounded above, while the swish function is not bounded, performs well in case of near-zero cost, and its response of derivative is better for others. Similarly, ReLU has zero with negative net input to a neuron.

2.6. Experimental Setup

This experiment used the RNN–LSTM deep learning model to forecast dam seepage. The data were time series, and for this analysis, the data from chosen days in every month from the years 2014 to 2020 were used. MATLAB 2021a, with Machine toolbox deep neural network designer, was used in this experiment. The experimental analysis was subdivided into several steps: first, data normalization; second, data division for training 70%, testing 15%, and validation 15%; third, data mapping of training, testing, and validation using a deep neural network designer tool (MATLAB deep learning toolbox 2021a); and fourth, model error and accuracy evaluation with dam seepage prediction.

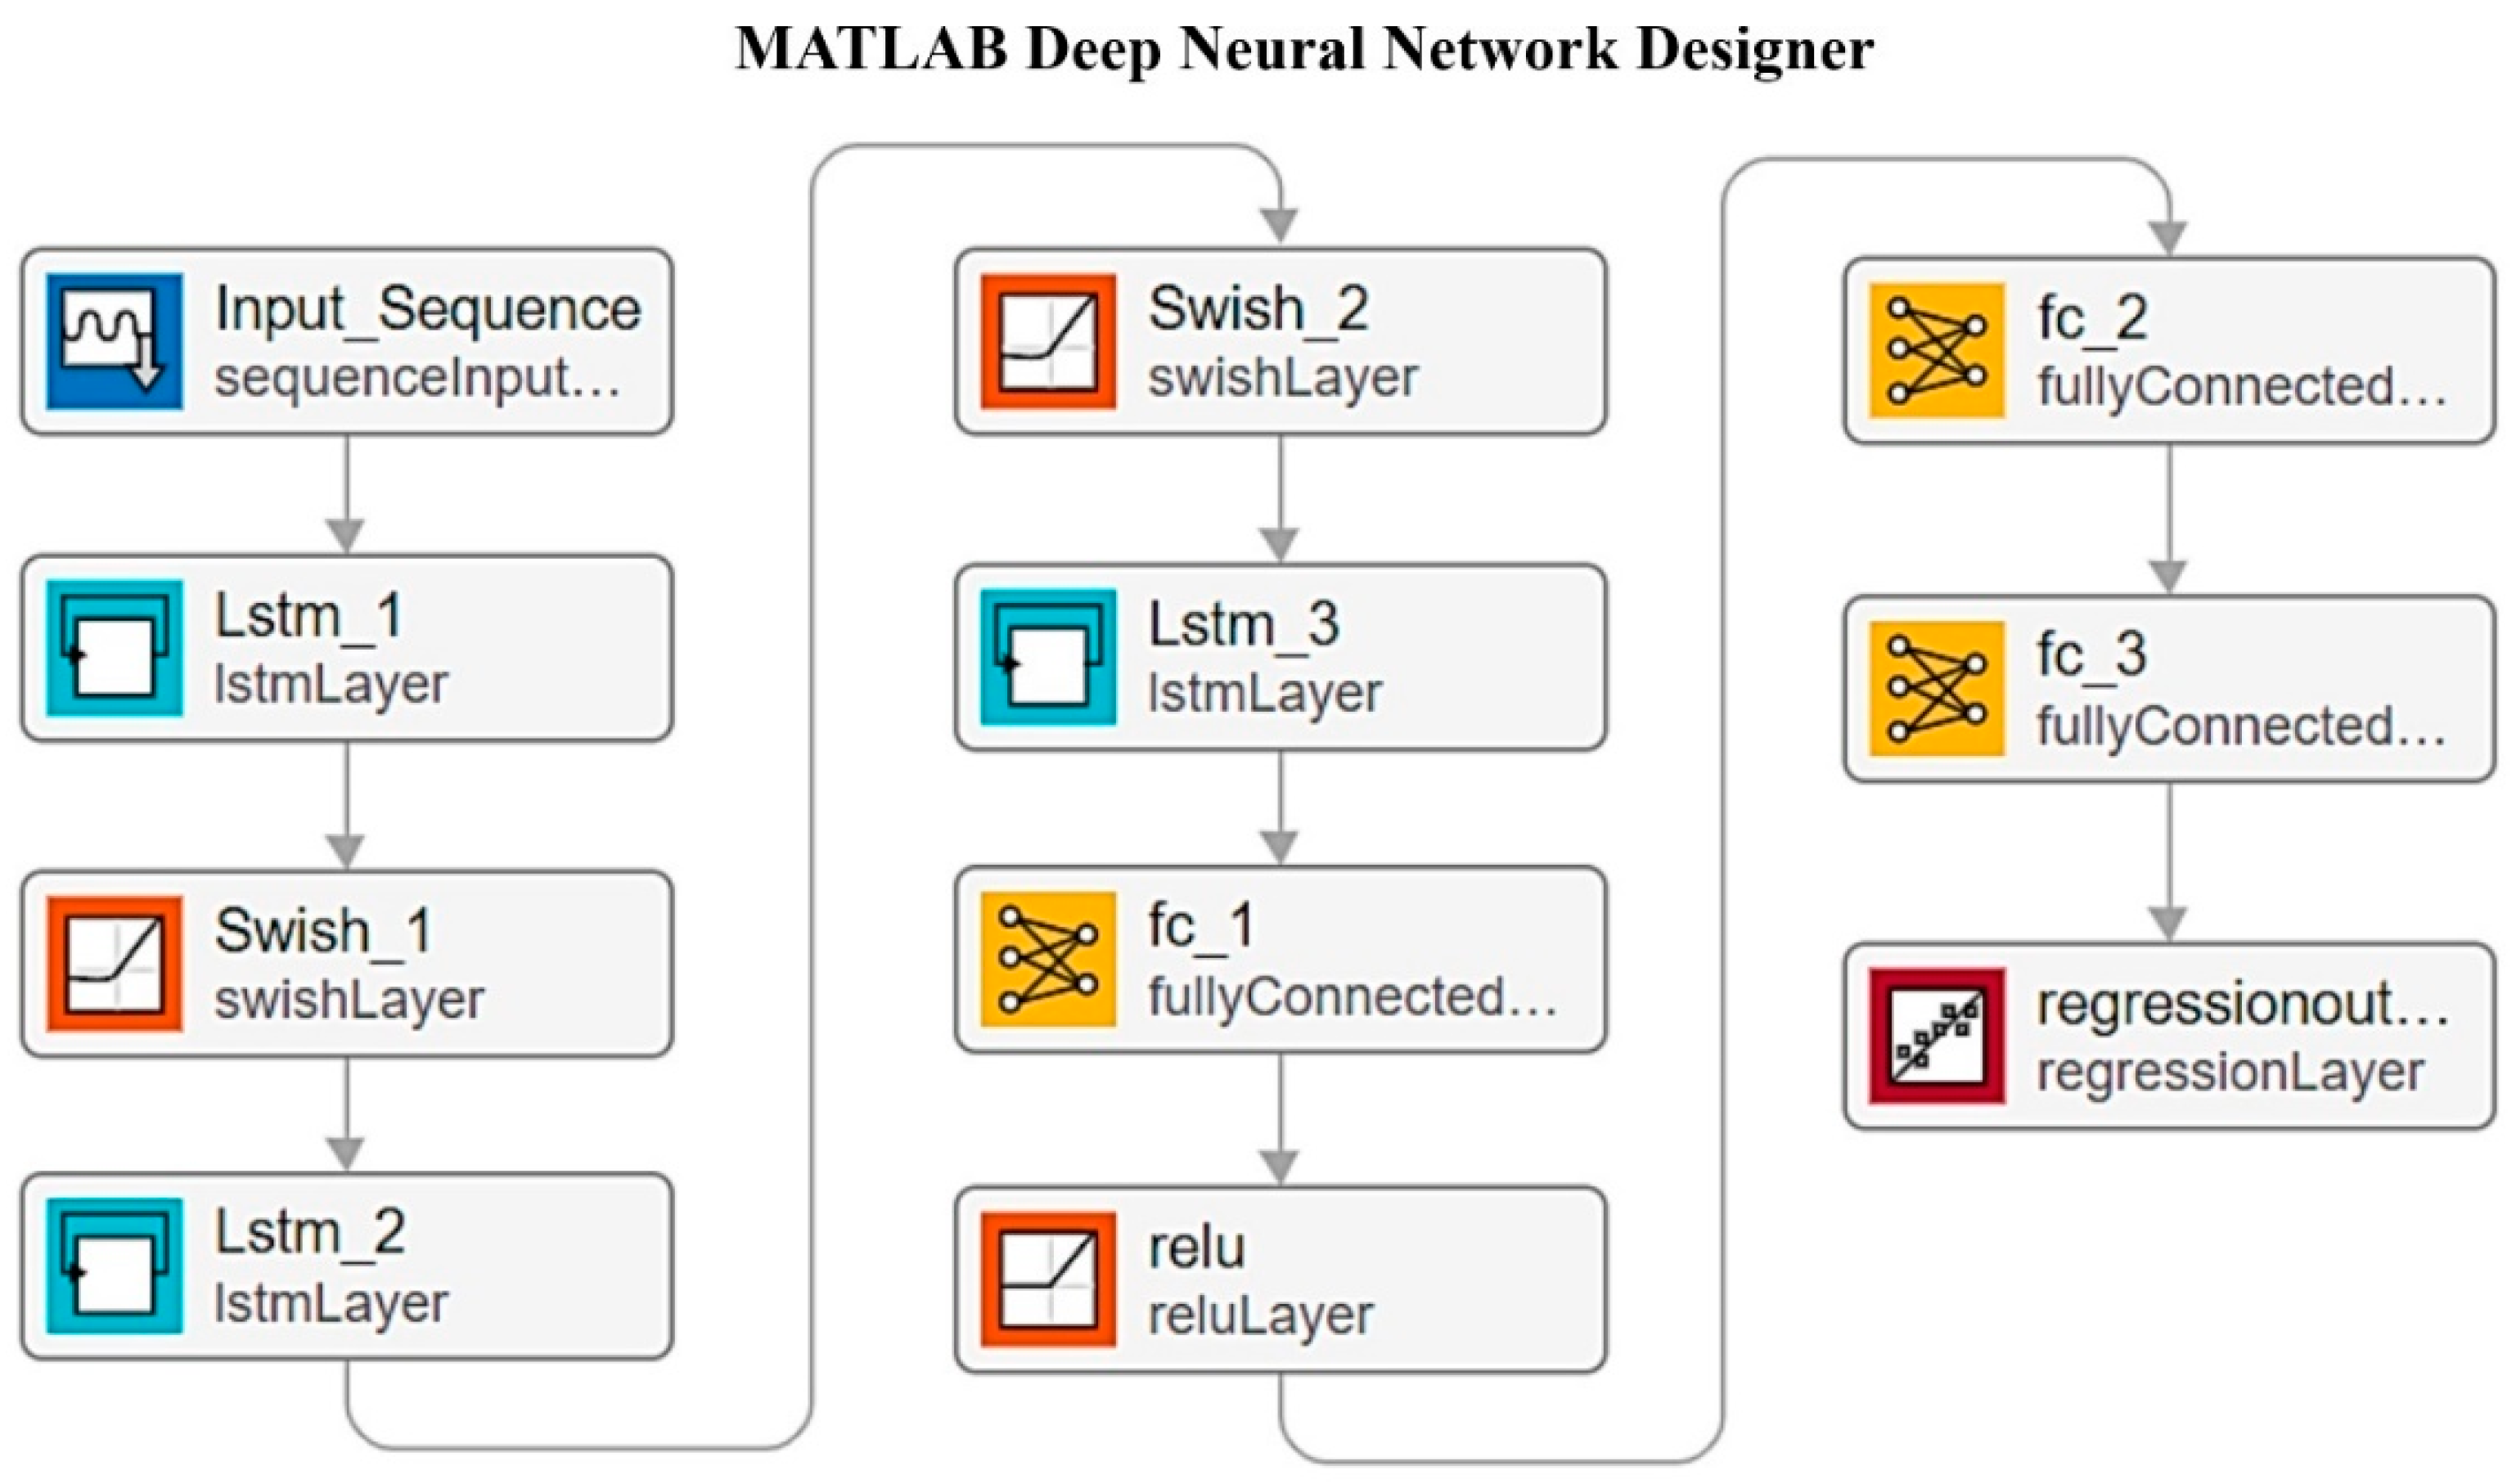
2.7. Network Architecture Design

The RNN–LSTM network design had three LSTM layers, each with 256, 512, and 1024 neurons, with a swish activation function, as shown in Figure 6. The swish function is a sigmoid function variation that is represented mathematically as:
f ( x ) = x × 1 ( 1 + e x )
The sequence input layer is where sequence data was imported into the network. In time series and sequence data, an LSTM layer learns long-term correlations between time steps. The layer inferred correlations between the values in the input sequence through contextual interactions between the input and output layers, increasing gradient flow over long training sequences. For regression, a fully connected layer multiplied the input by a weight matrix, while inserting a bias vector and an output layer. A regression layer calculated the half mean squared error loss for regression tasks.

2.8. Model Performance Evaluation

The mean square error is a performance metric that calculates the difference between observed and expected values. The total of squared errors of all cases under observation is the mean square error.
The historical observation of seepage data was compared to the computed seepage from RNN–LSTM in this research. The value of this accuracy in the network was determined by the cost function, which minimized the squared error. The training was performed using 512 sample batches. Using the observed and predicted dam seepage values officially defined in the below equation, the cost was computed as the MSE of each repeated step.
M S E = 1 n i = 1 m ( y ( i ) y ^ ( i ) ) 2
In above equation, y ( i ) is actual, y ^ ( i ) is the predicted value for i th observation in batch, and n denotes the observations numbers in the minibatch. The last layer output of the network at the final time step was linked to a dense layer with a single output neuron. Between the layers, a dropout equal to 10% was used. Fully connected layers had 200 and 150 neurons. The ReLU activation function was applied for the fully connected layers. The main advantage of using ReLU is that, for all inputs greater than 0, there is a fixed derivative. This constant derivative speeds up network learning.

3. Result and Discussion

The RNN–LSTM methods accurately predict dam seepage, and make a direct comparison between the amount of seepage observed and the amount predicted. The Tarbela dam in Pakistan was used as a case study site in this experiment. The scenario performance was evaluated using the MSE, MAE, and MAPE values when comparing observed data and predicted values during the validation or testing process. The size of the training dataset varies, depending on the model being employed. The 2014–2018 data was used for training purposes, while the 2019 data was used for testing, and the 2020 data was used for validation purposes. According to this study, using RNN–LSTM methods to model the daily seepage time series yielded a significant improvement in prediction performance over traditional RNN.

3.1. Earhfill Dam Seepage Model Accuracy

The model is trained using a training set of 4900 value training examples, distributed across 10 time stamps. The training settings are 200 epochs with 512 batch sizes, resulting in 10 iterations for each epoch. The model progressively converges as the number of iterations rises, and there is no noticeable difference between the findings of 300 and 500 epochs. As a result, it is determined that a limit of 500 epochs is sufficient. The number of neurons in the hidden layers is another factor impacting model accuracy. A dropout approach with a 10% dropout, which deactivates multiple neurons, was used to overcome this issue.
The goal of this research was to develop a many-to-one RNN–LSTM model. The model was developed in MATLAB, and the dataset was separated into three sections: training, validation, and testing. For model error, the appropriate mapping of the dataset was investigated. For training based on MSE of the whole dataset and minibatch MSE, there are two sorts of errors to consider. The overall error is determined on the whole dataset, while the minibatch error is calculated on each batch. Figure 7 depicts the MSE estimated for the training process at a batch level, as well as the MSE calculated for all training samples. The MSE for training decreases for both overall and batch level error throughout the training process, and eliminates overfitting when validation data confirm the training process, as shown in Figure 7 and Figure 8. During training, early stopping conditions were used to prevent the model from overfitting. After 200 epochs, the training was stopped, since the training MSE improved, while the validation MSE increased after 180 epochs and 3 validation tests failed.
Table 2 below shows the accuracy (MSE, R) of the deep learning models prediction of seepage from the earth-fill Tarbela dam. The result from the RNN–LSTM model shows that LSTM has the highest accuracy during model evaluation, with an MSE of 0.124, while R is 0.945. Recently, in hydrological stream inflow, different researchers report the good applicability of RNN–LSTM, e.g., J. Hong et al. use a combined machine learning model for dam inflow in South Korea, using the input variables of solar radiation, wind speed, humidity, temperature, precipitation; and water inflow as an output variable. The RNN–LSTM has an accuracy of NSE 0.429, MAE 26.332 m3/s, and R 0.675 [40]. When compared with this RNN–LSTM dam seepage prediction model, this model performed well in model evaluation. In another study, J. Hong et al. (2021) use the combined machine learning algorithm for the discharge prediction of a multipurpose dam in South Korea, with the input variables of inflow, precipitation, discharge, and the output variable of discharge prediction. In this study, RNN–LSTM was also used with other machine learning algorithms. The result shows that MAE is 10.024 m3/s, R is 0.89, and when compared with our model it performs well [41]. It is observed that J. Hong et al. (2021) use seven input variables in the first study, and three input variables in the second study. In our model, there are 49 input variables, including maximum information and the data values from 2014–2020, which increases the performance of our model as compared to above discussed model. From the above comparison, it is concluded that our model performance is as good as the J. Hong et al. (2021) models used for dam inflow and discharge study in South Korea. Although it is a different study conducted for hydrological time series, these two are near to our scope of study.
Artificial intelligence, machine learning, and deep learning are the emerging technologies from the last decade, especially in solving the dam seepage problem. V. Nourani et al. (2012) integrated the ANN model with the earth-fill dam, using upstream and downstream water level use for a developed comparison between observed and computed water levels, using feed-forward backpropagation (FFBP), radial basis function (RBF), and ANN. The result shows good agreements between computing and observing reservoir water heads at different piezometers, with a validation determination coefficient higher than 0.79 in single ANN, and 0.87 and 0.67 in FFBP and RBF integrated modeling, respectively. The result of the ANN is satisfactory when compared to FFBP and RBF [42]. Similarly, S. Emami et al. (2019) used RBF and GFF to analyze the piezometer data and water level difference of the dam. The result shows good agreement with the model, and accuracy measurements R2 and RMSE were 0.81 and 33.12, respectively. Similarly, other studies were conducted in 2019 and 2020, but all the studies are related to artificial neural networks. This is the first time that a deep learning time series dataset study was conducted in Pakistan for Tarbela dam seepage using the RNN-LSTM model. All the previous studies show normal results, but our study has a good performance when compared to the previous studies.

3.2. Earthfill Dam Seepage Prediction Model Result

The earth-fill dam seepage problem is a critical problem throughout the world, and the last decade of integration of artificial intelligence into water resources management and dams plays an important role in terms of the safety and stability of dams. For this purpose, an earth-fill dam in Pakistan was studied using the RNN–LSTM technique to predict the dam seepage. A total of 49 variables were used for the model mapping for this study. The model was validated using 479 test observations, spanning 479 days of data. In Figure 9, the real and projected time series for seepage are shown. The networks produce larger inaccuracies in the peaks in the actual time series. This inaccuracy is due to the previous observation’s window size being too small to estimate the next seepage value using the model. This leads to the identification that if the ideal window size is chosen, the network performs effectively. This occurs even though the dam seepage abundance has multiple low values, allowing the model to be trained properly and effectively during the training stage. The difference between the minimum and maximum seepage values is significant, according to the data, and the validity of these values is tested over the research period, using hydro-climatological parameters in the area. The maximum rainfall is a substantial quantity during times when peak dam seepage is detected, indicating the accuracy of peak water inflow values. However, of the approaches used, the LSTM network outperforms the others and properly represents seepage. As previously stated, the network’s greatest strength is its ability to learn long-term dependencies, and the forget gate allows the network to maintain or forget the required amount of past knowledge, which helps in modeling improvement.
Figure 9 shows the actual and predicted seepage, which is the peak session data for two years, from August 2019 to October 2020, in the Tarbela dam of Pakistan. The dam is at its maximum reservoir level at that time due to the summer season and rapid glacier melting, along with monsoon precipitation. The diagram shows data points of days on the x-axis, from 0 to 500 days. Similarly, on the y-axis, seepage is scaled. The peak level seepage is predicted at 5 to 6.5, which is the peak session seepage, and it is observed that actual and predicted seepage in that time show good relation to each other. The overall seepage trend is the same, but little fluctuation is observed between points 150 and 300 on the graph, which is due to dry weather and more outflow from the dam, decreasing the seepage from the body of the dam in terms of reservoir level pressure. Overall, the model performance is good for comparing the observed seepage vs. predicted seepage.
Support vector machine learning is a supervised algorithm that is used for classification and regression studies. As our proposed model is based on regression, the SVM regression model is used for comparison for this research. To compare the proposed model with state-of-the-art techniques, the support vector machine model was selected and trained on the same data and tested with test data. SVM is a soft computing technique that maximizes the margin across the decision boundary. Mean square error (MSE), mean absolute error (MAE), and mean absolute percentage error (MAPE) are used to compare the models for test data. The test results are presented in Table 3. The proposed network’s LSTM layer is replaced with a gated recurrent unit (GRU), and the network is trained using the same data. Table 3 summarizes the test results for GRU, SVM, and the suggested model. The findings demonstrate that the suggested approach outperforms previous RNN algorithms, with the Bi-LSTM being significantly closer competition. However, the Bi-LSTM is more complicated than the LSTM.
The overall experiment and comparison with SVM, Bi-LSTM, and GRU results show that the RNN–LSTM performance is good for the prediction of dam seepage, for a time series dataset as compared to SVM, Bi-LSTM and GRU.

4. Conclusions

In this study, deep learning algorithm models were used to predict the amount of dam seepage in the Tarbela dam, built on the Indus River of Pakistan, and model performance was evaluated. Deep learning techniques were used to compensate for the shortcomings of dam monitoring operations, such as data collection of different operations in dam schedules, human decision, and the uncertainty due to human activities.
The goal of this research was to explore whether a new RNN–LSTM approach could forecast dam seepage. For model construction and training, daily data of real-time observed information from the instruments from 2014 to 2020 was used as a case study. The model’s performance was assessed using the standard statistical performance assessment measurement MSE. The RNN capacity of LSTMs to forget, remember, and update information made it possible to develop time series models using it. According to the findings of this study, the RNN–LSTM approach may be used to model dam seepage prediction at the earth-fill Tarbela dam and provide good results. RNN–LSTM is capable of analyzing, and forecasting time series with unknown time gaps between critical events. It includes searching for patterns that develop through time, and is based on both present and past values of observable data. The authors recommend employing RNN–LSTM approaches to forecast dam seepage, using a time series dataset, in order to aid water resources management decision making and policymaking, and for improved monitoring of seepage losses at any dam around the globe using AI-based models. The selection of window size is one of the challenges with such time series prediction. The window size in this study was 10, and the model was predicted based on the prior 10 days’ data.
In light of global warming and climate change, water resources management should be a research priority. This should be accomplished by creating a database of all dam variables from the entire hydrological cycle, via dam site data collections and applying various algorithms to improve dam problems. This work recommends the performance of such a model can be improved for dam seepage prediction problems for time series datasets by adopting several stack layers (multiple hidden LSTM layers), GRU (gated recurrent unit), and bi-directional LSTM, which would be the scope of future work.

Author Contributions

The author contribution as follows: data collection, M.I.; data provision, K.J.; conceptualization, M.I.; methodology, M.I.; software, M.I. and N.u.H.; analysis, M.I. and N.u.H.; validation, M.I., N.u.H., K.J., H.T.J. and Q.D.; writing— original draft, M.I.; writing— review and editing, H.T.J., S.M.S. and K.J.; supervision, Q.D.; project administration, K.J., S.M.S. and H.T.J. All authors have read and agreed to the published version of the manuscript.

Funding

This research is supported by National Key Research and Development program of China, Grant Nos. 2018YFC0603903 and the National Natural Science Foundation of China, Grant Nos. 41874148 under the Key Laboratory of Metallogenic Prediction of Nonferrous Metal of the Ministry of Education, Central South University, Changsha, China.

Data Availability Statement

The data is confidential (provided upon request).

Acknowledgments

For his financial and technical assistance during the study effort throughout the COVID pandemic. My gratitude also goes to the Tarbela dam administration and geologist Baber Siddique for sharing the data. I also want to highlight my family’s unwavering support throughout my Ph.D. study. Last but not least, I’d like to express my gratitude to Lei, Zhang, Bilal Khalid, Ali Nawaz, Muhammad Ilyas, and Idrees for their assistance.

Conflicts of Interest

The authors declare no conflict of interest.

References

  1. Donnelly, C.; Greuell, W.; Andersson, J.; Gerten, D.; Pisacane, G.; Roudier, P.; Ludwig, F.J.C.C. Impacts of climate change on European hydrology at 1.5, 2 and 3 degrees mean global warming above preindustrial level. Clim. Chang. 2017, 143, 13–26. [Google Scholar] [CrossRef] [Green Version]
  2. Wang, X.; Yu, H.; Lv, P.; Wang, C.; Zhang, J.; Yu, J. Seepage safety assessment of concrete gravity dam based on matter-element extension model and FDA. Energies 2019, 12, 502. [Google Scholar] [CrossRef] [Green Version]
  3. Bi, J.; Lee, J.-C.; Liu, H. Performance Comparison of Long Short-Term Memory and a Temporal Convolutional Network for State of Health Estimation of a Lithium-Ion Battery using Its Charging Characteristics. Energies 2022, 15, 2448. [Google Scholar] [CrossRef]
  4. Rodríguez-Rángel, H.; Arias, D.M.; Morales-Rosales, L.A.; Gonzalez-Huitron, V.; Valenzuela Partida, M.; García, J. Machine Learning Methods Modeling Carbohydrate-Enriched Cyanobacteria Biomass Production in Wastewater Treatment Systems. Energies 2022, 15, 2500. [Google Scholar] [CrossRef]
  5. Norouzi, R.; Sihag, P.; Daneshfaraz, R.; Abraham, J.; Hasannia, V. Predicting relative energy dissipation for vertical drops equipped with a horizontal screen using soft computing techniques. Water Supply 2021, 21, 4493–4513. [Google Scholar] [CrossRef]
  6. Singh, B.; Sihag, P.; Pandhiani, S.M.; Debnath, S.; Gautam, S. Estimation of permeability of soil using easy measured soil parameters: Assessing the artificial intelligence-based models. ISH J. Hydraul. Eng. 2019, 27, 38–48. [Google Scholar] [CrossRef]
  7. Ibrahim, K.S.M.H.; Huang, Y.F.; Ahmed, A.N.; Koo, C.H.; El-Shafie, A. A review of the hybrid artificial intelligence and optimization modelling of hydrological streamflow forecasting. Alex. Eng. J. 2021, 61, 279–303. [Google Scholar] [CrossRef]
  8. Kulisz, M.; Kujawska, J.; Przysucha, B.; Cel, W. Forecasting water quality index in groundwater using artificial neural network. Energies 2021, 14, 5875. [Google Scholar] [CrossRef]
  9. Benítez, R.; Ortiz-Caraballo, C.; Preciado, J.C.; Conejero, J.M.; Sánchez Figueroa, F.; Rubio-Largo, A. A short-term data based water consumption prediction approach. Energies 2019, 12, 2359. [Google Scholar] [CrossRef] [Green Version]
  10. Zhang, X.; Chen, X.; Li, J. Improving dam seepage prediction using back-propagation neural network and genetic algorithm. Math. Probl. Eng. 2020, 2020, 1404295. [Google Scholar] [CrossRef]
  11. Rehamnia, I.; Benlaoukli, B.; Jamei, M.; Karbasi, M.; Malik, A. Simulation of seepage flow through embankment dam by using a novel extended Kalman filter based neural network paradigm: Case study of Fontaine Gazelles Dam, Algeria. Measurement 2021, 176, 109219. [Google Scholar] [CrossRef]
  12. Zitnik, M.; Nguyen, F.; Wang, B.; Leskovec, J.; Goldenberg, A.; Hoffman, M.M. Machine learning for integrating data in biology and medicine: Principles, practice, and opportunities. Inf. Fusion 2019, 50, 71–91. [Google Scholar] [CrossRef] [PubMed]
  13. Li, Y.; Yang, J. Hydrological Time Series Prediction Model Based on Attention-LSTM Neural Network. In Proceedings of the 2019 2nd International Conference on Machine Learning and Machine Intelligence, Jakarta, Indonesia, 18–20 September 2019; pp. 21–25. [Google Scholar]
  14. Liu, B.; Fu, C.; Bielefield, A.; Liu, Y.Q. Forecasting of Chinese primary energy consumption in 2021 with GRU artificial neural network. Energies 2017, 10, 1453. [Google Scholar] [CrossRef]
  15. Salmasi, F.; Nouri, M. Effect of upstream semi-impervious blanket of embankment dams on seepage. ISH J. Hydraul. Eng. 2017, 25, 143–152. [Google Scholar] [CrossRef]
  16. Xu, J.; Wei, W.; Bao, H.; Zhang, K.; Lan, H.; Yan, C.; Sun, W. Failure models of a loess stacked dam: A case study in the Ansai Area (China). Bull. Eng. Geol. Environ. 2020, 79, 1009–1021. [Google Scholar] [CrossRef]
  17. Zaji, A.H.; Bonakdari, H.; Gharabaghi, B. Reservoir water level forecasting using group method of data handling. Acta Geophys. 2018, 66, 717–730. [Google Scholar] [CrossRef]
  18. Zhang, J.; Zhu, Y.; Zhang, X.; Ye, M.; Yang, J. Developing a Long Short-Term Memory (LSTM) based model for predicting water table depth in agricultural areas. J. Hydrol. 2018, 561, 918–929. [Google Scholar] [CrossRef]
  19. Elsaraiti, M.; Merabet, A. A comparative analysis of the arima and lstm predictive models and their effectiveness for predicting wind speed. Energies 2021, 14, 6782. [Google Scholar] [CrossRef]
  20. Apaydin, H.; Feizi, H.; Sattari, M.T.; Colak, M.S.; Shamshirband, S.; Chau, K.-W. Comparative analysis of recurrent neural network architectures for reservoir inflow forecasting. Water 2020, 12, 1500. [Google Scholar] [CrossRef]
  21. Lee, S.; Kim, J. Predicting Inflow Rate of the Soyang River Dam Using Deep Learning Techniques. Water 2021, 13, 2447. [Google Scholar] [CrossRef]
  22. Ouled Sghaier, M.; Hammami, I.; Foucher, S.; Lepage, R. Flood extent mapping from time-series SAR images based on texture analysis and data fusion. Remote Sens. 2018, 10, 237. [Google Scholar] [CrossRef] [Green Version]
  23. Omofunmi, O.; Kolo, J.; Oladipo, A.; Diabana, P.; Ojo, A. A review on effects and control of seepage through earth-fill dam. Curr. J. Appl. Sci. Technol. 2017, 22, 1–11. [Google Scholar] [CrossRef]
  24. Ismaeel, K.S.; Noori, B.M. Evaluation of seepage and stability of Duhok Dam. Al-Rafidain Eng. J. (AREJ) 2011, 19, 42–58. [Google Scholar] [CrossRef]
  25. Scaioni, M.; Marsella, M.; Crosetto, M.; Tornatore, V.; Wang, J. Geodetic and remote-sensing sensors for dam deformation monitoring. Sensors 2018, 18, 3682. [Google Scholar] [CrossRef] [PubMed] [Green Version]
  26. Moiseev, I. Experience with Designing and Building Earth-Fill Dams. Hydrotech. Constr. 2000, 34, 412–414. [Google Scholar] [CrossRef]
  27. Kontakiotis, G.; Karakitsios, V.; Cornée, J.-J.; Moissette, P.; Zarkogiannis, S.D.; Pasadakis, N.; Koskeridou, E.; Manoutsoglou, E.; Drinia, H.; Antonarakou, A. Preliminary results based on geochemical sedimentary constraints on the hydrocarbon potential and depositional environment of a Messinian sub-salt mixed siliciclastic-carbonate succession onshore Crete (Plouti section, eastern Mediterranean). Mediterr. Geosci. Rev. 2020, 2, 247–265. [Google Scholar] [CrossRef]
  28. Zubaidi, S.L.; Ortega-Martorell, S.; Al-Bugharbee, H.; Olier, I.; Hashim, K.S.; Gharghan, S.K.; Kot, P.; Al-Khaddar, R.J.W. Urban water demand prediction for a city that suffers from climate change and population growth: Gauteng province case study. Water 2020, 12, 1885. [Google Scholar] [CrossRef]
  29. Kahlown, M.A.; Majeed, A. Water-resources situation in Pakistan: Challenges and future strategies. Water Resour. South Present Scenar. Future Prospect. 2003, 20, 33–45. [Google Scholar]
  30. Ali, S.K.; Janjuhah, H.T.; Shahzad, S.M.; Kontakiotis, G.; Saleem, M.H.; Khan, U.; Zarkogiannis, S.D.; Makri, P.; Antonarakou, A. Depositional Sedimentary Facies, Stratigraphic Control, Paleoecological Constraints, and Paleogeographic Reconstruction of Late Permian Chhidru Formation (Western Salt Range, Pakistan). J. Mar. Sci. Eng. 2021, 9, 1372. [Google Scholar] [CrossRef]
  31. Wei, X.; Zhang, L.; Yang, H.-Q.; Zhang, L.; Yao, Y.-P. Machine learning for pore-water pressure time-series prediction: Application of recurrent neural networks. Geosci. Front. 2021, 12, 453–467. [Google Scholar] [CrossRef]
  32. Graves, A.; Mohamed, A.-R.; Hinton, G. Speech recognition with deep recurrent neural networks. In Proceedings of the 2013 IEEE International Conference on Acoustics, Speech and Signal Processing, Vancouver, British, 26–31 May 2013; pp. 6645–6649. [Google Scholar]
  33. Assaad, M.; Boné, R.; Cardot, H. A new boosting algorithm for improved time-series forecasting with recurrent neural networks. Inf. Fusion 2008, 9, 41–55. [Google Scholar] [CrossRef]
  34. LeCun, Y.; Bengio, Y.; Hinton, G. Deep learning. Nature 2015, 521, 436–444. [Google Scholar] [CrossRef]
  35. Gers, F.A.; Schmidhuber, J.; Cummins, F.A. Learning to forget: Continual prediction with LSTM. Neural Comput. 2000, 12, 2451–2471. [Google Scholar] [CrossRef] [PubMed]
  36. Gers, F. Long Short-Term Memory in Recurrent Neural Networks. Ph.D. Thesis, Leibniz Universität Hannover, Hannover, Germany, 2001. [Google Scholar]
  37. Hochreiter, S.; Schmidhuber, J. Long short-term memory. Neural Comput. 1997, 9, 1735–1780. [Google Scholar] [CrossRef]
  38. Ouma, Y.O.; Cheruyot, R.; Wachera, A.N.J.C.; Systems, I. Rainfall and runoff time-series trend analysis using LSTM recurrent neural network and wavelet neural network with satellite-based meteorological data: Case study of Nzoia hydrologic basin. Complex Intell. Syst. 2021, 8, 213–236. [Google Scholar] [CrossRef]
  39. Kahraman, S. The correlations between the saturated and dry P-wave velocity of rocks. Ultrasonics 2007, 46, 341–348. [Google Scholar] [CrossRef] [PubMed]
  40. Hong, J.; Lee, S.; Bae, J.H.; Lee, J.; Park, W.J.; Lee, D.; Kim, J.; Lim, K.J. Development and evaluation of the combined machine learning models for the prediction of dam inflow. Water 2020, 12, 2927. [Google Scholar] [CrossRef]
  41. Hong, J.; Lee, S.; Lee, G.; Yang, D.; Bae, J.H.; Kim, J.; Kim, K.; Lim, K.J. Comparison of Machine Learning Algorithms for Discharge Prediction of Multipurpose Dam. Water 2021, 13, 3369. [Google Scholar] [CrossRef]
  42. Nourani, V.; Sharghi, E.; Aminfar, M.H. Integrated ANN model for earthfill dams seepage analysis: Sattarkhan Dam in Iran. Artif. Intell. Res. 2012, 1, 22–37. [Google Scholar] [CrossRef] [Green Version]
Figure 1. The study area of earth-fill Tarbela dam of Pakistan. (a). Tarbela dam main embankment Google Earth overview. (b). Origin and overview of Indus River, which inflows into dam reservoir.
Energies 15 03123 g001
Figure 2. (a) overview of Tarbela dam; (b) the seepage location of left and right abutment; (c) the seepage location of auxiliary, service spillway, and seepage at auxiliary dam foundation; (d) the cross-section of Tarbela dam with audit points; (e) the audit for seepage water in Tarbela dam; and (f) the vernier gauge instrument used for seepage measurement in the Tarbela dam.
Energies 15 03123 g002
Figure 3. The research flow chart for model.
Energies 15 03123 g003
Figure 4. A typical RNN structure in the unrolled (network of entire sequence) form of a completely linked network [34].
Energies 15 03123 g004
Figure 5. The architecture of LSTM memory blocks has one cell and three gate layers.
Energies 15 03123 g005
Figure 6. RNN–LSTM network architecture design with active layers.
Energies 15 03123 g006
Figure 7. Minibatch error for network training.
Energies 15 03123 g007
Figure 8. Overall mean square error for network training.
Energies 15 03123 g008
Figure 9. Actual and predicted seepage of Tarbela dam.
Energies 15 03123 g009
Table 1. The input data for deep learning models.
Input Variables for NetworkTarget Variables
Reservoir level (ft)MB/P8-3P4-67 gauge (P)Seepage
Barrage level In (ft)MB/T2-6P6-77
P6-gaugeP2-57P6-78
Actual inflowP2-62Ext gauge (P)
Actual outflowP2-67P8-1
Skardu temp minP2-74P8-2
Skardu temp maxMC-1 (house)P8-6
P2-55MD-1 (house)BB-223
P4-56 gauge(P)P2-61B-661
P4-54 gauge(P)MA/P2-1B-662
P4-65 gauge(P)MB/P2-1B-686
P4-67MD/P2-3B-764
MB-1 (house)ME/P2-4B-593
MB-1 (house left)P4-51 gauge (P)B-756-1
MB-1 (house right)DFSD gaugeB-756-2
MB-P8/62BB-203 (TIC)
MB/P8-1 (New)BB-204 (TIC)
Table 2. Test data results of RNN–LSTM model.
Test Data SamplesMean Squared Error MSECorrelation Coefficient
4790.12490.9451
Table 3. Comparison of model’s performance evaluated.
Sr. No.TechniqueMSEMAEMAPE
1.SVM regression0.91240.18974.3245
2.GRU0.70550.58668.2234
3.Bi-LSTM0.51360.10642.8271
4.RNN–LSTM (proposed method)0.56030.07963.1469
Publisher’s Note: MDPI stays neutral with regard to jurisdictional claims in published maps and institutional affiliations.

