
Numerical Study of Knocking Combustion in a Heavy-Duty Engine under Plateau Conditions

 ,
,
Abstract
:1. Introduction
2. Experimental Methods
3. Numerical Methodology
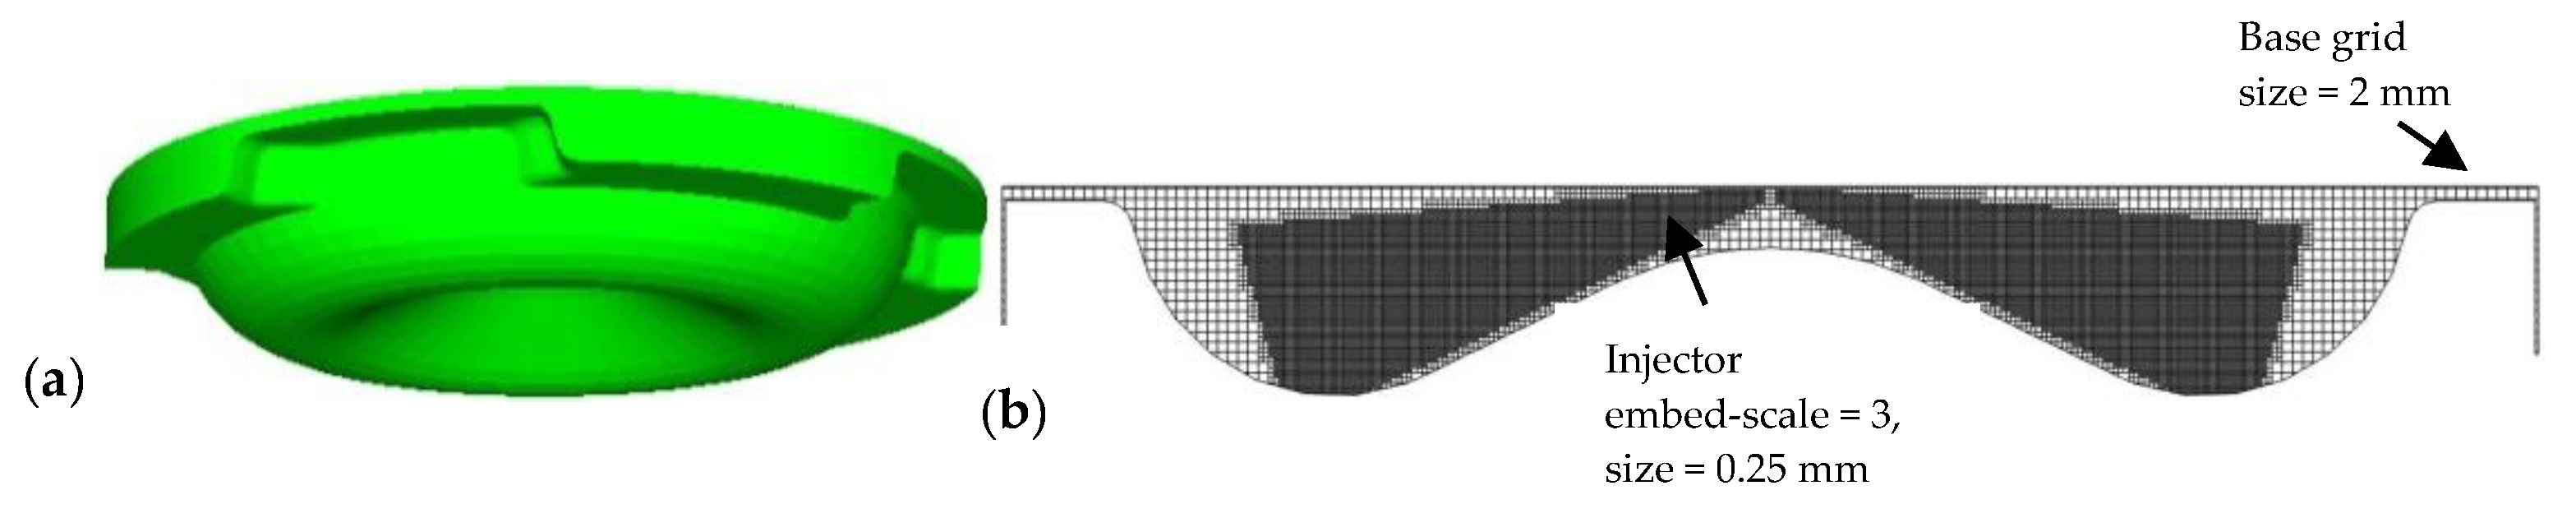
4. Numerical Model Setup
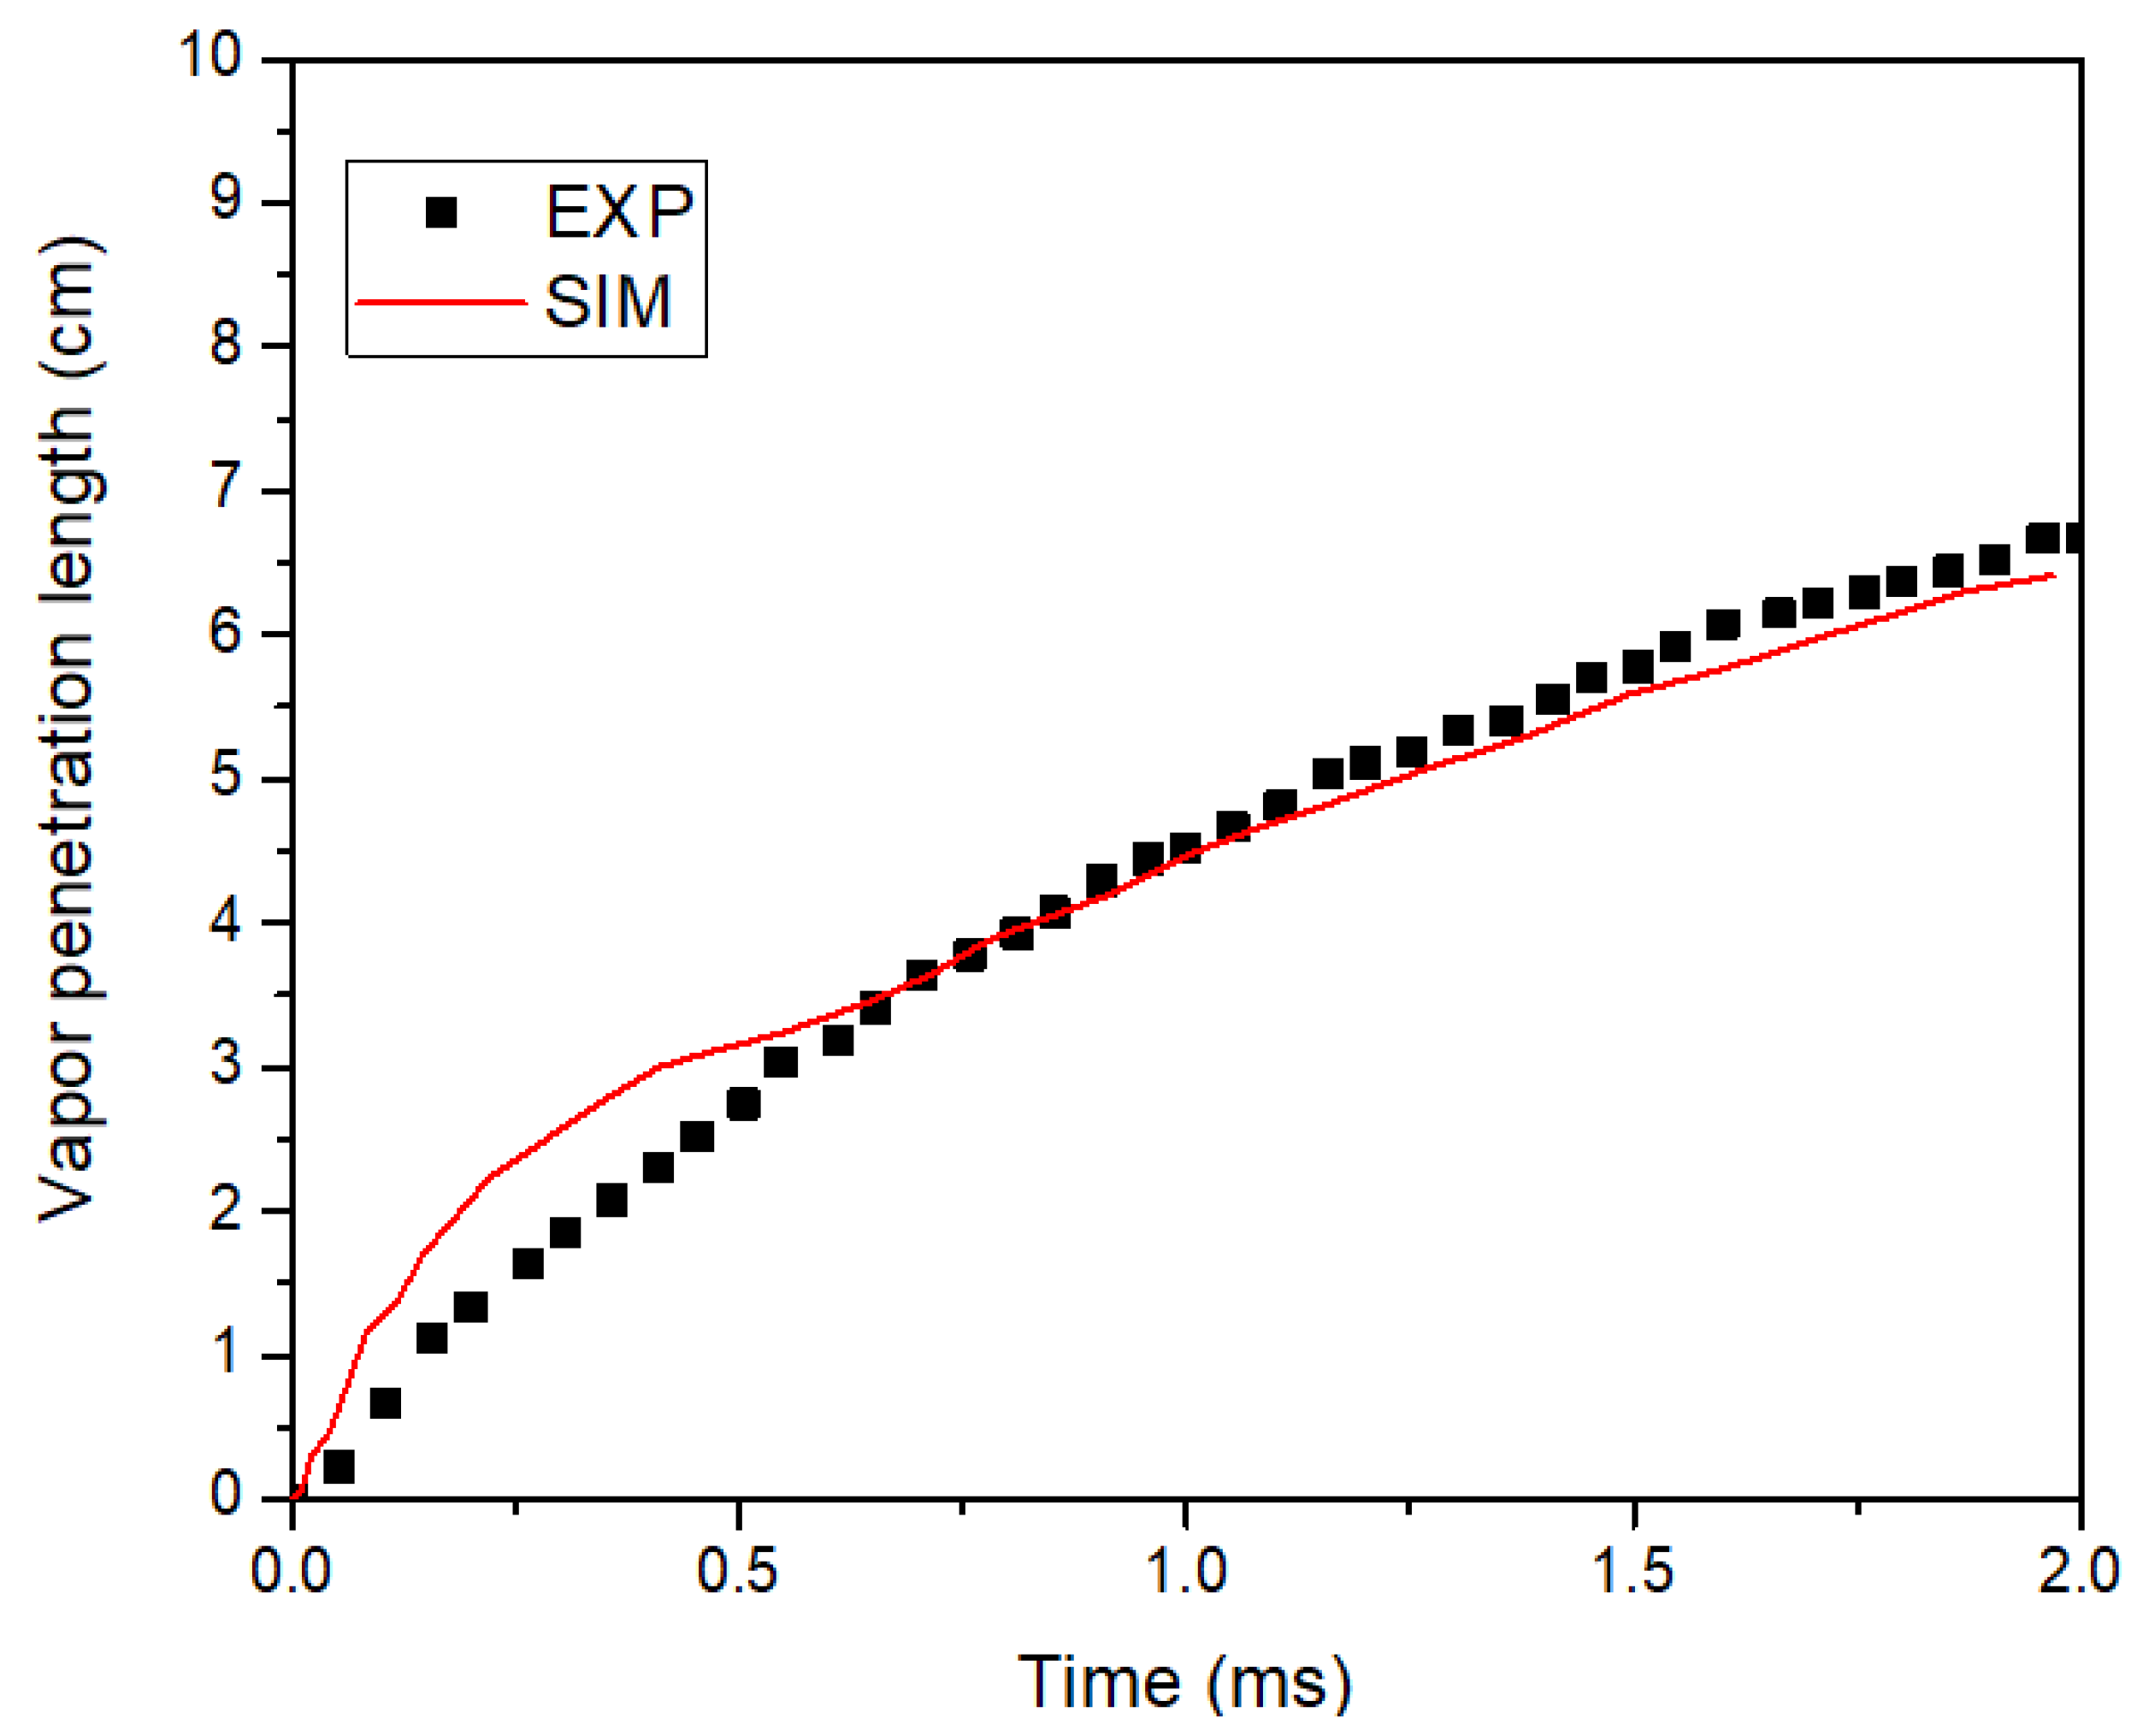
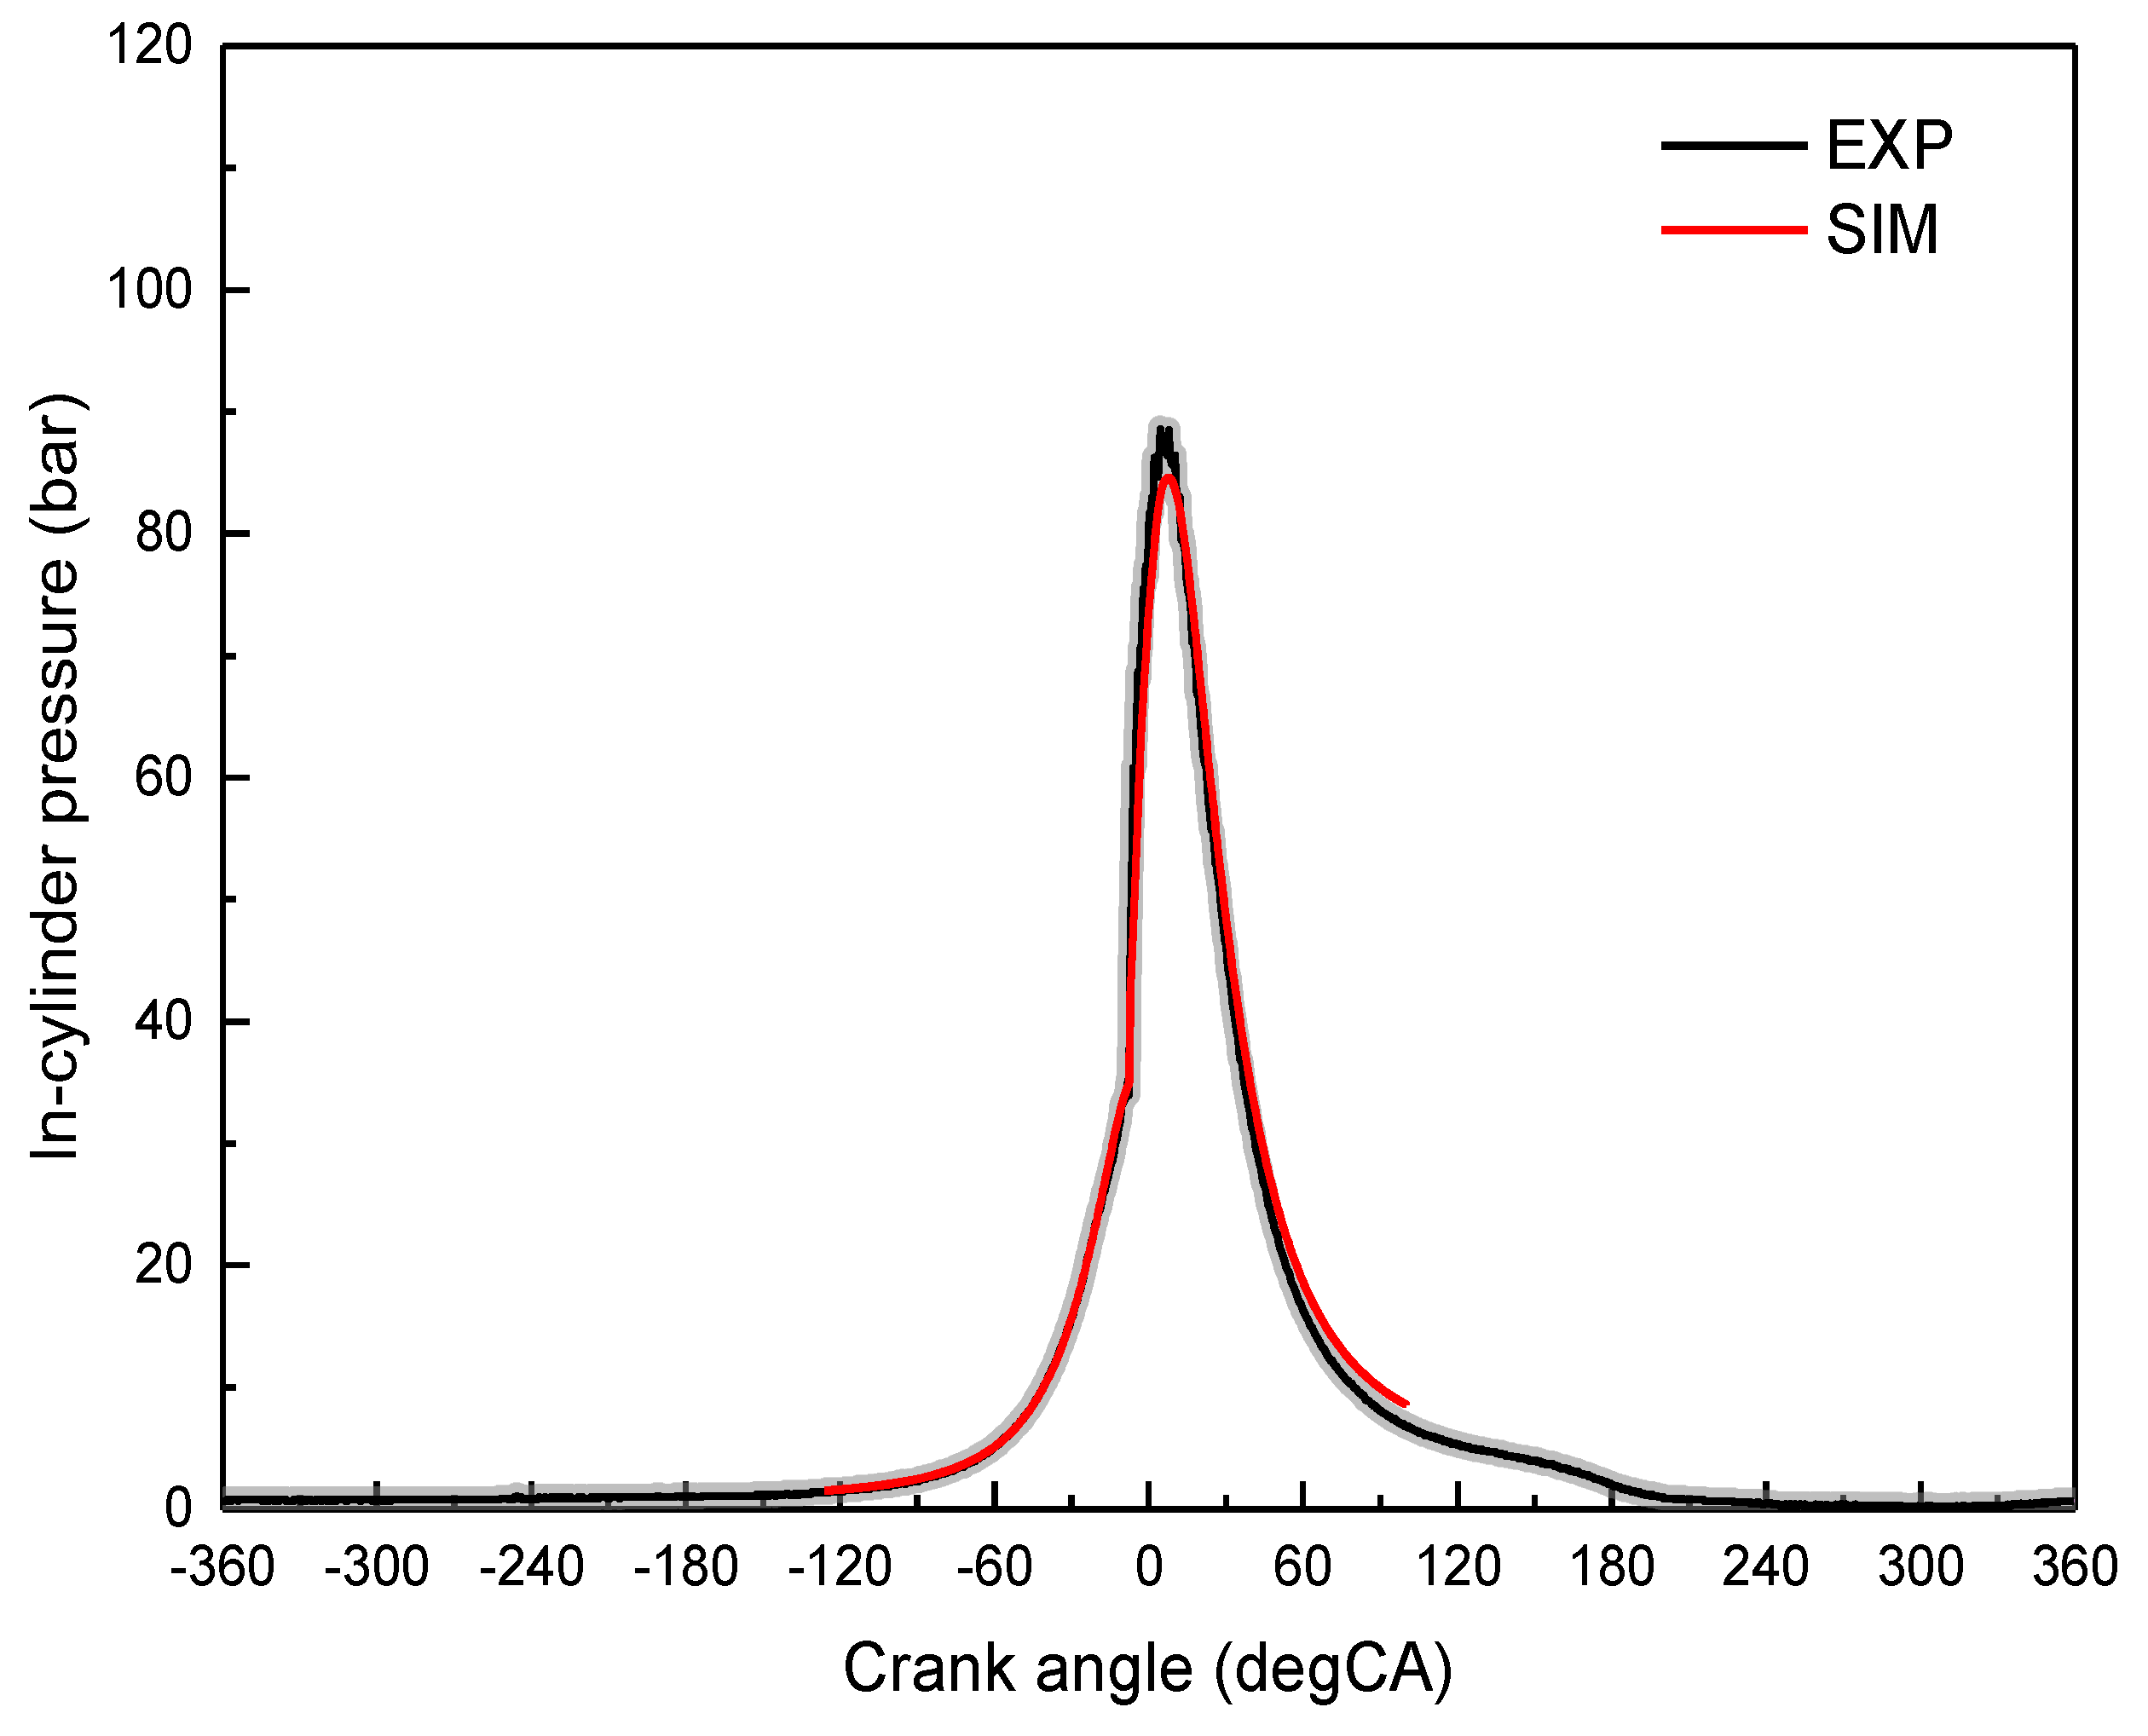
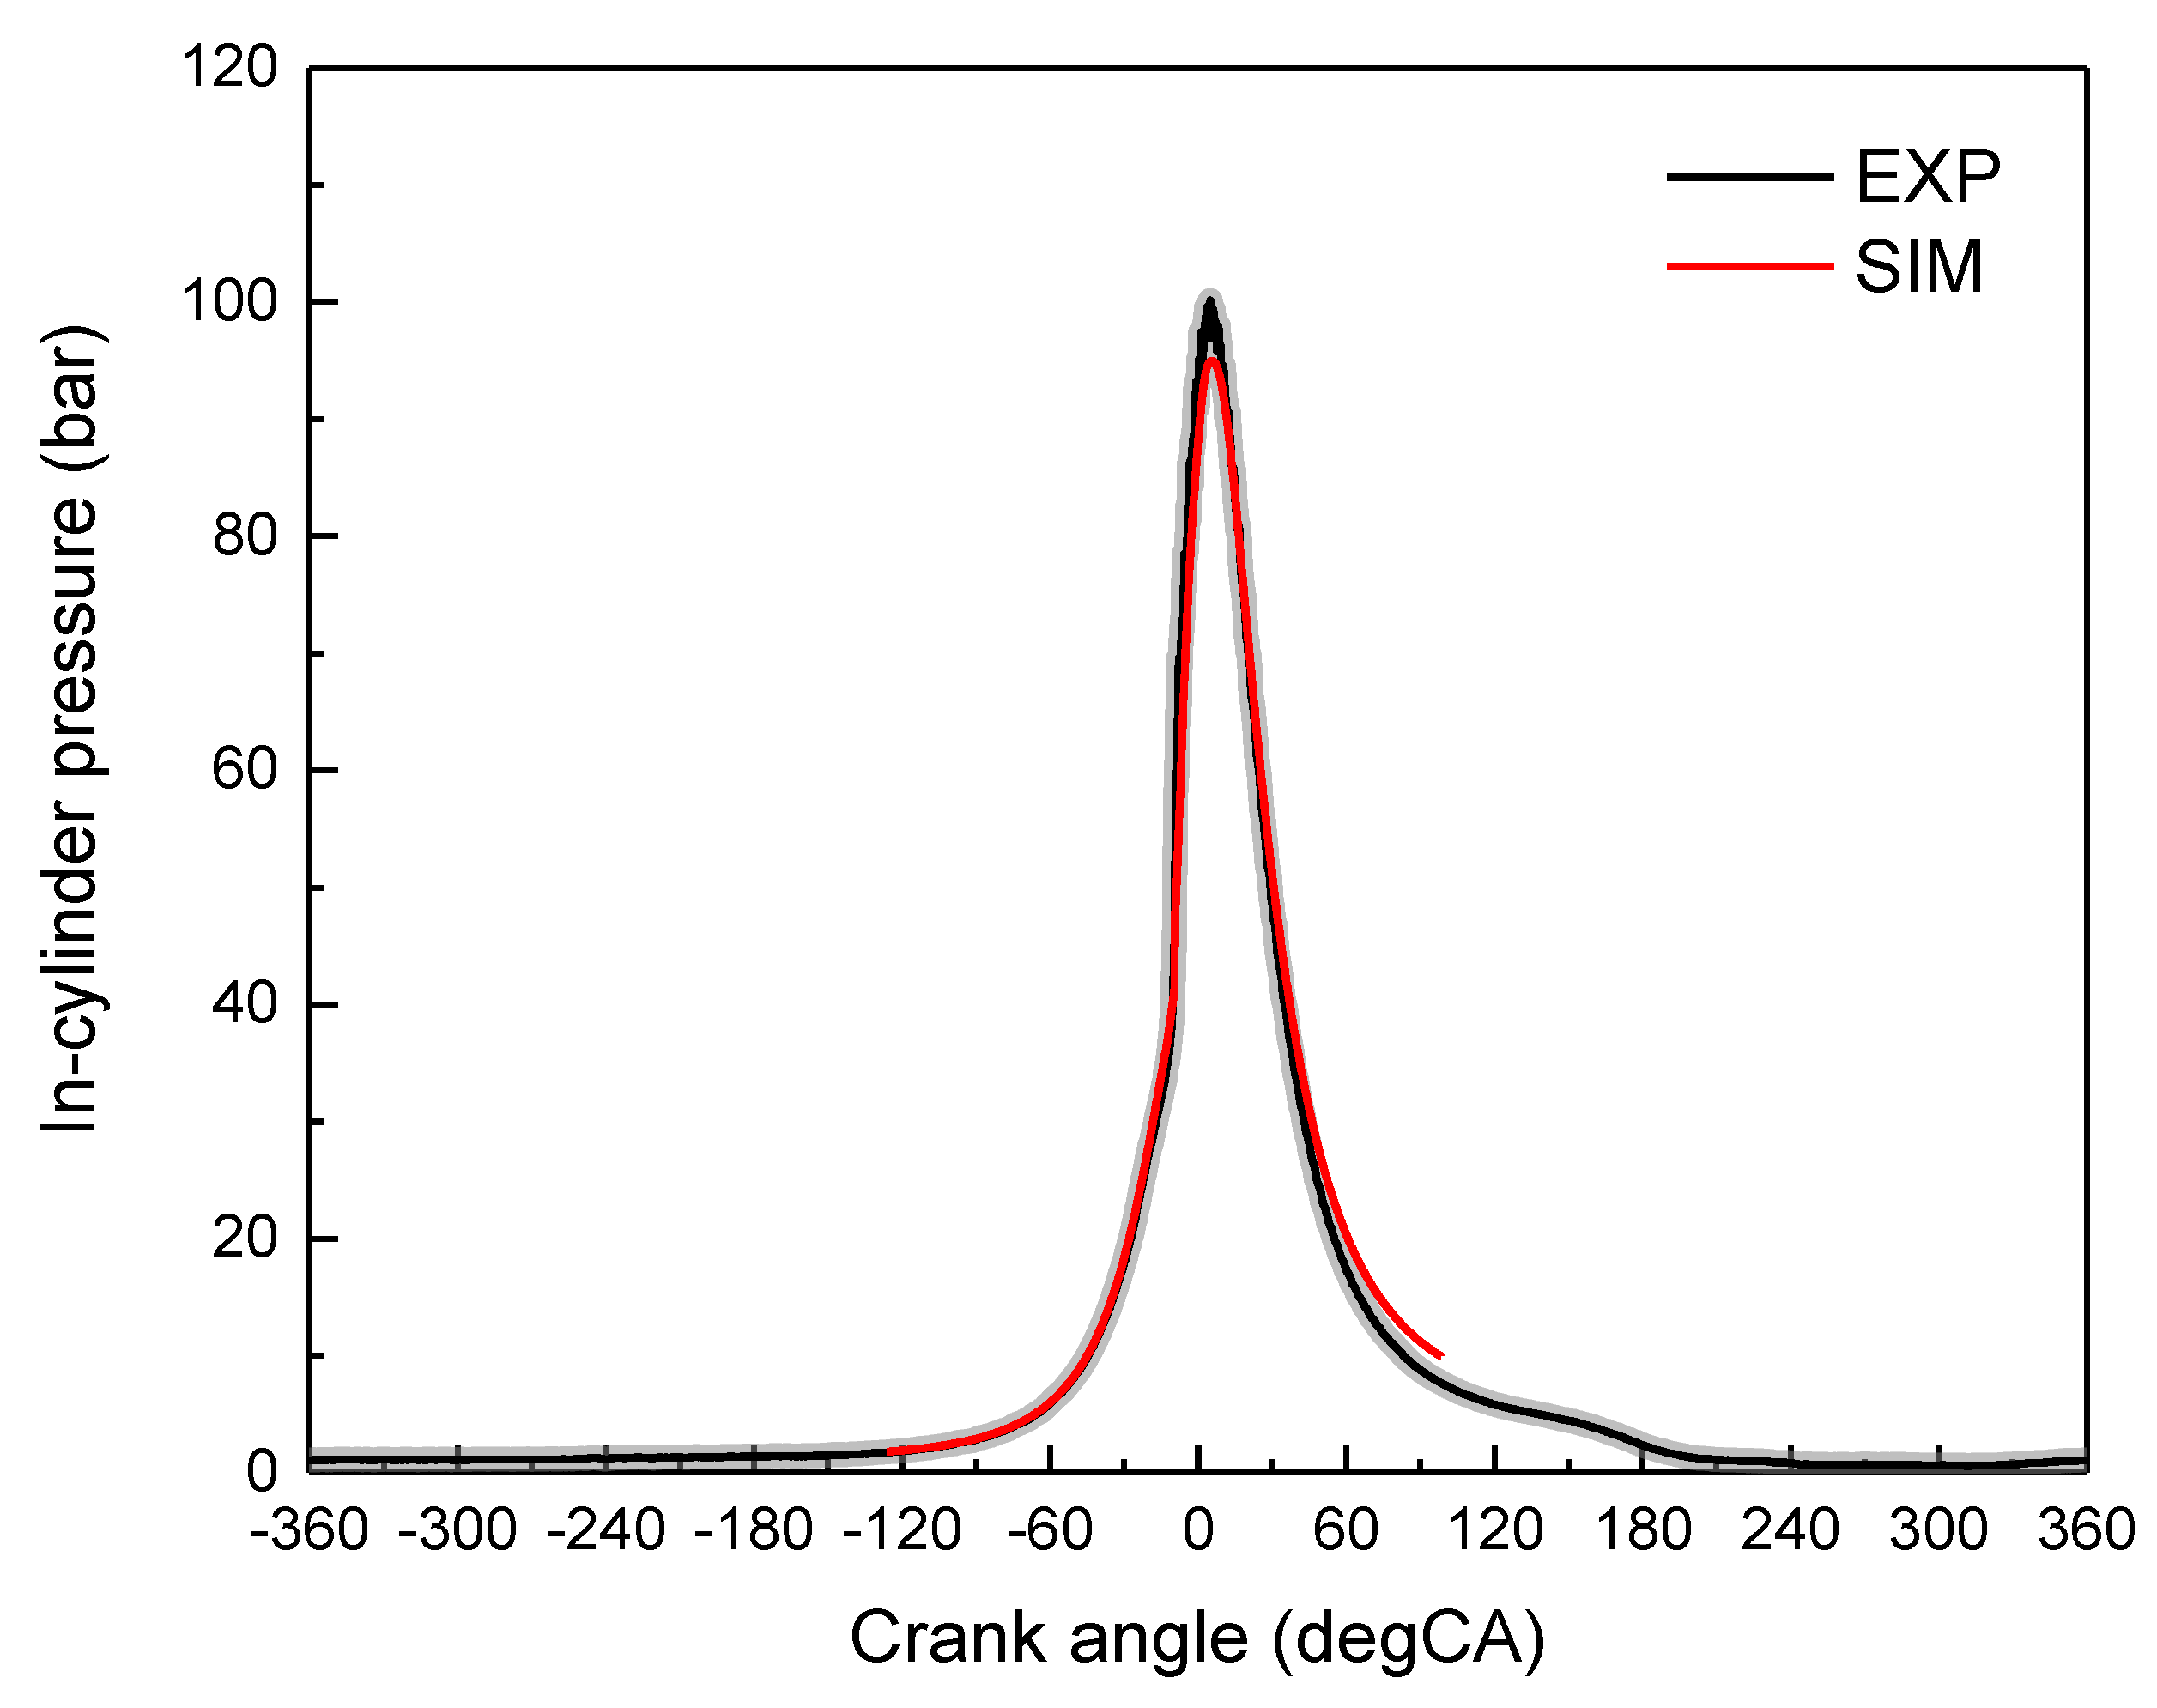
5. Validation of Numerical Modeling
6. Numerical Results and Discussions
7. Conclusions
- 1.
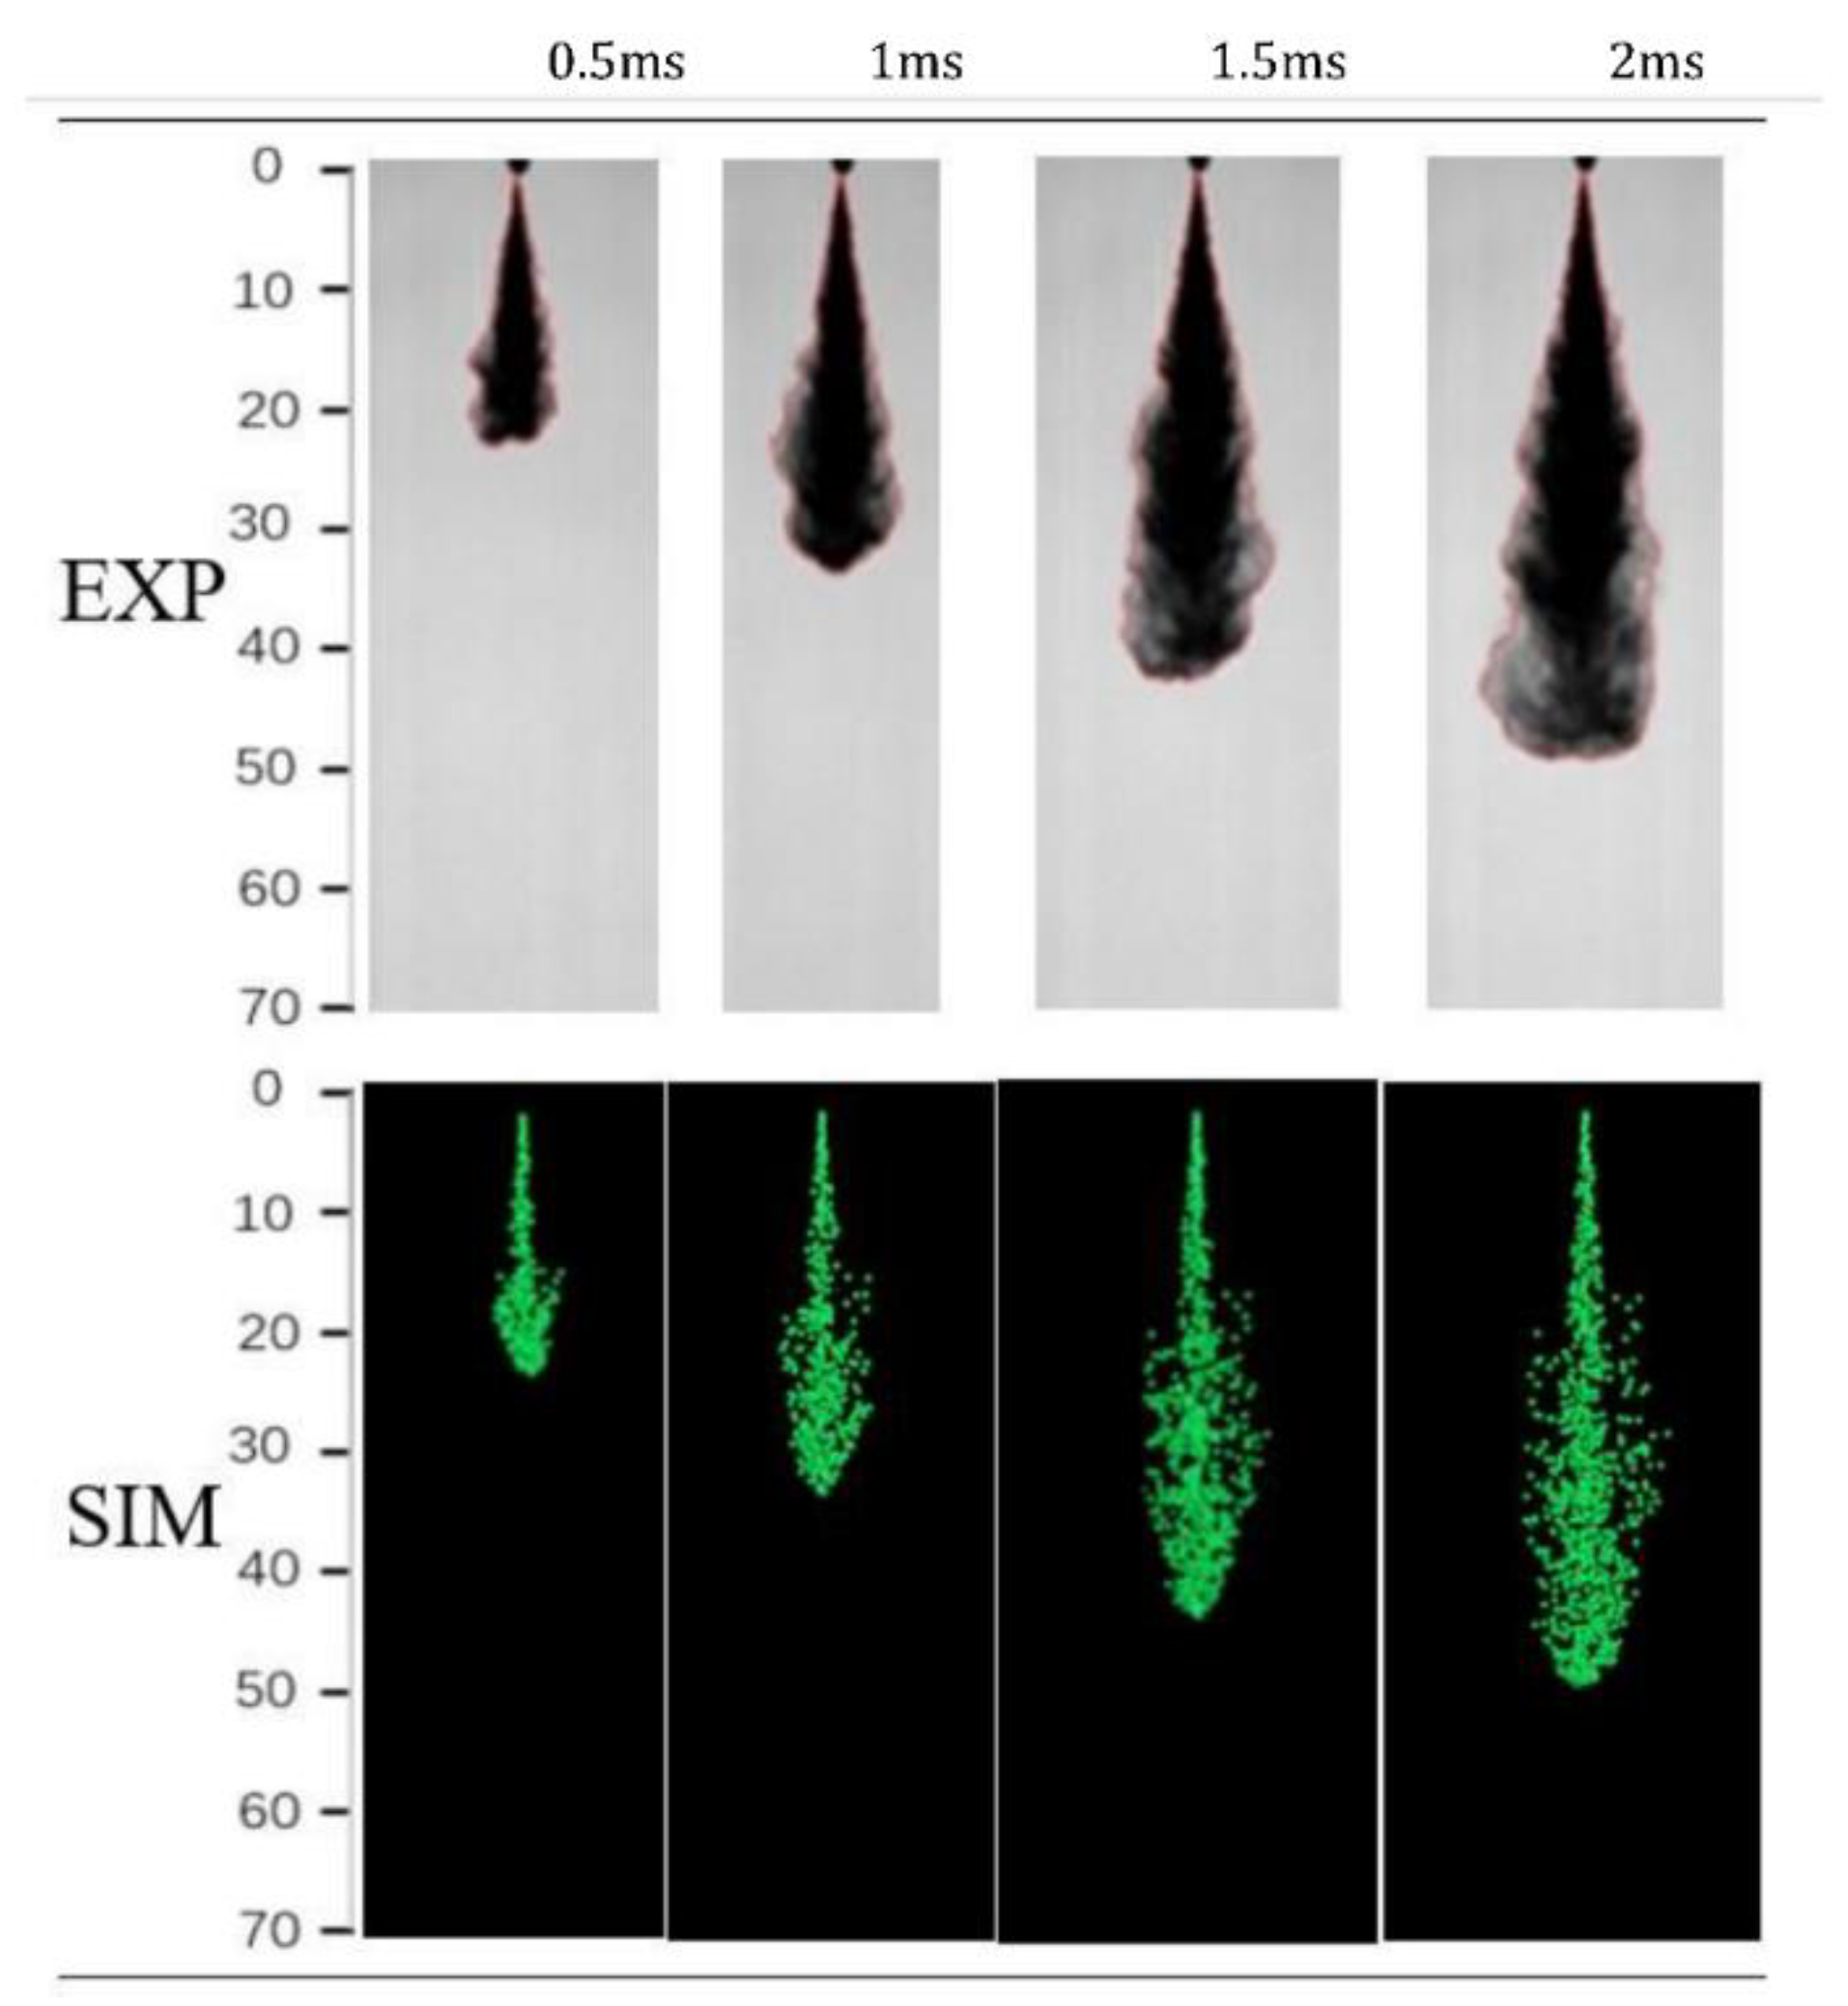
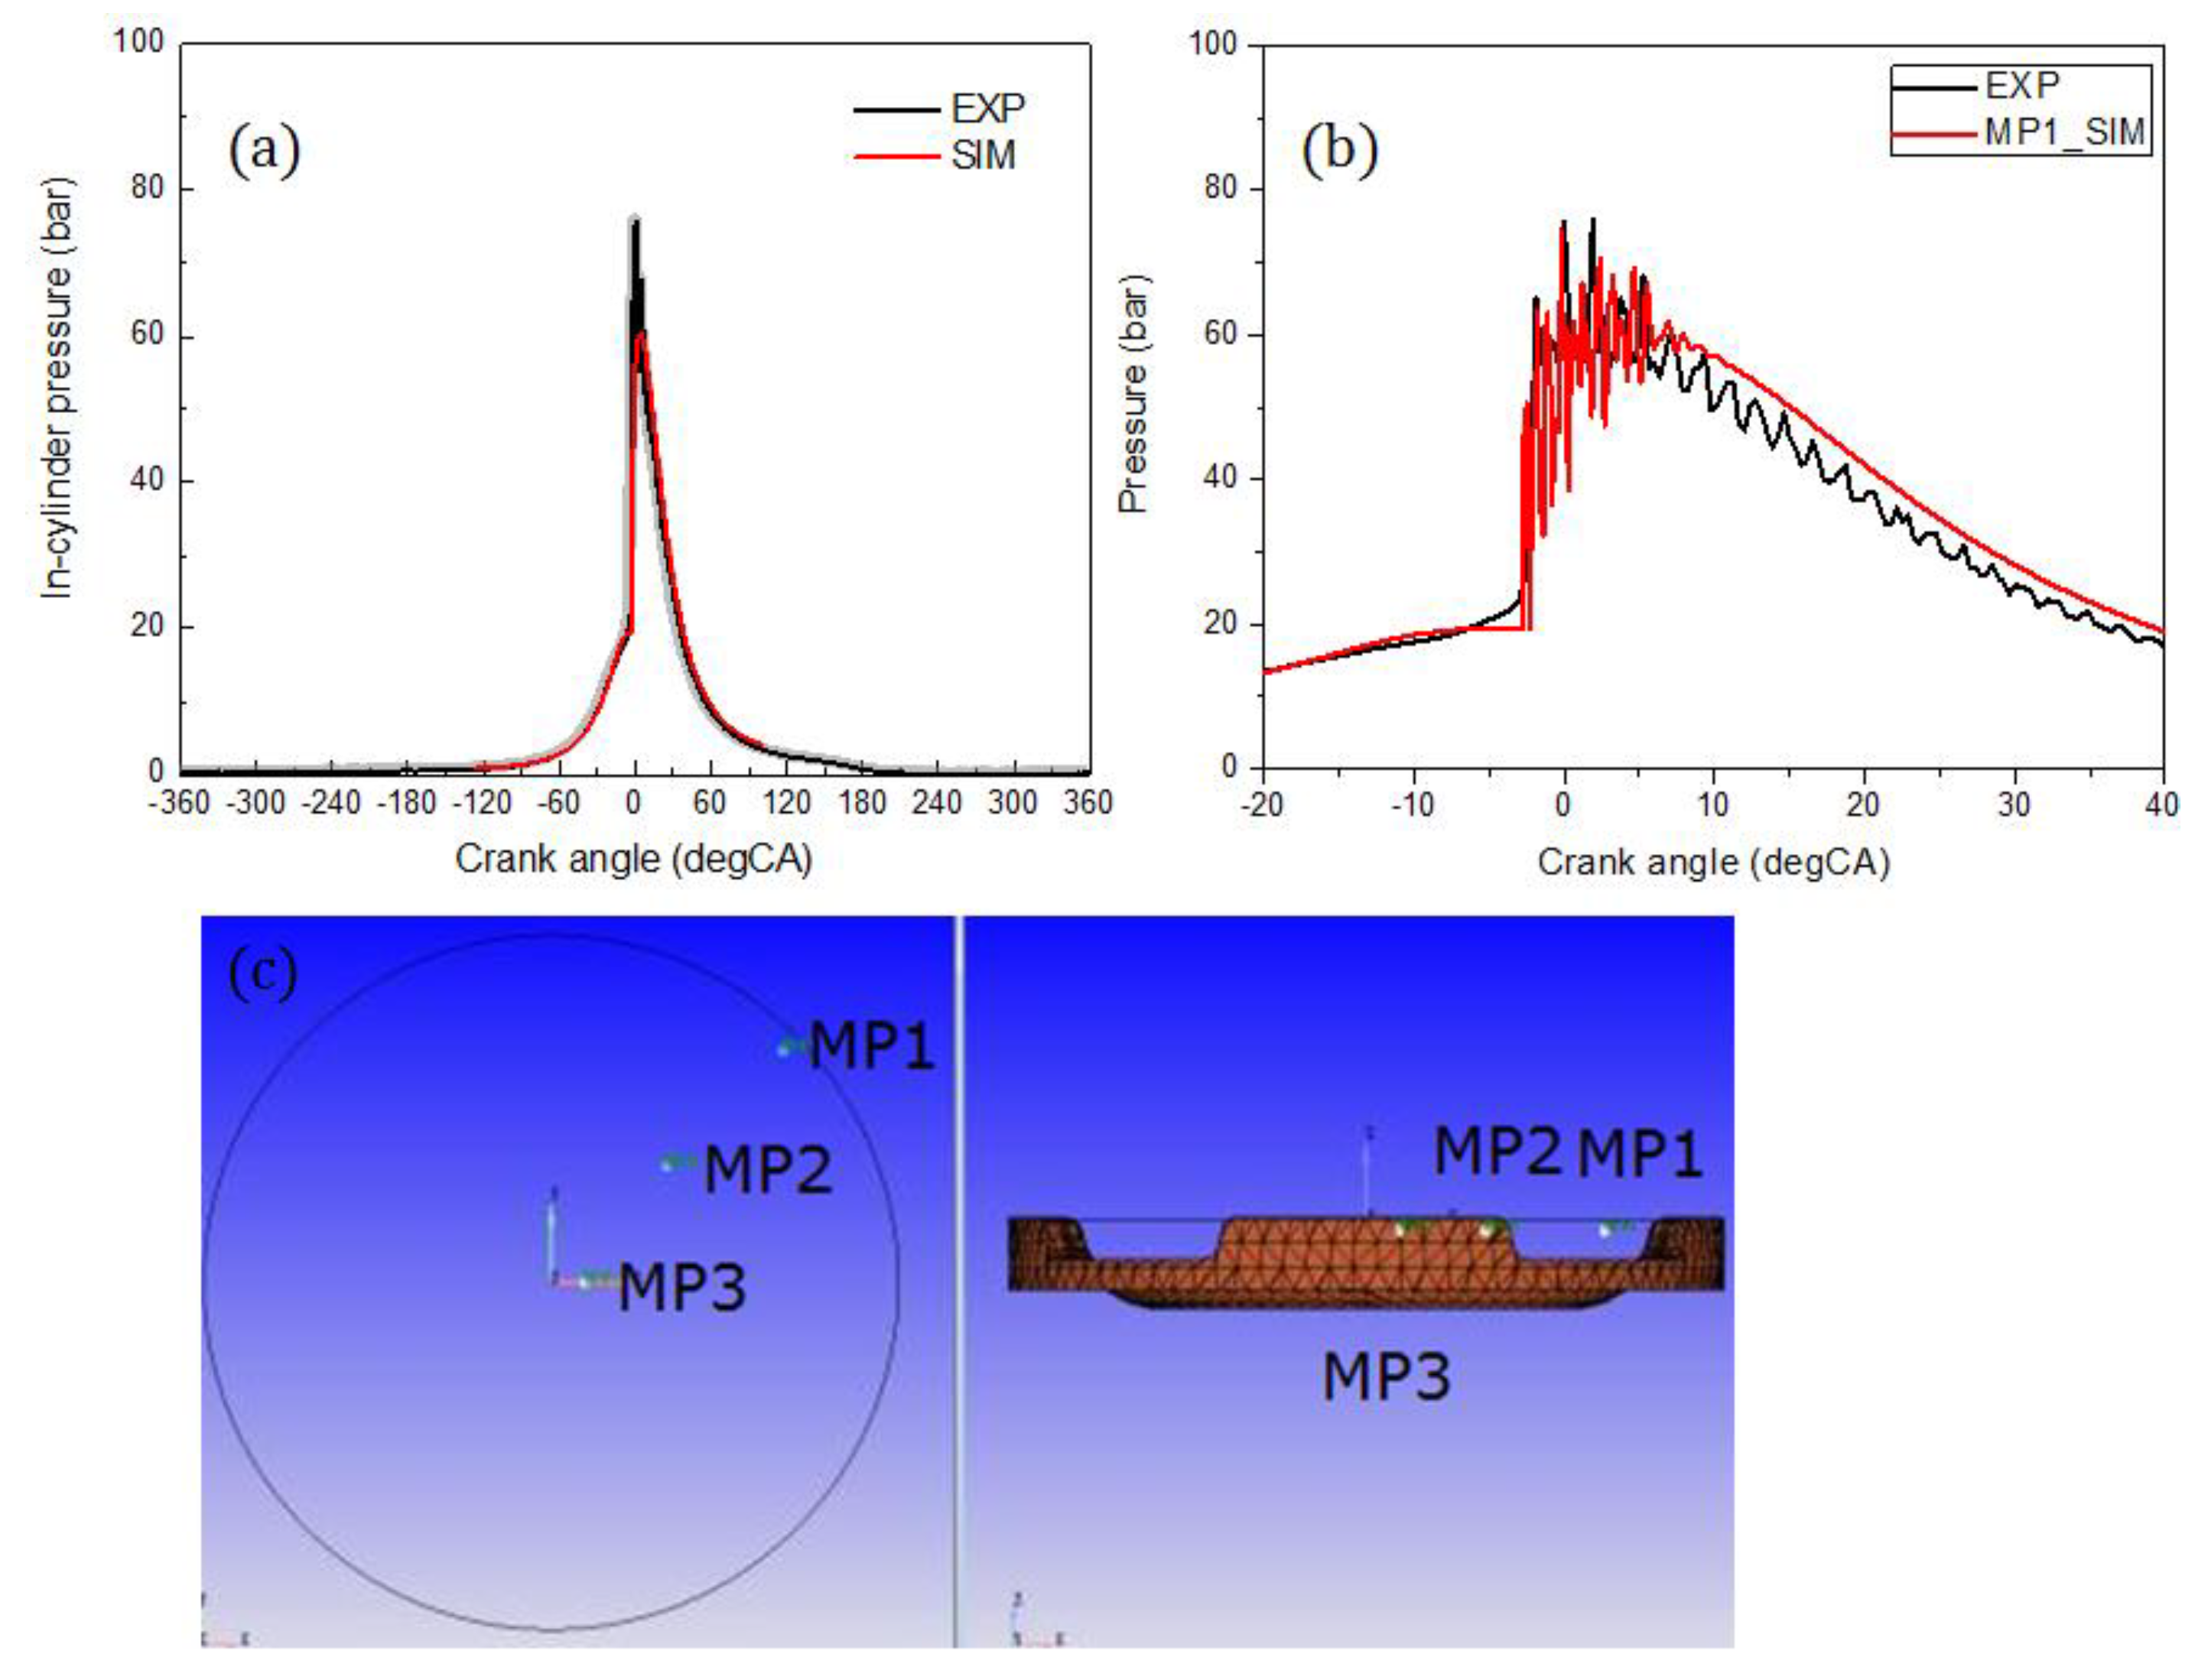
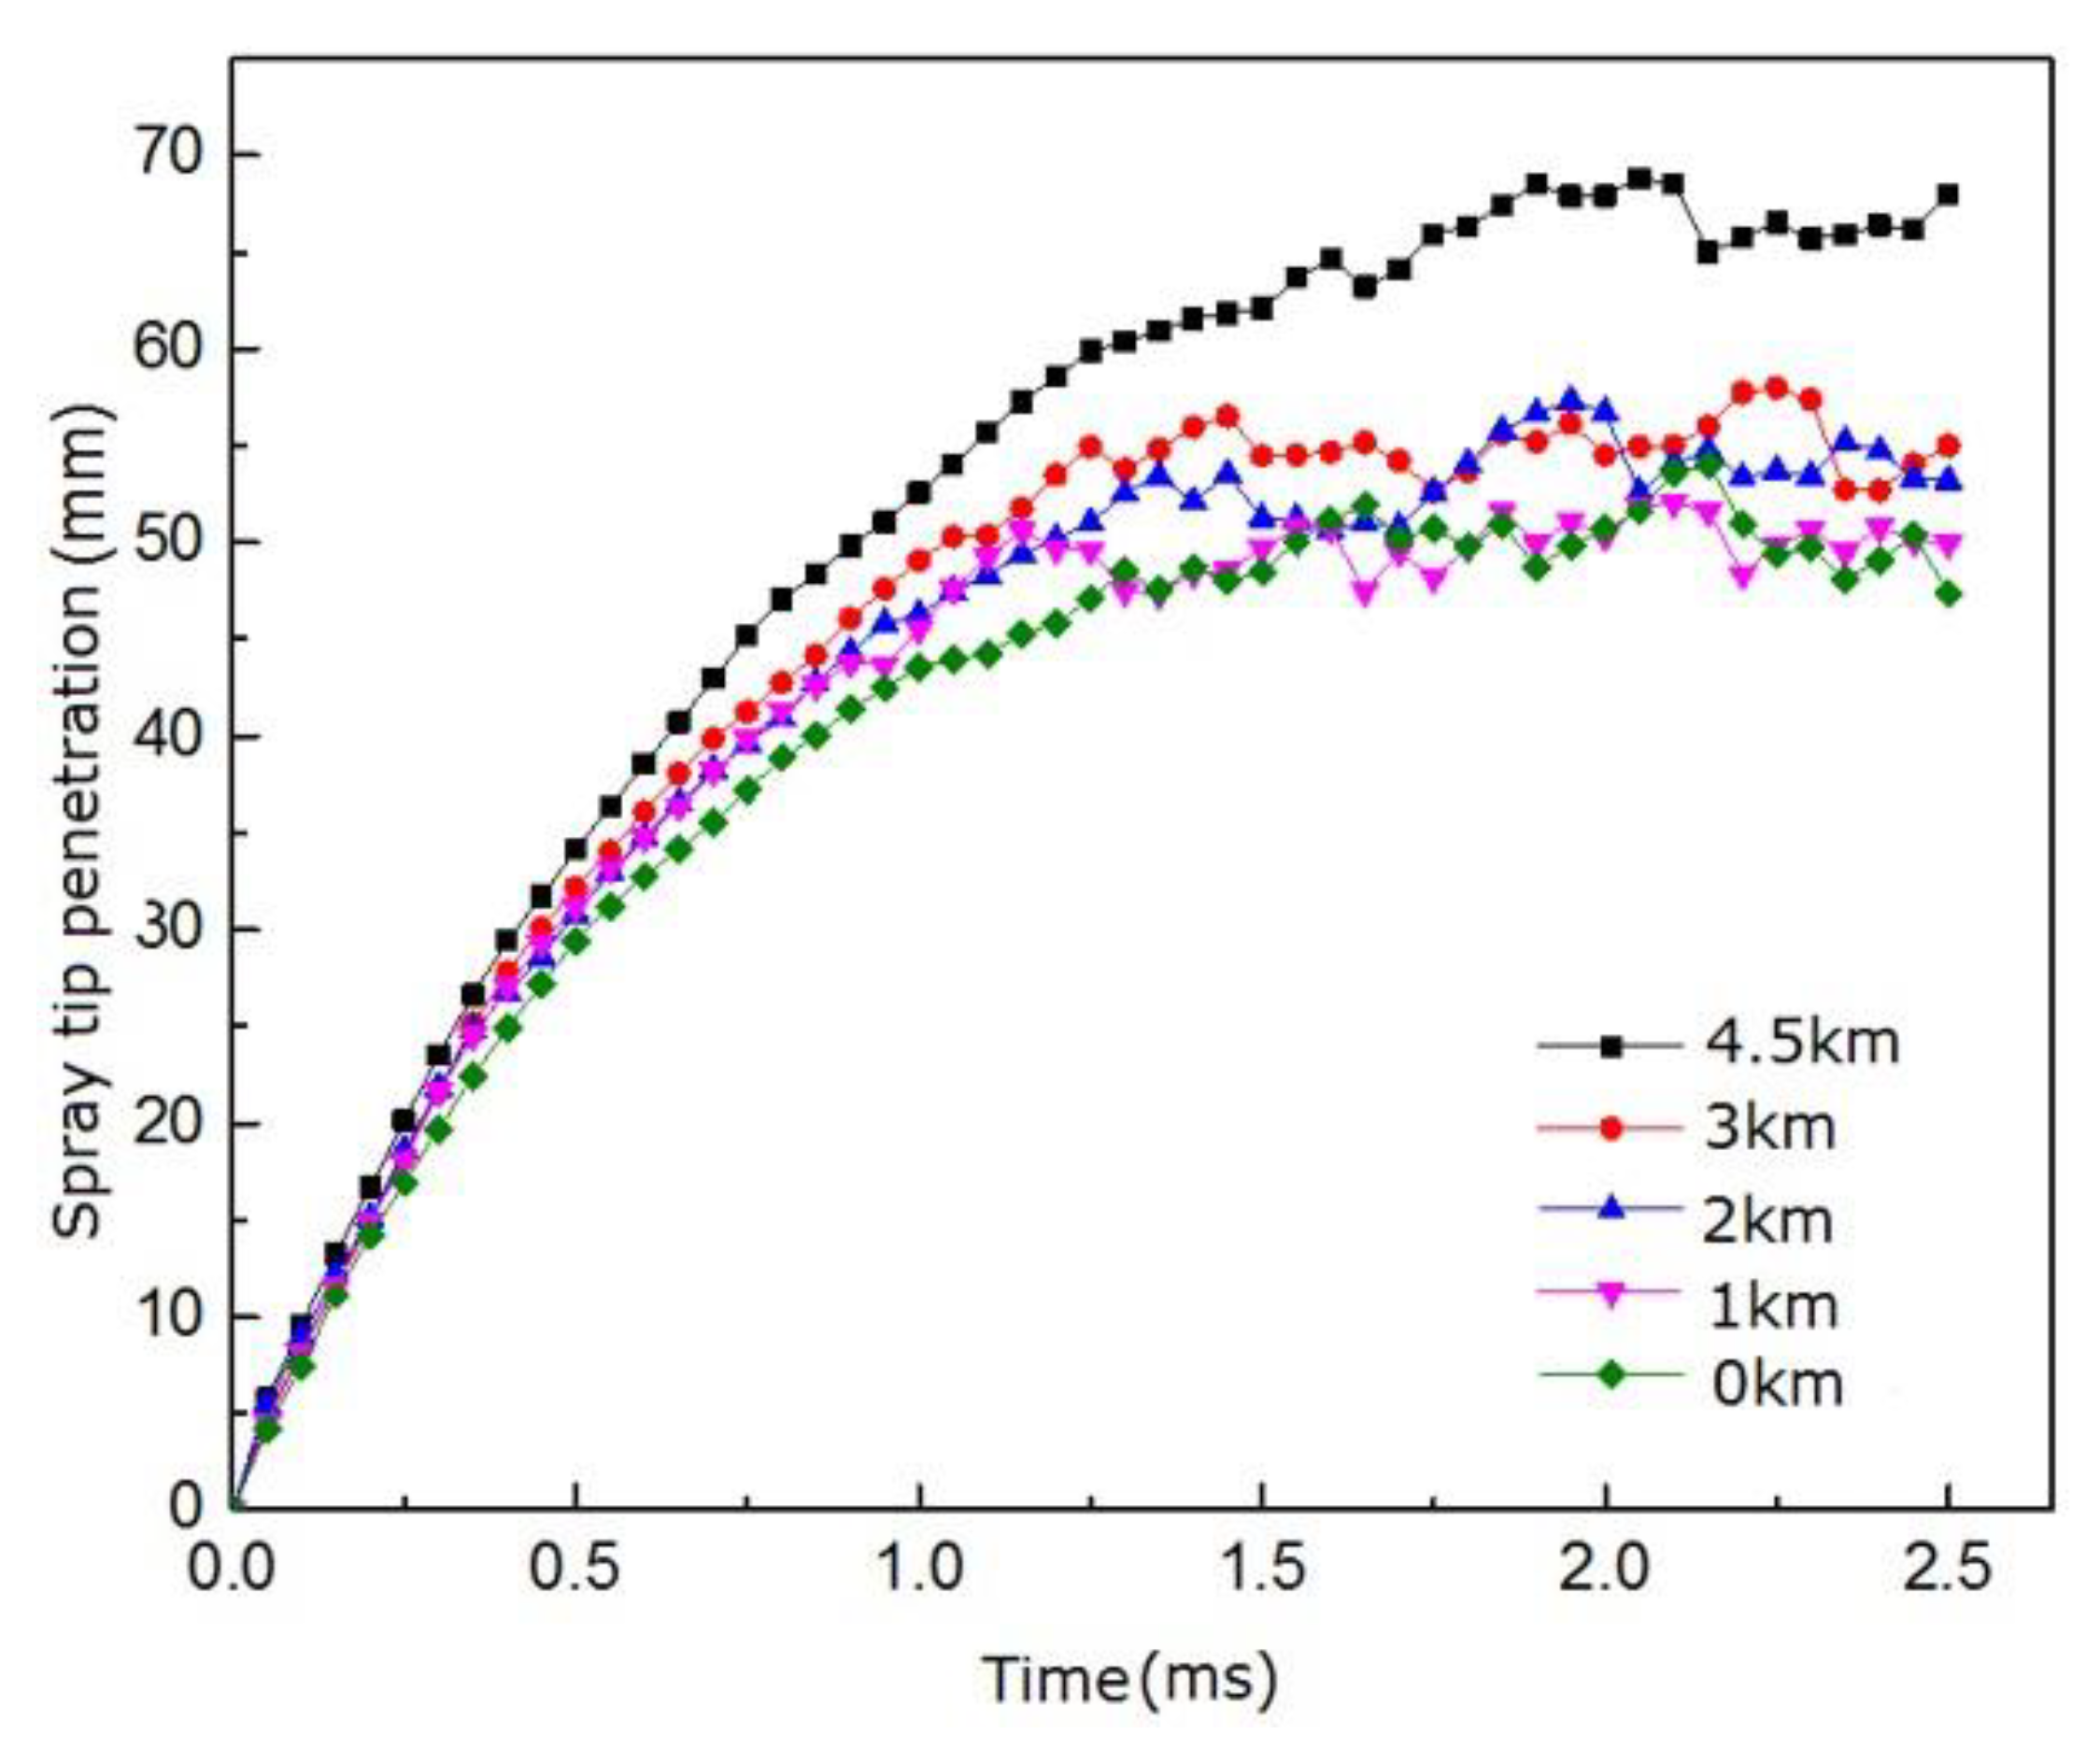
- A numerical model was validated with the optical data of spray behavior and the pressure trace measured by a test bench.
- 2.
- Long ignition delay, rapid premixed and low combustion efficiency were observed under the condition of knocking combustion.
- i.
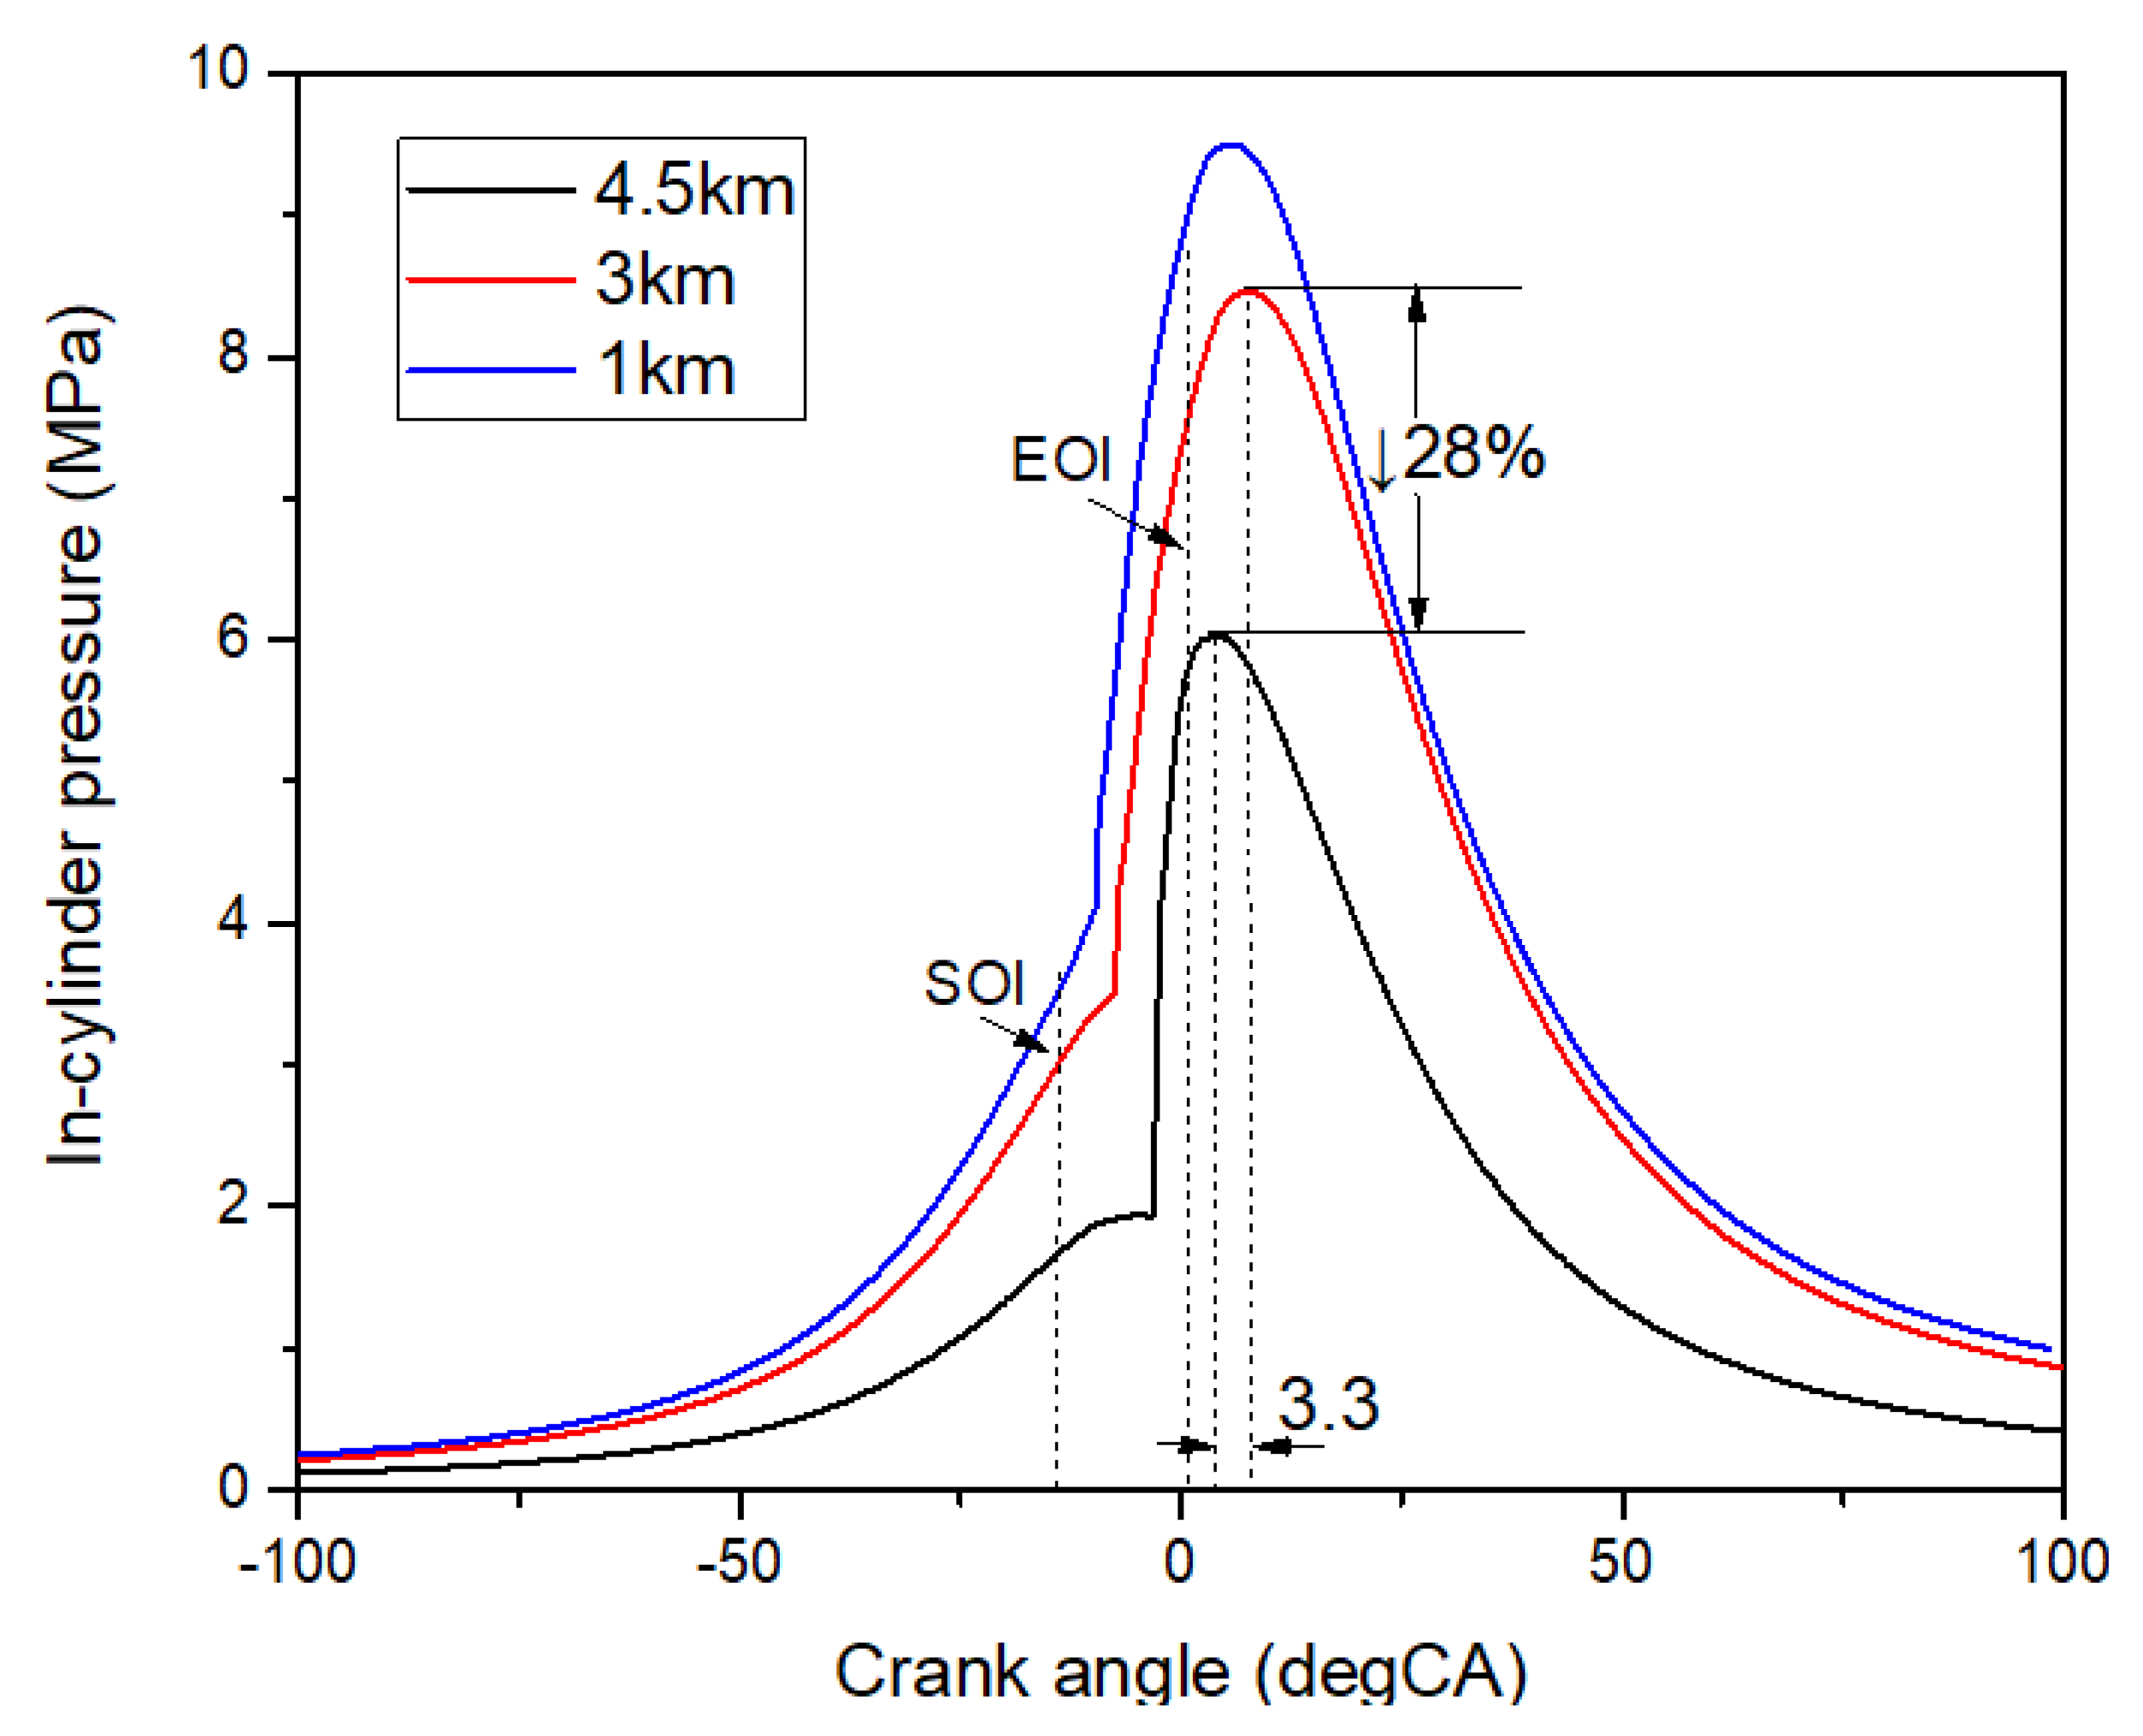
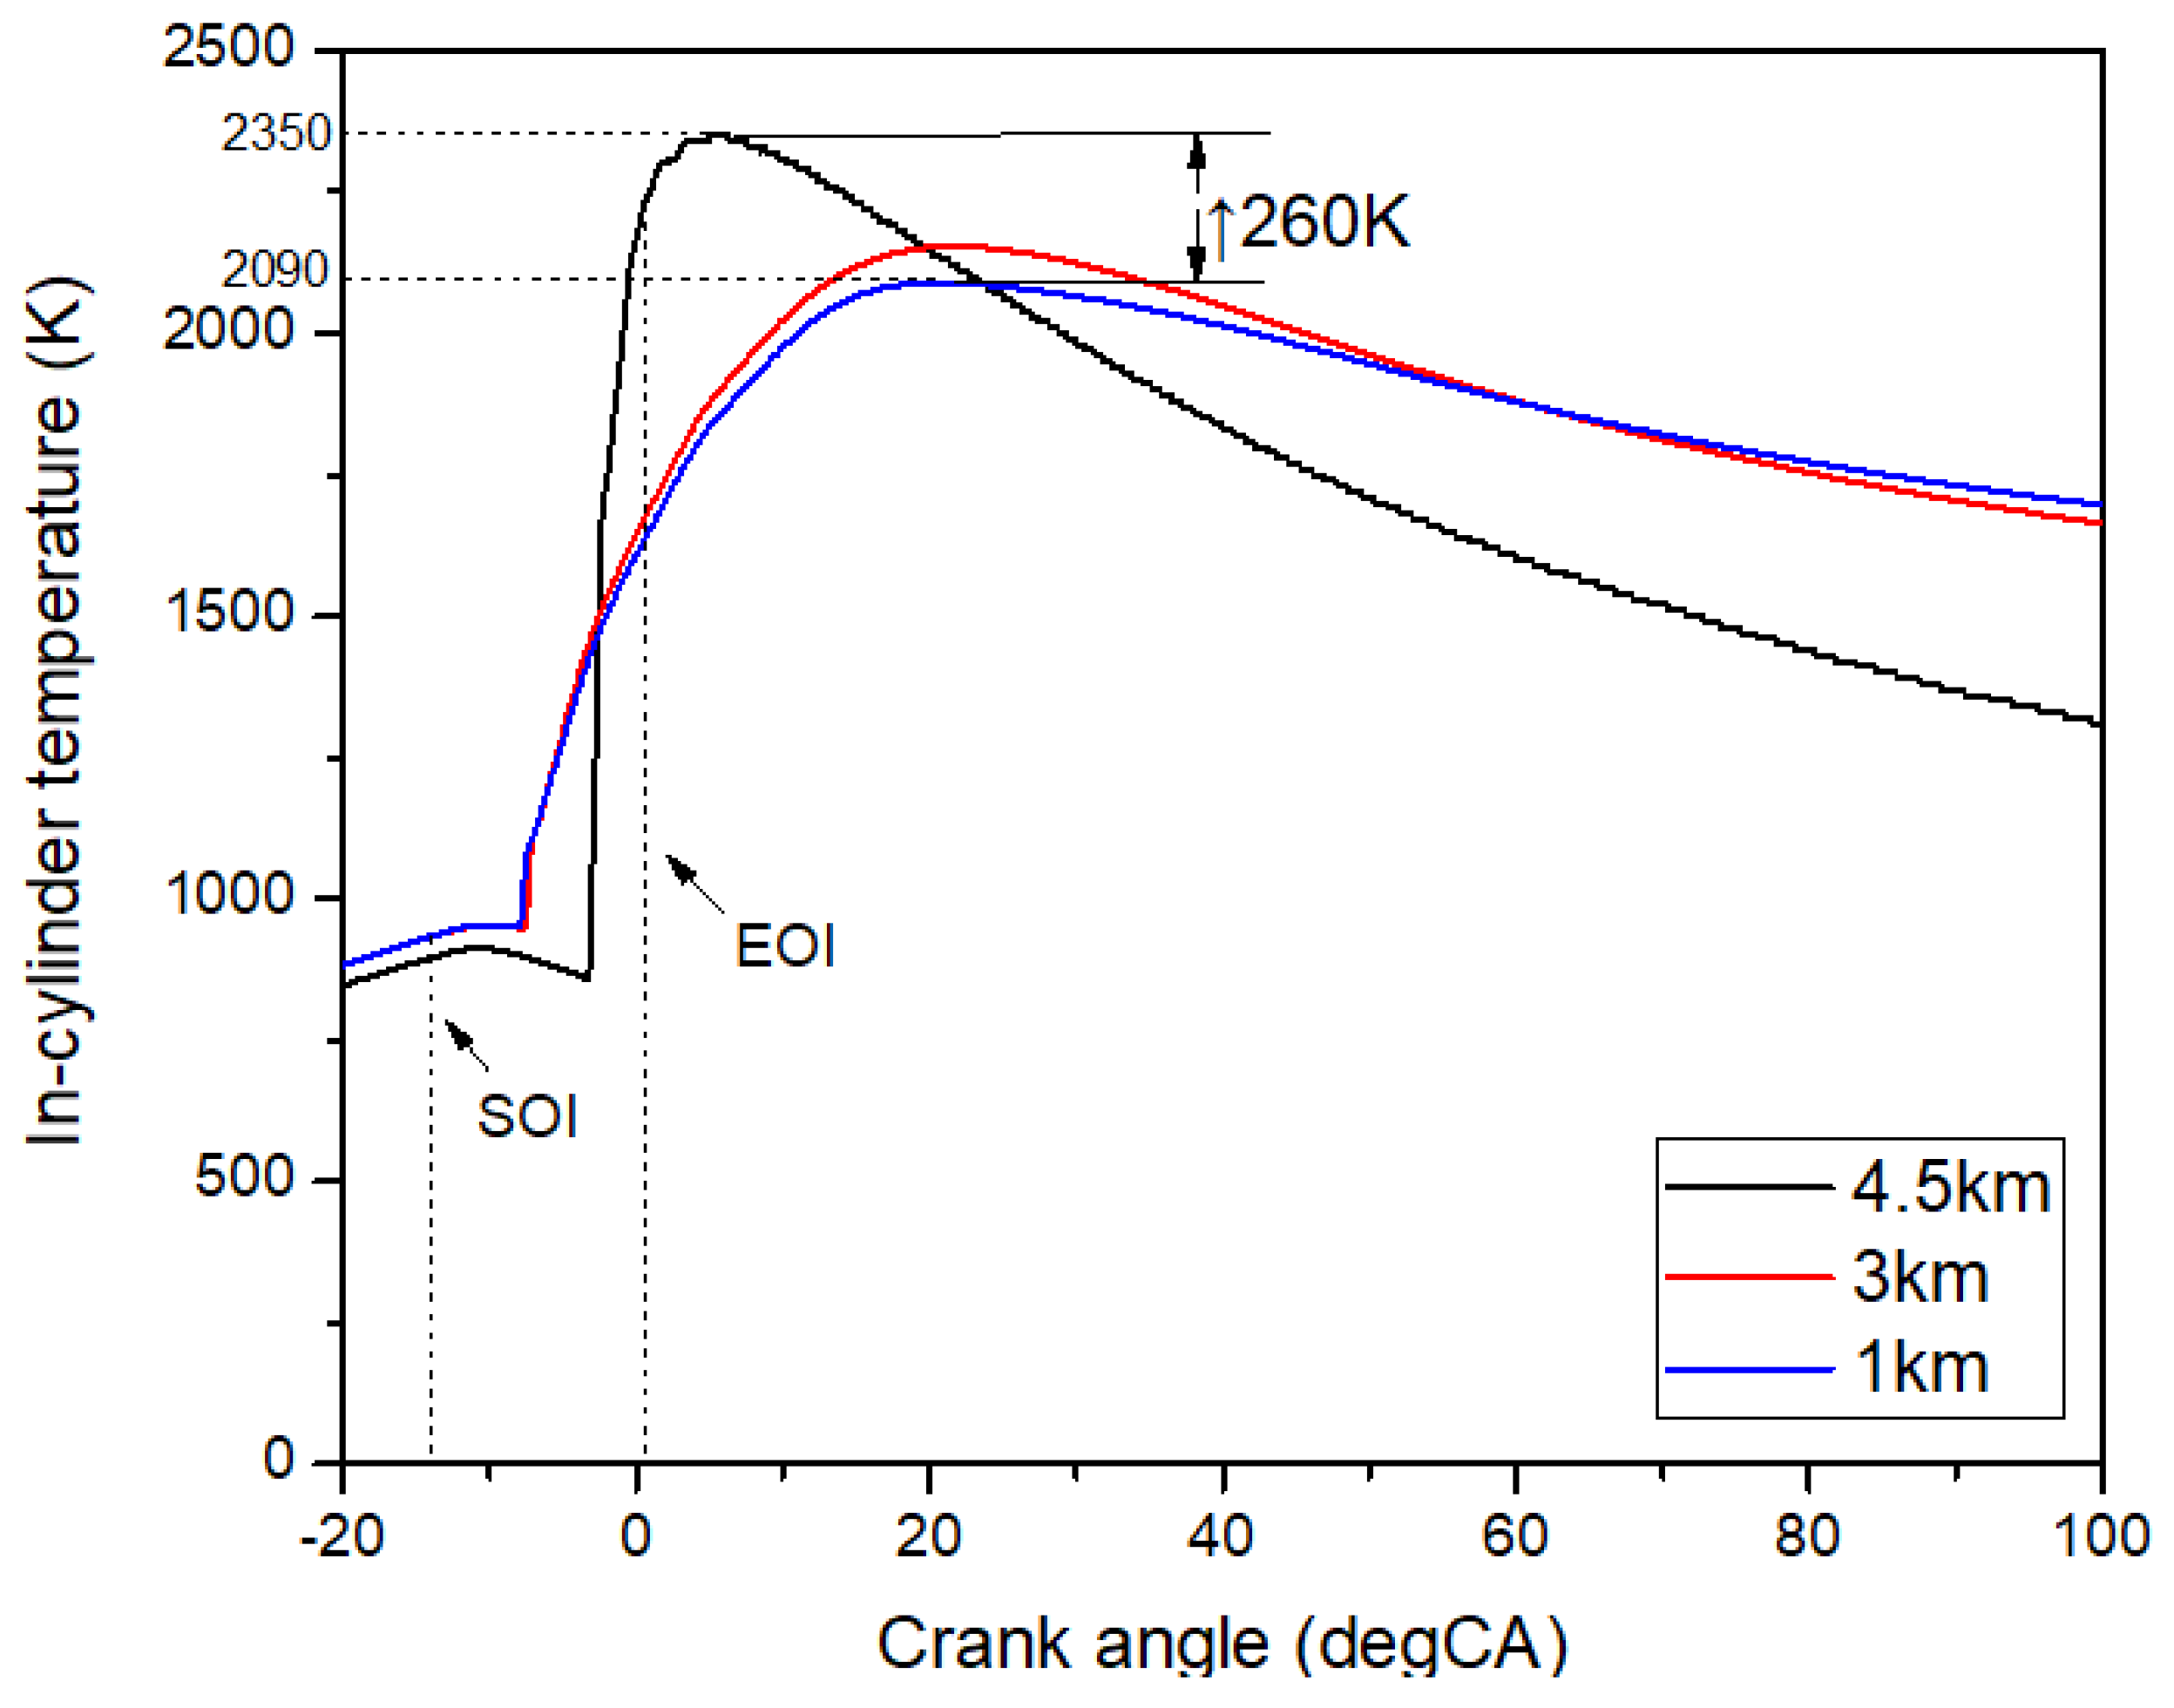
- The decreases in compression pressure and temperature at 4.5 km led to over 4 °CA longer ignition delays than those at 1 and 3 km.
- ii.
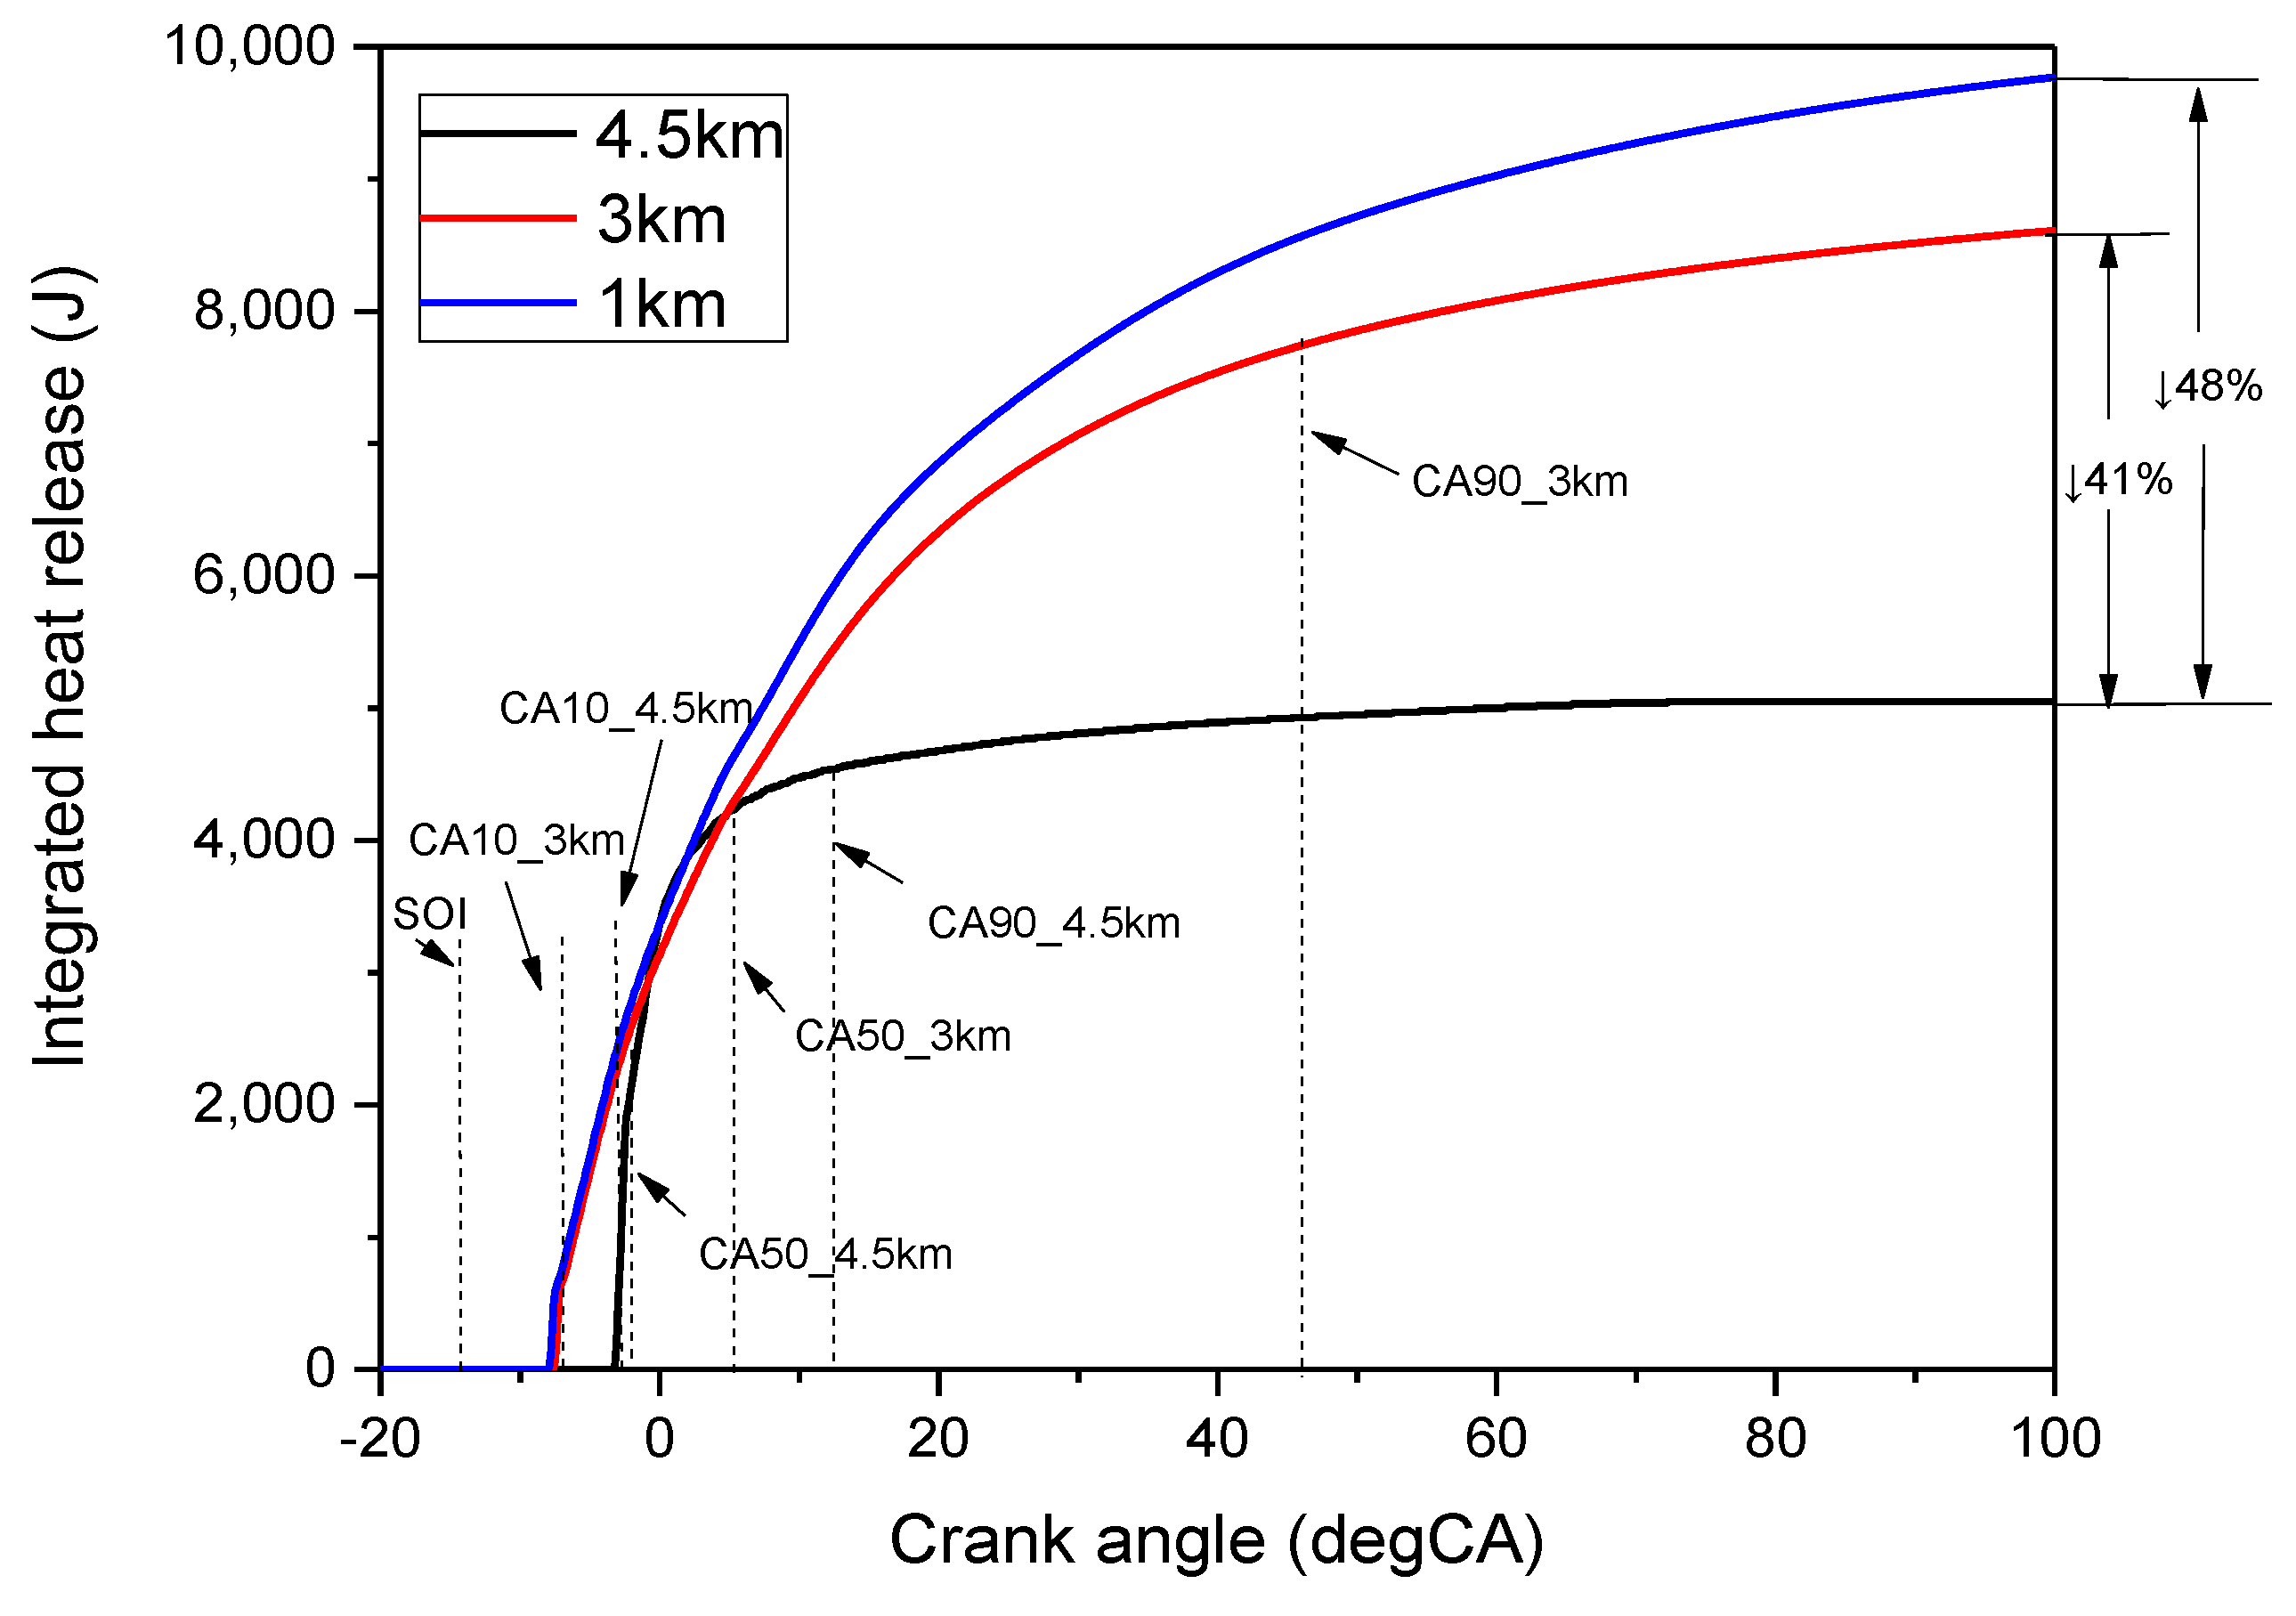
- The main combustion durations from CA10 to CA90 at 1, 3, and 4 km were 59.9, 53.5, and 15.8 °CA, respectively, and the durations from CA10 to CA50 were 14.4, 12.6, and 1.6 °CA. Thus, compared to typical diffusion combustion at 1 and 3 km, premixed combustion dominated at 4.5 km.
- iii.
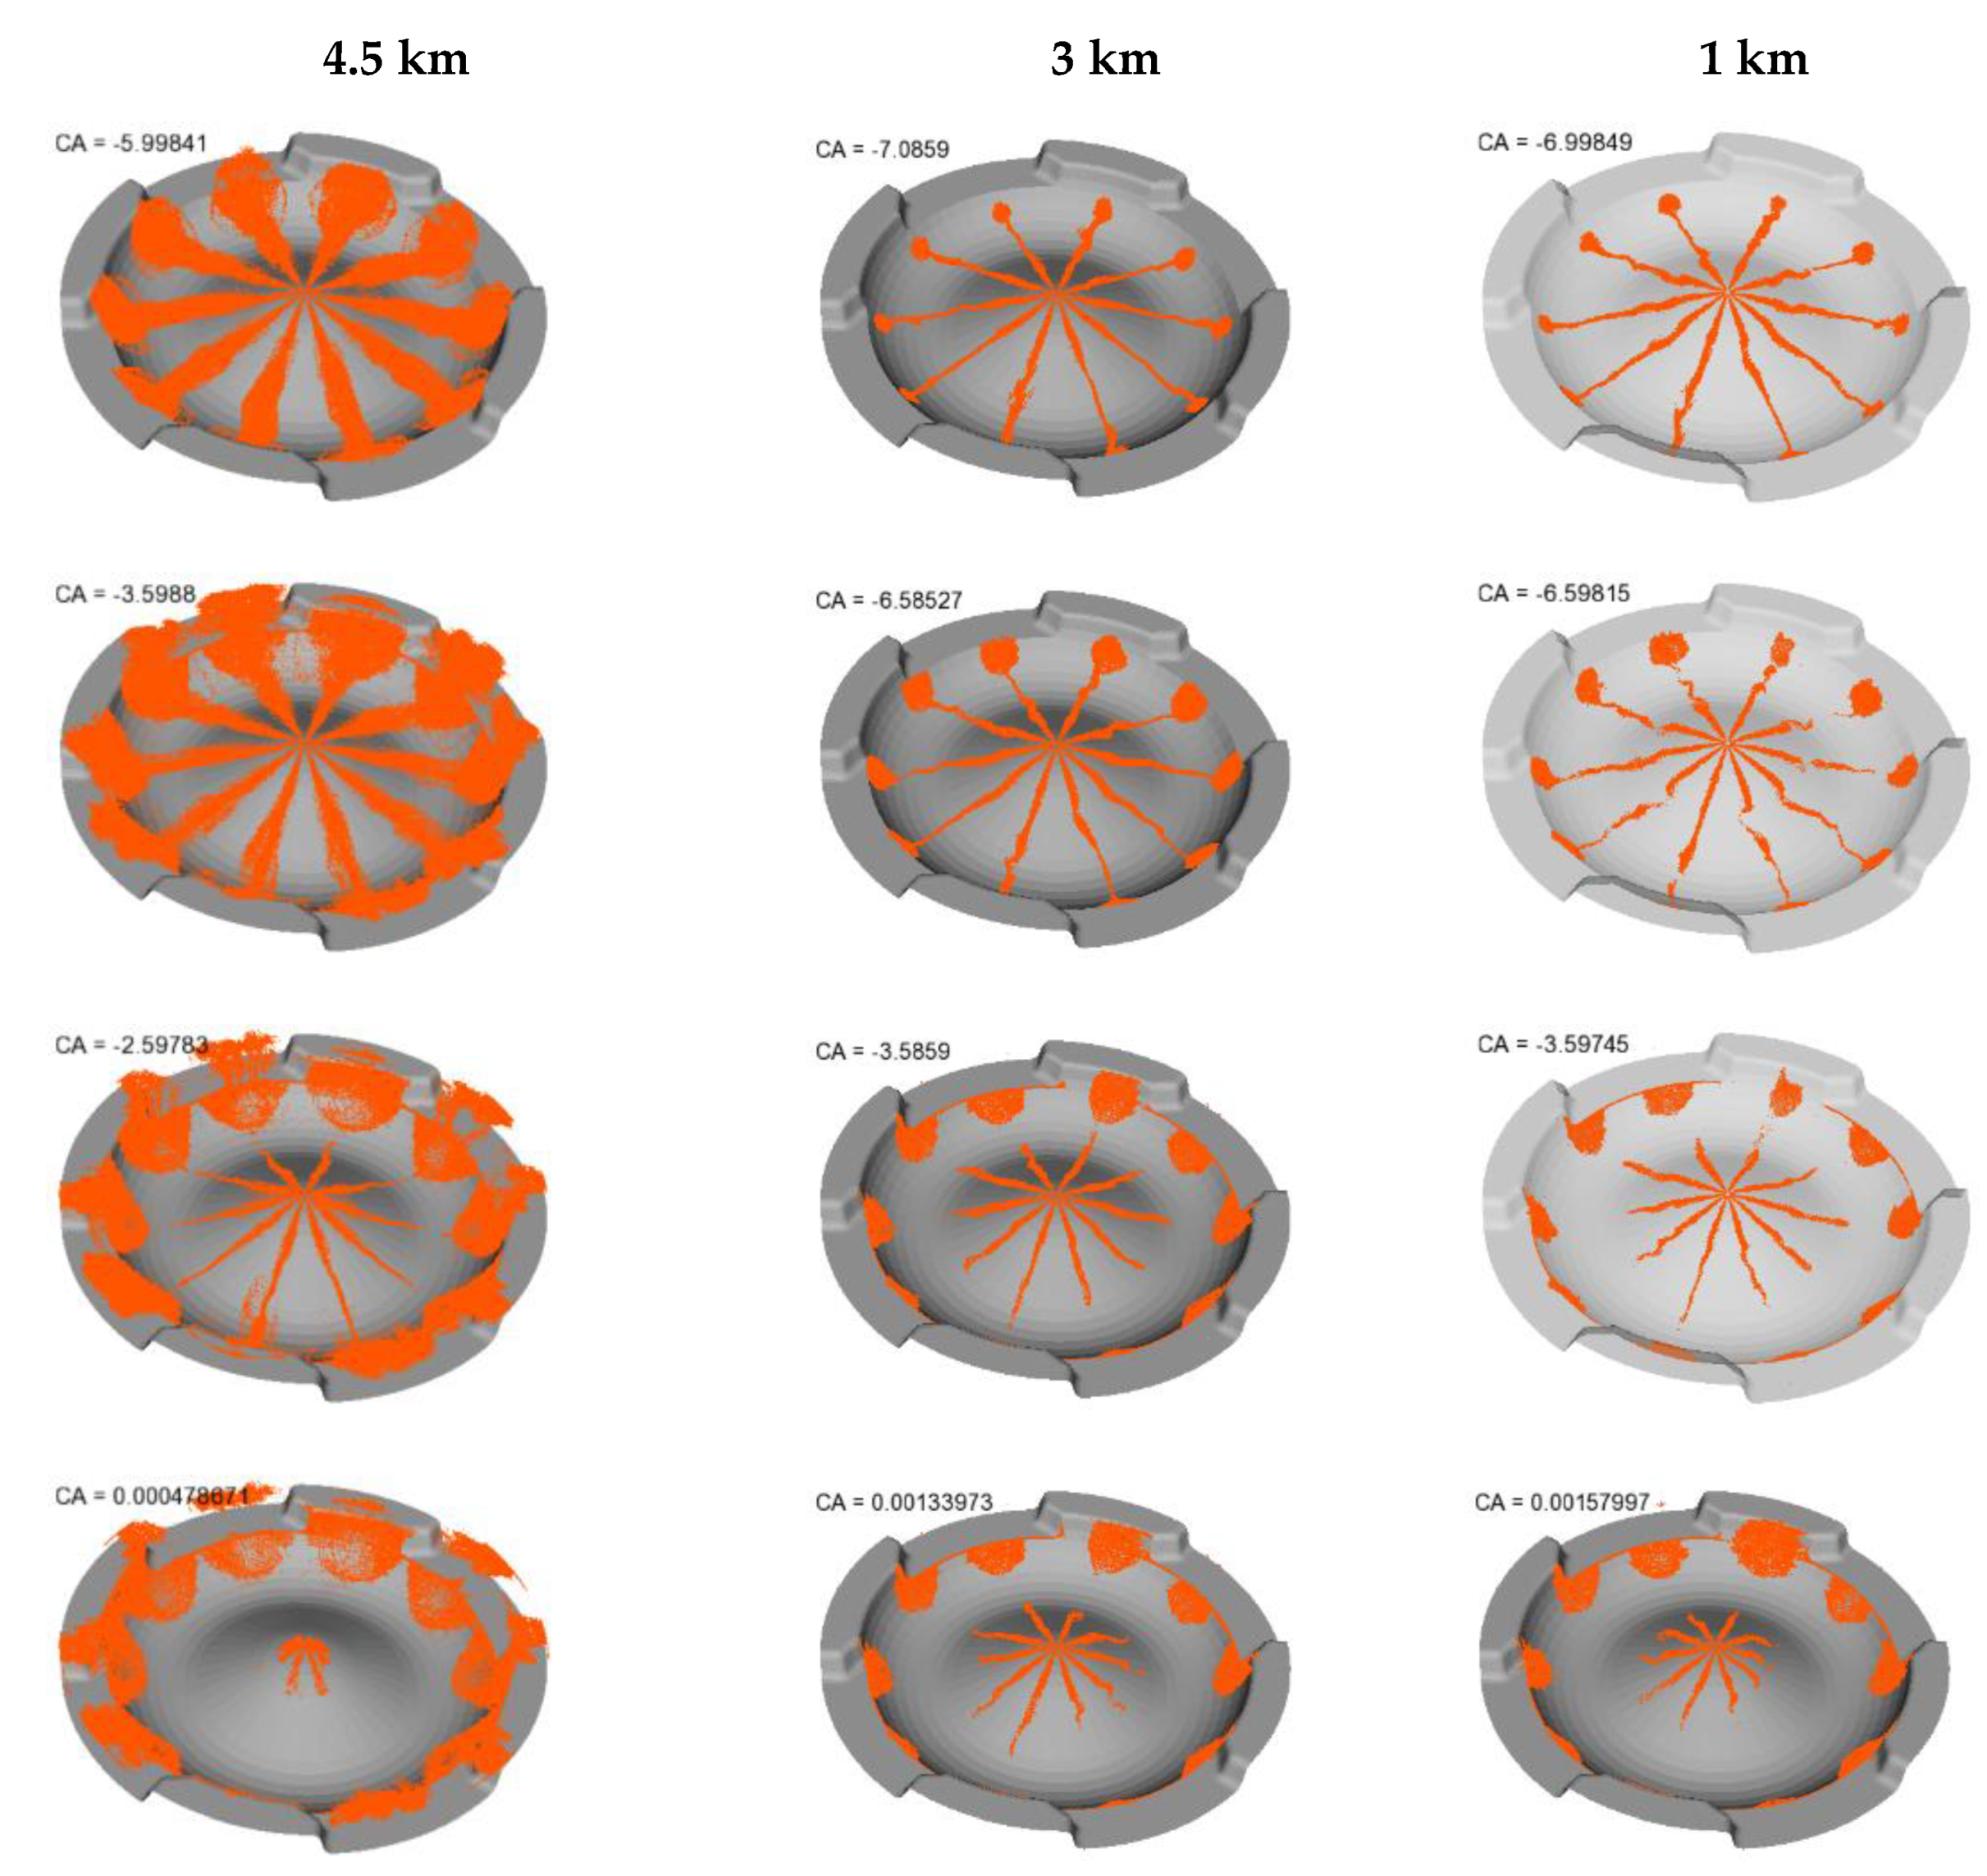
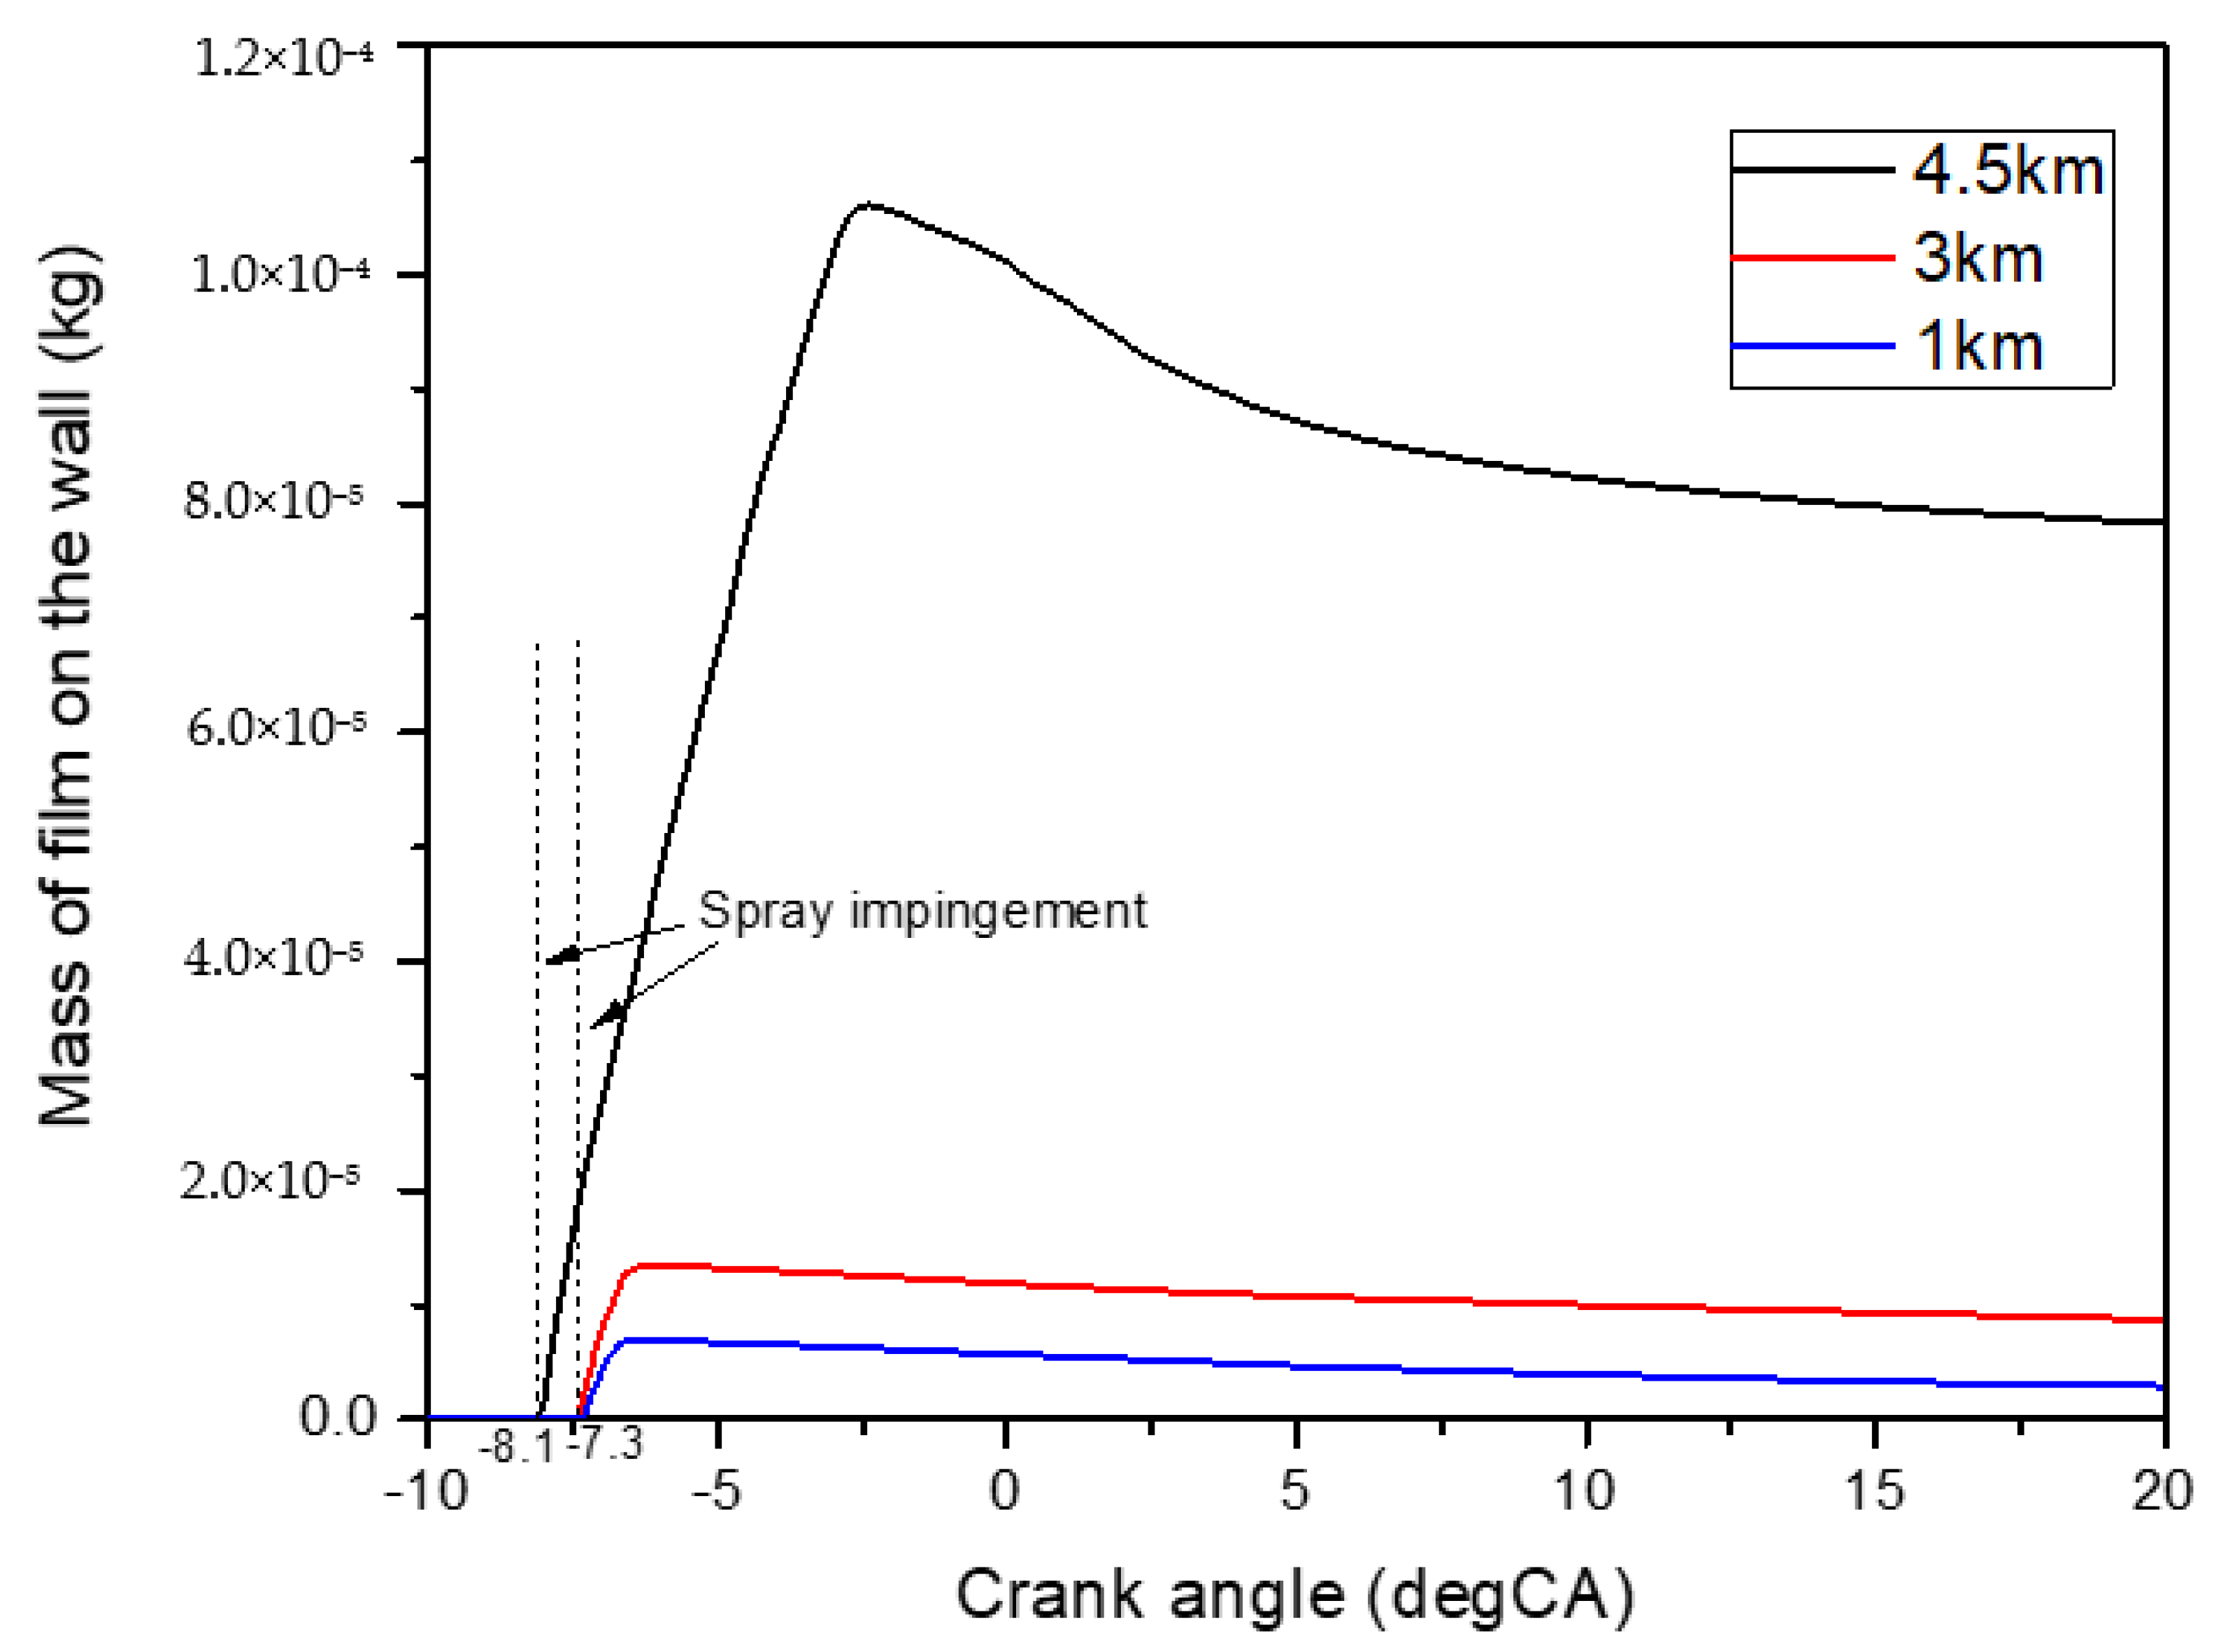
- The combustion efficiency decreased from 90% to 47% when the combustion changed from normal combustion to knocking combustion due to severe spray impingement.
- 3.
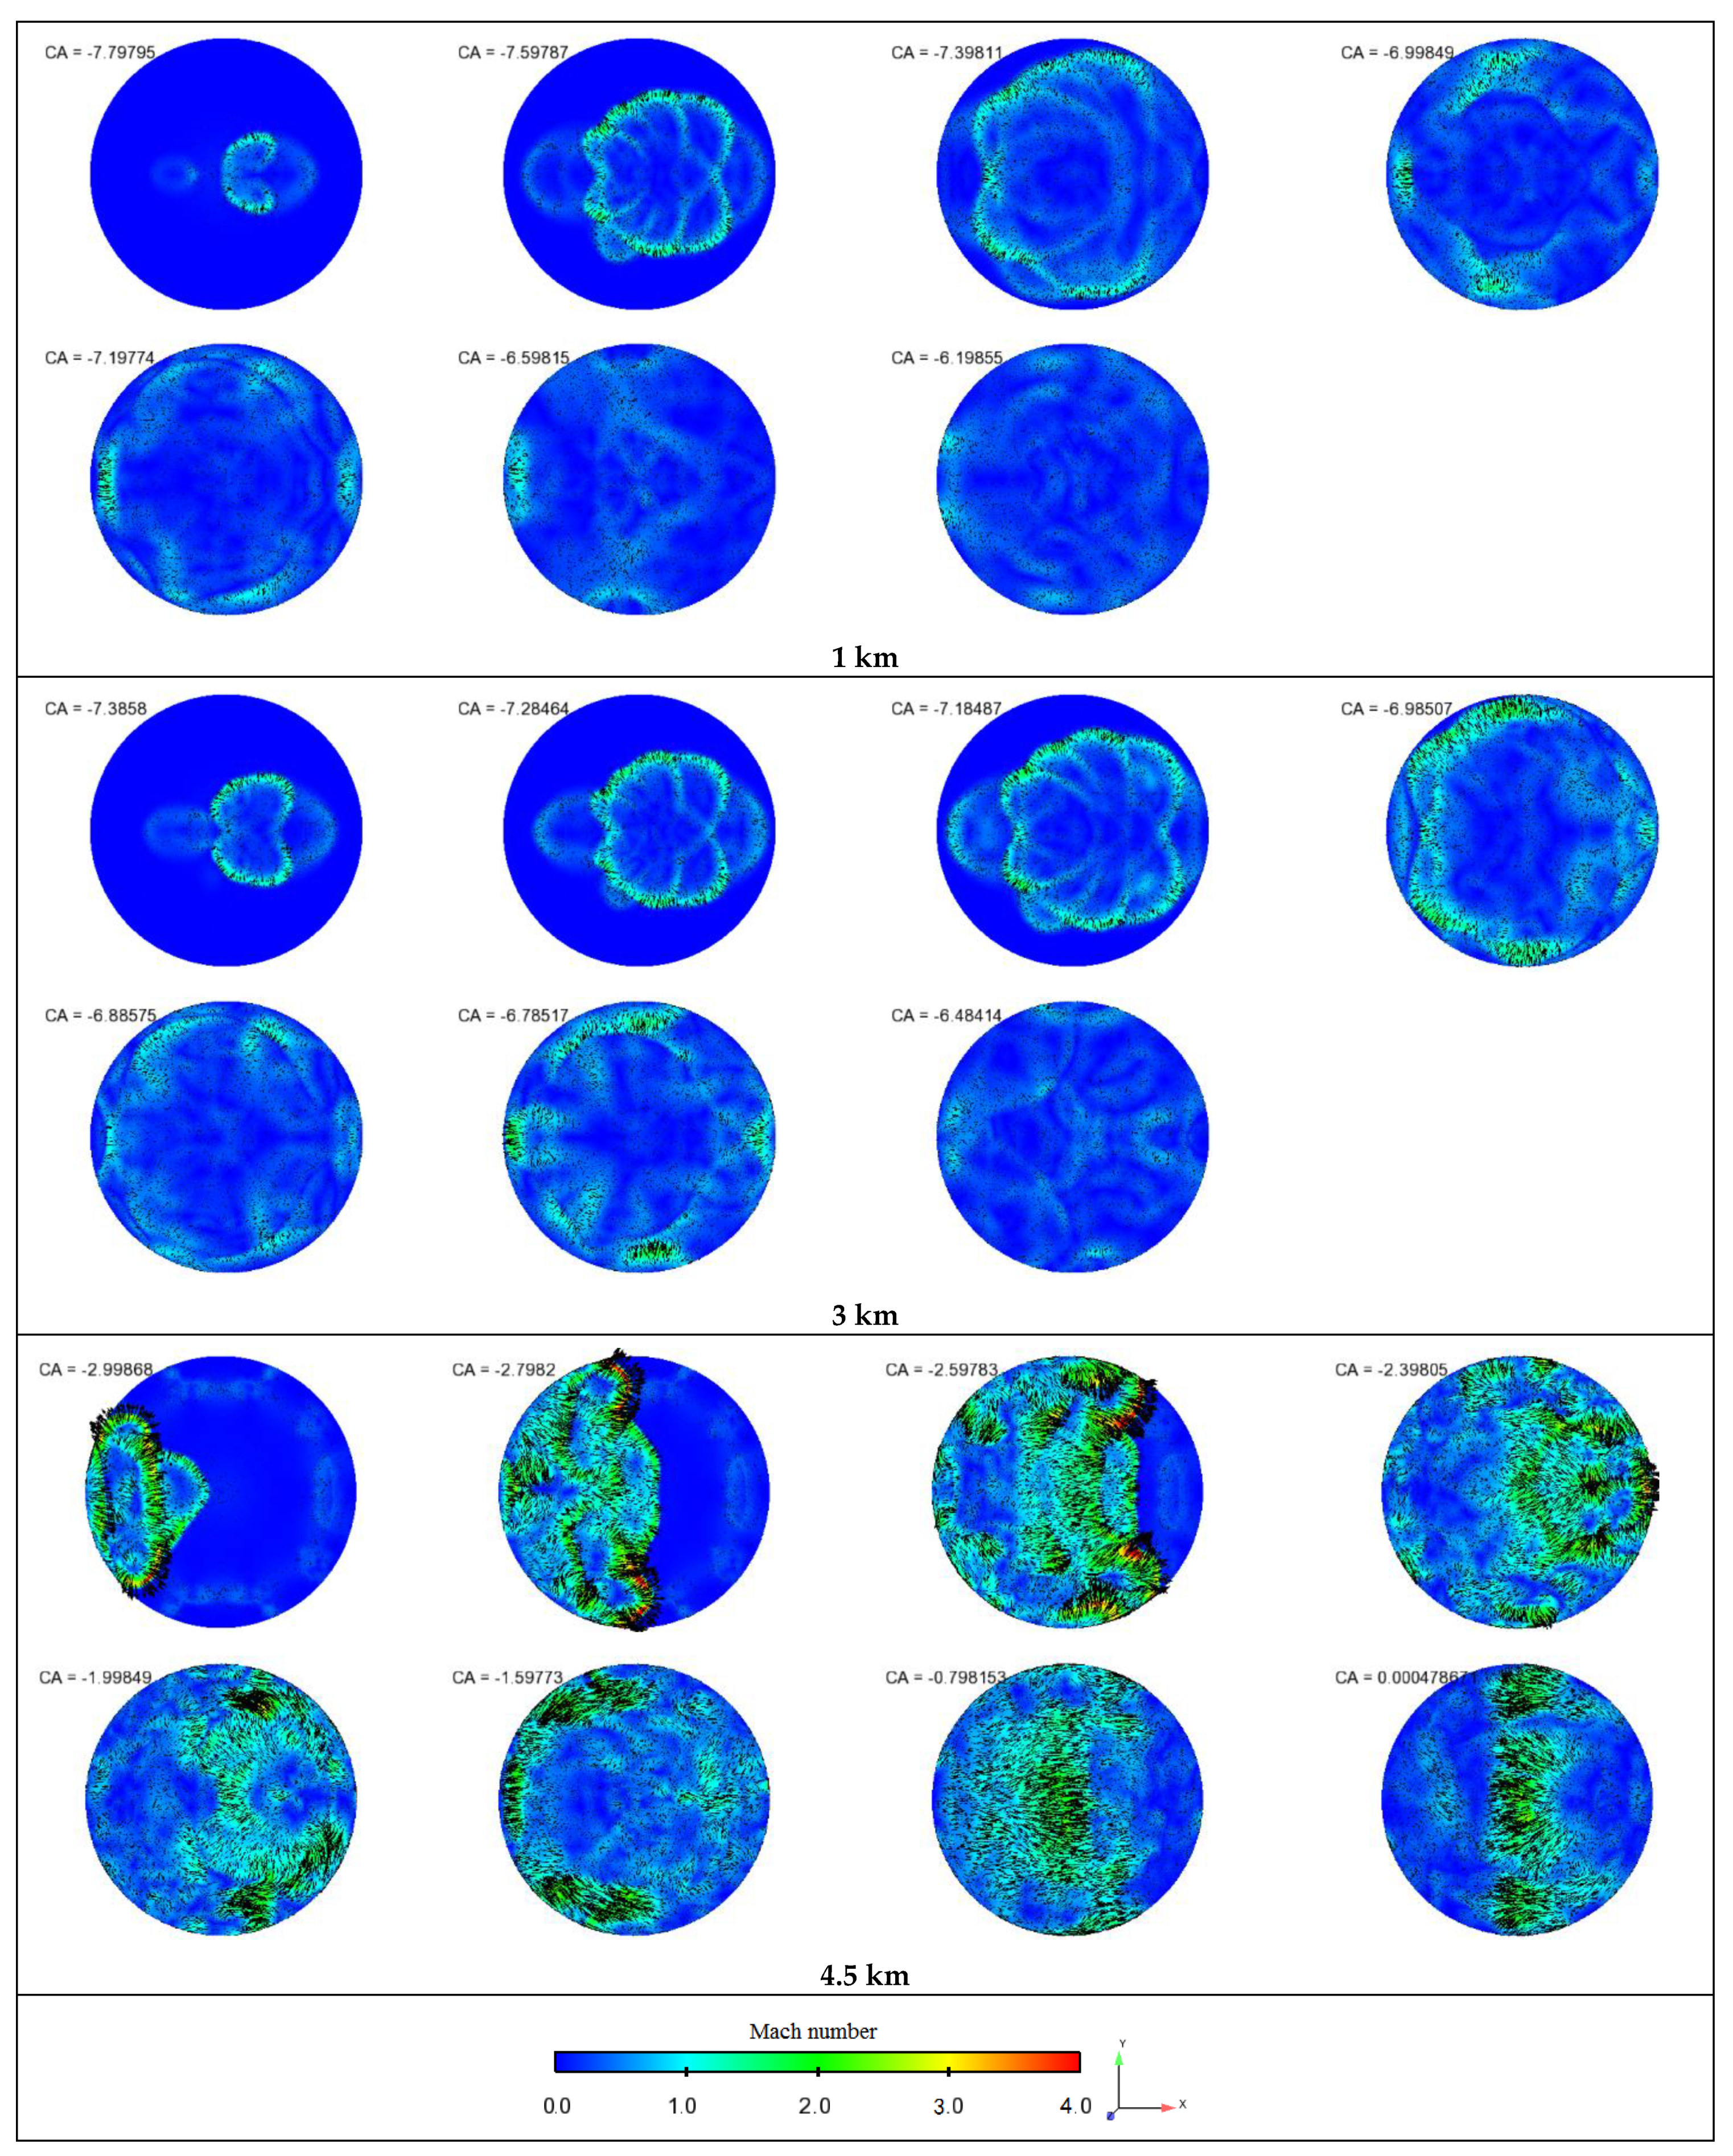
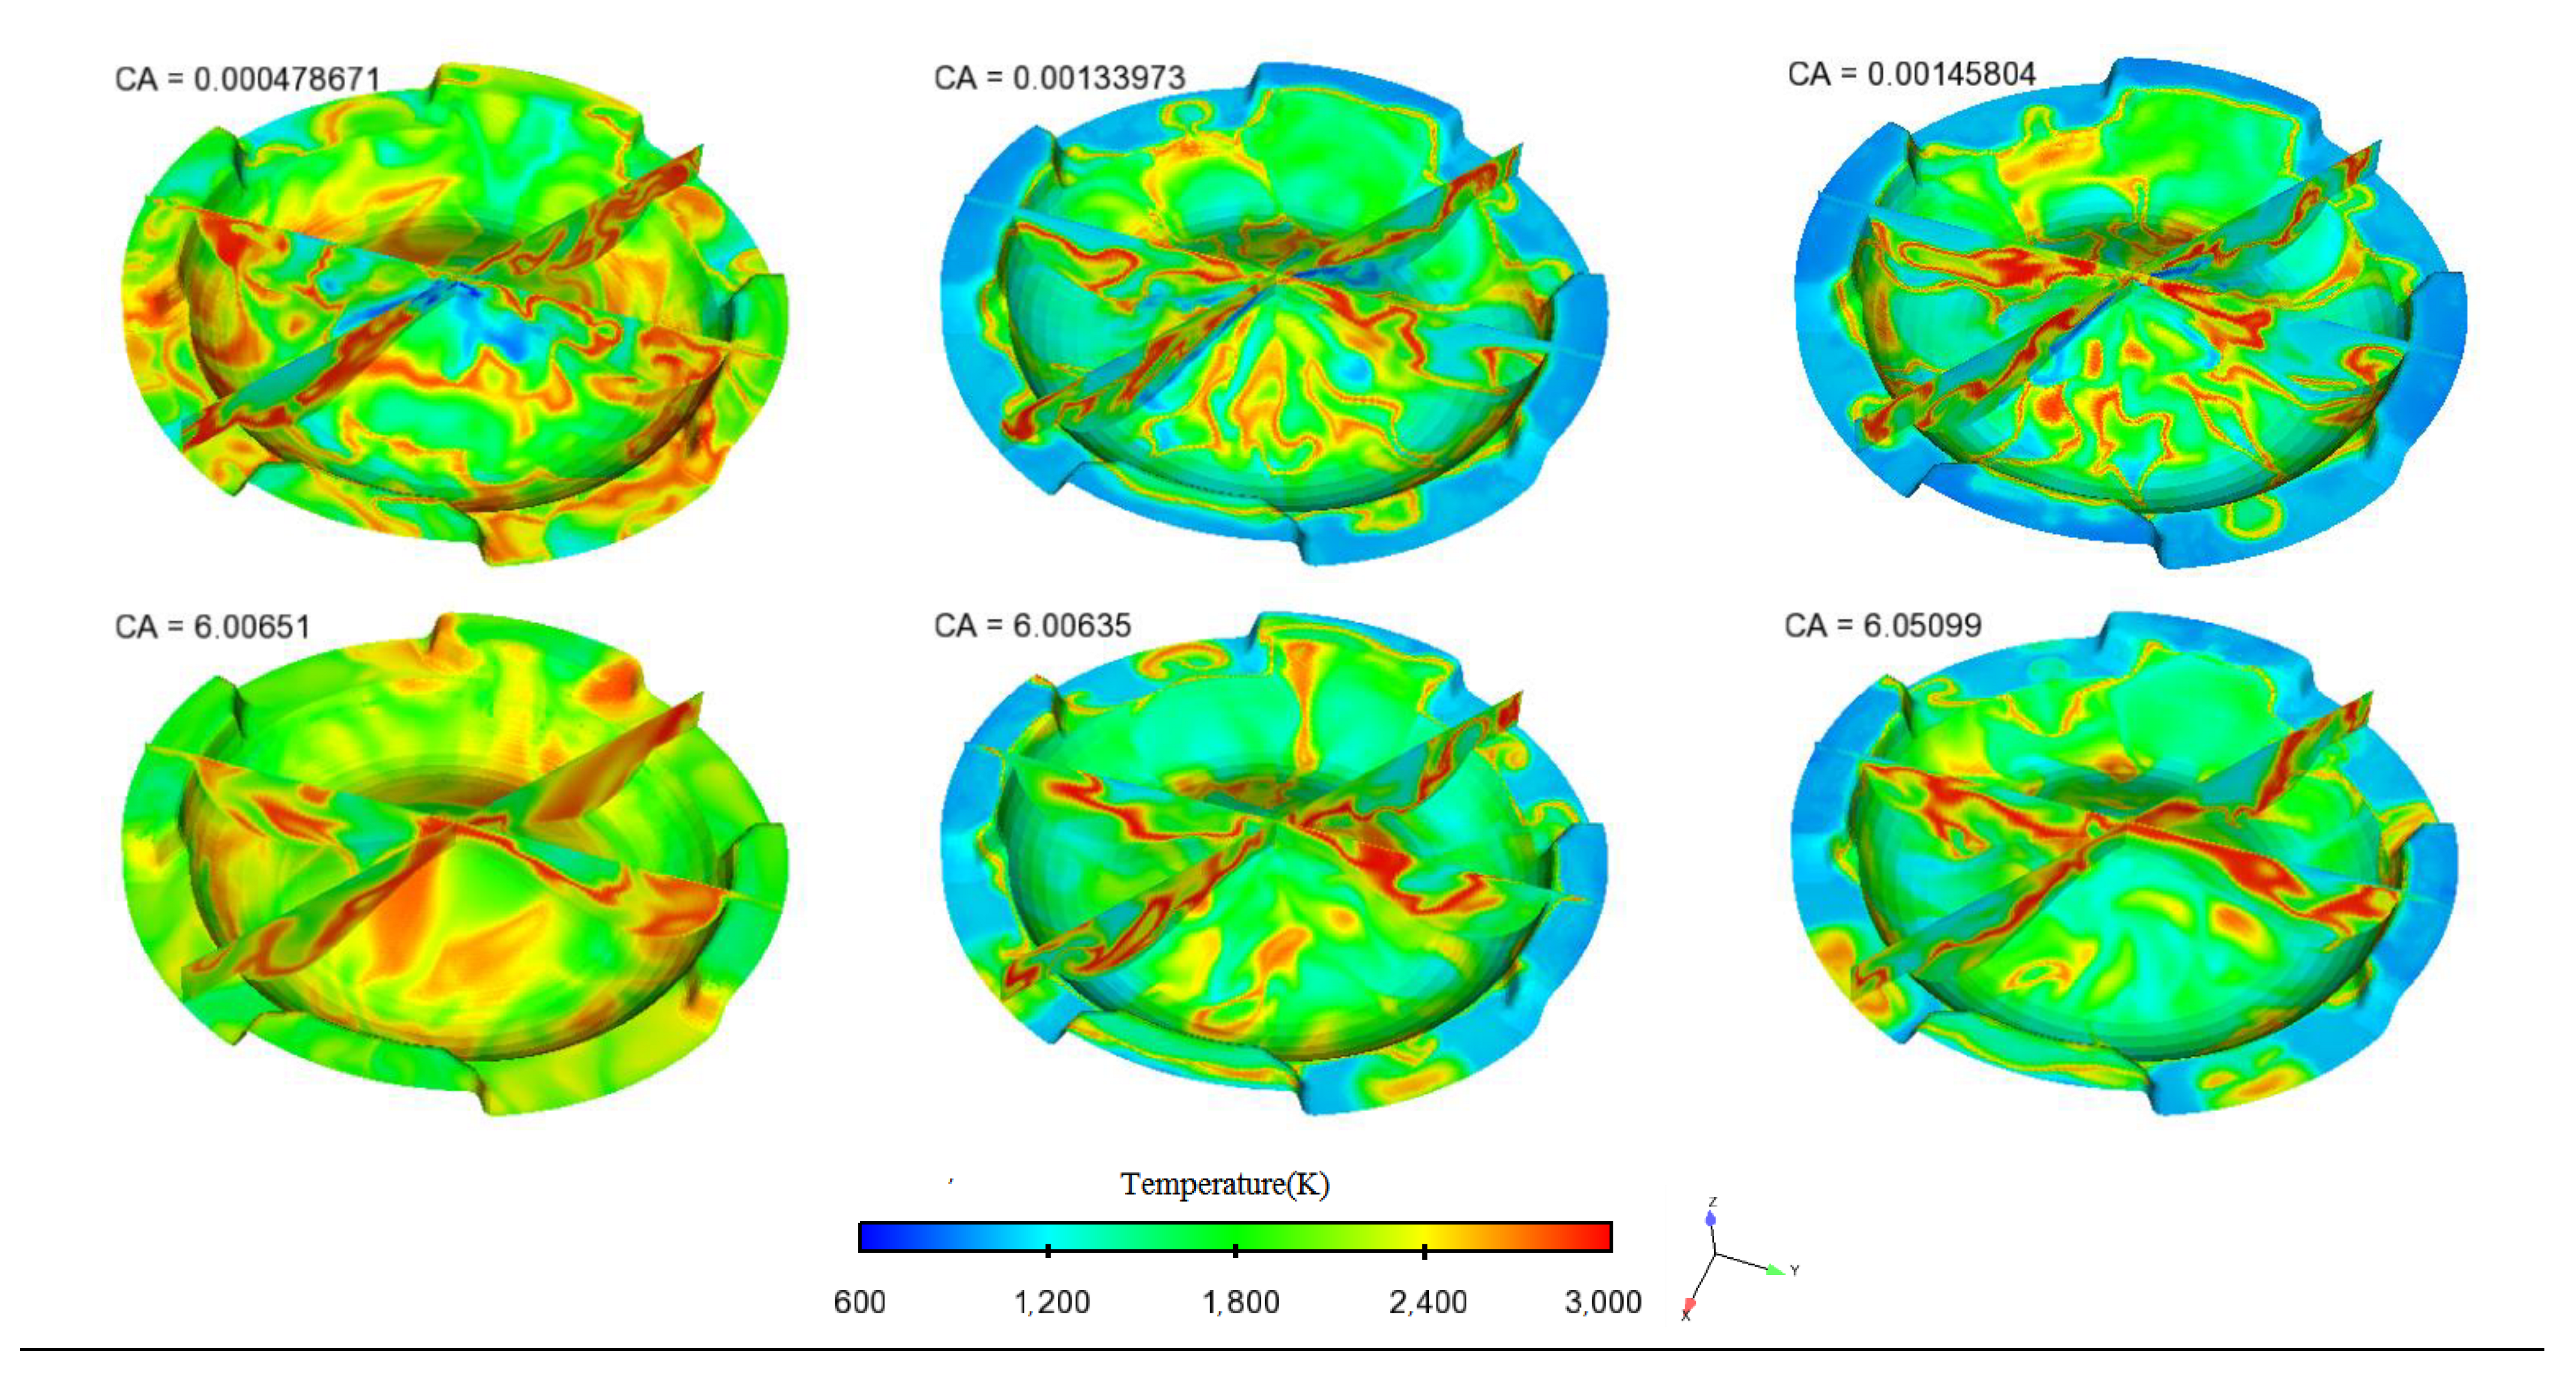
- The processes of end-gas ignition, sequential combustion, and pressure oscillation in the knocking combustion were revealed by the numerical modeling results.
- i.
- A deflagration was initiated by the end-gas with the ignitable mixture near the wall due to severe spray impingement.
- ii.
- Instead of typical multiple-ignition, the chemical heat release from the deflagration led to the thermal expansion of the burned zone, which compressed the surrounding unburned mixture to high pressure and high temperature. The deflagration flames propagated in the surrounding unburned mixture along the periphery of the cylinder.
- iii.
- Due to the thermal expansion of end-gas ignition, the pressure wave propagated from the one side to the other side of the cylinder within 0.8 °CA, and the mean propagation velocity of pressure wave was 1364 m/s. A typical reciprocating pressure oscillation was observed.
Author Contributions
Funding
Institutional Review Board Statement
Informed Consent Statement
Data Availability Statement
Conflicts of Interest
Abbreviations
| AMR | Adaptive Mesh Refinement |
| ATDC | After Top Dead Center |
| BTE | Brake Thermal Efficiency |
| CA | Crank Angle |
| CFD | Computation Fluid Dynamics |
| CI | Compression-Ignition |
| CNERI | China North Engine Research Institute |
| COV | Cycle-to-Cycle Variation |
| IM EP | Indicated Mean Effective Pressure |
| KI | Knock Intensity |
| LES | Large Eddy Simulation |
| MP | Monitor Point |
| PPRR | Peak Pressure Rise Rate |
| PSD | Power Spectral Density |
| SI | Spark-Ignition |
References
- Benjumea, P.; Agudelo, J.; Agudelo, A. Effect of Altitude and Palm Oil Biodiesel Fueling on the Performance and Combustion Characteristics of a HDSI Diesel Engine. Fuel 2009, 88, 72509. [Google Scholar] [CrossRef]
- Wang, X.; Ge, Y.; Yu, L.; Feng, X. Comparison of Combustion Characteristics and Brake Thermal Efficiency of a Heavy-Duty Diesel Engine Fueled with Diesel and Biodiesel at High Altitude. Fuel 2013, 107, 852–858. [Google Scholar] [CrossRef]
- Cai, Z.; Zhang, X.; Wang, Z.; Li, Y.; Li, Y.; Huang, Y.; Wang, X.; Zhang, D. Effects of Fuel Properties on Combustion Characteristics of Diesel Engine at Plateau Environment. Veh. Engine 2015, 219, 76–79. [Google Scholar]
- Zhang, X.; Cai, Z.; Wang, Z.; Li, Y.; Li, Y.; Huang, Y.; Wang, X.; Zhang, D.; Liu, J. Effects of Fuel Property on Combustion Cyclic Variation and Performance of Diesel Engine. Veh. Engine 2015, 218, 41–44. [Google Scholar]
- Kan, Z.; Hu, Z.; Lou, D.; Tan, P.; Cao, Z.; Yang, Z. Effects of altitude on combustion and ignition characteristics of speedup period during cold start in a diesel engine. Energy 2018, 150, 164–175. [Google Scholar] [CrossRef]
- Li, H.; Zhang, X.; Qiang, Y.; Zhu, W.; Li, Y. Experimental Study on Knocking Combustion in CI Engines under High-Altitude Conditions. J. Phys. Conf. Ser. 2020, 1507, 032024. [Google Scholar] [CrossRef]
- Heywood, J.B. Internal Combustion Engine Fundamentals; McGraw-Hill: New York, NY, USA, 1988. [Google Scholar]
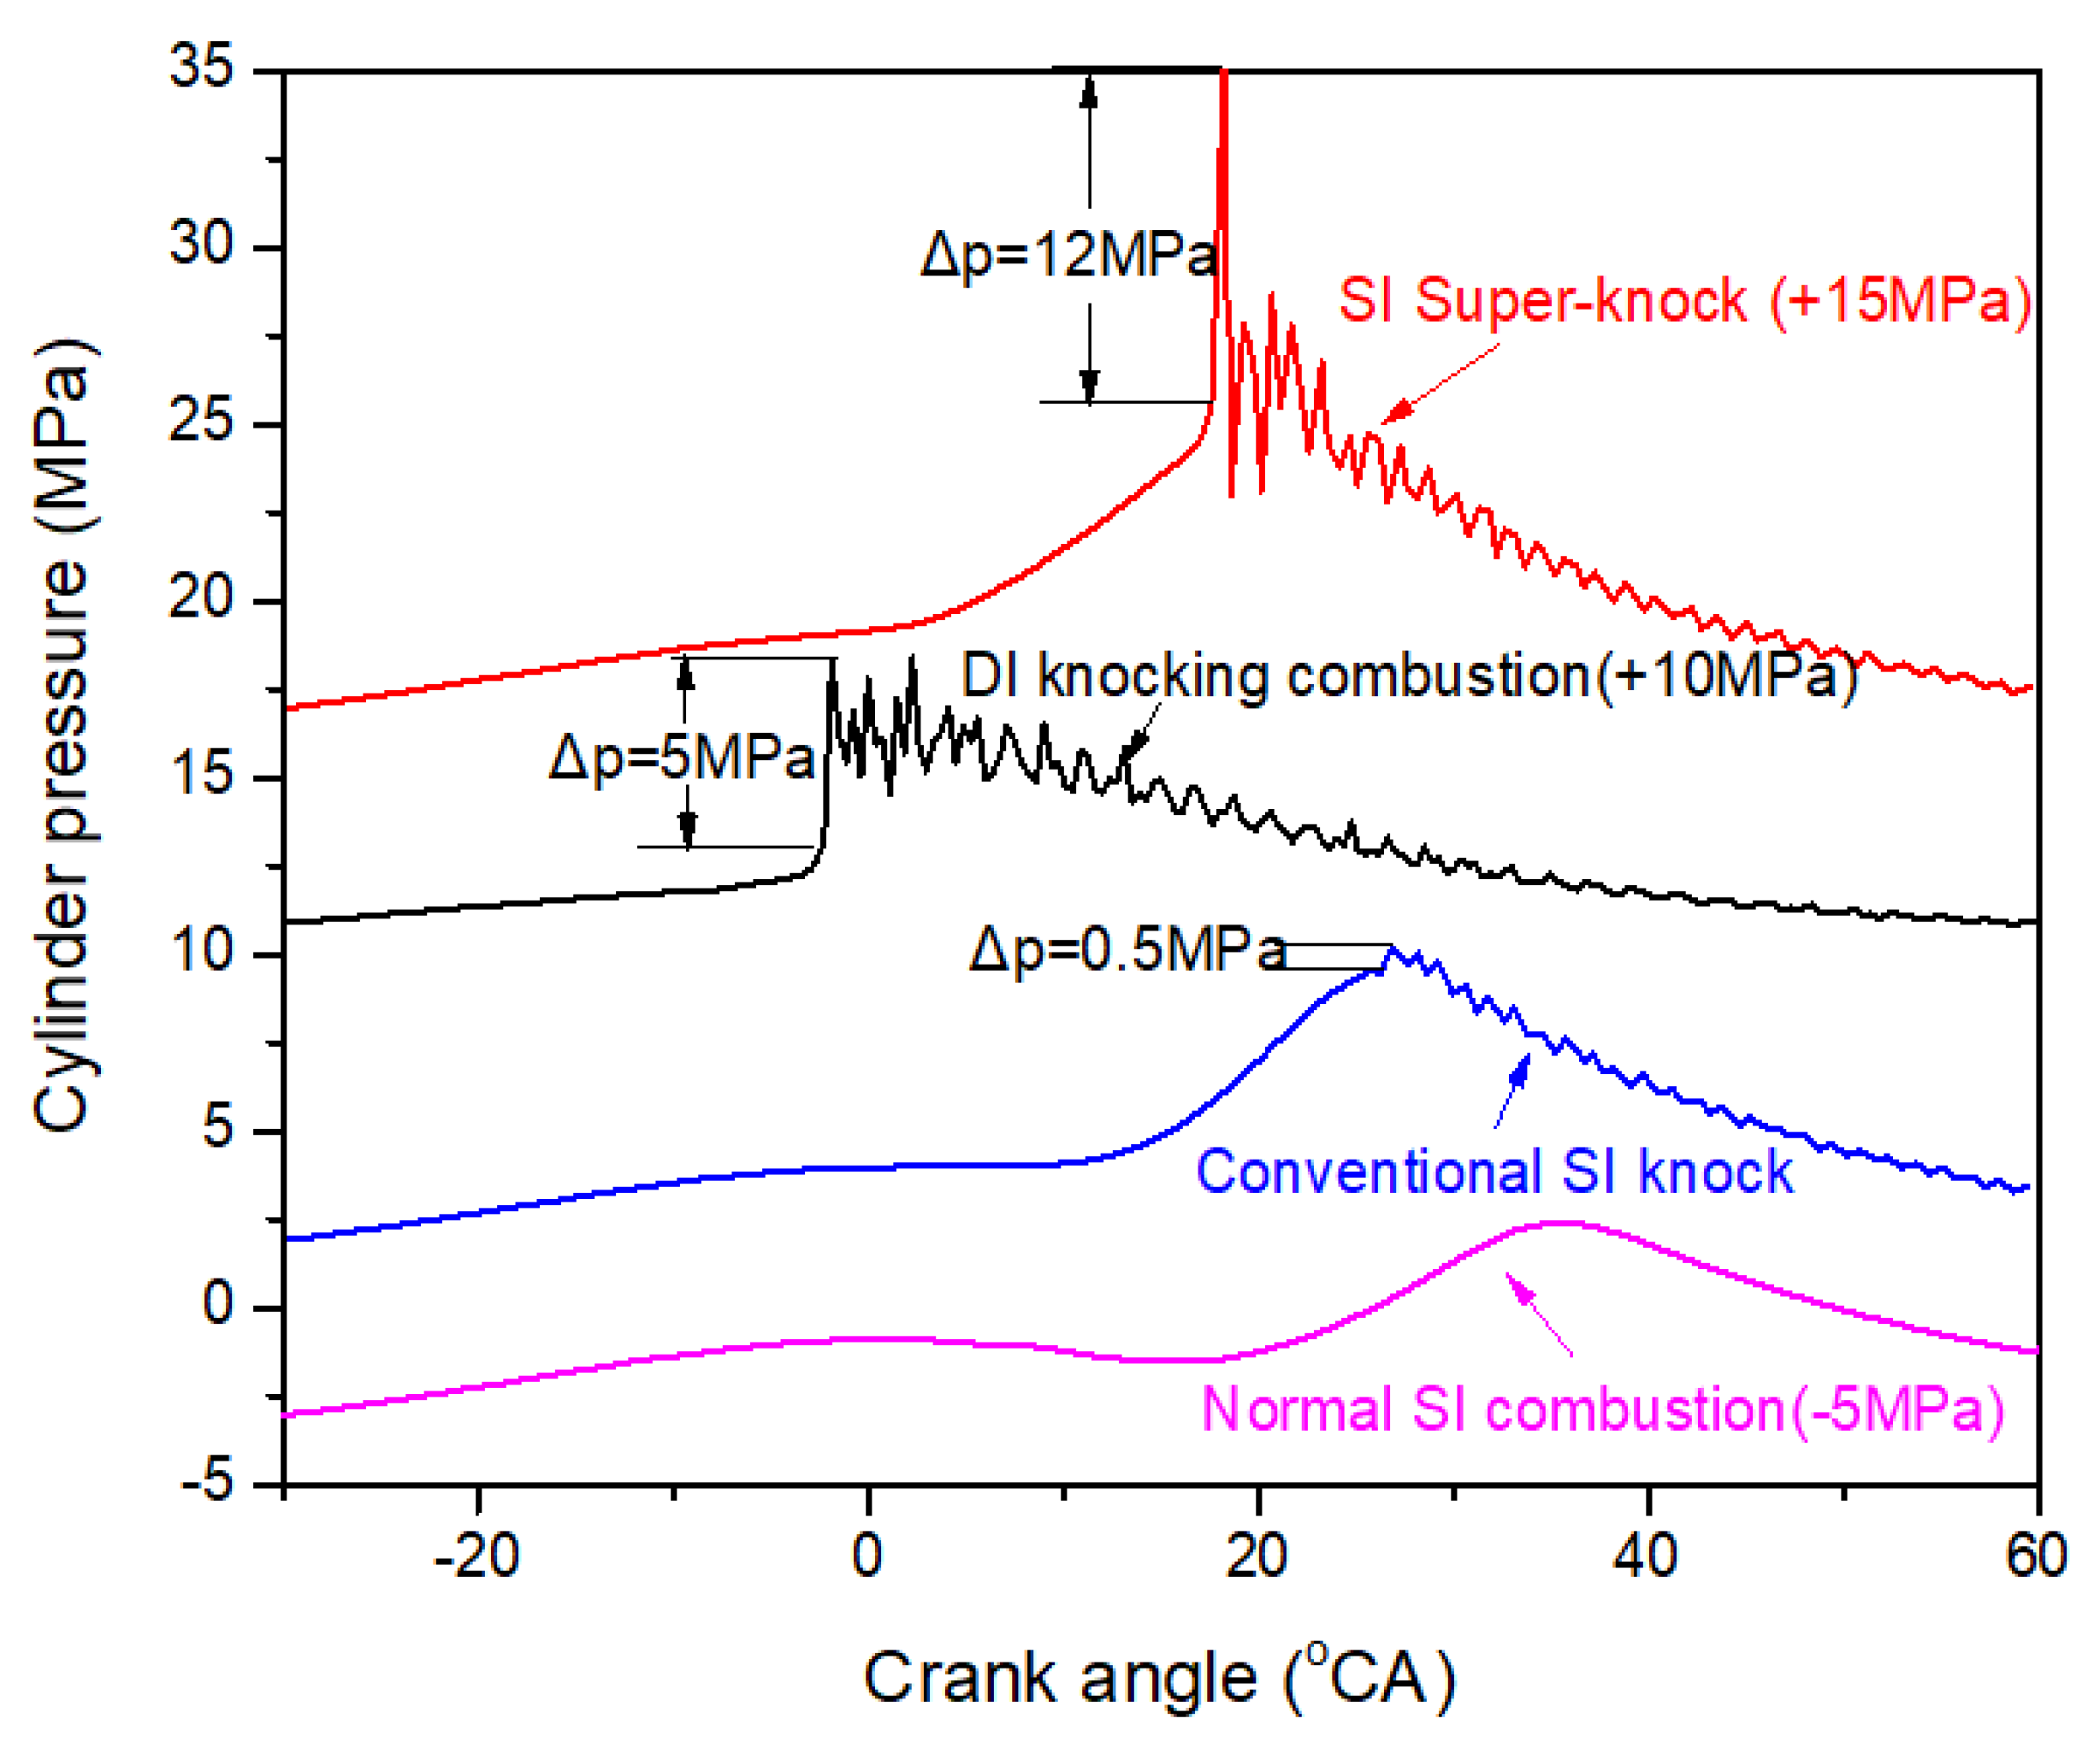
- Wang, Z.; Liu, H.; Rolf, D.R. Knocking combustion in spark-ignition engines. Prog. Energy Combust. Sci. 2017, 61, 78–112. [Google Scholar] [CrossRef]
- Gequn, S.; Wei, J.; Wei, H.; Chen, X. Research on Couple Mechanism of Heat Release and Acoustic Characteristics during Combustion of Butane in Close Chamber; SAE Technical Paper; SAE International: Warrendale, PA, USA, 2007. [Google Scholar]
- Towers, J.M.; Hoekstra, R.L. Engine Knock, A Renewed Concern In Motorsports—A Literature Review; SAE Technical Paper; SAE International: Warrendale, PA, USA, 1998. [Google Scholar]
- Terashima, H.; Koshi, M. Mechanisms of strong pressure wave generation in end-gas autoignition during knocking combustion. Combust. Flame 2015, 162, 1944–1956. [Google Scholar] [CrossRef]
- Zhen, X.; Wang, Y.; Zhu, Y. Study of knock in a high compression ratio SI methanol engine using LES with detailed chemical kinetics. Energy Convers. Manag. 2013, 75, 523–531. [Google Scholar] [CrossRef]
- Lecocq, G.; Richard, S.; Michel, J.B.; Vervisch, L. A new LES model coupling flame surface density and tabulated kinetics approaches to investigate knock and pre-ignition in piston engines. Proc. Combust. Inst. 2011, 33, 3105–3114. [Google Scholar] [CrossRef]
- Misdariis, A.; Vermorel, O.; Poinsot, T. LES of knocking in engines using dual heat transfer and two-step reduced schemes. Combust. Flame 2015, 162, 4304–4312. [Google Scholar] [CrossRef] [Green Version]
- Pan, J.; Wei, H.; Shu, G.; Pan, M.; Feng, D.; Li, N. LES analysis for auto-ignition induced abnormal combustion based on a downsized SI engine. Appl. Energy 2017, 191, 183–192. [Google Scholar] [CrossRef]
- CONVERGE, 2.3 Manual; Converge Science: Madison, WI, USA, 2016.
- Chang, Y.; Jia, M.; Li, Y.; Liu, Y.; Xie, M.; Wang, H.; Reitz, R.D. Development of a skeletal mechanism for diesel surrogate fuel by using a decoupling methodology. Combust. Flame 2015, 162, 3785–3802. [Google Scholar] [CrossRef]


| Submodel | Name |
|---|---|
| Turbulence | LES |
| Evaporation | Frossling |
| Droplet breakup | KH |
| Spray–wall interaction | Bai–Gosman |
| Collision | NTC |
| Combustion | Four species skeletal oxidation mechanism [17] |
| Altitude (km) | 4.5 | 3 | 1 |
|---|---|---|---|
| Mean pressure @IVC (kPa) | 85 | 154 | 180 |
| Mean temperature | 402 | 422 | 422 |
| @IVC (K) | 550 | 550 | 550 |
| Piston temperature (K) | 450 | 450 | 450 |
| Liner temperature (K) Head temperature (K) | 500 | 500 | 500 |
| Injection quantity per cycle (mg) | 225 | 225 | 225 |
| Altitude (km) | 4.5 | 3 | 1 |
|---|---|---|---|
| Maximum combustion pressure (MPa) | 6.1 | 8.5 | 9.5 |
| Related crank angle of maximum combustion pressure (°CA) | 4.2 | 7.5 | 7.5 |
| PPRR (MPa/°CA) | 3.5 | 2.4 | 0.9 |
| Related crank angle of PPRR (°CA) | −2.5 | −7.3 | −7.8 |
| Maximum combustion temperature (K) | 2350 | 2154 | 2090 |
| Total mass of droplets hitting the wall (mg) | 136 | 14.5 | 7.2 |
| Maximum of heat release rate (J/°CA) | 3040 | 2078 | 1936 |
| Crank angle of maximum of heat release rate (°CA) | −2.5 | −7.3 | −7.7 |
| Integrated heat release (J) | 5050 | 8610 | 9769 |
| CA10 (°CA ATDC) | −3.1 | −7.3 | −7.7 |
| Combustion efficiency | 47% | 81% | 91% |
| CA50 (°CA ATDC) | −1.5 | 5.3 | 6.7 |
| CA90 (°CA ATDC) | 12.7 | 46.2 | 52.2 |
| Ignition delay (°CA) | 10.9 | 6.7 | 6.3 |
| Combustion duration (°CA) | 15.8 | 53.5 | 59.9 |
Publisher’s Note: MDPI stays neutral with regard to jurisdictional claims in published maps and institutional affiliations. |
© 2022 by the authors. Licensee MDPI, Basel, Switzerland. This article is an open access article distributed under the terms and conditions of the Creative Commons Attribution (CC BY) license (https://creativecommons.org/licenses/by/4.0/).
Share and Cite
Li, H.; Zhang, X.; Li, C.; Cao, R.; Zhu, W.; Li, Y.; Liu, F.; Li, Y. Numerical Study of Knocking Combustion in a Heavy-Duty Engine under Plateau Conditions. Energies 2022, 15, 3083. https://doi.org/10.3390/en15093083
Li H, Zhang X, Li C, Cao R, Zhu W, Li Y, Liu F, Li Y. Numerical Study of Knocking Combustion in a Heavy-Duty Engine under Plateau Conditions. Energies. 2022; 15(9):3083. https://doi.org/10.3390/en15093083
Chicago/Turabian StyleLi, Haiying, Xiaoqin Zhang, Chaofan Li, Rulou Cao, Weiqing Zhu, Yaozong Li, Fengchun Liu, and Yufeng Li. 2022. "Numerical Study of Knocking Combustion in a Heavy-Duty Engine under Plateau Conditions" Energies 15, no. 9: 3083. https://doi.org/10.3390/en15093083
APA StyleLi, H., Zhang, X., Li, C., Cao, R., Zhu, W., Li, Y., Liu, F., & Li, Y. (2022). Numerical Study of Knocking Combustion in a Heavy-Duty Engine under Plateau Conditions. Energies, 15(9), 3083. https://doi.org/10.3390/en15093083