
An Experimental Analysis and ANN Based Parameter Optimization of the Influence of Microalgae Spirulina Blends on CI Engine Attributes

 , and
, and 
Abstract
:
1. Introduction
2. Materials and Methods
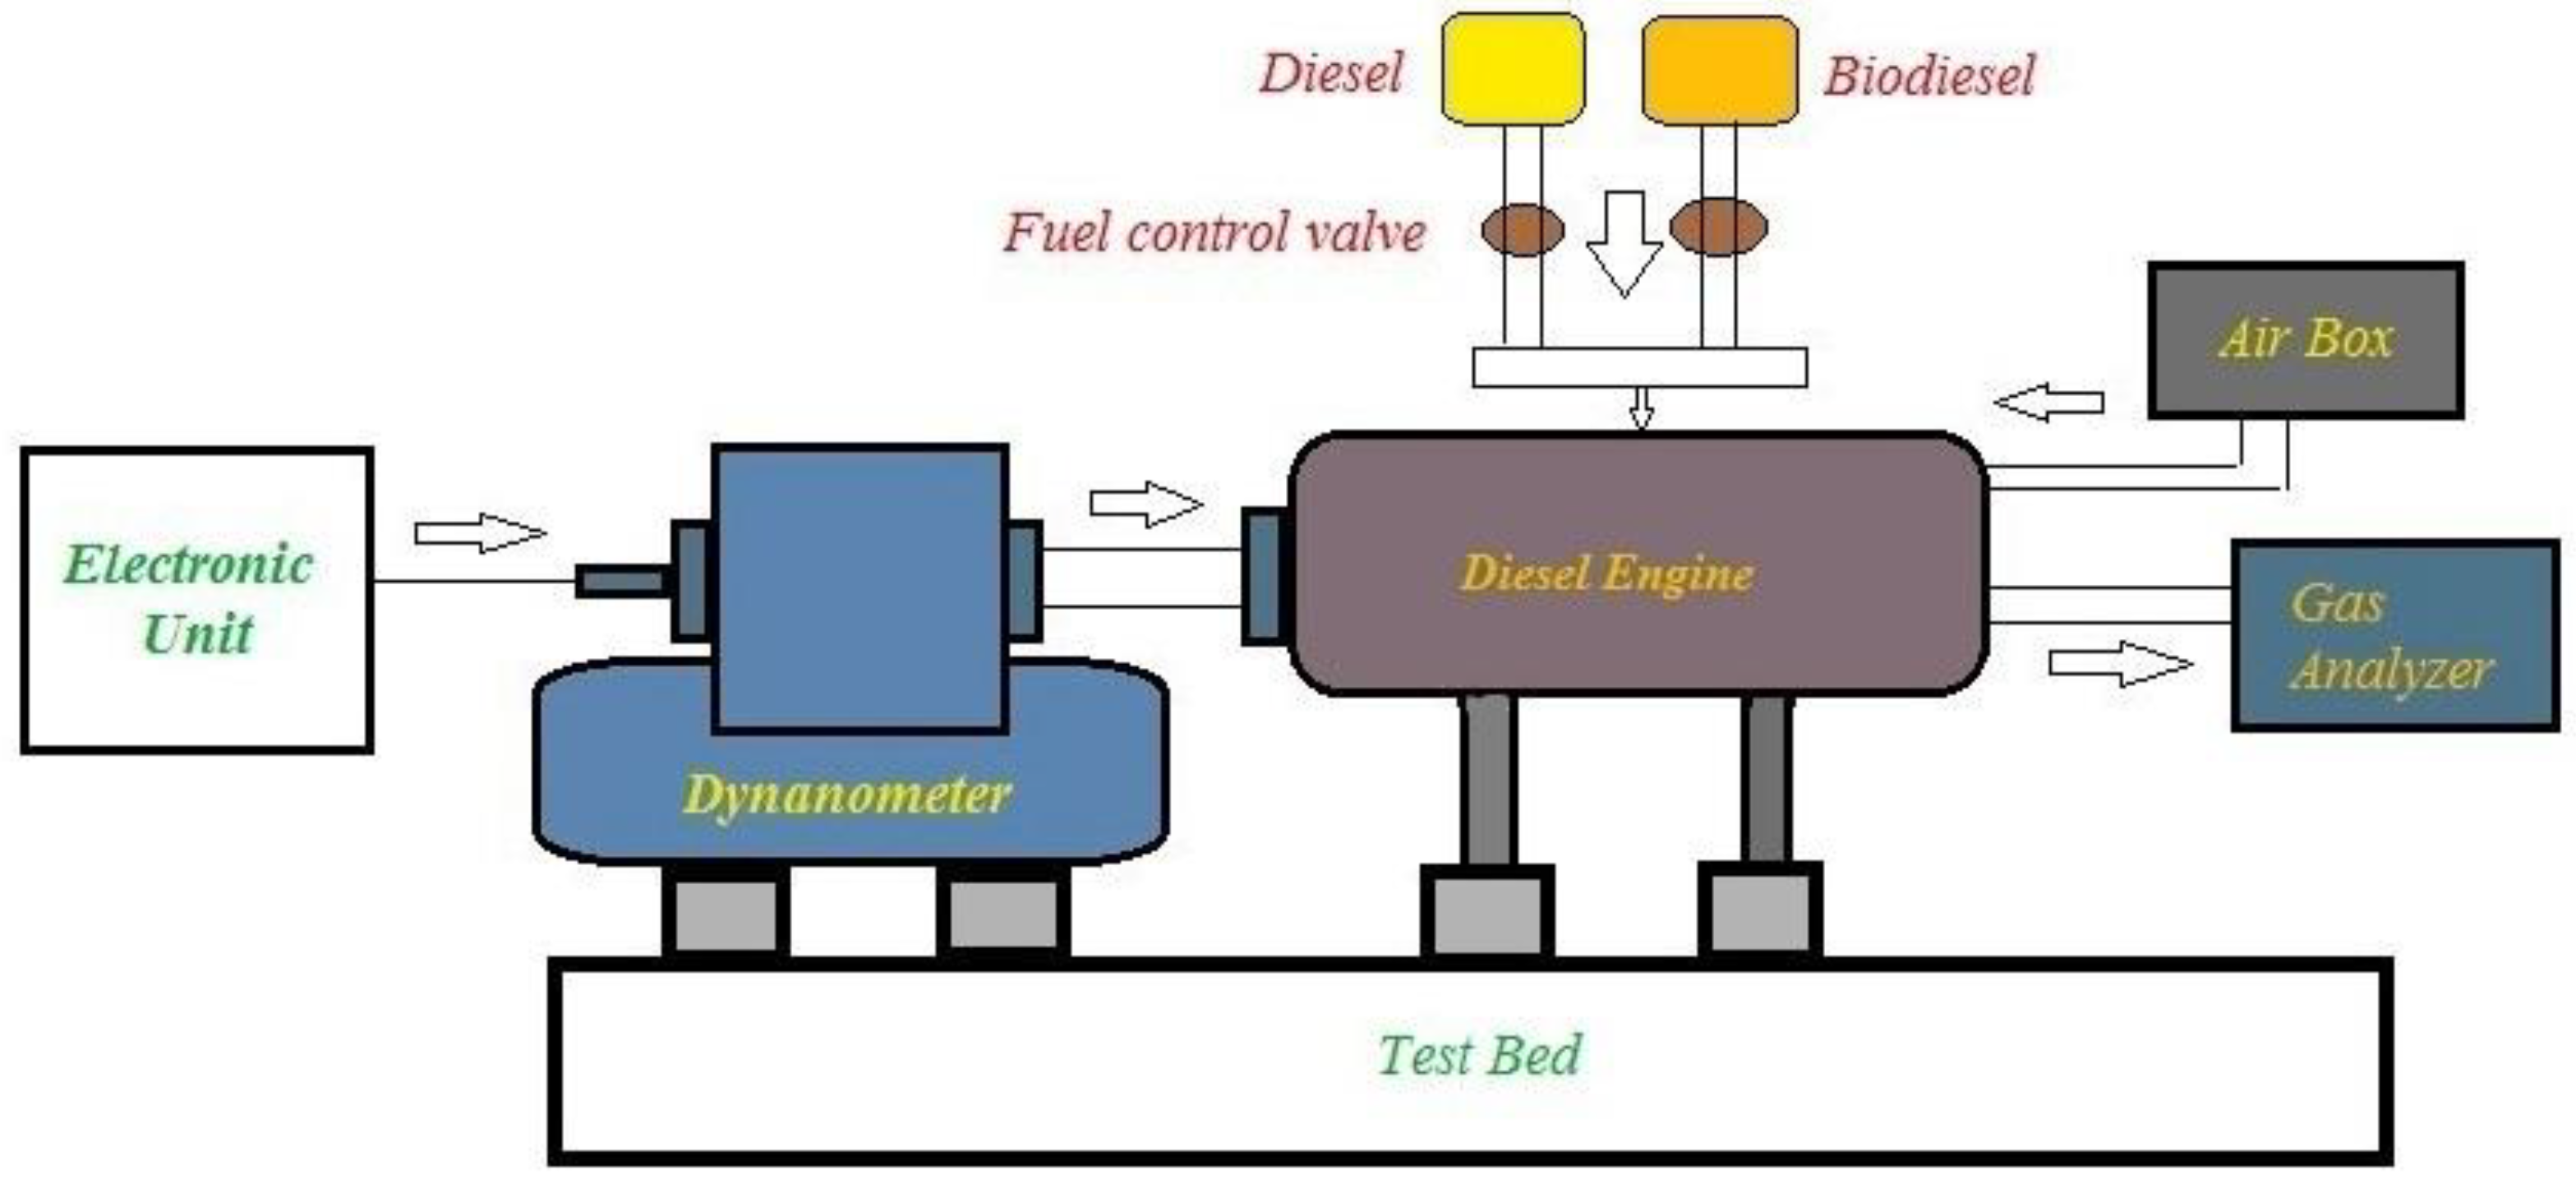
Fuel Properties and Test Rig
- The engine’s fuel system, cooling, and lubrication have all been inspected for proper operation;
- To achieve steady operating circumstances, the engine is started and operated in no-load for 25 min using baseline fuel (diesel);
- Data were taken within a few minutes of attaining steady operating circumstances;
- All relevant data were carefully obtained manually. The tests were executed for varied loads (0, 2, 4, 6, 8, and 10 kg) using SB100, SB80, SB65, SB50, SB35, SB20, and SB0 fuels, emissions, and performance attributes were written down;
- NOX, and HC were recorded in ppm whereas CO2 was in percentages;
- Each experiment was undertaken three times, and the mean value was noted. Table 3 shows the uncertainty measurements of the obtained outcomes.
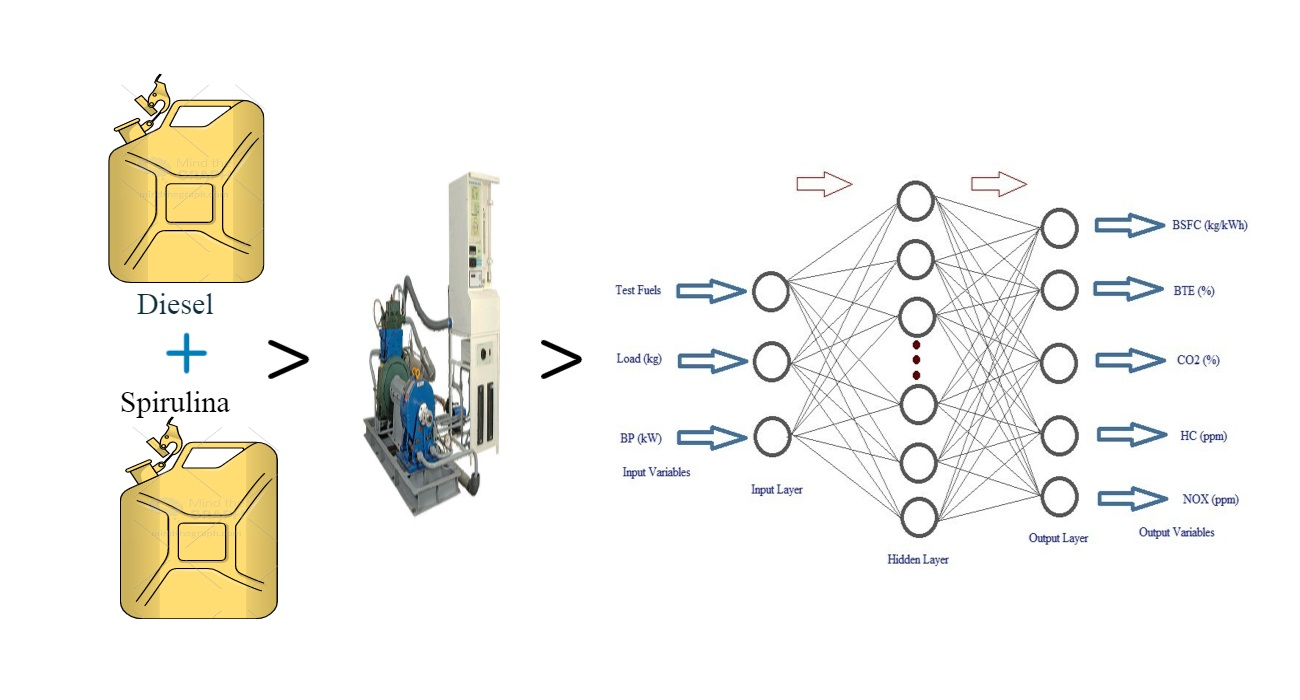
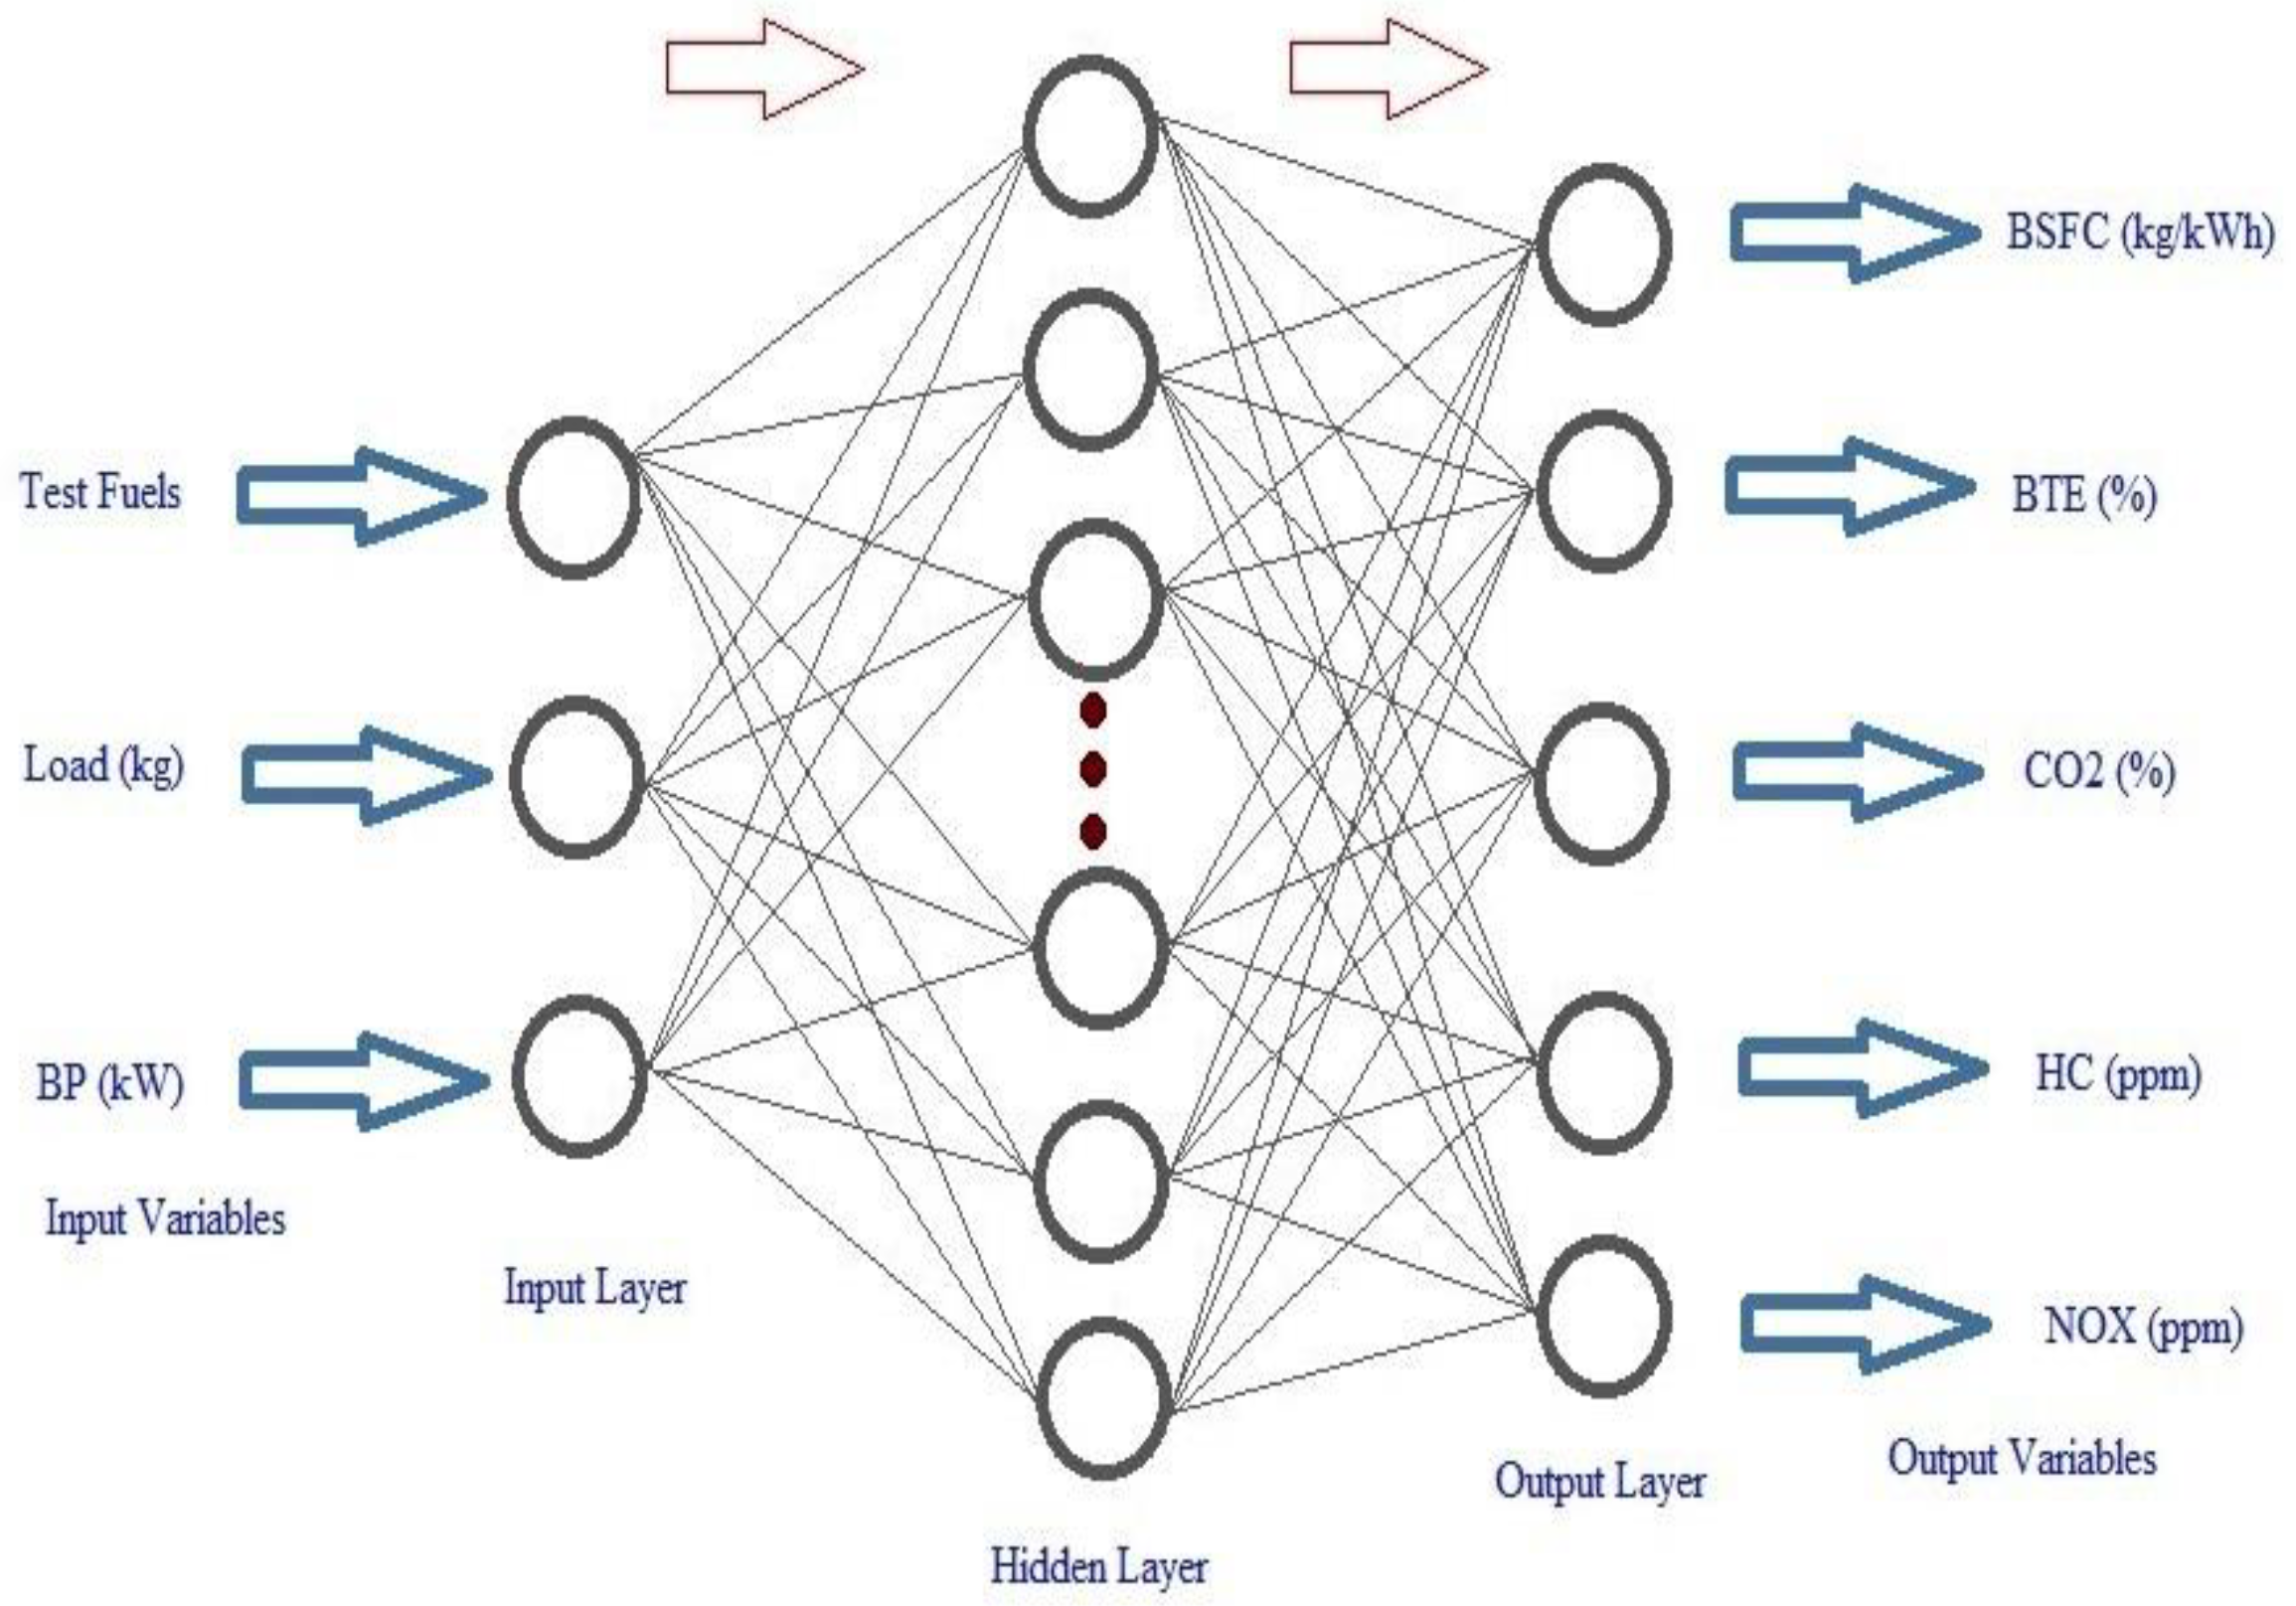
3. Artificial Neural Network (ANN)
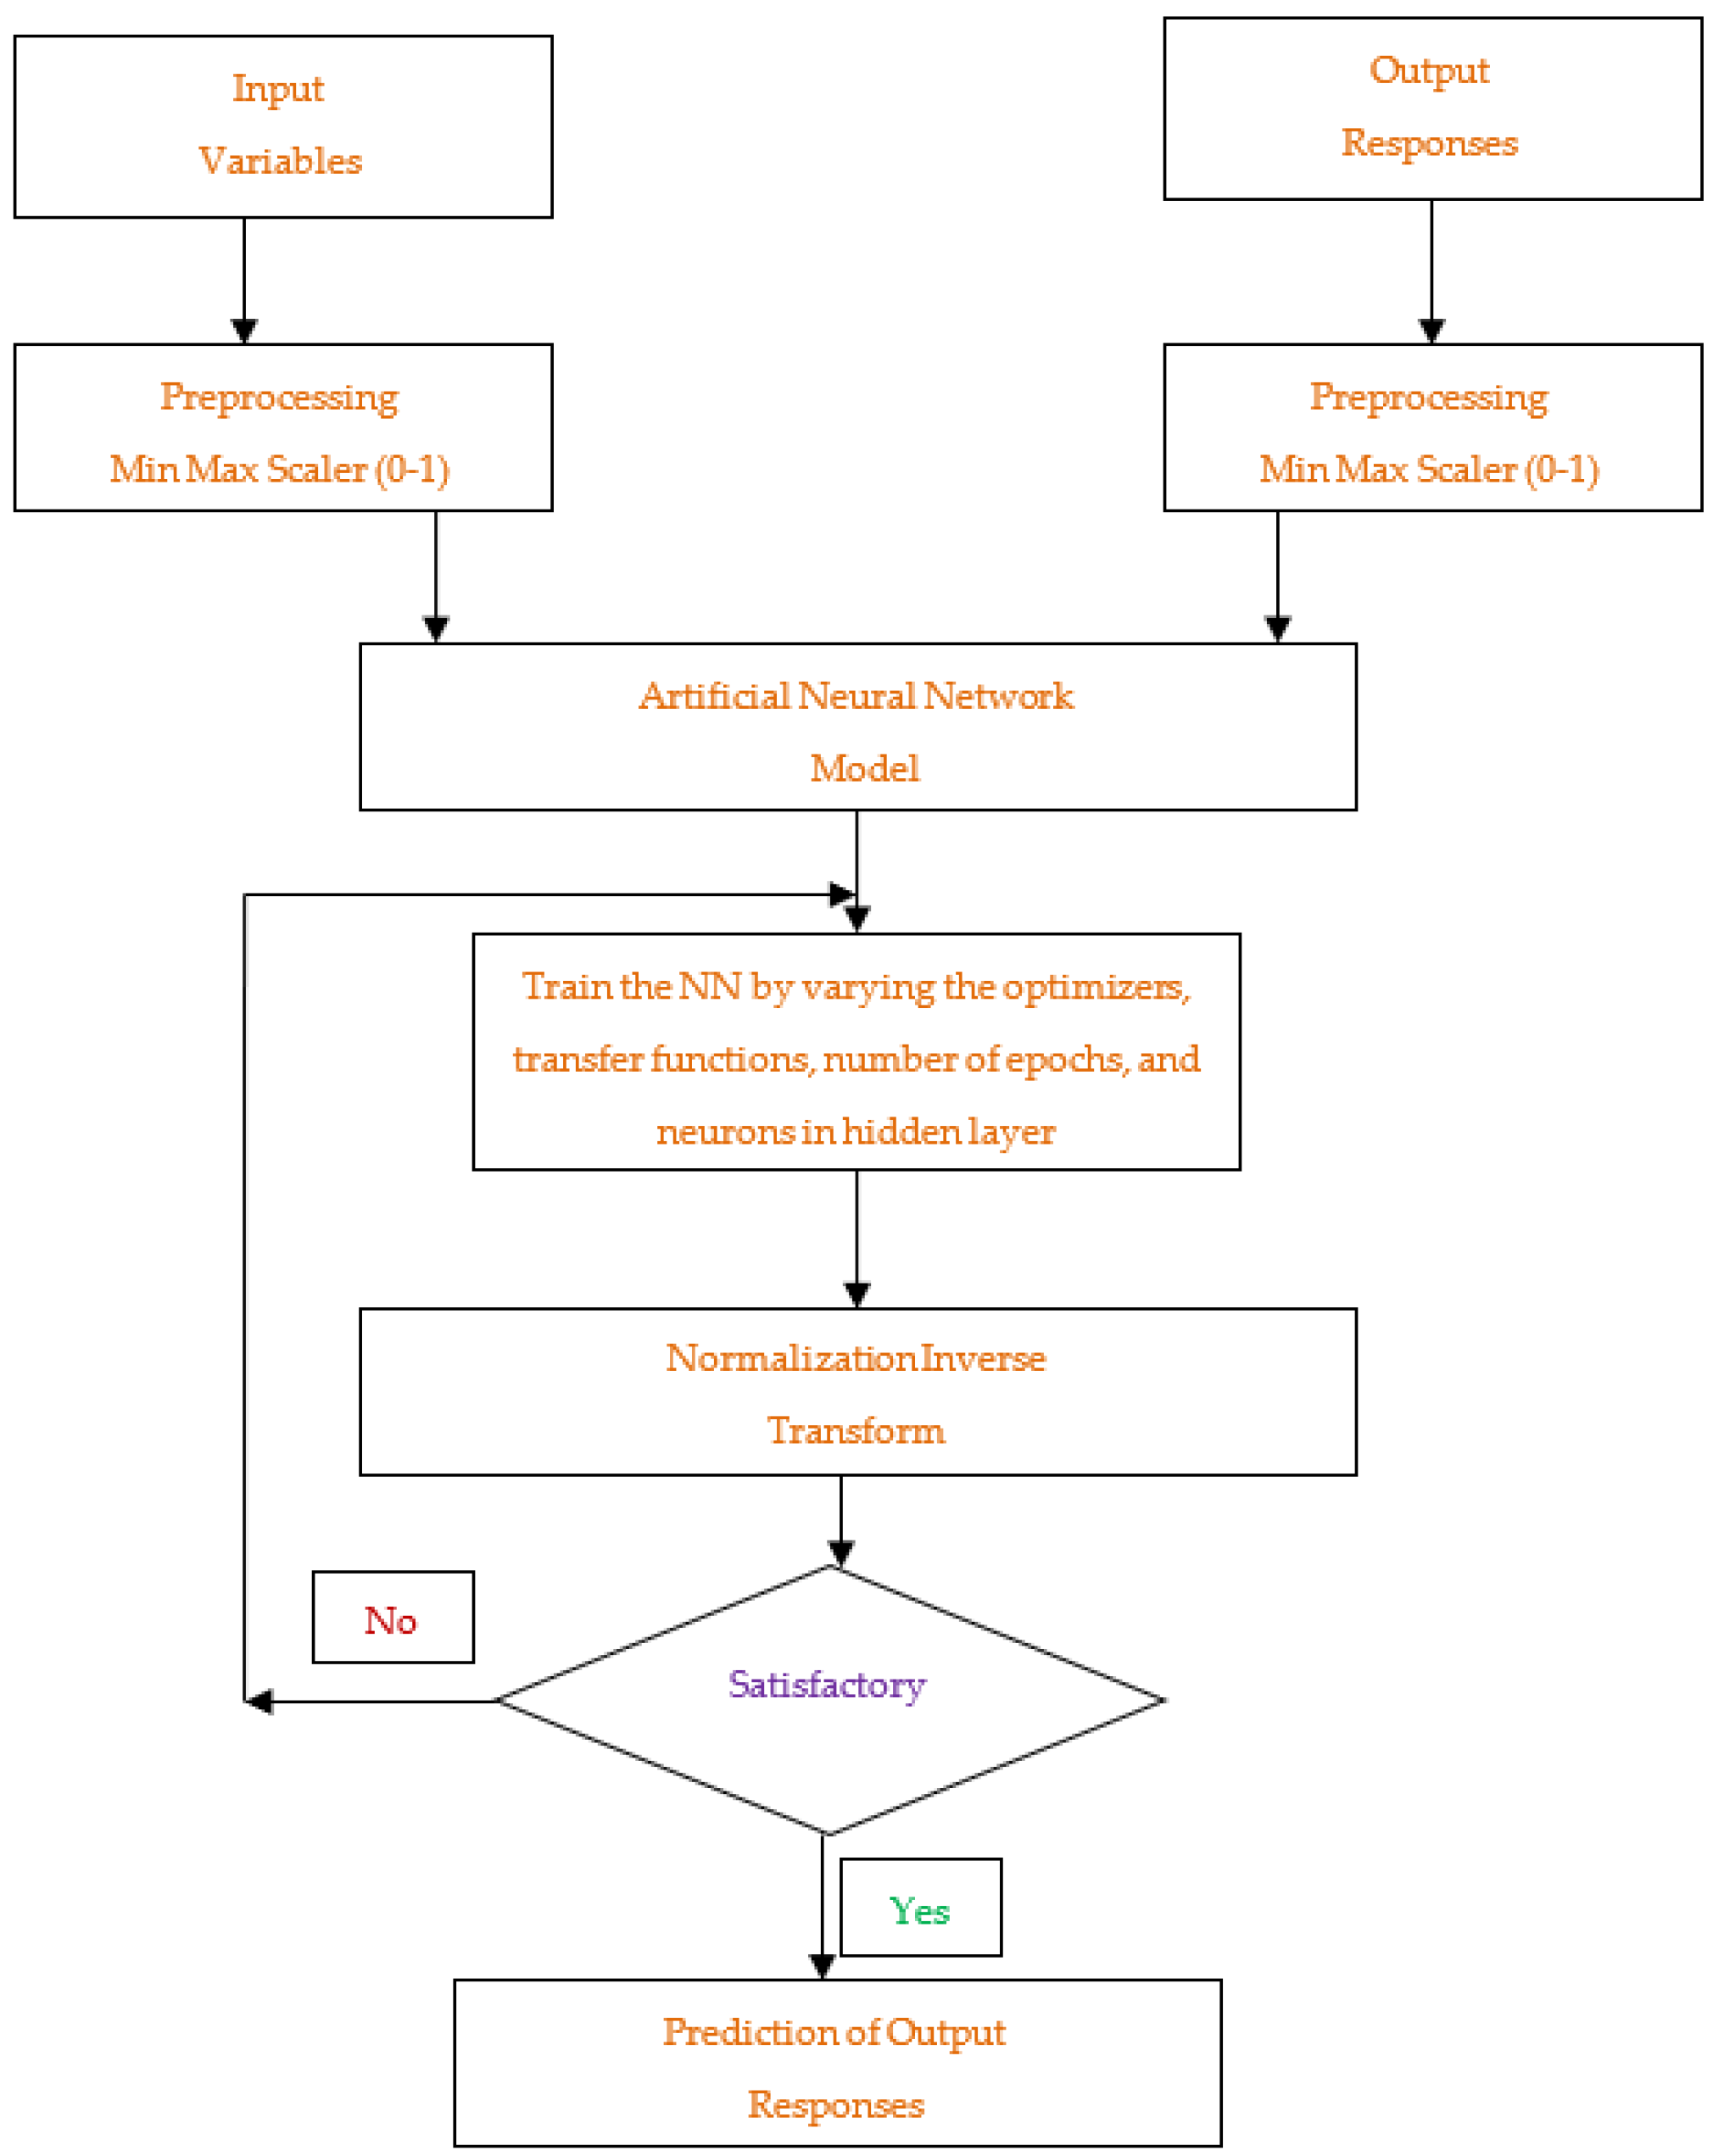
Preprocessing, and Modeling of ANN
- Defining input and output parameters;
- Preprocessing of data (output and input);
- Defining optimizer, transfer function, number of neurons in the hidden layer, and number of epochs;
- Step 1: Adam optimizer with sigmoid transfer function was chosen and evaluated for a varied number of neurons in hidden layers and epochs. By keeping adam optimizer and sigmoid transfer function constant, for each neuron in the hidden layer, four iterations were executed;
- Step 2: Tabulation and plotting of corresponding data (Training MSE and r, Validation MSE and r of output variables);
- Step 1 and Step 2 were repeated for the Nadam optimizer with a Softmax transfer function and Adagrad optimizer with the Relu transfer function;
4. Results and Discussion
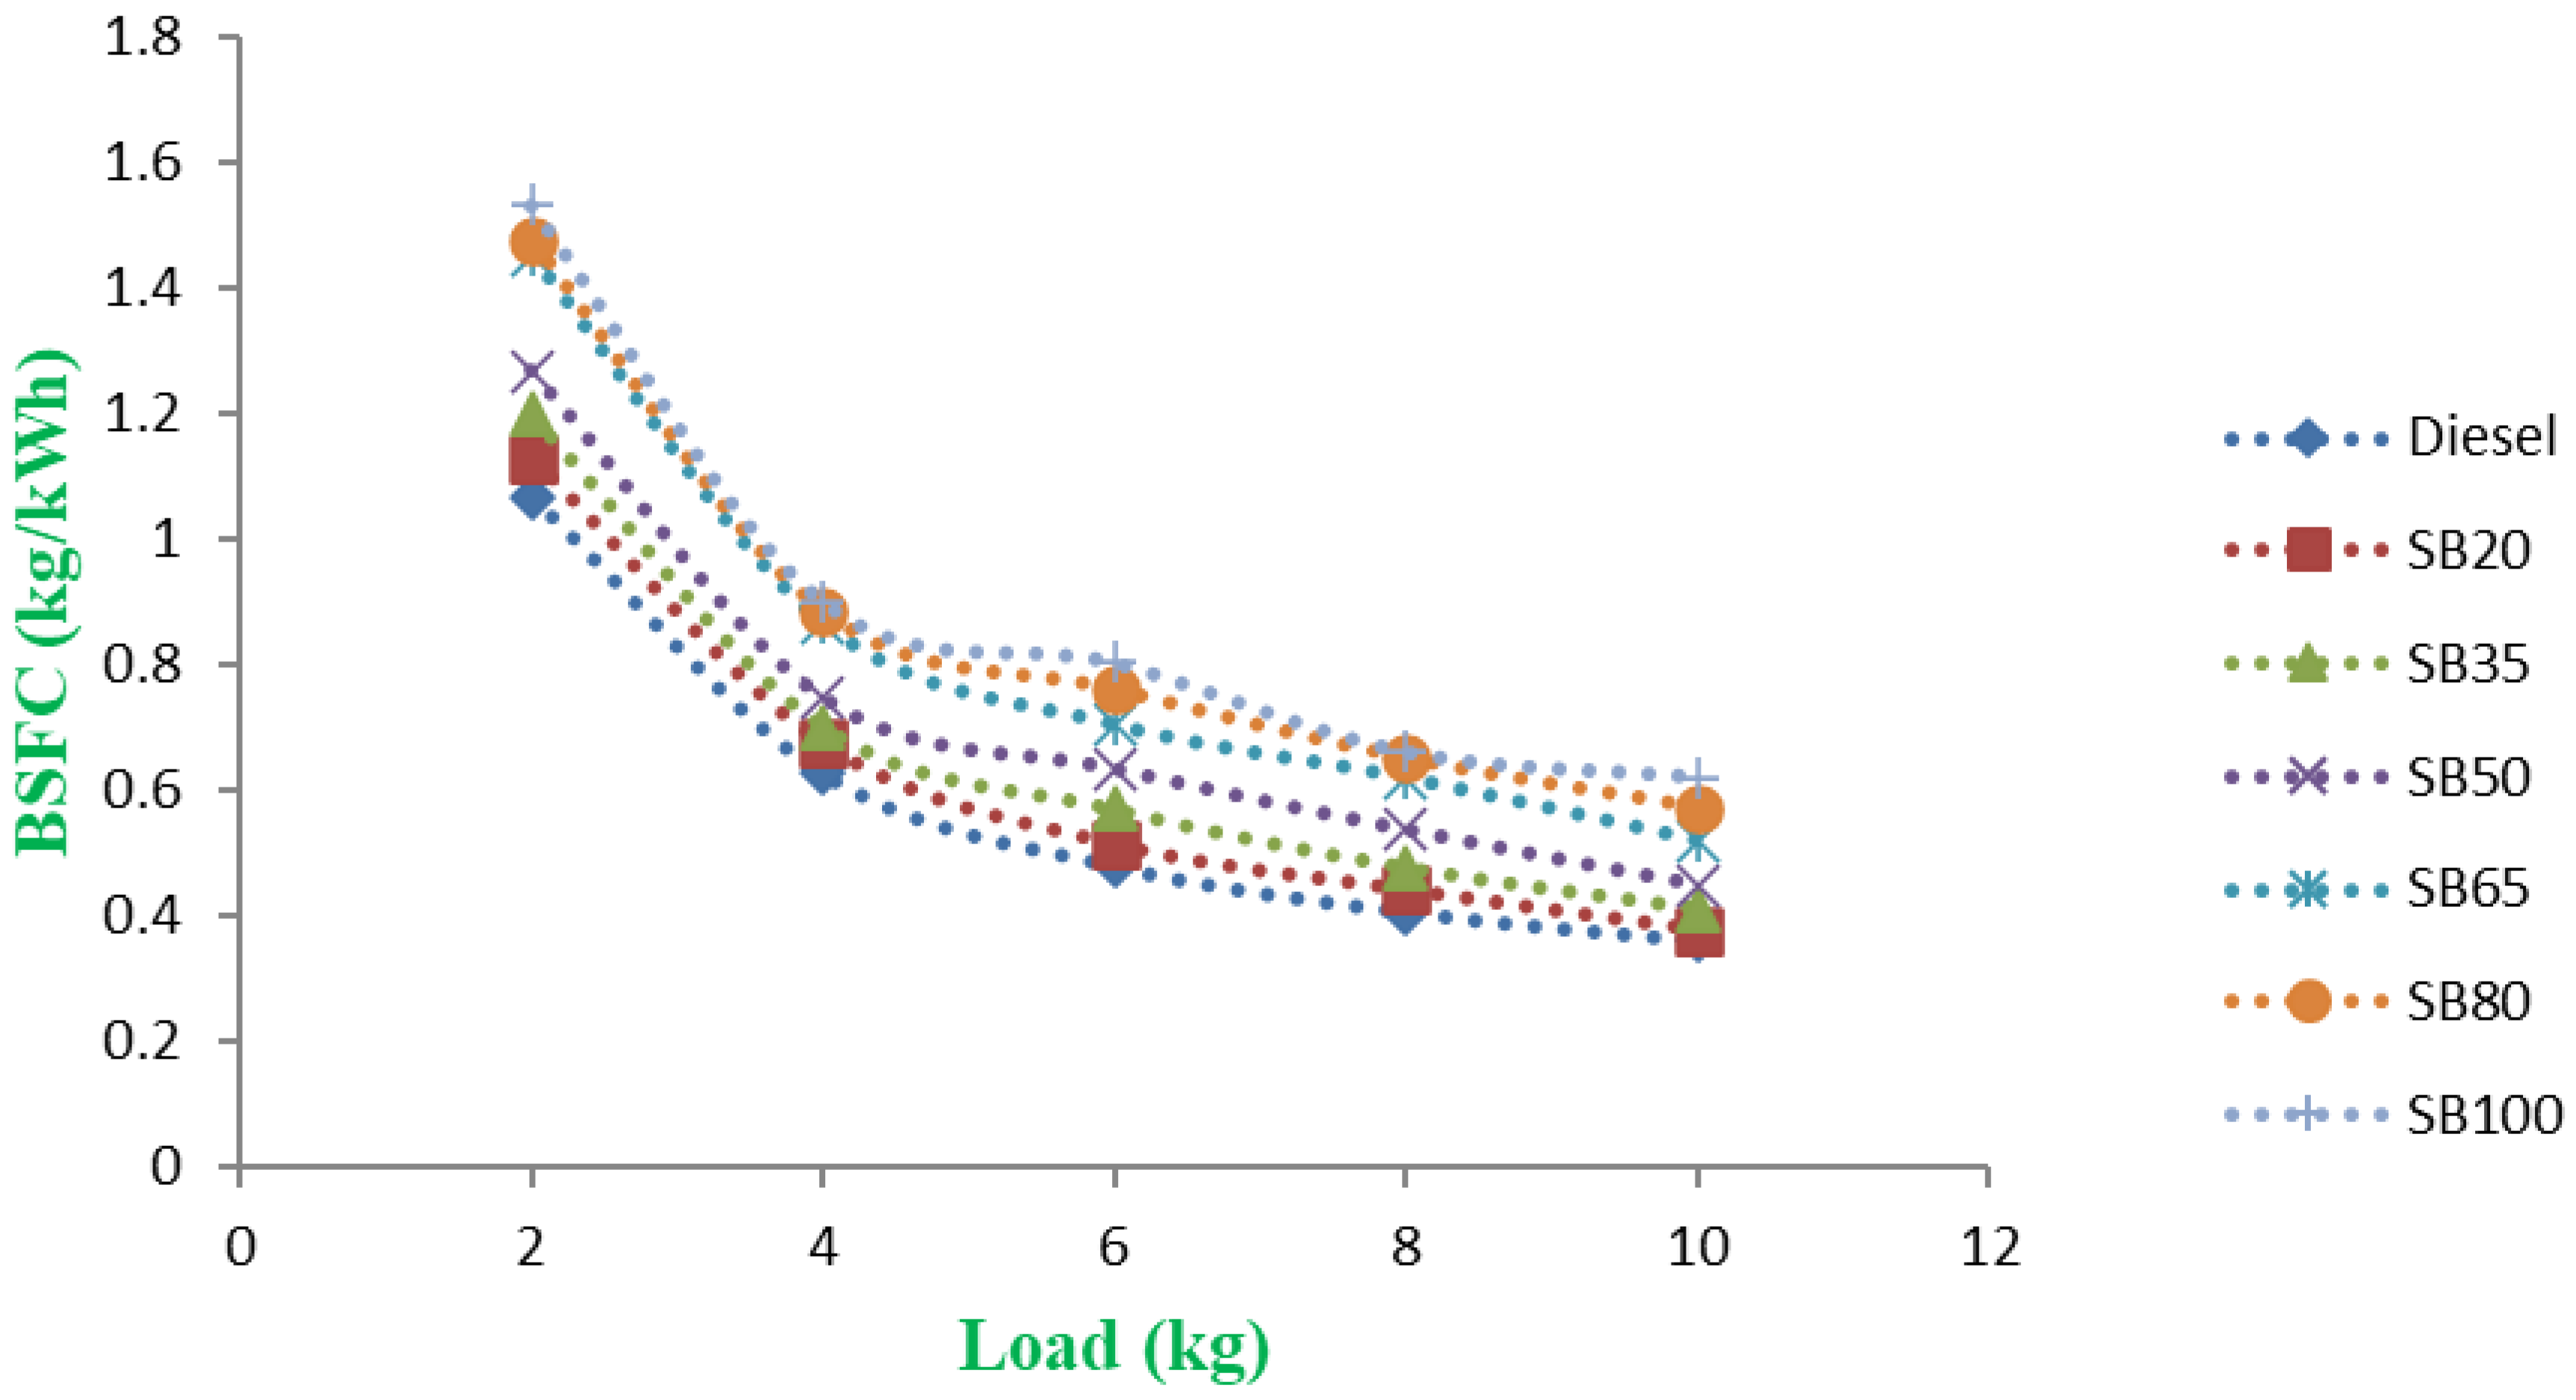
4.1. Impact of Brake Specific Fuel Consumption
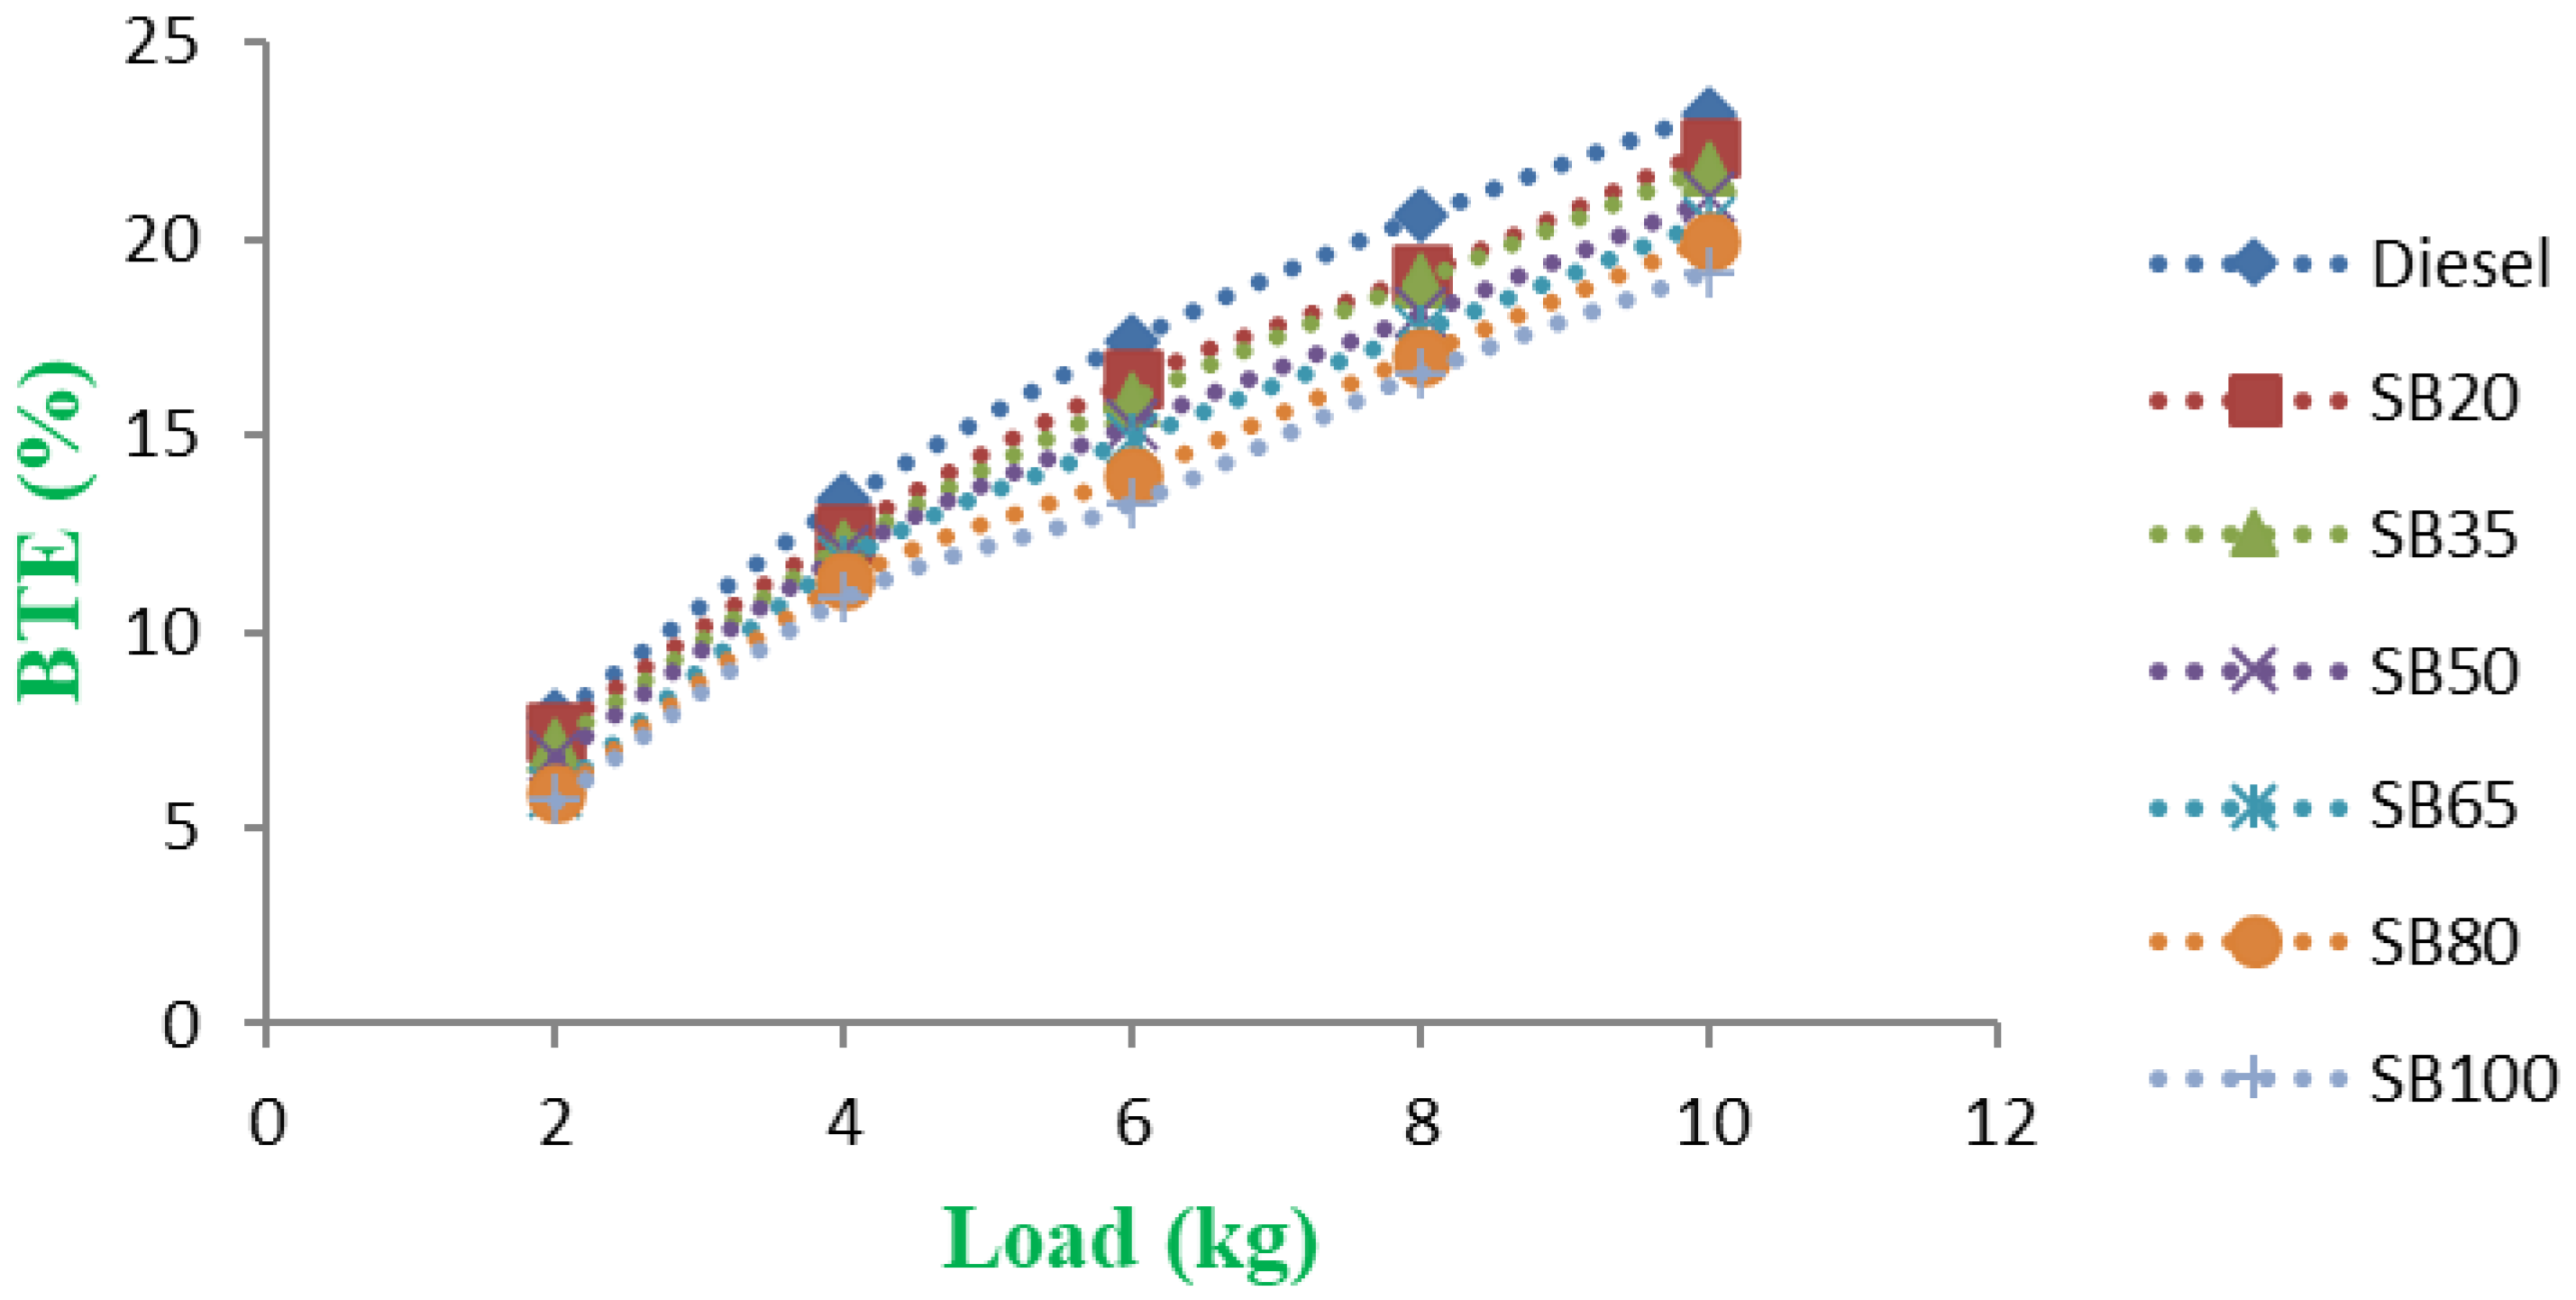
4.2. Impact of Brake Thermal Efficiency
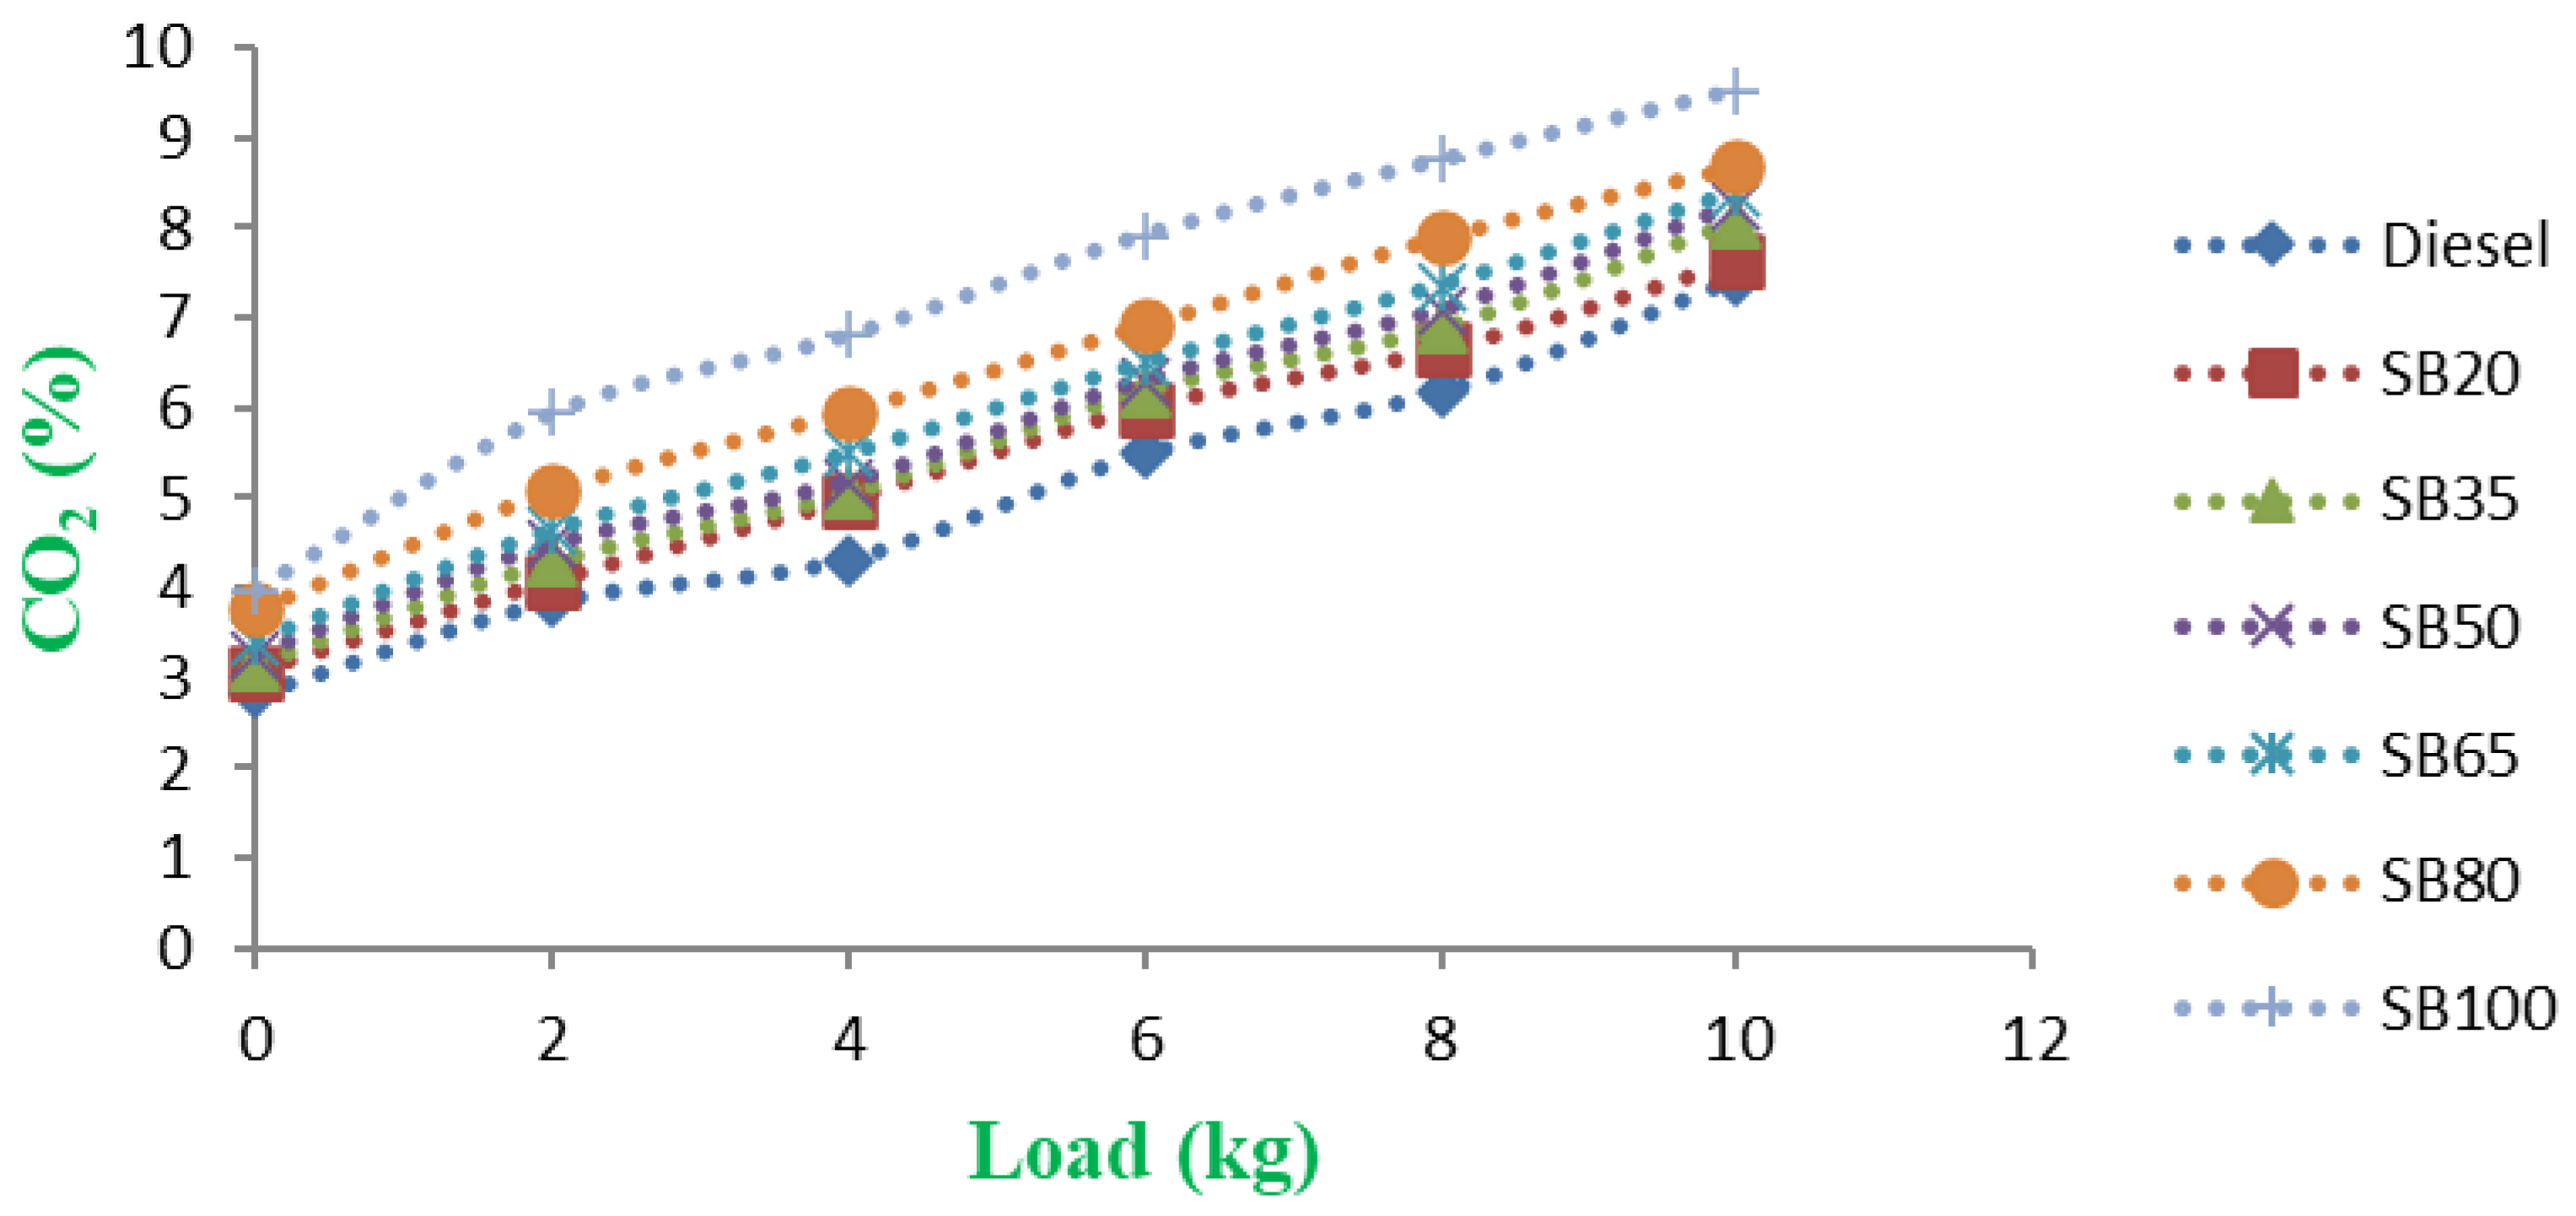
4.3. Impact of Carbon Dioxide (CO2) Emissions
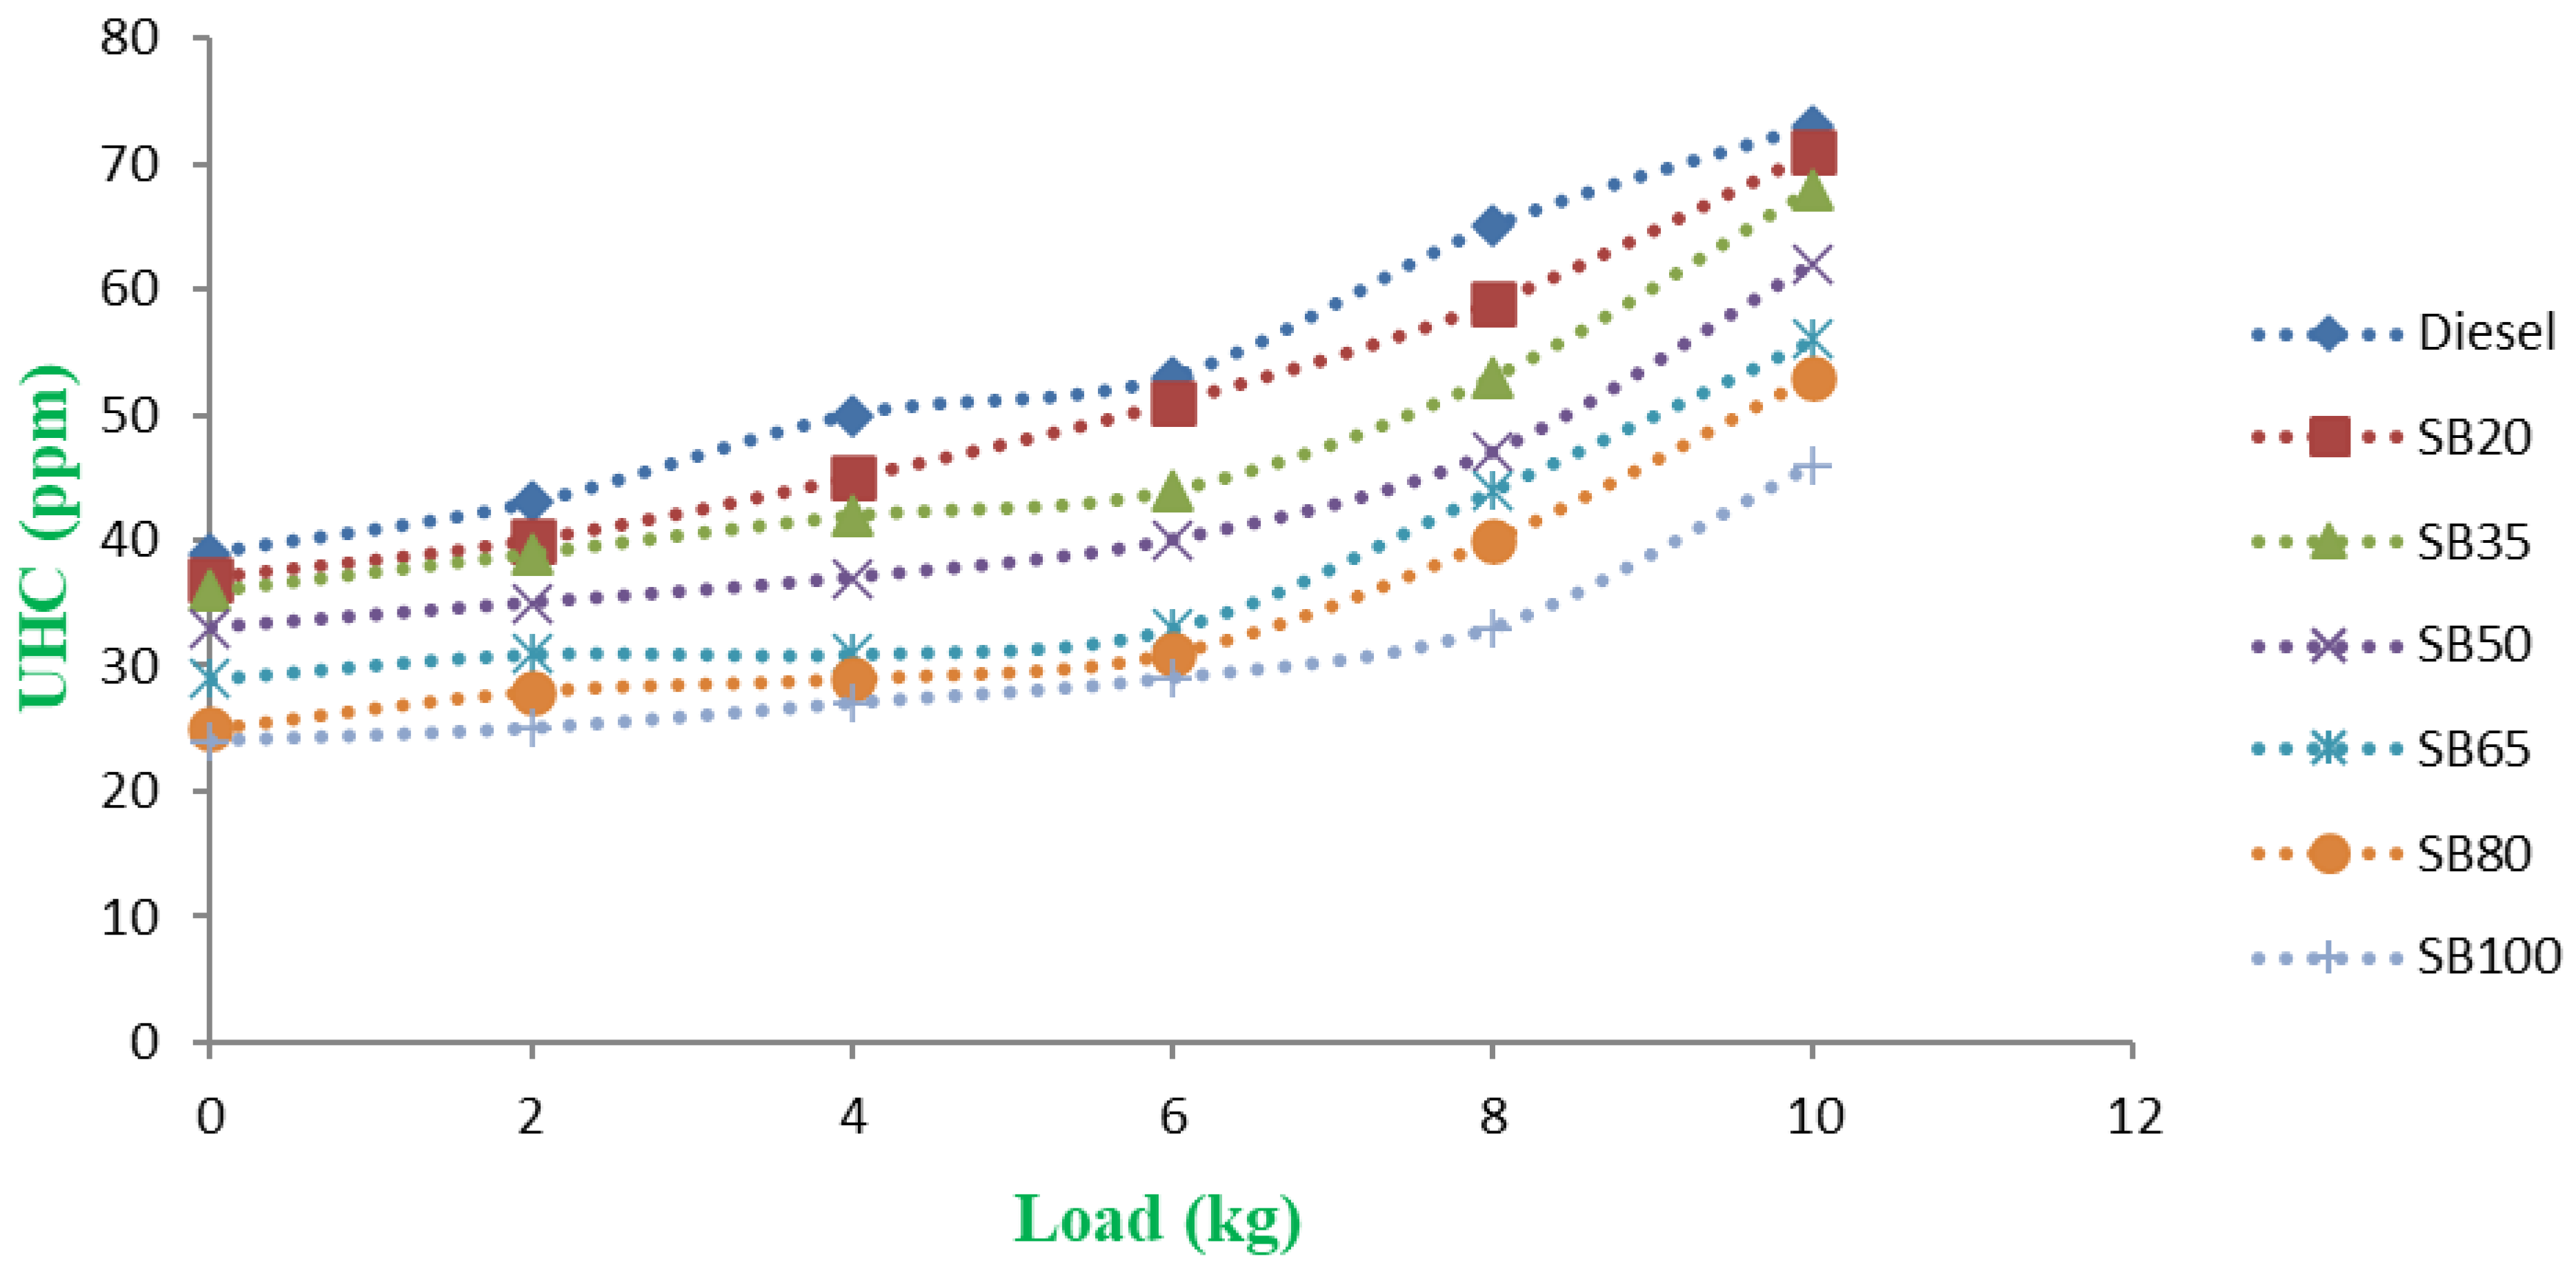
4.4. Impact of Unburnt Hydrocarbons
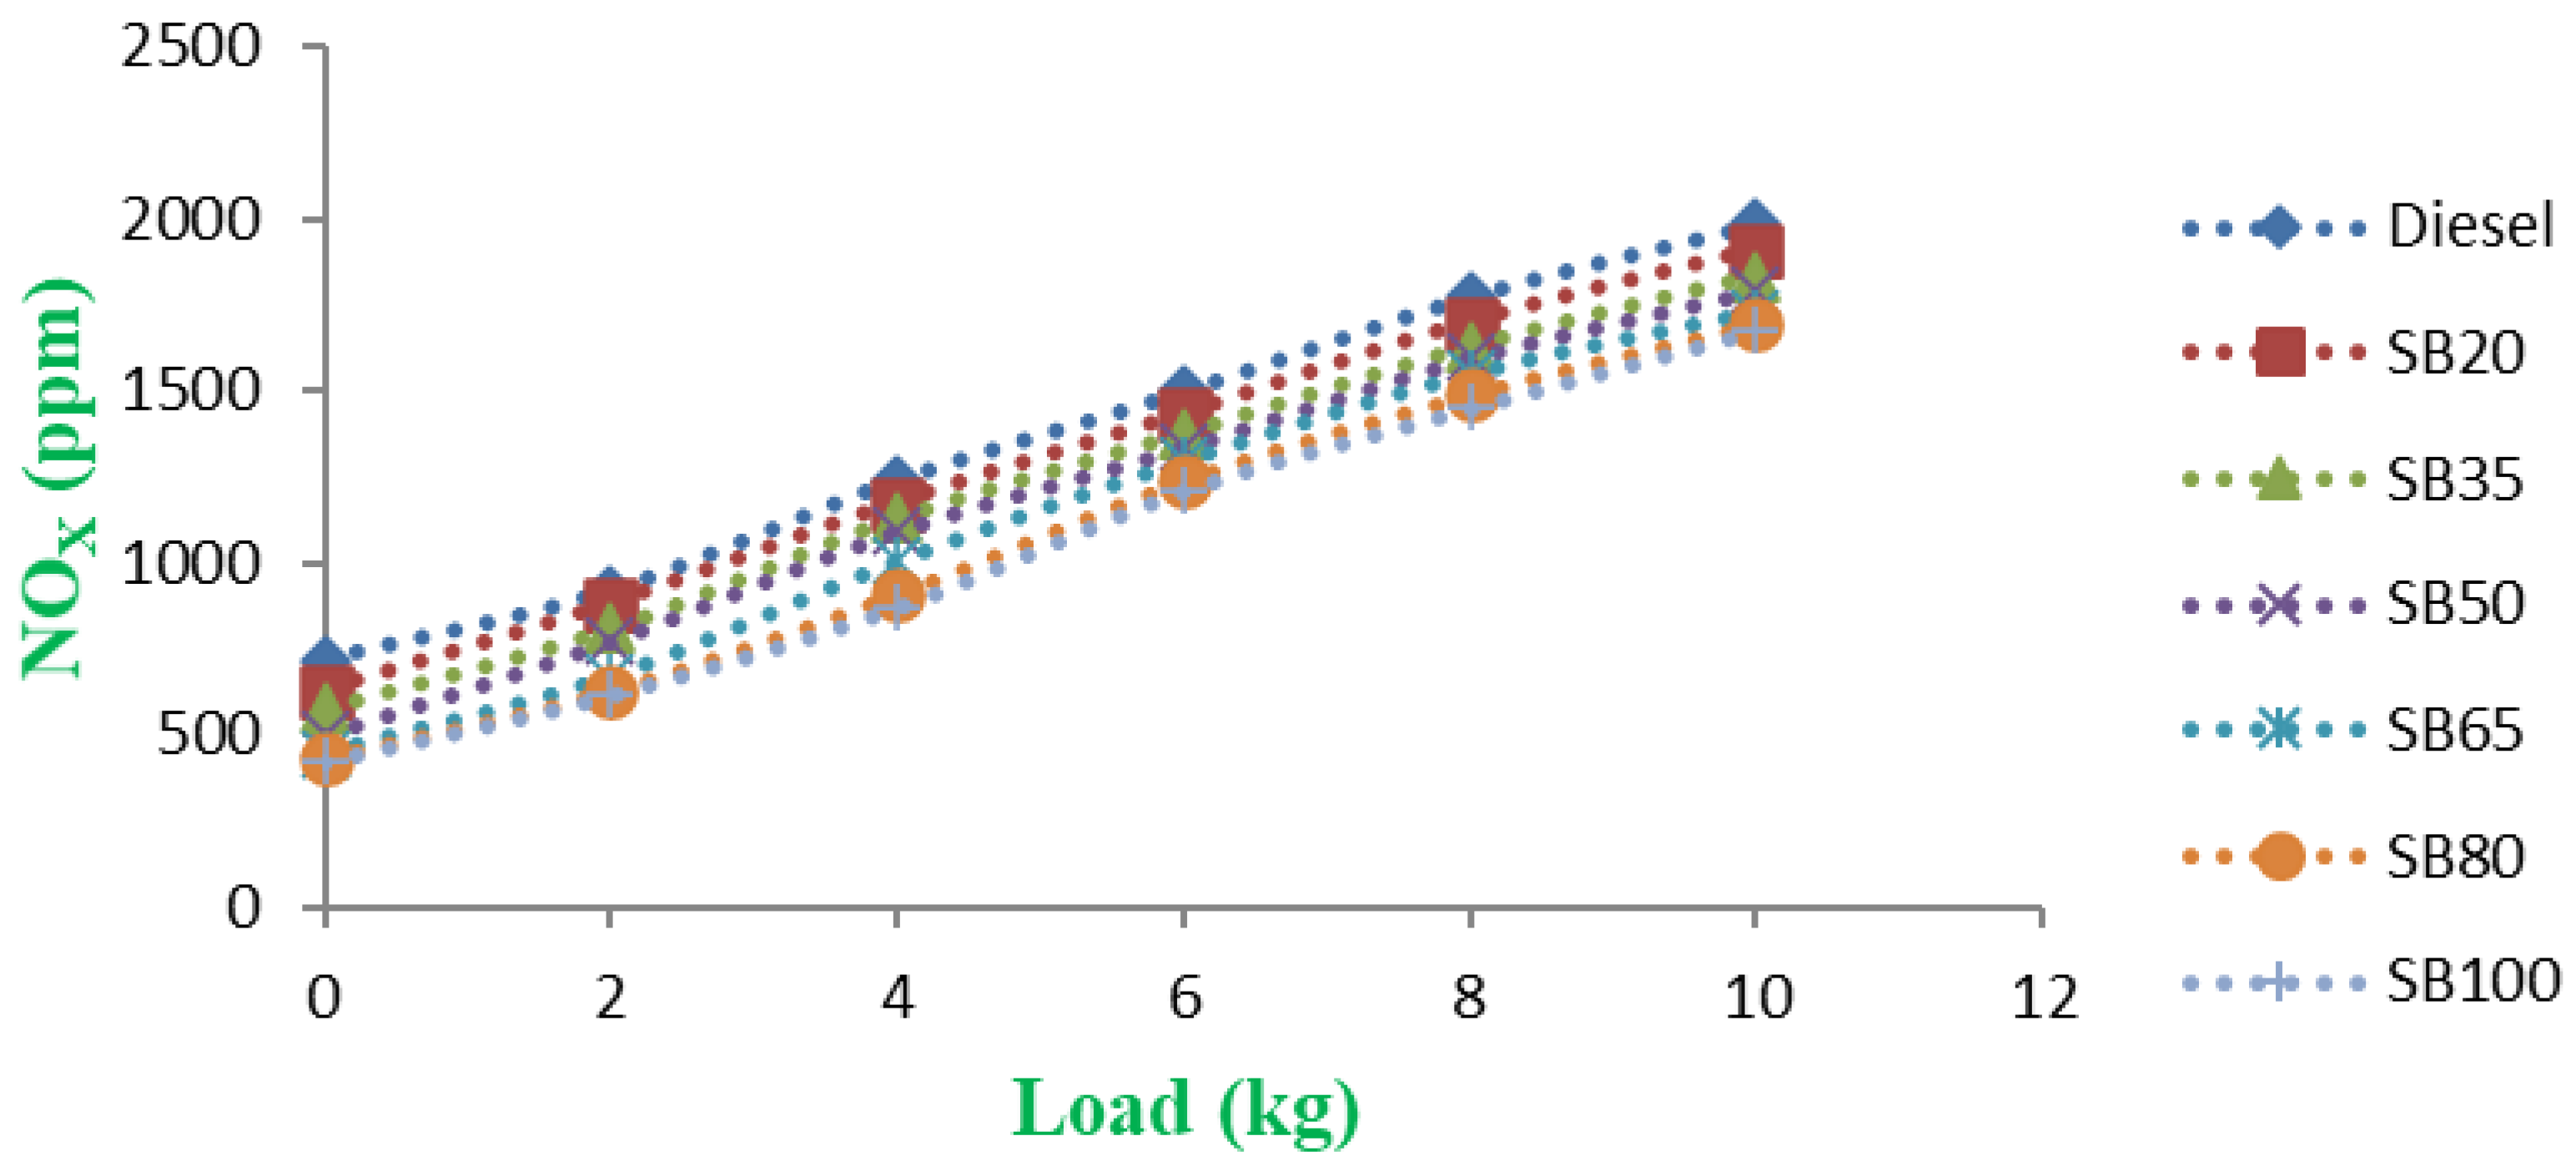
4.5. Impact of Nitrogen Oxides (NOX) Emissions
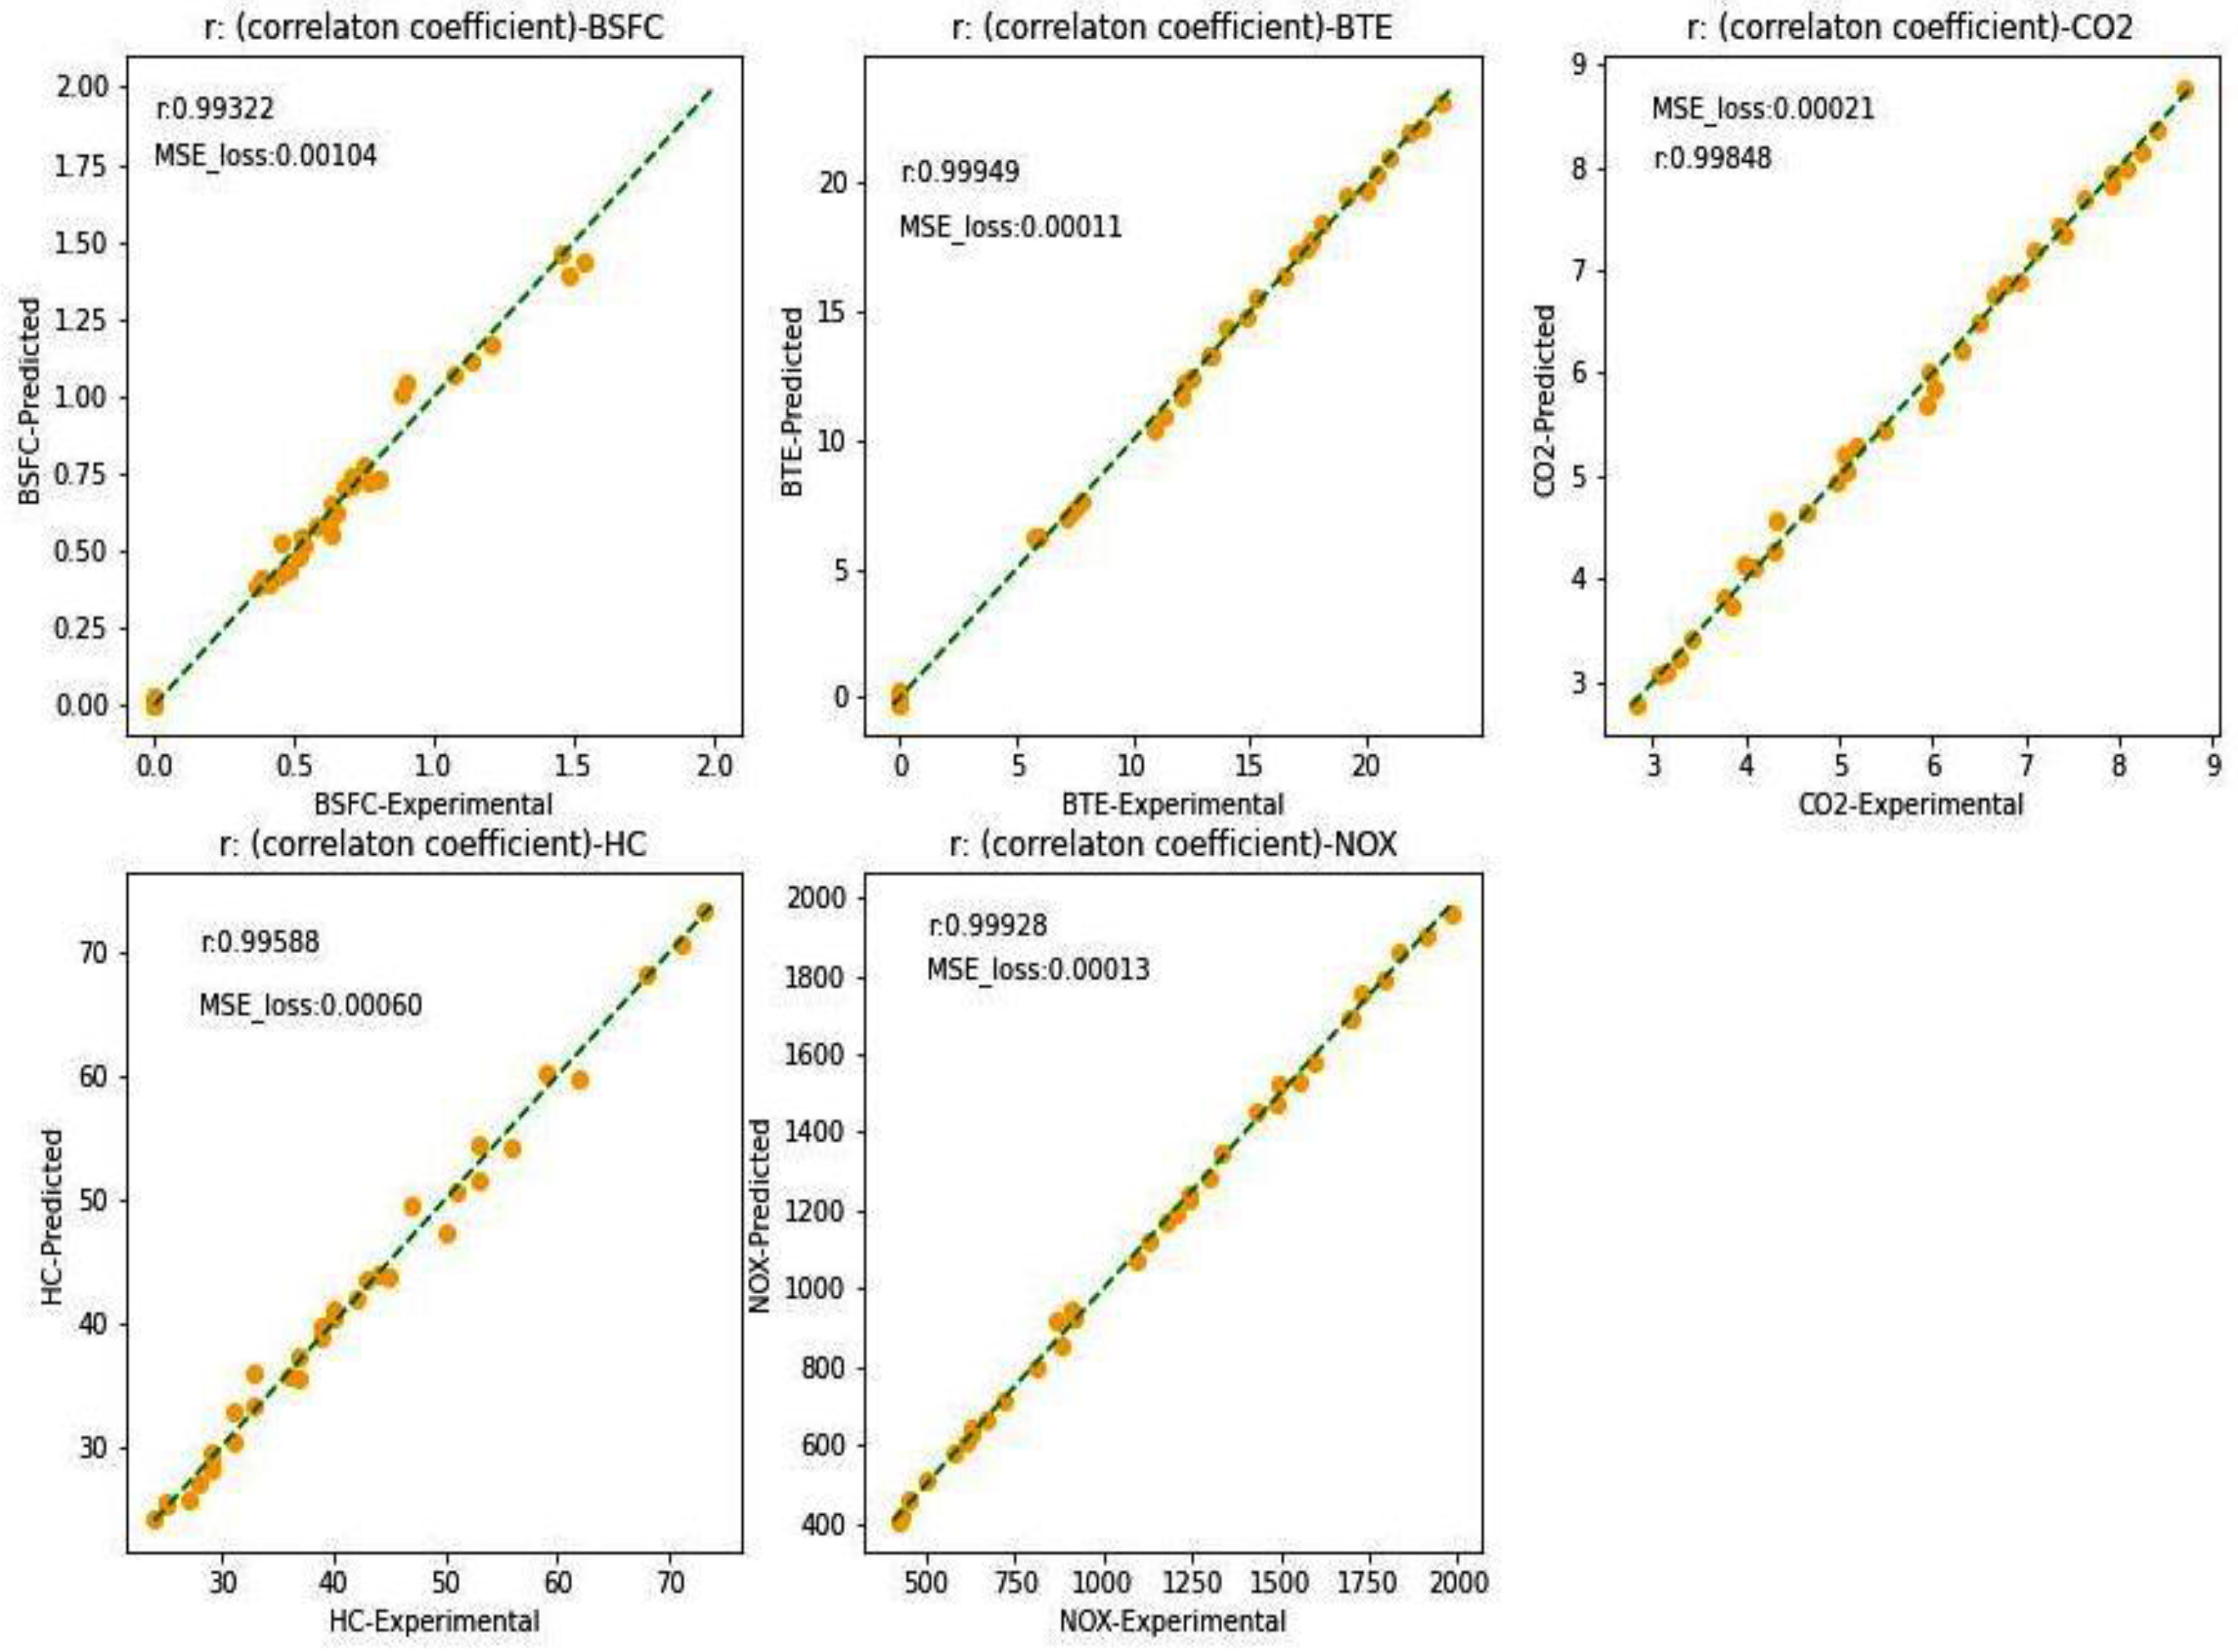
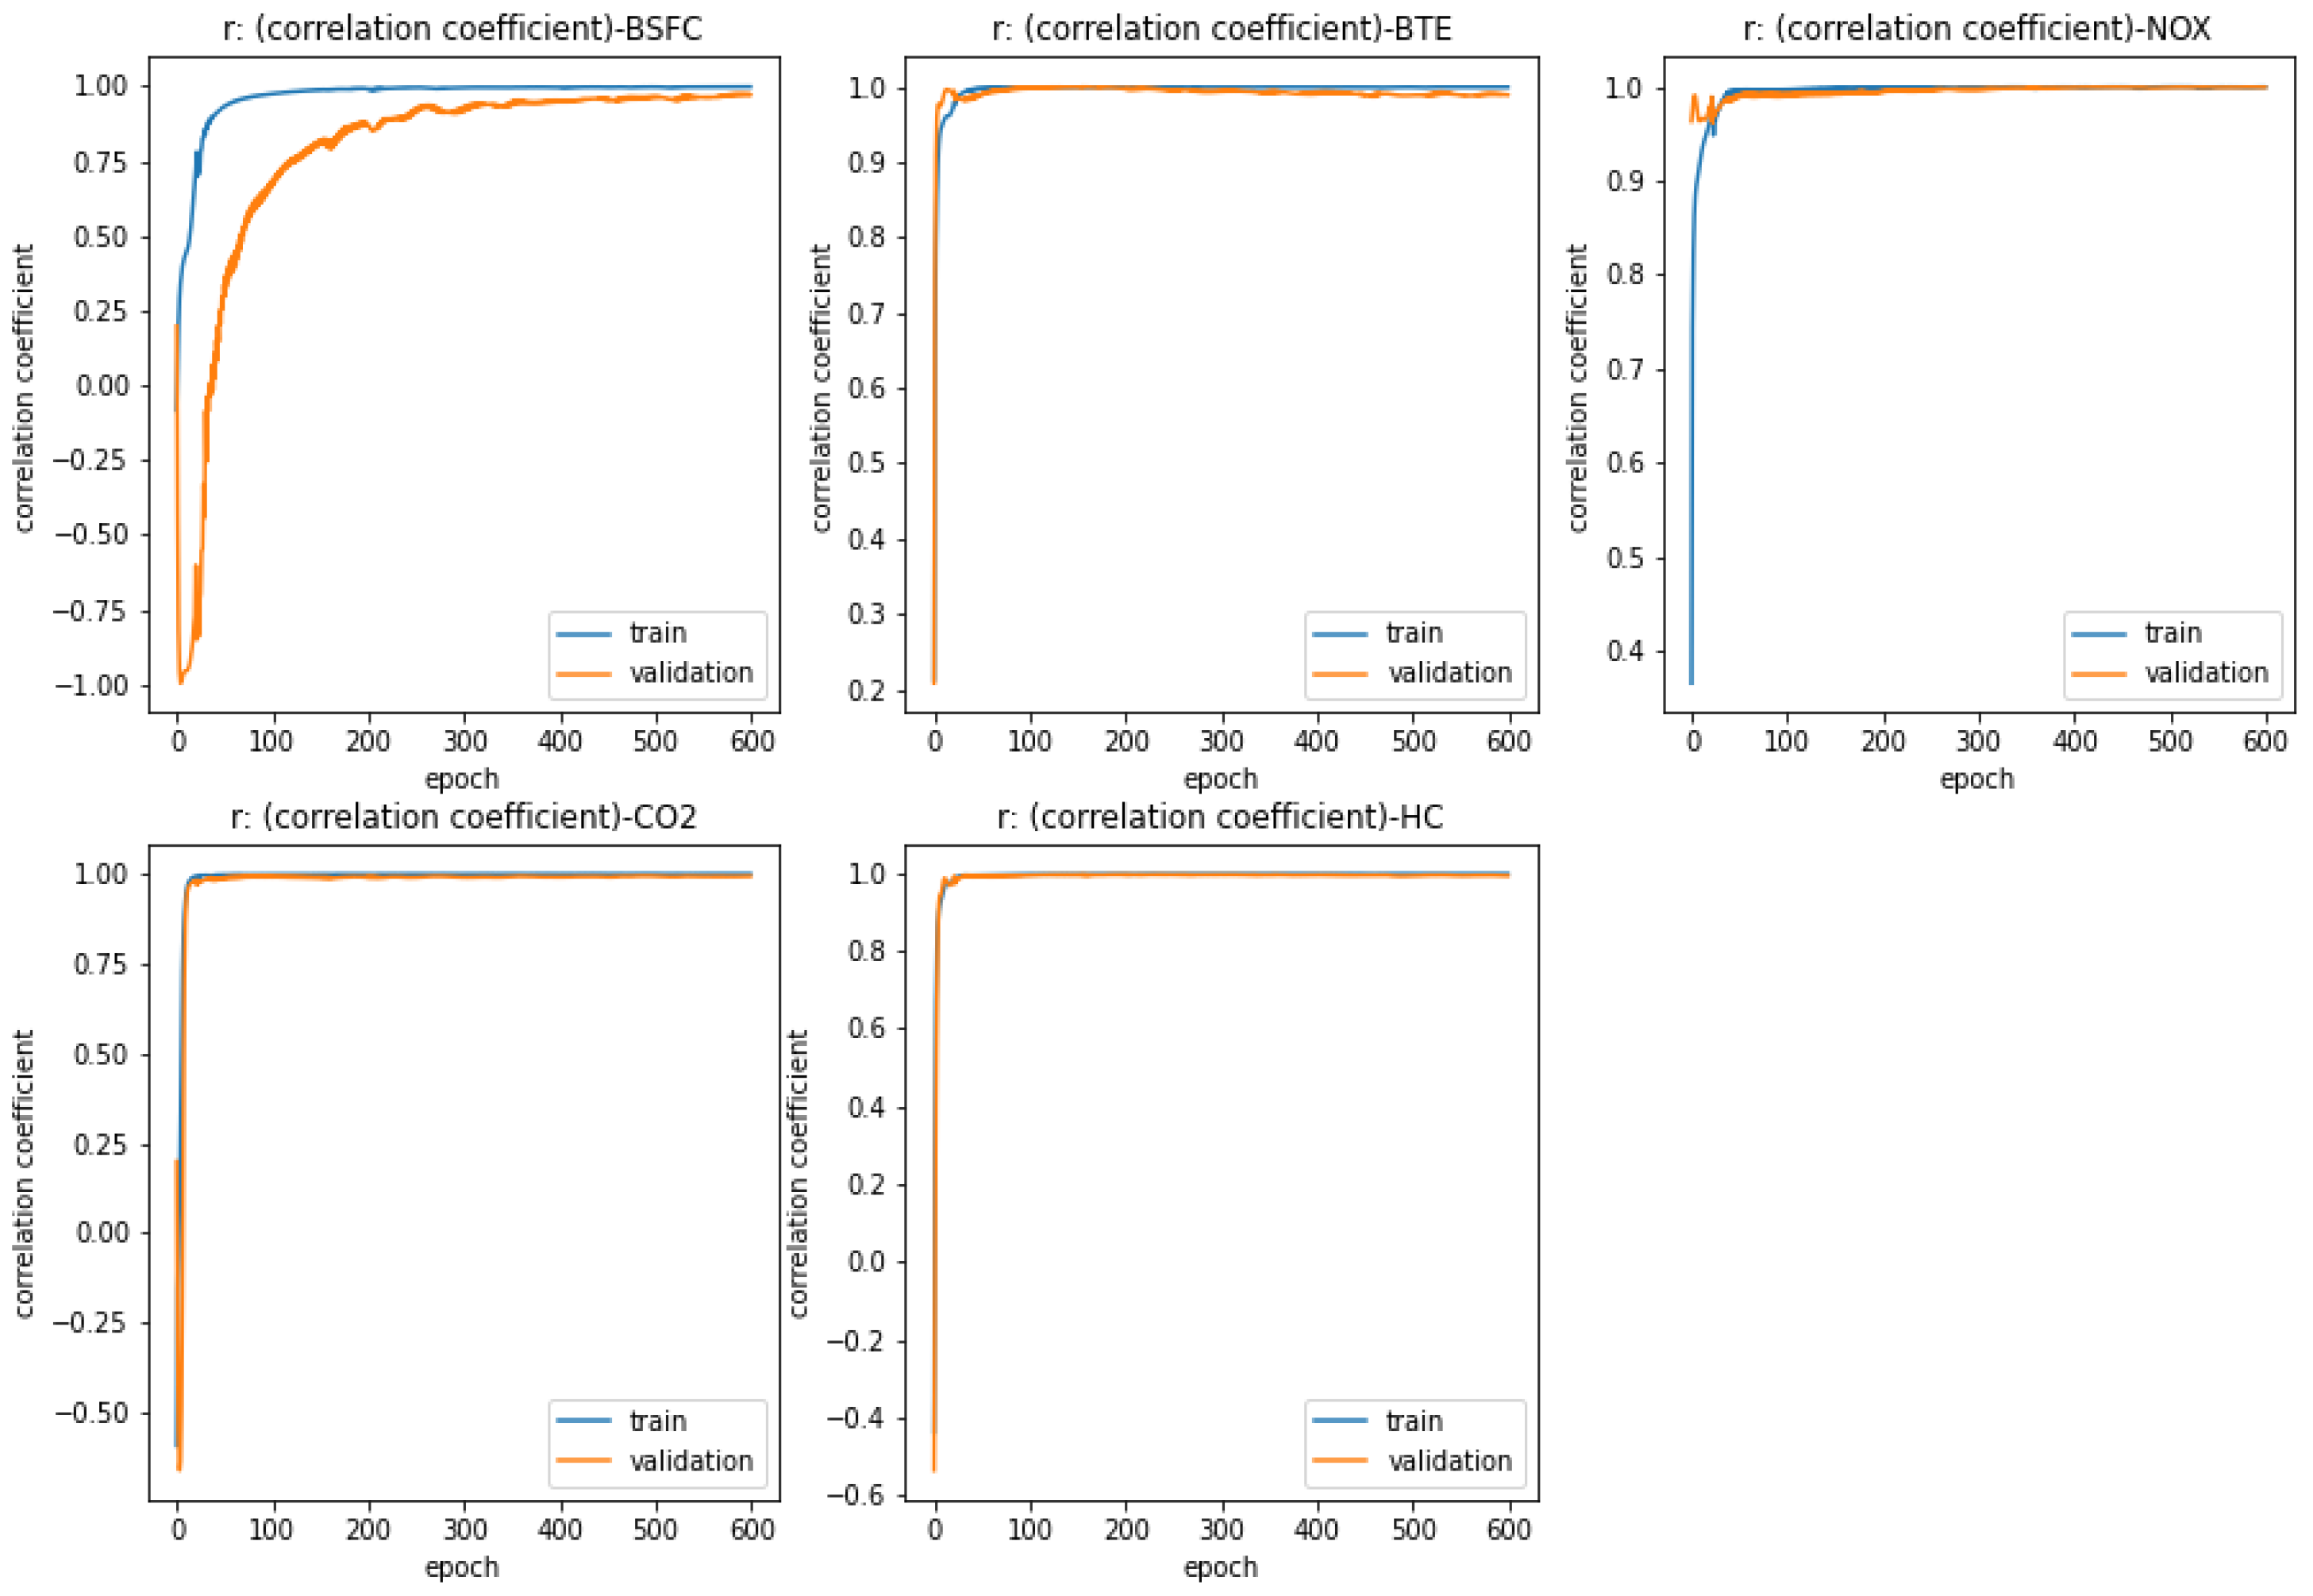
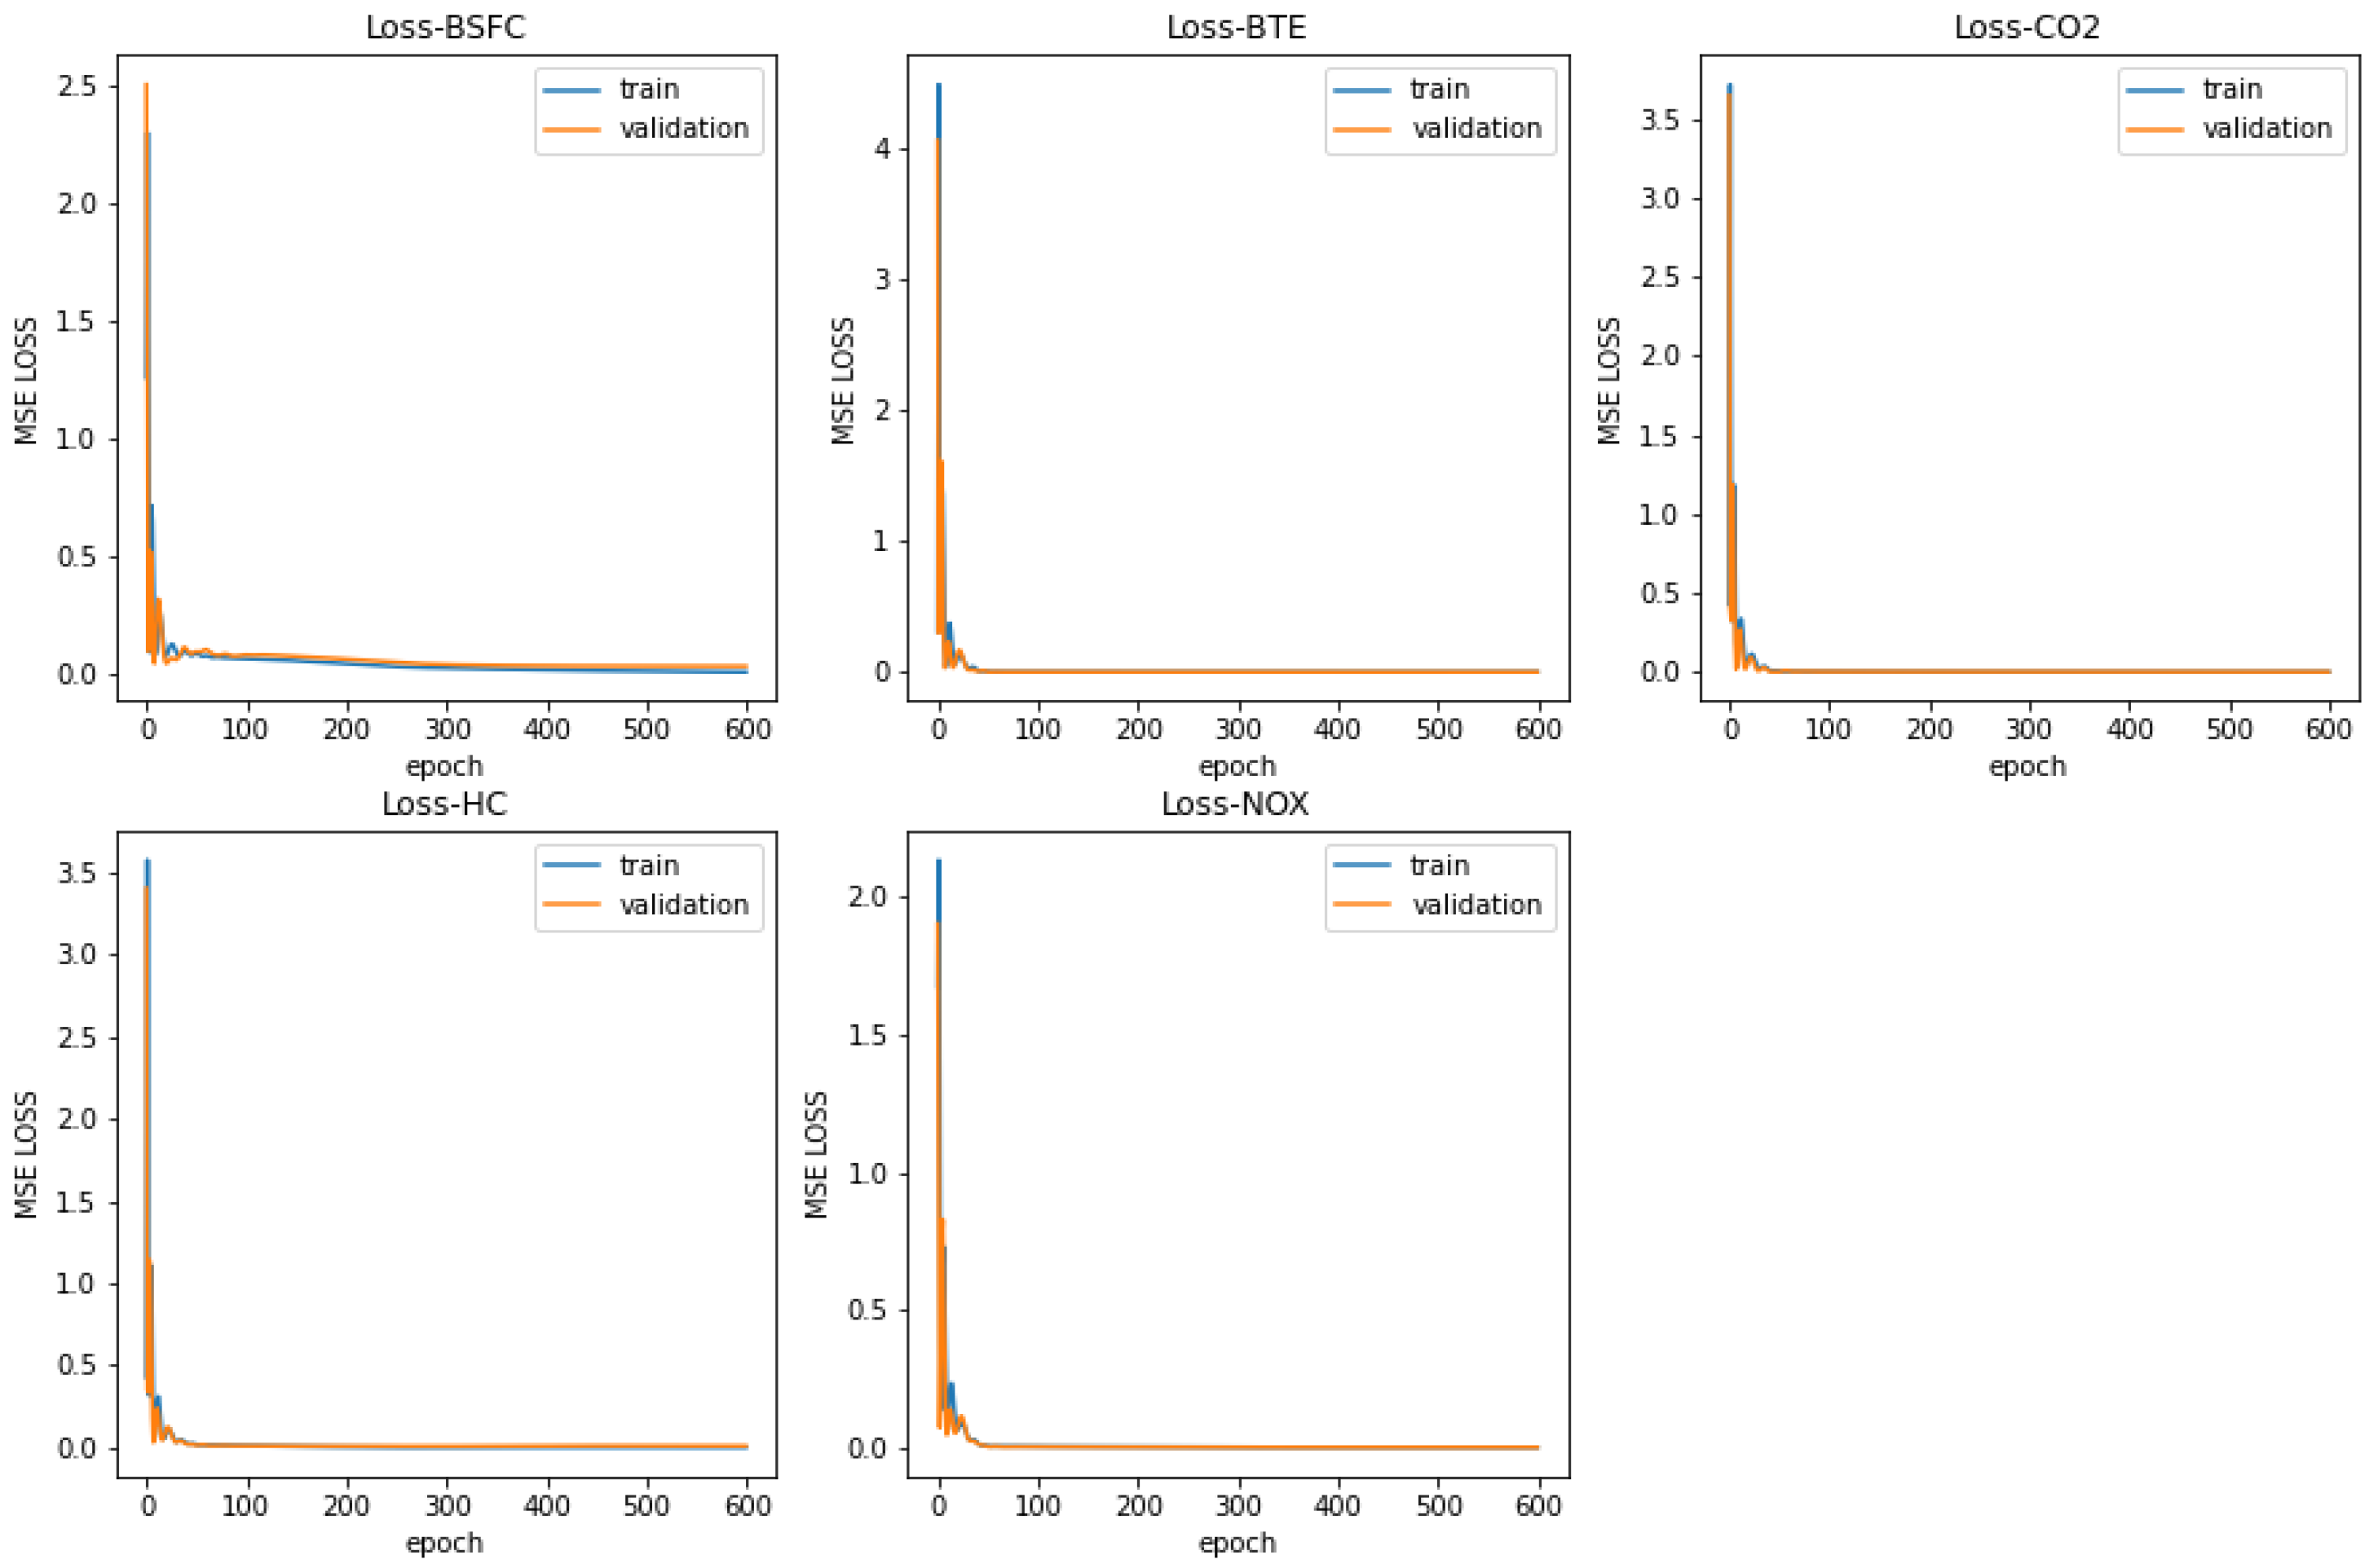
4.6. Analysis of ANN
5. Main Findings
- SB100 depicted a significant reduction in NOX and thermal efficiency. Bio-diesel derived from micro-algae spirulina, among one of the alternative energy sources that can be utilized instead of diesel, has a significant prospective for lowering NOX concentrations;
- As opposed to the spirulina blend SB0 has decreased specific fuel consumption;
- For prediction of CI Engine attributes ANN framework utilizing python with the Tensor flow as backend and Keras framework was implemented;
- Optimizers such as adam, nadam, and adagrad were evaluated and adam was found to be the optimum.
6. Conclusions
- The outcomes demonstrated a reduction in BTE, HC, and NOX concentrations when micro-algae spirulina blends were applied; however, a rise inCO2 and BSFC was observed relative to SB0;
- SB100 was found to be the minimum BTE as compared to other blends. SB100 has a substantial impact on reducing NOX concentrations, but CO2 enhanced is correlative to diesel (SB0);
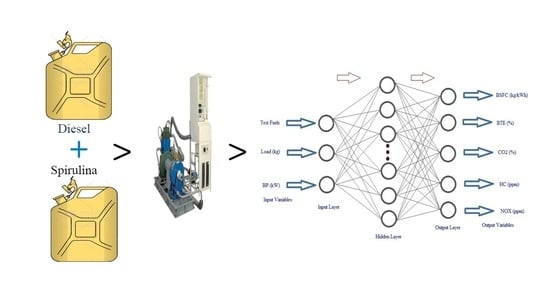
- The proposed ANN was a three-layer one that utilized output variables (NOX, HC, CO2, BTE, and BSFC) and input variables (load, test fuels, and BP);
- Adam optimizer with sigmoid transfer function was found to be best suited for training the network. The optimum network configuration was composed of 32 neurons in a hidden layer, and the best architecture of ANN was found to be 3-32-5;
- The overall network validation and training MSE loss was found to be 0.00175 and 0.00039, respectively. The experimental results and model outcomes are correlated with each other and revealed that the ANN technique has given optimum results.
Author Contributions
Funding
Institutional Review Board Statement
Informed Consent Statement
Data Availability Statement
Conflicts of Interest
Nomenclature
| ANN | Artificial Neural Network |
| BSFC | Brake Specific Fuel Consumption |
| BTE | Brake Thermal Efficiency |
| CN | Cetane Number |
| CO | Carbon-Monoxide |
| CO2 | Carbon-Dioxide |
| DI | Direct Injection |
| MSE | Mean Squared Error |
| UHC | Unburnt Hydro-Carbons |
| NOX | Nitrogen Oxide |
| O2 | Oxygen |
| Oi | Output for ith trail case |
| ppm | Parts per million |
| r | Correlation Coefficient |
| TC | Turbo Charged |
| Ti | Target for ith trial case |
| Val | Validation |
| Train | Training |
| BP | Brake power |
References
- Datta, A.; Mandal, B.K. A Comprehensive Review of Biodiesel as an Alternative Fuel for Compression Ignition Engine. Renew. Sustain. Energy Rev. 2016, 57, 799–821. [Google Scholar] [CrossRef]
- Dwivedi, G.; Sharma, M.P. Prospects of Biodiesel from Pongamia in India. Renew. Sustain. Energy Rev. 2014, 32, 114–122. [Google Scholar] [CrossRef]
- Arunprasad, S.; Balusamy, T. Experimental investigation on the performance and emission characteristics of a diesel engine by varying the injection pressure and injection timing using mixed biodiesel. Int. J. Green Energy 2018, 15, 376–384. [Google Scholar] [CrossRef]
- Singh, D.; Sharma, D.; Soni, S.L.; Sharma, S.; Kumar Sharma, P.; Jhalani, A. A Review on Feedstocks, Production Processes, and Yield for Different Generations of Biodiesel. Fuel 2020, 262, 116553. [Google Scholar] [CrossRef]
- Aro, E.M. From First Generation Biofuels to Advanced Solar Biofuels. Ambio 2016, 45, 24–31. [Google Scholar] [CrossRef]
- Alalwan, H.A.; Alminshid, A.H.; Aljaafari, H.A.S. Promising Evolution of Biofuel Generations. Subject Review. Renew. Energy Focus 2019, 28, 127–139. [Google Scholar]
- Venkatesan, H.; Rose, G.J.J.; Vijayarengan, P.; Sivamani, S.; Krishnan, J.; Thomai, M.P. Predicting the combustion behaviour of compression ignition engine fuelled with biodiesel from Stoechosper mummarginatum, a macro algae. Environ. Sci. Pollut. Res. 2021, 28, 63464–63479. [Google Scholar] [CrossRef]
- Yusri, I.M.; Abdul Majeed, A.P.P.; Mamat, R.; Ghazali, M.F.; Awad, O.I.; Azmi, W.H. A Review on the Application of Response Surface Method and Artificial Neural Network in Engine Performance and Exhaust Emissions Characteristics in Alternative Fuel. Renew. Sustain. Energy Rev. 2018, 90, 665–686. [Google Scholar] [CrossRef]
- Uslu, S. Optimization of Diesel Engine Operating Parameters Fueled with Palm Oil-Diesel Blend: Comparative Evaluation between Response Surface Methodology (RSM) and Artificial Neural Network (ANN). Fuel 2020, 276, 117990. [Google Scholar] [CrossRef]
- Manimaran, R.; Mohanraj, T.; Venkatesan, M. ANN modeling for forecasting of VCR engine performance and emission parameters fuelled with green diesel extracted from waste biomass resources. Environ. Sci. Pollut. Res. 2022, 29, 51183–51210. [Google Scholar] [CrossRef]
- Shrivastava, P.; Salam, S.; Verma, T.N.; Samuel, O.D. Experimental and Empirical Analysis of an IC Engine Operating with Ternary Blends of Diesel, Karanja and Roselle Biodiesel. Fuel 2020, 262, 116608. [Google Scholar] [CrossRef]
- Taghavi, M.; Gharehghani, A.; Nejad, F.B.; Mirsalim, M. Developing a Model to Predict the Start of Combustion in HCCI Engine Using ANN-GA Approach. Energy Convers. Manag. 2019, 195, 57–69. [Google Scholar] [CrossRef]
- Uslu, S.; Celik, M.B. Prediction of Engine Emissions and Performance with Artificial Neural Networks in a Single Cylinder Diesel Engine Using Diethyl Ether. Eng. Sci. Technol. Int. J. 2018, 21, 1194–1201. [Google Scholar] [CrossRef]
- Datta, A.; Mandal, B.K. Engine Performance, Combustion and Emission Characteristics of a Compression Ignition Engine Operating on Different Biodiesel-Alcohol Blends. Energy 2017, 125, 470–483. [Google Scholar] [CrossRef]
- Bueno, A.V.; Pereira, M.P.B.; de Oliveira Pontes, J.V.; de Luna, F.M.T.; Cavalcante, C.L. Performance and Emissions Characteristics of Castor Oil Biodiesel Fuel Blends. Appl. Therm. Eng. 2017, 125, 559–566. [Google Scholar] [CrossRef]
- Al-lwayzy, S.H.; Yusaf, T. Diesel Engine Performance and Exhaust Gas Emissions Using Microalgae Chlorella Protothecoides Biodiesel. Renew. Energy 2017, 101, 690–701. [Google Scholar] [CrossRef]
- Kalsi, S.S.; Subramanian, K.A. Effect of Simulated Biogas on Performance, Combustion and Emissions Characteristics of a Bio-Diesel Fueled Diesel Engine. Renew. Energy 2017, 106, 78–90. [Google Scholar] [CrossRef]
- Can, Ö.; Öztürk, E.; Yücesu, H.S. Combustion and Exhaust Emissions of Canola Biodiesel Blends in a Single Cylinder DI Diesel Engine. Renew. Energy 2017, 109, 73–82. [Google Scholar] [CrossRef]
- Srihari, S.; Thirumalini, S.; Prashanth, K. An Experimental Study on the Performance and Emission Characteristics of PCCI-DI Engine Fuelled with Diethyl Ether-Biodiesel-Diesel Blends. Renew. Energy 2017, 107, 440–447. [Google Scholar] [CrossRef]
- Leevijit, T.; Prateepchaikul, G.; Maliwan, K.; Mompiboon, P.; Eiadtrong, S. Comparative Properties and Utilization of Un-Preheated Degummed/Esterified Mixed Crude Palm Oil-Diesel Blends in an Agricultural Engine. Renew. Energy 2017, 101, 82–89. [Google Scholar] [CrossRef]
- Satputaley, S.S.; Zodpe, D.B.; Deshpande, N.V. Performance, Combustion and Emission Study on CI Engine Using Microalgae Oil and Microalgae Oil Methyl Esters. J. Energy Inst. 2017, 90, 513–521. [Google Scholar] [CrossRef]
- Nirmala, N.; Dawn, S.S.; Harindra, C. Analysis of Performance and Emission Characteristics of Waste Cooking Oil and Chlorella Variabilis MK039712.1 Biodiesel Blends in a Single Cylinder, Four Strokes Diesel Engine. Renew. Energy 2020, 147, 284–292. [Google Scholar] [CrossRef]
- Krishnamoorthi, M.; Malayalamurthi, R. Engine Characteristics Analysis of Chaulmoogra Oil Blends and Corrosion Analysis of Injector Nozzle Using Scanning Electron Microscopy/Energy Dispersive Spectroscopy. Energy 2018, 165, 1292–1319. [Google Scholar] [CrossRef]
- Babu, D.; Thangarasu, V.; Ramanathan, A. Artificial Neural Network Approach on Forecasting Diesel Engine Characteristics Fuelled with Waste Frying Oil Biodiesel. Appl. Energy 2020, 263, 114612. [Google Scholar] [CrossRef]
- Dharma, S.; Hassan, M.H.; Ong, H.C.; Sebayang, A.H.; Silitonga, A.S.; Kusumo, F.; Milano, J. Experimental Study and Prediction of the Performance and Exhaust Emissions of Mixed Jatropha Curcas-Ceiba Pentandra Biodiesel Blends in Diesel Engine Using Artificial Neural Networks. J. Clean. Prod. 2017, 164, 618–633. [Google Scholar] [CrossRef]
- Banerjee, A.; Varshney, D.; Kumar, S.; Chaudhary, P.; Gupta, V.K. Biodiesel Production from Castor Oil: ANN Modeling and Kinetic Parameter Estimation. Int. J. Ind. Chem. 2017, 8, 253–262. [Google Scholar] [CrossRef]
- Sandeep, K.B.; Naveen, K. Experimental investigation and artificial neural network modeling of performance and emission of a CI engine using orange peel oil-diesel blends. Energy Sources Part A Recovery Util. Environ. Eff. 2022, 44, 232–246. [Google Scholar]
- Kolhe, A.V.; Malwe, P.D.; Wahile, G.S. Artificial intelligence for prediction of performance and emission parameters of CI engine using bio-fuel. AIP Conf. Proc. 2021, 2369, 020128. [Google Scholar]
- Bahri, B.; Shahbakhti, M.; Aziz, A.A. Real-Time Modeling of Ringing in HCCI Engines Using Artificial Neural Networks. Energy 2017, 125, 509–518. [Google Scholar] [CrossRef]
- Channapattana, S.V.; Pawar, A.A.; Kamble, P.G. Optimisation of Operating Parameters of DI-CI Engine Fueled with Second Generation Bio-Fuel and Development of ANN Based Prediction Model. Appl. Energy 2017, 187, 84–95. [Google Scholar] [CrossRef]
- Niu, X.; Yang, C.; Wang, H.; Wang, Y. Investigation of ANN and SVM Based on Limited Samples for Performance and Emissions Prediction of a CRDI-Assisted Marine Diesel Engine. Appl. Therm. Eng. 2017, 111, 1353–1364. [Google Scholar] [CrossRef]
- Esonye, C.; Onukwuli, O.D.; Ofoefule, A.U.; Ogah, E.O. Multi-Input Multi-Output (MIMO) ANN and Nelder-Mead’s Simplex Based Modeling of Engine Performance and Combustion Emission Characteristics of Biodiesel-Diesel Blend in CI Diesel Engine. Appl. Therm. Eng. 2019, 151, 100–114. [Google Scholar] [CrossRef]
- Çelebi, K.; Uludamar, E.; Tosun, E.; Yıldızhan, Ş.; Aydın, K.; Özcanlı, M. Experimental and Artificial Neural Network Approach of Noise and Vibration Characteristic of an Unmodified Diesel Engine Fuelled with Conventional Diesel, and Biodiesel Blends with Natural Gas Addition. Fuel 2017, 197, 159–173. [Google Scholar] [CrossRef]
- Ramalingam, K.; Kandasamy, A.; Balasubramanian, D.; Palani, M.; Subramanian, T.; Varuvel, E.G.; Viswanathan, K. Forcasting of an ANN model for predicting behaviour of diesel engine energised by a combination of two low viscous biofuels. Environ. Sci. Pollut. Res. 2020, 27, 24702–24722. [Google Scholar] [CrossRef]
- Thakur, A.K.; Mer, K.K.S.; Kaviti, A. An Artificial Neural Network Approach to Predict the Performance and Exhaust Emissions of a Gasoline Engine Using Ethanol–Gasoline Blended Fuels. Biofuels 2018, 9, 379–393. [Google Scholar] [CrossRef]
- Ilangkumaran, M.; Sakthivel, G.; Nagarajan, G. Artificial Neural Network Approach to Predict the Engine Performance of Fish Oil Biodiesel with Diethyl Ether Using Back Propagation Algorithm. Int. J. Ambient Energy 2016, 37, 446–455. [Google Scholar] [CrossRef]
- Soukht Saraee, H.; Taghavifar, H.; Jafarmadar, S. Experimental and Numerical Consideration of the Effect of CeO2 Nanoparticles on Diesel Engine Performance and Exhaust Emission with the Aid of Artificial Neural Network. Appl. Therm. Eng. 2017, 113, 663–672. [Google Scholar] [CrossRef]
- LEE, T.; Singh, V.P.; Cho, K.H. Tensorflow and Keras Programming for Deep Learning. In Deep Learning for Hydrometrology and Envinormental Scienece; Springer: Berlin/Heidelberg, Germany, 2021; pp. 151–162. [Google Scholar] [CrossRef]
- Nurdiyana Wan Mansor, W.; Abdullah, S.; Ashraf Razali, N.; Albani, A.; Ramli, A.; Olsen, D. Prediction of Emissions of a Dual Fuel Engine with Artificial Neural Network (ANN). In Proceedings of the 2019 Theory and Technique International Aerosol Conference and Malaysia Air Quality Annual Symposium, Balik Pulau Hotel, Malacca, Malaysia, 7–10 August 2019; IOP Conference Series: Earth and Environmental Science. Institute of Physics Publishing: Bristol, UK, 2019; Volume 373. [Google Scholar]
- Javed, S.; Satyanarayana Murthy, Y.V.V.; Baig, R.U.; Prasada Rao, D. Development of ANN Model for Prediction of Performance and Emission Characteristics of Hydrogen Dual Fueled Diesel Engine with Jatropha Methyl Ester. Biodiesel Blends. J. Nat. Gas Sci. Eng. 2015, 26, 549–557. [Google Scholar] [CrossRef]
- Rajak, U.; Nashine, P.; Verma, T.N. Effect of Spirulina Microalgae Biodiesel Enriched with Diesel Fuel on Performance and Emission Characteristics of CI Engine. Fuel 2020, 268, 117305. [Google Scholar] [CrossRef]
- Rajak, U.; Verma, T.N. Spirulina Microalgae Biodiesel—A Novel Renewable Alternative Energy Source for Compression Ignition Engine. J. Clean. Prod. 2018, 201, 343–357. [Google Scholar] [CrossRef]
- Rahman, M.A.; Aziz, M.A.; Ruhul, A.M.; Rashid, M.M. Biodiesel Production Process Optimization from Spirulina Maxima Microalgae and Performance Investigation in a Diesel Engine. J. Mech. Sci. Technol. 2017, 31, 3025–3033. [Google Scholar] [CrossRef]
- Nautiyal, P.; Subramanian, K.A.; Dastidar, M.G.; Kumar, A. Experimental Assessment of Performance, Combustion and Emissions of a Compression Ignition Engine Fuelled with Spirulina Platensis Biodiesel. Energy 2020, 193, 116861. [Google Scholar] [CrossRef]
- Arunkumar, M.; Kannan, M.; Murali, G. Experimental Studies on Engine Performance and Emission Characteristics Using Castor Biodiesel as Fuel in CI Engine. Renew. Energy 2019, 131, 737–744. [Google Scholar] [CrossRef]
- Mohamed, M.; Tan, C.-K.; Fouda, A.; Gad, M.S.; Abu-Elyazeed, O.; Hashem, A.-F. Diesel Engine Performance Emissions and Combustion Characteristics of Biodiesel and Its Blends Derived from Catalytic Pyrolysis of Waste Cooking Oil. Energies 2020, 13, 5708. [Google Scholar] [CrossRef]


| Test Fuel | Density (kg/m3) at 15 °C | Flash Point (°C) | Calorific Value (MJ/kg) | Viscosity (mm2/s) |
|---|---|---|---|---|
| Spirulina (SB100) | 860 | 130 | 41 | 5.22 |
| SB 80 | 854.8 | 118.3 | 41.29 | 4.63 |
| SB 65 | 849.1 | 108.5 | 41.46 | 4.37 |
| SB 50 | 843.4 | 100.7 | 41.63 | 3.92 |
| SB 35 | 840.9 | 95.3 | 41.97 | 3.56 |
| SB 20 | 835.7 | 86.5 | 42.6 | 3.19 |
| Diesel (SB0) | 830 | 70 | 43 | 3 |
| Engine Specifications | |
|---|---|
| Maker | Kirloskar, TV1 |
| Indicator used type | Cylinder pressure |
| Dynamometer type | Eddy current |
| Cooling type | Water |
| Number of Cylinders | One |
| Compression ratio | 17.5 |
| Stroke type | Four |
| Connecting rod length | 234 mm |
| Engine power | 5.2 kW |
| Cylinder bore | 87.5 mm |
| Stroke length | 110 mm |
| Maximum speed | 1500 rpm |
| Nozzle opening pressure | 180 bar |
| Measurements | Instrument | Uncertainty |
|---|---|---|
| CO2 | Gas analyzer | ±1.0% |
| NOx | Gas analyzer | ±5 ppm |
| UHC | Gas analyzer | ±0.5 ppm |
| rpm | Speed indicator | ±2% |
| Load | Dynamometer | ±0.5% |
| Fuel consumption | Fuel Burette | ±1% |
| BTE | ±1.5% | |
| Power | ±1% | |
| BSFC | ±1.5% |
| Optimizer | Transfer Function | Number of Epochs | Number of Neurons in Hidden Layer | Attributes | Train. MSE | Val. MSE | Over All MSE Loss | Train. r: | Val. r: | ||
|---|---|---|---|---|---|---|---|---|---|---|---|
| Loss | Loss | Train. | Val. | ||||||||
| Adam | Sigmoid | 200 | 8 | BSFC | 0.0086 | 0.01232 | 0.00269 | 0.00497 | 0.9423 | 0.84607 | |
| BTE | 0.00083 | 0.00097 | 0.99596 | 0.99203 | |||||||
| CO2 | 0.00108 | 0.00246 | 0.99206 | 0.97945 | |||||||
| HC | 0.00234 | 0.00873 | 0.98389 | 0.95286 | |||||||
| NOX | 0.00058 | 0.00037 | 0.99681 | 0.99729 | |||||||
| Adam | Sigmoid | 300 | 8 | BSFC | 0.00511 | 0.02273 | 0.00148 | 0.00618 | 0.96878 | 0.72042 | |
| BTE | 0.00044 | 0.00069 | 0.99788 | 0.99457 | |||||||
| CO2 | 0.00052 | 0.00075 | 0.99618 | 0.99546 | |||||||
| HC | 0.00105 | 0.00621 | 0.99283 | 0.97256 | |||||||
| NOX | 0.00029 | 0.0005 | 0.99842 | 0.99606 | |||||||
| Adam | Sigmoid | 400 | 8 | BSFC | 0.02134 | 0.03784 | 0.0056 | 0.01073 | 0.85104 | 0.50068 | |
| BTE | 0.00055 | 0.00131 | 0.99735 | 0.99386 | |||||||
| CO2 | 0.00126 | 0.00104 | 0.99072 | 0.99369 | |||||||
| HC | 0.00425 | 0.0126 | 0.97048 | 0.9483 | |||||||
| NOX | 0.00061 | 0.00089 | 0.99661 | 0.99751 | |||||||
| Adam | Sigmoid | 500 | 8 | BSFC | 0.00206 | 0.01015 | 0.00072 | 0.003 | 0.98637 | 0.92099 | |
| BTE | 0.0002 | 0.00031 | 0.99905 | 0.99839 | |||||||
| CO2 | 0.00027 | 0.00054 | 0.99802 | 0.99177 | |||||||
| HC | 0.00058 | 0.00289 | 0.99599 | 0.98256 | |||||||
| NOX | 0.00051 | 0.0011 | 0.99718 | 0.9964 | |||||||
| Adam | Sigmoid | 200 | 16 | BSFC | 0.02611 | 0.04097 | 0.00594 | 0.00998 | 0.81547 | 0.36112 | |
| BTE | 0.00021 | 0.00032 | 0.99899 | 0.9968 | |||||||
| CO2 | 0.0005 | 0.00088 | 0.99631 | 0.99342 | |||||||
| HC | 0.00209 | 0.00742 | 0.98568 | 0.96278 | |||||||
| NOX | 0.00082 | 0.00033 | 0.99549 | 0.99999 | |||||||
| Adam | Sigmoid | 300 | 16 | BSFC | 0.01394 | 0.02282 | 0.00358 | 0.00702 | 0.90453 | 0.69879 | |
| BTE | 0.00029 | 0.00048 | 0.9986 | 0.99582 | |||||||
| CO2 | 0.00063 | 0.00116 | 0.99539 | 0.99342 | |||||||
| HC | 0.00254 | 0.01016 | 0.98245 | 0.95267 | |||||||
| NOX | 0.0005 | 0.00047 | 0.99725 | 0.99615 | |||||||
| Adam | Sigmoid | 400 | 16 | BSFC | 0.00579 | 0.02621 | 0.00195 | 0.00817 | 0.96209 | 0.67509 | |
| BTE | 0.00039 | 0.00035 | 0.9981 | 0.99693 | |||||||
| CO2 | 0.00117 | 0.00226 | 0.99139 | 0.99753 | |||||||
| HC | 0.00213 | 0.01133 | 0.98532 | 0.95155 | |||||||
| NOX | 0.00025 | 0.00069 | 0.99863 | 0.99628 | |||||||
| Adam | Sigmoid | 500 | 16 | BSFC | 0.00137 | 0.00984 | 0.00046 | 0.00267 | 0.99099 | 0.89962 | |
| BTE | 0.00011 | 0.00033 | 0.99948 | 0.99653 | |||||||
| CO2 | 0.00023 | 0.00038 | 0.99832 | 0.99328 | |||||||
| HC | 0.00048 | 0.0027 | 0.99674 | 0.97969 | |||||||
| NOX | 0.00011 | 0.00012 | 0.9994 | 0.99903 | |||||||
| Adam | Sigmoid | 200 | 24 | BSFC | 0.03194 | 0.05353 | 0.00714 | 0.01254 | 0.77304 | 0.08641 | |
| BTE | 0.00022 | 0.00049 | 0.99896 | 0.99558 | |||||||
| CO2 | 0.00067 | 0.00147 | 0.99509 | 0.98629 | |||||||
| HC | 0.00249 | 0.00706 | 0.98305 | 0.95967 | |||||||
| NOX | 0.00036 | 0.00015 | 0.998 | 0.99933 | |||||||
| Adam | Sigmoid | 300 | 24 | BSFC | 0.00782 | 0.02142 | 0.00226 | 0.00686 | 0.94742 | 0.71643 | |
| BTE | 0.00042 | 0.00056 | 0.99795 | 0.99473 | |||||||
| CO2 | 0.00052 | 0.00097 | 0.99617 | 0.99459 | |||||||
| HC | 0.00237 | 0.01127 | 0.98368 | 0.94964 | |||||||
| NOX | 0.00015 | 0.0001 | 0.99917 | 0.99921 | |||||||
| Adam | Sigmoid | 400 | 24 | BSFC | 0.00769 | 0.02733 | 0.00256 | 0.00892 | 0.94828 | 0.65893 | |
| BTE | 0.00068 | 0.00063 | 0.99672 | 0.99615 | |||||||
| CO2 | 0.0009 | 0.00213 | 0.99339 | 0.99789 | |||||||
| HC | 0.0033 | 0.01386 | 0.97723 | 0.94008 | |||||||
| NOX | 0.00025 | 0.00066 | 0.99861 | 0.99674 | |||||||
| Adam | Sigmoid | 500 | 24 | BSFC | 0.00088 | 0.0038 | 0.00042 | 0.00181 | 0.99424 | 0.96032 | |
| BTE | 0.00006 | 0.00018 | 0.99972 | 0.99862 | |||||||
| CO2 | 0.00028 | 0.00036 | 0.99793 | 0.98916 | |||||||
| HC | 0.00072 | 0.00426 | 0.99505 | 0.97595 | |||||||
| NOX | 0.00016 | 0.00016 | 0.99914 | 0.99889 | |||||||
| Adam | Sigmoid | 200 | 32 | BSFC | 0.03306 | 0.05259 | 0.00744 | 0.01273 | 0.76369 | 0.15619 | |
| BTE | 0.00053 | 0.00067 | 0.99745 | 0.99462 | |||||||
| CO2 | 0.00101 | 0.00242 | 0.99256 | 0.99565 | |||||||
| HC | 0.00209 | 0.00781 | 0.98557 | 0.96626 | |||||||
| NOX | 0.00049 | 0.00014 | 0.99731 | 0.99905 | |||||||
| Adam | Sigmoid | 300 | 32 | BSFC | 0.02158 | 0.03714 | 0.00513 | 0.01025 | 0.85291 | 0.4619 | |
| BTE | 0.0003 | 0.00029 | 0.99854 | 0.99711 | |||||||
| CO2 | 0.00056 | 0.00101 | 0.99586 | 0.99513 | |||||||
| HC | 0.00298 | 0.01263 | 0.97943 | 0.94433 | |||||||
| NOX | 0.00025 | 0.00015 | 0.9986 | 0.99883 | |||||||
| Adam | Sigmoid | 400 | 32 | BSFC | 0.00073 | 0.00674 | 0.0004 | 0.0023 | 0.99539 | 0.94095 | |
| BTE | 0.0001 | 0.0002 | 0.99952 | 0.99793 | |||||||
| CO2 | 0.00025 | 0.00054 | 0.99814 | 0.99364 | |||||||
| HC | 0.00068 | 0.00385 | 0.99535 | 0.98254 | |||||||
| NOX | 0.00023 | 0.00016 | 0.99875 | 0.99969 | |||||||
| Adam | Sigmoid | 500 | 32 | BSFC | 0.00075 | 0.00331 | 0.00039 | 0.00175 | 0.99512 | 0.96477 | |
| BTE | 0.00007 | 0.0002 | 0.99967 | 0.99846 | |||||||
| CO2 | 0.00019 | 0.00049 | 0.99863 | 0.99203 | |||||||
| HC | 0.00081 | 0.00488 | 0.99446 | 0.97394 | |||||||
| NOX | 0.00013 | 0.00017 | 0.99927 | 0.99866 | |||||||
| Nadam | Softmax | 200 | 8 | BSFC | 0.01359 | 0.03844 | 0.00554 | 0.01206 | 0.9478 | 0.52292 | |
| BTE | 0.00093 | 0.00102 | 0.99723 | 0.99672 | |||||||
| CO2 | 0.00868 | 0.0042 | 0.99145 | 0.98368 | |||||||
| HC | 0.00271 | 0.01411 | 0.98899 | 0.9545 | |||||||
| NOX | 0.00177 | 0.00252 | 0.9975 | 0.98849 | |||||||
| Nadam | Softmax | 300 | 8 | BSFC | 0.00442 | 0.01707 | 0.00976 | 0.0251 | 0.97099 | 0.79434 | |
| BTE | 0.00479 | 0.01118 | 0.99775 | 0.99096 | |||||||
| CO2 | 0.01485 | 0.02879 | 0.9933 | 0.98269 | |||||||
| HC | 0.0187 | 0.05233 | 0.98798 | 0.96139 | |||||||
| NOX | 0.00606 | 0.01615 | 0.99674 | 0.98703 | |||||||
| Nadam | Softmax | 400 | 8 | BSFC | 0.0062 | 0.0397 | 0.00397 | 0.01413 | 0.9828 | 0.55435 | |
| BTE | 0.00335 | 0.00346 | 0.99921 | 0.99803 | |||||||
| CO2 | 0.00323 | 0.00713 | 0.99516 | 0.97772 | |||||||
| HC | 0.00344 | 0.01474 | 0.99471 | 0.97046 | |||||||
| NOX | 0.00361 | 0.00562 | 0.99876 | 0.99592 | |||||||
| Nadam | Softmax | 500 | 8 | BSFC | 0.00416 | 0.00941 | 0.00443 | 0.00993 | 0.98428 | 0.90226 | |
| BTE | 0.00477 | 0.0073 | 0.99848 | 0.98826 | |||||||
| CO2 | 0.00307 | 0.00976 | 0.99305 | 0.97928 | |||||||
| HC | 0.005 | 0.01465 | 0.99305 | 0.9802 | |||||||
| NOX | 0.00518 | 0.00852 | 0.99833 | 0.99039 | |||||||
| Nadam | Softmax | 200 | 16 | BSFC | 0.01921 | 0.02933 | 0.00899 | 0.01087 | 0.97023 | 0.73502 | |
| BTE | 0.00771 | 0.00732 | 0.99708 | 0.99178 | |||||||
| CO2 | 0.00153 | 0.0019 | 0.99556 | 0.99295 | |||||||
| HC | 0.00577 | 0.00747 | 0.98268 | 0.95034 | |||||||
| NOX | 0.01073 | 0.00834 | 0.99635 | 0.99307 | |||||||
| Nadam | Softmax | 300 | 16 | BSFC | 0.00832 | 0.02024 | 0.00382 | 0.0109 | 0.98117 | 0.80768 | |
| BTE | 0.00312 | 0.00662 | 0.99838 | 0.98905 | |||||||
| CO2 | 0.00283 | 0.01035 | 0.99637 | 0.98672 | |||||||
| HC | 0.00178 | 0.00989 | 0.99175 | 0.9592 | |||||||
| NOX | 0.00306 | 0.00741 | 0.99856 | 0.99244 | |||||||
| Nadam | Softmax | 400 | 16 | BSFC | 0.00781 | 0.01739 | 0.00426 | 0.00992 | 0.98681 | 0.87054 | |
| BTE | 0.00452 | 0.00749 | 0.99889 | 0.99032 | |||||||
| CO2 | 0.00148 | 0.00501 | 0.99797 | 0.98655 | |||||||
| HC | 0.00276 | 0.01272 | 0.99487 | 0.9662 | |||||||
| NOX | 0.00473 | 0.00698 | 0.99863 | 0.9951 | |||||||
| Nadam | Softmax | 500 | 16 | BSFC | 0.00597 | 0.02053 | 0.00483 | 0.01243 | 0.99016 | 0.82648 | |
| BTE | 0.00448 | 0.00594 | 0.9988 | 0.99357 | |||||||
| CO2 | 0.0005 | 0.00287 | 0.99812 | 0.99373 | |||||||
| HC | 0.00732 | 0.02445 | 0.99471 | 0.96771 | |||||||
| NOX | 0.00586 | 0.00835 | 0.99867 | 0.99789 | |||||||
| Nadam | Softmax | 200 | 24 | BSFC | 0.01214 | 0.02655 | 0.00376 | 0.00909 | 0.97054 | 0.6949 | |
| BTE | 0.00192 | 0.00124 | 0.99701 | 0.99206 | |||||||
| CO2 | 0.00039 | 0.00211 | 0.99769 | 0.99284 | |||||||
| HC | 0.00206 | 0.01429 | 0.99001 | 0.9524 | |||||||
| NOX | 0.00227 | 0.00125 | 0.99768 | 0.99433 | |||||||
| Nadam | Softmax | 300 | 24 | BSFC | 0.014 | 0.02197 | 0.00441 | 0.00703 | 0.9814 | 0.74216 | |
| BTE | 0.00324 | 0.00315 | 0.99825 | 0.99391 | |||||||
| CO2 | 0.00099 | 0.00161 | 0.9974 | 0.99468 | |||||||
| HC | 0.00068 | 0.00622 | 0.9955 | 0.97638 | |||||||
| NOX | 0.00315 | 0.00222 | 0.9986 | 0.9958 | |||||||
| Nadam | Softmax | 400 | 24 | BSFC | 0.01542 | 0.02914 | 0.00574 | 0.0119 | 0.98459 | 0.87196 | |
| BTE | 0.00563 | 0.01167 | 0.99848 | 0.98877 | |||||||
| CO2 | 0.00265 | 0.00547 | 0.99808 | 0.99796 | |||||||
| HC | 0.00092 | 0.00566 | 0.99589 | 0.97293 | |||||||
| NOX | 0.00407 | 0.00753 | 0.99894 | 0.99651 | |||||||
| Nadam | Softmax | 500 | 24 | BSFC | 0.00164 | 0.022 | 0.00199 | 0.01008 | 0.99095 | 0.74711 | |
| BTE | 0.00122 | 0.00303 | 0.99899 | 0.98921 | |||||||
| CO2 | 0.00143 | 0.00448 | 0.99816 | 0.98602 | |||||||
| HC | 0.004 | 0.01606 | 0.99589 | 0.96192 | |||||||
| NOX | 0.00164 | 0.0048 | 0.99889 | 0.99327 | |||||||
| Nadam | Softmax | 200 | 32 | BSFC | 0.00444 | 0.03051 | 0.00521 | 0.01018 | 0.97672 | 0.63954 | |
| BTE | 0.00687 | 0.00558 | 0.9984 | 0.99043 | |||||||
| CO2 | 0.00717 | 0.00366 | 0.99636 | 0.9966 | |||||||
| HC | 0.00293 | 0.00784 | 0.98793 | 0.95762 | |||||||
| NOX | 0.00465 | 0.00331 | 0.99837 | 0.99522 | |||||||
| Nadam | Softmax | 300 | 32 | BSFC | 0.00984 | 0.01614 | 0.00381 | 0.00557 | 0.98572 | 0.82234 | |
| BTE | 0.00307 | 0.00288 | 0.99855 | 0.99331 | |||||||
| CO2 | 0.0017 | 0.00134 | 0.99817 | 0.99279 | |||||||
| HC | 0.00119 | 0.00497 | 0.99353 | 0.97268 | |||||||
| NOX | 0.00325 | 0.0025 | 0.99903 | 0.99676 | |||||||
| Nadam | Softmax | 400 | 32 | BSFC | 0.00392 | 0.01958 | 0.00346 | 0.01143 | 0.99077 | 0.83959 | |
| BTE | 0.00306 | 0.00674 | 0.99899 | 0.98818 | |||||||
| CO2 | 0.00483 | 0.01014 | 0.99864 | 0.99632 | |||||||
| HC | 0.00249 | 0.01499 | 0.99572 | 0.96501 | |||||||
| NOX | 0.003 | 0.0057 | 0.99913 | 0.99635 | |||||||
| Nadam | Softmax | 500 | 32 | BSFC | 0.00151 | 0.01375 | 0.00196 | 0.00417 | 0.99354 | 0.83431 | |
| BTE | 0.00145 | 0.00173 | 0.99911 | 0.99288 | |||||||
| CO2 | 0.00087 | 0.00078 | 0.99875 | 0.99589 | |||||||
| HC | 0.00414 | 0.00351 | 0.99569 | 0.97439 | |||||||
| NOX | 0.00186 | 0.0011 | 0.99923 | 0.99805 | |||||||
| Adagrad | Relu | 200 | 8 | BSFC | 0.06691 | 0.05035 | 0.02132 | 0.01774 | 0.34902 | 0.53797 | |
| BTE | 0.01225 | 0.01094 | 0.9397 | 0.9522 | |||||||
| CO2 | 0.01186 | 0.00866 | 0.90866 | 0.82812 | |||||||
| HC | 0.00848 | 0.01028 | 0.94016 | 0.91711 | |||||||
| NOX | 0.00708 | 0.00844 | 0.9632 | 0.95271 | |||||||
| Adagrad | Relu | 300 | 8 | BSFC | 0.06728 | 0.04799 | 0.01579 | 0.01281 | 0.34207 | 0.28044 | |
| BTE | 0.00411 | 0.00507 | 0.97995 | 0.99154 | |||||||
| CO2 | 0.00103 | 0.00226 | 0.99268 | 0.96619 | |||||||
| HC | 0.00333 | 0.00631 | 0.97771 | 0.95808 | |||||||
| NOX | 0.00323 | 0.00242 | 0.98218 | 0.99713 | |||||||
| Adagrad | Relu | 400 | 8 | BSFC | 0.0674 | 0.0447 | 0.01638 | 0.01107 | 0.34413 | 0.38635 | |
| BTE | 0.00427 | 0.00457 | 0.97915 | 0.99054 | |||||||
| CO2 | 0.00153 | 0.00131 | 0.98872 | 0.99051 | |||||||
| HC | 0.00789 | 0.00396 | 0.94452 | 0.97742 | |||||||
| NOX | 0.0008 | 0.00081 | 0.99559 | 0.99654 | |||||||
| Adagrad | Relu | 500 | 8 | BSFC | 0.04943 | 0.06764 | 0.01335 | 0.01683 | 0.7185 | −0.5345 | |
| BTE | 0.00472 | 0.00384 | 0.97693 | 0.96884 | |||||||
| CO2 | 0.00363 | 0.00422 | 0.97296 | 0.94953 | |||||||
| HC | 0.00785 | 0.00818 | 0.94478 | 0.94958 | |||||||
| NOX | 0.00111 | 0.00026 | 0.99387 | 0.99845 | |||||||
| Adagrad | Relu | 200 | 16 | BSFC | 0.05379 | 0.05165 | 0.01385 | 0.01258 | 0.62853 | 0.06749 | |
| BTE | 0.00437 | 0.00408 | 0.97882 | 0.98665 | |||||||
| CO2 | 0.00301 | 0.00133 | 0.9777 | 0.99282 | |||||||
| HC | 0.00646 | 0.00518 | 0.95478 | 0.97201 | |||||||
| NOX | 0.00163 | 0.00066 | 0.99098 | 0.99832 | |||||||
| Adagrad | Relu | 300 | 16 | BSFC | 0.061 | 0.07195 | 0.01474 | 0.01696 | 0.47368 | −0.42298 | |
| BTE | 0.00436 | 0.00455 | 0.9788 | 0.99563 | |||||||
| CO2 | 0.00156 | 0.00372 | 0.98854 | 0.99239 | |||||||
| HC | 0.00526 | 0.00457 | 0.96387 | 0.97707 | |||||||
| NOX | 0.00152 | 0.00002 | 0.9916 | 0.99998 | |||||||
| Adagrad | Relu | 400 | 16 | BSFC | 0.0637 | 0.07373 | 0.01518 | 0.01787 | 0.43457 | −0.64301 | |
| BTE | 0.00363 | 0.005 | 0.9823 | 0.98471 | |||||||
| CO2 | 0.0022 | 0.00109 | 0.98386 | 0.97084 | |||||||
| HC | 0.00566 | 0.00888 | 0.96048 | 0.95955 | |||||||
| NOX | 0.00071 | 0.00063 | 0.99607 | 0.99884 | |||||||
| Adagrad | Relu | 500 | 16 | BSFC | 0.05292 | 0.06428 | 0.01305 | 0.01739 | 0.60676 | −0.14604 | |
| BTE | 0.00513 | 0.00592 | 0.97486 | 0.98378 | |||||||
| CO2 | 0.0013 | 0.00135 | 0.99043 | 0.95878 | |||||||
| HC | 0.00477 | 0.0149 | 0.96679 | 0.9272 | |||||||
| NOX | 0.00112 | 0.00047 | 0.9938 | 0.99859 | |||||||
| Adagrad | Relu | 200 | 24 | BSFC | 0.05528 | 0.05445 | 0.01364 | 0.0157 | 0.61015 | 0.0156 | |
| BTE | 0.0045 | 0.00675 | 0.97798 | 0.97732 | |||||||
| CO2 | 0.00389 | 0.00289 | 0.97107 | 0.98276 | |||||||
| HC | 0.00385 | 0.01424 | 0.9733 | 0.93214 | |||||||
| NOX | 0.00066 | 0.00019 | 0.99638 | 0.99959 | |||||||
| Adagrad | Relu | 300 | 24 | BSFC | 0.05563 | 0.06067 | 0.01326 | 0.01512 | 0.58647 | −0.1716 | |
| BTE | 0.00226 | 0.00185 | 0.98906 | 0.99573 | |||||||
| CO2 | 0.00179 | 0.00324 | 0.98672 | 0.99923 | |||||||
| HC | 0.00455 | 0.00741 | 0.96848 | 0.94134 | |||||||
| NOX | 0.00208 | 0.00242 | 0.98866 | 0.99463 | |||||||
| Adagrad | Relu | 400 | 24 | BSFC | 0.06072 | 0.06219 | 0.01441 | 0.01609 | 0.49497 | −0.26716 | |
| BTE | 0.00503 | 0.00578 | 0.97541 | 0.99 | |||||||
| CO2 | 0.00114 | 0.00186 | 0.99164 | 0.99895 | |||||||
| HC | 0.00428 | 0.00993 | 0.97035 | 0.93742 | |||||||
| NOX | 0.00087 | 0.0007 | 0.99521 | 0.99496 | |||||||
| Adagrad | Relu | 500 | 24 | BSFC | 0.06106 | 0.06679 | 0.01449 | 0.01772 | 0.48641 | −0.35244 | |
| BTE | 0.00494 | 0.00498 | 0.97582 | 0.99074 | |||||||
| CO2 | 0.00108 | 0.00164 | 0.99204 | 0.96514 | |||||||
| HC | 0.00453 | 0.01464 | 0.96851 | 0.92427 | |||||||
| NOX | 0.00086 | 0.00055 | 0.99523 | 0.99985 | |||||||
| Adagrad | Relu | 200 | 32 | BSFC | 0.06148 | 0.05739 | 0.01474 | 0.01574 | 0.47624 | 0.29582 | |
| BTE | 0.00523 | 0.00305 | 0.97444 | 0.99025 | |||||||
| CO2 | 0.00117 | 0.00179 | 0.99162 | 0.98774 | |||||||
| HC | 0.00444 | 0.01543 | 0.96923 | 0.92201 | |||||||
| NOX | 0.00139 | 0.00103 | 0.9923 | 0.99568 | |||||||
| Adagrad | Relu | 300 | 32 | BSFC | 0.05007 | 0.05915 | 0.01228 | 0.01494 | 0.67119 | −0.03018 | |
| BTE | 0.00273 | 0.00324 | 0.98679 | 0.99698 | |||||||
| CO2 | 0.00171 | 0.00156 | 0.98739 | 0.98397 | |||||||
| HC | 0.00587 | 0.01003 | 0.95902 | 0.93103 | |||||||
| NOX | 0.00103 | 0.00072 | 0.99428 | 0.9994 | |||||||
| Adagrad | Relu | 400 | 32 | BSFC | 0.05529 | 0.06235 | 0.01261 | 0.01504 | 0.57119 | −0.21838 | |
| BTE | 0.00184 | 0.00094 | 0.99107 | 0.99651 | |||||||
| CO2 | 0.00147 | 0.00179 | 0.98914 | 0.97134 | |||||||
| HC | 0.00373 | 0.0097 | 0.97414 | 0.94638 | |||||||
| NOX | 0.00074 | 0.0004 | 0.99593 | 0.99942 | |||||||
| Adagrad | Relu | 500 | 32 | BSFC | 0.03947 | 0.05622 | 0.01 | 0.01404 | 0.78943 | −0.12114 | |
| BTE | 0.0028 | 0.00401 | 0.98639 | 0.99593 | |||||||
| CO2 | 0.00242 | 0.00167 | 0.98224 | 0.9964 | |||||||
| HC | 0.00407 | 0.00791 | 0.97173 | 0.9615 | |||||||
| NOX | 0.00123 | 0.0004 | 0.99319 | 0.99762 | |||||||
| Output layer neurons | 5 |
| Hidden layer neurons | 32 |
| Input layer neurons | 3 |
| Normalized range | 0 to 1 |
| Transfer functions | Sigmoid |
| Optimizer | Adam |
| Evaluation metrics | r and MSE |
| Number of epochs | 500 |
| Preprocessing | MinMax Scaler |
Publisher’s Note: MDPI stays neutral with regard to jurisdictional claims in published maps and institutional affiliations. |
© 2022 by the authors. Licensee MDPI, Basel, Switzerland. This article is an open access article distributed under the terms and conditions of the Creative Commons Attribution (CC BY) license (https://creativecommons.org/licenses/by/4.0/).
Share and Cite
Kumar, S.C.; Thakur, A.K.; Aseer, J.R.; Natarajan, S.K.; Singh, R.; Priyadarshi, N.; Twala, B. An Experimental Analysis and ANN Based Parameter Optimization of the Influence of Microalgae Spirulina Blends on CI Engine Attributes. Energies 2022, 15, 6158. https://doi.org/10.3390/en15176158
Kumar SC, Thakur AK, Aseer JR, Natarajan SK, Singh R, Priyadarshi N, Twala B. An Experimental Analysis and ANN Based Parameter Optimization of the Influence of Microalgae Spirulina Blends on CI Engine Attributes. Energies. 2022; 15(17):6158. https://doi.org/10.3390/en15176158
Chicago/Turabian StyleKumar, S. Charan, Amit Kumar Thakur, J. Ronald Aseer, Sendhil Kumar Natarajan, Rajesh Singh, Neeraj Priyadarshi, and Bhekisipho Twala. 2022. "An Experimental Analysis and ANN Based Parameter Optimization of the Influence of Microalgae Spirulina Blends on CI Engine Attributes" Energies 15, no. 17: 6158. https://doi.org/10.3390/en15176158
APA StyleKumar, S. C., Thakur, A. K., Aseer, J. R., Natarajan, S. K., Singh, R., Priyadarshi, N., & Twala, B. (2022). An Experimental Analysis and ANN Based Parameter Optimization of the Influence of Microalgae Spirulina Blends on CI Engine Attributes. Energies, 15(17), 6158. https://doi.org/10.3390/en15176158