Article

Energy-Environmental Planning of Electric Vehicles (EVs): A Case Study of the National Energy System of Pakistan

1
Department of Industrial Engineering and Mathematical Sciences, Marche Polytechnic University, Via Brecce Bianche 12, 60131 Ancona, Italy
2
Astea S.p.A., Via Guazzatore 163, 60027 Osimo, Italy
3
Department of Mechanical Engineering, International Islamic University, Islamabad 44000, Pakistan
*
Author to whom correspondence should be addressed.
Energies 2022, 15(9), 3054; https://doi.org/10.3390/en15093054
Submission received: 18 March 2022 / Revised: 13 April 2022 / Accepted: 20 April 2022 / Published: 21 April 2022
(This article belongs to the Special Issue Electric Vehicle Charging Networks)

Abstract

:
Energy-environmental planning for road transportation involves a vast investigation of vehicles’ technologies and electricity production. However, in developing countries where the public transportation sector is growing quickly, energy-environmental planning is urgently needed. This paper evaluates the future electricity demand, as well as fuel consumption and CO2 emissions reduction, due to the operation of an expected increasing number of electric vehicles (EVs) in Pakistan. The planning of EVs up to 2040 is performed with the ePop simulator that calculates the future EVs’ electricity demand, while EnergyPLAN® assesses the expected new power capacities. Two scenarios are investigated by penetrating 30% and 90% of 2/3 electric wheelers and cars by 2030 and 2040 compared to 2020, respectively. To fulfill the expected energy demand, PV in the daytime and the national electric grid at nighttime are here considered. Finally, a 9 GW of PV capacity is needed to satisfy the EVs’ electricity demand of 14.7 TWh/year, and a 0.7 GW power plants capacity is needed to fulfill 4.7 TWh/year by 2040. Consequently, EVs’ charging scenarios at daytime and nighttime are assessed. Results indicated a total reduction of 10.4 Mtonnes of CO2 emissions and 9.1 Mtoe of fuel consumption by 2040 in the transportation sector.

1. Introduction

Over the last few decades, environmental pressure and energy scarcity have increased severely, and conventional road transportation is causing more concern because of carbon emissions and energy consumption. Among the numerous categories of environmental effects, greenhouse gas (GHG) emissions are known as the key factor that influences climate change. According to the Environmental Protection Agency (EPA), the transportation sector is one of the biggest contributors to GHG emissions [1]. Confronting the requirements of sustaining energy security, namely tackling global climate change and reducing pollution, both developed and developing countries have responded with policies to electrify their transportation sector [2].
Electric vehicles (EVs) are currently considered to be an efficient way to lower the dependency on fossil fuel resources and enhance the environment as well. Current technologies need to be improved to prevent GHG emissions from burning fossil fuels, so it is a requirement to make an immediate action plan by implementing environmentally friendly solutions. Just to give an idea, 92% of the transportation sector relies on fossil fuels globally, consuming 49% of the overall oil production [3]. The expected world population will be equal to 9.8 billion by the year 2040, thus there is a need to further enhance and develop the transportation sector that is currently boosting most precipitously [4]. EVs are expected to accomplish both climate change and environmental pollution challenges [5]: indeed, conventional vehicles emit more heat than EVs within the same mileage; therefore, their substitution can considerably reduce global warming’s consequences that have been raised in the last decades due to the irresponsible humans’ behaviors.
EVs’ market is currently raising since 2019, reaching 7.2 million vehicles and then continuing to increase by 40% per year [6]. This growth of EVs requires an extra amount of electricity from the grid. According to the International Energy Agency (IEA) [7], 7.3 million chargers were deployed, whose 90% of them were employed for private use. However, one of the main problems that limit the deployment of EVs is related to their charge/discharge phase management. Outdated power grid infrastructures make the power flow towards the grid difficult, mainly when renewable energy sources (RESs) and EVs are used as electricity sources. In this case, the inlet power flow to the grid is limited for safety reasons, i.e., a mismatch between both the frequency and the voltage compared to the power grid characteristics due to the source variability, as well as between the energy demand and the energy production, and the overload of transmissions lines [8,9]. To overcome these issues, proper planning and control of the EVs’ charge/discharge phase is a key factor for the EVs’ diffusion. Yuan et al. [10] considered comparative studies of road transportation on two planning and charging strategies by integrating RESs into the energy system compared to the reference case. The Beijing-Tianjin-Hebei region was used as a case study, and results showed that a 100% EVs penetration can be obtained without adding RESs’ capacity, thus leading to energy savings and a reduction of CO2 emissions reduction by 11% in the year 2040. In the EVs’ view side, the technological progress could lead to a 25% reduction of their initial cost in the year 2040 as well.
The Pakistani power sector is heavily dependent on imported fuels that constitute a considerable share of the Pakistani energy mix [11]: this includes hydro for 27%, fossil fuels (e.g., natural gas, coal, and imported oil) for 64%, nuclear for 7%, while renewables only account for 2%. Although the GHG emissions share of Pakistan is considered to be the lowest worldwide, it ranks among the top 10 countries most impacted by those emissions as claimed by the long-term Climate Risk Index (CRI) [12]. Pakistani economic policy set the target to bring half a million electric motorcycles and rickshaws along with more than 100,000 electric cars, buses, and trucks into the transportation system in the next five years [13]. Geographically, Pakistan is located East 62–75° on longitude and North 24−37°on latitude, so it receives a significant amount of solar radiation across the country. The solar radiation changes from North to South, and the solar energy potential of the country is close to 1 TW [14]; for this reason, there is a huge interest in increasing and further boosting the installation of new PV capacities in the overall country.
Among the use of renewables for further contributing to the decarbonization process and the deployment of EVs as well, various studies analyzed the interaction between PV and EVs, drawing the attention to smart charging approaches in combination with PV systems: indeed, using PV systems, the consumption of energy from EVs’ charging systems in residential houses were reduced by almost 48.1%, and electricity prices decreased by 17.6% per year considering the scenario of Germany from the year 2018 to the year 2019. The same research also analyzed that the charge of EVs at workplaces can further reduce the cost of electricity. Kempton et al. [15] discussed that both PV and EVs will be most likely to be connected to the grid in a similar exceptionally distributed manner, and at constant voltage levels as well. Through the vehicle-to-grid power (V2G) approach, EVs provide power for specific electric markets, but they can be also used as storage for renewable energy generation. Results showed that V2G can stabilize large-scale RES power with 3% of the fleet dedicated to the regulation of RESs, plus 8–38% of the fleet providing operating reserves or storage for RESs. Chaouachi et al. [16] explained that both PV and EVs can be incorporated into the electric grid through a power electronic interface with the potential to make intelligent nodes in the system. Assuming a possible smart grid architecture, the results of a case study revealed that the benefits of a coordinated EVs’ charge could lead to an increase of 14% of the PV penetration, 64% in EVs’ penetration, and consequently a decrease of 28% in CO2 emissions. Thus, the maximum penetration of EVs in a medium-sized European city could increase starting from the current value of 18%.
Considering that the energy production in Pakistan relies on fossil fuels for 64% of its energy matrix [11], there is an urgent need to organize the transportation system properly by addressing its future energy demand using additional progressive RESs capacity installations. The goal of this work is to exploit the electricity demand and supply accessible during off-peak periods, decrease the dependency on FFVs, and lower CO2 emissions. Moreover, it analyzes the impact of EVs’ use on the national energy system of Pakistan under different PV sizes to satisfy the load demand due to the penetration of 30% and 90% of the EVs and considers how the PV/EVs coupling can contribute to more sustainable mobility. Furthermore, it will also focus on the charging strategies during the day (PV) and nighttime (electric grid). Hence, the final power production sector should have enough capacity and working hours to enhance EVs’ utilization.
The paper is structured as follows: Section 2 compares the proposed methodology with others available in the literature in terms of both the PV capacity and the EVs’ demand forecast, highlighting the pros of using already validated tools for their forecast/evaluation. Section 3 gives an outline of the methods and simulation tools, namely the ePop simulator and EnergyPLAN®, used in this work for carrying on the energy modeling. Section 4 explains both the case study and the scenarios considered in the current work regarding the implementation of EVs and PV in the years 2030 and 2040, respectively. Section 5 presents the results together with some comments, while the conclusions and the recommendations are reported in Section 6.

2. Comparison of the Proposed Methodology with Others Available in the Literature

The present work used two different tools, whose reliability has been already validated in other researches in the literature, where real data were available [17,18], to forecast the impact of the progressive EVs’ implementation in Pakistan, and the fulfilment of their electricity demand through additional PV capacity to be installed by the years 2030 and 2040. To the authors’ knowledge, the gradual implementation of EVs was studied more on district [19,20] and city [21,22] levels than on a country level.
Most of the scenario analyses focus on the use of RESs for fulfilling the EVs’ electricity demand completely without using proper simulation tools, thus a detailed hourly resolution that is important to address this problem properly is missed. Harewood et al. [23] developed an open-source energy system model to study the Barbadian energy system and to investigate cost-optimal and 100% renewable energy system configurations to be achieved by the year 2030. In this scenario, they also considered the electrification of private passenger vehicles; however, the EVs’ electricity demand has been assumed as an aggregate value, and not on an hourly basis. On the contrary, the present study used the ePoP simulator to obtain the hourly trend of the electricity demand, thus knowing exactly how much electricity would have been needed for charging the EVs with PV in the daytime and with fossil fuel-based power plants in the nighttime. Iwai et al. [24] performed several scenarios of future regional power grid (Toyonaka City, Osaka Prefecture, Japan) focusing on residential and commercial sectors. They also analyzed the diffusion of both PV and EVs by the year 2030, but the new PV capacity and the overall electricity demand for charging EVs come from statistical data, environmental reports, and roadmaps of the technologies of PV and EVs. Brostrom et al. [25] used synthetic driving patterns generated by log-normal distributions to assess the use of EVs: these distributions have been obtained by considering the average daily distance driven by personal vehicles in Spain and the EVs’ energy consumption according to [26], but they do not come from an available dataset like the one implemented in the ePop simulator that allows the software to provide a detail EV’s electricity demand profile.
In the light of the above, the scenario analyses are certainly important to get an idea of the future outlook of the energy sector at a country level by considering the deployment of different RESs and EVs, but their forecast would be more accurate if already validated tools are used.

3. Energy Modeling

This section provides a detailed description of the approaches used to model and evaluate the energy analysis regarding the implementation of EVs and the PV capacity in the years 2030 and 2040. Precisely, the ePop simulator has been used to evaluate the EVs’ electricity demand according to the studied scenarios. Then, the solar data of Pakistan have been analyzed through Renewables.ninja; after collecting these data, EnergyPLAN® has been used to plan the national energy system of Pakistan with the penetration of EVs, thus matching their electricity demand using PV and the conventional power stations fossil fuel based.

3.1. The ePop Simulator

The ePop simulator simulates the EVs’ electricity demand in the residential sector. This tool predicts the State of Charge (SOC) of EVs, as well as the daily energy demand. Each simulated end-user is modeled as an autonomous unit with a certain domestic energy plan for the EVs’ charge. The ePop simulator has been developed and presented by Ciabattoni et al. [17] and uses a bottom-up approach to assist the deployment of depth first search (DSF) algorithms, and design optimization procedures as well. In particular, they simulated the electrical demand of a considered region according to the behavior of EVs’ users.
The key parameters are the number of consumers, the number of days in a year (360 days in this study), and a sampling time of 30 min, while a set of advanced options can design up to four separate end-users’ subgroups, stated as proportion values of their aggregate number. ePop simulator considers the end-users’ class and allows to analyze the data of a single end-user to aggregate the output. Each end-user is analyzed using the following steps: (i) commuting distance [km] according to the EV model, (ii) declared vehicle autonomy (km), (iii) battery capacity (kWh), (iv) domestic charging point capacity (kW), v) average vehicle fuel consumption (kWh/km), (vi) electric battery efficiency (assumed equal to 91% according to [27]), and vii) charger efficiency (assumed equal to 95% according to [28]).
The average commuting distance of the end-users is generated pseudo-randomly from statistical data implemented in the model, which have been taken from [29]. The EVs’ population is generated by matching the EV’s model and end-users‘ needs based on the commuting distances. EVs’ characteristics from manufacturers (e.g., model, price, battery capacity, autonomy, and average fuel consumption) are inserted and automatically updated quarterly. Each end-user’s charging point capacity is assigned randomly. Then, ePop simulator will get the yearly energy demand (hourly resolution) of the EVs’ electricity demand throughout the year.
In this study, besides considering electric cars, 2/3 of electric wheelers are also involved, and their specifications must be inserted in the tool. Precisely, the following configurations are considered: (i) the model of 2/3 electric wheelers, (ii) the battery capacity (kWh), (iii) the average mileage [km], and the price [€]. This configuration allows to analyze the 2/3 wheelers’ behavior. The required data, which are listed in Table 1, are inserted in the ePop simulator to get the final results in terms of the electricity demand.

3.2. The PV Modeling through Renewables.Ninja

So far, actual precise meteorological data are not publicly accessible for Pakistan; thus, a simulated range of the annual solar radiation has been calculated using the Renewables.ninja model to create credible temperature conditions that are representative of several years’ time span [36]. Renewables.ninja’s data are available from the year 2000 to the year 2019, with a time resolution of 60 min. Renewables.ninja uses the MERRA-2 dataset, whose maximum number of years is equal to 20. This model can record both solar and wind time series data from any location in the World using satellite observations from today back to the year 2000 [37,38].
Figure 1a–d shows the yield attained from Renewables.ninja considering 4 months (February, April, July, and November) following different days with an hourly distribution trend for one year, namely 2019. The considered months showed different solar radiations reached in a year. In particular, the flexibility of a 1 kW hourly peak as an output power of a PV system has been recorded. It is worth noting that every line relates to data from a sample day of each considered month from a particular yearly dataset.

3.3. The EnergyPLAN® Software

Energy, economics, and environmental assessments can be performed through EnergyPLAN® [39], which is designed to exploit the synergies enabled by including the whole energy system as expressed in the smart energy system concept. EnergyPLAN® simulates the operation of energy systems, including the electricity, heating, cooling, industry, and transport sectors with a sampling time of 1 h. It provides results on a yearly basis with the possibility of obtaining monthly aggregate information regarding power stations and/or RESs’ production, as well CO2 emissions emitted into the atmosphere due to the use of conventional power stations or FFVs. In EnergyPLAN®, the whole system is modelled as a single entity: it is a holistic approach where the supply and demands of different energy systems are balanced for a whole year. The EnergyPLAN® model has been generally applied on a state or a country level [39], and for insights and policymaking at different levels as well. Connolly et al. [40] described that the main objective of this tool is to support the design of long-term energy planning strategies by modelling the complete energy system. It makes it possible to identify problems and make strategies for the whole energy system rather than for specific sectors [41].
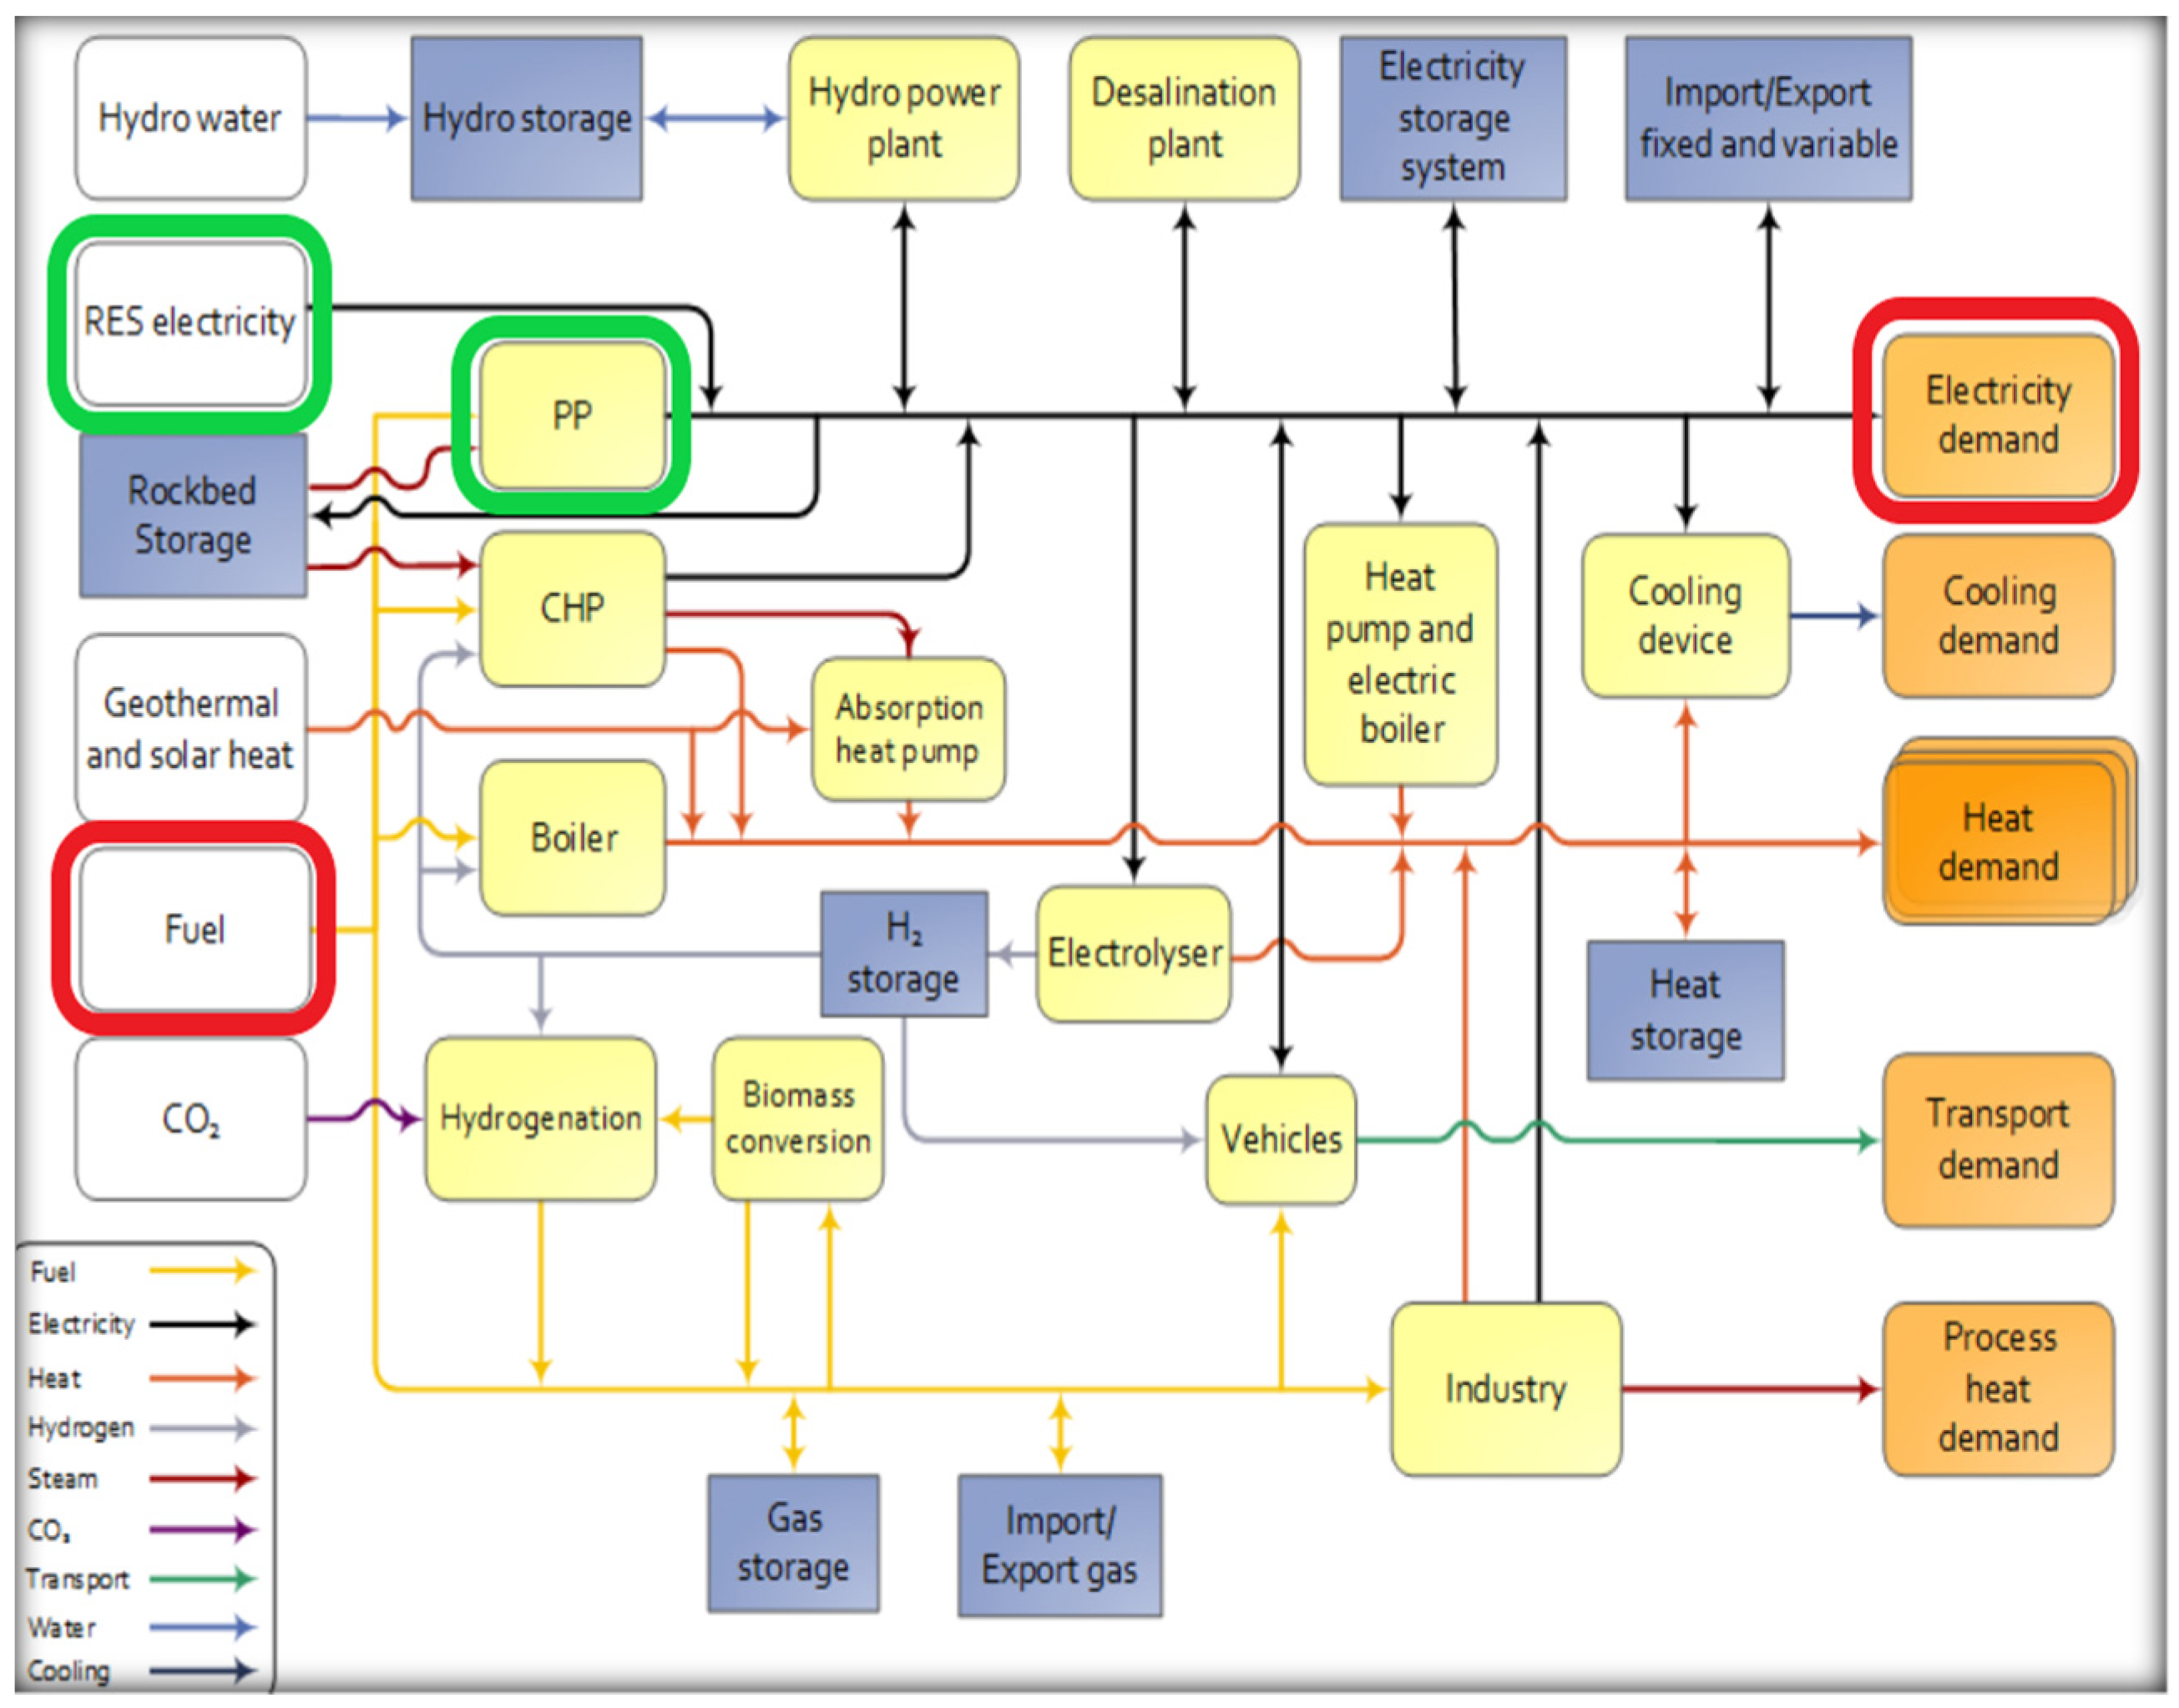
The use of the EnergyPLAN® involves the following technical parameters: (i) the total annual electricity demand, (ii) the capacity of the installed renewables, and (iii) the hourly distribution of the total annual production/demand, which relies on 8784 data points since the hourly distribution of one year consists of 8760 h and EnergyPLAN® operates a full year in hourly resolution using 8784-time slices (leap year). A typical EnergyPLAN®’s input-output arrangement is presented in Figure 2, where the main blocks involved in this study are highlighted in red (inputs) and green (outputs), while a more detailed description of the EnergyPLAN®’s official documentation is available in [42].
Given the aim of this study, the EnergyPLAN® software has been used to evaluate the PV and conventional power station fossil fuel-based capacity needed to fulfill the electricity demand of the EVs fleet for the years 2030 and 2040 at daytime and nighttime, respectively. The electricity demand has been analyzed using the ePop simulator, as described in Section 3.1, and then imported into EnergyPLAN® together with the solar radiation from Renewables.ninja as described in Section 3.2. In Figure 2, the considered blocks are highlighted in red (inputs) and green (outputs), thus the technical simulation strategy of EnergyPLAN® will only focus on the transportation (conventional fuel and the number of FFVs) and renewable electricity capacity as well. The EnergyPLAN® software v15.1 has been used for the analysis carried out in this study.

4. The Case Study of Pakistan

According to the Data Pakistan Bureau of Statistics (DPBS) [43], conventional registered vehicles increased by 9.6% in the year 2018 compared to the year 2017. The expected growth of FFVs from the year 2018 to the year 2025 is approximately 37.5%; among them, 2/3 wheelers should increase by 69.2% [44]. To accomplish a more sustainable and energy secure society, the deployment of EVs for ground transportation in Pakistan has drawn more attention due to the potential of reducing GHG emissions and fossil fuel dependency. Based on the country’s widely used transportation system, the studies focused on three types of EVs, which have been categorized as small- and medium-sized as listed in Table 2 [45,46].
This study mainly aims at reducing the emissions coming from 2/3 wheelers and cars. Pakistani 2/3 wheelers’ market is currently growing and increasing fast, following the trend of the previous years. In the first half of the year 2021, total sales recorded an increase of 27.7% compared to the last year, scoring the highest sale ever. Indeed, the 2/3 wheelers are growing quickly compared to 2019 [47]; for this reason, 2/3 wheelers are receiving an exclusive observation in developing Asian countries as these light-duty vehicles are also contributors to CO2 emissions. Schröder et al. [48] addressed the situation in the Association of Southeast Asian Nations (ASEAN) countries where these vehicles are extensively used for short-distance public transportation. Since they are cheaper and more frequent in the road transportation system, these smaller vehicles have the great potential to decarbonize the transportation sector; moreover, these vehicles are light weighted, compact, and green compared to the ICE ones. Electrification of 2/3 wheelers is now considered a feasible solution for a sustainable country due to their smaller size and low-cost maintenance, thus being highly deployable shortly.

4.1. Current and Possible Future Scenarios

This part discusses in detail the current and future possible scenarios for the Pakistani energy system. In the current scenario referred to the year 2020 (baseline) where all the 2/3 wheelers and cars are fossil fuel-based, the overall efficiency of FFVs has been discussed, whereas the future scenario includes the penetration of EVs into the national electric system considering two possible ways of feeding EVs with convention power stations fossil fuel-based and RESs such as PV.

4.1.1. Current Scenario Referred to the Year 2020 (Baseline)

This sub-Section describes the current scenario of Pakistan and the impact of fossil fuels feeding into FFVs in terms of overall efficiency. Typical fossil fuels used in Pakistan for road transportation are petrol, diesel, and compressed natural gas (CNG). Most of the fuels are imported, thus resulting in an efficiency chain drop moving from extraction, conversion, compression, and finally distribution. The efficiency of fossil fuels referred to natural gas, coal, and oil-based power plants are 34–56% [49,50], 32–42% [50,51], and 32–40%, [52,53], respectively. For electrical power production, both line and transmission losses account for about 10–20% [54]. Figure 3 shows the FFVs’ efficiency chain. The fossil fuel chain starts from the extraction of the crude oil and finishes with its transformation to be then used. Later, the chain shows the distribution of the efficiencies during the transport towards the oil station, thus providing the final overall efficiency [55] of FFVs when they are effectively used.

4.1.2. The Future Scenarios (Years 2030 and 2040)

The future scenarios demonstrate the possible developments with the EVs penetration into the mobility system of Pakistan. Precisely, Scenario 1 considers the efficiency chain and the different charging situations (daytime and nighttime). Scenario 2 represents the future EVs’ fleet situation in the years 2030 and 2040, as well as the PV capacity required to fulfill the energy demand of EVs in the daytime.
Regarding Scenario 1, charging strategies and their efficiencies consider that the EVs are charged through the national electric grid, thus powered by conventional power plants fossil fuel-based in the nighttime and through PV in the daytime. The electricity generation using fossil fuels is a foundation of modern society. Cheaper technologies and fossil fuels have built an energy sector constructed across these fuels. The power plants have been designed in such a place where fossil fuels were easily available, distributed, supplied, and easily handled. Figure 4 shows the overall performance chain of EVs charged in the nighttime with the power plants fed by fossil fuels. The chain begins from the extraction and the conversion of the crude oil in a refinery plant and then ends up with its distribution towards the required facilities such as power plants or oil stations [56,57]. The electricity generated in the power plant is distributed through the electrical grid to reach the charging stations, which are then used to supply electricity to EVs [58]. Finally, the overall performance of the process is presented considering the values of each subprocess previously mentioned.
In the present study, EVs are charged through PV during the daytime; thus, it also takes into account the EVs’ efficiencies that show a better trend than using only conventional plants.
Figure 5 shows an EV’s efficiency chain powered by a RES such as PV, then there is the inverter [59], charger, and electrical grid transportation efficiencies to reach the charger station that affects the performance of the overall process. The aim of analyzing these scenarios is to forecast how the current situation, namely using only conventional power plants fossil fuel-based, can be changed by initially using these plants to feed EVs, and then increasing the penetration of PV to further contribute to the EVs’ feeding and lower the CO2 emissions as well.
On the other hand, Scenario 2 is focused on the path to decarbonizing and further lowering the CO2 emissions by exploiting as much as possible renewables: indeed, the present study analyses the impact coming from the penetration of 30% and 90% EVs in the national energy system of Pakistan by investigating the effects of different charging options. Per each scenario, two different PV capacities in Pakistan during the daytime have been calculated according to the forecasted PV, considering the two different levels of EVs’ penetration previously mentioned.
The studied scenarios are the following [13]:
  • 30% EVs fleet penetration by adding small and medium vehicles (year 2030);
  • 90% EVs fleet penetration (year 2040).
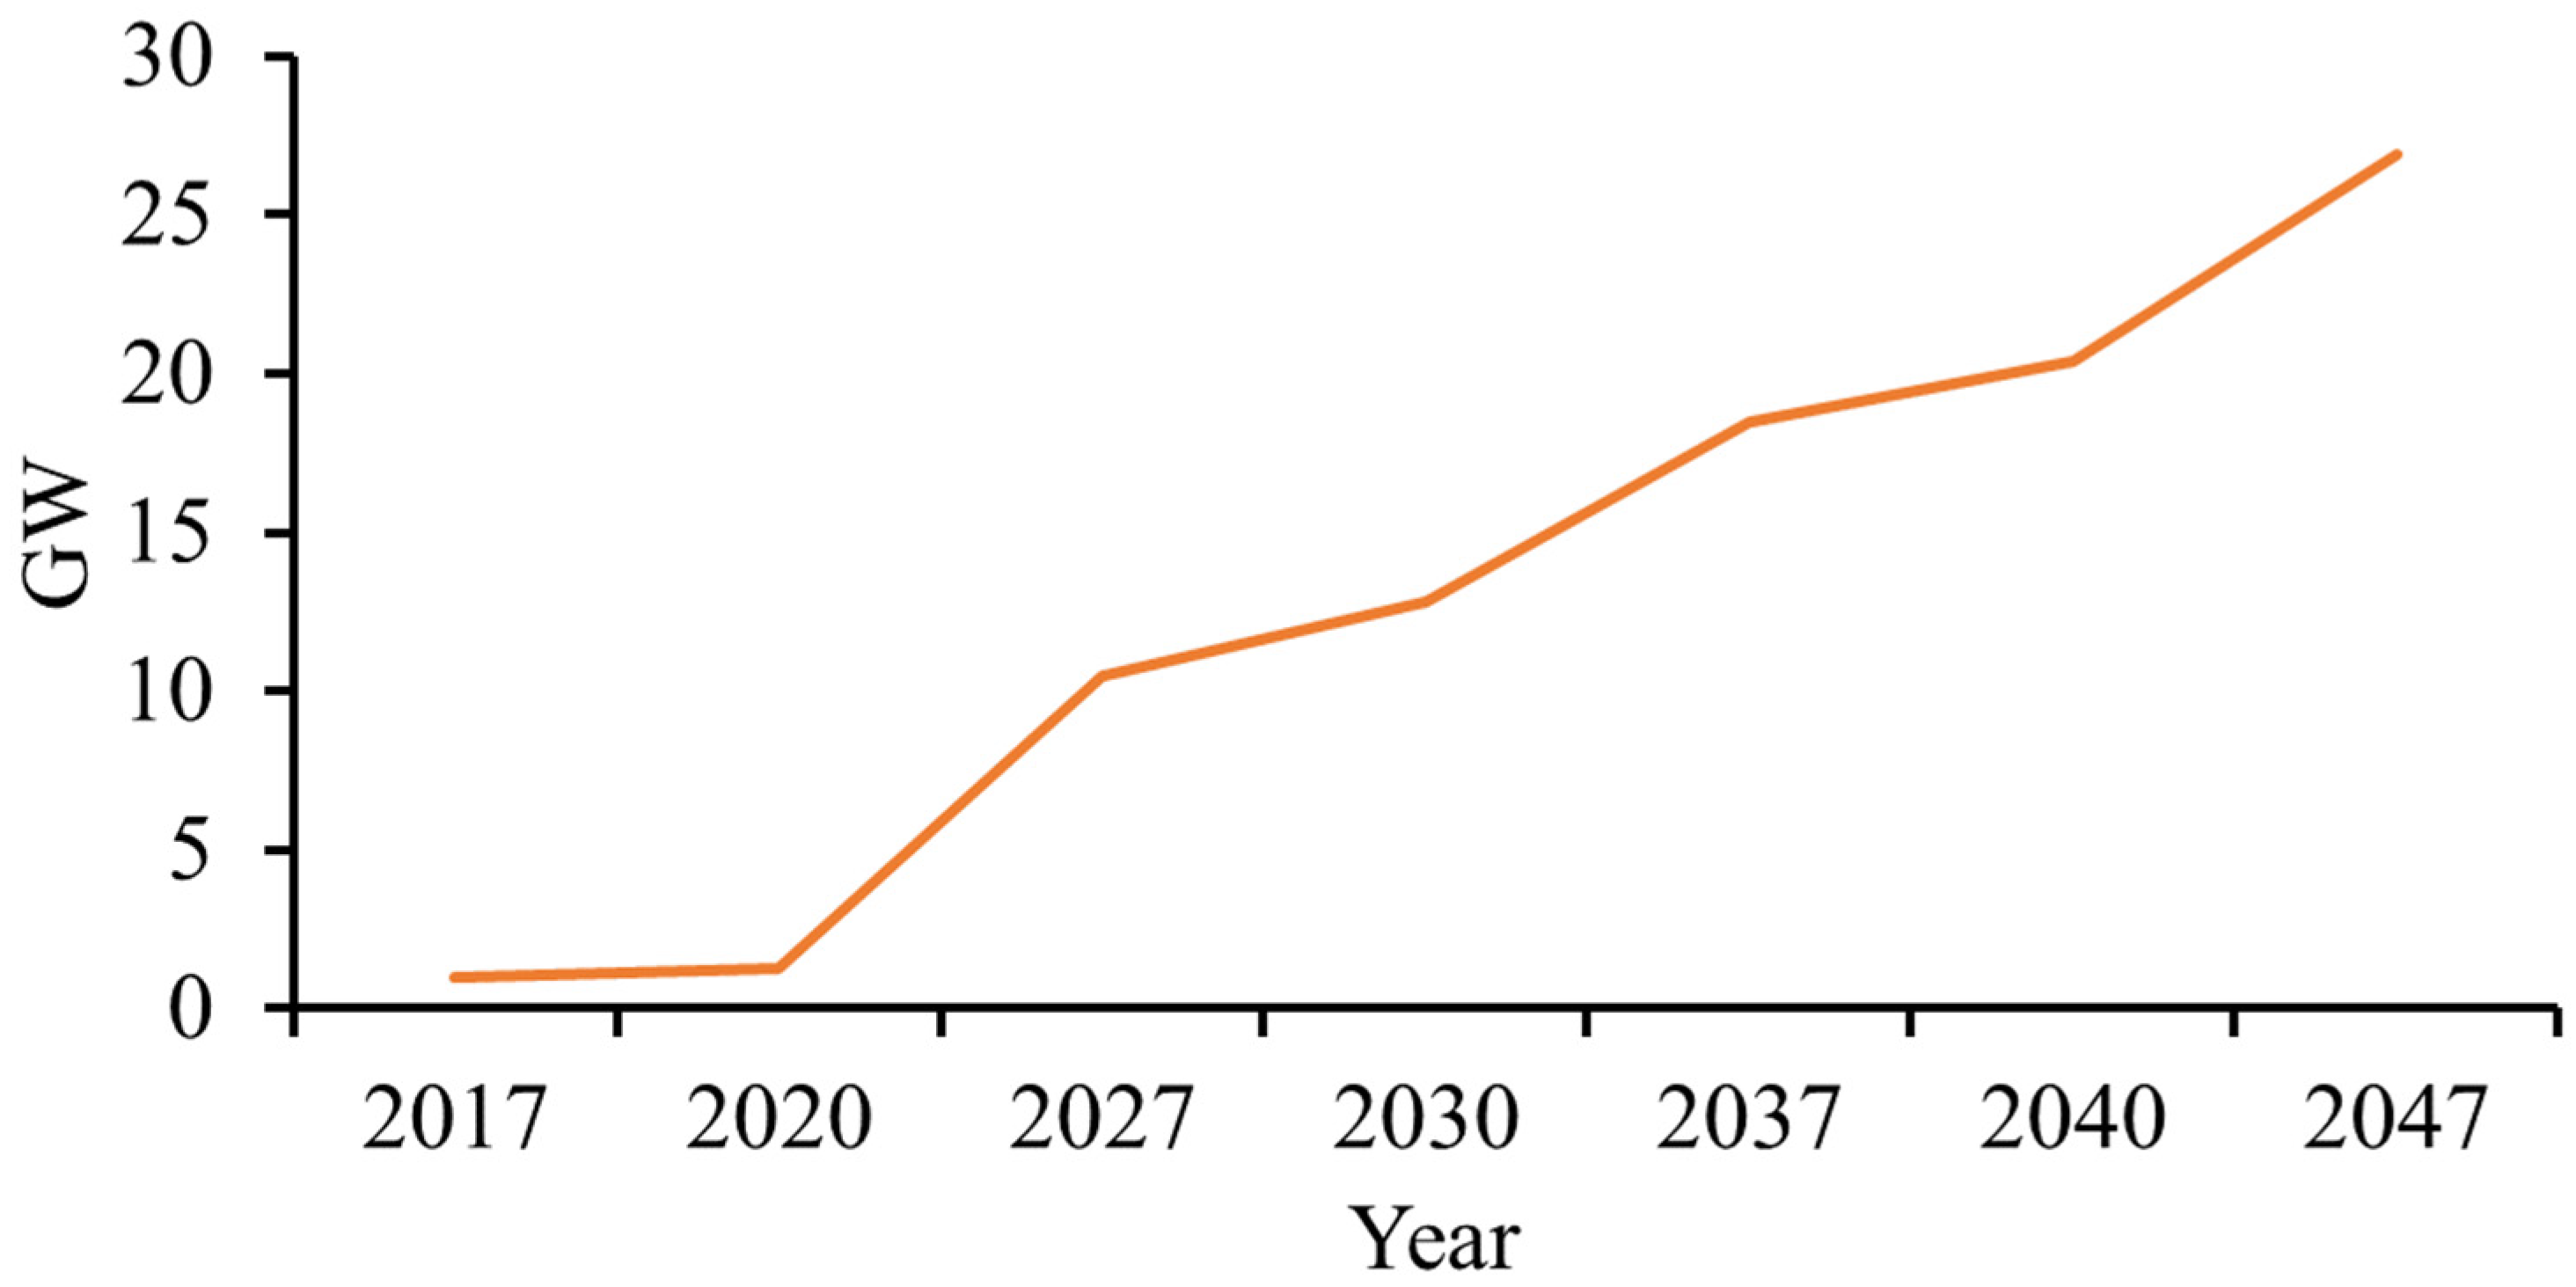
The impact of adding PV to fulfill the electricity demand of EVs is therefore studied considering the current situation and the future outlooks given by Pakistan in Figure 6 [13]. It is worth noting that the analysis will start from 2020, and not from 2017 since the increase of the PV capacity is negligible compared to the future outlooks as reported below:
  • 12.6 GW of PV capacity in 2030;
  • 20.4 GW of PV capacity in 2040.

4.2. The CO2 Emissions of Pakistan

Pakistan has been stated as the seventh most vulnerable country because of climate change [44]. According to the National Economic and Environment Development Study (NEEDS) [60], Pakistan is expected to increase its emissions by two folds in the year 2030. Based on its Intended Nationally Determined Contributions (INDC) [61], Pakistan intends to reduce by 20% of its 2030 projected GHG emissions, estimated at 1603 Mtonnes of CO2 equivalent. According to the World Bank [62], data on CO2 emissions in Pakistan are shown in Figure 7.
The mathematical correlation used to calculate the CO2 emissions due to the use of FFVs is reported by Equation (1):
C O 2 0 % E V = i n E i × C O 2 , i
where:
-
n is the No. of fossil fuel;
-
i is the type of fossil fuel;
-
Ei is the yearly consumption of fossil fuel (kWh);
-
C O 2 , i is the unitary C O 2 emission for fossil fuel [kgCO2/kWh] [46].

5. Results and Comments

Results refer to both PV and conventional power stations connected to the national electric grid capacity to fulfill the forecasted EVs’ energy demand, as well as both the fuel consumption and the CO2 emissions reduction. The EVs’ electricity demand has been evaluated through ePop simulator software, while the capacities of both PV and conventional power stations have been calculated through EnergyPLAN® as energy balance. Finally, the CO2 emissions and fuel consumption have been calculated according to Equation (1).

5.1. The EVs’ Electricity Demand

EVs perform as an extra non-elastic electricity requirement with hourly resolution. For this study, data obtained from the ePop simulator showed the electricity demand for a year, where EVs are charged in both daytime and nighttime using PV and the national electric grid powered by conventional fossil fuel-based plants, respectively. It is worth noting that the EVs’ charging time during the daytime has been chosen according to the solar radiation in Pakistan presented in Section 3.2, while three hours have been considered in the nighttime since most of the charging phase is assumed to be done in the daytime, and thus EVs’ batteries are partially charged at the end of the working days.
As per Pakistani yearly solar radiation, the electricity production from PV is around 7–8 h/day and produces electricity to fulfill the EVs’ electricity demand in the daytime, while the electricity withdrawn from the national electric grid will be used in the nighttime. In the current study, the implementation of EVs into the national system will raise the overall electricity demand of Pakistan, and this demand will be fulfilled by PV and fossil fuel-based power stations according to the government policy in the years 2030 and 2040. The overall power generation capacity (both renewables and fossil fuel-based) is going to double by the year 2040.
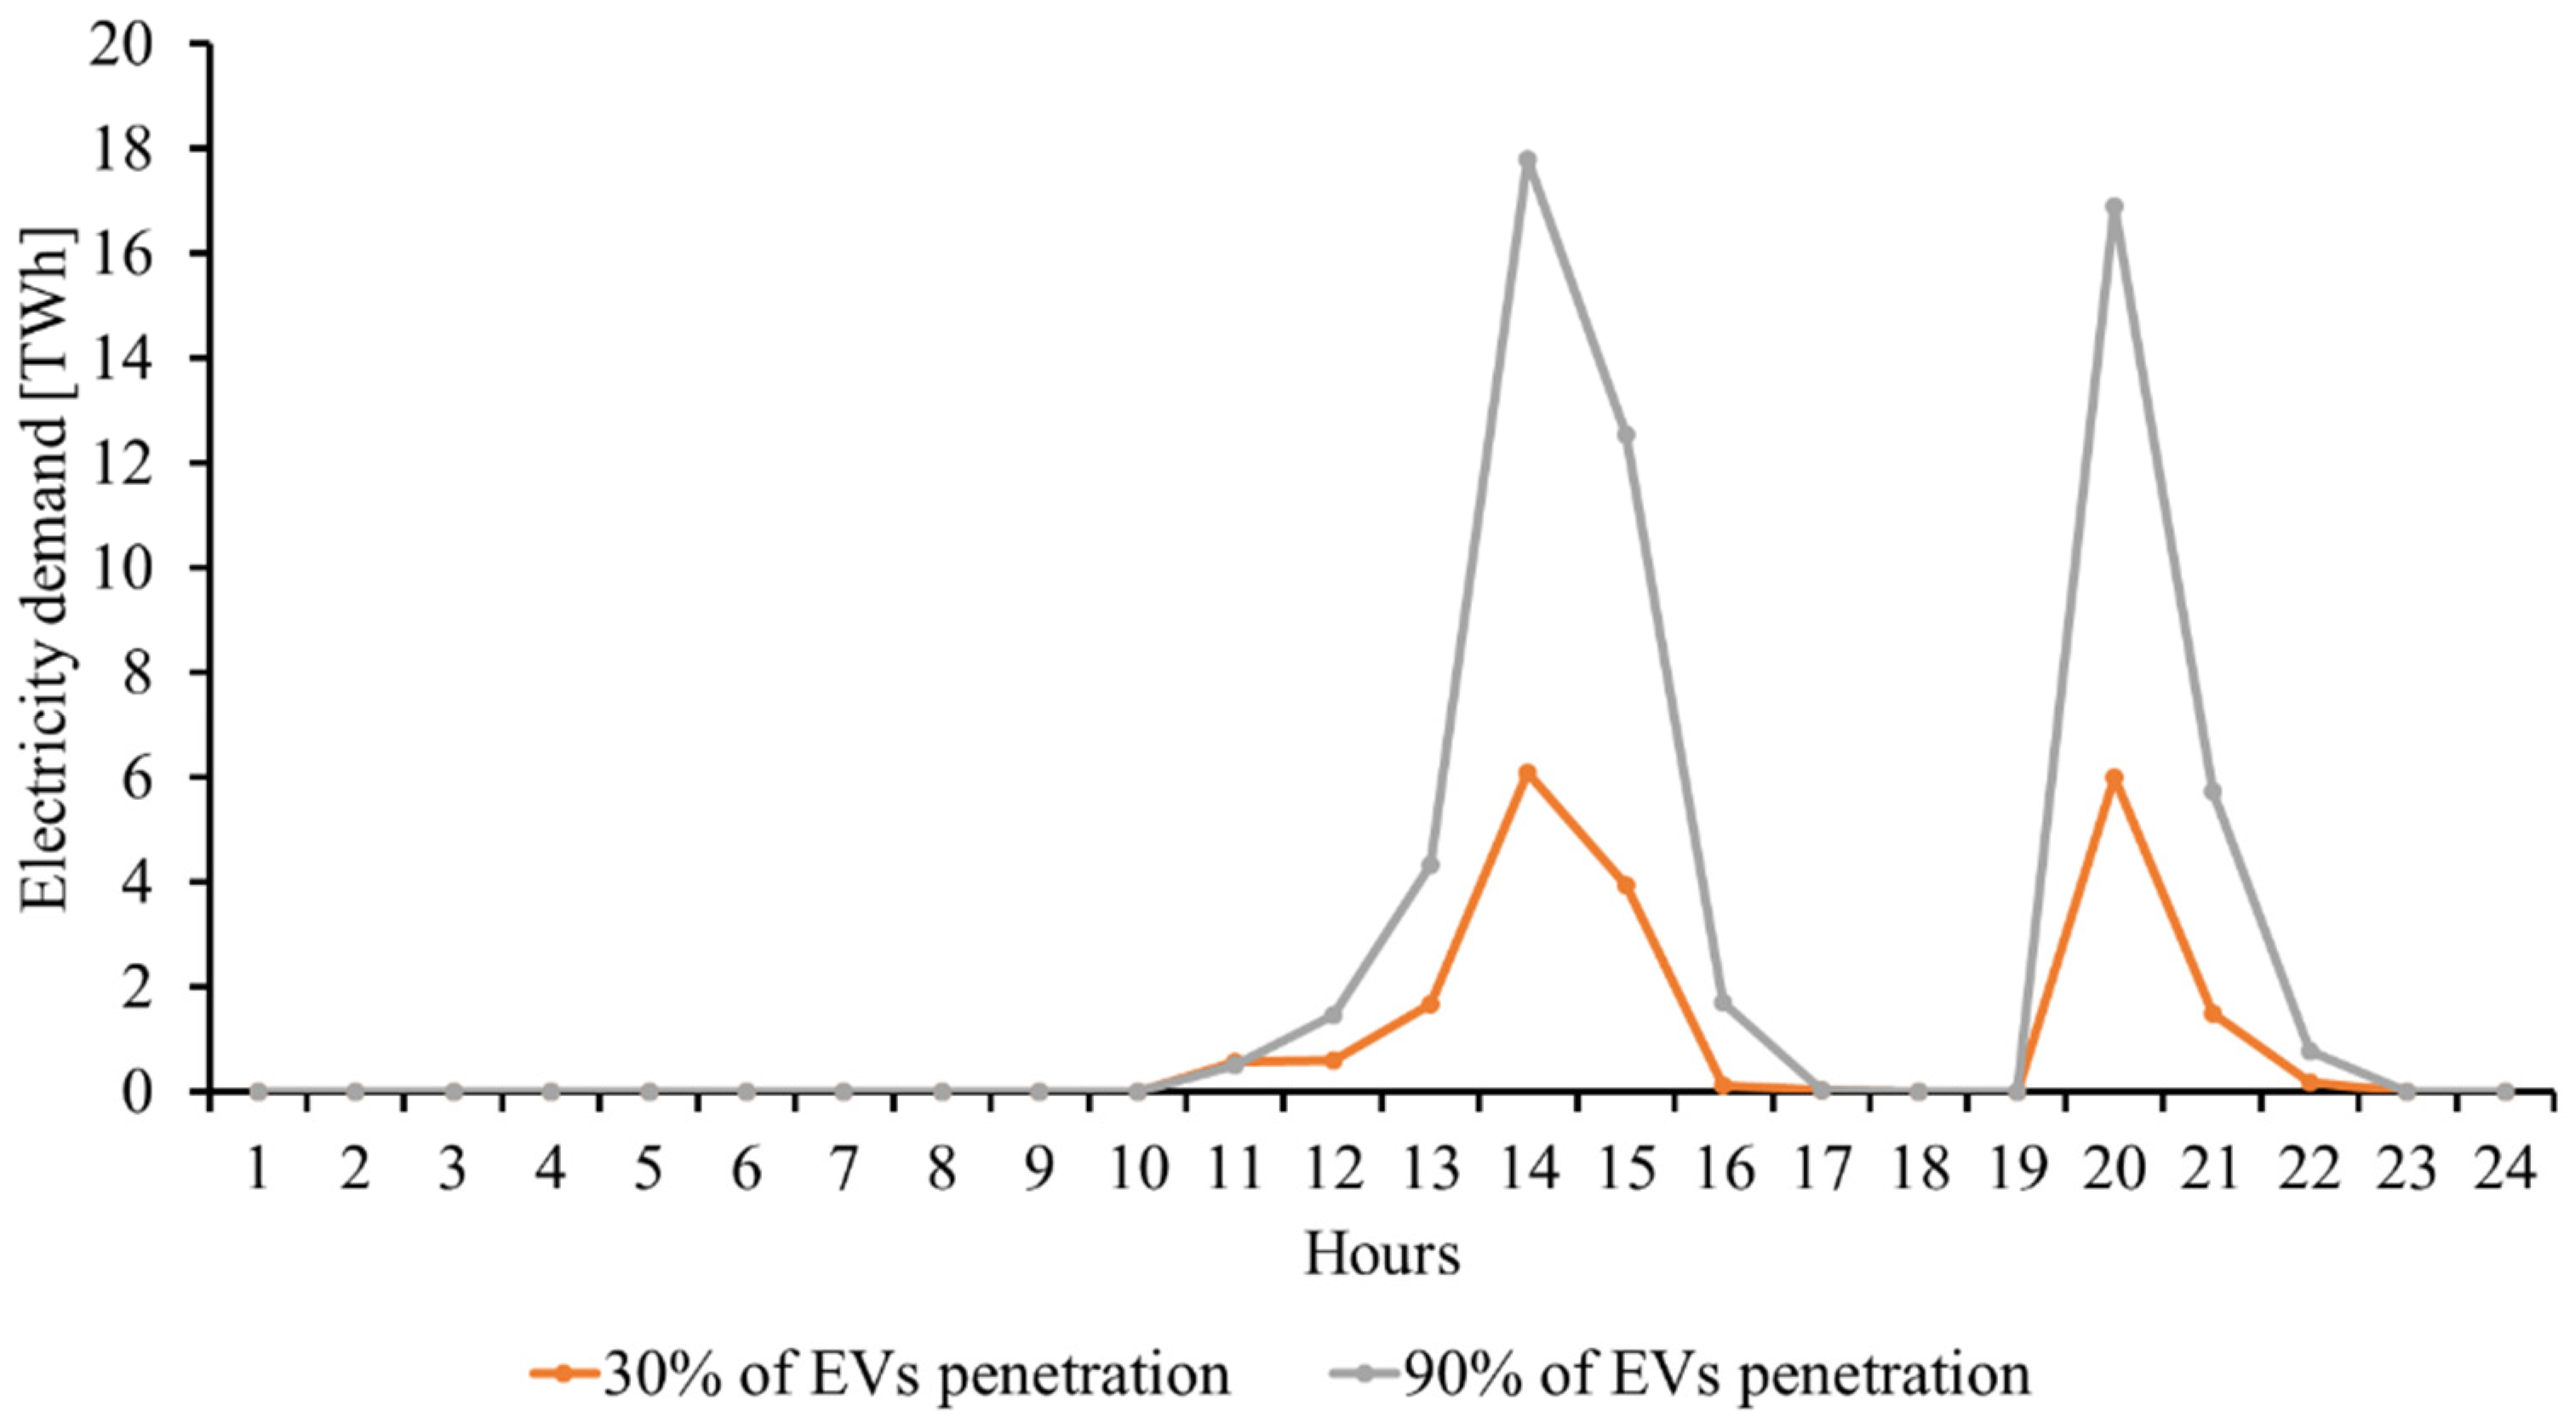
Figure 8 shows the forecasted electricity demand for 30% (2030) and 90% (2040) EVs penetration in a day. As it can be noticed, the electricity demand is higher during office hours. In Pakistan, office hours usually range from 9:00 a.m. to 5:00 p.m., and the peak electricity demand can be observed between 2:00–3:00 p.m. or after lunch. In the nighttime, the maximum electricity demand is recorded at 8 p.m., and it reduces afterward since EVs are assumed to be no longer recharged. From the obtained results, it is clear that the highest daily EVs’ electricity demand will occur during the daytime using PV, while the remaining electricity demand will be covered during the nighttime by the conventional power plants fossil fuel-based via the national electric grid.
As expected, the increase in EVs requires more electricity demand from the power sector. In particular, the electricity demand with the addition of 30% EVs for the year 2030 during both the daytime and the nighttime will be equal to 4.7 TWh/year and 2.2 TWh/year, respectively. Similarly, the electricity demand with the addition of 90% EVs for the year 2040 during both the daytime and the nighttime will be equal 14.2 TWh/year and 4.7 TWh/year, respectively. Finally, the overall evaluated capacities shown in Figure 9 will meet the required EVs’ electricity demand: regarding the estimated electricity demand coming from the implementation of 30% (2030) and 90% (2040) EVs, the PV capacity will be equal to 2.9 GW and 9 GW, respectively. Along the same line, regarding the EVs’ charge in the nighttime, the conventional power plant fossil fuel-based capacity will be equal to 0.3 GW and 0.7 GW in the years 2030 and 2040, respectively.
Another important aspect to be considered in the EVs’ industry is the amount of energy needed for the EVs’ manufacturing. Despite the energy consumption, i.e., natural gas, coal, and electricity used in parts manufacturing for EVs (3.82 MWh/vehicle) and conventional FFVs (3.75 MWh/vehicle) is almost comparable according to [63], the energy consumption for producing an electric battery (e.g., Li-Ion battery based) is equal to approximately 25 MWh according to [64]. As it can be noticed, this latter value influences considerably the energy needed to manufacture an EV, but this additional energy demand could be fulfilled by further implementation of RESs in addition to PV. To date, additional RESs’ capacities of almost 50 GW (2030) and 150 GW (2040) are required to satisfy the energy demand for the battery production due to the replacement of 30% and 90% of FFVs with EVs, respectively. However, it is worth noting that these additional RESs’ capacities are calculated based on the current economic situation worldwide, which will surely change in the future due to the variability of the availability of both primary sources and fuels, as well as their costs, along with further development in the batteries’ technology and their manufacturing processes.
In the light of the above, Pakistan is also planning to increase the installed generation capacity of fossil fuel-based power plants from 32 GW (2020) to 75 GW by the end of the year 2040. According to the future outlook of Pakistan, the expected PV capacity in the years 2030 and 2040 would be around 12.6 GW and 20.4 GW, respectively; thus, the PV power capacity dedicated to fulfilling the EVs’ electricity demand will be almost 23%, and 44% of the predicted ones in the years 2030 and 2040, respectively. The significant growth of EVs in the transportation sector is expected to increase the total electricity demand of the country for the baseline scenario related to the year 2020; thus, the projected PV capacity can easily fulfill the electricity demand of the transportation sector soon. Indeed, the government of Pakistan desires to improve the overall energy mix by considering sustainable developments to decarbonize the environment and provide affordable energy to the final users at a reduced cost.

5.2. Reduction of the Fuel Consumption in the Transportation Sector of Pakistan

The fuel share of vehicles differs for categories, namely 2/3 wheelers and cars: fossil fuels such as diesel and petrol are the major ones used in Pakistan, even though CNG was introduced for buses, taxis, motorbikes, and auto-rickshaws (3-wheeler) in early 2000.
Figure 10 shows the fuel share of Pakistan in the year 2020 for 2/3 wheelers and cars. It can be noticed that 3-wheelers hold a maximum share of CNG, and they are used as a means of public transport widely. Then, 2-wheelers are commonly fed by CNG and petrol to cover short distances. So far, diesel cars did not have a huge share compared to the others fueled by petrol and CNG in Asian countries [65]. As most of the fuels are imported into Pakistan, the use of more efficient energy vehicles is an important part to minimize the trend of the imported fuels, thus the introduction of EVs would be beneficial for the country from both the economic and the environmental points of view.
As previously said, the penetration of EVs in the national system of Pakistan has been investigated through two different scenarios, namely by replacing the current 2/3 wheelers and cars fossil fuel-based with EVs up to 30% (2030) and 90% (2040), as well as the installation of added PV and conventional power stations fossil fuel-based capacity to meet the increased EVs’ electricity demand.
As a result, a fuel consumption reduction is expected over the years due to the future energy policy that Pakistan will make from now onward which these forecasts have been done [13,66].
In this regard, Figure 11 shows the trend of what could be obtained by considering the EVs charge through PV (daytime) and the national electric grid (nighttime) according to the results obtained in this study.
Based on the collected data, average FFVs consumed 9.8 Mtoe in the year 2020. According to the evaluations done in this study, by replacing 30% of the fleet with EVs within the year 2030, the amount of fuel consumption will reduce by 1 Mtoe in the daytime and nighttime EVs’ charging scenarios.
Similarly, the fuel consumption will be further reduced by 3.5 Mtoe by the end of the year 2040. Even though the fuel consumption is expected to rise in such a condition (e.g., the use of fuel in the power sector), the use of fuel in the transportation sector will decrease significantly due to the further implementation of EVs by 36%.
Along the same line, the penetration of EVs will also reduce CO2 emissions, which will be assessed in Section 5.3, since the energy conversion technologies involved in the power sector are far more efficient than the current ones of the transportation sector such as ICEs.

5.3. Impacts on the Overall CO2 Emissions

Worldwide vehicles’ emissions increased only by 0.5% in the year 2019 owing to efficiency improvements, electrification, and greater use of alternative fuels. However, the transportation sector is still responsible for 24% of direct CO2 emissions from fuel combustion [6]. EVs do not represent a considerable share in 2020, but this will shift under the recently released national electric vehicles policy (NEVP) of Pakistan. The policy sets a goal of EVs capturing 30–90% of the light-duty vehicle by the years 2030 and 2040, respectively. Then, 90% of 10 million 2/3 wheelers and cars will be replaced by EVs in the year 2040.
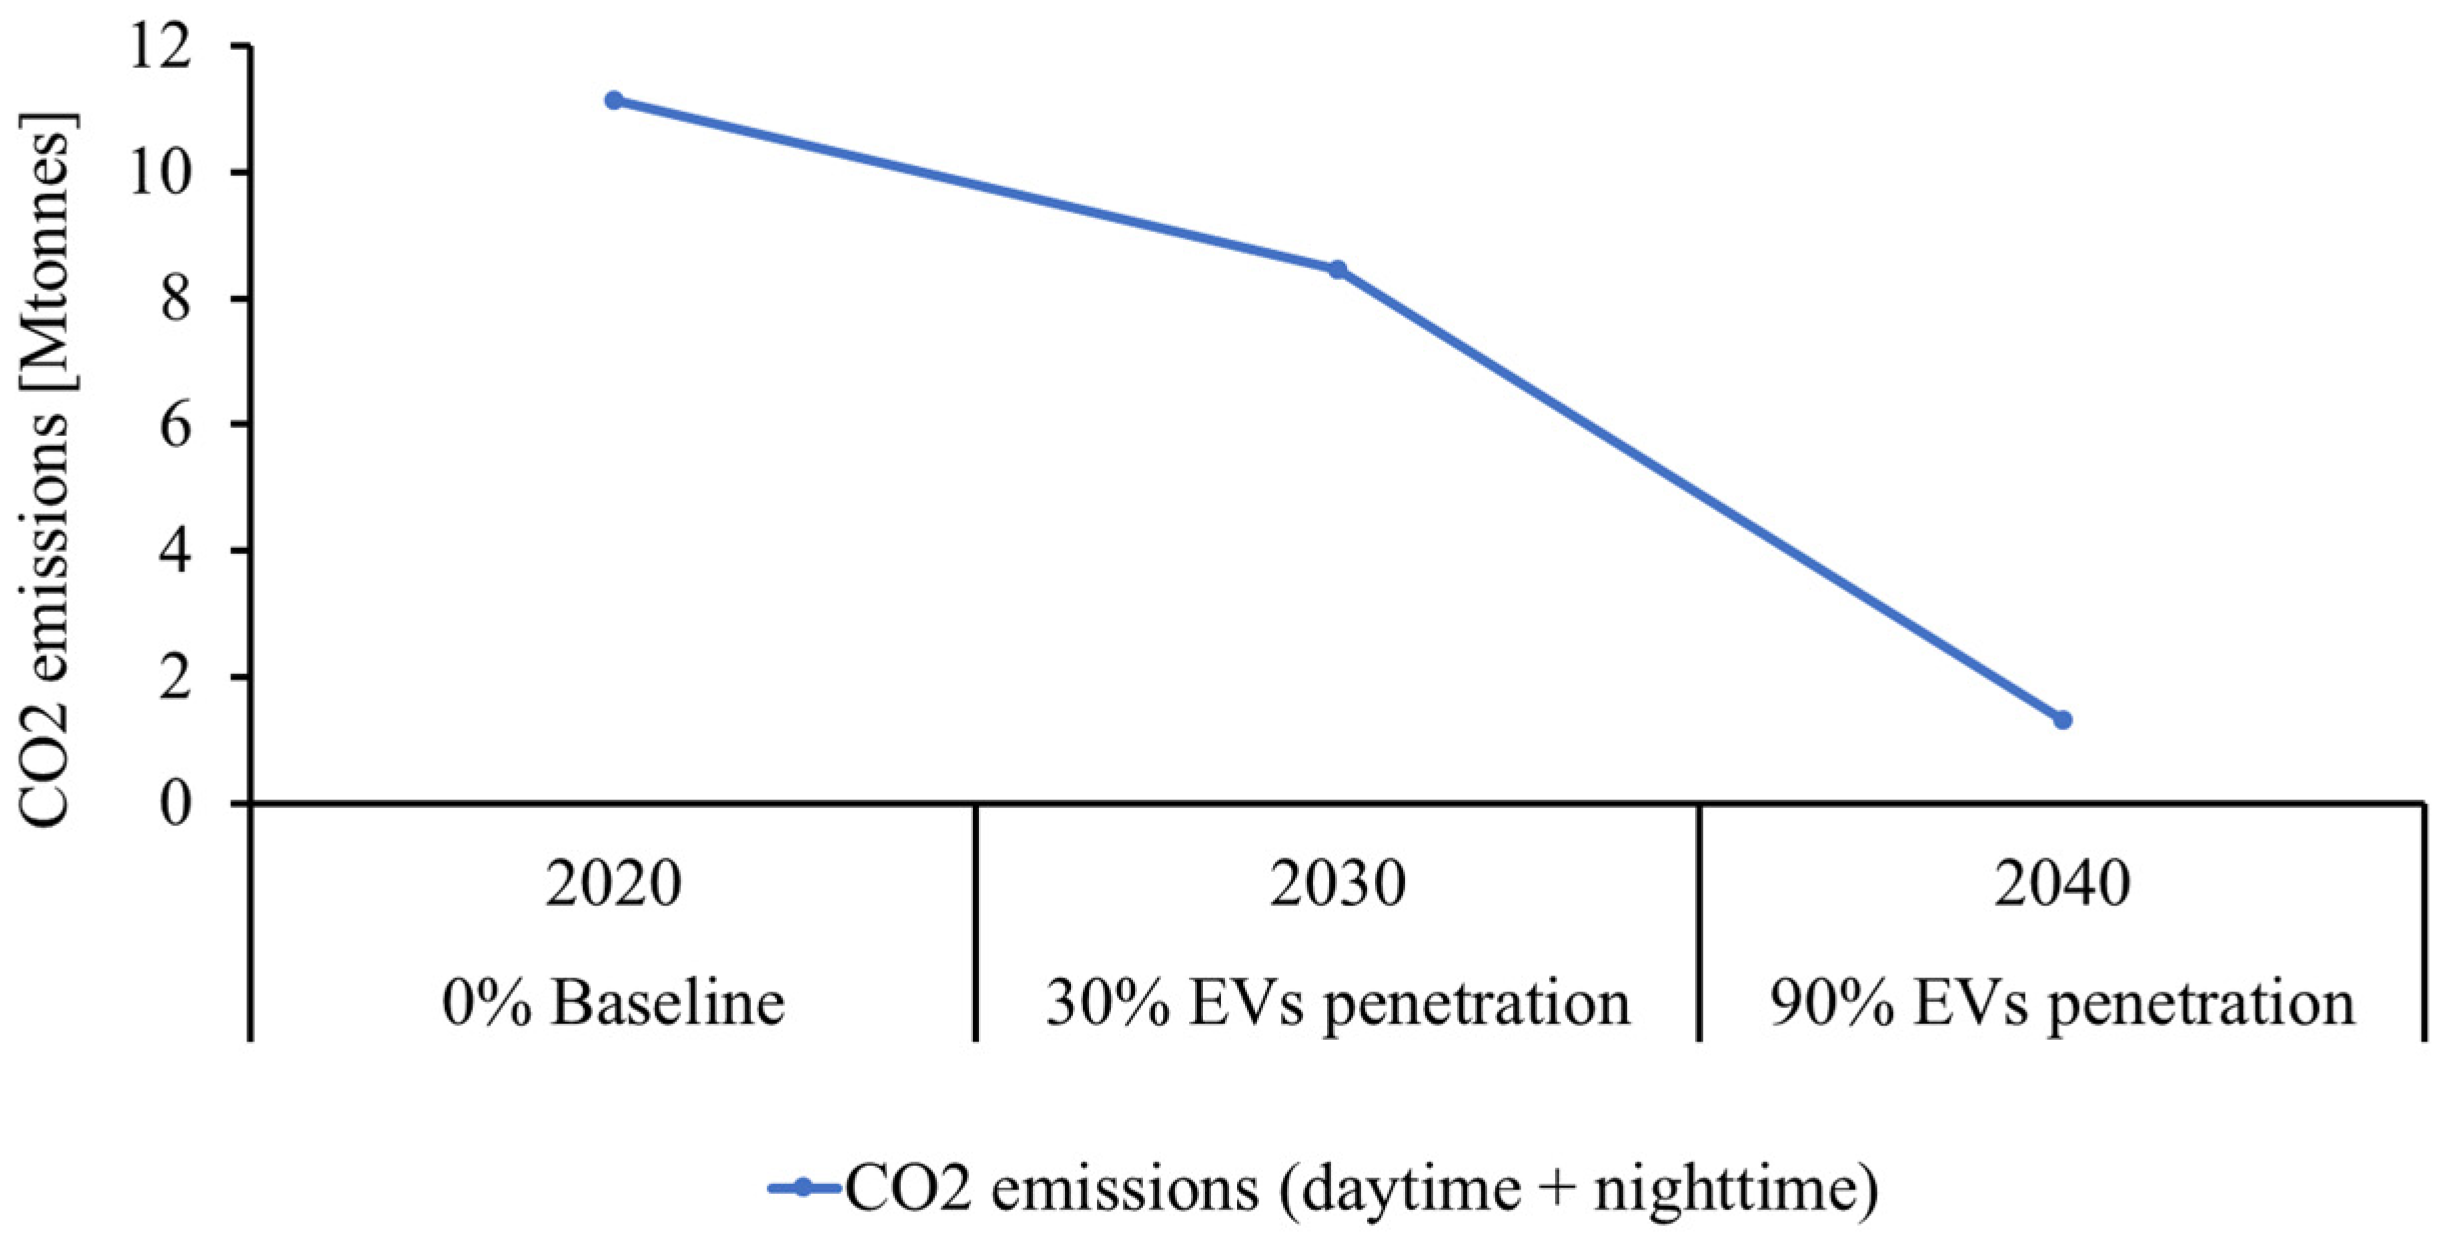
In the current study, the CO2 emissions depend on two factors: (i) emissions from the transportation sector, and (ii) the charging pattern (daytime and nighttime). EVs consider being emissions-free so the addition of EVs into the system will reduce the CO2 emissions from the transportation sector. Estimated vehicles’ CO2 emissions by integrating the input values in Equation (1) observed to be 11.13 Mtonnes for the Pakistani transportation sector in the reference year 2020. It can be noticed from Figure 8 that the electricity demand shows higher values during the day for both scenarios. At nighttime, the electricity is needed only for three hours; therefore, a comparison of CO2 emission has been made by charging with PV (daytime) and with the fossil fuel-based power plants (nighttime) in Figure 12 where all the CO2 emissions are due to mobility. When EVs are charged with PV in the daytime by considering the scenario in the year 2030, the total emissions reduce by 3.3 Mtonnes, and during the nighttime, when EVs are charged with the national electric grid, they further reduce to almost 0.7 Mtonnes. The charge of EVs with PV automatically reduces the emissions by 30% from the transportation sector. Hence, the overall reduction of CO2 emission in the year 2030 would be almost 4 Mtonnes from the same sector. In the year 2040, a total drop in CO2 emissions with the introduction of 90% of EVs will be approximately 10.4 Mtonnes in the transportation sector. Finally, a reduction of almost 88% in terms of CO2 emissions is possible with the use of PV to charge EVs instead of using FFVs by the end of 2040.
Nevertheless, the EVs’ life cycle has still a considerable impact also on the environmental point of view, as well as on the energy point of view as discussed in Section 5.1. Since the scenario analyses performed in this work provide an outlook of the possible outcomes due to the implementation of EVs in the Pakistani transportation sector (e.g., EVs’ operation), their life cycle analysis has been done separately to provide a wider overview of the EVs’ sector. According to [67], despite the average production of GHG emissions of the EVs’ manufacturing being equal to the FFVs (approximately 6.5 t CO2/vehicle per each), the life cycle of the battery increases the GHG emission of the EVs’ production (+4 t CO2/vehicle). In addition, the battery replacement has been also assessed, contributing to GHG emissions by almost 182 t CO2, which is sensibly lower than the overall EVs’ production process. This low value is mainly due to the replacement times of batteries in EVs, which have been considered equal to 3 for the entire EVs’ useful lives according to [63].
It can be concluded that a large proportion of GHG and air pollutant emissions associated with EVs’ manufacture arise from energy-intensive processes associated with battery manufacturing. To minimize the negative environmental impact of producing EVs, some key aspects must be considered: (i) end-users can choose the smallest EVs category with the smallest battery required to meet their own needs; (ii) take advantage of economies of scale and new techniques in both the battery and the vehicle production to lower the overall energy use; and (iii) choose the battery type with the lowest impact per unit of energy provided, while considering weight-related trade-offs with impacts on the use stage.

6. Conclusions and Recommendations

This study intended to assess the impact of the increasing share of EVs in Pakistan, only in terms of their operation, with different charging strategies during daytime (PV) and nighttime (national electric grid). The outputs are the annual electricity production due to the penetration of EVs, the forecasted capacity to fulfill completely the future EVs’ electricity demand according to the charging strategies previously mentioned, and, as a consequence, the reduction of both the fuel consumption and the CO2 emissions. The further penetration of EVs in the growing market depends on various aspects, but the most important factor is the reduction of CO2 emissions. The increase of the RESs’ share in the Pakistan energy mix for electricity production and the addition of EVs can be considered a good solution for achieving CO2 emissions reduction. Keeping in mind the scenarios and simulations performed in this study, it can be concluded that:
  • The added PV capacity of 2.9 GW during the daytime in the year 2030 will be required to fulfill the EVs’ electricity demand of 4.7 TWh/year. Likewise, for the year 2040 it would be needed 9 GW to meet the EVs’ electricity demand of 14.2 TWh/year;
  • In the year 2030, the added power plants’ fossil fuel-based capacity of 0.3 GW will satisfy 2.2 TWh/year during the nighttime for fulfilling the EVs’ electricity demand. Similarly, in the year 2040 it would be required 0.7 GW to meet the EVs’ electricity demand of 4.7 TWh/year;
  • The fuel consumption with the penetration of more EVs will reduce from 10 Mtoe (the baseline year 2020) by 1 Mtoe in the year 2030 (30% EVs penetration), and by 3.5 Mtoe in the year 2040 (90% EVs penetration);
  • Finally, a reduction in CO2 emissions will be observed, going from 11.13 Mtonnes (the baseline year 2020) to 4 Mtonnes in the year 2030 (30% EVs’ penetration), and 10.4 Mtonnes in the year 2040 (90% EVs’ penetration).
After this analysis, EVs can be considered a viable solution to decarbonize the national energy system of Pakistan. However, further steps forward must be done in the EVs’ manufacturing process since, despite the energy consumption, i.e., natural gas, coal, and electricity used in parts manufacturing for EVs (3.82 MWh/vehicle) and conventional FFVs (3.75 MWh/vehicle) is almost comparable as well as the average production of GHG emissions (approximately 6.5 t CO2/vehicle per each), the energy consumption for producing an electric battery (e.g., Li-Ion battery based) is equal to approximately 25 MWh and accounts for additional 4 t CO2/vehicle in terms of GHG emissions. Nevertheless, by summarizing the results obtained due to EVs’ operation, it is evident that there are considerable gains in terms of both fuel consumption and CO2 emissions reduction. Indeed, EVs are far more energy efficient than FFVs, which means that they use less energy to cover the maximum distance; thus, it will not only decrease the fuel consumption, but they will reduce the fuel cost as well. The overall reduction in terms of fuel consumption at the end of the year 2040 is estimated to be 9.1 Mtoe in the transportation sector. Therefore, this is a profitable project that is economically and energetically reliable. As a result of the massive deployment of EVs, the electricity demand will be expected to rise, and hence the production of more electricity will be needed. Considering the potential outlook of Pakistan, the EVs’ electricity demand will be certainly satisfied by both PV and the national electric grid. This initial EVs’ growth should be followed up by the development of proper infrastructure planning approaches for the country, involving more efforts and coordination from both the government and the provincial organizations. Further studies should focus on the planning of charging infrastructure, proper regulations, and appropriate policies should be designed to encourage and support the related industries. Moreover, the charging actions of EVs’ users and the configuration of the charging infrastructure will have a strong impact on the power system; hence, a coordinated and synergic approach must be properly implemented shortly to properly address the environmental issues not only in Pakistan but worldwide as well.

Author Contributions

Conceptualization, A.N., M.R., L.J. and E.C.; methodology, A.N. and M.R.; software, A.N., L.J.; validation, A.N. and M.R.; formal analysis, A.N. and E.C.; investigation, A.N., M.R. and E.C.; resources, G.C. and N.A.S.; data curation, A.N.; writing—original draft preparation, A.N., M.R.; writing—review and editing, A.N., M.R., E.C., G.C. and N.A.S.; visualization, A.N., M.R. and E.C.; supervision, G.C. and N.A.S.; project administration, G.C. All authors have read and agreed to the published version of the manuscript.

Funding

This research received no external funding.

Informed Consent Statement

Not applicable.

Conflicts of Interest

The authors declare no conflict of interest.

Nomenclature

η ChargerEfficiency of the grid to battery connection (charger)
ηInverterEfficiency of the battery to grid connection (inverter)

Acronyms

ASEANAssociation of Southeast Asian Nations
CNGCompressed Natural Gas
CRIClimate Risk Index
DSFDepth First Search
DPBSData Pakistan Bureau of Statistics
EPAEnvironmental Protection Agency
EVElectric Vehicle
FFVFossil Fuel Vehicle
GHGGreenhouse Gas
ICEInternal Combustion Engine
IEAInternational Energy Agency
INDCIntended Nationally Determined Contributions
LPGLow Pressure Gas
PVPhotovoltaic
NEEDSNational Economic and Environment Development
NEPRANational Electric Power Regulatory Authority
NEVPNational Electric Vehicles Policy
RESRenewable Energy Source
SOCState Of Charge
toetonnes of oil equivalent
V2GVehicle-to-Grid

References

  1. Climate Change|US EPA. Available online: https://www.epa.gov/climate-change (accessed on 14 March 2022).
  2. Wu, Y.A.; Ng, A.W.; Yu, Z.; Huang, J.; Meng, K.; Dong, Z.Y. A Review of Evolutionary Policy Incentives for Sustainable Development of Electric Vehicles in China: Strategic Implications. Energy Policy 2021, 148, 111983. [Google Scholar] [CrossRef]
  3. López, I.; Ibarra, E.; Matallana Andreu, J.; Kortabarria, I. Next Generation Electric Drives for HEV/EV Propulsion Systems: Technology, Trends and Challenges. Renew. Sustain. Energy Rev. 2019, 114, 109336. [Google Scholar] [CrossRef]
  4. Singh, N.; Mishra, T.; Banerjee, R.; Mishra, T.; Banerjee, R.; Mehta, S.J. Greenhouse Gas Emissions in India’s Road Transport Sector, Climate Change Signals and Response; Springer: Singapore, 2018; pp. 197–209. [Google Scholar] [CrossRef]
  5. Ghosh, A. Possibilities and Challenges for the Inclusion of the Electric Vehicle (EV) to Reduce the Carbon Footprint in the Transport Sector: A Review. Energies 2020, 13, 2602. [Google Scholar] [CrossRef]
  6. Schey, S.; Scoffield, D.; Smart, J. A First Look at the Impact of Electric Vehicle Charging on the Electric Grid in the EV Project. In Proceedings of the EVS26 International Battery, Hybrid and Fuel Cell Electric Vehicle Symposium, Los Angeles, CA, USA, 6–9 May 2012. [Google Scholar]
  7. Global EV Outlook 2020—Analysis—IEA. Available online: https://www.iea.org/reports/global-ev-outlook-2020 (accessed on 8 April 2022).
  8. ESMAP (Energy Sector Management Assistance Program), Bringing Variable Renewable Energy Up to Scale Option for Grid Integration Using Natural Gas and Energy Storage; Technical Report 006/15; The International Bank for Reconstruction and Development: Washington, DC, USA. 2015. Available online: https://openknowledge.worldbank.org/bitstream/handle/10986/21629/ESMAP_Bringing+Variable+Renewable+Energy+Up+to+Scale_VRE_TR006-15.pdf;jsessionid=3C9833F5E118E7D948A44FB049CF9ADE?sequence=4 (accessed on 8 April 2022).
  9. Bellocchi, S.; Manno, M.; Noussan, M.; Prima, G.M.; Vellini, M. Electrification of Transport and Residential Heating Sectors in Support of Renewable Penetration: Scenarios for the Italian Energy System. Energy 2020, 196, 117062. [Google Scholar] [CrossRef]
  10. Yuan, M.; Thellufsen, J.Z.; Lund, H.; Liang, Y. The Electrification of Transportation in Energy Transition. Energy 2021, 236, 121564. [Google Scholar] [CrossRef]
  11. Muneer, T.; Maubleu, S.; Asif, M. Prospects of Solar Water Heating for Textile Industry in Pakistan. Renew. Sustain. Energy Rev. 2006, 10, 1–23. [Google Scholar] [CrossRef]
  12. Publications|Germanwatch e.V. Available online: https://www.germanwatch.org/en/publications (accessed on 8 April 2022).
  13. Pakistan’s National Electric Vehicle Policy: Charging towards the Future. Available online: https://theicct.org/pakistans-national-electric-vehicle-policy-charging-towards-the-future/ (accessed on 8 April 2022).
  14. Muhammad, F.; Waleed Raza, M.; Khan, S.; Khan, F. Different Solar Potential Co-Ordinates of Pakistan. Innov. Energy Res. 2017, 6, 173. [Google Scholar] [CrossRef] [Green Version]
  15. Kempton, W.; Tomic, J. Vehicle-to-Grid Power Implementation: From Stabilizing the Grid to Supporting Large-Scale Renewable Energy. J. Power Sources 2005, 144, 280–294. [Google Scholar] [CrossRef]
  16. Chaouachi, A.; Bompard, E.; Fulli, G.; Masera, M.; De Gennaro, M.; Paffumi, E. Assessment Framework for EV and PV Synergies in Emerging Distribution Systems. Renew. Sustain. Energy Rev. 2016, 55, 719–728. [Google Scholar] [CrossRef]
  17. Ciabattoni, L.; Cardarelli, S.; di Somma, M.; Graditi, G.; Comodi, G. A Novel Open-Source Simulator of Electric Vehicles in a Demand-Side Management Scenario. Energies 2021, 14, 1558. [Google Scholar] [CrossRef]
  18. Pupo-Roncallo, O.; Ingham, D.; Pourkashanian, M. Techno-economic benefits of grid-scale energy storage in future energy systems. Energy Rep. 2020, 6, 242–248. [Google Scholar] [CrossRef]
  19. Bartolini, A.; Comodi, G.; Salvi, D.; Østergaard, P.A. Renewables self-consumption potential in districts with high penetration of electric vehicles. Energy 2020, 213, 118653. [Google Scholar] [CrossRef]
  20. Calise, F.; Liberato Cappiello, F.; Dentice d’Accadia, M.; Vicidomini, M. Smart grid energy district based on the integration of electric vehicles and combined heat and power generation. Energy Convers. Manag. 2021, 234, 113932. [Google Scholar] [CrossRef]
  21. Wang, M.; Li, T.; Yuan, C.; Tian, H.; Tian, S. Research on vehicle renewable energy use in cities with different carbon emission characteristics. Energy Rep. 2022, 8, 343–352. [Google Scholar] [CrossRef]
  22. Bastida-Molina, P.; Hurtado-Pérez, E.; Moros Gomez, M.C.; Vargas-Salgado, C. Multicriteria power generation planning and experimental verification of hybrid renewable energy systems for fast electric vehicle charging stations. Renew. Energy 2021, 179, 737–755. [Google Scholar] [CrossRef]
  23. Harewood, A.; Dettner, F.; Hilpert, S. Open source modelling of scenarios for a 100% renewable energy system in Barbados incorporating shore-to-ship power and electric vehicles. Energy Sustain. Dev. 2022, 68, 120–130. [Google Scholar] [CrossRef]
  24. Iwai, N.; Kurahashi, N.; Kishita, Y.; Yamaguchi, Y.; Shimoda, Y.; Fukushige, S.; Umeda, Y. Scenario Analysis of Regional Electricity Demand in the Residential and Commercial Sectors—Influence of Diffusion of Photovoltaic Systems and Electric Vehicles into Power Grids. Procedia Cirp 2014, 15, 319–324. [Google Scholar] [CrossRef] [Green Version]
  25. Brostrom, T.; Babar, B.; Hansen, J.B.; Good, C. The pure PV-EV energy system—A conceptual study of a nationwide energy system based solely on photovoltaics and electric vehicles. Smart Energy 2021, 1, 100001. [Google Scholar] [CrossRef]
  26. Smith, D.; Graves, R.; Ozpineci, B.; Jones, P.T. Medium- and Heavy-Duty Vehicle Electrification: An Assessment of Technology and Knowledge Gaps; ORNL/SPR-2020/7; Oak Ridge National Laboratory (ORNL): Oak Ridge, TN, USA; National Renewable Energy Laboratory (NREL): Golden, CO, USA, 2019. Available online: https://info.ornl.gov/sites/publications/Files/Pub136575.pdf (accessed on 8 April 2022).
  27. Petkov, I.; Gabrielli, P. Power-to-hydrogen as seasonal energy storage: An uncertainty analysis for optimal design of low-carbon multi-energy systems. Appl. Energy 2020, 274, 115197. [Google Scholar] [CrossRef]
  28. Trentadue, G.; Lucas, A.; Otura, M.; Pliakostathis, K.; Zanni, M.; Scholz, H. Evaluation of Fast Charging Efficiency under Extreme Temperatures. Energies 2018, 11, 1937. [Google Scholar] [CrossRef] [Green Version]
  29. NationMastr: Pakistan Transport Stats. Available online: https://www.nationmaster.com/country-info/profiles/Pakistan/Transport (accessed on 8 April 2022).
  30. Jolta Electric EBike JE-70D. Available online: https://www.joltaelectric.com/models/JE-70D.html (accessed on 8 April 2022).
  31. Hero Electric—Best Electric Bikes & Scooters in India. Available online: https://heroelectric.in/ (accessed on 8 April 2022).
  32. PURE EV Epluto Specifications & Features, Mileage, Weight. Available online: https://www.zigwheels.com/newbikes/PURE-EV/epluto/specifications (accessed on 8 April 2022).
  33. Mahindra Treo|E Rickshaw—Mahindra Electric. Available online: https://www.mahindraelectric.com/vehicles/treo-electric-auto/ (accessed on 8 April 2022).
  34. Kinetic Zing Electric Scooter and Bike|Kinetic Green Vehicles. Available online: https://kineticgreenvehicles.com/electric-scooters/zing.html (accessed on 8 April 2022).
  35. Gayam Motor Works (GMW), an EV Pioneer with Presence in 5 Continents Announces $50Mn Investment Commitment from GEM, as Company Seeks to Go Public in Coming Months|Business Wire. Available online: https://www.businesswire.com/news/home/20210331005905/en/Gayam-Motor-Works-GMW-an-EV-Pioneer-with-Presence-in-5-Continents-Announces-50Mn-Investment-Commitment-from-GEM-as-Company-Seeks-to-Go-Public-in-Coming-Months (accessed on 8 April 2022).
  36. Renewables.Ninja. Available online: https://www.renewables.ninja/ (accessed on 8 April 2022).
  37. Staffell, I.; Pfenninger, S. Using Bias-Corrected Reanalysis to Simulate Current and Future Wind Power Output. Energy 2016, 114, 1224–1239. [Google Scholar] [CrossRef] [Green Version]
  38. Pfenninger, S.; Staffell, I. Long-Term Patterns of European PV Output Using 30 Years of Validated Hourly Reanalysis and Satellite Data. Energy 2016, 114, 1251–1265. [Google Scholar] [CrossRef] [Green Version]
  39. EnergyPLAN|Advanced Energy Systems Analysis Computer Model. Available online: https://www.energyplan.eu/ (accessed on 8 April 2022).
  40. Connolly, D.; Lund, H.; Mathiesen, B.; Leahy, M. The First Step towards a 100% Renewable Energy-System for Ireland. Appl. Energy 2011, 88, 502–507. [Google Scholar] [CrossRef]
  41. Dorotić, H.; Doračić, B.; Dobravec, V.; Puksec, T.; Krajacic, G.; Duic, N. Integration of Transport and Energy Sectors in Island Communities with 100% Intermittent Renewable Energy Sources. Renew. Sustain. Energy Rev. 2019, 99, 109–1241. [Google Scholar] [CrossRef]
  42. Documentation|EnergyPLAN. Available online: https://www.energyplan.eu/training/documentation/ (accessed on 8 April 2022).
  43. Pakistan Bureau of Statistics. Available online: https://www.pbs.gov.pk/ (accessed on 8 April 2022).
  44. Electric Vehicles in Pakistan: Policy Recommendations. Available online: https://lei.lums.edu.pk/index.php/electric-vehicles-in-pakistan-policy-recommendations/ (accessed on 8 April 2022).
  45. Aslam, H.; Ahmed, V.; Williamson, M.; Rana, F.; Rehman Zia, U. Reform Priorities for Pakistan’s Energy Sector Perspectives in the Backdrop of Paris Agreement This Brief Draws from the Extensive Workshops on the Subject Led by the United Nations Economic and Social Commission for Asia and the Pacific (UNESCAP) and the Sustainable Development Policy Institute (SDPI) under the Project ’Evidence Based Policies for Sustainable Use of Energy Resources. Available online: https://repository.unescap.org/handle/20.500.12870/2901 (accessed on 8 April 2022).
  46. Specific Carbon Dioxide Emissions of Various Fuels. Available online: https://www.volker-quaschning.de/datserv/CO2-spez/index_e.php (accessed on 8 April 2022).
  47. Motorcycles Sales Database—80 Countries, All Brands & Models. Available online: https://www.motorcyclesdata.com/ (accessed on 8 April 2022).
  48. Schröder, M.; Iwasaki, F. Promotion of Electromobility in ASEAN: States, Carmakers, and International Production Networks. ERIA 2021. Research Project Report. Available online: https://www.eria.org/publications/promotion-of-electromobility-in-asean-states-carmakers-and-international-production-networks/ (accessed on 8 April 2022).
  49. Haslback, J.; Kuehn, N.; Lewis, E.; Pinkerton, L. Bituminous Coal and Natural Gas to Electricity. In Cost and Performance Baseline for Fossil Energy Plants. Available online: https://www.netl.doe.gov/projects/files/CostAndPerformanceBaselineForFossilEnergyPlantsVol1BitumCoalAndNGtoElectBBRRev4-1_092419.pdf (accessed on 8 April 2022).
  50. Torchio, M.; Santarelli, M. Energy, Environmental and Economic Comparison of Different Powertrain/Fuel Options Using Well-to-Wheels Assessment, Energy and External Costs–European. Energy 2010, 35, 4156–4171. [Google Scholar] [CrossRef]
  51. Spath, P.L.; Mann, M.K.; Kerr, D.R. Life Cycle Assessment of Coal-Fired Power Production; National Renewable Energy Lab (NREL): Golden, CO, USA, 1999. [Google Scholar] [CrossRef] [Green Version]
  52. Ren, L.; Zhou, S.; Ou, X. Life-Cycle Energy Consumption and Greenhouse Gas Emissions for Electricity Generation and Supply in China. Energy 2020, 209, 118482. [Google Scholar] [CrossRef]
  53. Fioreze, M.; Honnicke, M. Montagem de Dispositivos Ópticos para Obtenção de Imagens por Contraste de Difração e Atenuação para Análise de Incrustações de Fosfato e Oxalato de Cálcio em Superfícies de Caldeiras. 2016. Available online: https://dspace.unila.edu.br/bitstream/handle/123456789/637/Montagem%20de%20Dispositivos%20Opticos%20para%20Obtencao%20de%20Imagens%20por%20Contraste%20de%20Difracao%20e%20Atenuacao%20para%20Analise%20de%20Incrustacoes%20de%20Fosfato%20e%20Oxalato%20de%20C%C3%A1lcio%20em%20Superficies%20de%20Caldeiras.pdf?sequence=1&isAllowed=y (accessed on 8 April 2022).
  54. Suppes, G.J.; Storvick, T.S. Production of Electricity. In Sustainable Nuclear Power; Academic Press: Cambridge, MA, USA, 2007; pp. 185–200. [Google Scholar] [CrossRef]
  55. Travesset-Baro, O.; Rosas-Casals, M.; Jover, E. Transport Energy Consumption in Mountainous Roads. A Comparative Case Study for Internal Combustion Engines and Electric Vehicles in Andorra. Transp. Res. Part D Transp. Environ. 2015, 34, 16–26. [Google Scholar] [CrossRef] [Green Version]
  56. Hekkert, M.; Hendriks, F.; Faaij, A.; Neelis, M. Natural Gas as an Alternative to Crude Oil in Automotive Fuel Chains Well-to-Wheel Analysis and Transition Strategy Development. Energy Policy 2005, 33, 579–594. [Google Scholar] [CrossRef] [Green Version]
  57. Linssen, J.; Schindler, V.; Danzer, M.A.; Schmitz, P.; Marker, S.; Lindwedel, E.; Günther, C.; Strunz, K.; Maas, H.; Waldowski, P.; et al. Netzintegration von Fahrzeugen mit elektrifizierten Antriebssystemen in bestehende und zukünftige Energieversorgungsstrukturen—Advances in Systems Analysis 1; Forschungszentrum Jülich’s Publishing House: Jülich, Germany, 2012. [Google Scholar]
  58. Albatayneh, A.; Assaf, M.; Alterman, D.; Jaradat, M. Comparison of the Overall Energy Efficiency for Internal Combustion Engine Vehicles and Electric Vehicles. Environ. Clim. Technol. 2020, 24, 669–680. [Google Scholar] [CrossRef]
  59. Allik, A.; Märss, M.; Uiga, J.; Annuk, A. Optimization of the Inverter Size for Grid-Connected Residential Wind Energy Systems with Peak Shaving. Renew. Energy 2016, 99, 1116–1125. [Google Scholar] [CrossRef]
  60. Amin Aslam Khan, M.; Amir, P.; Ahmad Ramay Zuhair Munawar, S.; Ahmad, D. National Economic & Environmental Development Study (NEEDS). 2011. Available online: https://unfccc.int/topics/climate-finance/workstreams/determination-of-the-needs-of-developing-country-parties-related-to-implementing-the-convention-and/national-economic-environment-and-development-study-needs-for-climate-change-project (accessed on 8 April 2022).
  61. Pakistan’s Intended Nationally Determined Contribution (Pak-INDC). Available online: https://www4.unfccc.int/sites/ndcstaging/PublishedDocuments/Pakistan%20First/Pak-INDC.pdf (accessed on 8 April 2022).
  62. CO2 Emissions from Gaseous Fuel Consumption (Kt)—Pakistan|Data. Available online: https://data.worldbank.org/indicator/EN.ATM.CO2E.GF.KT?end=2018&locations=PK&start=2003&view=chart (accessed on 8 April 2022).
  63. Yang, L.; Yu, B.; Yang, B.; Chen, H.; Malima, G.; Wei, Y.M. Life cycle environmental assessment of electric and internal combustion engine vehicles in China. J. Clean. Prod. 2021, 285, 124899. [Google Scholar] [CrossRef]
  64. Yuan, C.; Deng, Y.; Li, T.; Yang, F. Manufacturing energy analysis of lithium ion battery pack for electric vehicles. CIRP Ann. 2017, 66, 53–56. [Google Scholar] [CrossRef]
  65. Asia|Transport Policy. Available online: https://www.transportpolicy.net/region/asia/ (accessed on 8 April 2022).
  66. Pakistan’s Installed Capacity May Rise by over 40% to 57 GW in 2030|Enerdata. Available online: https://www.enerdata.net/publications/daily-energy-news/pakistans-installed-capacity-may-rise-over-40-57-gw-2030.html (accessed on 8 April 2022).
  67. European Environmental Agency, Electric Vehicles from Life Cycle and Circular Economy Perspectives. TERM 2018: Transport and Environment Reporting Mechanism (TERM) Report, EEA Report No 13/2018, ISSN 1977–8449. Available online: https://www.eea.europa.eu/publications/electric-vehicles-from-life-cycle/download (accessed on 8 April 2022).
Figure 1. The hourly trend was recorded in February (a), April (b), July (c), and November (d) in the year 2019.
Energies 15 03054 g001aEnergies 15 03054 g001b
Figure 2. Input-output arrangement of EnergyPLAN®, where the main blocks involved in this study are highlighted in red (inputs) and green (outputs).
Energies 15 03054 g002
Figure 3. The final efficiency chain of FFVs considering the overall fuel process.
Energies 15 03054 g003
Figure 4. The final efficiency of EVs’ charging considering the electricity coming from power plants.
Energies 15 03054 g004
Figure 5. The final efficiency of EVs’ charging considering the electricity coming from PV.
Energies 15 03054 g005
Figure 6. The trend of the PV capacity in Pakistan till 2047 [13].
Energies 15 03054 g006
Figure 7. CO2 emissions trend in Pakistan from 2002 till 2018.
Energies 15 03054 g007
Figure 8. Daily forecasted electricity demand for 30% and 90% EVs penetration.
Energies 15 03054 g008
Figure 9. Yearly EVs’ electricity demand with (a) added PV (daytime) and (b) added conventional power plant (nighttime) capacities.
Energies 15 03054 g009
Figure 10. Fuel share of the transportation sector (year 2020).
Energies 15 03054 g010
Figure 11. The decreasing trend of the fuel consumption with EVs penetration.
Energies 15 03054 g011
Figure 12. CO2 emissions’ trend with the EVs penetration over the years.
Energies 15 03054 g012
Table 1. Characteristics of 2/3 electric wheelers used in the ePop simulator.
SubgroupName/Model
(2/3 Electric Wheelers)
Battery Capacity [kWh]Price [€]Average Mileage [km]
1JOLTA [30] 400–500
EBIKE JE-704.40Up to 80
SCOOTY4.40Up to 60
SPORTS BIKE7.04Up to 80
2Hero Electric Optima LA [31]0.9650050
3PURE EV Epluto [32]1.8080085
4MAHINDRA TREO [33] 2000–3000
SFT7.37130
HRT7.37130
YAARI-SFT3.6985
yaari-HRT3.6985
5Kinetic Safar E- Auto [34]4.802110From 80 to 100
6GMW Urban ET [35]4.803686Up to 110
Table 2. Characteristics of the EVs involved in the current study.
Size of VehicleType of VehiclesFuel Consumption (ktoe)# Vehicles
Compressed Natural GasLiquid Natural GasPetrolDieselMillions
Small2 wheelers (motorbikes)298-457-1.72
3 wheelers (rickshaws)63.30.810.05-1.80
MediumCars142-71648.26.2
Carbon contents in fuel
(kg CO2/GJ)
55.8263.169.374.1
Publisher’s Note: MDPI stays neutral with regard to jurisdictional claims in published maps and institutional affiliations.