Article

Measurement of Cyclic Variation of the Air-to-Fuel Ratio of Exhaust Gas in an SI Engine by Laser-Induced Breakdown Spectroscopy

1
i-Lab., Inc., #213 KIBC Bldg., 5-5-2 Minatojima-Minami, Chuo, Kobe 650-0047, Japan
2
Department of Mechanical Engineering, Okayama University 3-1-1 Tsushima-Naka, Okayama 700-8530, Japan
*
Author to whom correspondence should be addressed.
Energies 2022, 15(9), 3053; https://doi.org/10.3390/en15093053
Submission received: 28 March 2022 / Revised: 18 April 2022 / Accepted: 20 April 2022 / Published: 21 April 2022
(This article belongs to the Special Issue Internal Combustion Engine Performance 2022)

Abstract

:
Temporally and spatially resolved laser-induced breakdown spectroscopy (LIBS) was applied to a four-stroke, single-cylinder test engine’s cyclic exhaust gas to demonstrate engine performance. The LIBS technique provided quantitative air-to-fuel ratio (A/F) measurements by generating localized breakdown plasma during the compression and exhaust strokes. The results showed that the timing and duration settings of the emission energy ionization and molecular spectra affect the intensity peaks. Optimum measurements performed between 200 ns and 10 ms after breakdown resulted in observed atomic spectra of CI (248 nm), Hβ (485 nm), Hα (656 nm), NI (745, 824 nm), and OI (777, 844 nm). The intensities of CI (248 nm) and Hα (656 nm) decreased with increasing A/F, whereas the intensity ratios of NI and OI remained constant. A decrease in the intensity ratio of C/O and Hα/O was observed as the A/F increased. This study is a major step toward defining a means of using LIBS to control the A/F ratio in gasoline engines by focusing on the exhaust gas rather than the flame.

1. Introduction

Many studies on engine control and performance enhancements [1] have led to increased fuel economy [2,3,4] and stable combustion [5,6,7]. However, the drawbacks of high combustion emissions still endure [8,9]. Gaseous emissions such as nitrogen oxides and carbon monoxide impact human health, while carbon dioxide emissions promote climate change and global warming [10]. Reducing exhaust emissions is essential in addressing pollution and climate change [11]. Many great efforts to decarbonize the transportation sector have been made [12,13,14,15] and are continually being studied [16,17,18]. Thus, the reduction of unwanted exhaust gases is indispensable in developing high-performance automobile engines.
One of the crucial parameters in determining engine exhaust gas emissions is the air-to-fuel ratio (A/F) [19,20,21,22,23]. Several methodologies can be applied to measure and control the A/F, provided that the cycle-to-cycle intake air flow rate can be measured [24,25,26,27,28]. The A/F control is complicated because the cylinder-to-cylinder variance of the intake air flow rate must be considered. However, this is the actual process used to control the quantity of fuel injected into the engine, even if the temporal resolution of available measurement techniques is low.
Cycle-resolved A/F measurements and feedback control can control the amount of fuel injected without airflow rate measurements [29]. Although the A/F can be estimated at the exhaust manifold with an O2 sensor [30], the cycle-resolved A/F cannot be measured by such a sensor because its time response is too slow compared to the engine speed. Therefore, a measurement technique with a faster response time is needed. Fourier transform infrared (FTIR), a flame ionization detector (FID), non-dispersive infrared sensor (NDIR), and laser-induced breakdown spectroscopy (LIBS) are becoming more common for measuring gas species [31]. However, some of these methods require a gas vacuum and have low resolutions (see Table 1) [32].
The actual A/F compared to the stoichiometric air to fuel ratio gives rise to the equivalence ratio (ER), which is also an essential parameter in controlling exhaust gas [22]. The equivalence ratio can be obtained directly from the flame emission during combustion by the chemiluminescence spectrum [24,25]. In spark-ignition engines, this highly effective tool can identify the quality of the air mixture by typically using the intensity ratios of OH*, CH*, and C2*. The advantages of using this method include measurements for turbulent flow and high-pressure combustion. However, chemiluminescence cannot be applied without light emissions. Thus, it is impossible to use this for cyclic variations of exhaust gas in SI engines, including air mixtures, without the flame in the intake and compression stroke.
LIBS is a valuable technique for species measurement that is not affected by the presence of a flame to measure the A/F. Significant progress in LIBS has led to in-line and real-time measurements by eliminating the tiresome process of sample preparation [32,33,34,35,36,37,38,39,40,41,42,43,44]. LIBS can demonstrate the composition of the mixture, exhaust gas, and residual gas in a combustion chamber in a way that is not intrusive to the combustion process. This technique has been applied to internal combustion engines and can be extended to gas turbines or any type of combustion system.
LIBS’s high spatial and temporal resolutions are powerful in complex systems, having a simple method that can easily be demonstrated in SI engines. The laser beam produces a localized plasma when a short pulse is irradiated into gas. Local breakdown plasma emission measurements and spectral analyses allow the direct identification of atomic species. This method has been critical in measurements of the equivalence ratio using the emission of Hα (656 nm) and the O (777 nm) triplet [32]. The process is also applicable in correlating the equivalence ratio and ignition probability using the methane-air mixture’s line radiation of Hα and ionic oxygen (OI) [39]. The relationship of the equivalence ratio with the Boltzmann law has also been obtained by the variation of the number density ratio, Hα (656 nm)/O (777 nm), in laminar premixed methane-air flames [32,33,39].
In this study, the LIBS technique was applied to the exhaust gas of a gasoline engine. A second harmonic laser beam generates the localized breakdown plasma, while the emission is captured by Cassegrain optics with high spatial resolution. The high temporal resolution of the intensified charge-coupled device (ICCD) spectrometer measures the spectrally resolved plasma emissions. The intensity and intensity ratio of the atomic spectrum of C, H, N, and O were investigated, and the applicability of LIBS to exhaust gas analysis is discussed. This study is a significant step toward defining a means of using LIBS to control the A/F ratio in gasoline engines by analyzing the exhaust gases rather than taking direct measurements in the flames.

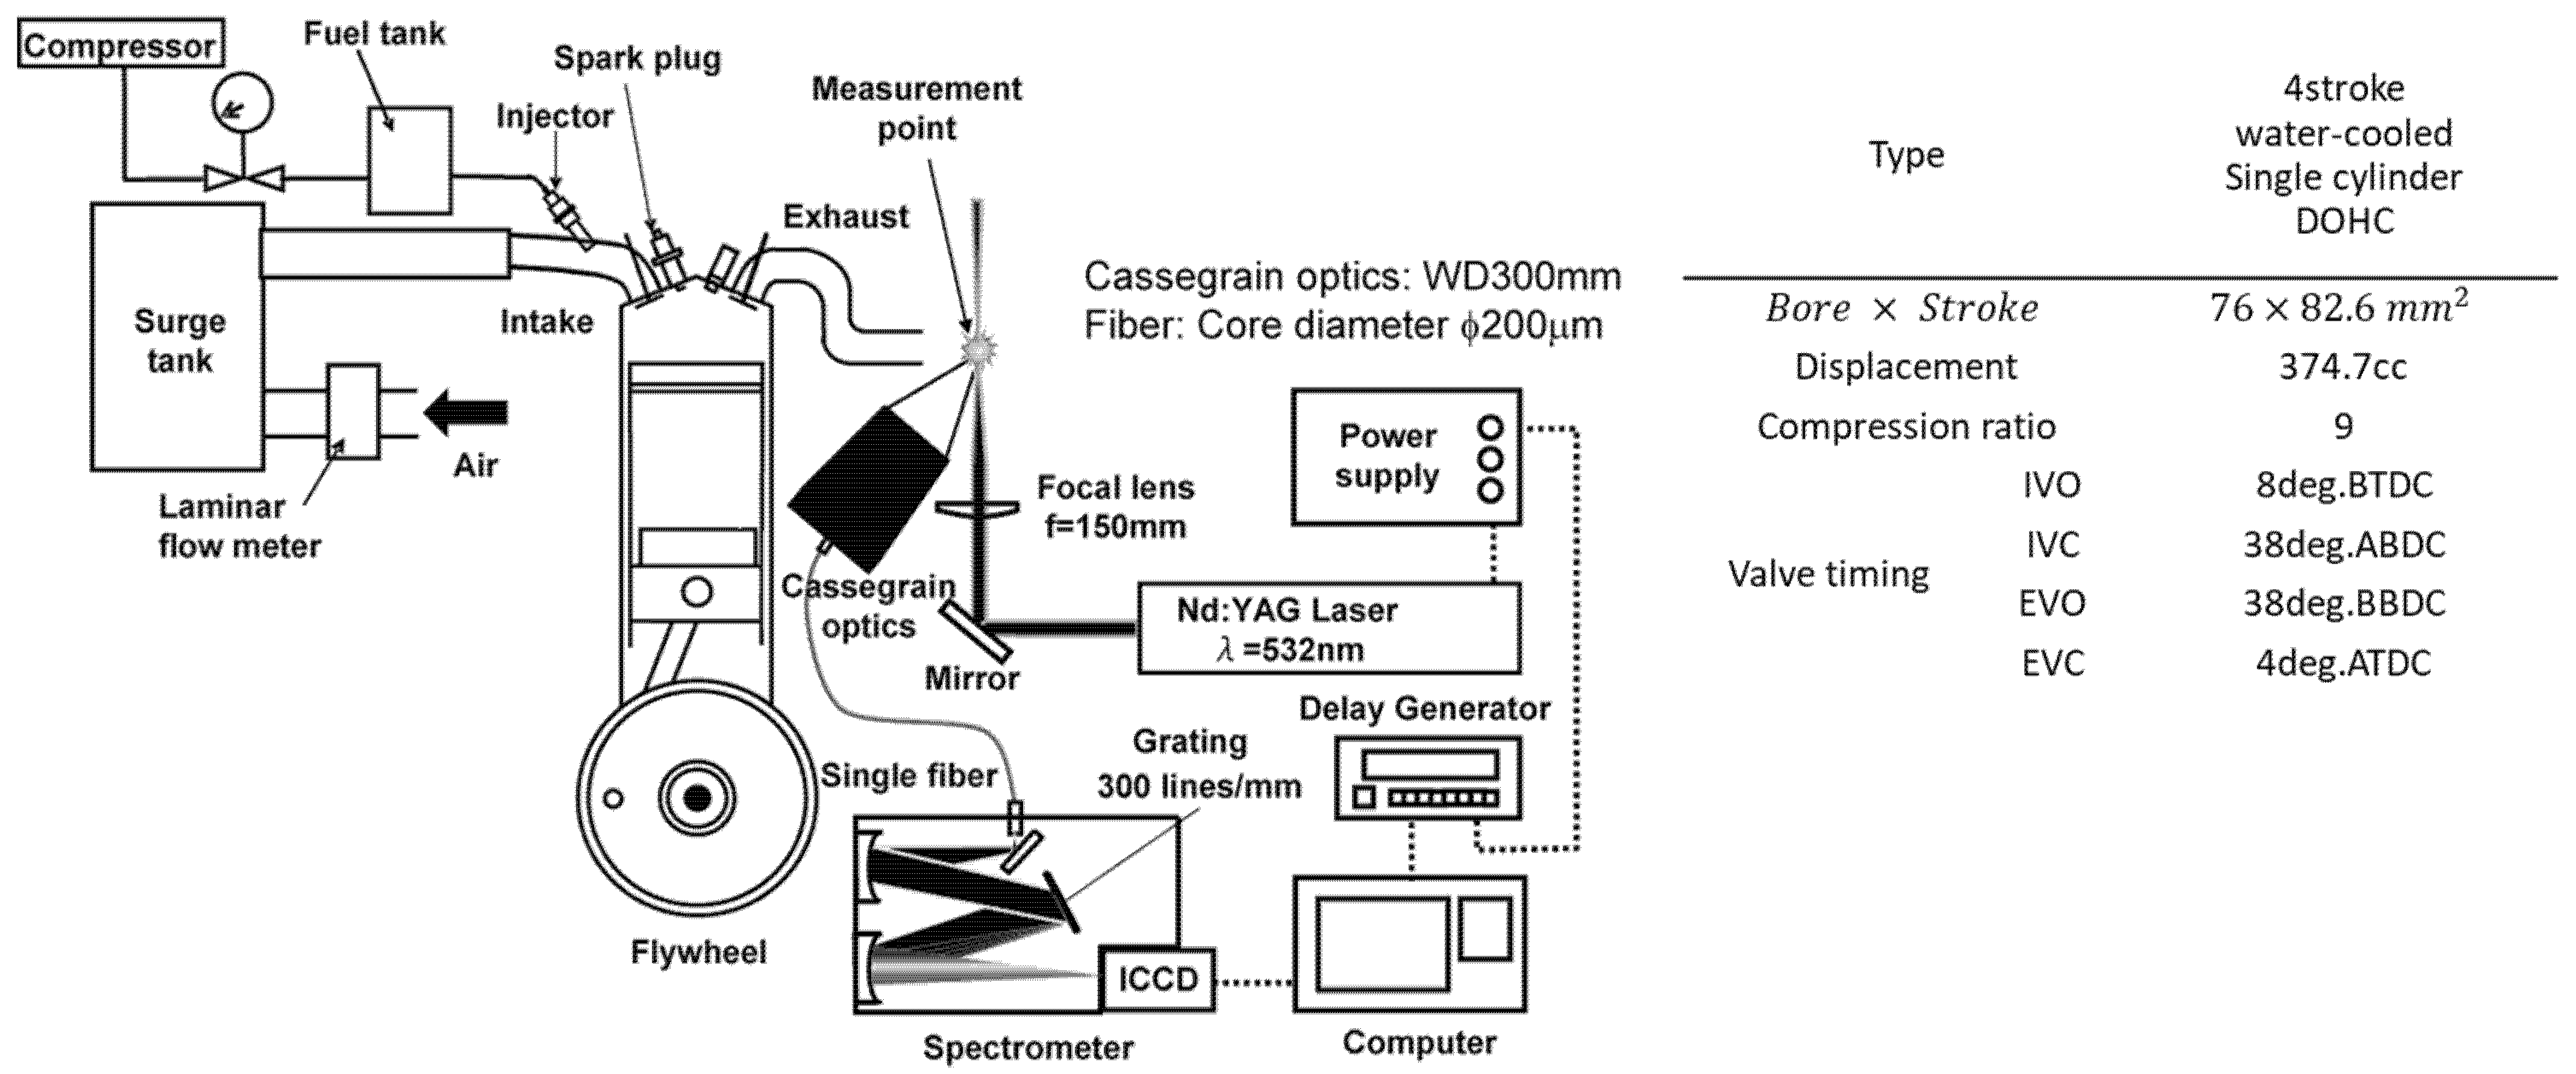
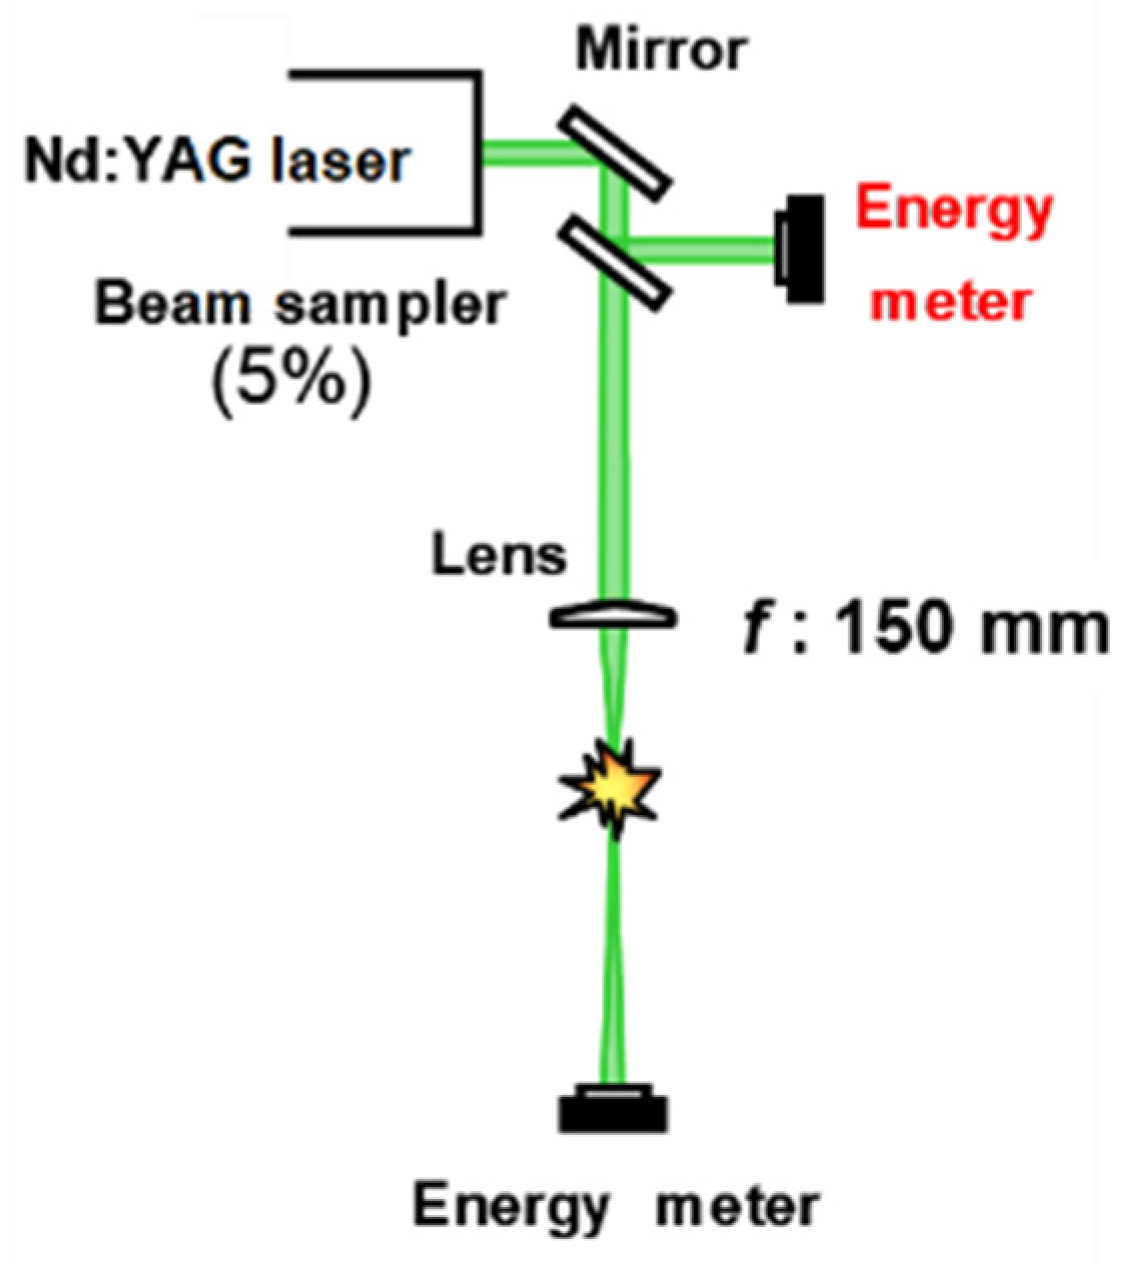
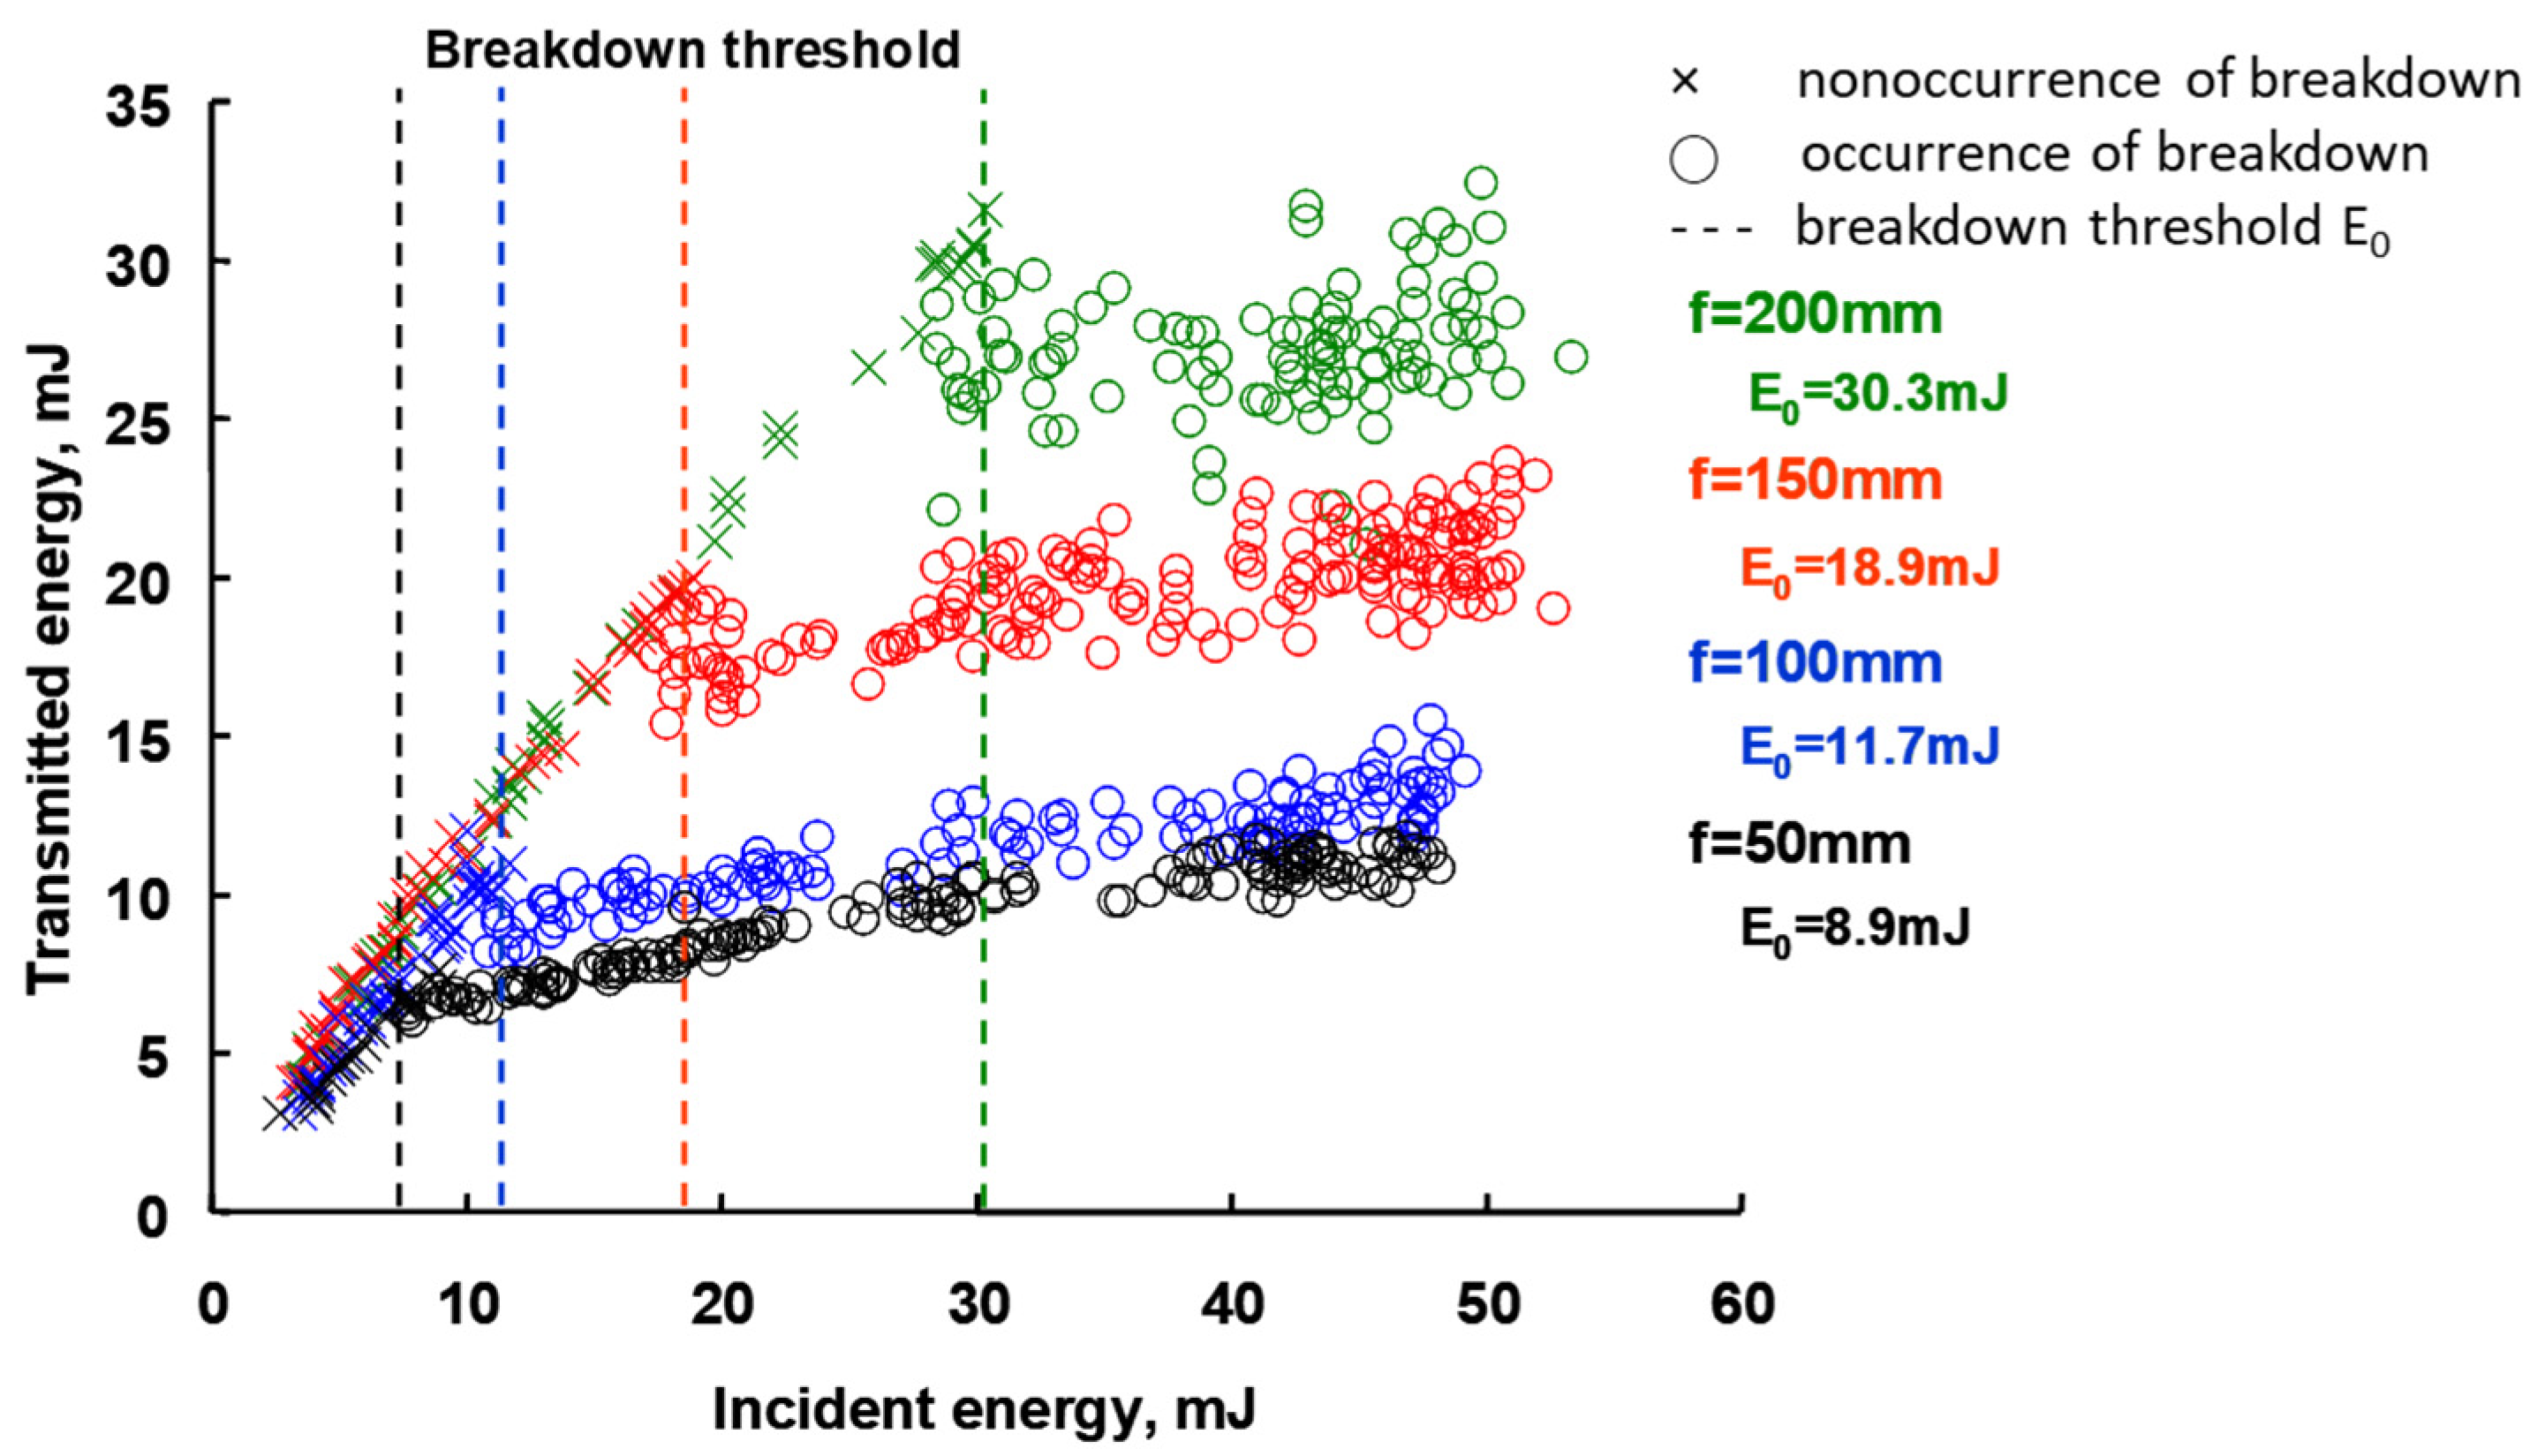
2. Materials and Methods

Figure 1 shows the measurement system and the engine specifications. The test engine we used was a four-stroke single-cylinder engine (bore diameter: 76 mm, stroke: 82.6 mm, displacement: 374.7 cc) [29]. Regular gasoline was used as fuel. A laminar flow meter installed upstream from the surge tank measured the air mass flow rate. The amount of fuel injected was varied by changing the fuel injection duration, to control the preset A/F between 12 and 22. The measurement point was just behind the exit of the exhaust pipe.
The second harmonic laser (532 nm) was focused on a lens with a focal length of 150 mm to produce the plasma breakdown. The double-cavity Nd: YAG laser operates in a Q-switched nanosecond mode (Quanta-Ray ND1-004, Spectra-Physics, Mountain View, CA), generating an 8 mm diameter laser beam at seven ns pulse width and 10 Hz repetition rate. A delay pulse generator (Stanford Research Systems, DG535, Sunnyvale, CA) controls the synchronous laser emission and ICCD acquisition. The ICCD is connected to the spectrometer (Andor: Oriel MS-257, London, UK) and an optical fiber (core diameter: 200 μm). The spatial resolution of the LIBS is improved by the optical receiver using Cassegrain optics, which are typically used in telescopes but have been customized for emission acquisitions [28].
Figure 2 shows the simple breakdown method using the LIBS. The mirror guides the laser’s incident energy into the beam splitter, where 5% of the energy is monitored by a power meter (OPHIR: PE-25, Darmstadt, Germany). The same power meter also measures the transmitted energy after plasma breakdown. The laser breakdown occurs at the focus point of the lens. The characteristics of the breakdown plasma are investigated by this method, wherein changes in the transmitted power are recorded at varied incident power.
Figure 3 shows the transmitted energy measurements as a function of incident laser energy for the varied converging lens used: 50, 100, 150, and 200 mm. All the plasma breakdown occurrences are plotted with circles, while incidents with no breakdown occurrences are denoted with crosses. The nonoccurrence of plasma breakdown is also easily noted when the incident and transmitted energies are of equal value. If plasma breakdown occurs, the energy is absorbed, resulting in low energy transmission measurements. The absorbed energy is higher for lenses with shorter focal lengths due to the higher energy density generated with smaller condensed focal spots.
The breakdown threshold level (E0) of the atmospheric air plasma is denoted by the broken lines for each lens used. The minimum E0 is 8.9 mJ, using a 50 mm focal length lens. The E0 increases with higher focal length, due to the larger spot size generated. With a smaller spot size, the laser energy density causes gas breakdown, using lower laser pulse energy. In this study, a lens with a 150 mm focal length was selected for the exhaust gas analysis, considering the optical arrangement. Since the exhaust gas has a high temperature, the laser pulse energy required to generate the breakdown is higher, due to the molecular density and the first electron initiation probability. Therefore, the incident energy was set to 60 mJ, higher than the breakdown threshold level in air at low ambient temperatures (18.9 mJ). Fixing the incident energy at three times the breakdown threshold level secures and stabilizes the breakdown event.
Before studying an actual gasoline engine configuration, equivalence ratio measurements were conducted using a Bunsen burner [29]. Figure 4 shows the LIBS spectrum of a propane-air mixture without flame conditions. The equivalence ratio chosen was changed from 0.1 to 1.5. The atomic spectra of H (656 nm), N (745, 821, 871 nm), and O (777, 798, 845 nm) were observed in a wavelength range from 650 to 900 nm. The intensity of each atomic spectrum changed with the equivalence ratio. Proportionally, H presented a higher evolution range; the other radicals presented a lower evolution range.
Figure 5 shows the spectrum intensity peaks of H, N, and O as a function of the equivalence ratio. Here, the equivalence ratio is classified as the propane to air ratio. Low emission intensities of N and O spectra were measured for increased equivalence ratio, while higher intensity peaks of the H spectrum were observed for larger values of the equivalence ratio. The total mass flow rate was fixed at 8 L/min, where fuel mass flow increased, while air decreased as the equivalence ratio increased. Thus, the evolution of the H radical compared to the others is different where the N and O emission intensities decreased (from the air), and the H intensity increased (from fuel) with an increase in the equivalence ratio.
The equivalence ratio in correlation with the emission intensity ratios of the H, N, and O atomic spectra is shown in Figure 6. The propane–air mixtures define the equivalence ratio. The emission peaks of H (656 nm), O (777 nm), and N (745 nm) were used to obtain the intensity ratios for H/O and H/N. The intensity ratio of H/O and the equivalence ratio have been reported as being proportional [38,39,40,41,42,43]. The same trend is observed in this study. However, the emission intensity ratio of H/N yields higher measurements than that of H/O. Either way, the local equivalence ratio’s high resolution can be measured by H/N and H/O.
The final purpose of this analysis was to apply this technique with high temporal and spectral resolution in a practical combustor for cyclic exhaust gas analysis. Figure 7 shows a time chart of the cycle-resolved exhaust gas measurements using LIBS. At a fixed constant of 600 rpm, the spectrum measurement was synchronized with the laser frequency (10 Hz). The laser shot was triggered by the top dead center (TDC) signal, and the timing of the laser shot was set to 235 deg. ATDC. The laser was fired two times (compression and exhaust strokes) in one cycle. In this way, the air and exhaust gas spectra were measured alternately. No specific spectrum was observed at the compression stroke in the wavelength range from 200 to 270 nm.
However, an emission spectrum was observed in the range of carbon (248 nm) at the exhaust stroke, as shown in Figure 8. This C atomic spectrum, seen in the exhaust stroke, came from the CO, CO2, and total hydrocarbons (THC) present in the exhaust gas. The atomic spectra were measured during 100 consecutive cycles. Figure 9 shows the shot-to-shot variation of the spectrum intensity at 248 nm (related to the C atomic spectrum). The red circle indicates the data for the exhaust gas spectrum (at the exhaust stroke), while the blue circle indicates the data for the air spectrum (at the compression stroke). At the exhaust stroke, large fluctuations were observed in the spectrum intensity for each cycle. On the other hand, the obvious spectrum was more stable at the compression stroke. This demonstrates a difference in the A/F or in the combustion efficiency, as the different contributors to the C emissions do not have the same emission intensity level.

3. Result and Discussions

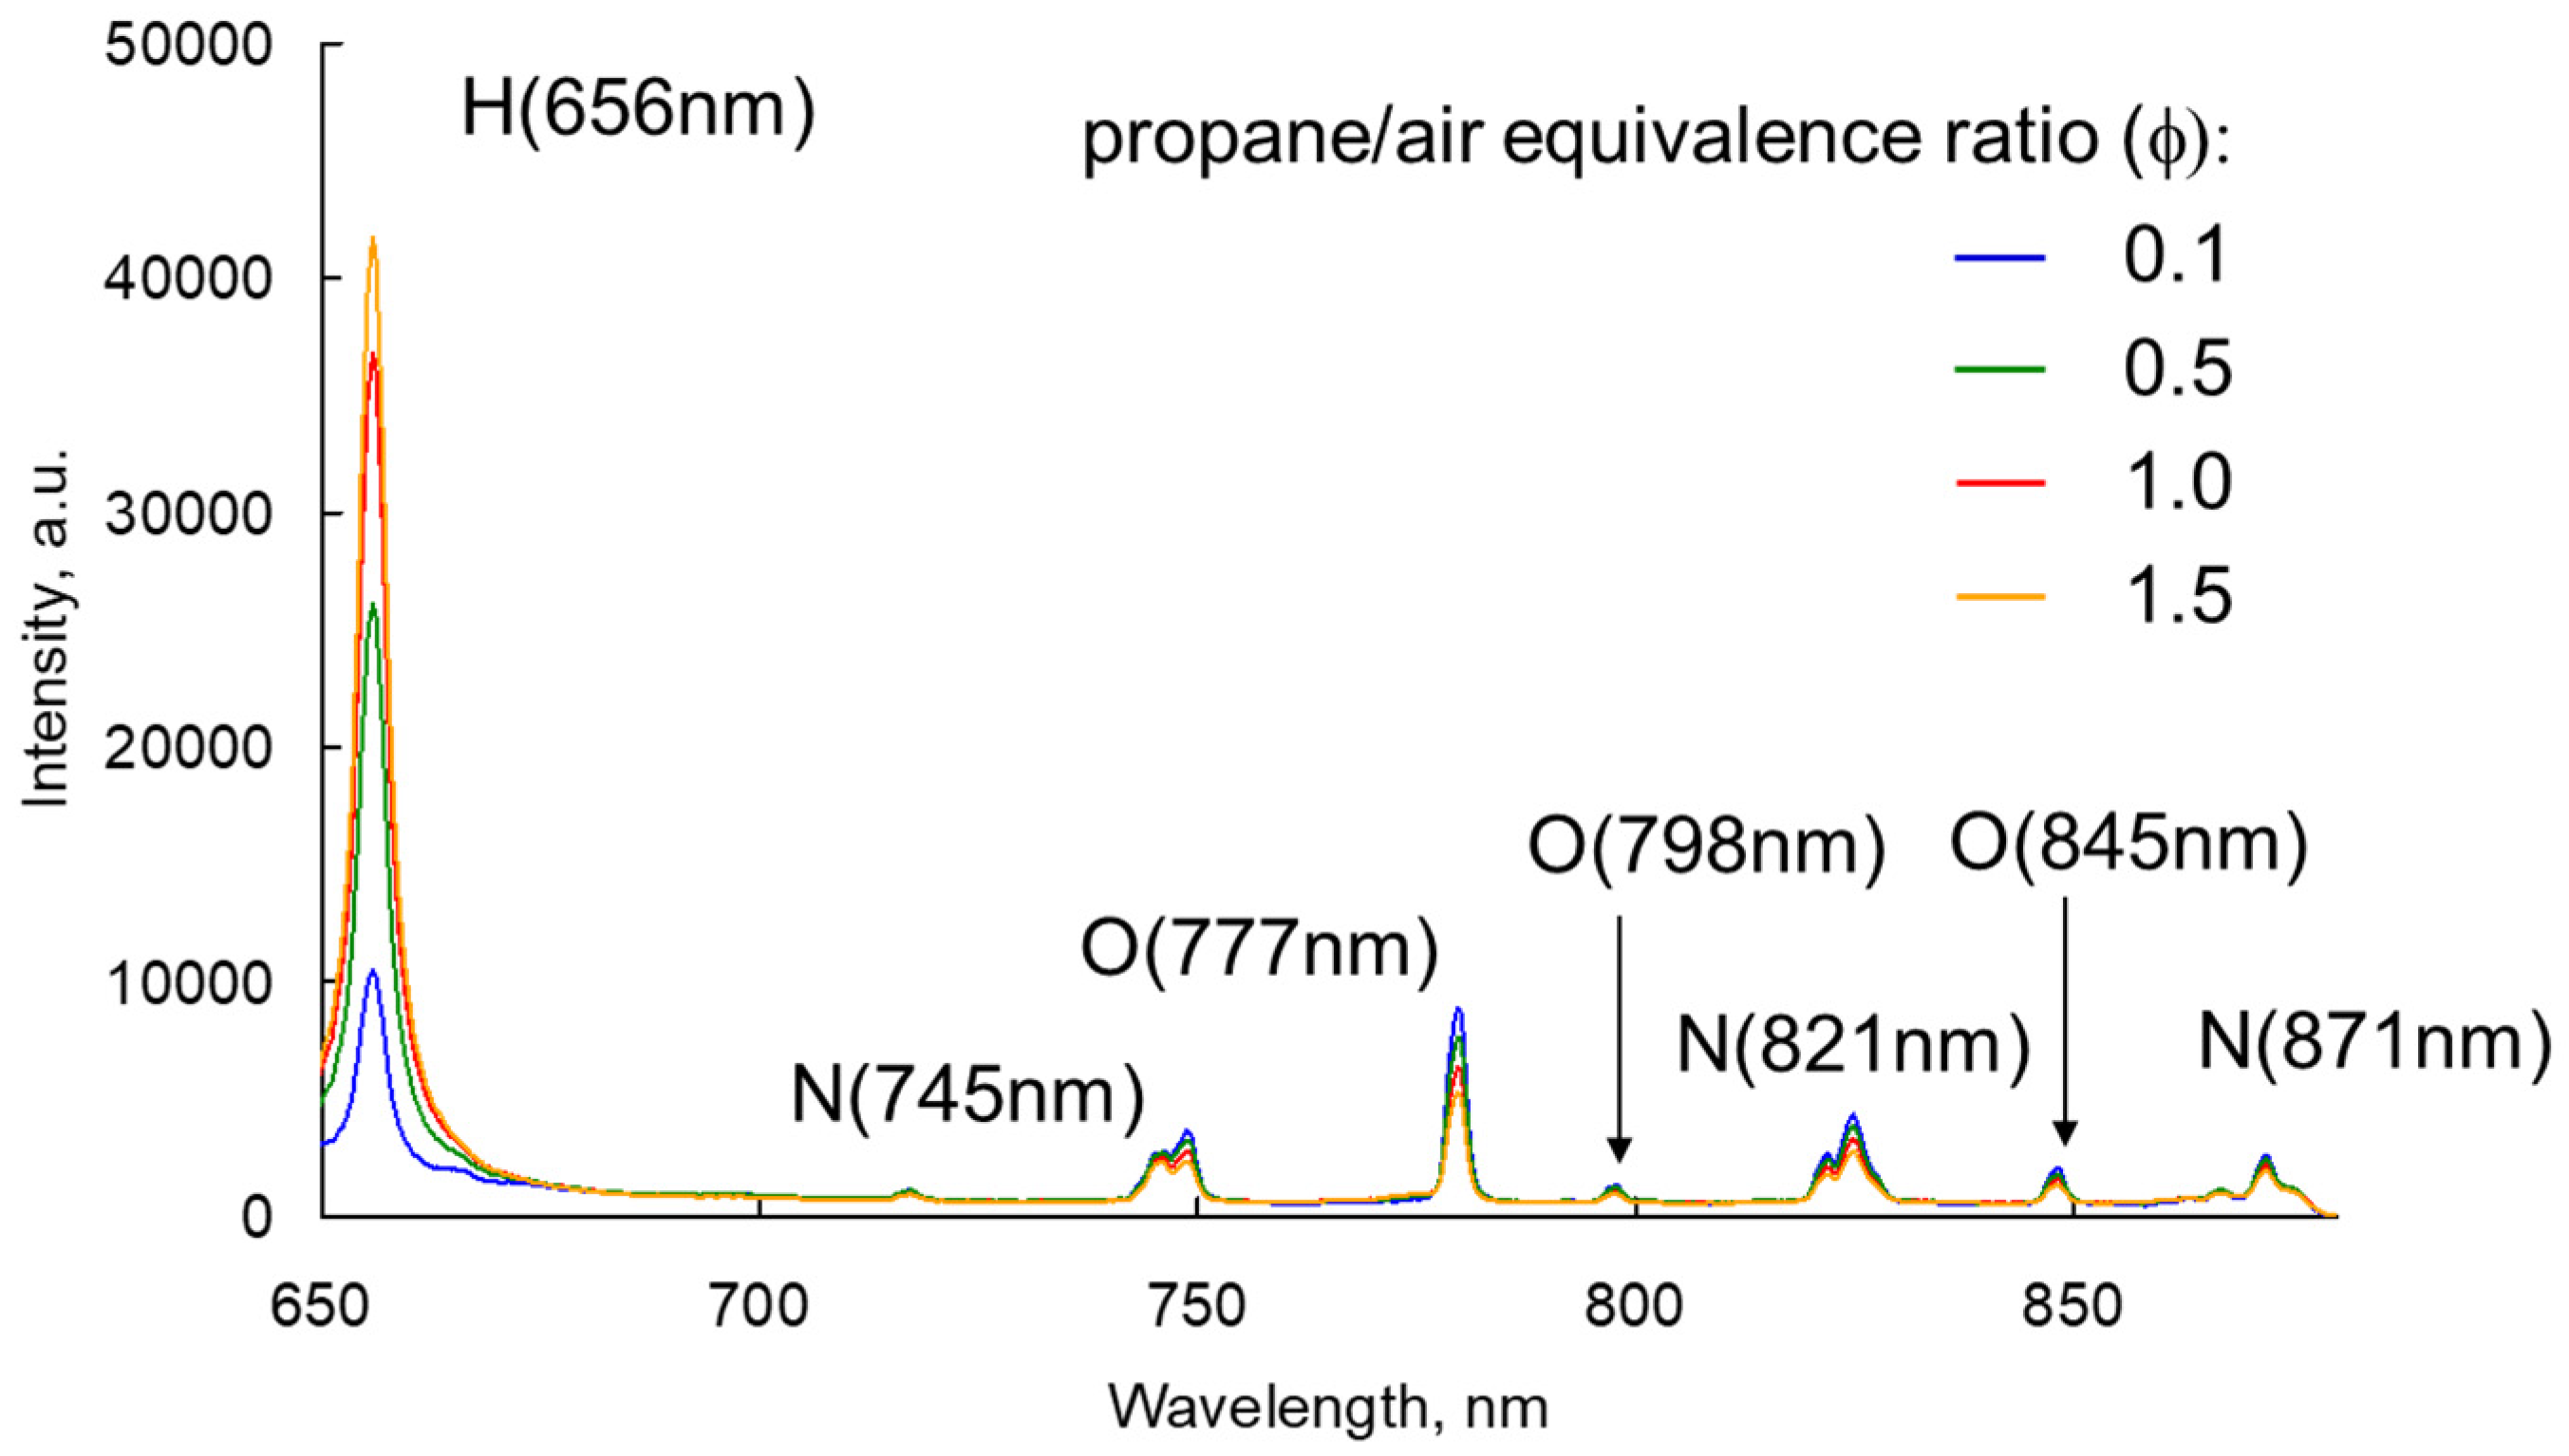
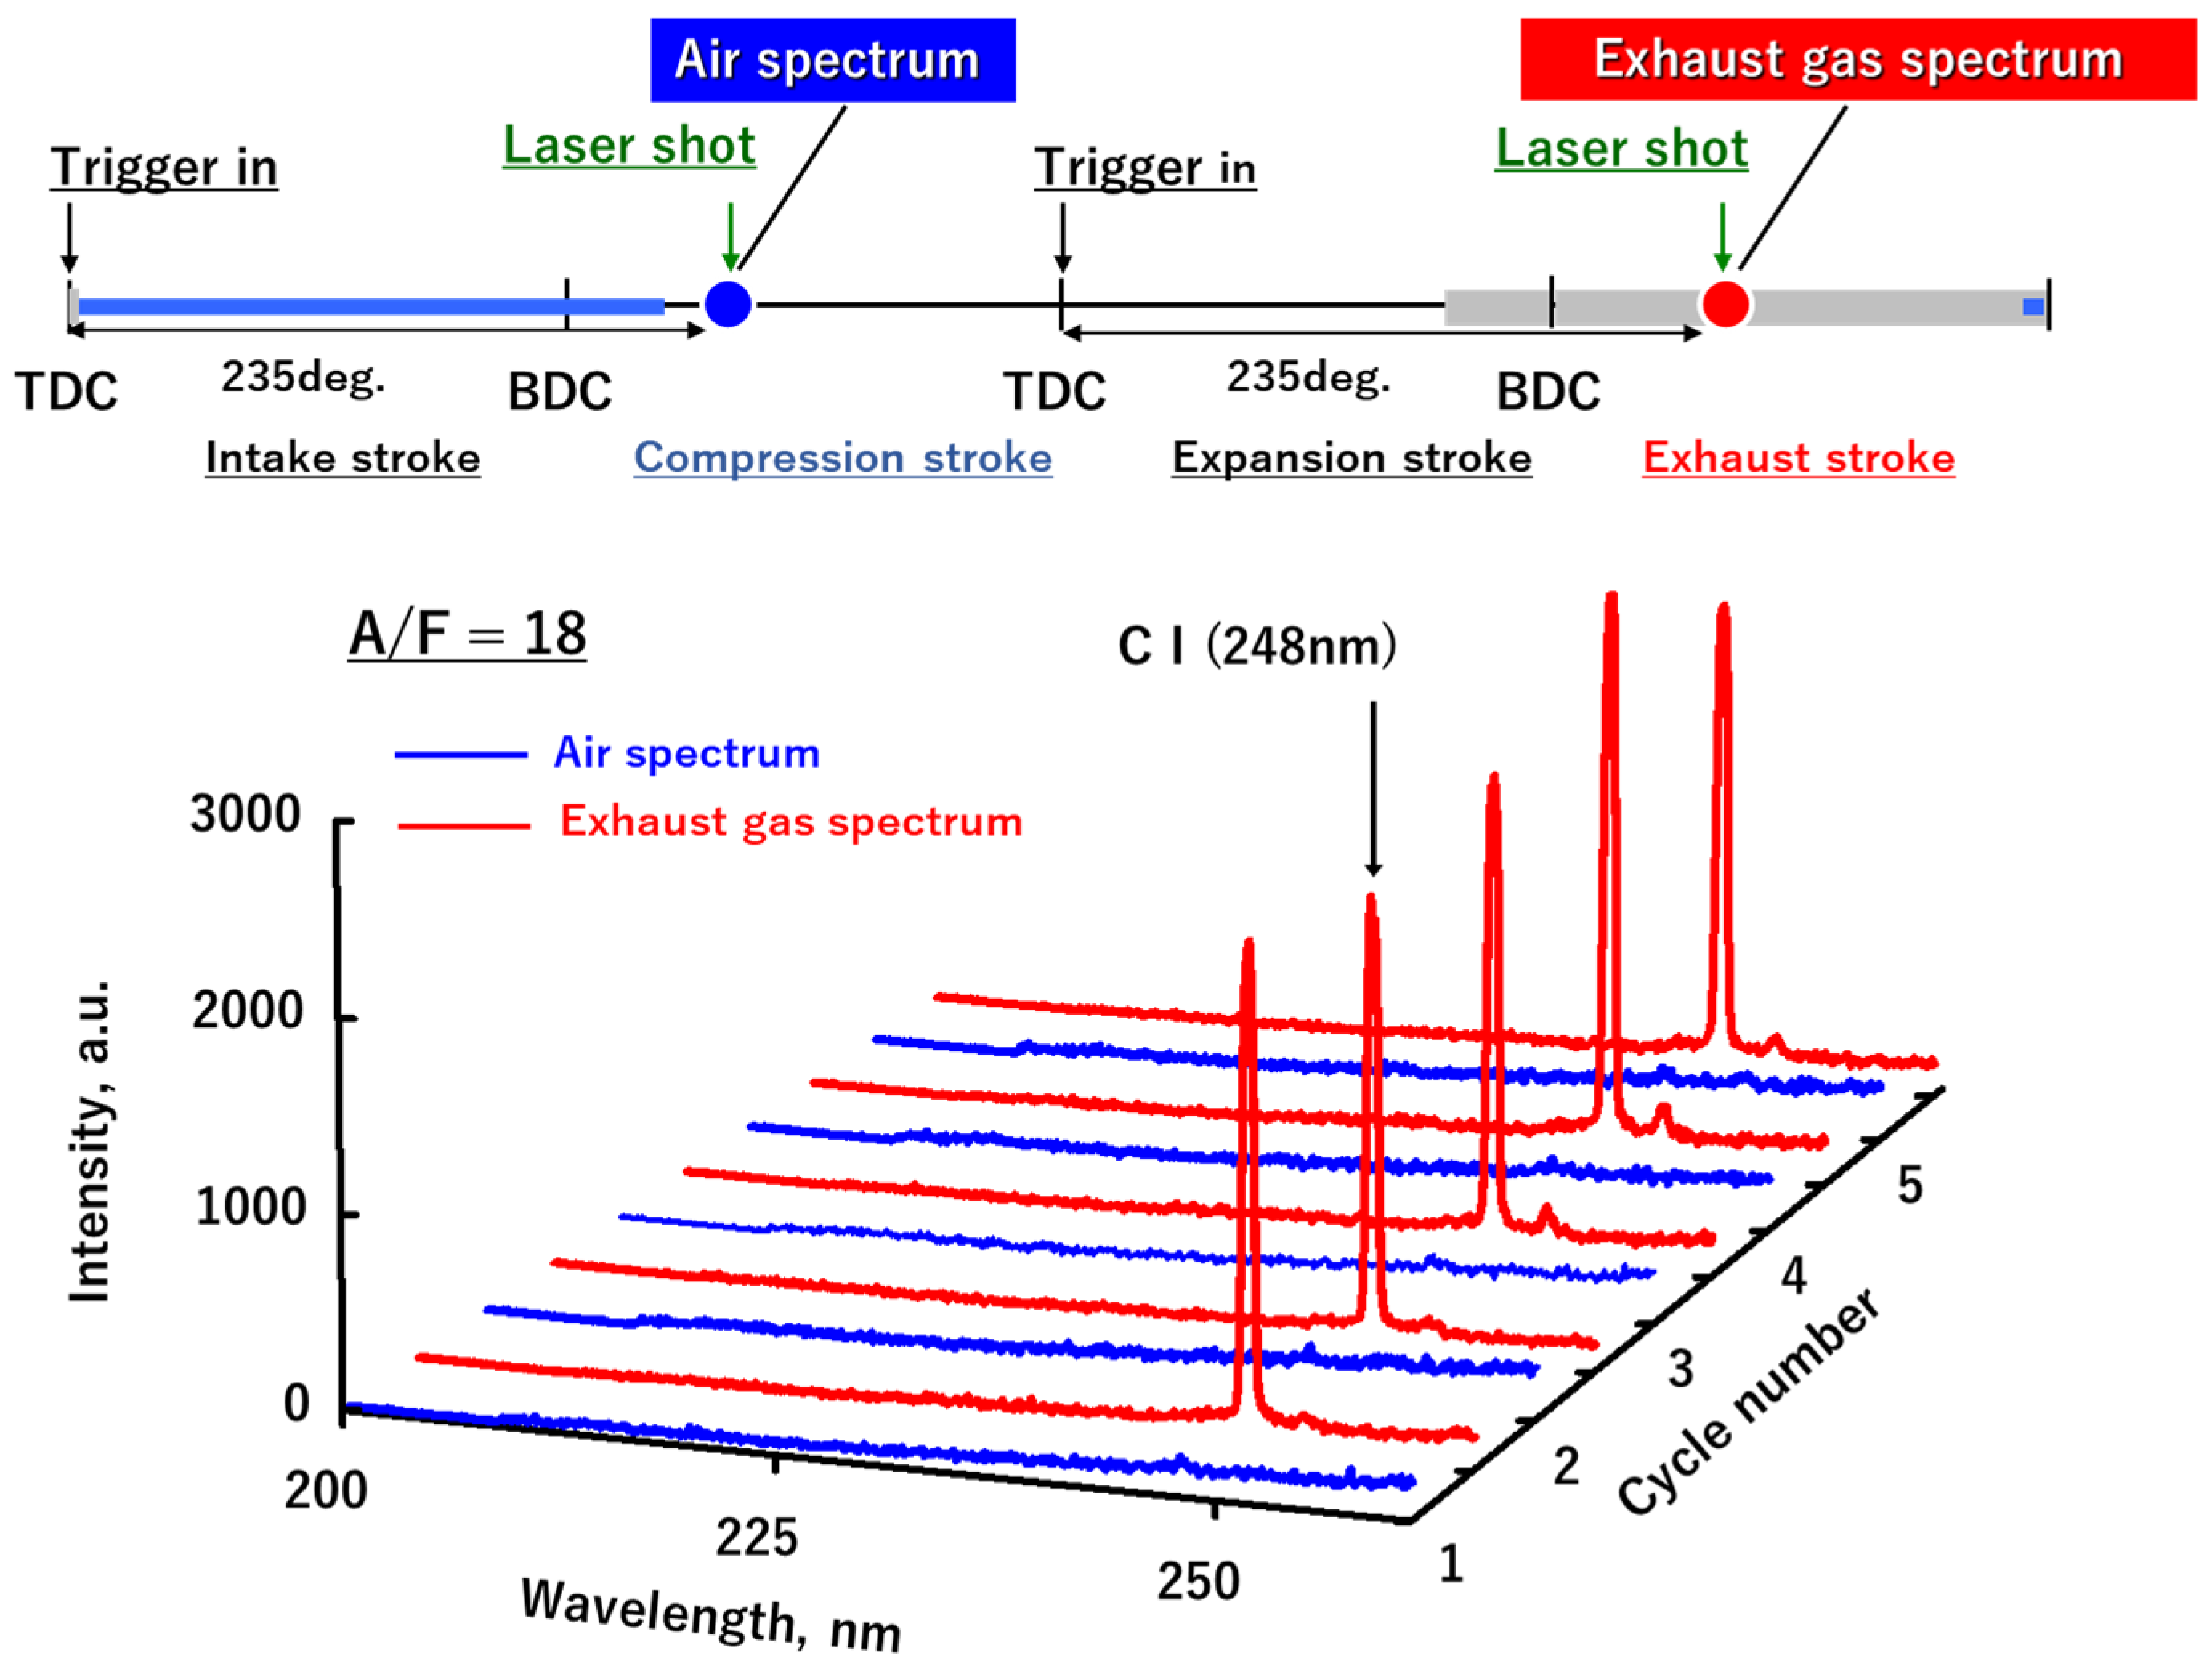
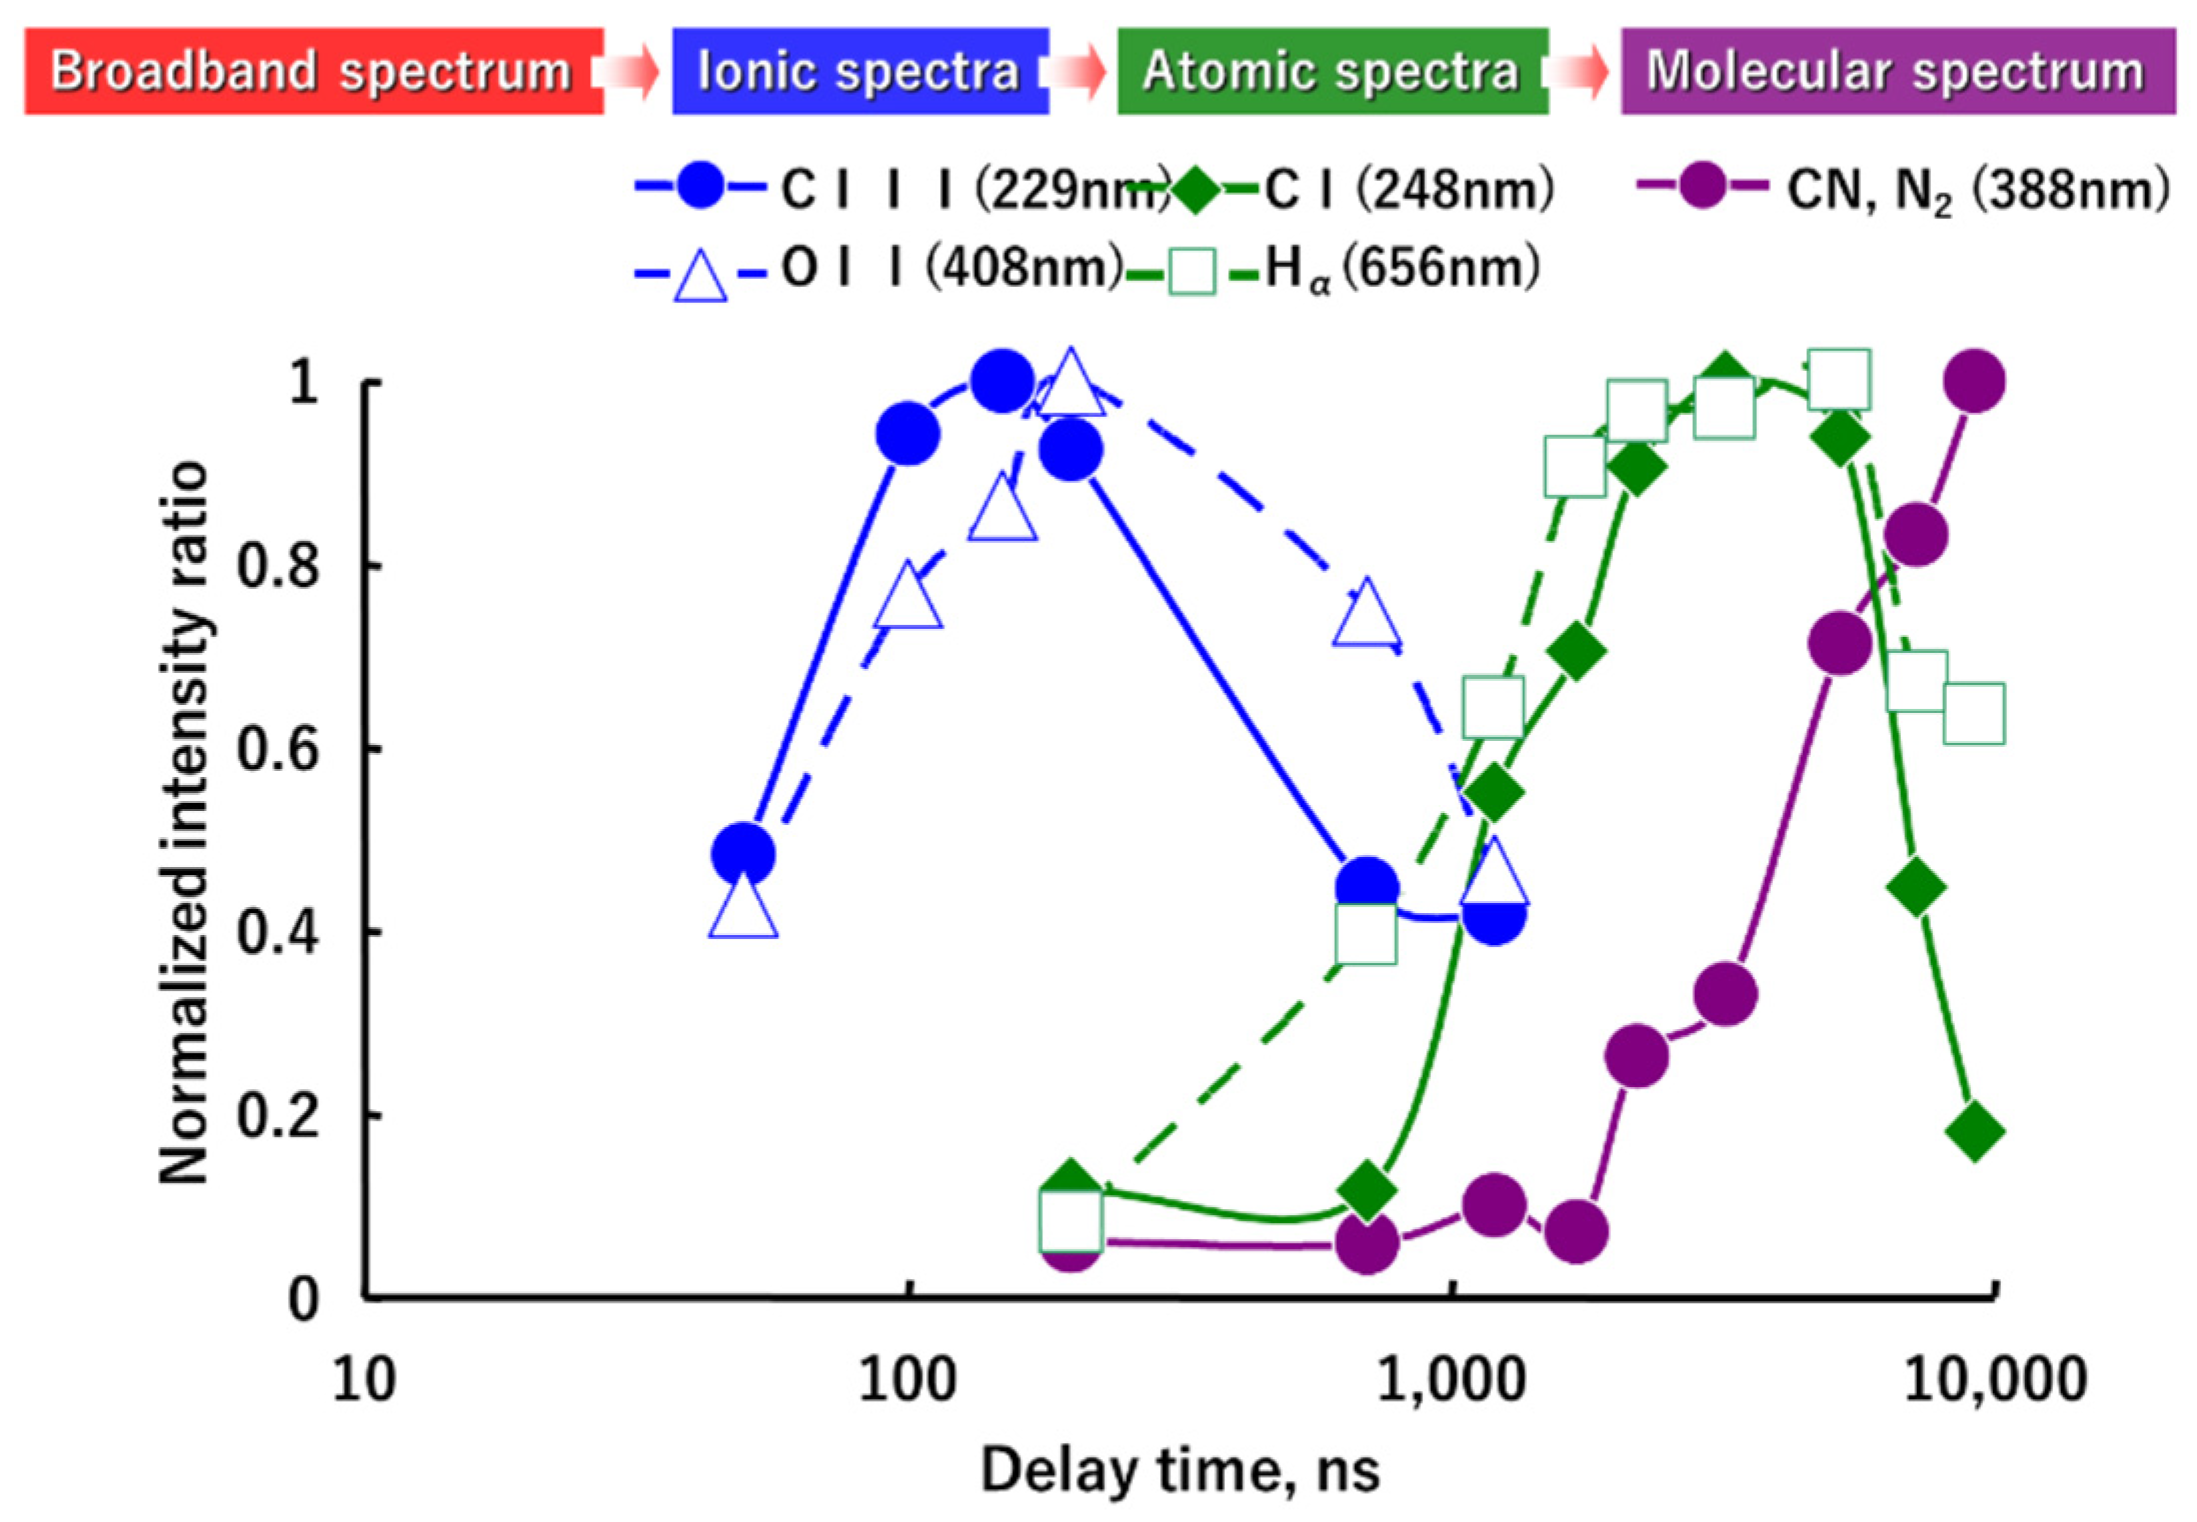
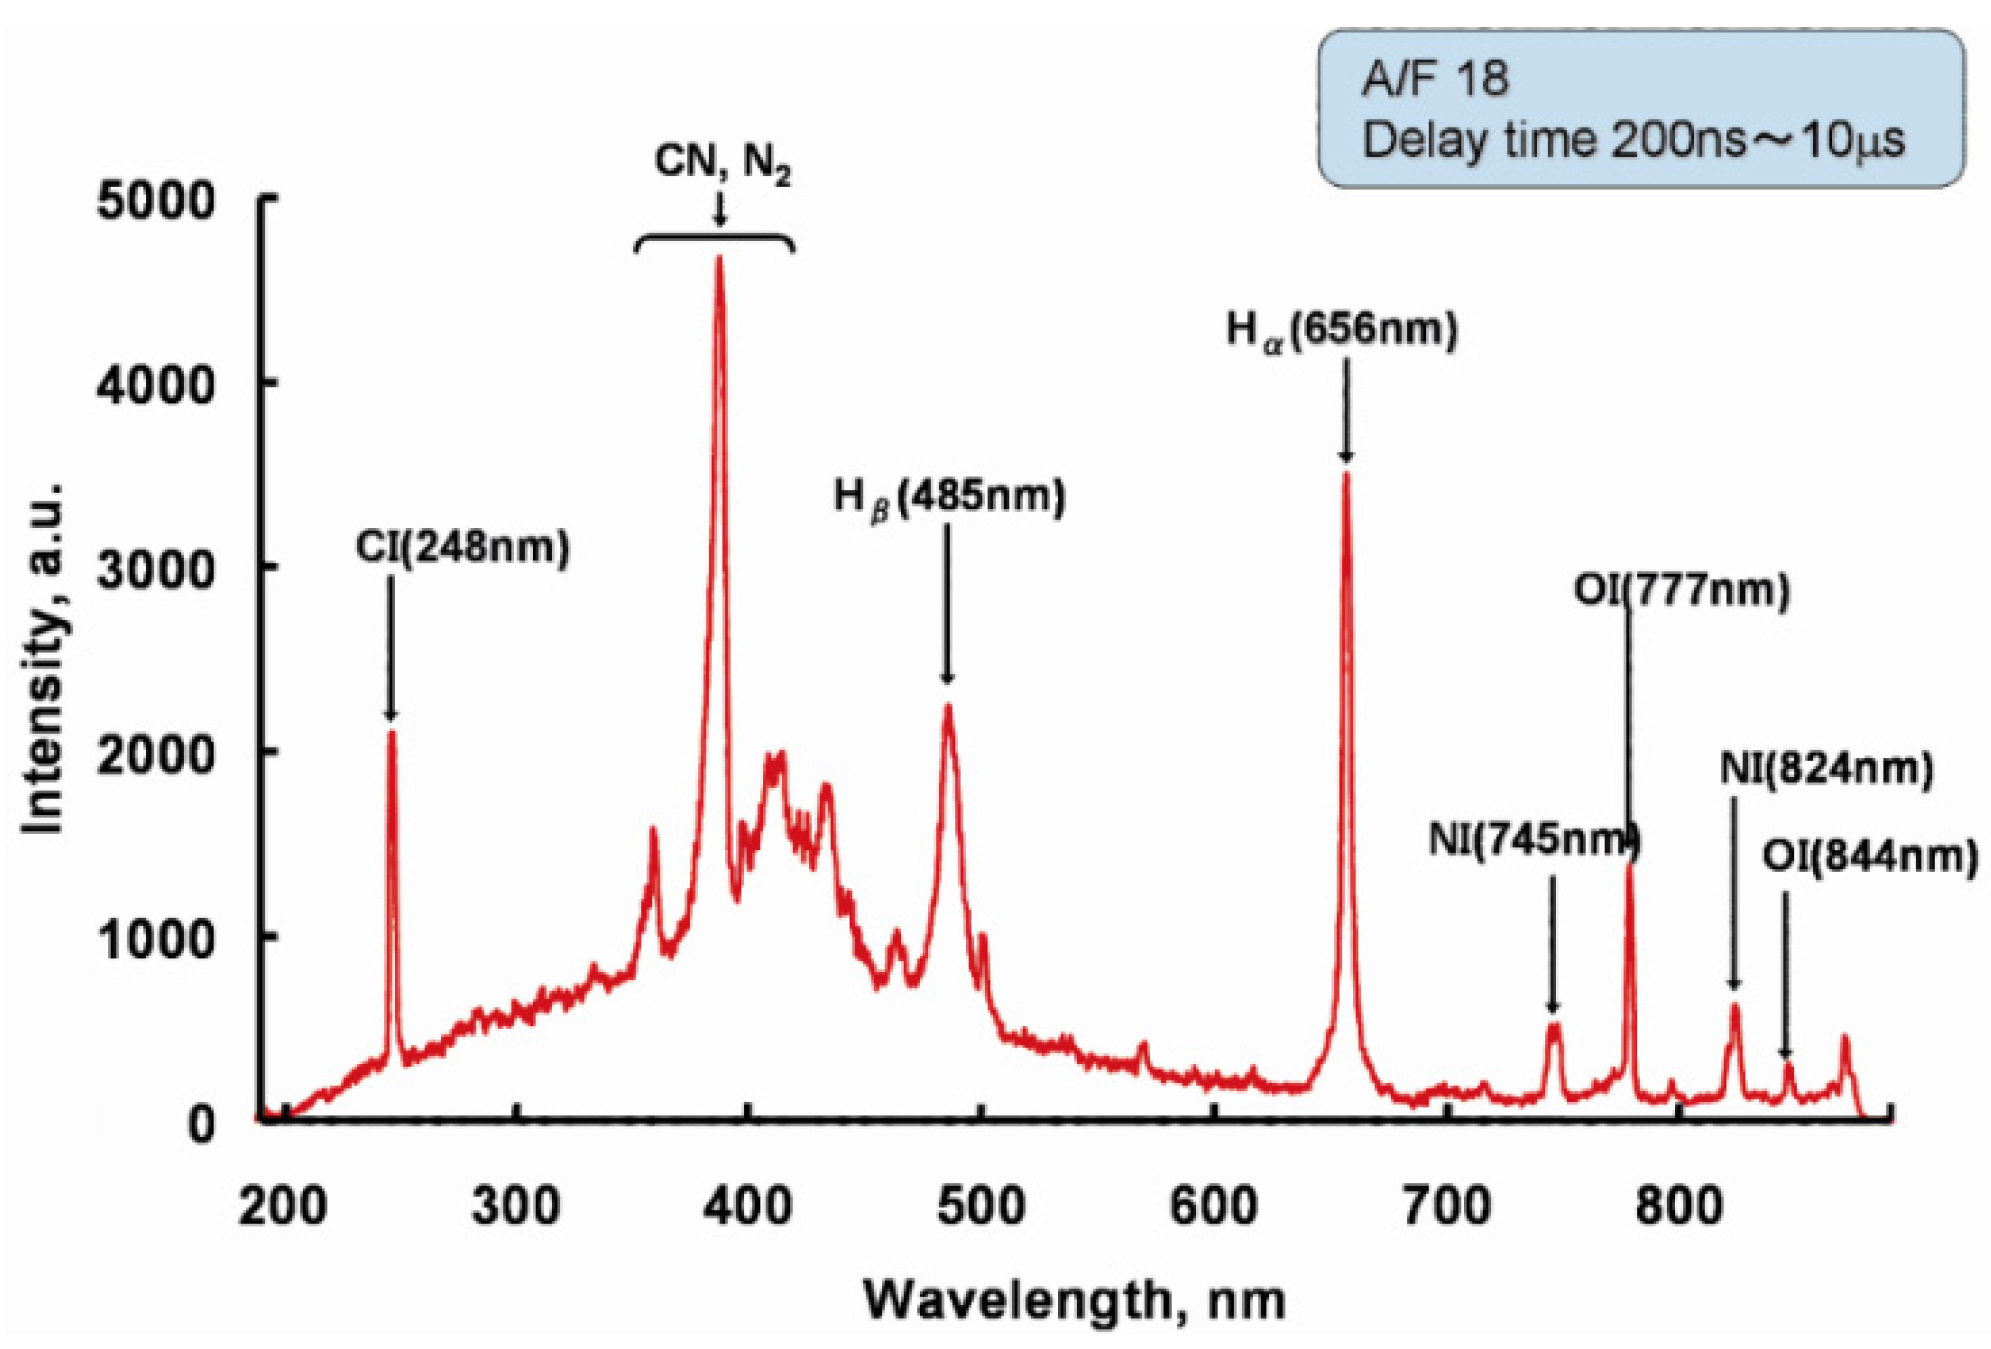
3.1. LIBS Spectrum of the Exhaust Gas

Figure 9 shows a time series of the LIBS spectrum of the exhaust gas for four periods of time (0–50 ns, 700–1200 ns, 1200–1700 ns, and 3200–5200 ns) after the laser breakdown. Just after the breakdown (0–50 ns), scattered laser light was observed at a wavelength of 532 nm. The broadband spectrum expanded from 230 to 550 nm. From 700 to 1200 ns, the ionic spectrum was observed between 300 and 500 nm. Atomic spectra were also observed at 248 nm (C atom), 656 nm (H atom), 745 nm (N atom), and 777 nm (O atom). The intensity of the broadband spectrum decreased. From 1200 to 1700 ns, the atomic spectrum became sharp, and the molecular spectrum of CN*, N2, and N* was observed between 360 and 420 nm. From 3200 to 5200 ns, the atomic spectrum intensity decreased, and the molecular spectrum intensity, such as that of CN*, increased.
The temporal changes in the intensity of the spectra of ionic C (229 nm), atomic O (408 nm), atomic C (248 nm), atomic Hα (656 nm), and molecular CN and N2 (388 nm) are shown in Figure 10. The logarithmic time variations from the breakdown are shown in the horizontal axis, while the normalized spectrum intensity is shown in the vertical axis. As shown in Figure 10, the LIBS spectrum changed from the ionic spectrum to the atomic spectrum and then to the molecular spectrum, in that order. The ionic spectra were observed from 10 ns to 3.0 µs, the atomic spectra were observed from 200 ns to 10 µs, and the molecular spectra were observed after 1 µs. We used the atomic spectrum ratio to measure the A/F of the exhaust gas. Here, the correct definitions of the measurement timing and duration are critical to obtaining a robust value. If the timing and the duration are not precisely synchronized with the laser pulse, the emission can be affected by the ionization and/or molecular spectra. Based on Figure 10, the delay time of 200 ns to 10 ms after the breakdown measures the important LIBS spectra.
Figure 11 shows the LIBS spectrum of the exhaust gas for the case of A/F = 18. Atomic and molecular spectra were observed. The following atomic spectra were observed: CI (248 nm), Hβ (485 nm), Hα (656 nm), NI (745, 824 nm), and OI (777, 844 nm). The observed molecular spectra were CN and N2 at around 400 nm. In this study, we focused our analysis on the relationship between the intensities of these atomic spectra and the A/F. The wavelengths measured were from 210 to 265 nm, including CI, and from 650 to 850 nm, including Hα (656 nm), NI (745 nm), and OI (777 mm).
Figure 12 shows the spectrum of the exhaust gas, measured for three different A/F values (12, 14.7, and 18). A different evolution was observed for each atomic spectrum. The intensities of CI (248 nm) and Hα (656 nm) decreased with increasing A/F (Figure 13a), whereas a constant emission intensity level was observed for NI and OI (Figure 13b). The main explanation for this behavior comes from the origin of the carbon and hydrogen. These atoms were sourced from the hydrocarbon fuel. When the A/F increased, the densities of carbon and hydrogen atoms decreased, and the emission intensities became lower. The same tendency was observed previously in the burner experiment.

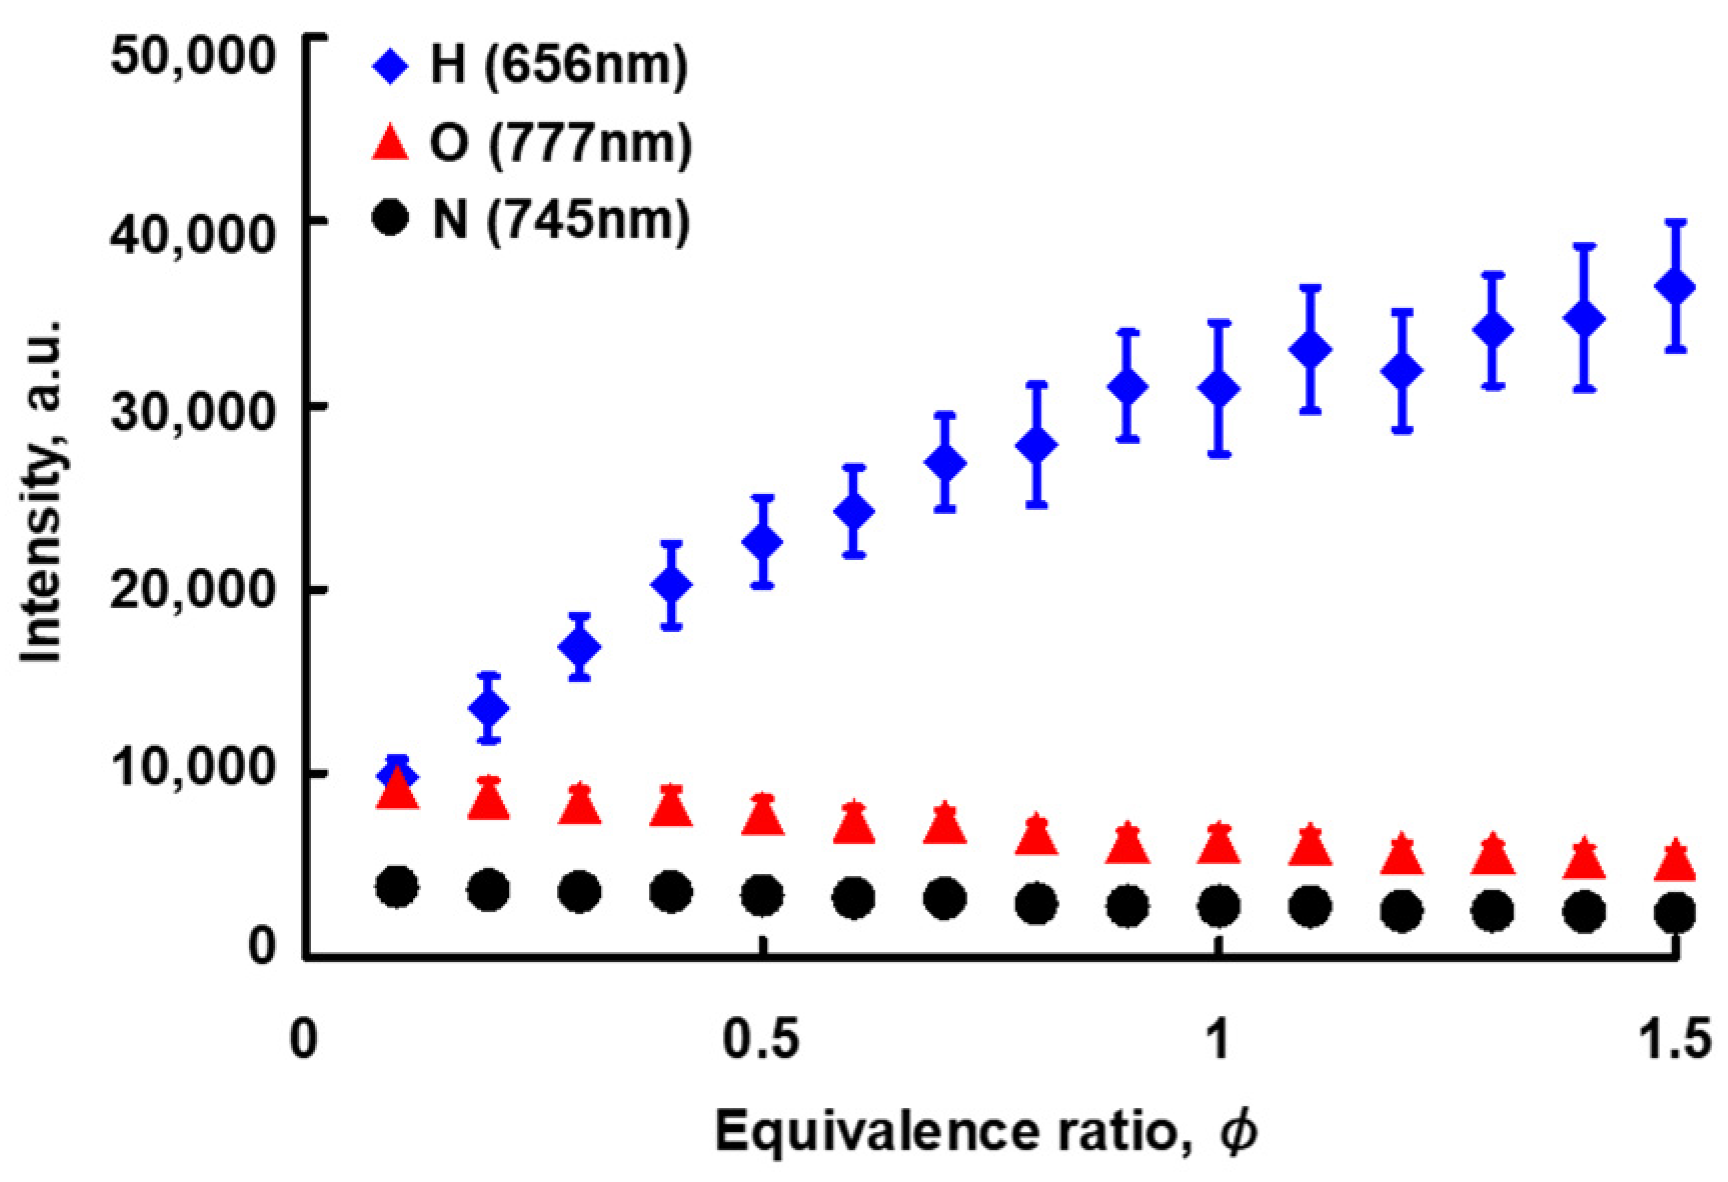
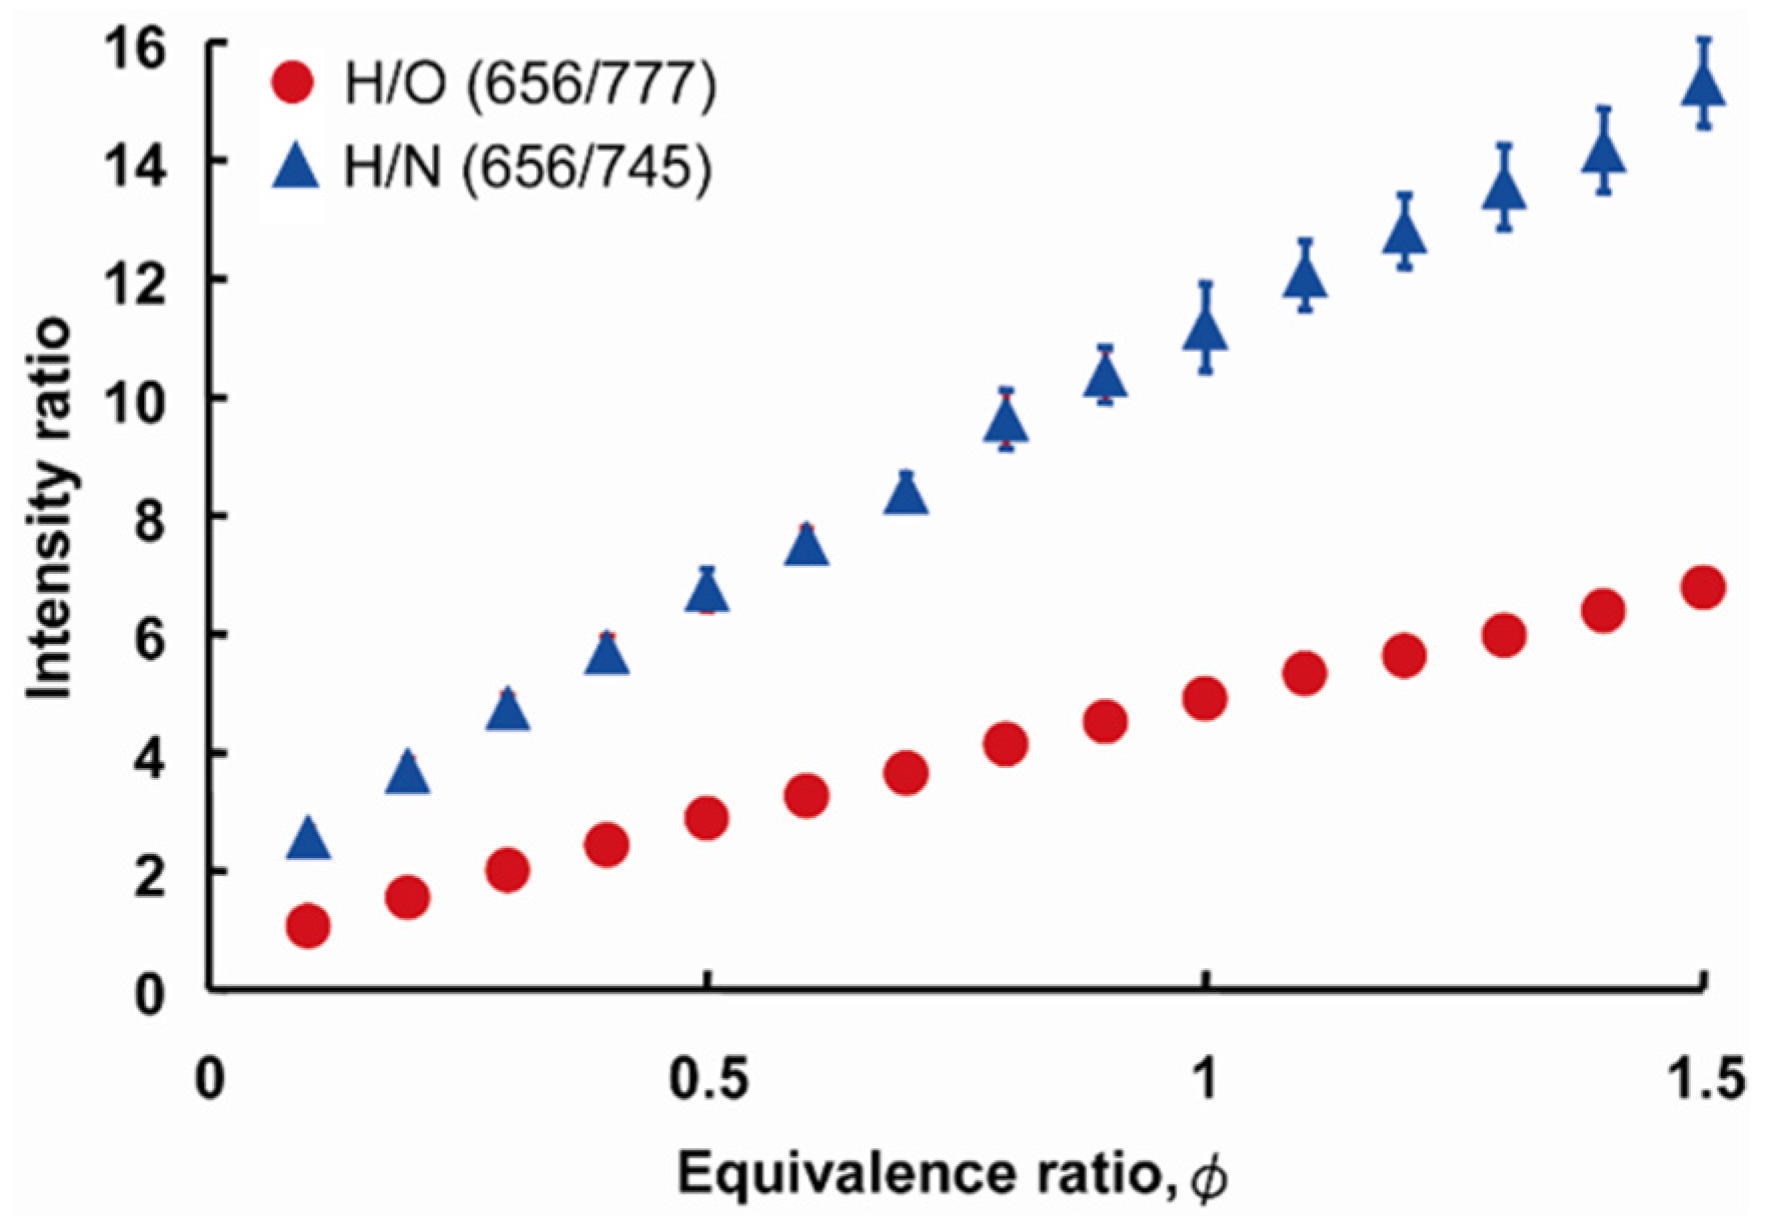
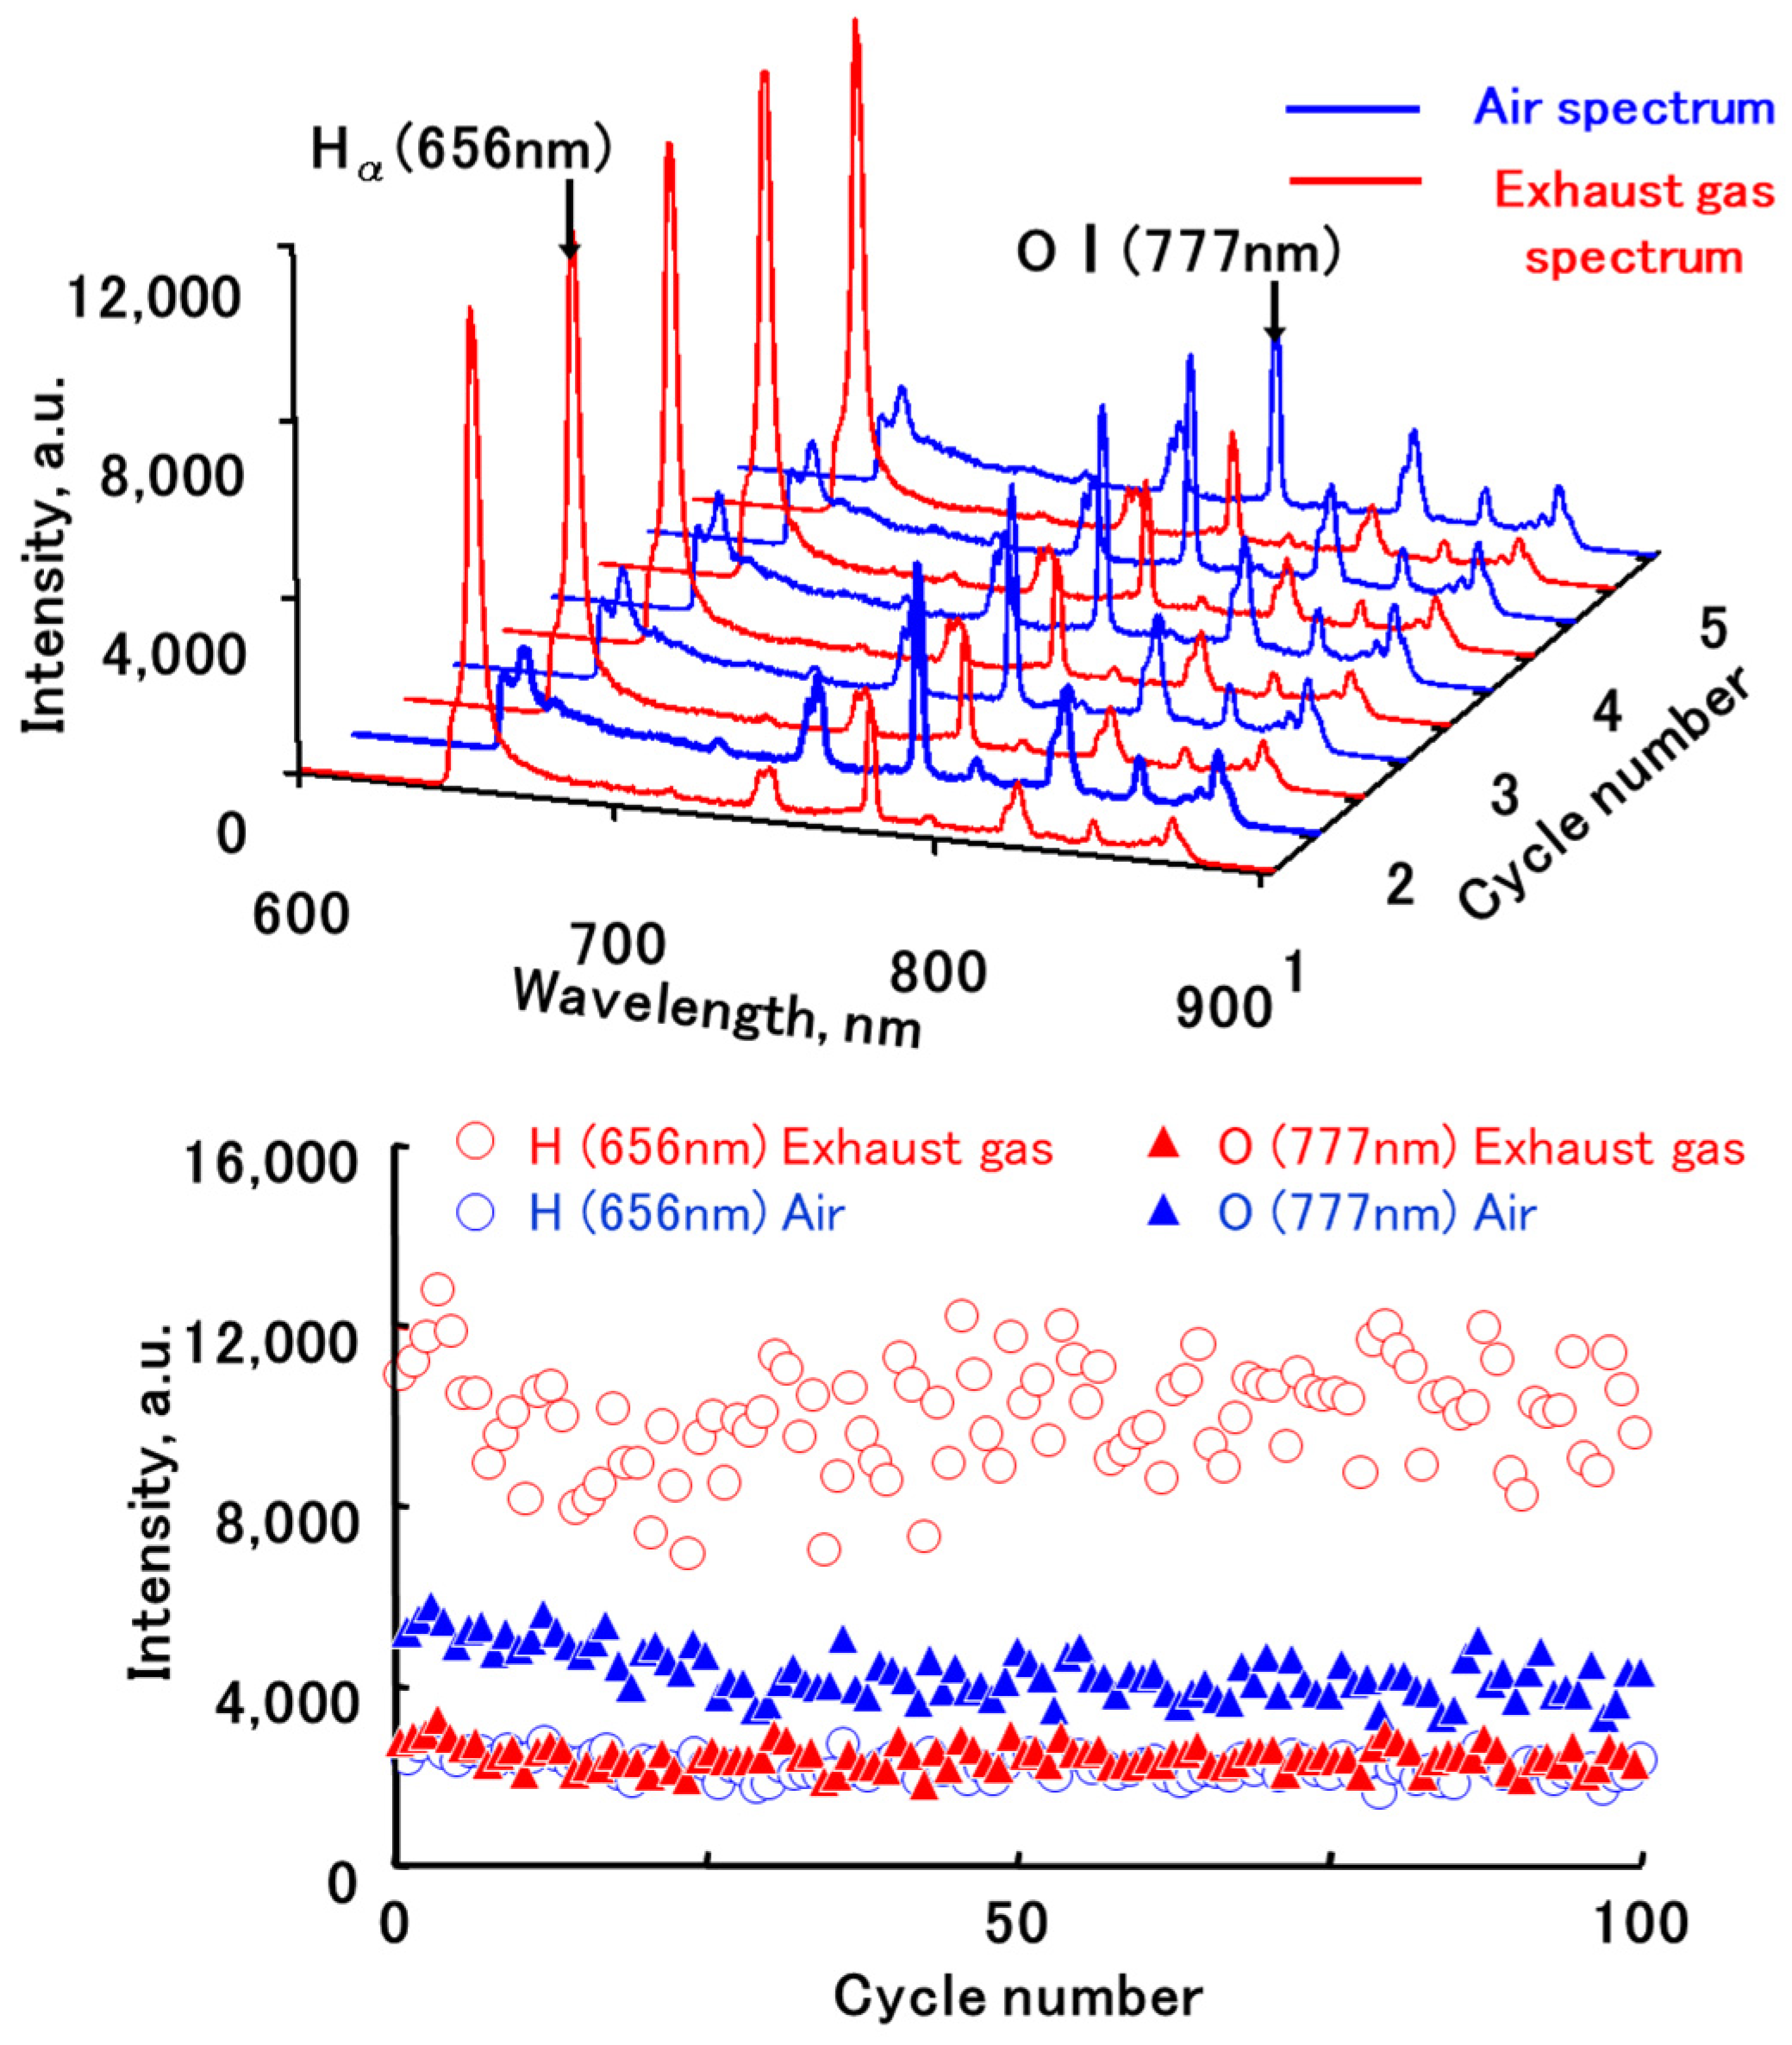
3.2. Relationship between the Atomic Spectrum Intensity and A/F

Figure 13 shows the A/F in correlation with the measured intensities of CI, Hα, and OI. The intensity ratio of CI and OI (C/O) was estimated from the averages of 100 cycles because CI and OI could not be observed simultaneously with the equipment utilized in this experiment. On the other hand, Hα and OI could be observed simultaneously, so the intensity ratio of Hα and OI (Hα, O) was measured for each cycle. The average and fluctuation values were obtained, based on 100 cycles.
The intensity ratio of C/O decreased monotonically as the A/F increased from 12 to 22. The intensity ratio of Hα/O also decreased monotonically as the A/F increased. The intensity ratio of the atomic spectra and the A/F in the LIBS spectrum of the exhaust gas demonstrated linear relationships. The maximum fluctuation calculated over 100 cycles was between 5 and 8%. This fluctuation is close to the relative error of the intensity ratio Hα/O that was measured with the Bunsen burner. The fluctuation was lower than that observed by Phuoc et al., which was around 20% [45]. The difference was mainly due to the emission collection equipment (Cassegrain optics) and the optimized breakdown. The breakdown was optimized based on several studies [46,47] that optimized all parameters of breakdown generation that could impact the precision of the technique (focal length, lens type, laser wavelength, and pulse length). By making use of this correlation and selecting the right correlation between the A/F ratio fixed at the engine inlet and the value observed at the outlet, based on the average intensity ratio of CI and OI (C/O), the A/F ratio of the engine exhaust gas could be measured with good accuracy (Table 1). Good precision was also obtained for the cycle-to-cycle measurements.

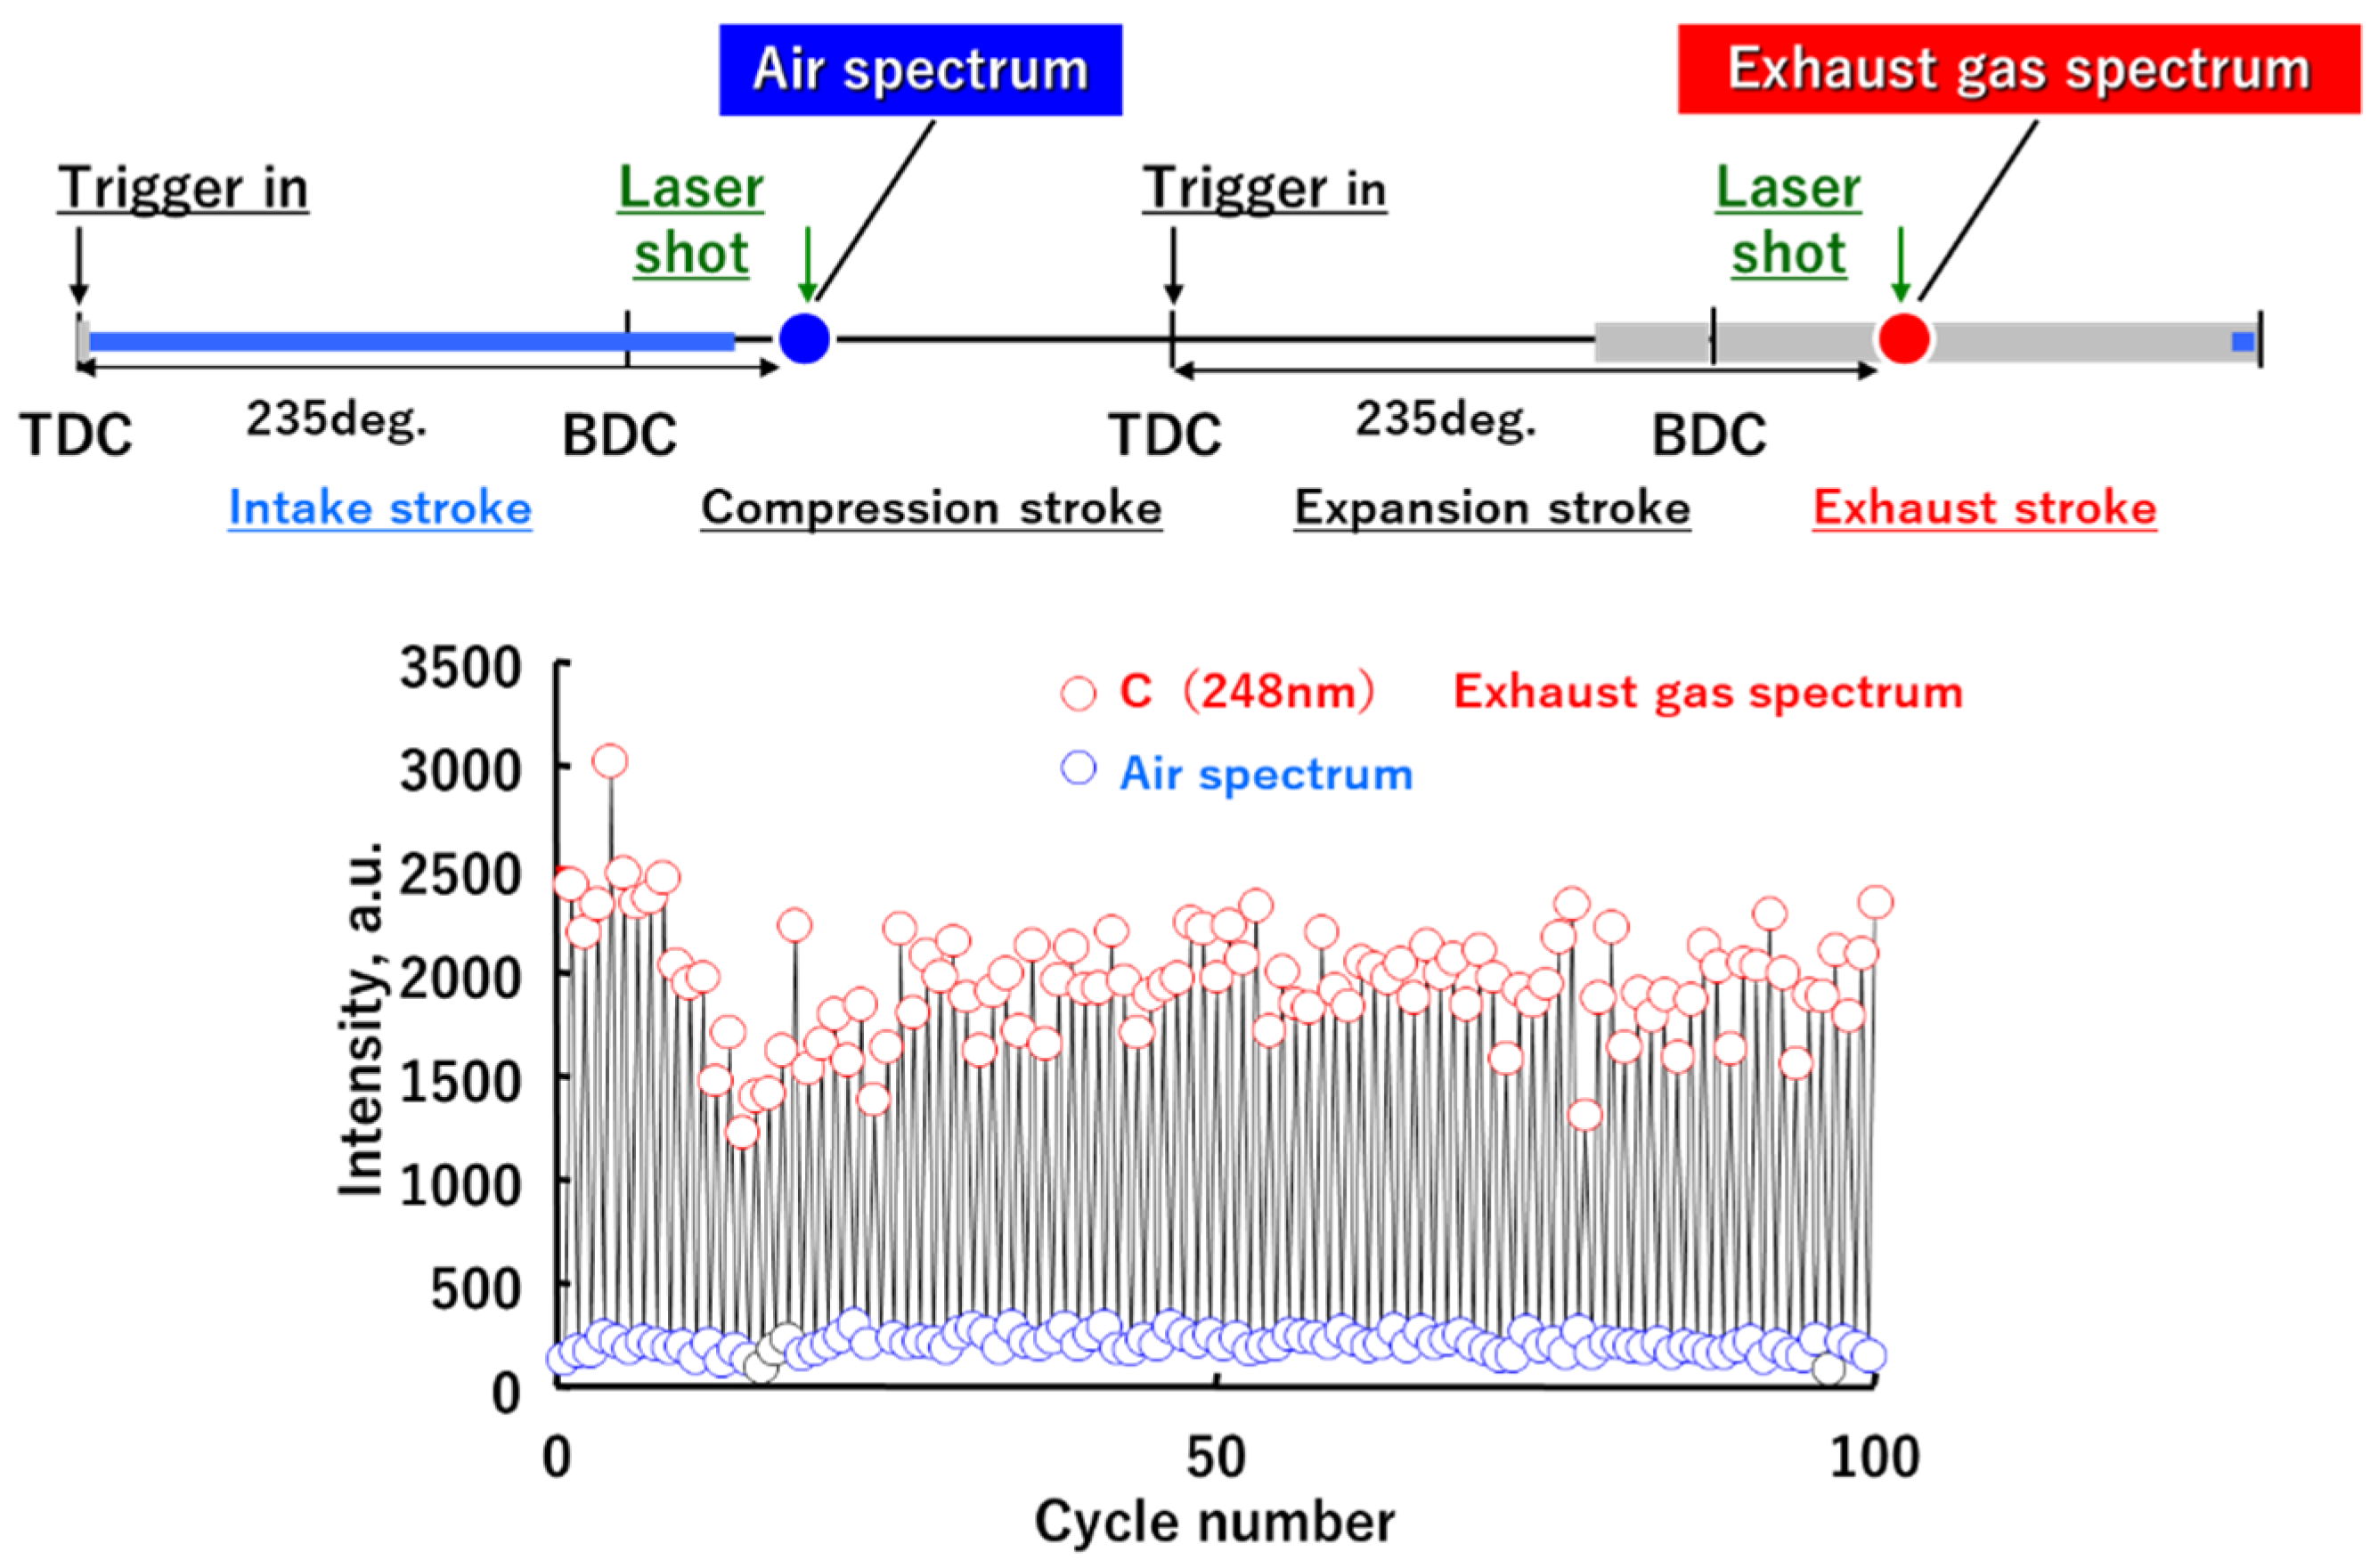
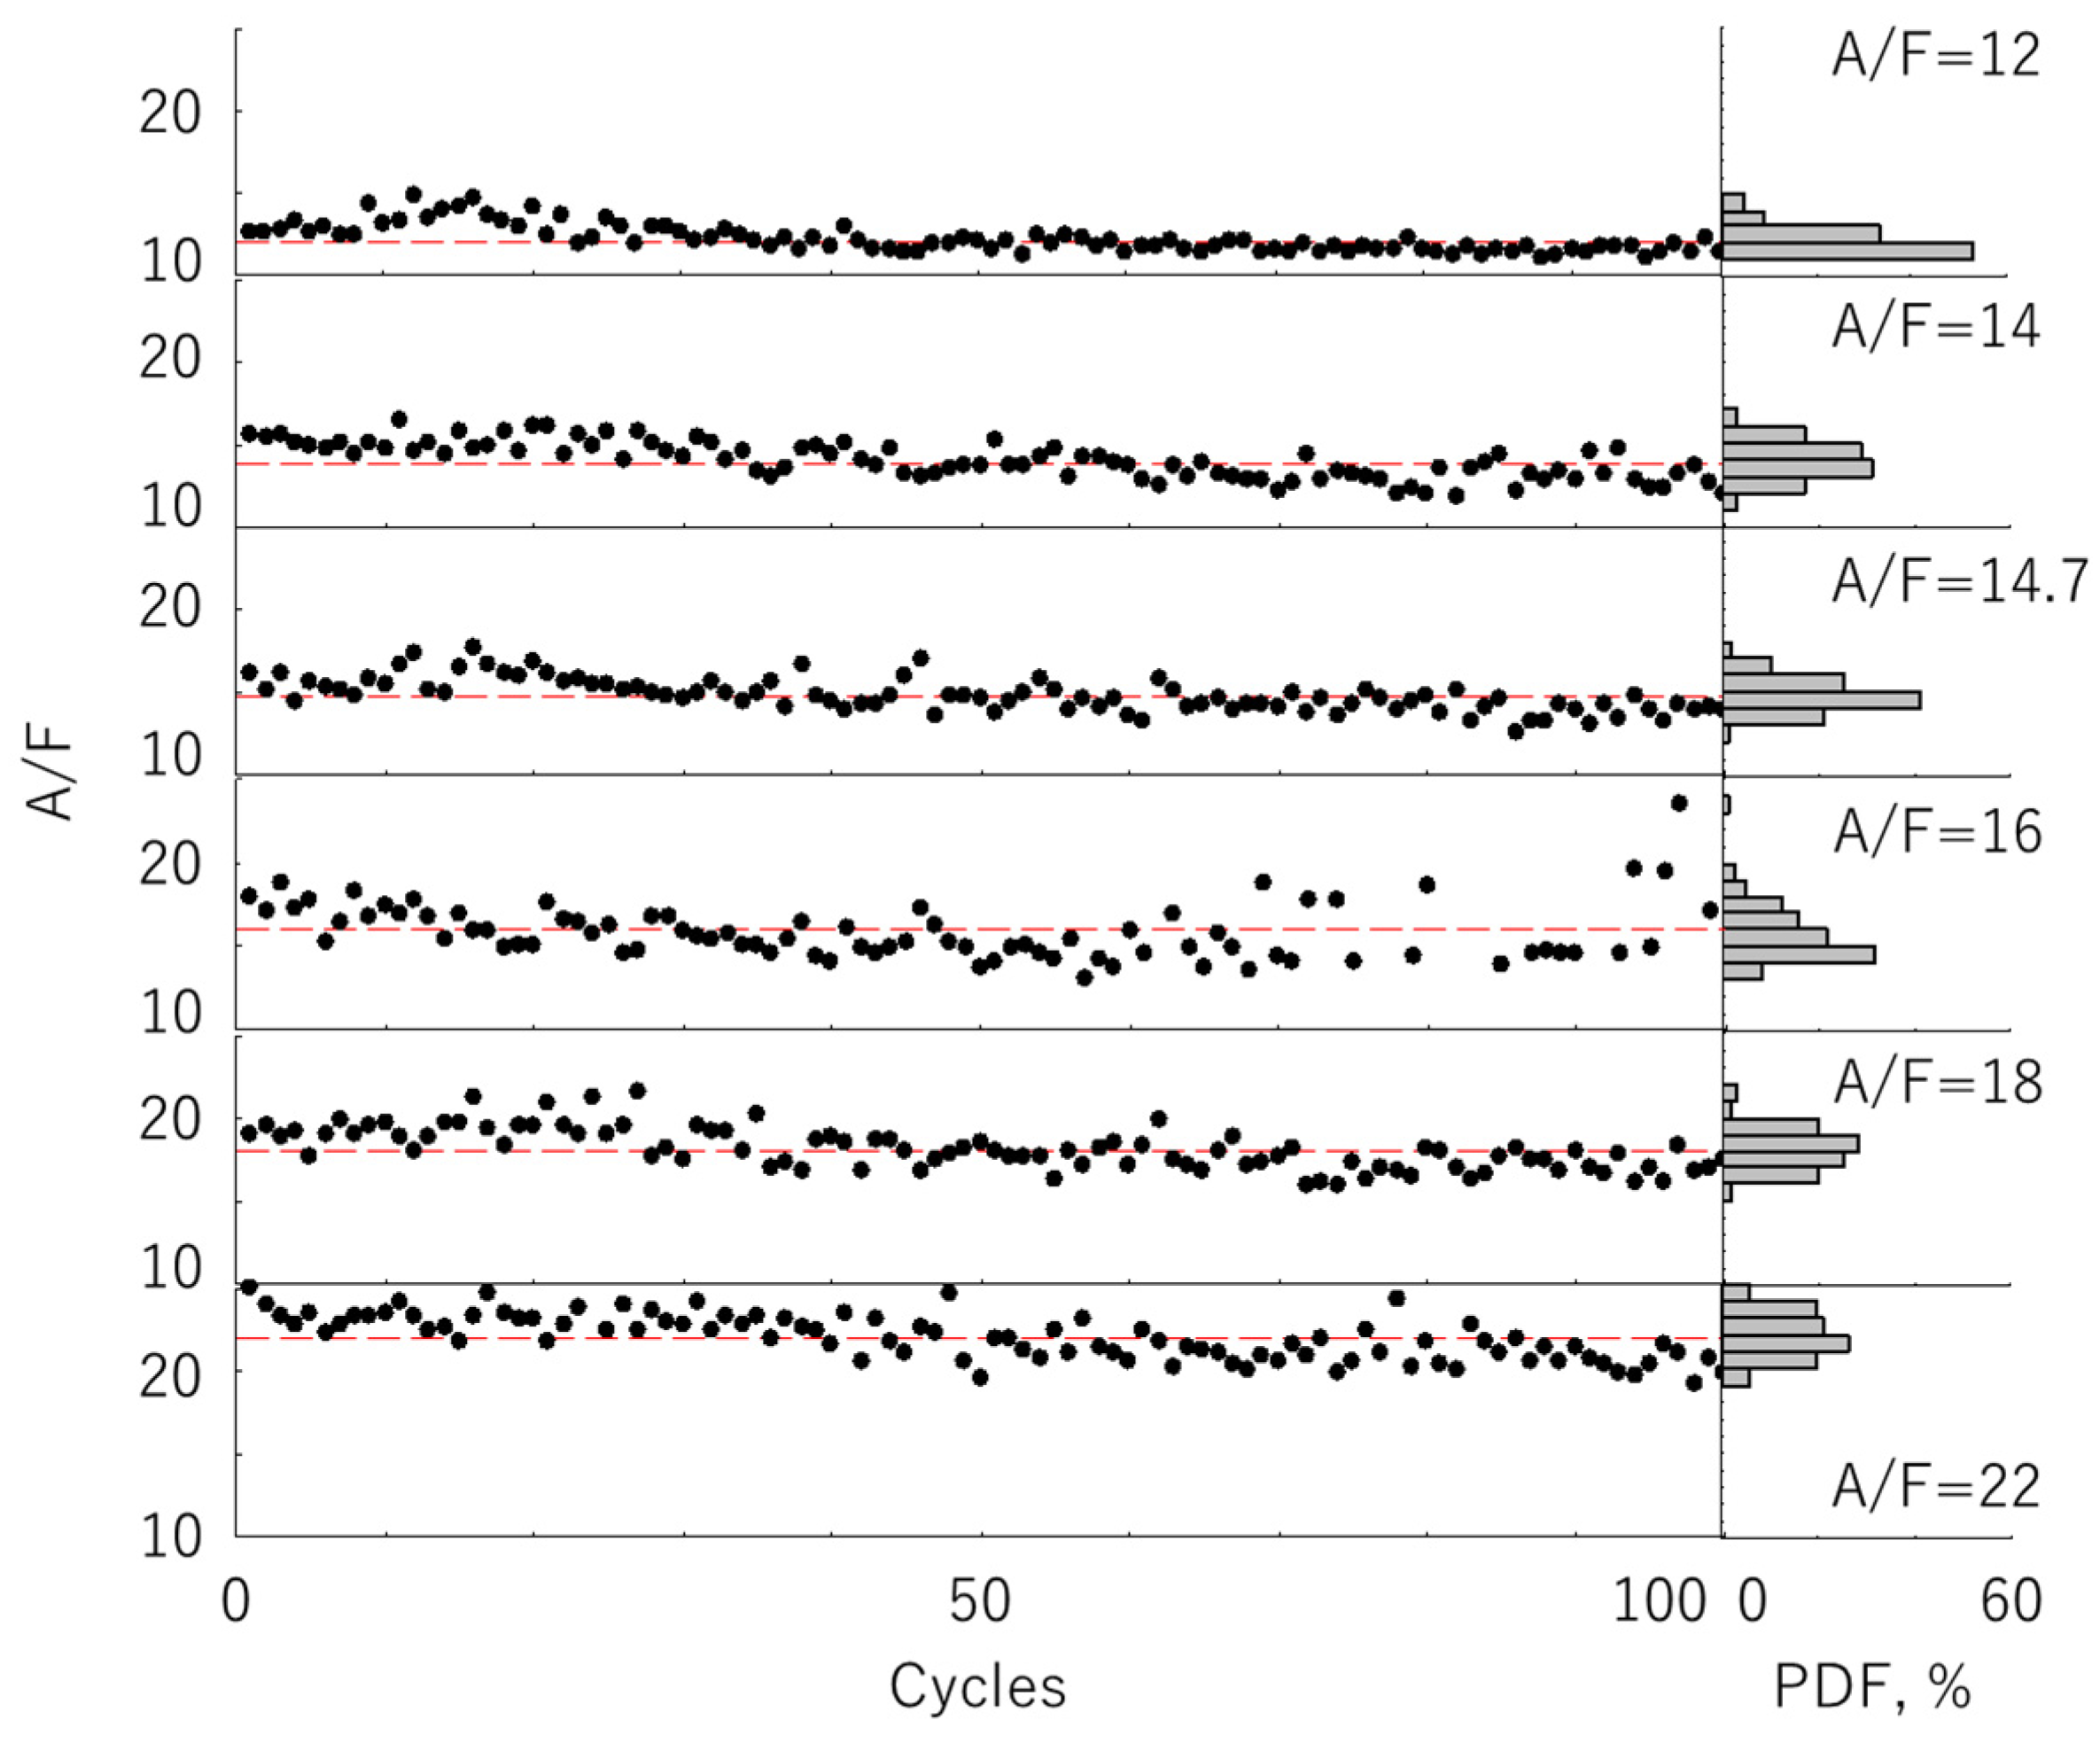
3.3. Cyclic Variation of the A/F

Figure 14 and Figure 15 show the cyclic variation of the A/F estimated from the relationship between A/F and Hα/O, shown in Figure 13. As mentioned above, the intensities of CI and OI could not be observed during the same cycle, but the intensity of CI in each cycle is shown in Figure 14 as a reference.
As shown in Figure 15, the value of the A/F estimated from the LIBS spectrum of the exhaust gas agreed well with the preset A/F, as denoted by the dashed line. The cyclic variation in the A/F increased with the preset A/F. The cyclic variation of the intensity of CI also increased with the preset A/F. With the simultaneous measurement of OI and CI, the A/F of each cycle could be determined from the intensity ratio of C/O.

4. Conclusions

The LIBS technique was applied to exhaust gas analysis, and the A/F at the exhaust manifold was measured. A second harmonic laser beam was used as the light source and was controlled using a delay pulse generator. At a constant engine speed of 600 rpm, the spectrum measurements were synchronized for a laser frequency of 10 Hz. The measurement timing and the duration after the laser pulse were regarded as key parameters to obtain accurate atomic spectra. Careful timing and the duration settings utilized for the emission energy measurements are important; otherwise, the results can be affected by the ionization effect or molecular spectra and by a lack of intensity. A wrong setting can impact the measurement precision and acquisition frequency. Based on our observations, the LIBS spectrum measurements were performed between 200 ns and 10 ms after the breakdown. The observed atomic spectra were CI (248 nm), Hβ (485 nm), Hα (656 nm), NI (745, 824 nm), and OI (777, 844 nm).
The intensities of CI (248 nm) and Hα (656 nm) decreased with increasing A/F, whereas the intensities of NI and OI remained constant. This behavior was explained by the carbon and hydrogen atoms, which came from the hydrocarbon fuel. When the A/F increased, the densities of the carbon and hydrogen atoms decreased; consequently, the emission intensities became lower. In exhaust gases with the correct timing for data acquisition, the intensity ratio of C/O and Hα/O decreased monotonically as the A/F increased. Using this relationship, the cyclic variation of the A/F was measured by LIBS. The A/F values obtained from the LIBS spectrum of the exhaust gas were in good agreement with the preset A/F. The cyclic fluctuations became larger as the preset A/F increased. This technique can efficiently provide the information required during engine development and can be useful to understand physical phenomena, combining good precision and repeatability with a high data acquisition speed. In the near future, the advantages of LIBS could be used to provide real-time closed-loop control of the A/F. Controlling the A/F during the transition phase of internal combustion engines will be key to decreasing fuel consumption and pollutant emissions.

Author Contributions

Conceptualization, All authors; Experimental Design: All authors; Data Analysis, All authors; Writing: Y.I.; Supervision and Project administration, Y.I. All authors have read and agreed to the published version of the manuscript.

Funding

Not applicable.

Institutional Review Board Statement

Not applicable.

Informed Consent Statement

Not applicable.

Data Availability Statement

Not applicable.

Conflicts of Interest

The authors declare no conflict of interest.

References

  1. Heywood, J.B.; John, B. Internal Combustion Engine Fundamentals; McGraw-Hill Education: New York, NY, USA, 1988. [Google Scholar]
  2. Ramalingam, S.; Rajendran, S. Assessment of Performance, Combustion, and Emission Behavior of Novel Annona Biodiesel-Operated Diesel Engine. In Advances in Eco-Fuels for a Sustainable Environment; Woodhead Publishing: Sawston, UK, 2019; pp. 391–405. [Google Scholar] [CrossRef]
  3. Imamoto, T.; Kawahara, N.; Tomita, E. PREMIER Combustion Characteristics of a Pilot Fuel-Ignited Dual-Fuel Biogas Engine with Consideration of Cycle-to-Cycle Variations. Fuel 2022, 314, 123049. [Google Scholar] [CrossRef]
  4. Valipour Berenjestanaki, A.; Kawahara, N.; Tsuboi, K.; Tomita, E. End-Gas Autoignition Characteristics of PREMIER Combustion in a Pilot Fuel-Ignited Dual-Fuel Biogas Engine. Fuel 2019, 254, 115634. [Google Scholar] [CrossRef]
  5. Kim, J.; Chun, K.M.; Song, S.; Baek, H.K.; Lee, S.W. Hydrogen Effects on the Combustion Stability, Performance and Emissions of a Turbo Gasoline Direct Injection Engine in Various Air/Fuel Ratios. Appl. Energy 2018, 228, 1353–1361. [Google Scholar] [CrossRef]
  6. Zhou, L.; Hua, J.; Wei, H.; Han, Y. An Experimental Investigation on Low Load Combustion Stability and Cold-Firing Capacity of a Gasoline Compression Ignition Engine. Engineering 2019, 5, 558–567. [Google Scholar] [CrossRef]
  7. Han, X.; Yu, S.; Tjong, J.; Zheng, M. Study of an Innovative Three-Pole Igniter to Improve Efficiency and Stability of Gasoline Combustion under Charge Dilution Conditions. Appl. Energy 2020, 257, 113999. [Google Scholar] [CrossRef]
  8. Verhelst, S.; Turner, J.W.; Sileghem, L.; Vancoillie, J. Methanol as a Fuel for Internal Combustion Engines. Prog. Energy Combust. Sci. 2019, 70, 43–88. [Google Scholar] [CrossRef] [Green Version]
  9. Wang, C.; Cheng, K.; Qin, J.; Shao, J.; Huang, H. Performance Comparison of Three Chemical Precooled Turbine Engine Cycles Using Methanol and N-Decane as the Precooling Fuels. Energy 2022, 249, 123606. [Google Scholar] [CrossRef]
  10. Li, X.; Ai, Y.; Ge, Y.; Qi, J.; Feng, Q.; Hu, J.; Porter, W.C.; Miao, Y.; Mao, H.; Jin, T. Integrated Effects of SCR, Velocity, and Air-Fuel Ratio on Gaseous Pollutants and CO2 Emissions from China V and VI Heavy-Duty Diesel Vehicles. Sci. Total Environ. 2022, 811, 152311. [Google Scholar] [CrossRef]
  11. Valipour Berenjestanaki, A.; Kawahara, N.; Tsuboi, K.; Tomita, E. Performance, Emissions and End-Gas Autoignition Characteristics of PREMIER Combustion in a Pilot Fuel-Ignited Dual-Fuel Biogas Engine with Various CO2 Ratios. Fuel 2021, 286, 119330. [Google Scholar] [CrossRef]
  12. Tian, Z.; Wang, Y.; Zhen, X.; Liu, Z. The Effect of Methanol Production and Application in Internal Combustion Engines on Emissions in the Context of Carbon Neutrality: A Review. Fuel 2022, 320, 123902. [Google Scholar] [CrossRef]
  13. Ikeda, Y.; Furui, T.; Le, M.K.; Nishiyama, A. In-Cylinder Flow Measurement in SI Engine under Firing Conditions by High Speed PIV. In Proceedings of the 18th International Symposium on the Application of Laser and Imaging Techniques to Fluid Mechanics, Lisboa, Portugal, 14–17 July 2016. [Google Scholar]
  14. Kawahara, N.; Kim, Y.; Wadahama, H.; Tsuboi, K.; Tomita, E. Differences between PREMIER Combustion in a Natural Gas Spark-Ignition Engine and Knocking with Pressure Oscillations. Proc. Combust. Inst. 2019, 37, 4983–4991. [Google Scholar] [CrossRef]
  15. Zhao, J.; Fu, R.; Wang, S.; Xu, H.; Yuan, Z. Fuel Economy Improvement of a Turbocharged Gasoline SI Engine through Combining Cooled EGR and High Compression Ratio. Energy 2022, 239, 122353. [Google Scholar] [CrossRef]
  16. Wu, Y.; Gragston, M.; Zhang, Z.; Hsu, P.S.; Jiang, N.; Patnaik, A.K.; Roy, S.; Gord, J.R. High-Pressure 1D Fuel/Air-Ratio Measurements with LIBS. Combust. Flame 2018, 198, 120–129. [Google Scholar] [CrossRef]
  17. Behnke, L.; Monroe, E.; Nguyen, B.; Landera, A.; George, A.; Yang, Z.; Heyne, J.; Davis, R.W. Maximizing Net Fuel Economy Improvement from Fusel Alcohol Blends in Gasoline Using Multivariate Optimization. Fuel Commun. 2022, 11, 100059. [Google Scholar] [CrossRef]
  18. Zeng, Y.; Tan, X.; Gu, B.; Guo, J.; Jiang, J.; Wang, D.; Tang, J. Cost-Effectiveness Analysis on Improving Fuel Economy and Promoting Alternative Fuel Vehicles: A Case Study of Chongqing, China. J. Clean. Prod. 2021, 323, 129075. [Google Scholar] [CrossRef]
  19. Odunlami, O.A.; Oderinde, O.K.; Akeredolu, F.A.; Sonibare, J.A.; Obanla, O.R.; Ojewumi, M.E. The Effect of Air-Fuel Ratio on Tailpipe Exhaust Emission of Motorcycles. Fuel Commun. 2022, 11, 100040. [Google Scholar] [CrossRef]
  20. Yang, J.; Tao, W.; Wang, M.; Feng, C.; Yin, C. Stochastic Air-Fuel Ratio Control with Cylinder Pressure Measurement Inaccuracy of Gas Engines. IFAC-PapersOnline 2021, 54, 84–89. [Google Scholar] [CrossRef]
  21. Woo, S.; Lee, J.; Lee, K. Experimental Study on the Performance of a Liquefied Petroleum Gas Engine According to the Air Fuel Ratio. Fuel 2021, 303, 121330. [Google Scholar] [CrossRef]
  22. Moonsammy, S.; Oyedotun, T.D.T.; Oderinde, O.; Durojaiye, M.; Durojaye, A. Exhaust Determination and Air-to-Fuel Ratio Performance of End-of-Life Vehicles in a Developing African Country: A Case Study of Nigeria. Transp. Res. Part D Transp. Environ. 2021, 91, 102705. [Google Scholar] [CrossRef]
  23. Musculus, M.P.B.; Pickett, L.M. In-Cylinder Spray, Mixing, Combustion, and Pollutant-Formation Processes in Conventional and Low-Temperature-Combustion Diesel Engines. Adv. Direct Inject. Combust. Eng. Technol. Dev. 2010, 241, 644–675. [Google Scholar] [CrossRef]
  24. Nishiyama, A.; Le, M.K.; Furui, T.; Ikeda, Y. Simultaneous In-Cylinder Flow Measurement and Flame Imaging in a Realistic Operating Engine Environment Using High-Speed PIV. Appl. Sci. 2019, 9, 2678. [Google Scholar] [CrossRef] [Green Version]
  25. Kawahara, N.; Beduneau, J.L.; Nakayama, T.; Tomita, E.; Ikeda, Y. Spatially, temporally, and spectrally resolved measurement of laser-induced plasma in air. Appl. Phys. B 2007, 86, 605–614. [Google Scholar] [CrossRef]
  26. Kojima, J.; Ikeda, Y.; Nakajima, T. Spatially resolved measurement of OH *, CH * and C2 * chemiluminescence in the reaction zone of laminar methane/air premixed flames. Proc. Combust. Inst. 2000, 28, 1757–1764. [Google Scholar] [CrossRef]
  27. Kojima, J.; Ikeda, Y.; Nakajima, T. Multi-point time-series observation of optical emissions for flame-front motion analysis. Meas. Sci. Technol. 2003, 14, 1714–1724. [Google Scholar] [CrossRef]
  28. Ikeda, Y.; Kawahara, N.; Tomita, E. Time-series A/F analysis in a SI engine by micro-local chemiluminescence technique. In Proceedings of the 6th COMODIA 2004, Yokohama, Japan, 2–5 August 2004. [Google Scholar]
  29. Ikeda, Y.; Nishiyama, A.; Kawahara, N.; Tomita, E.; Arimoto, S.; Takeuch, A. In-spark-plug sensor for analyzing the initial flame and its structure in an SI engine. In SAE Technical Papers; MDPI: Basel, Switzerland, 2005. [Google Scholar] [CrossRef]
  30. Ikeda, Y.; Nishiyama, A.; Kim, S.M.; Takeuchi, A.; Winklhofer, E.; Baritaud, T. Cyclic variation of local A/F and mixture quality in SI engine using local chemiluminescence. In Proceedings of the 7th international symposium on internal combustion diagnostics, Baden, Germany, 18–19 May 2006. [Google Scholar]
  31. Kawahara, N.; Tomita, E.; Takeuchi, A.; Arimoto, S.; Ikeda, Y.; Nishiyama, A. Measurement of flame propagation characteristics in an SI engine using micro-local chemiluminescence technique. In SAE Technical Papers; MDPI: Basel, Switzerland, 2005. [Google Scholar] [CrossRef]
  32. Radziemski, L.J. From LASER to LIBS, the path of technology development. Spectrochim. Acta B 2002, 57, 1109–1113. [Google Scholar] [CrossRef]
  33. Phuoc, T.X.; White, F.P. Laser-induced spark for measurements of the fuel-to-air ratio of a combustible mixture. Fuel 2002, 81, 1761–1765. [Google Scholar] [CrossRef]
  34. Stavropoulos, P.; Michalakou, A.; Skevis, G.; Couris, S. Quantitative local equivalence ratio determination in laminar premixed methane-air flames by laser induced breakdown spectroscopy (LIBS). Chem. Phys. Lett. 2005, 404, 309–314. [Google Scholar] [CrossRef]
  35. Stavropoulos, P.; Michalakou, A.; Skevis, G.; Couris, S. Laser-induced breakdown spectroscopy as an analytical tool for equivalence ratio measurement in methane-air premixed flames. Spectrochim. Acta Part B At. Spectrosc. 2005, 60, 1092–1097. [Google Scholar] [CrossRef]
  36. Sturm, V.; Noll, R. Laser-induced breakdown spectroscopy of gas mixture of air, CO2, N2, and C3H8 for simultaneous C, H, O, and N measurement. Appl. Opt. 2003, 42, 6221–6225. [Google Scholar] [CrossRef]
  37. Ferioli, F.; Buckley, S.G. Measurements of hydrocarbons using laser-induced breakdown spectroscopy. Combust. Flame 2006, 144, 435–447. [Google Scholar] [CrossRef]
  38. Hohreiter, V.; Carranza, J.E.; Hahn, D.W. Temporal analysis of laser-induced plasma properties as related to laser-induced breakdown spectroscopy. Spectrochim. Acta Part B 2004, 59, 327–333. [Google Scholar] [CrossRef]
  39. Stavropoulos, P.; Palagas, C.; Angelopoulos, G.N.; Papamantellos, D.N.; Couris, S. Calibration measurement in laser-induced breakdown spectroscopy using nanosecond and picosecond lasers. Spectrochim. Acta Part B At. Spectrosc. 2004, 59, 1885–1892. [Google Scholar] [CrossRef]
  40. Ikeda, Y.; Nishiyama, A.; Kawahara, N.; Tomita, E.; Nakayama, T. Local equivalence ratio measurement of CH4/air and C3H8/air laminar flames by laser-induced breakdown. In Proceedings of the 44th AIAA Aerospace Sciences Meeting and Exhibit, Reno, Nevada, 12 January 2006; p. 965. [Google Scholar]
  41. Mansour, M.S.; Imam, H.; Elsayed, K.A.; Abbass, W. Local equivalence ratio measurements in turbulent partially premixed flames using laser-induced breakdown spectroscopy. Spectrochim. Acta Part B At. Spectrosc. 2009, 64, 1079–1084. [Google Scholar] [CrossRef]
  42. Joshi, S.; Olsen, D.B.; Dumitrescu, C.; Puzinauskas, P.V.; Yalin, A.P. Laser-induced breakdown spectroscopy for in-cylinder equivalence ratio measurements in laser-ignited natural gas engines. Appl. Spectrosc. 2009, 63, 549–554. [Google Scholar] [CrossRef]
  43. Eseller, K.E.; Yueh, F.Y.; Singh, J.P. Laser-induced breakdown spectroscopy measurement in methane and biodiesel flames using an ungated detector. Appl. Opt. 2008, 47, G144–G148. [Google Scholar] [CrossRef]
  44. Kim, Y.W. Fundamentals of analysis of solids by laser-produced plasmas. In Laser-Induced Plasmas and Applications; Radziemski, L.J., Cremers, D.A., Eds.; Marcel Dekker Inc: New York, NY, USA, 1989. [Google Scholar]
  45. Beduneau, J.L.; Kim, B.; Zimmer, L.; Ikeda, Y. Measurements of minimum ignition energy in premixed laminar methane/air flow by using laser induced spark. Combust. Flame 2003, 132, 653–665. [Google Scholar] [CrossRef]
  46. Beduneau, J.L.; Ikeda, Y. Spatial characterization of laser-induced sparks in air. J. Quant. Spectrosc. Radiat. Transf. 2004, 84, 123–139. [Google Scholar] [CrossRef]
  47. Beduneau, J.L.; Kawahara, N.; Nakayama, T.; Ikeda, Y. Laser-Induced radical generation and evolution to a self-sustaining flame. Combust. Flame 2009, 156, 642–656. [Google Scholar] [CrossRef]
Figure 1. The experimental setup for the exhaust gas measurement by LIBS and engine specifications.
Energies 15 03053 g001
Figure 2. Experimental setup for investigating breakdown characteristics.
Energies 15 03053 g002
Figure 3. Relationship between the incident and transmitted energy. The probability of occurrence of the plasma breakdown is high for shorter focal lengths.
Energies 15 03053 g003
Figure 4. LIBS spectrum of the propane–air mixture. The H intensity ratio vary with the change in equivalence ratio.
Energies 15 03053 g004
Figure 5. Relationship between atomic spectrum intensity and equivalence ratio (propane–air mixture). Only the H atomic spectra has higher sensitivity with the change of equivalence ratio.
Energies 15 03053 g005
Figure 6. The intensity ratio of H/O and H/N in relation to the equivalence ratio of the propane–air mixture. Both intensity ratios increased with a higher equivalence ratio.
Energies 15 03053 g006
Figure 7. LIBS spectrum for each laser shot (200~270 nm wavelength range). The cyclic variation of the atomic CI is observed for the compression and exhaust strokes.
Energies 15 03053 g007
Figure 8. Spectrum intensity at 248 nm for each laser shot. The C atomic spectra is only observed in the exhaust gas.
Energies 15 03053 g008
Figure 9. LIBS spectrum at each stage (A/F = 18). The spectra observed varied with the measurement delay time of the ICCD camera.
Energies 15 03053 g009
Figure 10. Intensity profile of ionic, atomic, and molecular spectra. The ionic spectra have a shorter lifetime compared with the atomic and molecular spectra.
Energies 15 03053 g010
Figure 11. LIBS spectrum (A/F = 18). At a delay time of 200 ns to 10 µs, the ionic spectra are observed which are then used in cyclic measurements of A/F.
Energies 15 03053 g011
Figure 12. (a) C and (b) H, N, and O atomic spectra (A/F = 12, 14.7, 18). The C and H atomic spectra significantly decrease with higher A/F values.
Energies 15 03053 g012
Figure 13. Relationship between intensity ratio and A/F: (a) C/O atomic spectrum intensity ratio and (b) H/O atomic spectrum intensity ratio. Both C/O and H/O has good correlation with A/F.
Energies 15 03053 g013
Figure 14. Cyclic variation measurement of A/F in the exhaust gas, with an A/F = 18. The O atomic spectra intensity increased in the exhaust gas.
Energies 15 03053 g014
Figure 15. Cyclic variation of measured A/F and C spectrum intensity.
Energies 15 03053 g015
Table 1. Comparison of gas species measurement methods.
FTIRFIDNDIRLIBS
Temporal
resolution
0.6 s1 ms8 ms<1 ms
Spatial
resolution
×××
SpeciesCO, CO2,
NO, NO2,
H2O, etc.
THCCO,
CO2
C, H, N,
O, etc.
× low; ○ high.
Publisher’s Note: MDPI stays neutral with regard to jurisdictional claims in published maps and institutional affiliations.

