Article

Effect of Blockage Inside Holes on Film Cooling Performance on the Suction Side of a Turbine Guide Vane

1
School of Aero-Engine, Shenyang Aerospace University, Shenyang 110136, China
2
Sichuan Gas Turbine Establishment, Aero Engine Corporation of China, Chengdu 610500, China
3
Research Institute of Aero-Engine, Beihang University, Beijing 100191, China
*
Author to whom correspondence should be addressed.
Energies 2022, 15(8), 2935; https://doi.org/10.3390/en15082935
Submission received: 15 March 2022 / Revised: 4 April 2022 / Accepted: 12 April 2022 / Published: 16 April 2022
(This article belongs to the Special Issue Analysis and Optimization of Cooling Performance in Gas Turbines)

Abstract

:
In order to study the effect of thermal barrier coating deposition inside the film holes of turbine guide vanes on film cooling performance, film effectiveness on the suction side is measured by infrared thermal imaging technology. Film effectiveness is obtained at blockage ratios of 0, 0.2, 0.5, and 0.8, and blowing ratios of 0.7, 1.05, and 1.4. Film effectiveness decreases and the spanwise inhomogeneity becomes evident with an increase of the blockage ratio. When blowing ratios increase from 0.7 to 1.4, the surface averaged film effectiveness decreases by 55–60% at a large blockage ratio of 0.8, 21–27% at the middle blockage ratio of 0.5 and by no more than 11% at a small blockage ratio of 0.2. The rounded corners formed by blockage enhance the adhesion of the film at the small blockage ratio of 0.2, thereby improving the film cooling performance near the hole exit. There is a maximum increase of 0.2 in film effectiveness within four hole diameters.

1. Introduction

As turbine inlet temperatures have increased over time, the operational environment of gas turbine vanes has become increasingly challenging, potentially affecting their life span. When the gas temperature exceeds what the superalloy in use can withstand, thermal protection of the turbine vane surface is required to decrease the substrate temperature and protect the vane from the hot gas [1,2,3].
Film cooling and thermal barrier coating are two typical thermal protection methods that have been widely used in turbine vane cooling in the last century [4,5]. A large number of researchers have conducted in-depth studies of the factors influencing film cooling [6]—studies that can be divided into two categories: One is the geometric parameters of the hole, such as hole shape, hole diameter, hole spacing, length–diameter ratio, and outflow angle [7]; the other category is the aerodynamic parameters of the hole, such as the blowing ratio, momentum ratio, density ratio, and temperature ratio [8]. Most studies have taken idealized film holes as the research objects. It is postulated that thermal barrier coating can add to the protection afforded by film cooling [9]. However, it has been found that during the spraying process for thermal barrier coating, some coating materials entered and were deposited in the outlet section of the film hole, causing some degree of blockage, and thus affecting the film cooling [10].
Bogard et al. [11] originated the study of film hole blockage and, using a microscope, were able to gain cross-sectional photographs of coating material deposition in the outlet section of film holes. Since then, researchers have studied the effect of blockage on film cooling. Some studies show that blockage inside holes has a negative influence on film effectiveness [12]. Wang et al. [13] carried out a study about spherical blockage configurations on a flat plate. It showed that both film spanwise coverage width and effectiveness decrease as the blockage ratio increases. A study by Demling and Bogard [14] showed that when the height of a tri-prism blockage was one hole radius, film effectiveness was up to 80% less than without blockage. Bunker [15], Chen et al. [16], and Whitfield et al. [17] also studied the blockage in different hole shapes (cylindrical holes and diffusion shaped holes) on a flat plate. Studies by Bunker and Chen et al. have shown that blockage by the coating causes a significant degradation of effectiveness of the cylindrical holes, but the effect on the diffusion shaped holes was relatively small. However, the results of Whitfield et al. showed that the effectiveness of both diffusion shaped and cylindrical holes decreased by 75% due to the blockage. Jovanovic et al. [18] found that a half torus blockage in the hole significantly changed the flow field, which caused film effectiveness to decay sharply; the decrease was more evident at a lower blowing ratio. Huang et al. [19] studied the effect of pyramid-shaped blockage on flow coefficient and film effectiveness. It showed that blockage inside the hole reduces the flow coefficient. Except for the leading-edge blockage of the hole exit, other blockage forms led to a decrease of effectiveness. The study of Wang et al. [20] showed that the blockage increased the pressure loss of the coolant and reduced film effectiveness and coverage area.
Due to the flow between real vanes being significantly different from the conventional flat plate, the suction side is a typical position of the vane. In recent years, the research on film cooling has increasingly shifted from conventional flat plates to real vanes, among which a large number of researchers have studied the film cooling on the suction side. The cooling performance of cylindrical holes on the suction side were studied from the beginning [21], and then the compound angle cylindrical holes on the suction surface were further studied [22]. Meanwhile, the research on shaped holes was gradually carried out on the suction side [23]. Liu et al. [24] conducted a comparative study on the film cooling performance of multiple rows of cylindrical holes and multiple rows of shaped holes on the suction side, and Gao et al. [25,26] simultaneously studied the film cooling characteristics of multiple rows of shaped holes and multiple rows of compound angle shaped holes on the suction side. In addition, research has shown that film cooling on the suction side under rotation conditions increases the influence of rotation, which is more consistent with the actual working condition. Li et al. [27,28,29] carried out studies on the cooling characteristics of multiple rows of holes on the suction side and multiple rows of compound angle holes on the suction side under rotating conditions, as well as the cooling characteristics of cylindrical holes and shaped holes on the suction side under rotating conditions. The above studies about film cooling on the suction side have made great contributions to the development of turbine vane cooling.
Although much research progress has been made on film cooling characteristics with film hole blockage, there are still some unknowns. The main one is the reason for the great difference between an oversimplified hole deposition morphology in theory and the actual situation, such as with tri-prism blockage, pyramid-shaped blockage, and spherical blockage, where the actual blockage inside the hole is not combined with the turbine vane. In order to explore how the actual blockage morphology caused by thermal barrier coating affects film cooling on a vane profile, film effectiveness on the suction side of the turbine guide vane was measured by an infrared camera in a cascade wind tunnel. The distributions of film effectiveness under different blockage ratios and blowing ratios were obtained and provided guidance for the future coupling design of film cooling and the thermal barrier coating of turbine vanes.

2. Experimental Apparatus and Methodology

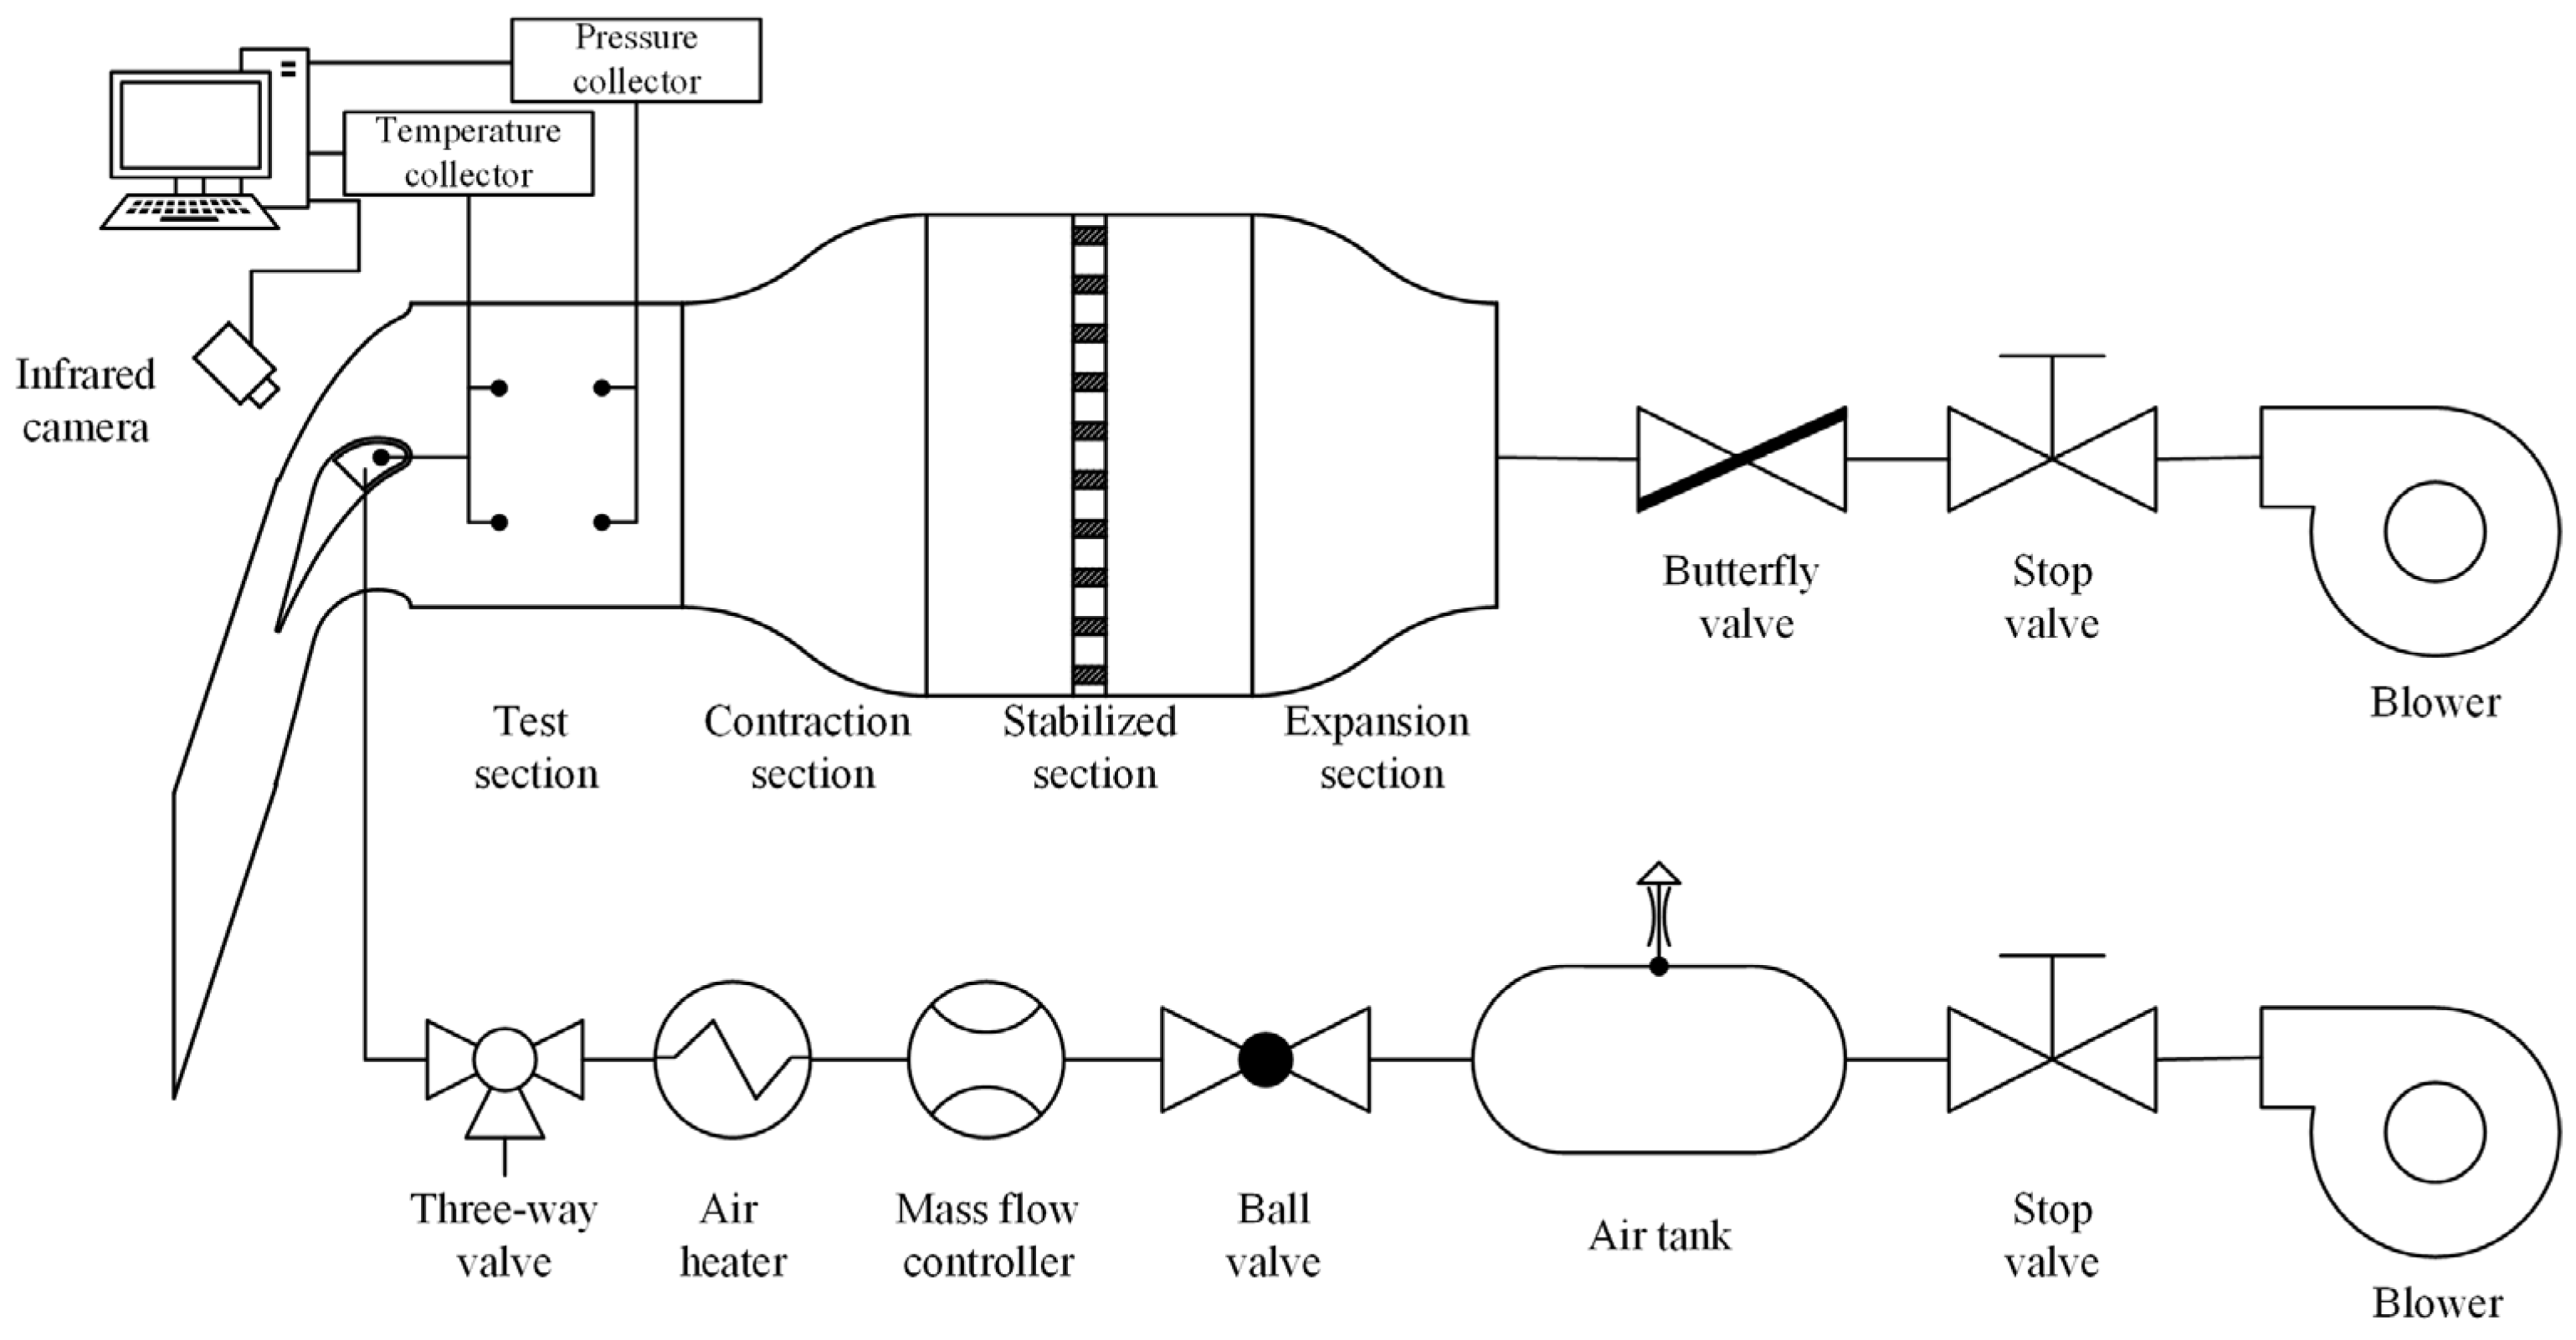
2.1. Experimental Apparatus

Figure 1 shows the cascade wind tunnel system, and Figure 2 shows the corresponding photograph of the cascade wind tunnel test section. The mainstream is provided by a Roots blower, which drives air into the wind tunnel expansion section after it passes through the air supply pipeline and control valve. The mainstream after deceleration is rectified by a honeycomb panel and damping mesh in the stable section and then flows into the cascade test section through the contraction section. It is finally discharged into the atmosphere from the outlet of the test section. Secondary flow is provided by a piston air compressor. The compressed high-pressure air passes through the air tank, valve, flow controller, and heater in turn, and then enters the secondary flow supply chamber of the test vane, finally flowing out of the vane through the film holes.
As shown in Figure 3, the cascade consists of three vanes and two channels; the channel wall is transparent organic glass with a thickness of 10 mm. This makes it possible to observe the situation in the cascade channel at any time while meeting the strength requirements. The detailed parameters of the cascade are given in Table 1. The temperature of the vane surface was obtained by an Optris PI160 infrared camera (Optris GmbH, Berlin, Germany) through an infrared window installed on the wall of test section. The infrared camera sampling frequency is 10 Hz. This meets the requirement of monitoring temperature changes in the mainstream in real time. The infrared transmittance of the window, which is made of germanium single crystal with a purity greater than 99.9999%, is greater than 90%. The mainstream and secondary flow temperatures are obtained through calibrated K-type thermocouples arranged at 0.75 L in front of the vane and in the secondary flow supply chamber. The sampling frequency of the thermocouple temperature acquisition module is 50 Hz, and the time constant of the thermocouple, with a diameter of 0.1 mm, is 0.3 s. The measurements of the infrared camera were calibrated by a thermocouple installed on the surface of a vane. The temperature calibration curve of the thermal camera is shown in Figure 4. The middle test vane has an organic glass (λ = 0.15 W/(m·K)) wall thickness of 9 mm. Twenty-two cylindrical film holes are located at 26% of the relative arc length of the suction side. The geometric structure of film hole exit blockage is based on the studies of Bogard and Whitfield et al. [11,17]. Its cross section is an isosceles triangle with a rounded corner, as shown in Figure 5. The examined blockage ratios of the film holes were 0, 0.2, 0.5, and 0.8. The sizes of the film holes are shown in Table 2.
The pressure coefficient test piece has 27 pressure measuring holes with diameters of 1 mm in the middle section of the vane perpendicular to the local profile. The positions of the pressure measuring holes are shown in Figure 6. The first 13 static pressure measuring holes are located on the pressure side. Static pressure measuring holes 15–27 are located on the suction side, and the No. 14 static pressure measuring hole is located at the stagnation point.

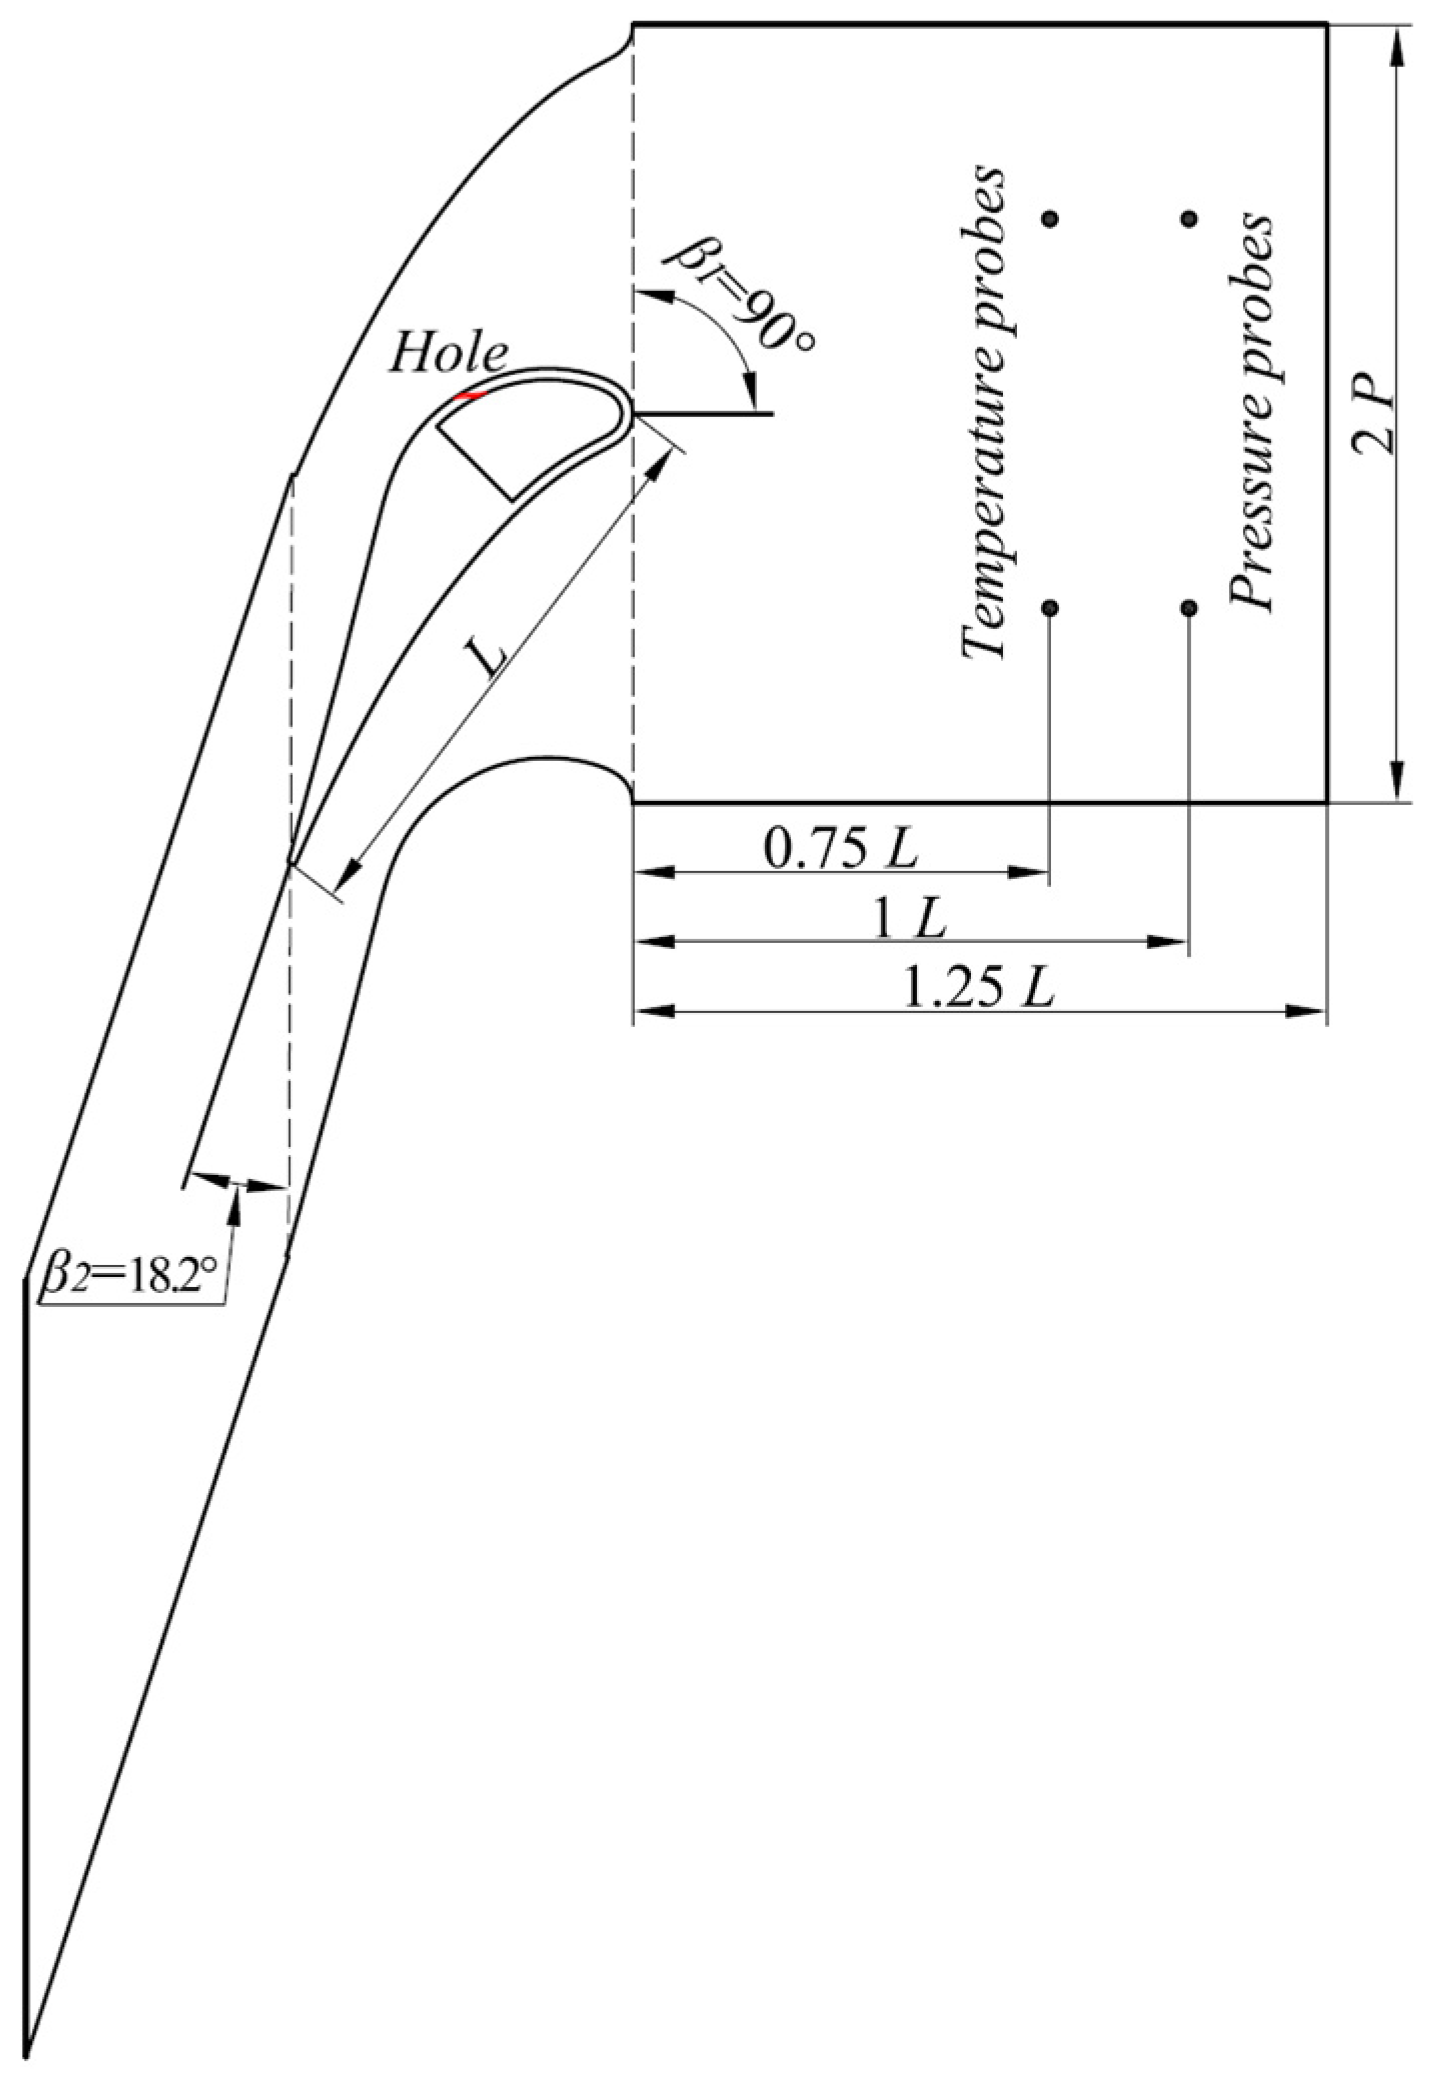
2.2. Experimental Methodology

The experiment was carried out in the cascade wind tunnel described above. The Roots blower frequency was adjusted to ensure that the speed of the test section inlet was 10 m/s, resulting in Re = 3 × 10⁵. The mainstream temperature was 293 ± 1 K. The pressure coefficient was measured on an individual test piece, and the local velocity along the vane outside boundary layer was calculated through the Bernoulli equation. The mass flow rates of secondary flow corresponding to the different blowing ratios were calculated according to the local velocity calculated above.
Steady state experiments were carried out to examine film effectiveness. The mass flow rate of the secondary flow was adjusted by the mass flow controller, and the temperature was raised to 313 ± 1 K by a thermostatic heater. According to the definition of film effectiveness, the adiabatic temperature of the vane surface needs to be measured. This requires the heat flux through the vane surface to be minimized to keep the vane close to the adiabatic state. To reduce the heat flux of steady heat transfer, a 5 mm thick soft foam (λ = 0.02 W/(m·K)) was pasted inside the vane to establish a large enough thermal resistance. The heat flux of steady heat transfer was eliminated for a time as long as 1.5 h. The temperature difference measured by two thermocouples arranged on the outer and inner walls of the vane was 0.7 K. According to Fourier law, the heat flux through the vane was 15.6 W/m2, which approximately satisfies the adiabatic condition. After reaching a steady state, the temperatures of the vane surface, secondary flow, and mainstream were measured by the data acquisition system.

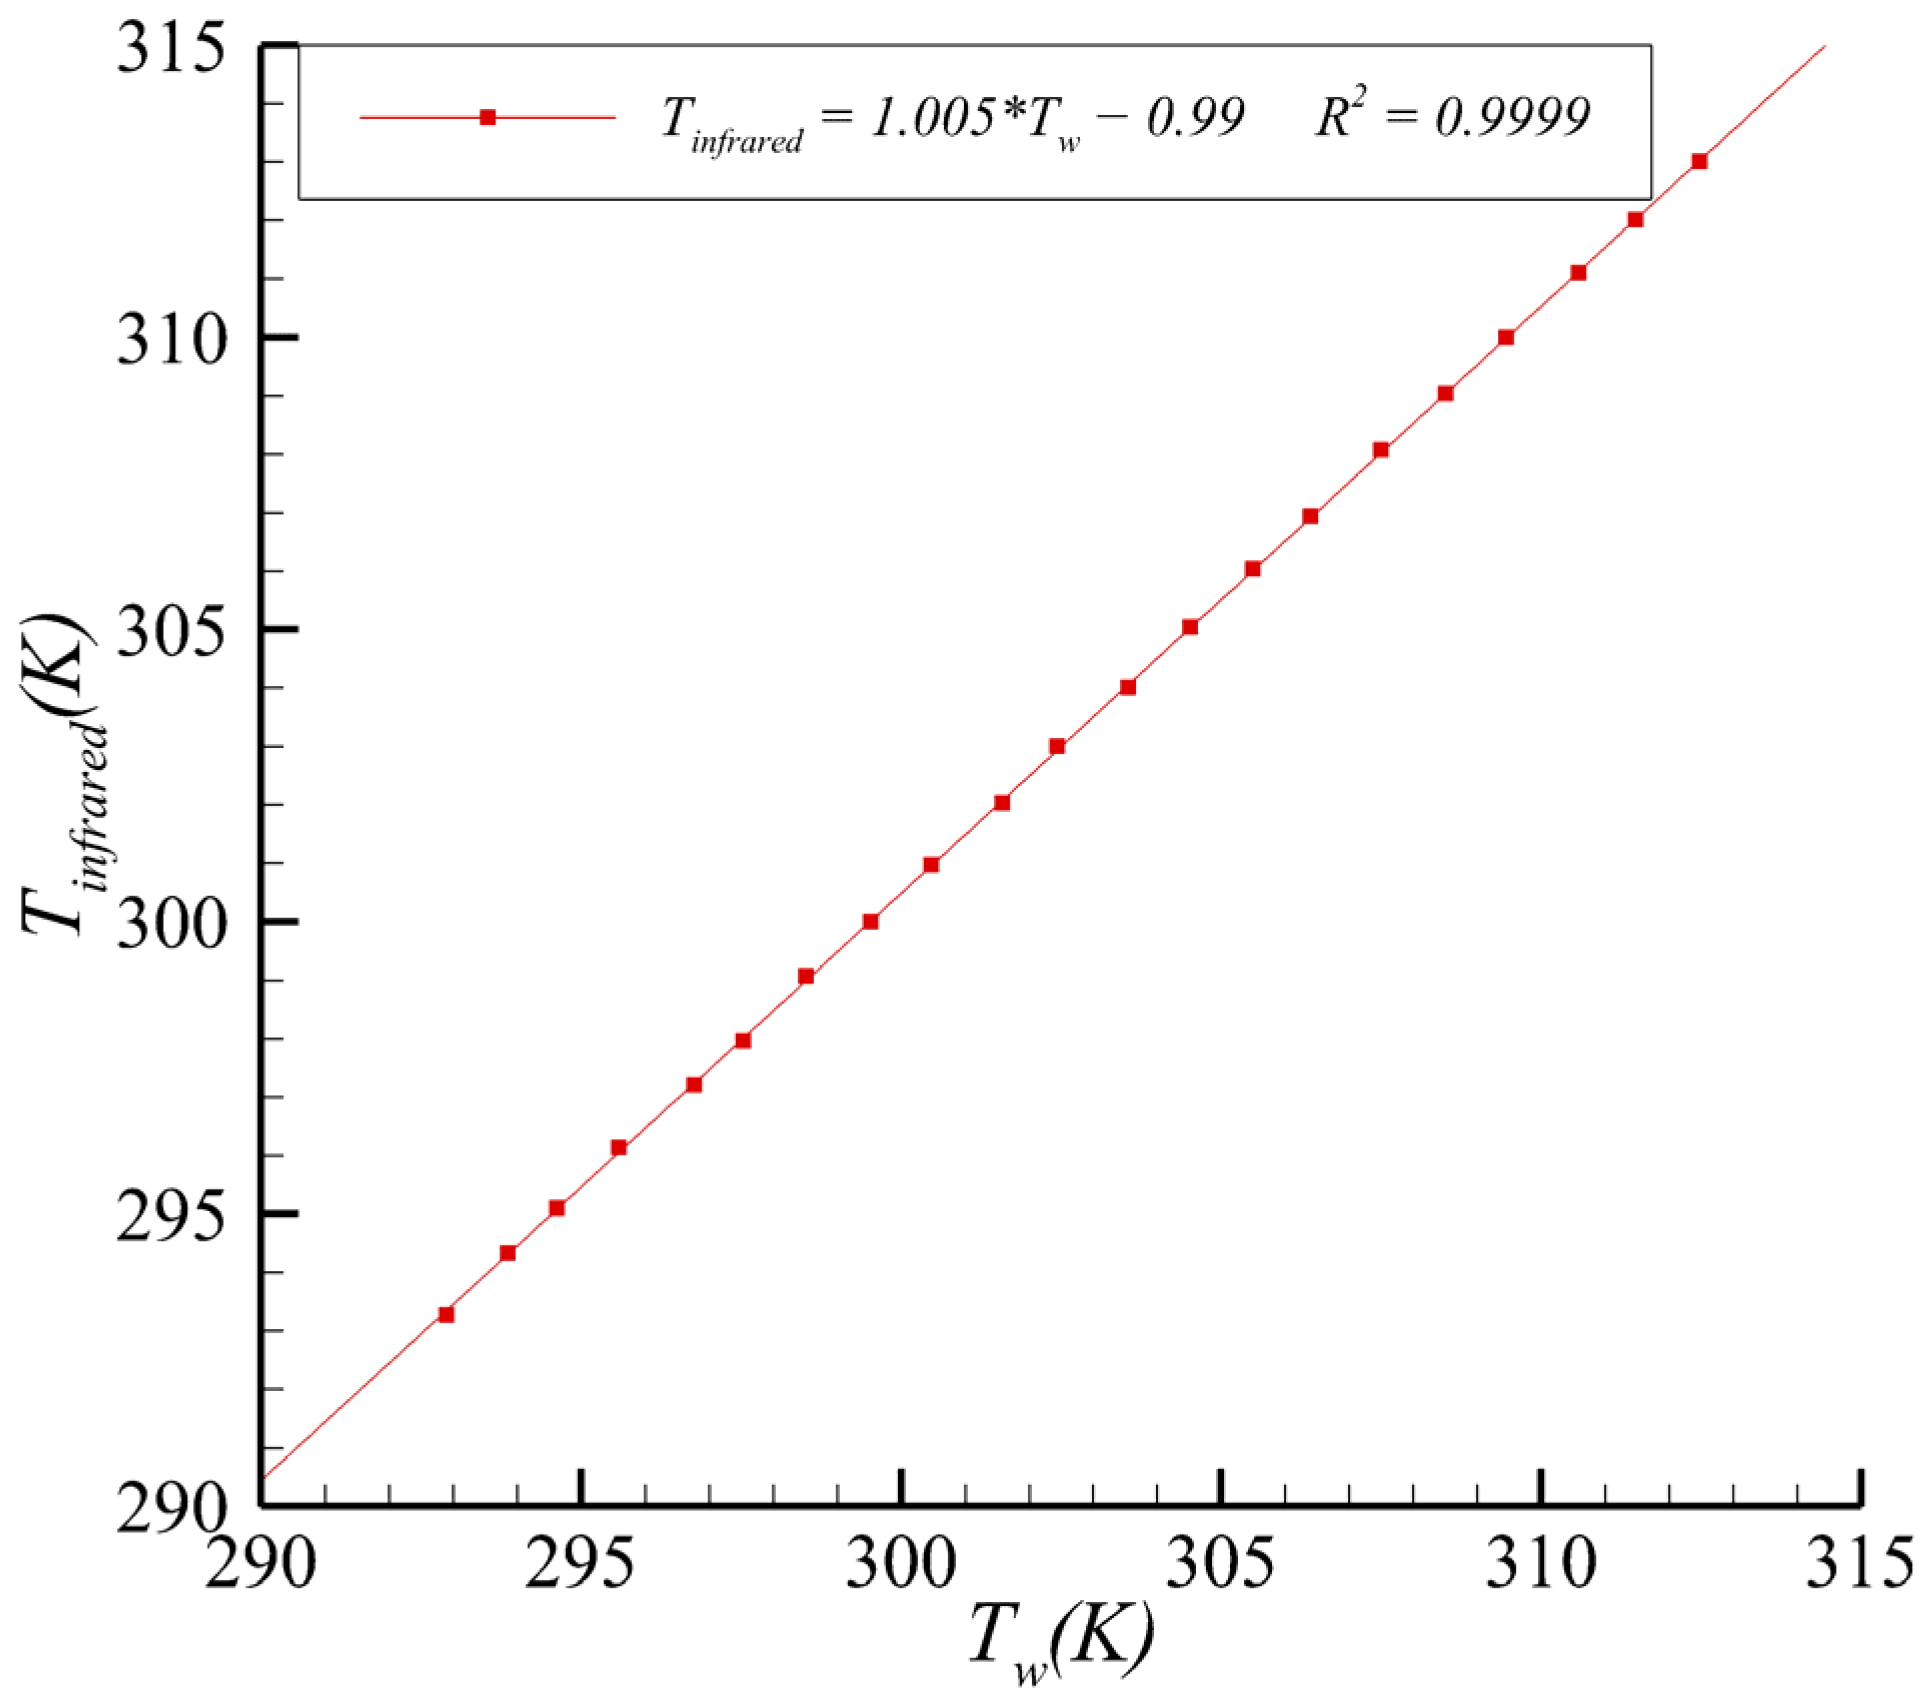
2.3. Experimental Uncertainty

The bias limit of the mass flow rate of the secondary flow was ±2 L/min at the condition of 273.15 K and 101,325 Pa. The bias limit of the calibrated thermocouple was ±0.3 K, and the bias limit of the infrared camera was ±0.5 K. The bias limit of pressure was ±1.5 Pa at a Reynolds number of 3 × 10⁵. As determined by the single-sample experiment method of Moffat [30], the estimated uncertainty in film effectiveness is ±13.8% (±0.0138) based on the value of 0.1 and ±3.3% (±0.0165) based on the value of 0.5. For the pressure coefficient, the estimated uncertainty is ±1.4% (±0.28) based on the value of −20.

3. Results and Discussion

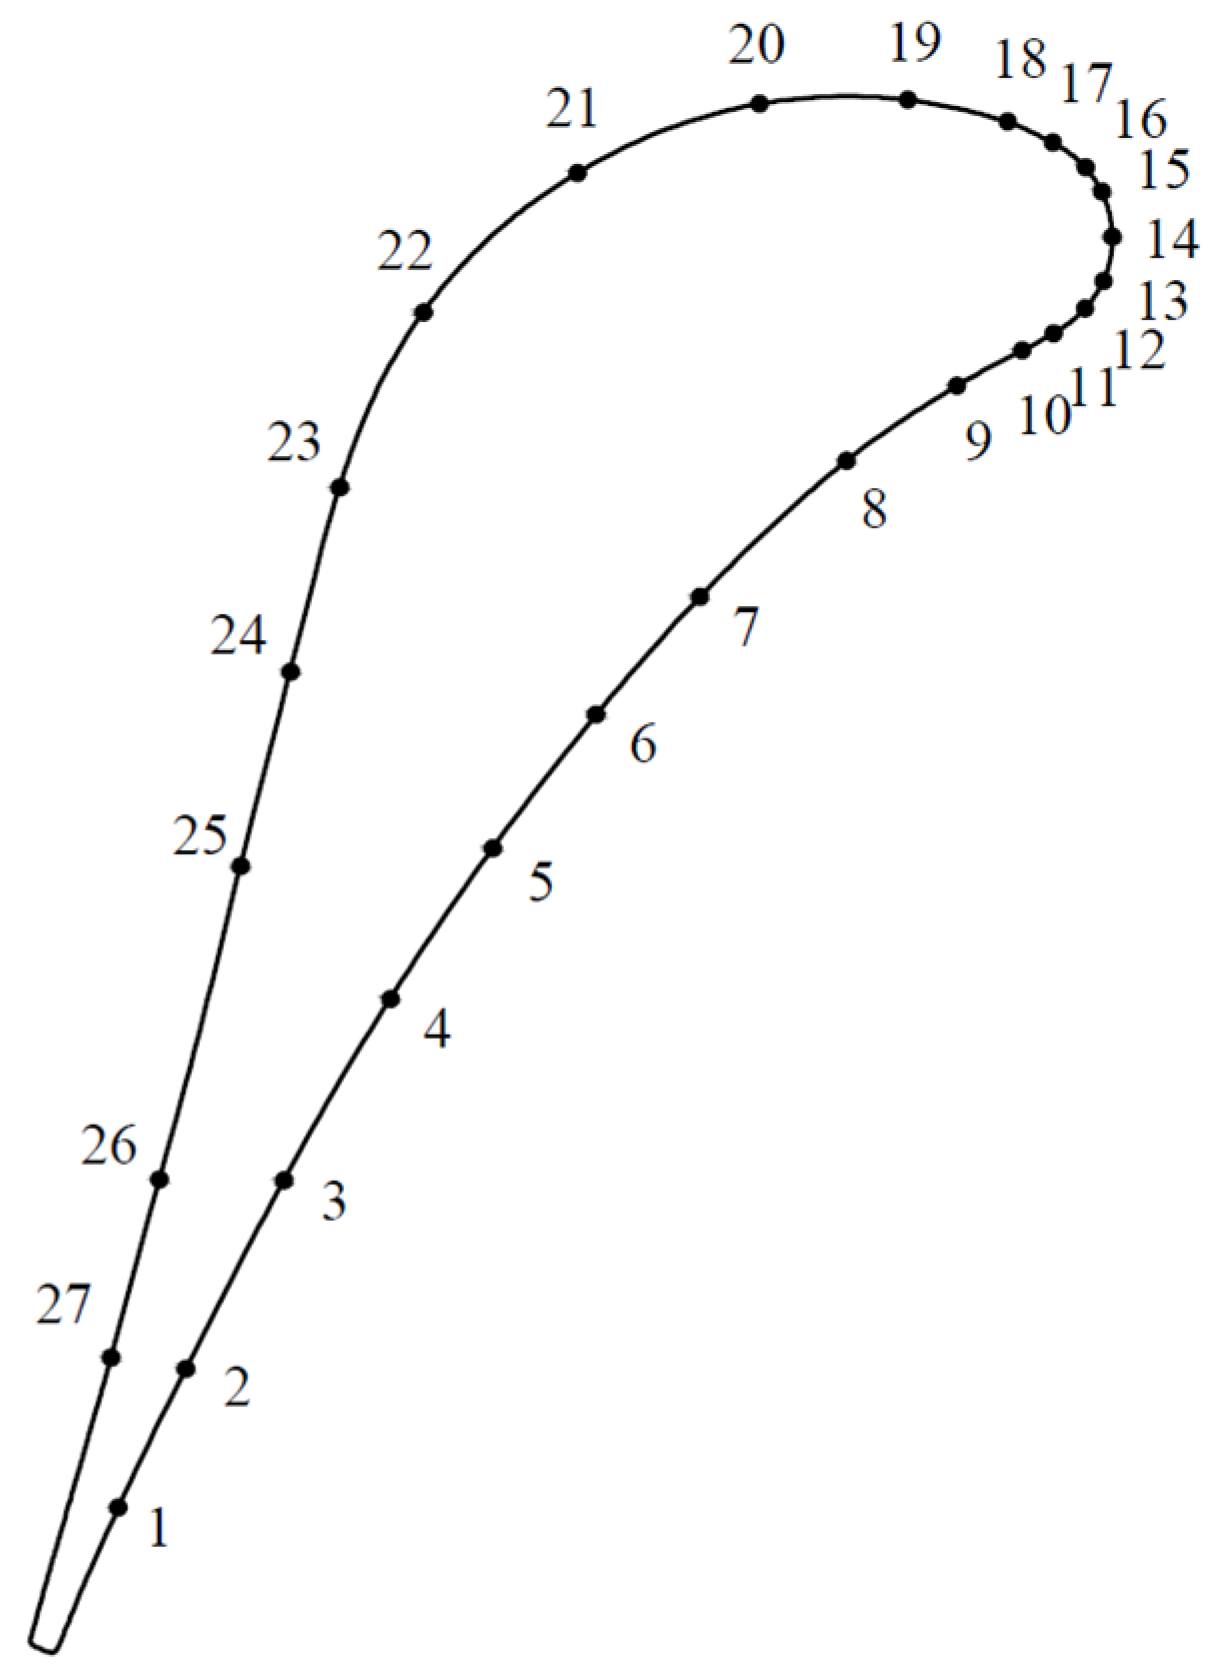
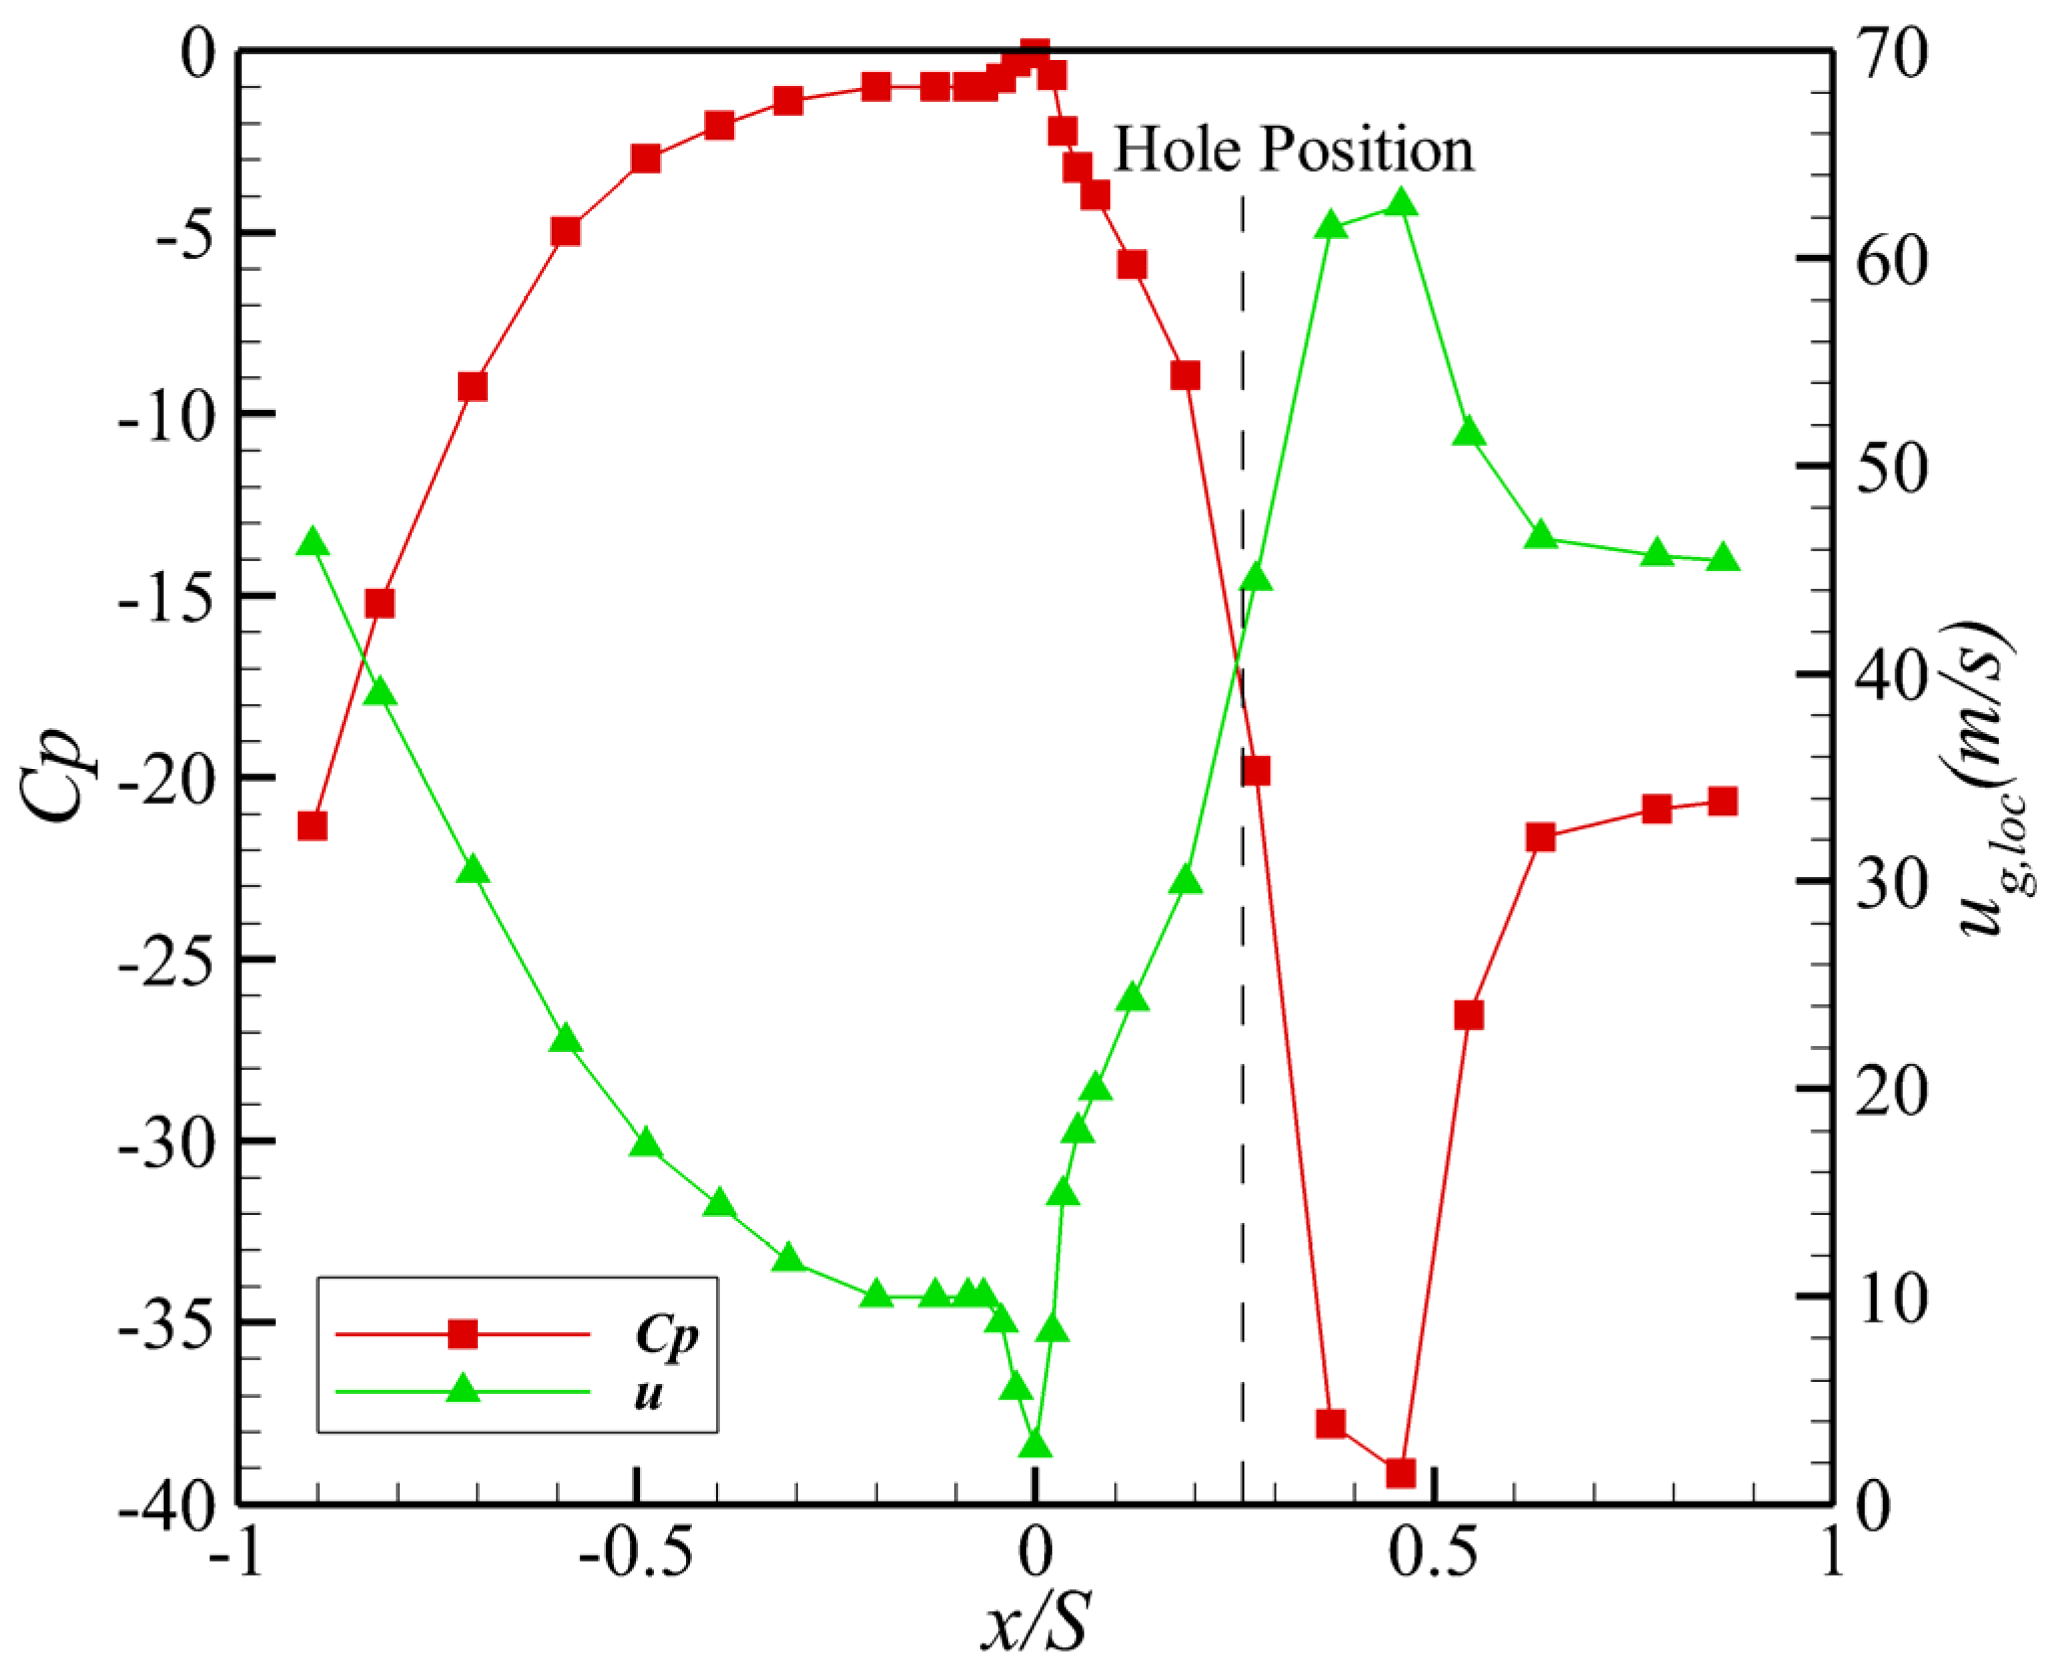
3.1. Pressure Coefficient

Figure 7 shows the pressure coefficient (Cp) and local velocity as functions of position in the middle section of the vane. The horizontal coordinate x/S is the relative arc length, positive on the suction side, and negative on the pressure side. On the pressure side, the Cp decreases and the mainstream speed gradually rises along the flow direction. The closer to the trailing edge, the more obvious the acceleration. On the suction side, the Cp decreases sharply with an increase of x/S in the region 0 < x/S < 0.45, and the mainstream velocity increases sharply. The mainstream transitions from a favorable pressure gradient to an adverse pressure gradient at x/S = 0.45. For x/S > 0.45, the Cp increases and the velocity decreases as x/S increases. The film hole exit is located at x/S = 0.26, and the measurement range of the infrared camera is 0.242 < x/S < 0.407—a range that is located completely in the favorable pressure gradient region.

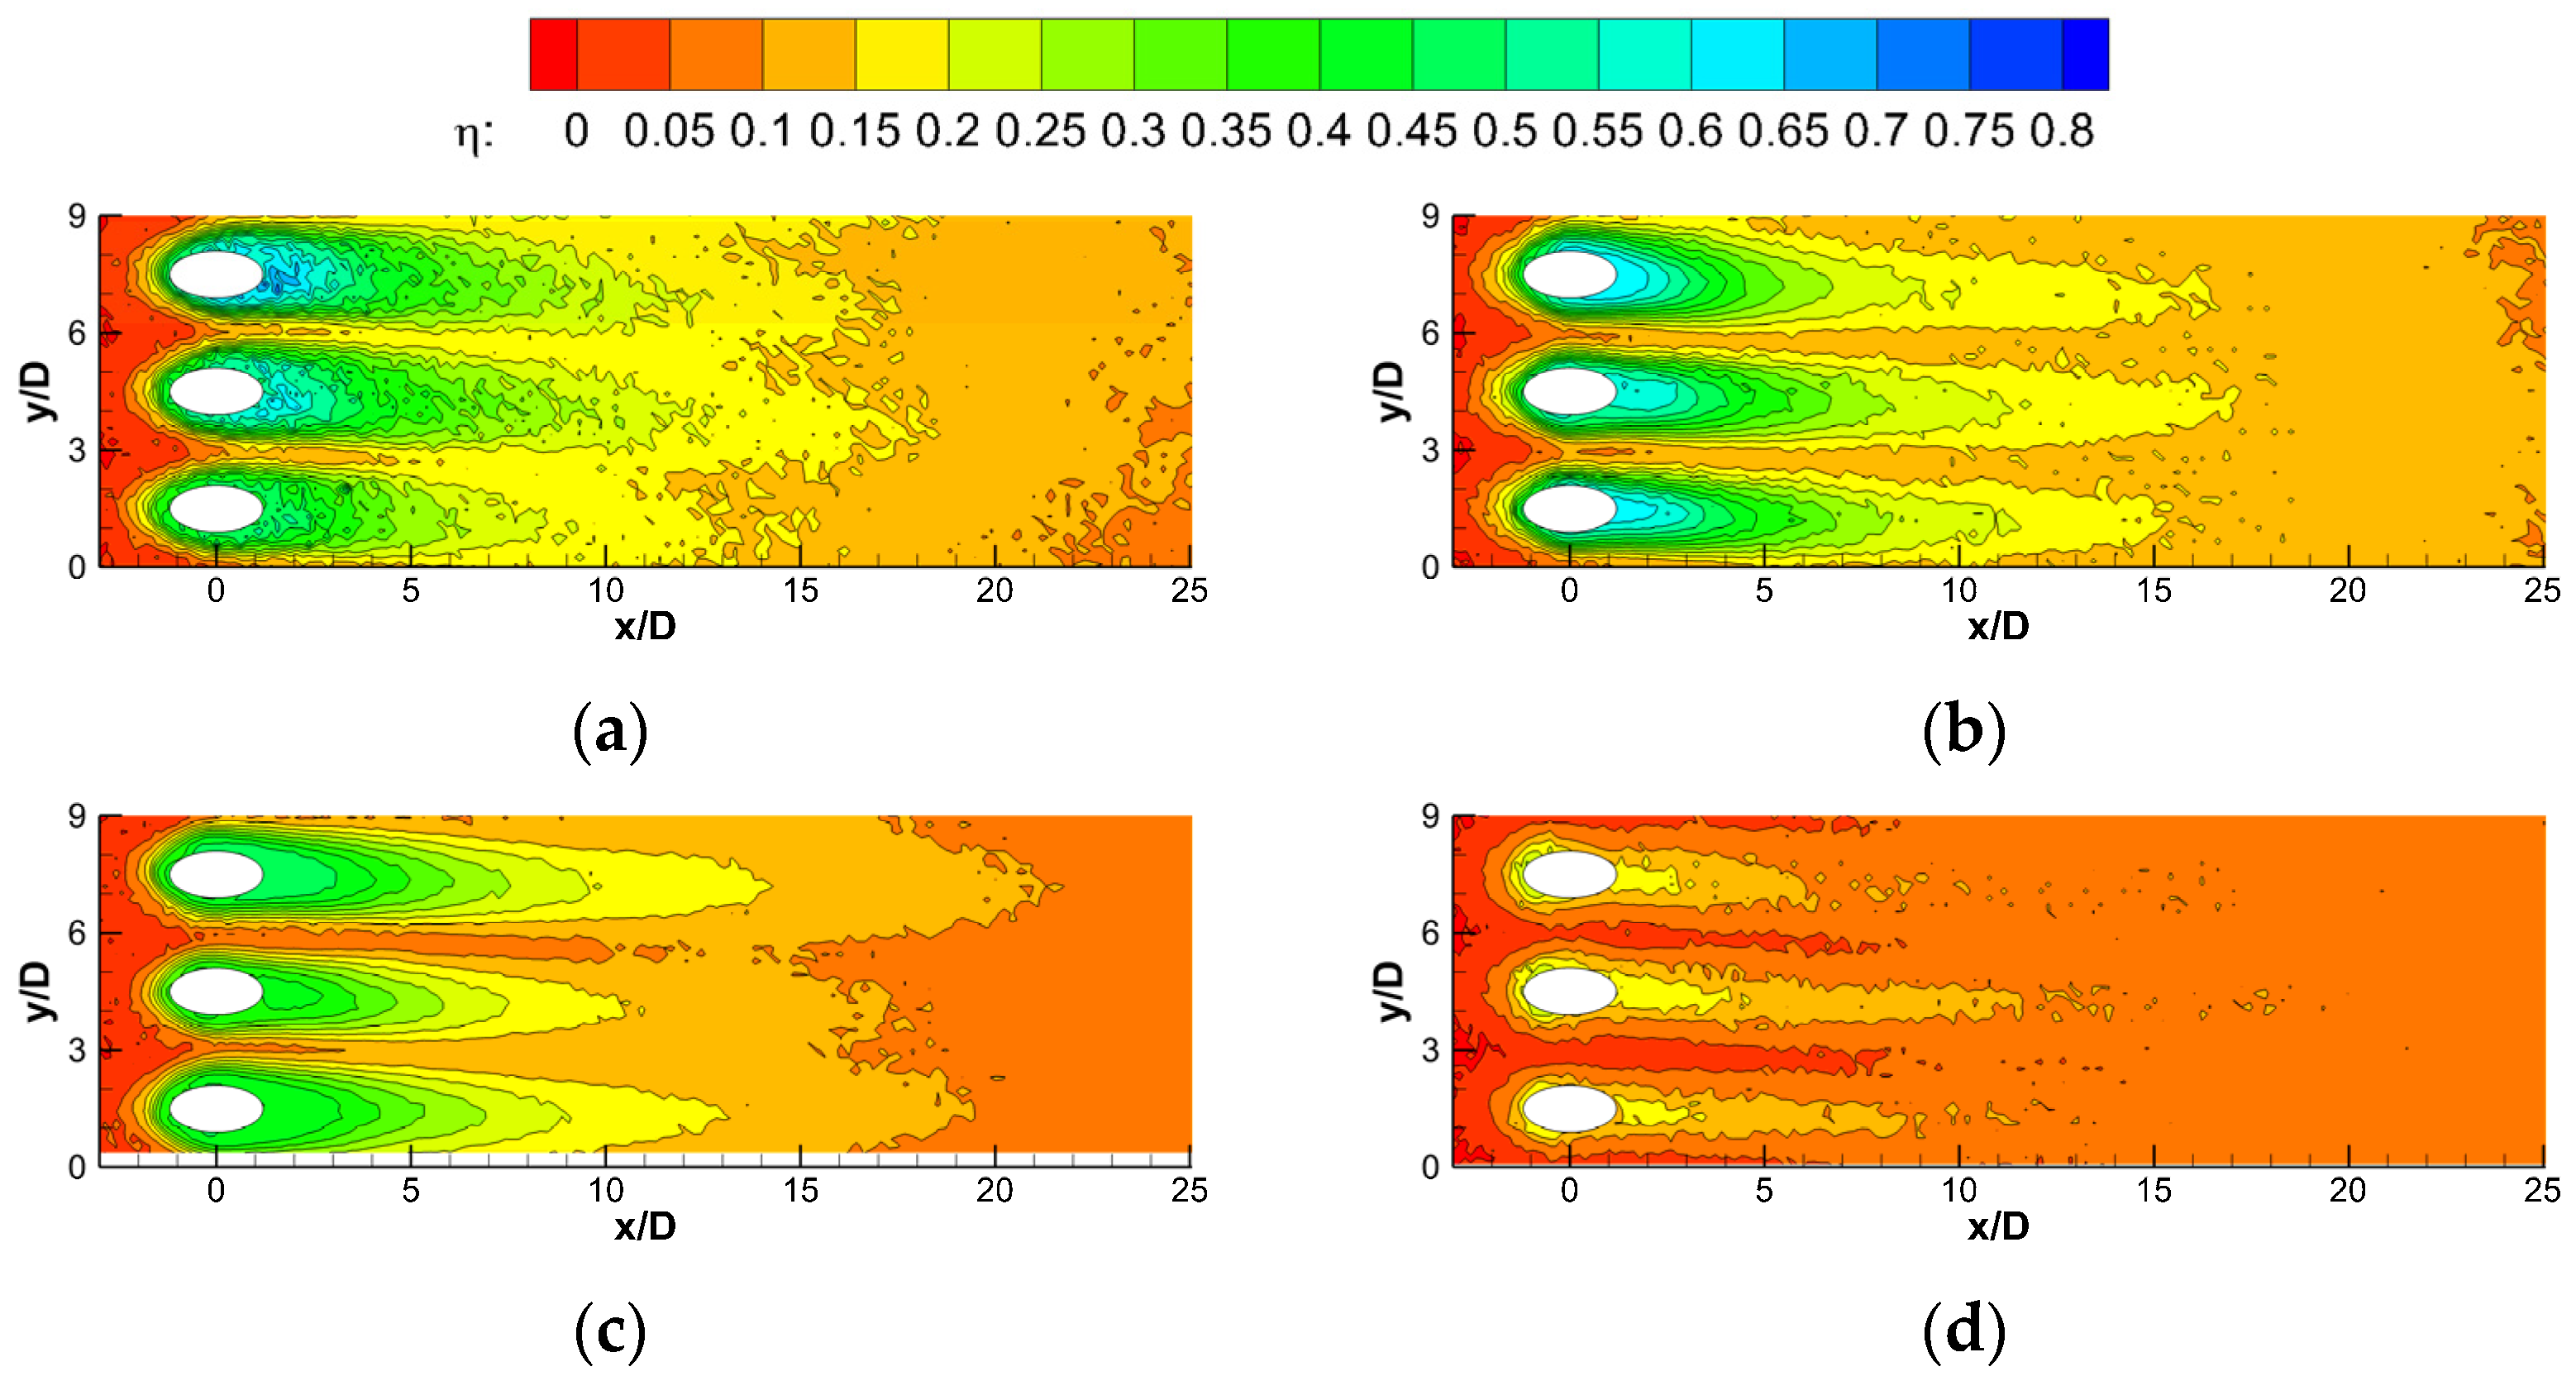
3.2. Effect of Blockage Ratio on the Distribution of Film Effectiveness

The effect of the blockage ratio on the distribution of film effectiveness at M = 0.7 is shown in Figure 8. The results for three film holes near the middle section were selected for analysis. The region with a film effectiveness greater than 0.2 is defined as the region of high effectiveness. As shown in the Figure 8a, the spanwise coverage of the film is widest without blockage inside the hole. At the hole exit, the vane surface is almost wholly covered by the region of high effectiveness in the spanwise direction, covering about 12 D downstream from the hole, and the spanwise coverage width decays slowly. At a blockage ratio of 0.2, the region of high effectiveness is clearly narrowed, showing a significant contraction trend, while the coverage length also decreases slightly. It is worth noting that local film effectiveness close to the hole exit is higher than the unblocked model. This is because a small blockage ratio does not significantly increase the outflow momentum of secondary flow, while the deposition in the hole makes the angular trailing edge of the original film hole exit become smooth, with the exit trailing edge of the hole changing from an ellipse to a straight line. These changes improve the adhesion of the secondary flow at the region close to the hole exit. At a blockage ratio of 0.5, effectiveness is completely less than 0.5 in the target region, the region of high effectiveness further decreases, and the coverage length decreases to 9 D. At this time, although the deposition inside the hole makes the hole exit smoother, the lifting effect caused by the blockage bulge significantly increases the normal momentum of secondary flow at the film hole exit. This causes an enhancement of secondary flow penetration into the mainstream and a decrease of secondary flow adhesion. For the blockage ratio of 0.8, the film coverage seriously deteriorates, and the region of high effectiveness disappears completely. The minimum cross-sectional area is reduced by extensive deposition inside the hole, resulting in an increase in the magnitude of the momentum of the secondary flow. In addition, the outflow angle of secondary flow is increased due to the uplift of deposition, which increases the proportion of the normal component of the secondary flow momentum. Both of these two points increase the normal momentum of the secondary flow, resulting in significant separation.
The effect of blockage ratio on the distribution of film effectiveness at M = 1.05 is shown in Figure 9. Effectiveness is improved in most regions because the secondary flow supply is more adequate than for a blowing ratio of 0.7. In addition, the regions of the unblocked model with high effectiveness are connected with each other, showing a whole sheet distribution and covering up to 20 D. With an increase of the blockage ratio, the spanwise inhomogeneity of film effectiveness increases, and the trend toward a long-strip distribution is gradually highlighted. At a blockage ratio of 0.2, the region of high effectiveness changes from a whole sheet distribution to an interval and discrete strip distribution, covering up to 17 D. At a blockage ratio of 0.5, the region of high effectiveness extends in the flow direction and shrinks in the spanwise direction relative to the behavior at a blockage ratio of 0.2, showing a slender distribution trend and covering up to 18 D downstream from the hole. At a blockage ratio of 0.8, effectiveness deteriorates significantly, and the region of high effectiveness is greatly reduced. However, the film cooling performance significantly improves due to a more adequate secondary flow as the blowing ratio increases from 0.7 to 1.05.
The effect of blockage ratio on the distribution of film effectiveness at M = 1.4 is shown in Figure 10. Compared to M = 1.05, film effectiveness continues to increase in most areas when the blockage ratio is 0.8. However, effectiveness close to the hole exit of the other three blockage ratios decreases by varying degrees. In addition, effectiveness is significantly enhanced at the region beyond 10 D. This is due to the fact that a slight flow separation occurs at the hole outlet with the momentum of secondary flow increasing, and then reattaches downstream. The attenuation trend of film effectiveness is obviously slowed down, and the film coverage is large and relatively uniform.
In general, with an increase of the blockage ratio, the film spanwise expansion gradually weakens, and the coverage width gradually decreases. At a small blockage ratio of 0.2, the film hole exit becomes smoother due to the blockage, which partially offsets the adverse effects due to the blockage, and film effectiveness decreases only slightly. However, with the blockage ratio continuing to increase, effectiveness decreases sharply. As the blowing ratio increases, effectiveness beyond 10 D keeps increasing. Due to the slight separation at a large blowing ratio, effectiveness close to the hole exit first increases and then decreases with the improvement of the blowing ratio.

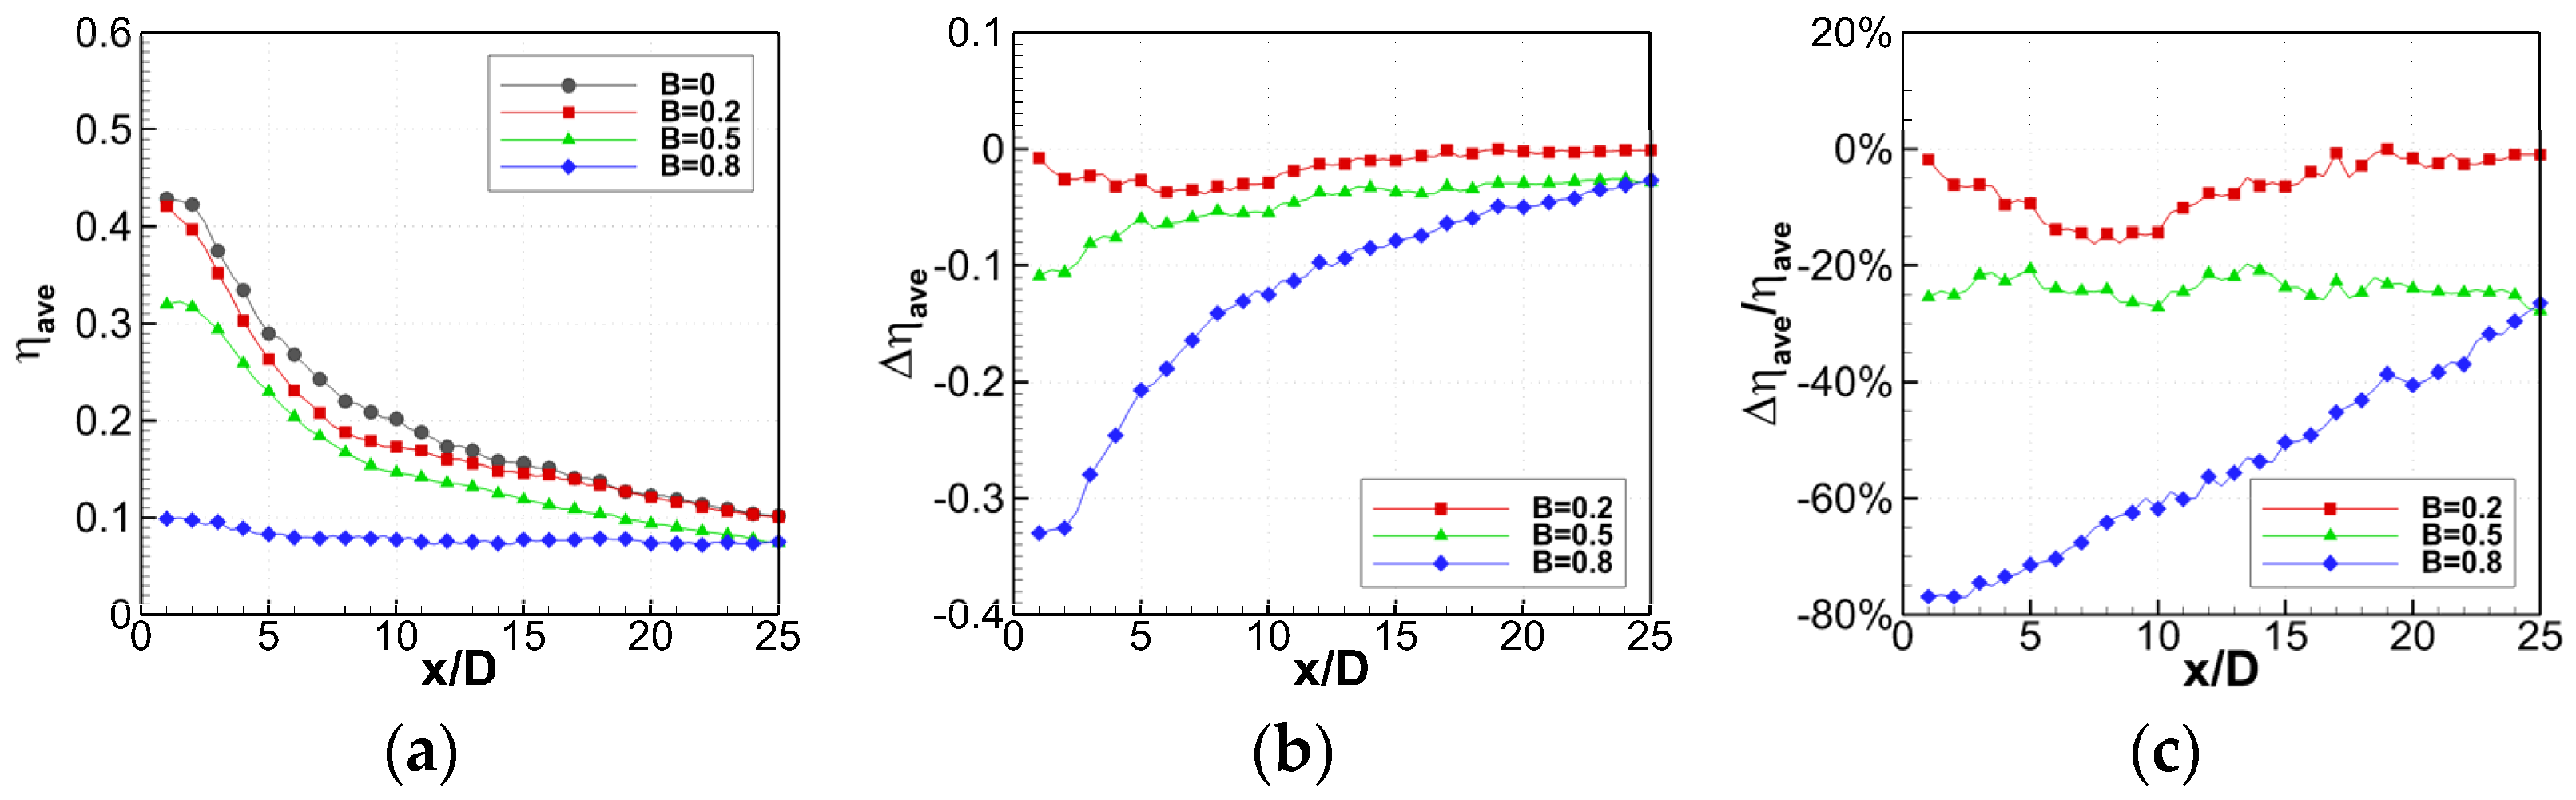
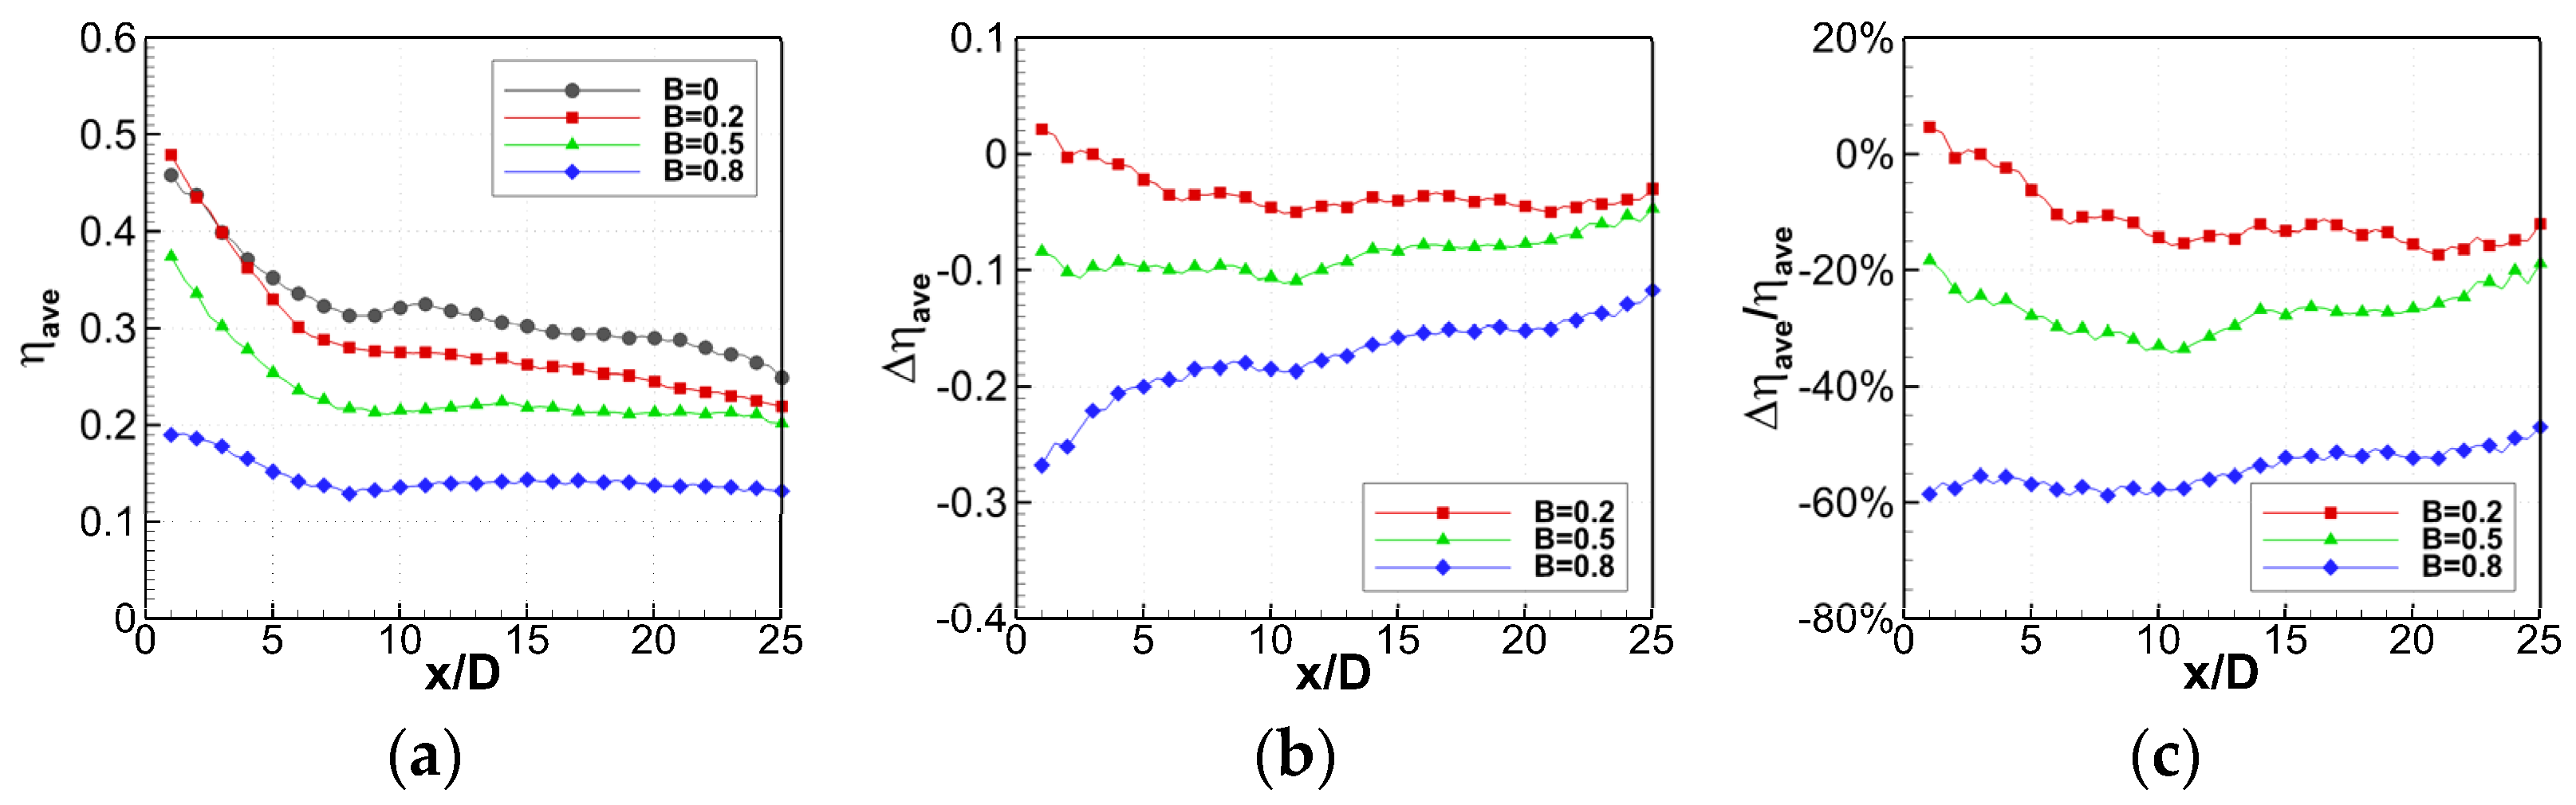
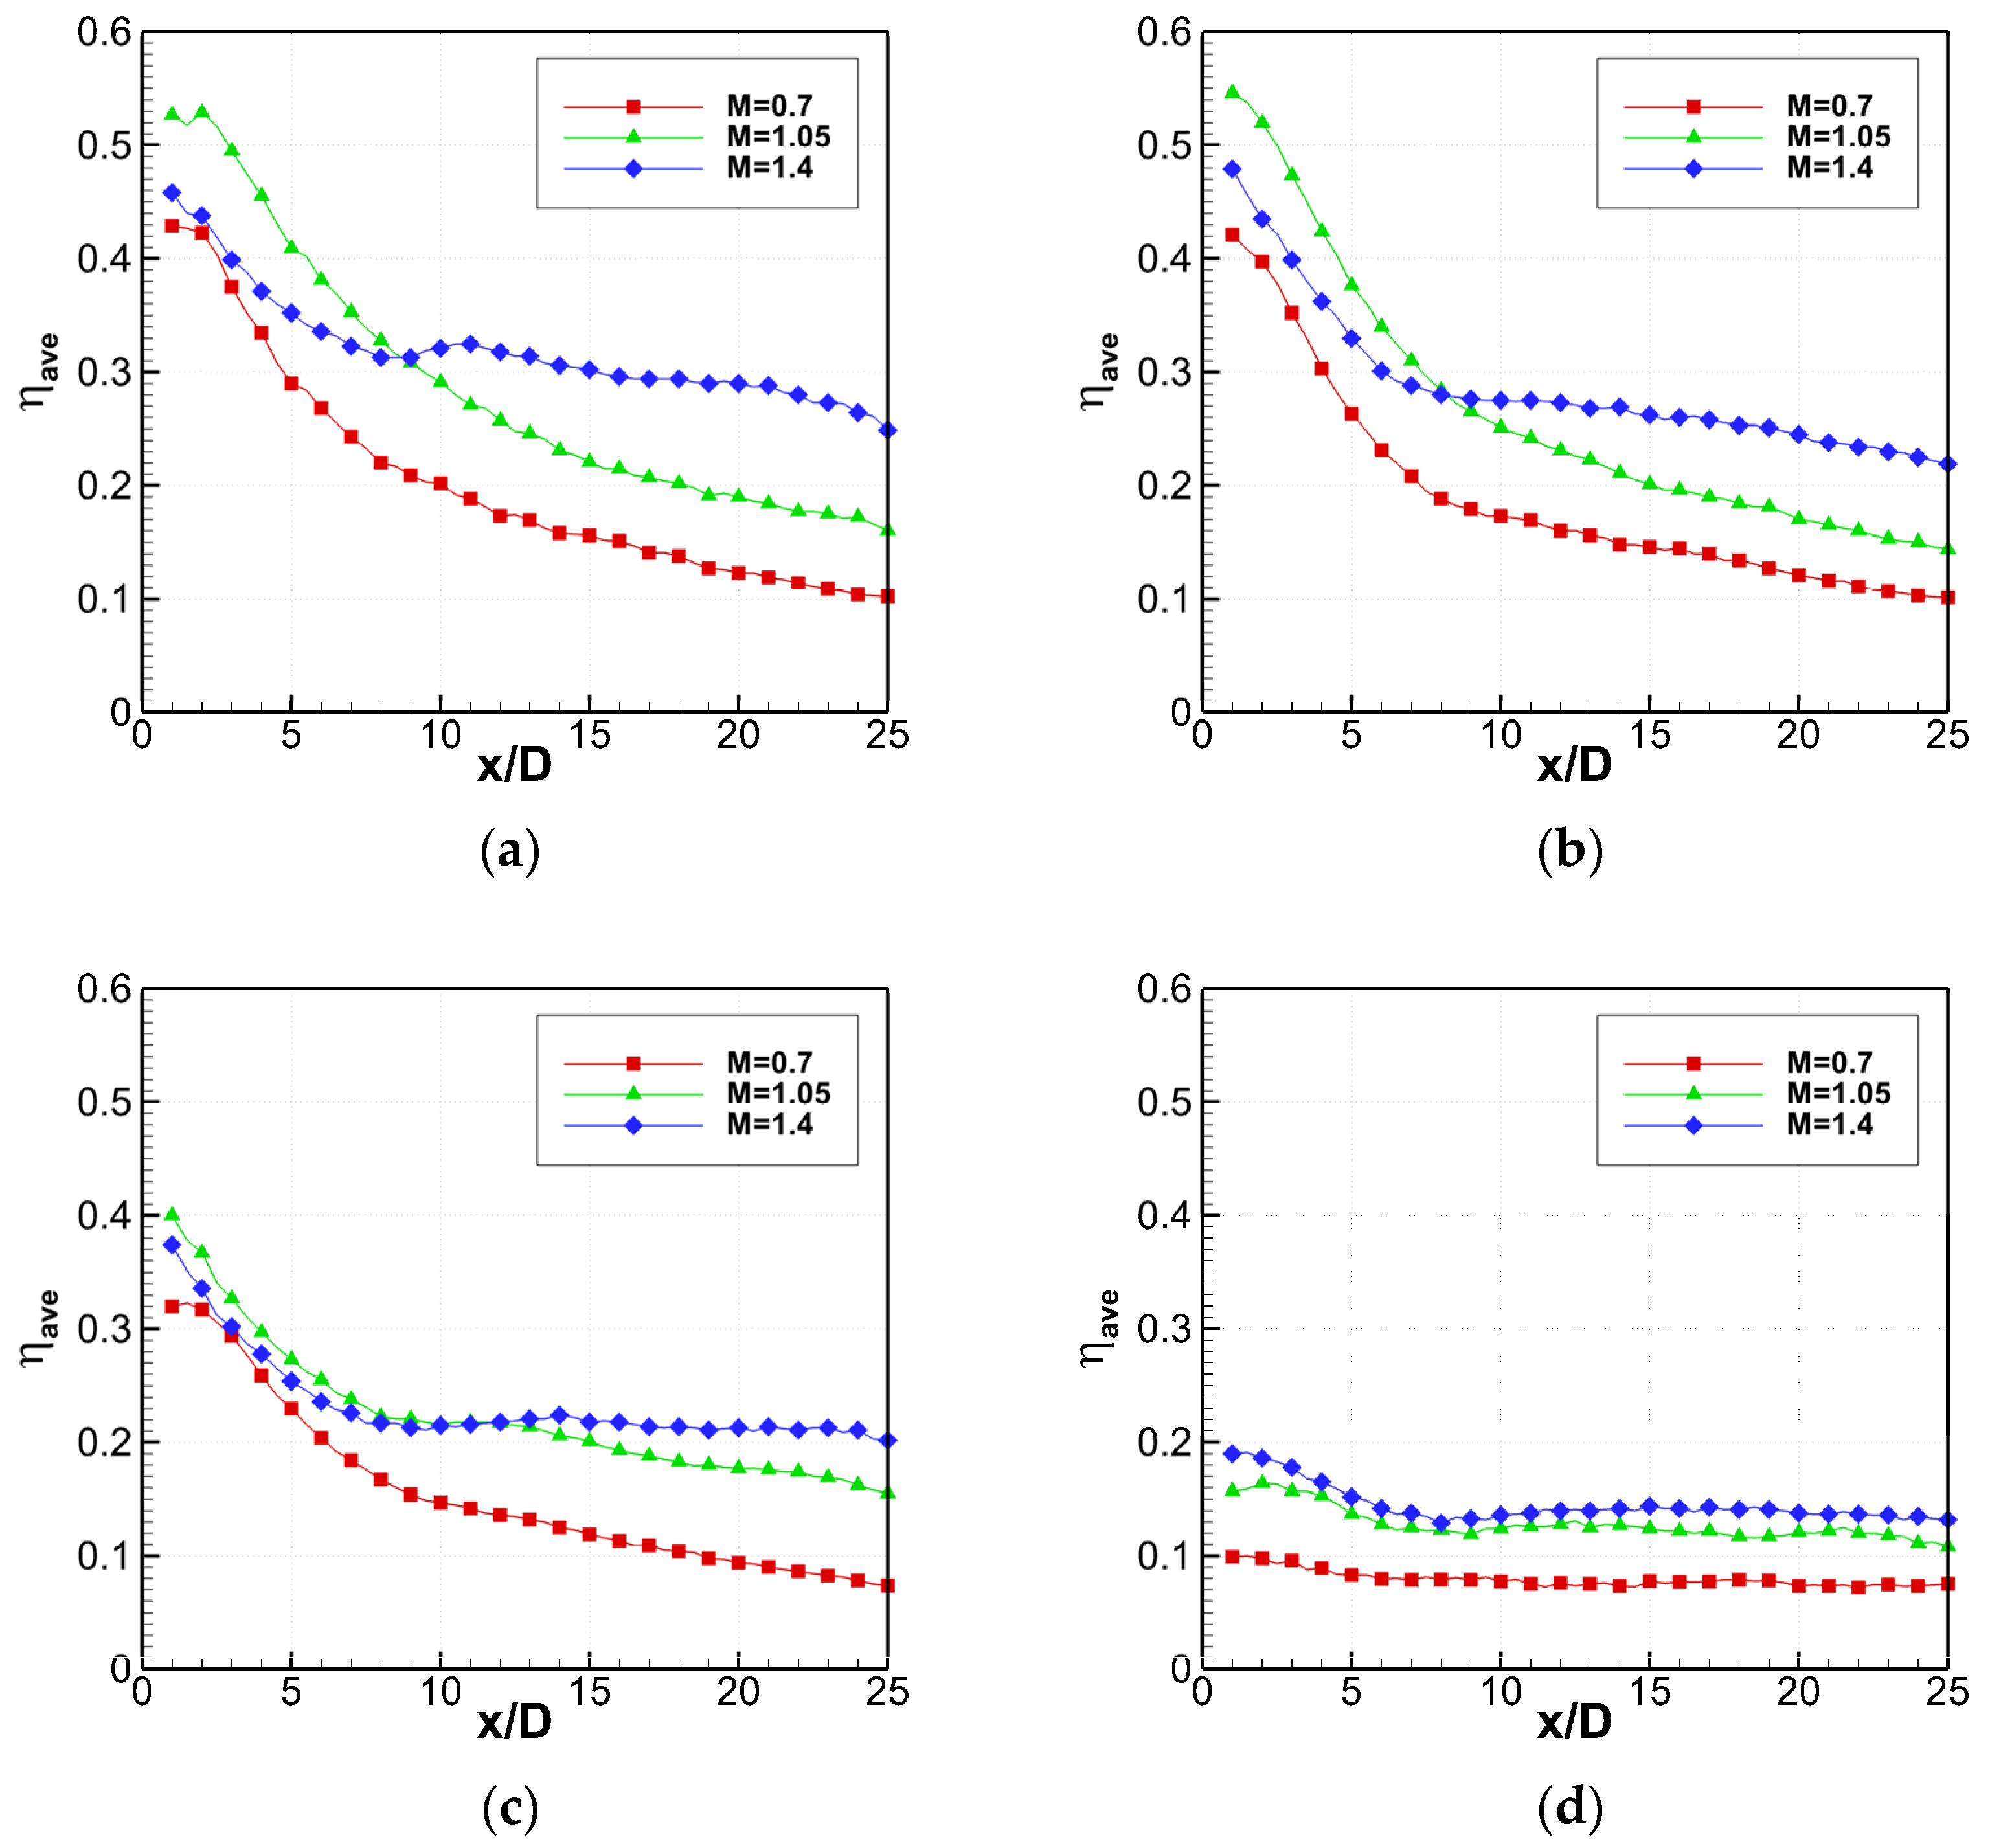
3.3. Effect of Blockage Ratio on Spanwise Averaged Film Effectiveness

The distribution of spanwise averaged film effectiveness with different blockage ratios at M = 0.7 is shown in Figure 11. The maximum is about 0.43 for the case of no blockage inside the hole, and it decreases gradually with an increase of x/D. The reasons are that the secondary flow temperature gradually approaches the mainstream temperature due to the continuous mixing, the heat exchange between mainstream and secondary flow, and the counter rotating vortex pair continuously entraining the mainstream into the film coverage region. It can also be found that spanwise averaged film effectiveness decreases as the blockage ratio increases. At a blockage ratio of 0.2, there was only a small decrease of 0.04 and a maximum relative decrease of 17% compared with the case without blockage, and there was almost no decrease beyond 15 D. At a blockage ratio of 0.5, the decrease of the spanwise averaged film effectiveness became obvious, with a maximum decrease of 0.11 at the near-hole region and a maximum relative decrease of more than 25%. At a blockage ratio of 0.8, it decreases significantly, with a maximum value of only about 0.1, which slightly decreases as x/D increases. Compared with the two-dimensional distribution of film effectiveness, it is very small both near a hole and far from it, and the coverage of the film is also the narrowest. Meanwhile, the decrease of spanwise averaged film effectiveness due to blockage is mainly concentrated at the region within 10 D, and the largest decrease is 0.33.
The distribution of spanwise averaged film effectiveness with different blockage ratios at M = 1.05 is shown in Figure 12. It is similar to the case of M = 0.7. The difference is that spanwise averaged film effectiveness at x/D = 1 is slightly higher than that without blockage, by 0.03 at a blockage ratio of 0.2. However, it begins to be lower than the unblocked situation at 2 D and lower than for the blockage ratio of 0.5 at 20 D. In addition, it decreases significantly at the blockage ratio of 0.5, with the maximum decrease being 0.13 with a relative decrease of 24%. The downward trend of spanwise averaged film effectiveness is obviously slowed starting at 10 D. It is only 0.005 lower than without blockage at 25 D, where the relative decrease is only 3.5%. Spanwise averaged film effectiveness decreases significantly at a blockage ratio of 0.8, but it is very little affected by how far downstream it is.
The distribution of spanwise averaged film effectiveness with different blockage ratios at M = 1.4 is shown in Figure 13. The attenuation of spanwise averaged film effectiveness decreases slightly near the hole exit, and it increases appreciably at the region beyond 10 D, more than for M = 1.05. At the small blockage ratio of 0.2, it also slightly increases at x/D = 1, by 0.02 compared to the unblocked case. At a blockage ratio of 0.5, the decrease at the near-hole region is less than the case of a small blowing ratio; the maximum decrease at the region within 10 D is 0.1. However, the decrease at the region beyond 10 D increases, with the maximum decrease exceeding 0.11 and the maximum relative decrease approaching 35%. At the large blockage ratio of 0.8, the decrease of spanwise averaged film effectiveness is still the most serious. Different from the case of M = 1.05, the decrease of spanwise averaged film effectiveness caused by blockage near the hole exit is weakened, but the influence is significantly enhanced beyond 10 D.
The distribution of spanwise averaged film effectiveness with various blowing ratios at the blockage ratios of 0, 0.2, 0.5, and 0.8 is shown in Figure 14. As the blowing ratio increases from 0.7 to 1.05, spanwise averaged film effectiveness increases at blockage ratios of 0, 0.2, and 0.5. However, when the blowing ratio increases further from 1.05 to 1.4, it decreases slightly in the near-hole region, starting to increase after 10 D. This is because the larger blowing ratio leads to the increase of momentum of the secondary flow, and a slight separation occurs after outflow. When the blockage ratio is 0.8, spanwise averaged film effectiveness always improves as the blowing ratio increases.

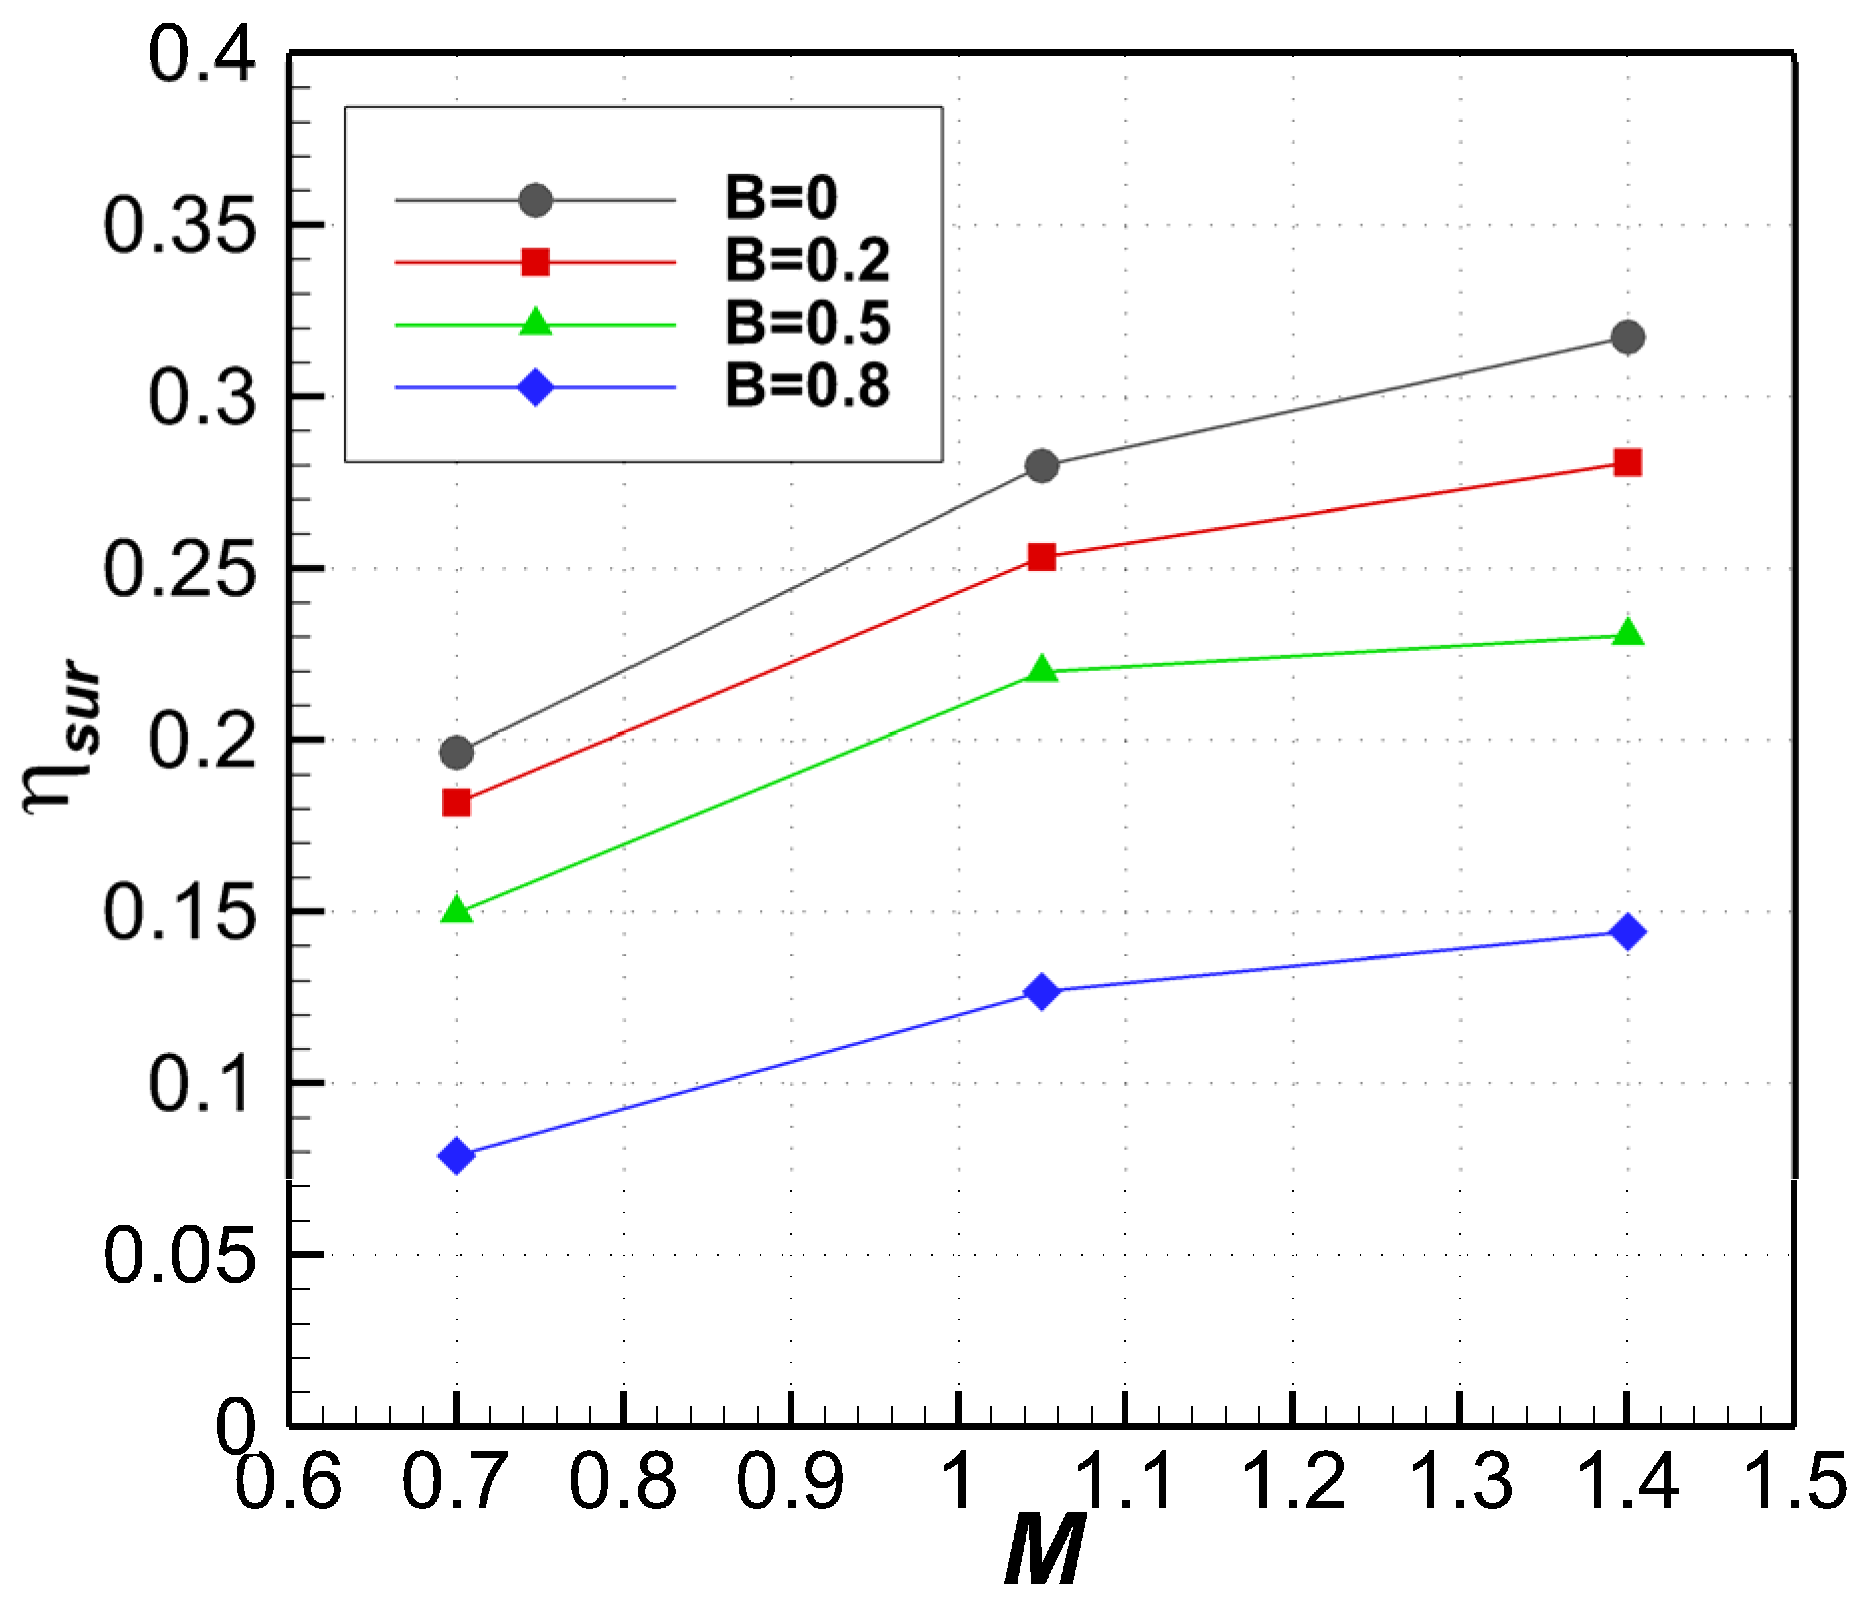
3.4. Effect of Blockage Ratio on Surface Averaged Film Effectiveness

Figure 15 shows the surface averaged film effectiveness for different cases. Both the blockage ratio and blowing ratio have significant effects on surface averaged film effectiveness. For example, it increases with an increase of the blowing ratio and decreases with an increase of the blockage ratio. It is noteworthy that the blockage ratio has a small impact at small blockage ratios but a sharp increase in film effectiveness when the blockage ratio is large. This is because a small blockage ratio has little effect on the outlet momentum and outflow angle, but the effect increases significantly when the blockage ratio is large. For the case of blowing ratios from 0.7 to 1.4, surface averaged film effectiveness decreases by 7–11% at a blockage ratio of 0.2, 21–27% at a blockage ratio of 0.5, and 55–60% at a blockage ratio of 0.8.

4. Conclusions

The distribution of film effectiveness on the suction side of a turbine guide vane was measured by an infrared camera in this study. Film cooling performance degradation trends were analyzed based on variations in film effectiveness across vanes with various blockage ratios.
  • The coverage of secondary flow and the cooling performance of vanes are both perfect in the case without blockage. However, the film effectiveness would be reduced and its spanwise inhomogeneity would be increased due to the blockage. This effect was not obvious when the blockage ratio was less than 0.2, but with the increase of the blockage ratio, the cooling performance of the vane deteriorated rapidly because of the flow separation caused by the blockage.
  • The degradation of spanwise averaged film effectiveness was very small when the blocking ratio was small, but it became serious when the blocking ratio was large. Moreover, the degradation of spanwise averaged film effectiveness was most significant only within 10 D, and the attenuation also became serious with the increase of blowing ratio at the region beyond 10 D.
  • The degradation trend of surface averaged film effectiveness due to blockage was the same as that of spanwise averaged film effectiveness. At the blowing ratio of 0.7, the surface averaged film effectiveness under different blockage ratios decreased by 7%, 24% and 60%, respectively.
  • To ensure the safe operation of the engine, special attention should be paid to the control of blockage inside film holes during the preparation of thermal barrier coating and vanes operation. In addition, the optimal blowing ratio should be reduced as much as possible in the design process to avoid a large blow ratio, under which the cooling performance was most obviously affected by the blockage.

Author Contributions

Devising the experiment, writing—original draft preparation, W.Z.; conducting the experiment, writing—review and editing, R.Z.; data processing, S.L.; investigation, G.L. All authors have read and agreed to the published version of the manuscript.

Funding

This research was funded by the Key Basic Research Project of the National Defense Science and Technology Foundation Strengthening Program, grant number 2017-JCJQ-ZD-031-00.

Acknowledgments

The authors are thankful to the Liaoning Key Laboratory of Advanced Measurement and Test Technology for Aviation Propulsion System for the support in the testing and acknowledge Yunxiu Guo for his help with our paper.

Conflicts of Interest

The authors declare no conflict of interest.

Nomenclature

AArea of cylindrical film hole section, m2
BBlockage ratio: t/D
CpPressure coefficient: ( p g , l o c p g , i n * ) / ( p g , i n * p g , i n )
DDiameter of film hole without blockage, m
kPitch of film hole, m
LChord length, m
lFilm hole length, m
MBlowing ratio: ( ρ c u c ) / ( ρ g , l o c u g , l o c ) = m ˙ / ( ρ g , l o c u g , l o c A )
m ˙ Mass flow rate through film hole: ρ c u c A , kg/s
mSpanwise pixel number of the measurement region
nArc pixel number of the measurement region
PPitch of vane, m
pStatic pressure, Pa
p*Total pressure, Pa
ReInlet Reynolds number: ρ g , i n u g , i n L / μ g , i n
rFillet radius of blockage, m
SArc length, m
TTemperature, K
tBlockage height, m
uVelocity, m/s
Greek symbols
αInjection angle of film hole, °
β 1 Inlet angle of mainstream, °
β 2 Exit angle of mainstream, °
γRepose angle of blockage, °
ηFilm effectiveness: ( T g T a w ) / ( T g T c )
η a v e Spanwise averaged film effectiveness: i = i n η / n
η ( s u r , a v e ) Surface averaged film effectiveness: j = 1 m i = 1 n η / m n
λThermal conductivity, W/(m·K)
μDynamic viscosity, kg/(m·s)
ρDensity, kg/m3
Subscripts
awAdiabatic wall
cSecondary flow
gMainstream
locLocal
wWall

References

  1. Han, J.C.; Dutta, S.; Ekkad, S. Gas Turbine Heat Transfer and Cooling Technology, 2nd ed.; CRC Press: Boca Raton, FL, USA, 2012; pp. 1–5. [Google Scholar] [CrossRef]
  2. Han, J.C. Fundamental Gas Turbine Heat Transfer. J. Therm. Sci. Eng. Appl. 2013, 5, 1–15. [Google Scholar] [CrossRef]
  3. Bunker, R.S. Evolution of Turbine Cooling. In Proceedings of the ASME Turbo Expo 2017: Turbomachinery Technical Conference and Exposition, Charlotte, NC, USA, 26–30 June 2017. [Google Scholar] [CrossRef]
  4. Goldstein, R.J. Film Cooling. Adv. Heat Transf. 1971, 7, 321–379. [Google Scholar] [CrossRef]
  5. Xu, H.; Gong, S.; Deng, L. Preparation of Thermal Barrier Coatings for Gas Turbine Blades by EB-PVD. Thin Solid Film. 1998, 334, 98–102. [Google Scholar] [CrossRef]
  6. Bogard, D.G.; Thole, K.A. Gas Turbine Film Cooling. J. Propuls. Power 2006, 22, 249–270. [Google Scholar] [CrossRef] [Green Version]
  7. Bunker, R.S. A Review of Shaped Hole Turbine Film-Cooling Technology. J. Heat Transf. 2005, 127, 441–453. [Google Scholar] [CrossRef]
  8. Han, J.C.; Ekkad, S. Recent Development in Turbine Blade Film Cooling. Int. J. Rotating Mach. 2001, 7, 21–40. [Google Scholar] [CrossRef]
  9. Sahith, M.S.; Giridhara, G.; Kumar, R.S. Development and Analysis of Thermal Barrier Coatings on Gas Turbine Blades—A Review. Mater. Today Proc. 2018, 5, 2746–2751. [Google Scholar] [CrossRef]
  10. Nemdili, F.; Azzi, A.; Jubran, B.A. Numerical Investigation of the Influence of a Hole Imperfection on Film Cooling Effectiveness. Int. J. Numer. Methods Heat Fluid Flow 2011, 21, 46–60. [Google Scholar] [CrossRef]
  11. Bogard, D.G.; Schmidt, D.L.; Tabbita, M. Characterization and Laboratory Simulation of Turbine Airfoil Surface Roughness and Associated Heat Transfer. J. Turbomach. 1998, 120, 337–342. [Google Scholar] [CrossRef]
  12. Krishna Anand, V.G.; Parammasivam, K.M. Thermal Barrier Coated Surface Modifications for Gas Turbine Film Cooling: A Review. J. Therm. Anal. Calorim. 2021, 146, 545–580. [Google Scholar] [CrossRef]
  13. Wang, J.; Tian, K.; Zhang, K.; Baleta, J.; Sunden, B. Effect of Spherical Blockage Configurations on Film Cooling. Therm. Sci. 2018, 22, 1933–1942. [Google Scholar] [CrossRef]
  14. Demling, P.; Bogard, D.G. The Effects of Obstructions on Film Cooling Effectiveness on the Suction Side of a Gas Turbine Vane. In Proceedings of the ASME Turbo Expo 2006: Power for Land, Sea, and Air, Barcelona, Spain, 8–11 May 2006. [Google Scholar] [CrossRef]
  15. Bunker, R.S. Effect of Partial Coating Blockage on Film Cooling Effectiveness. In Proceedings of the ASME Turbo Expo 2000: Power for Land, Sea, and Air, Munich, Germany, 8–11 May 2000. [Google Scholar] [CrossRef]
  16. Chen, X.; Wang, Y.; Long, Y.; Weng, S. Effect of Partial Blockage on Flow and Heat Transfer of Film Cooling with Cylindrical and Fan-Shaped Holes. Int. J. Therm. Sci. 2021, 164, 106866. [Google Scholar] [CrossRef]
  17. Whitfield, C.A.; Schroeder, R.P.; Thole, K.A.; Lewis, S.D. Blockage Effects from Simulated Thermal Barrier Coatings for Cylindrical and Shaped Cooling Holes. J. Turbomach. 2015, 137, 091004. [Google Scholar] [CrossRef] [Green Version]
  18. Jovanovic´, M.B.; de Lange, H.C.; van Steenhoven, A.A. Influence of Laser Drilling Imperfection on Film Cooling Performances. In Proceedings of the ASME Turbo Expo 2005: Power for Land, Sea, and Air, Reno, NV, USA, 6–9 June 2005. [Google Scholar] [CrossRef]
  19. Huang, K.; Zhang, J.; Tan, X.; Shan, Y. Experimental Study on Film Cooling Performance of Imperfect Holes. Chin. J. Aeronaut. 2018, 31, 1215–1221. [Google Scholar] [CrossRef]
  20. Wang, F.Q.; Pu, J.; Wang, J.H.; Xia, W.D. Numerical Investigation of Effects of Blockage, Inclination Angle, and Hole-Size on Film Cooling Effectiveness at Concave Surface. J. Turbomach. 2021, 143, 021007. [Google Scholar] [CrossRef]
  21. Williams, R.P.; Dyson, T.E.; Bogard, D.G.; Bradshaw, S.D. Sensitivity of the Overall Effectiveness to Film Cooling and Internal Cooling on a Turbine Vane Suction Side. J. Turbomach. 2013, 136, 031006. [Google Scholar] [CrossRef]
  22. Zhang, L.; Yin, J.; Moon, H.K. The Effect of Compound Angle on Nozzle Suction Side Film Cooling. In Proceedings of the ASME Turbo Expo 2012: Turbine Technical Conference and Exposition, Copenhagen, Denmark, 11–15 June 2012. [Google Scholar] [CrossRef]
  23. Forghan, F.; Askari, O.; Narusawa, U.; Metghalchi, H. Cooling of Turbine Blade Surface with Expanded Exit Holes: Computational Suction-Side Analysis. J. Energy Resour. Technol. 2016, 138, 051602. [Google Scholar] [CrossRef]
  24. Liu, C.; Zhang, F.; Zhang, S.; Shi, Q.; Song, H. Experimental Investigation of the Full Coverage Film Cooling Effectiveness of a Turbine Blade with Shaped Holes. Chin. J. Aeronaut. 2022, 35, 297–308. [Google Scholar] [CrossRef]
  25. Gao, Z.; Narzary, D.P.; Han, J.C. Film Cooling on a Gas Turbine Blade Pressure Side or Suction Side with Axial Shaped Holes. Int. J. Heat Mass Transf. 2008, 51, 2139–2152. [Google Scholar] [CrossRef]
  26. Gao, Z.; Narzary, D.P.; Han, J.C. Film-Cooling on a Gas Turbine Blade Pressure Side or Suction Side with Compound Angle Shaped Holes. J. Turbomach. 2009, 131, 011019. [Google Scholar] [CrossRef]
  27. Li, H.; Zhou, Z.; Xie, G.; Xia, S.; Tao, Z. The Cooling Performance of Multiple Rows of Film Holes on the Suction Surface of a Turbine Blade under Rotating Conditions. Appl. Therm. Eng. 2021, 188, 116125. [Google Scholar] [CrossRef]
  28. Zhou, Z.; Li, H.; Xie, G.; Xia, S.; Zhou, J. The Cooling Performance of Three-Row Compound Angle Holes on the Suction Surface of a Rotating Turbine Blade. Propuls. Power Res. 2021, 10, 23–36. [Google Scholar] [CrossRef]
  29. Li, H.; Zhao, G.; Zhou, Z.; Wang, H.; You, R. The Characteristics and Divergence of Fan-Shaped and Cylindrical Holes on the Suction Side of a Turbine Blade under Rotating Conditions. Int. J. Heat Mass Transf. 2019, 139, 432–441. [Google Scholar] [CrossRef]
  30. Moffat, R.J. Describing the Uncertainties in Experimental Results. Exp. Therm. Fluid Sci. 1988, 1, 3–17. [Google Scholar] [CrossRef] [Green Version]
Figure 1. Experimental wind tunnel system.
Energies 15 02935 g001
Figure 2. Photo of wind tunnel setup.
Energies 15 02935 g002
Figure 3. Test section.
Energies 15 02935 g003
Figure 4. Calibration curve of infrared camera.
Energies 15 02935 g004
Figure 5. Blockage of film cooling hole exit. (a) Photo of blockage [5]; (b) schematic diagram of blockage.
Energies 15 02935 g005
Figure 6. Positions of static pressure measurement points.
Energies 15 02935 g006
Figure 7. Dependence of pressure coefficient and local velocity on position in the middle section of the vane.
Energies 15 02935 g007
Figure 8. Distribution of film effectiveness at different blockage ratios, M = 0.7. (a) B = 0; (b) B = 0.2; (c) B = 0.5; (d) B = 0.8.
Energies 15 02935 g008
Figure 9. Distribution of film effectiveness at different blockage ratios, M = 1.05. (a) B = 0; (b) B = 0.2; (c) B = 0.5; (d) B = 0.8.
Energies 15 02935 g009
Figure 10. Distribution of film effectiveness at different blockage ratios, M = 1.4. (a) B = 0; (b) B = 0.2; (c) B = 0.5; (d) B = 0.8.
Energies 15 02935 g010
Figure 11. Effect of blockage ratio on spanwise averaged film effectiveness at M = 0.7. (a) ηave; (b) ∆ηave; (c) ∆ηave/ηave.
Energies 15 02935 g011
Figure 12. Effect of blockage ratio on spanwise averaged film effectiveness at M = 1.05. (a) ηave; (b) ∆ηave; (c) ∆ηave/ηave.
Energies 15 02935 g012
Figure 13. Effect of blockage ratio on spanwise averaged film effectiveness at M = 1.4. (a) ηave; (b) ∆ηave; (c) ∆ηave/ηave.
Energies 15 02935 g013
Figure 14. Spanwise averaged film effectiveness at different blowing ratios. (a) B = 0; (b) B = 0.2; (c) B = 0.5; (d) B = 0.8.
Energies 15 02935 g014
Figure 15. Surface averaged film effectiveness at different blockage ratios.
Energies 15 02935 g015
Table 1. Vane cascade parameters.
ParameterValue
Chord length (L) [m]0.407 ± 0.0005
Pitch of vane (P) [m]0.28 ± 0.0005
Vane height [m]0.3 ± 0.0005
Inlet velocity [m/s]10 ± 0.05
Inlet Reynolds number, Re(3 ± 0.012) × 105
Inlet turbulence intensity1~2%
Inlet angle of mainstream (β1) [°]90 ± 0.1
Exit angle of mainstream (β2) [°]18.2 ± 0.1
Mainstream temperature [K]293 ± 1
Secondary flow temperature [K]313 ± 1
Density ratio ( ρ c / ρ g )0.936 ± 0.0005
Blowing ratio M0.7, 1.05, 1.4
Table 2. Film hole parameters.
BD [mm]l/Dk/Dt [mm]α [°]γ [°]r/D
0363030304/3
0.23630.630304/3
0.53631.530304/3
0.83632.430304/3
Publisher’s Note: MDPI stays neutral with regard to jurisdictional claims in published maps and institutional affiliations.

