Abstract
The braking system of a racing car is one of the main design challenges. The flow around and inside the wheel of an F1 car with all braking system components is analyzed in order to evaluate the heat transfer after a braking event. Very few studies have been published on this topic, mainly due to the high confidentiality level in the racing car sector. In the present work, using an actual geometry of an early 2000s F1 car, the braking system is simulated using a CFD approach. The boundary conditions for the wheel and brake system are taken from the simulation of a vehicle model with a front wing. Different heat transfer phenomena are progressively added to the model in order to understand their effects, including thermal convection only, radiation and conjugate heat transfer. Two different vehicle velocities are simulated to quantify and compare the heat removal after a braking event. The different heat transfer mechanisms have dramatic effects on the prediction of the brake cooling results, and these are quantified in order to understand the limitations of the simplified approaches. Finally, the influence of the ambient pressure at two different altitudes on the heat transfer from a braking event is studied.
1. Introduction
One of the most important components in a road vehicle is undoubtedly the braking system. The brakes must be able to reduce the kinetic and potential energy of the vehicle, converting it into thermal energy (heat). The rate of heat generation in a friction braking system depends on the mass of the vehicle, its speed and its deceleration rate. During the braking event, a large amount of heat is generated that must be absorbed in a short time by the brake components, which must also be efficient in the heat transfer process with external airflow. However, the technological constraints of the various components limit the heat that can be absorbed [1,2]. The heat must then be dissipated to achieve satisfactory performance [3]. Excessively high temperatures can be responsible for various problems, such as excessive component wear, squeal, judder and in extreme cases complete failure of the brakes [4].
During braking, the heat is generated by the friction between the brake rotor and the pad (lining) material. In the first part of the braking event, it has been established that the heat is absorbed by the adjacent components; however, as braking continues, heat is dissipated through convection to the atmosphere and conduction and radiation to nearby components. According to Limpert, the radiation heat transfer from the rotor has its greatest effect at higher temperatures [1]; it must be controlled to prevent serious damage. However, the convection with the surrounding airstream is the primary source of energy dissipation, meaning the use of the right flow path to cool the air is a crucial aspect of the braking system.
The study of car braking systems is both very difficult and strategic. A decisive increase in their development was achieved in racing cars, due to the high speeds involved and related high performance required of the braking system. Various systems for managing the thermal energy during braking have been studied so as not to lose energy into the atmosphere. The heat can be stored in special cells, which redistribute this energy only when needed [5]. For the above reasons, the aerodynamics of a brake system is a fundamental design consideration. Several works, both experimental [6,7] and numerical [8,9], have been presented. However, the attention has mainly been focused on the aerodynamic optimization of the vehicle performance, such as overall drag reductions. Few studies have been published on the aerodynamic cooling of automotive brakes. Stephens experimentally investigated the aerodynamic influence on the heat dissipation of brakes, using a complete car and a brake test machine [10]. Talati and Jalalifar studied the thermal conduction of the heat generated during braking to evaluate different parameters, such as pressure and wear [11]. Neys investigated brake heat generation and dissipation to develop a brake temperature calculation model [12]. Then, Thuressson analyzed convection cooling with a wind tunnel brake machine to compare certain numerical simulations [13]. Macuzicl et al. analyzed several types of brakes, considering the thermal conduction only [14]. Kiran [15] and Lindgren [16] carried out CFD simulations to explore certain cooling methods for the brakes with ambient air using specific ducts.
The aerodynamic effects of geometrical details, such as the Gurney flap, have been investigated with a focus on fluid dynamic interactions between car components [17,18] or the interactions of the front wheel flow with the car’s aerodynamics [19]. The details of certain flow mechanisms that can generate unsteadiness in the aerodynamics of a car wing have been also discussed and simulated using CFD [20]. In this paper, the flow around the actual geometry of a wheel is studied using CFD, along with braking system details from an F1 car from the 2000s, in order to understand the heat transfer process during the braking action and its underlying flow dynamics. Starting from the aerodynamic analysis of the complete car [18], a CFD submodel of the wheel and braking system only is derived. Various heat exchange mechanisms are considered with increasing complexity in the simulation model, including thermal convection only, radiation and conjugate heat transfer. In this last model, the solid domain of the disk is included and coupled to the CFD mesh. The simulations are performed at different speeds to evaluate the impacts on the three heat transfer mechanisms. The efficiency of the brake system under different environmental conditions, i.e., with a low atmospheric pressure, is also investigated.
2. Geometry
The braking system geometry considered here is for a racing car disk brake. A disk brake consists of a disk that is jointly connected to the wheel, with braking performed using a caliper system with a pair of pads. The pads press simultaneously on both sides of the disk, generating a frictional force proportional to the pressure on the surfaces obtained using a hydraulic system. In Figure 1, the assembly of the disk brake system is shown, while in Figure 2 the internal components are detailed in an expanded view.
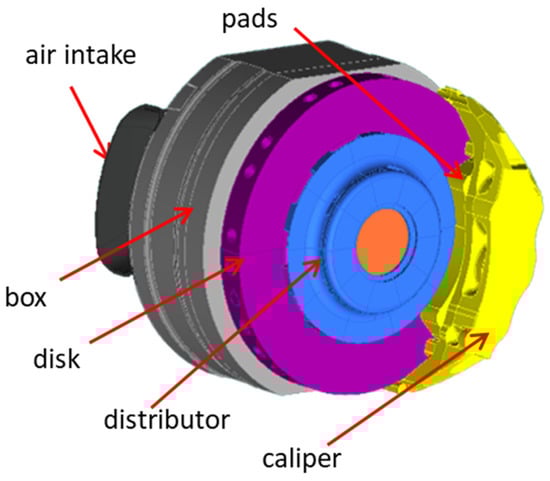
Figure 1.
Component assembly of the disk brake system.
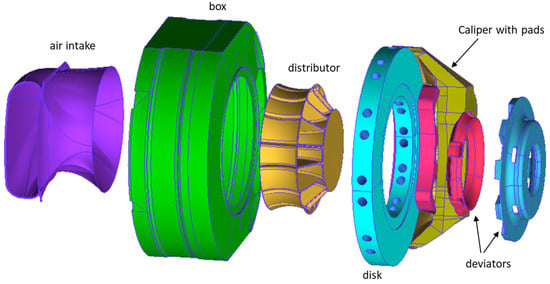
Figure 2.
Expanded view of internal components of the disk brake assembly.
The braking system was installed inside the wheel of an open-wheeled Formula 1 car from the early 2000s. The installation is primarily composed of an air intake, whose purpose is to convey external flow inside the wheel. Then the air enters a box containing the distributor, which directs the flow perpendicularly to the disk through two additional deviators. The self-ventilating disk is the main component of the system, which must be cooled. It has an external diameter of 278 mm, an internal diameter of 155 mm and a thickness of 26 mm. This disk has several holes located on the shoulder of the disk, having a diameter of 12 mm. Finally, two pads are pressed onto the disk by the caliper. The braking system is located inside the wheel, including a 615-mm-diameter tire with a tread thickness of 270 mm and rim measuring 354 mm in diameter.
The wheel is connected to the car through a set of suspension rods. The car has a length of 3.5 m. Other geometrical data for the car, including the ailerons and wheels, can be found in [18].
3. CFD Model
Two different CFD models were employed in this work. The first included the front of the car with the ailerons and the front wheel (with the rim closed and without the braking system). The second model (submodel) was composed of the wheel group containing the braking system, which will be called the “reduced model”. The flow domain of the car consisted of a rectangular hexahedron with half-car dimensions of 3lv × 2lv × 8lv. The surface in front of the wing was placed at 2lv. The dimensions of this fluid domain were determined in order to do not influence the flow structure around the car with the boundary conditions, as is common best practice in the external aerodynamic simulations. The complete model was used to identify the appropriate boundary conditions to set the reduced model based on the different operating conditions. The flow and thermal analyses of the braking system were conducted on the reduced model, using CFD simulations with the complete model for domain coupling through boundary conditions.
Figure 3 shows the mesh of the complete model with some details in front of the vehicle. The domain was discretized with an unstructured grid with a prism layer (10 layers) near the wall of the vehicle and its components, in order to solve the effects of the boundary layer in the fluid. The size of the first cell was set to guarantee a value of Y+ close to one. In addition, local mesh refinements were performed for some components, such as the leading edge and the Gurney flap (placed at the trailing edge) of the ailerons; these refinements were achieved using mesh density cylinders, where the maximum size of the tetrahedral elements was equal to 1.0 mm. The global mesh size of this model consisted of about 45 million cells. The mesh we used was designed to have a high-quality ratio higher than 0.5. The mesh strategy with the appropriate local refinements was selected after a grid dependency analysis performed in a previous study [17] on the wing in ground effects analyzed in an isolated form. In the previous work [17], the CFD model was validated by comparing the numerical results with detailed experimental data [21] at different distances from the ground and with different GF heights.
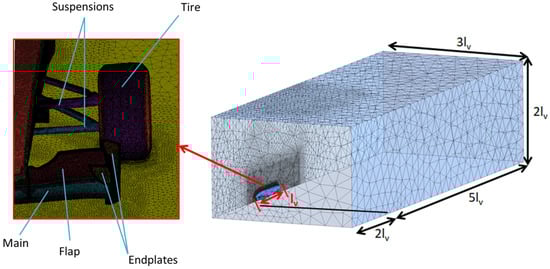
Figure 3.
Mesh of the complete model.
The reduced model (wheel with braking system) consisted of a parallelepiped with dimensions of 0.62 × 0.97 × 0.8 m, in order to isolate the wheel group and to avoid excessive computational resources. The grid, as shown in Figure 4, was an unstructured mesh with a prism layer at the walls with the same characteristics as the previous validated model. The overall mesh size consisted of about 65 million cells for the set of two domains.
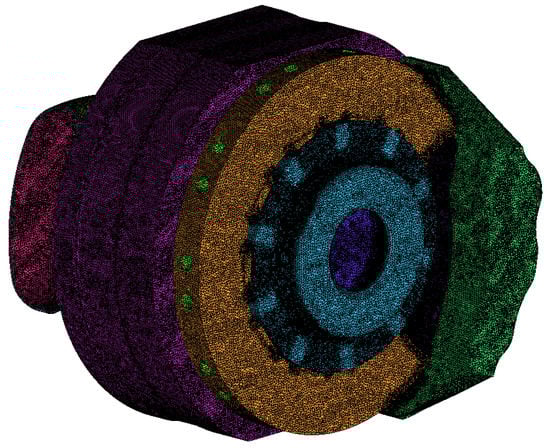
Figure 4.
Mesh details of the brake system.
In the first model, an inlet velocity of 35–70 m/s, a temperature of 25 °C and a medium turbulence intensity 5% were fixed as the boundary conditions. At the outlet, an ambient pressure condition was set. In the symmetry plane, the numerical symmetry condition was forced, while on the ground a no-slip wall condition with the same velocity as the car was set. The remaining surfaces of the domain were set with free slip wall conditions, whereby the fluid could not enter or exit without generating flow losses; the walls of the car and the components had no-slip wall conditions generating boundary layers.
For the reduced model boundary conditions at the inlet, the velocity, turbulent kinetic energy (k), eddy dissipation (ε) and temperature profiles obtained on the same surface from the simulation of the complete model were imposed. An opening condition at ambient pressure and zero turbulence gradient was imposed on the upper, rear and lateral surfaces of the control volume of this submodel. All of the walls, including the ground, were imposed as no-slip walls; the rotational speeds (230 and 115 rad/s) were fixed for the walls of the tire, the rim, the disk and the deviators. Uniform temperatures were set on the walls of the disk and the brake pads, respectively, of 1000 °C and 800 °C, in order to simulate the maximum temperatures reached after a braking event [22]. The remaining solid walls were considered as adiabatic. The CFX software of the ANSYS CFD platform was used as the solver. The air was treated as a perfect ideal gas, while the SST turbulence model was activated in order to solve the boundary layer near the walls; the total thermal energy model is set for the energy equation. All the equations were solved with second-order numerical schemes with steady simulations.
3.1. Thermal Radiation
The thermal radiation was considered as the heat exchange method in the brake system. The P1 model was activated and the open surfaces of the domain were considered completely transparent, i.e., they absorbed all the output energy, while the input energy was calculated as a black body at the local temperature or at the specified black body external temperature (for the disk and the pads). The emissivity values and diffusion factors were set for the various surfaces, as reported in Table 1.

Table 1.
Emissivity and diffusion factor values of the brake system components.
These values were obtained from the tables of the most common materials [23]. The emissivity values, expressed as a function of the wavelength, depend on the temperature, as demonstrated in [24]. Emissivity values compatible with the temperature of the disk were set. Finally, the materials considered were aluminum for the caliper, carbon–carbon for the disk, carbon–ceramic for the pads and steel for the other components [25].
3.2. Conjugate Heat Transfer
In addition to the previous settings, the solid domain related to the disk was added to the model in the conjugate heat transfer simulations. This component was discretized with an unstructured grid with a global size of one million cells. Interfaces between the fluid and the solid domain were set on the external surfaces of the disk, assuming zero thermal resistance. In order to simulate the conjugate heat transfer, a thermal source was set to properly solve the temperature distribution inside the solid and to take into account the thermal conduction within the component. Based on the vehicle speeds considered (70 and 35 m/s), the following values were set as thermal sources: 60.2 MW/m3 and 45.1 MW/m3, respectively. These values were obtained from the heat flux on the disk from the CFD simulations with the thermal convection and the thermal radiation only.
4. Thermo-Fluid Dynamic Analysis of the Brake System
The flow structure around the vehicle and the ailerons was visualized using the streamlines in Figure 5. A velocity contour was also displayed in the plane corresponding to the input surface of the reduced model of the wheel with the brake system. This distribution was used as the inlet boundary condition for the submodel. The front wing diverts the air that will not impact directly on the tire and conveys it towards the air intake of the brake duct (located between the wheel and the car). In the velocity contour planes, there are high-velocity areas below the wing and low-speed regions near the wheel, because the wake generated by the Gurney flap is affected by the flow stagnation of the wheel.
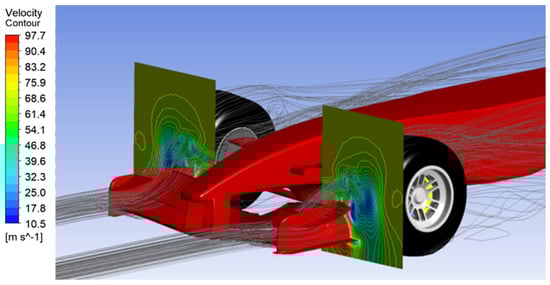
Figure 5.
Streamlines around the car and velocity contour at the inlet of the reduced model.
The 3D nature of the flow structure was evident, meaning the proper boundary conditions to the submodel required the simulation of the front wing with the wheel. A set of control planes were considered in the reduced model, as in Figure 6, in order to investigate the flow structure.
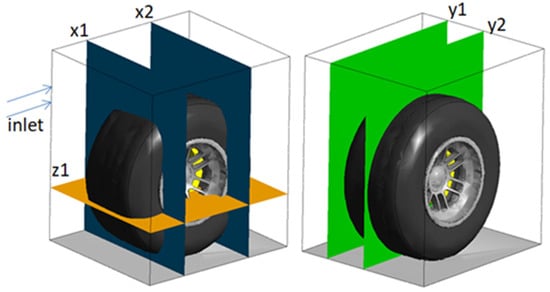
Figure 6.
Control plans for post-processing.
Figure 7 and Figure 8 show the velocity distributions on planes X1 and X2, respectively. On the X1 plane there are high-velocity areas near the corners of the tire and swirling structures develop around the wheel. High-velocity areas are also present in the lower left side, where the flow is accelerated under the wing. There is a stagnation zone under the wheel generated by the incoming flow, which after stagnation is dragged downward by the wheel rotation. On the other hand, in the X2 plane separated flow regions are evident. In fact, the flow after stagnation on the tire front generates a series of vortices in the upper part.
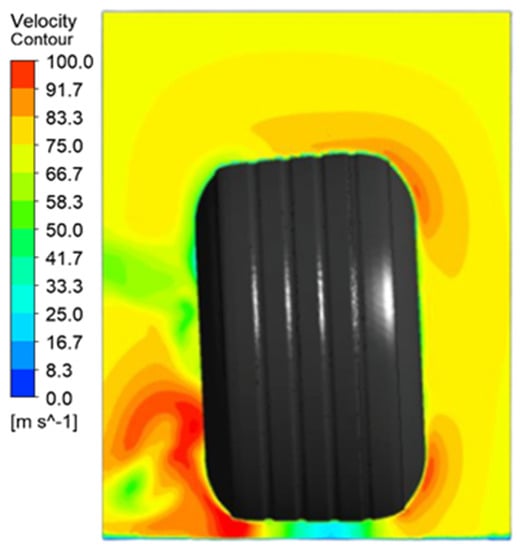
Figure 7.
Velocity contours on plane X1.
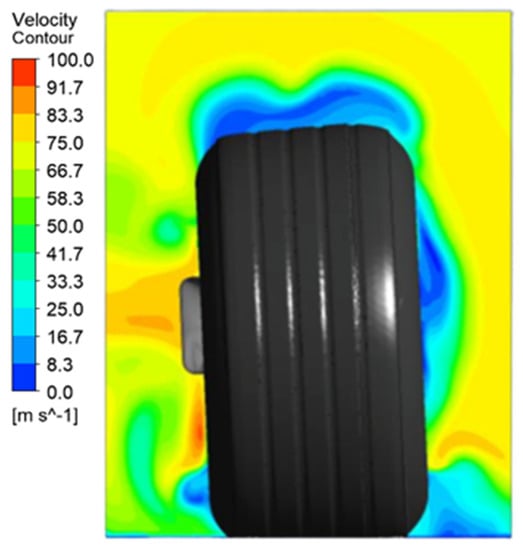
Figure 8.
Velocity contours on plane X2.
The streamlines, taken from the air cooling duct intake, are reported in Figure 9, in order to understand the interior path of the flow into the braking system.
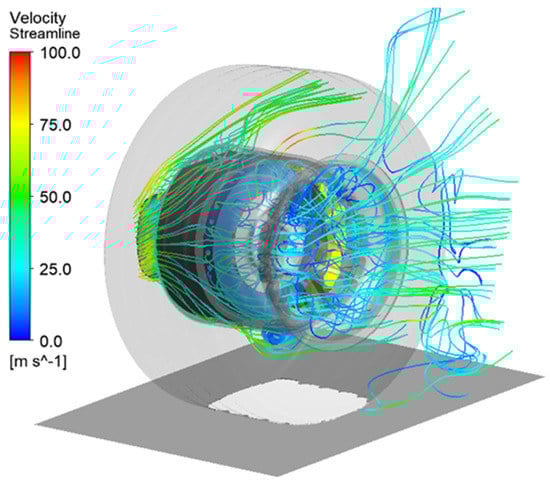
Figure 9.
Streamlines inside the brake system from the air intake cooling duct.
As shown above, there are several streamlines that do not enter into the brake cooling duct, instead they are deflected by the duct geometry. However, the cooling duct is efficiently fed by the high number of streamlines. The flow goes through the cooled disk via the holes, deviators, leaves and brakes, and after the rim joins the external flow and starts accelerating again. The velocity contour inside the wheel into the distributor (plane Y2) is shown in Figure 10.
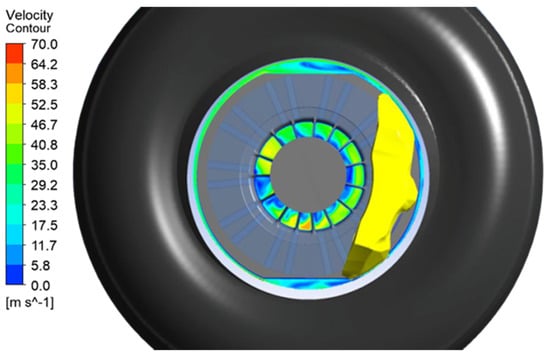
Figure 10.
Velocity contours on plane Y2, with flow separations on the distributor vanes.
Flow separation regions are evident on the distributor vanes. These vanes must distribute the flow perpendicularly to the disk; however, these flow separations reduce the passage area, causing a cooling efficiency reduction in the disk. In fact, only 63% of the total mass flow enters from the air intake flows through the distributor to feed the disk. Figure 11 shows the velocity distribution in the middle plane of the disk.
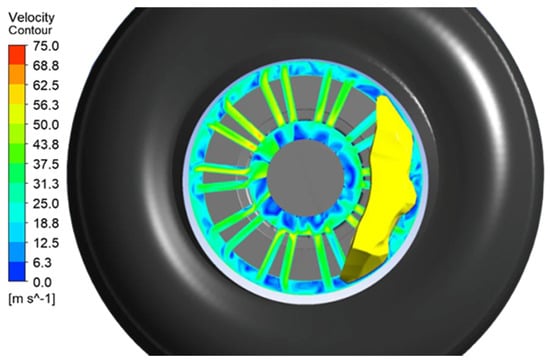
Figure 11.
Velocity contours on the middle plane of the disk.
It can be seen that the flow conveyed by the distributor enters the disk ventilation holes perpendicularly to remove the heat generated during braking. Inside these channels the flow is accelerated, but the flow distribution is not uniform and equal for the channels. In addition to the above separations generated downstream of the distributor vanes, the channels that face the brake caliper are partially obstructed. The interaction between the channels and the caliper, due to the rotation of the disk, is periodic. In Figure 12, the temperature distribution in the middle plane of the disk is shown.
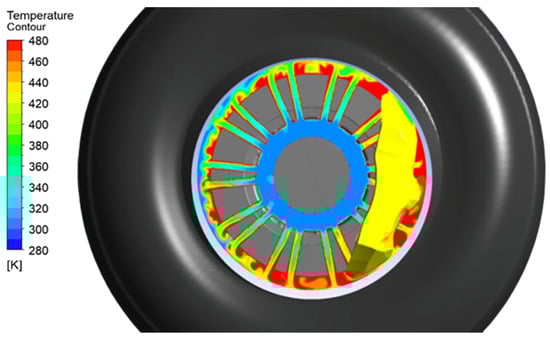
Figure 12.
Temperature contours on the middle plane of the disk.
Higher temperature values (in red) are evident in the outer zone of the disk shoulder, because the heat removed during the passage from the disk channels tends to accumulate in the disc’s periphery, where a radial temperature increase can be detected. Another high-temperature zone can be found near the caliper, exactly where the low velocity area is observed in the ventilation channels partially obstructed by the caliper. In Figure 13, the temperature distribution on the X2-Z1 planes is reported to observe how the heat moves from the rim after the brake ventilation. The flow leaves the rim at temperatures up to 150 °C higher (red) than the ambient temperature (in blue). Most of the hot flow is in the middle of the wheel, while it decreases going towards the upper part. This hot flow temperature rapidly drops because of the mixing with the main external flow. In Figure 14, the contour surface of the temperature field with values higher than 350 K is reported.
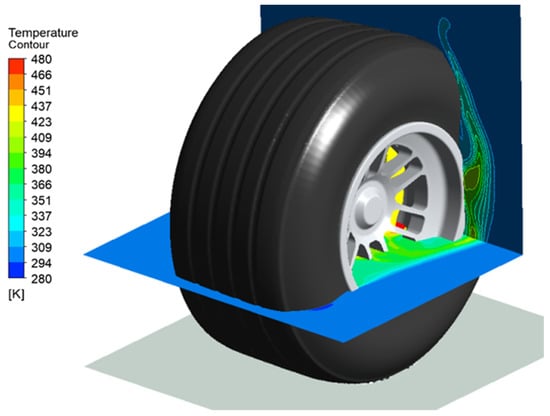
Figure 13.
Temperature contours on the planes X2-Z1.
Figure 14.
Temperature surface (350 K) of the hot air that leaves the wheel rim.
Through the above postprocessing steps, it can be verified that the hot air from the wheel rim develops in the outer flow in such a direction that it will be not ingested by the downstream inlet section of the engine radiator cooling duct. In fact, temperatures higher than 350 K can be found inside the light blue surface (Figure 14) only; the above iso-surface runs out before the end of the tire and clearly before the engine radiator. Lower temperature values are detected externally to that surface.
5. Heat Transfer Analysis
In this section, the heat flux removed from the brake system (the amount of heat flux exchanged and dissipated with the air flow) is investigated for two different car speeds. The analysis is initially performed with thermal convection mechanism only, then the thermal radiation and finally the conjugate conducted into the disk (coupled heat exchange mechanisms).
5.1. Thermal Convection
Figure 15 shows the heat flux removed from the entire disk surface, the ventilation channels and the pads at two different car speeds.
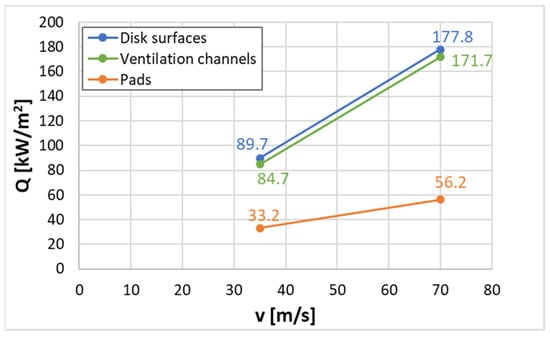
Figure 15.
Heat flux removed from the main components at different car speeds—thermal convection only.
At reduced car speeds, less heat can be removed from the main components of the braking system, after the braking event. In fact, in this case, a smaller air mass flow rate enters the brake cooling duct. From the above numerical values, despite the car speed being reduced by 50%, 49.5% less heat flux is removed from the disk, while a lower reduction (−40.9%) is observed on the pads. This difference is due to the smaller amount of flow in the ventilation channels located near the caliper, as described in the previous section, for the partial obstruction of the channels in the proximity of the caliper and the pads; therefore, the heat transfer in the pads is less affected by car speed reductions. The most relevant heat flux removal occurs through the ventilation channels (line green), representing about 95% of the total disk surface heat (line blue) for both car speeds. In fact, the highest rate of air is conveyed inside the channels thanks to the distributor, while only a smaller portion flows externally to the disk.
5.2. Thermal Convection and Radiation
The same analysis was performed with the addition of the thermal radiation mechanism. Here, this contribution is hardly negligible because the temperature values are rather high; in fact, the disk can have a typical red color in some dangerous conditions [1]. Figure 16 shows the heat flux values extracted from the disk and the caliper at two different car speeds.
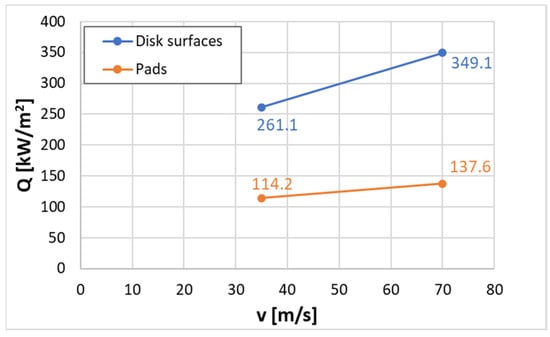
Figure 16.
Heat flux removed from the main components at different car speeds—thermal convection and radiation.
The introduction of the radiation mechanisms clearly increases the heat flux values. Both the disk and the pads emit and absorb a certain amount of heat based on the optical properties of the respective materials. Therefore, with the ventilation of the brake system, a larger amount of heat is removed than in the previous case. A reduction of 25.2% in the heat removed from the disk is predicted when the car speed is halved, while a reduction of 17% can be observed in the pads.
5.3. Conjugate Heat Transfer
In this case, the solid domain of the disk was been discretized and added to substitute the disk surface temperature condition with a volumetric thermal source. According to other investigations [11] the disk absorbs most of the heat generated by the friction through thermal conduction. Figure 17 shows the surface temperature distribution on the disk from the simulation at high speeds.
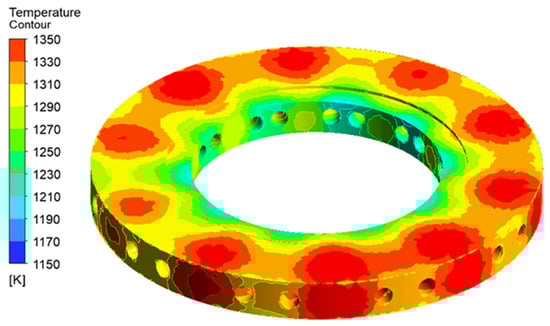
Figure 17.
Temperature contours on the disk—coupled heat transfer case at 70 m/s.
The temperature values above are almost equivalent to the cases without the solid domain, but the distribution is not uniform. In fact, higher values can be found between one ventilation channel and the other, while the lowest temperatures (even 100 °C less) are located near the cannels. Figure 18 shows the heat flux values removed by the main components using all coupled heat transfer mechanisms at two different car speeds.
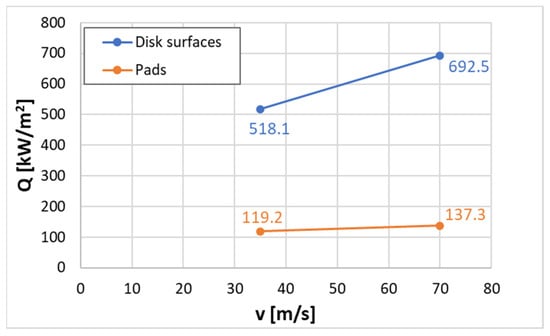
Figure 18.
Heat flux removed from the main components at different car speeds—all coupled heat transfer mechanisms.
The values of the heat flux above are increased compared to the previous analysis, especially for the disk where the conjugate heat transfer is considered. Reductions of 25.2% and 13.2% for the heat flux values of the disk and the pads are predicted with a 50% car speed reduction. These values confirm the same trend predicted with the model with thermal convection and radiation only.
5.4. Comparison of Heat Dissipation with Different Heat Transfer Mechanisms
Figure 19 and Figure 20 show the histograms of the different heat flux values removed at 70 m/s from the disk and the pads, respectively.
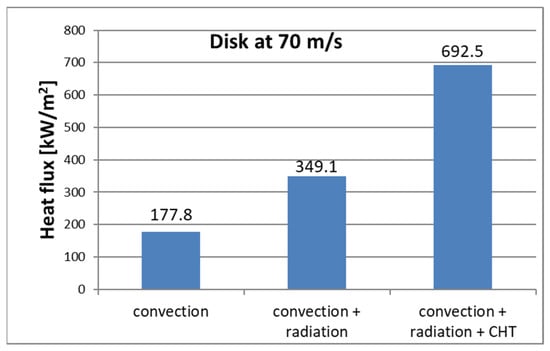
Figure 19.
Comparison of heat dissipation results from the disk with different heat transfer mechanisms at 70 m/s.
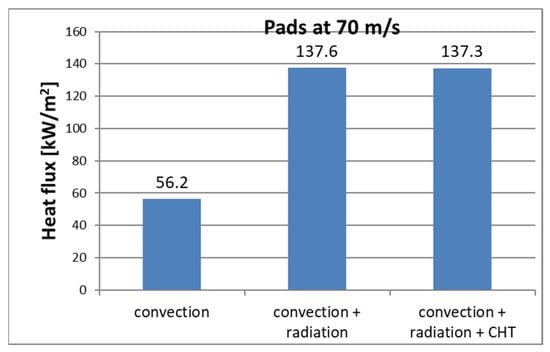
Figure 20.
Comparison of heat dissipation results from the pads with different heat transfer mechanisms at 70 m/s.
The heat flux changes significantly with the addition of the different heat transfer mechanisms. The disk is most affected when. heat flux values lower than 74% with thermal convection only or lower than 49% with thermal convection and radiation are obtained in comparison to the complete model. For the pads, a heat flux value lower than 59% in the case with thermal convection only is the highest deviation with respect to the complete heat transfer model. This analysis is useful to understand and quantify the effects of the various heat transfer mechanisms in order to understand the limits that a simplified model can have with respect to a complete numerical approach.
6. Effect of Atmospheric Pressure
The braking system analyzed here is typical of a racing car. In Formula 1, the GP is held in Mexico, which takes place at an altitude of around 2300 m above sea level, far from the typical conditions found in the traditional circuits, which are located at sea level. In this grand prix, the brakes are very stressed; the atmospheric pressure is lower (0.8 Pa) than the ambient pressure at sea level and consequently lower than the air density. To understand the effects on heat flux removal from the braking system, the CFD model with the full set of coupled heat transfer mechanisms was applied. Figure 21 and Figure 22 show the histograms of the heat flux dissipated at different altitudes, from the disk and the pads, at a car speed of 70 m/s.
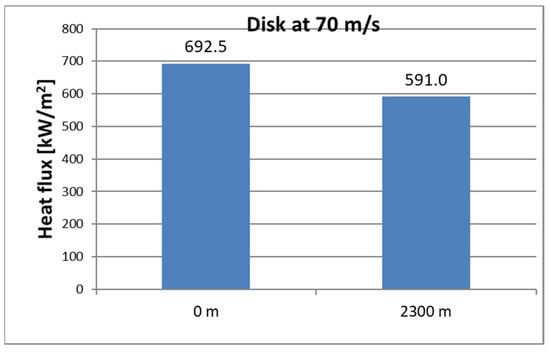
Figure 21.
Comparison of heat dissipation values from the disk at different altitudes—coupled heat transfer case at 70 m/s.
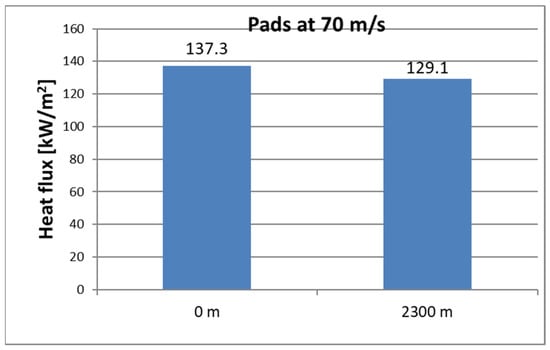
Figure 22.
Comparison of heat dissipation values from the pads at different altitudes—coupled heat transfer case at 70 m/s.
At higher altitudes, lower heat dissipation is evident because of the lower air density; reductions of 14.7% and 6% were found for the disk and the pads, respectively, compared to the sea level condition.
7. Conclusions
From the simulation of a complete Formula 1 car, a reduced CFD model was developed in order to focus on the thermo-fluid-dynamics of the brake system inside the wheel. Different simulations were carried out at two different car speeds to analyze the heat removal effects. The different heat transfer mechanisms were considered with increasing complexity to the numerical model. The detailed postprocessing phase of the 3D solutions highlighted the reasons for the temperature distributions on the brake surfaces. The heat flux removal from the brake system after a braking event was quantified and compared for different heat transfer methods and car speeds. The sensitivity of the heat flux from the heat transfer mechanisms was also demonstrated to understand the limitations of simplified CFD approaches.
Author Contributions
C.C. and D.M. equally contributed to the research activity, the setup of the model, the discussion of the results and the writing of the paper. All authors have read and agreed to the published version of the manuscript.
Funding
This research received no external funding.
Institutional Review Board Statement
Not applicable.
Informed Consent Statement
Not applicable.
Data Availability Statement
Not applicable.
Conflicts of Interest
The authors declare no conflict of interest.
Nomenclature
| d | Diffusion factor |
| lv | Vehicle length |
| ṁ | Mass flow rate |
| p | Static pressure |
| Q | Heat flux |
| T | Temperature |
| v | Velocity |
| Y+ | Non-dimensional boundary layer distance from wall |
| ε | Thermal emissivity |
References
- Limpert, R. The Thermal Performance of Automotive Disk Brakes. In Proceedings of the Automobile Engineering Meeting, Detroit, MI, USA, 13–17 October 1975. [Google Scholar]
- Sheridan, D.C.; Kuthney, J.A.; Samie, F. Approaches to the Thermal Modelling of Disk Brakes. J. Passegner Cars 1988, 97, 268–283. [Google Scholar]
- Day, A.J.; Newcomb, T.P. The dissipation of Frictional Energy From the Interface of an Annular Disk Brake. Proc. Inst. Mech. Eng. 1984, 198, 201–209. [Google Scholar] [CrossRef]
- Day, A.J. An Analysis of Speed Temperature and Performance Characteristics of Automotive Drum Brakes. J. Tribol. 1988, 110, 298–303. [Google Scholar] [CrossRef]
- Westbrook, M.H. The Electric Car: Development and Future of Battery, Hybrid and Fuel Cell Cars; Institution of Electrical Engineers: London, UK, 2001. [Google Scholar]
- Zhang, X.; Zerihan, J. Off-Surface Aerodynamic Measurements of a Wing in Ground Effect. J. Aircr. 2003, 40, 716–725. [Google Scholar] [CrossRef]
- Zhang, X.; Zerihan, J. Aerodynamics of a Double-Element Wing in Ground Effect. AIAA J. 2003, 41, 1007–1016. [Google Scholar] [CrossRef] [Green Version]
- Huminic, A.; Chiru, A. On CFD Investigations of Vehicle Aerodynamics with Rotating Wheels’ Simulation; Technical Paper 2006-01-08-04; SAE International: Troy, MI, USA, 2006. [Google Scholar]
- Kieffer, W.; Moujares, S.; Armbya, N. CFD study of section characteristics of Formula Mazda race car wings. Math. Comput. Model. 2006, 43, 1275–1287. [Google Scholar] [CrossRef]
- Stephens, A. Aerodynamic Cooling of Automotive Disk; RMIT University: Melbourne, Australia, 2006. [Google Scholar]
- Talati, F.; Jalalifar, S. Analysis of heat conduction in a disk brake system. Heat Mass Transf. 2009, 45, 1055–1056. [Google Scholar] [CrossRef]
- Neys, A. In-Vehicle Brake System Temperature Model. In Chalmers; Report No. 2012:38; University of Technology: Gotenborg, Sweden, 2012. [Google Scholar]
- Thuresson, A. CFD and design analysis of brake disk. In Chalmers; Report No. 2014:11; University of Technology: Gotenborg, Sweden, 2004. [Google Scholar]
- Macuzicl, S.; Saveljic, I.; Lukic, J.; Glisovic, J.; Filipovic, N. Thermal analysis of solid and vented disk brake during the braking process. J. Serb. Soc. Comput. Mech. 2015, 9, 19–26. [Google Scholar] [CrossRef]
- Kiran, C.H. Numerical simulation of ventilated disk cooling effect. Int. J. Mech. Eng. Rob. Res. 2015, 4, 1. [Google Scholar]
- Lindgren, A. Development of Brake Cooling; Halmstad University: Halmstad, Sweden, 2016. [Google Scholar]
- Cravero, C. Aerodynamic performance prediction of a profile in ground effect with and without a Gurney flap. ASME J. Fluids Eng. 2017, 139, 031105. [Google Scholar] [CrossRef]
- Basso, M.; Cravero, C.; Marsano, D. Aerodynamic Effect of the Gurney Flap on the Front Wing of a F1 Car and Flow Interactions with Car Components. Energies 2021, 14, 2059. [Google Scholar] [CrossRef]
- Cravero, C.; Marsano, D. Computational Investigation on the Aerodynamics of a Wheel Installed on a Race Car with Multi-Element Front Wing. Fluids, 2022; 7, submitted. [Google Scholar]
- Cravero, C.; Marogna, N.; Marsano, D. A Numerical Study of Correlation between Recirculation Length and Shedding Frequency in Vortex Shedding Phenomena. WSEAS Trans. Fluid Mech. 2021, 16, 48–62. [Google Scholar] [CrossRef]
- Zerihan, J.; Zhang, X. Aerodynamics of a Single Element Wing in Ground Effect. J. Aircr. 2000, 37, 1058. [Google Scholar] [CrossRef]
- Talati, F.; Jalalifar, S. Investigation of Heat Transfer Phenomena in a Ventilated Disk Brake Rotor with Straight Radial Rounded Vanes. J. Appl. Sci. 2008, 8, 3583–3592. [Google Scholar] [CrossRef]
- Available online: http://www.pointvet.it/web/media/libri_pvi/Tab_emissivita.pdf (accessed on 15 March 2022).
- Thevent, J.; Siroux, M.; Desmet, B. Measurements of brake disk surface temperature and emissivity by two-color pyrometry. Appl. Therm. Eng. 2010, 30, 753–759. [Google Scholar] [CrossRef] [Green Version]
- Savage, G. Carbon-Carbon Composites; Springer: Dordrecht, The Netherlands, 1993. [Google Scholar]
Publisher’s Note: MDPI stays neutral with regard to jurisdictional claims in published maps and institutional affiliations. |
© 2022 by the authors. Licensee MDPI, Basel, Switzerland. This article is an open access article distributed under the terms and conditions of the Creative Commons Attribution (CC BY) license (https://creativecommons.org/licenses/by/4.0/).