
Optimal Design of an Interior Permanent Magnet Synchronous Motor with Cobalt Iron Core


Abstract
:1. Introduction
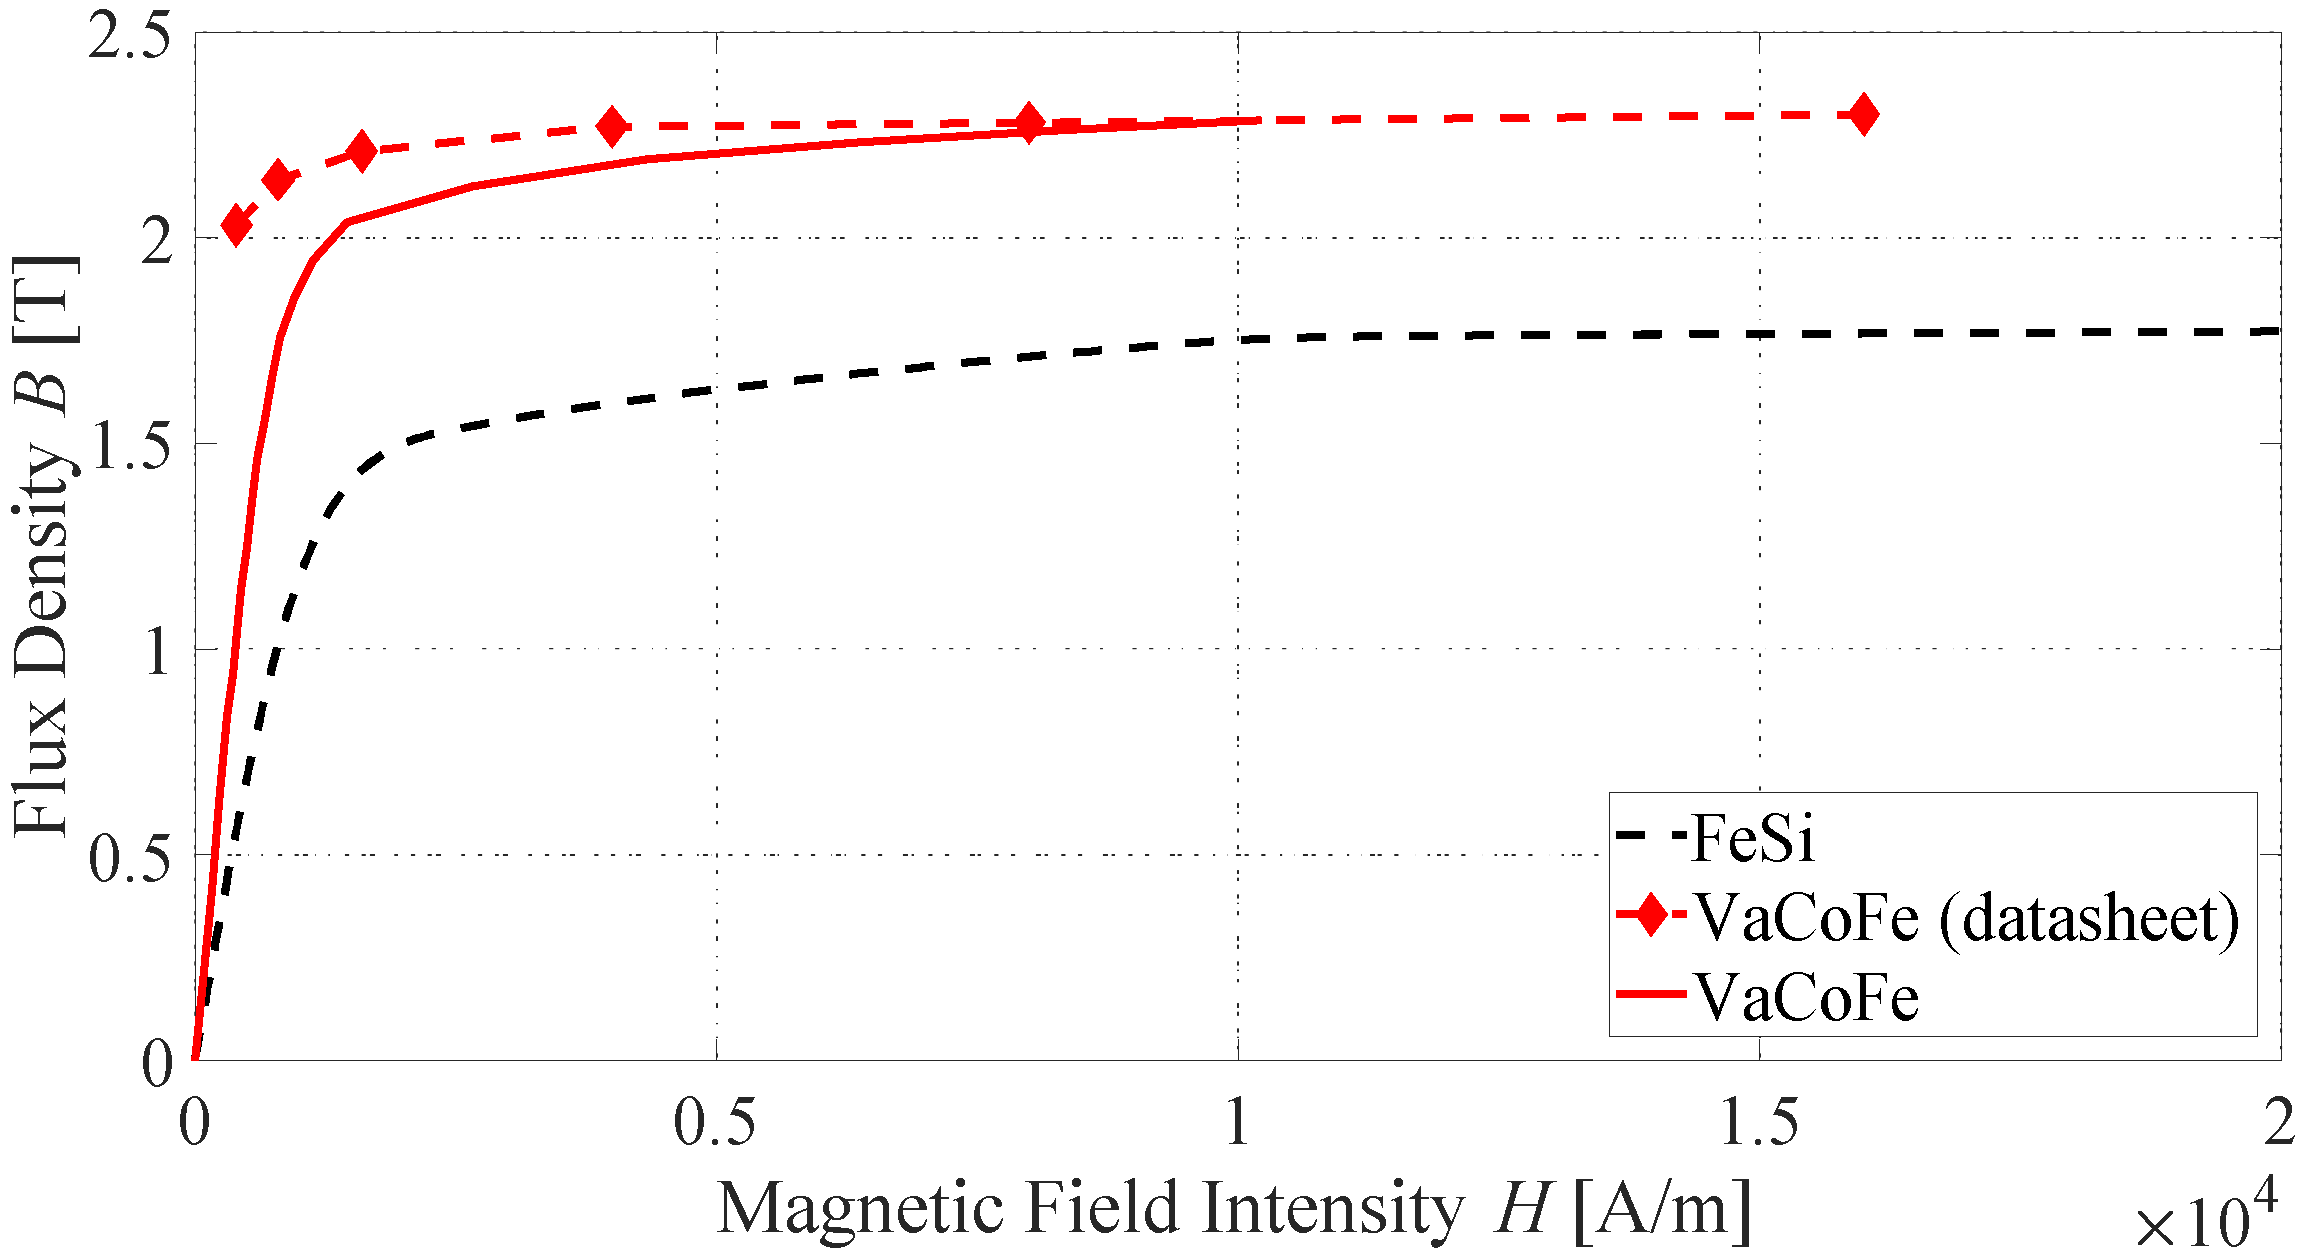
2. Electric Motor Materials
3. Spoke-Type Interior Permanent Magnet Synchronous Machine Model
3.1. Geometry and Winding Layout
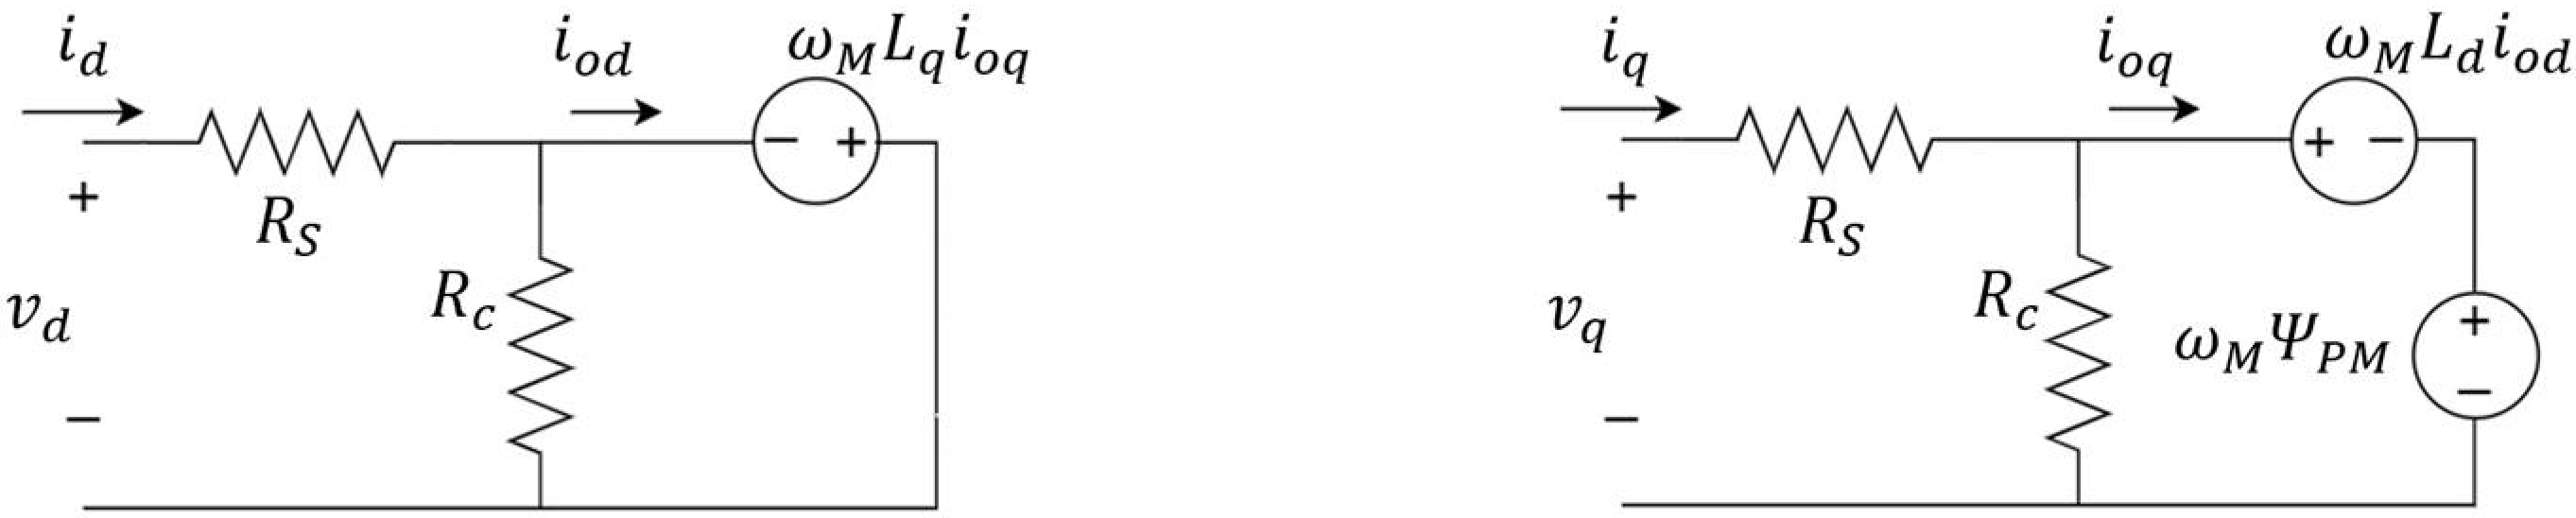
3.2. Electromagnetic Model
3.3. Finite Element Model
3.4. Maximum Operating Temperature Estimation
4. Optimization
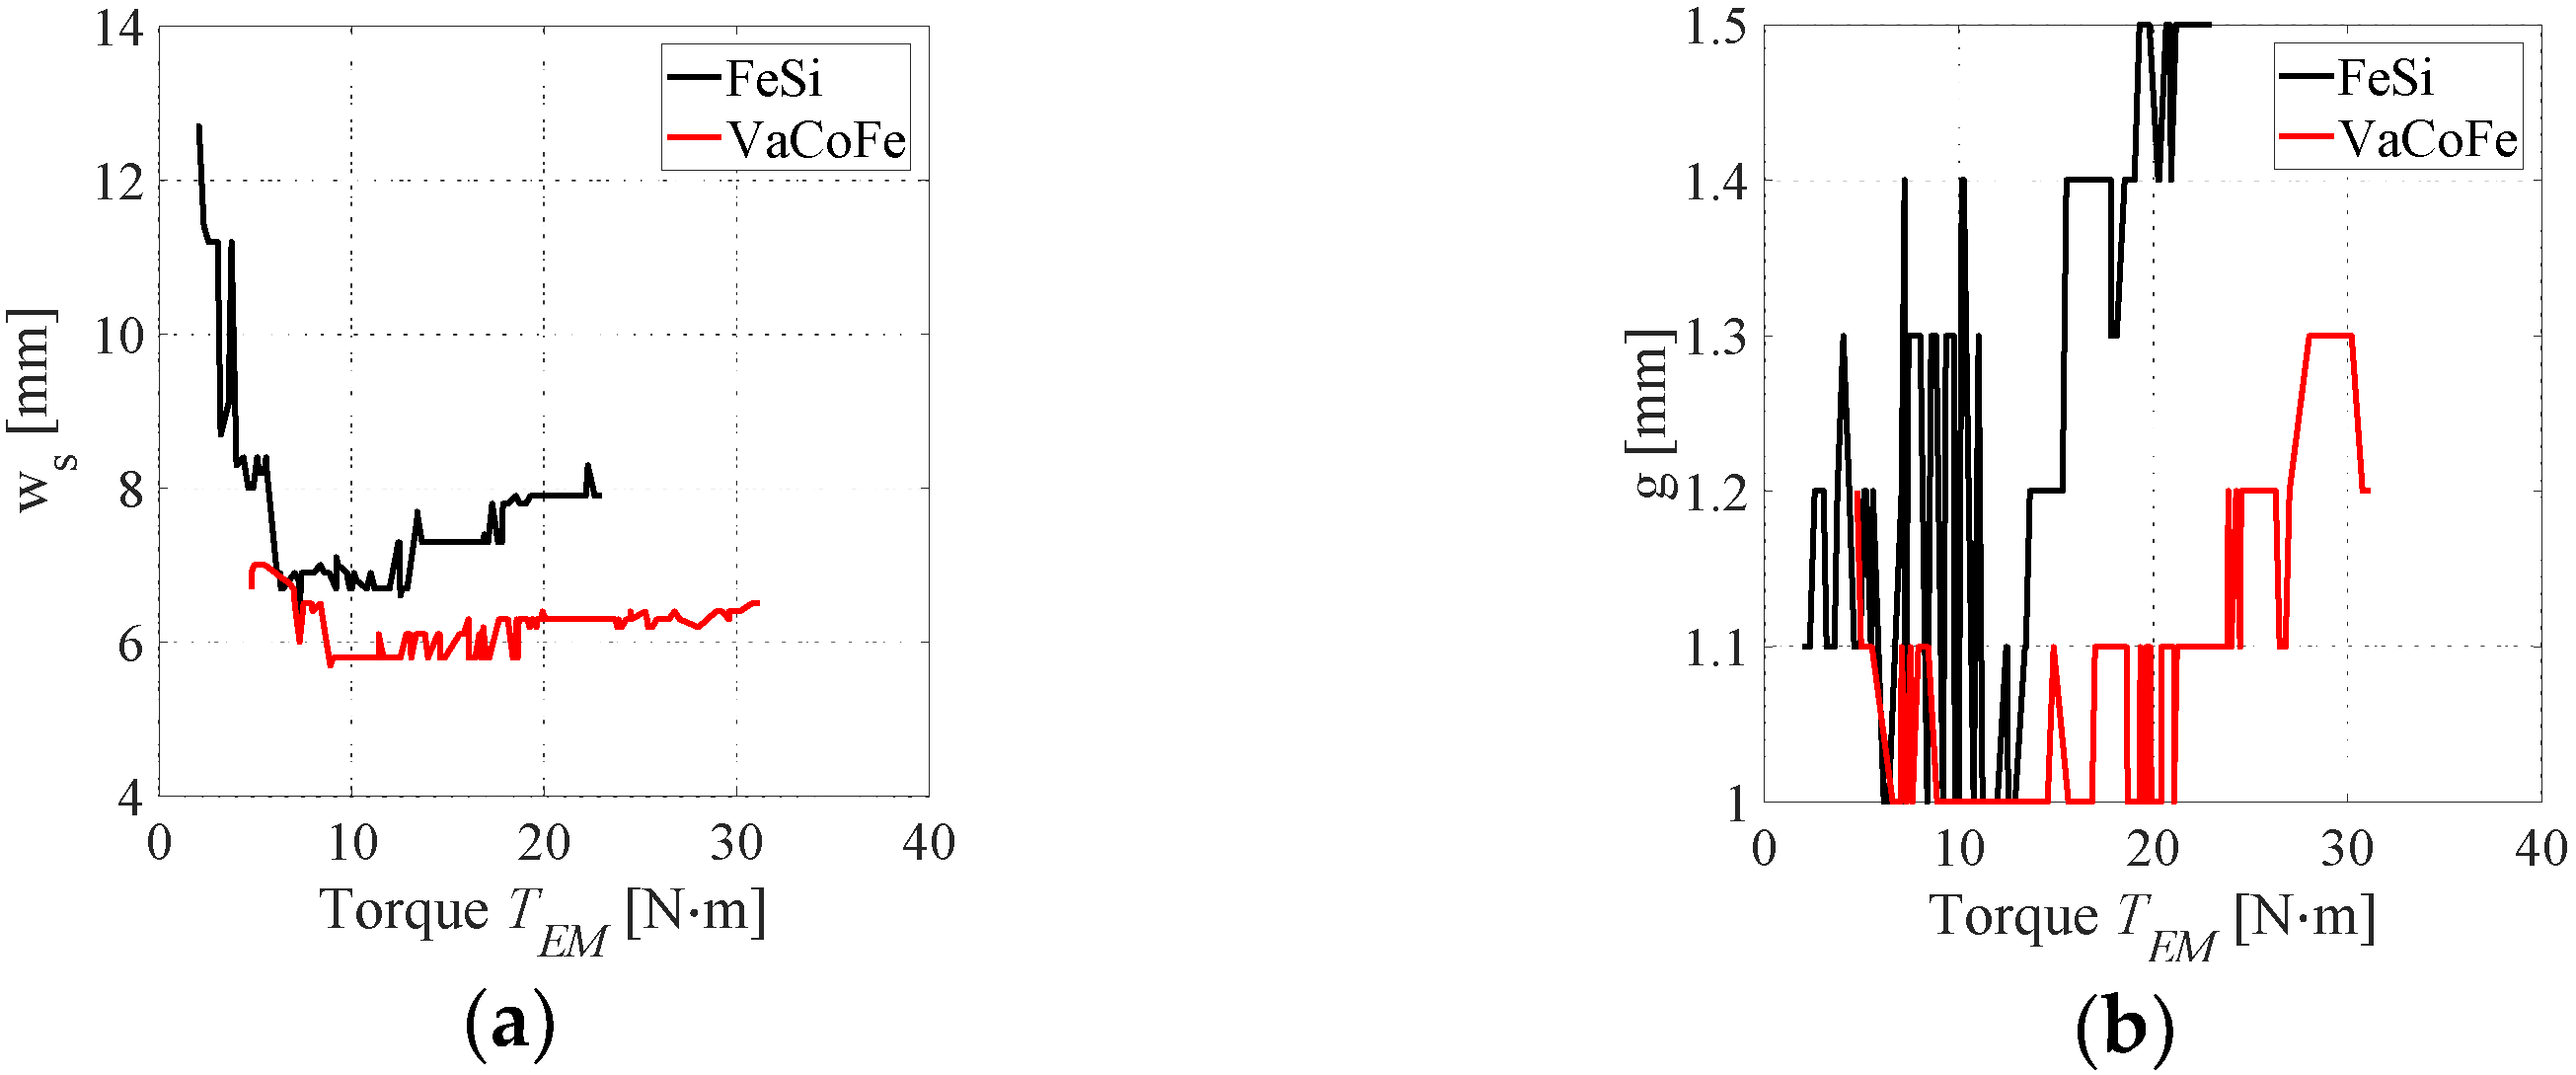
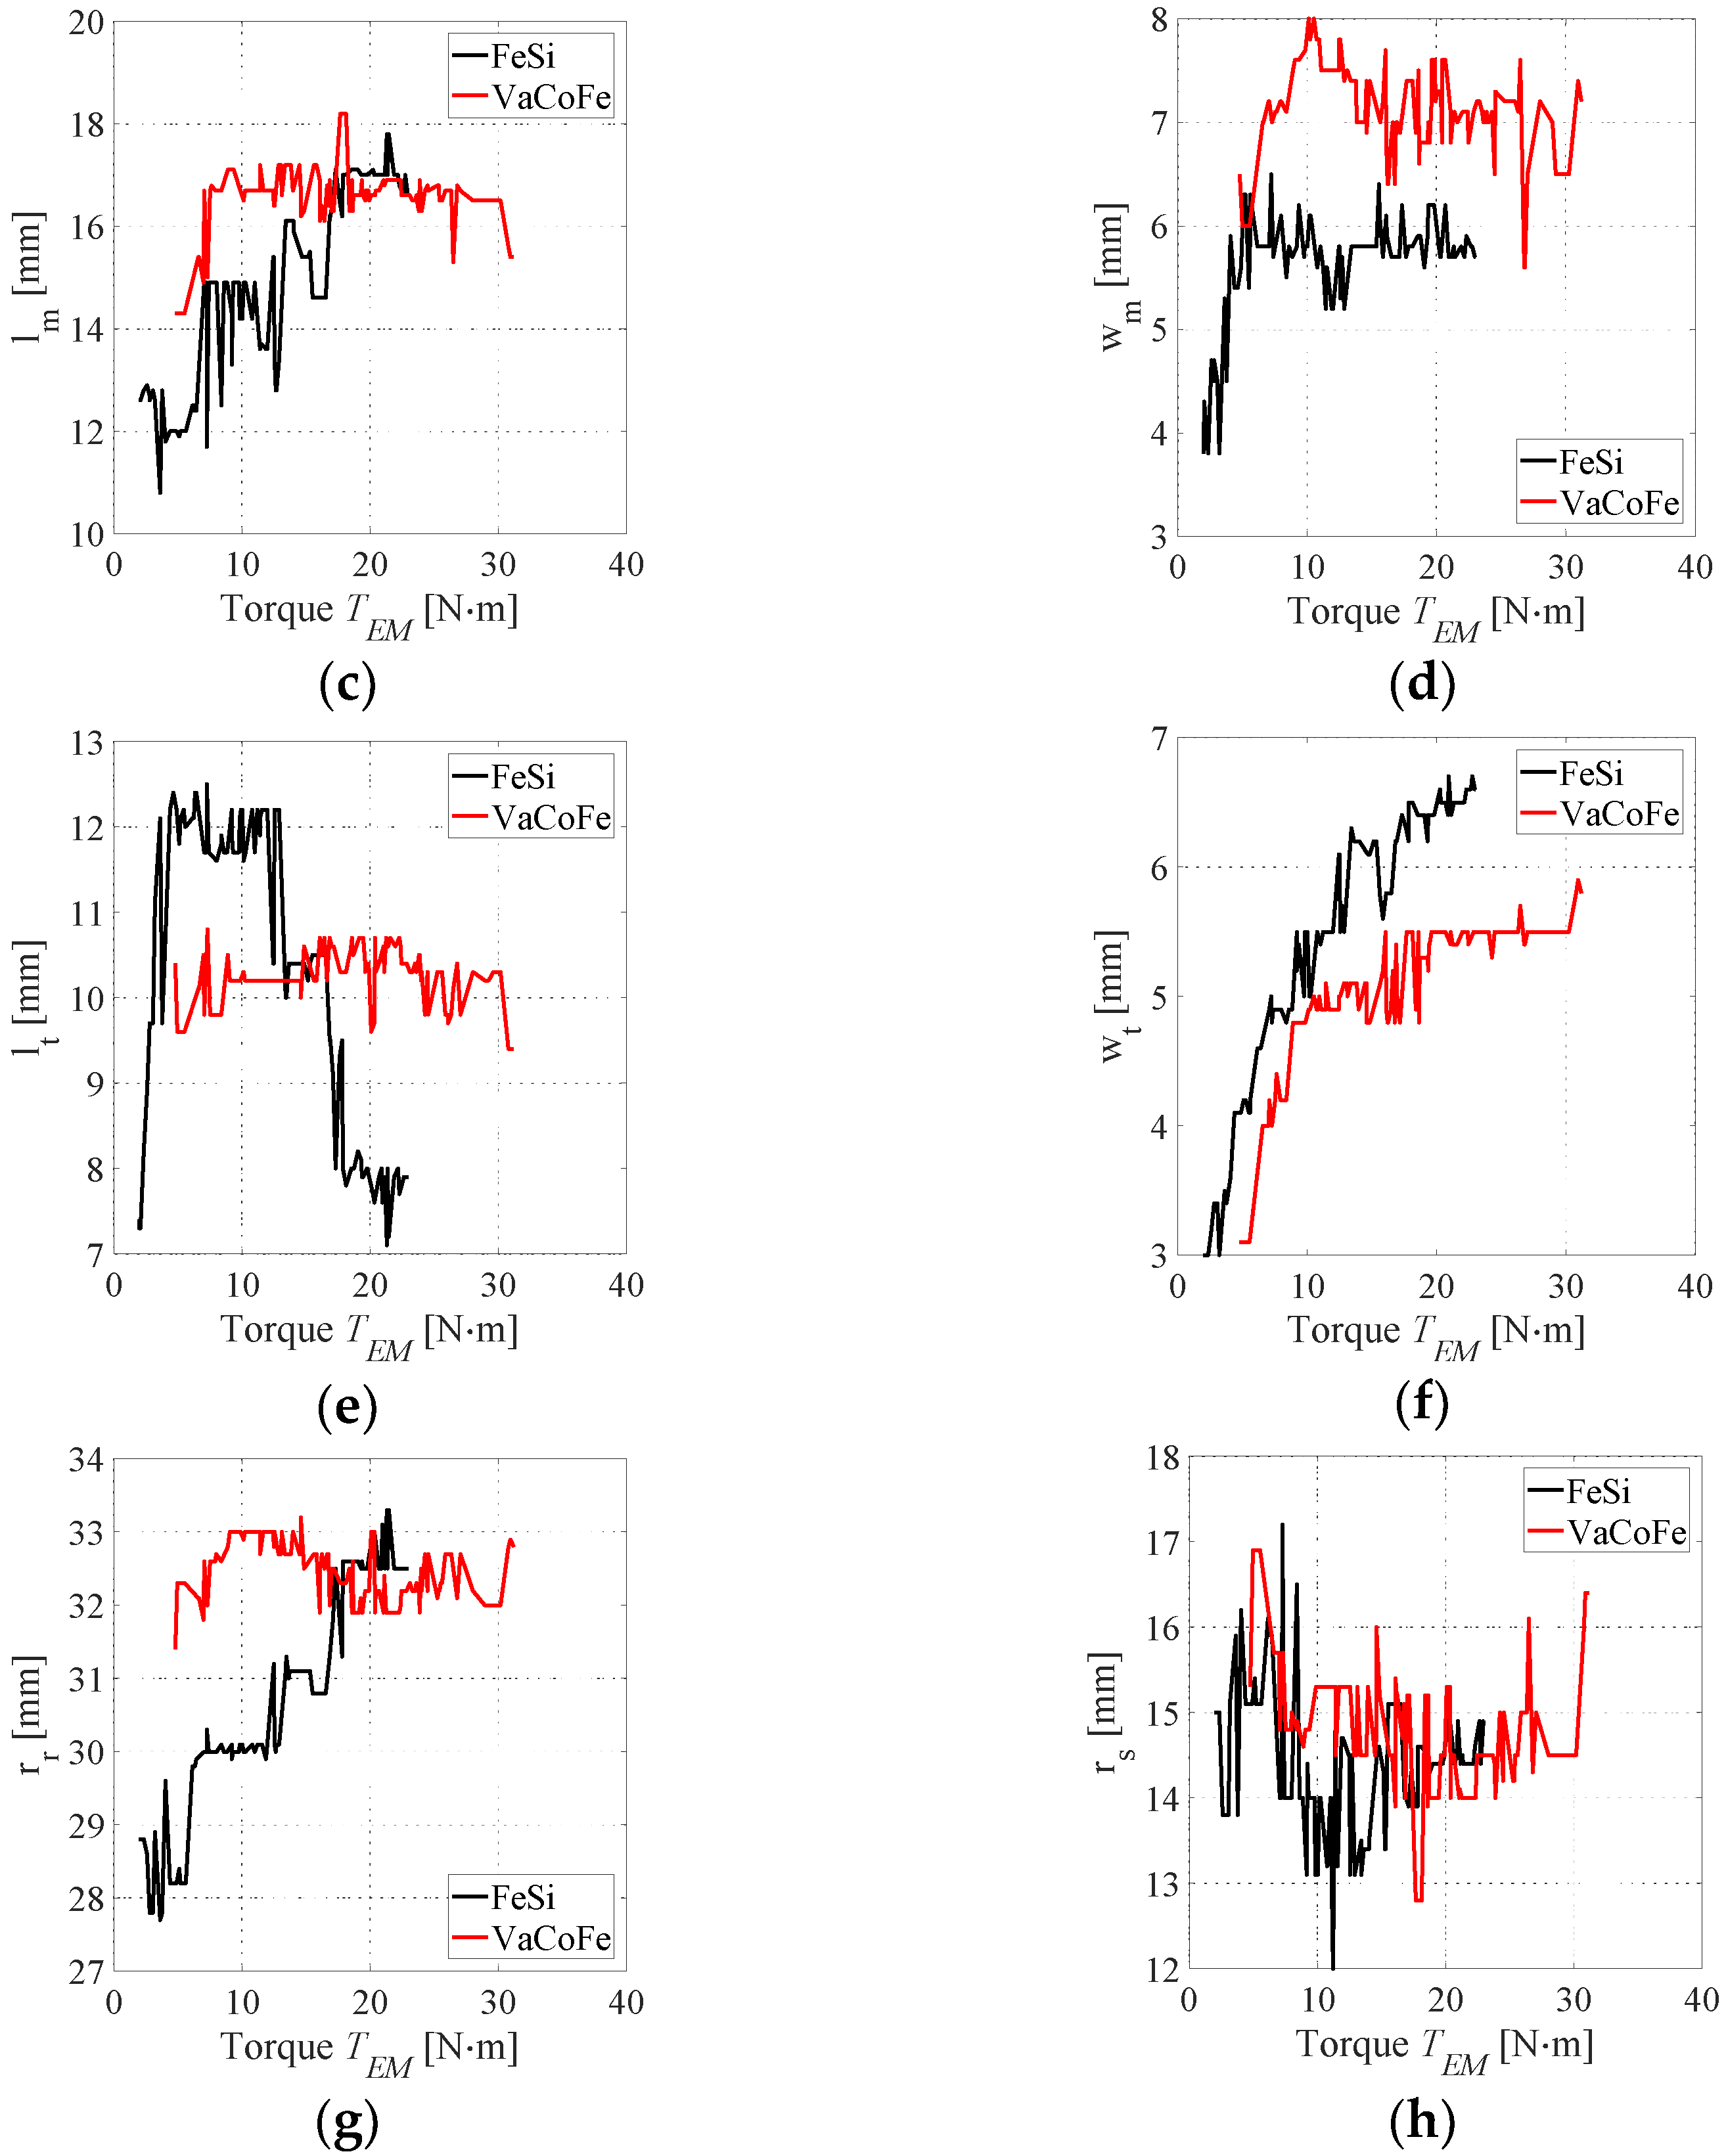
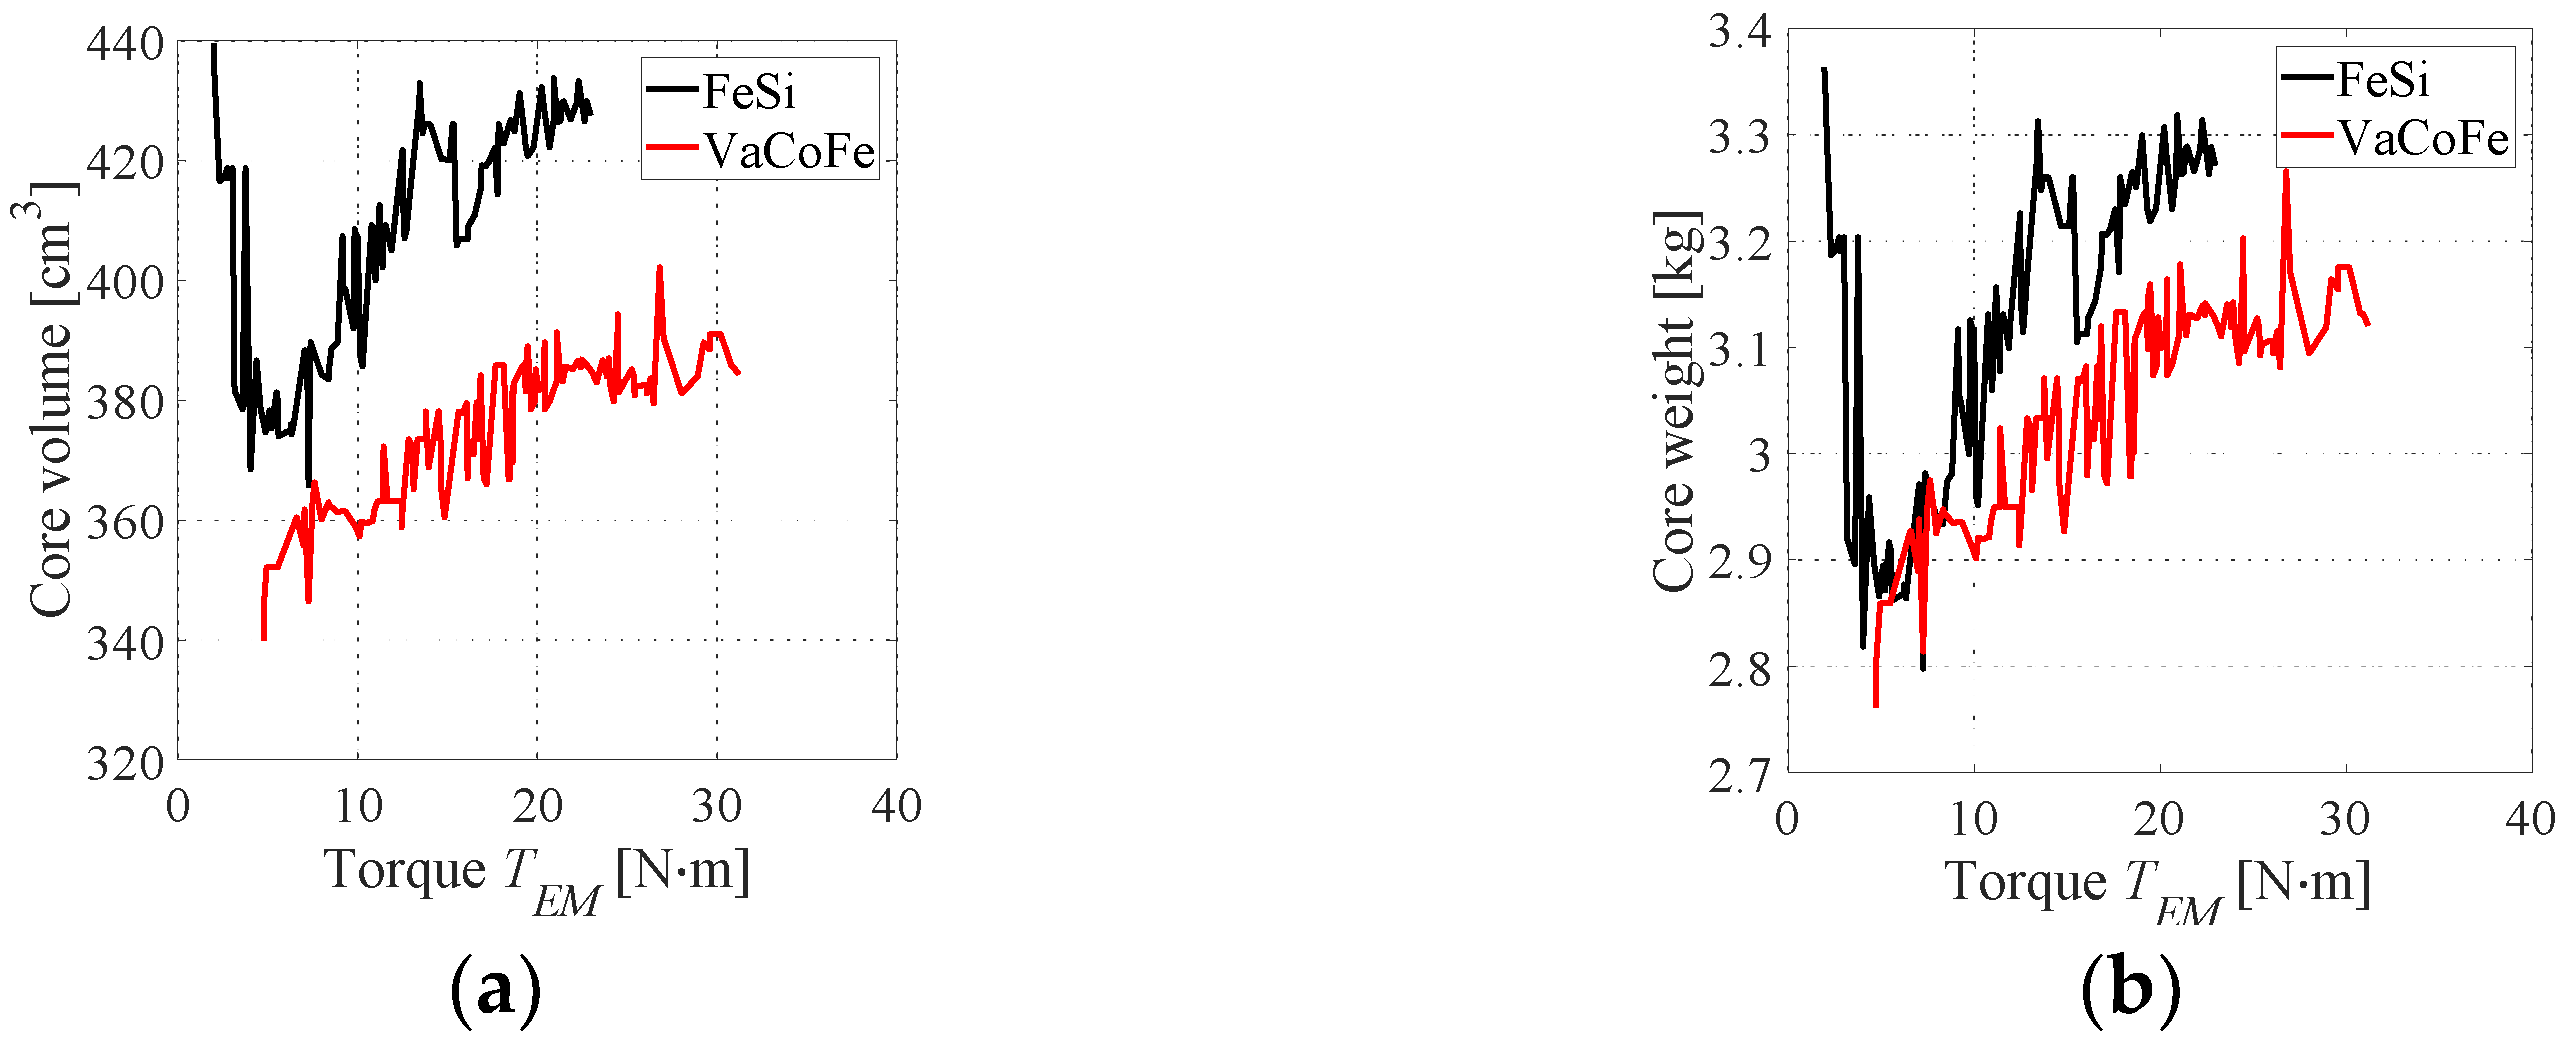
5. Results
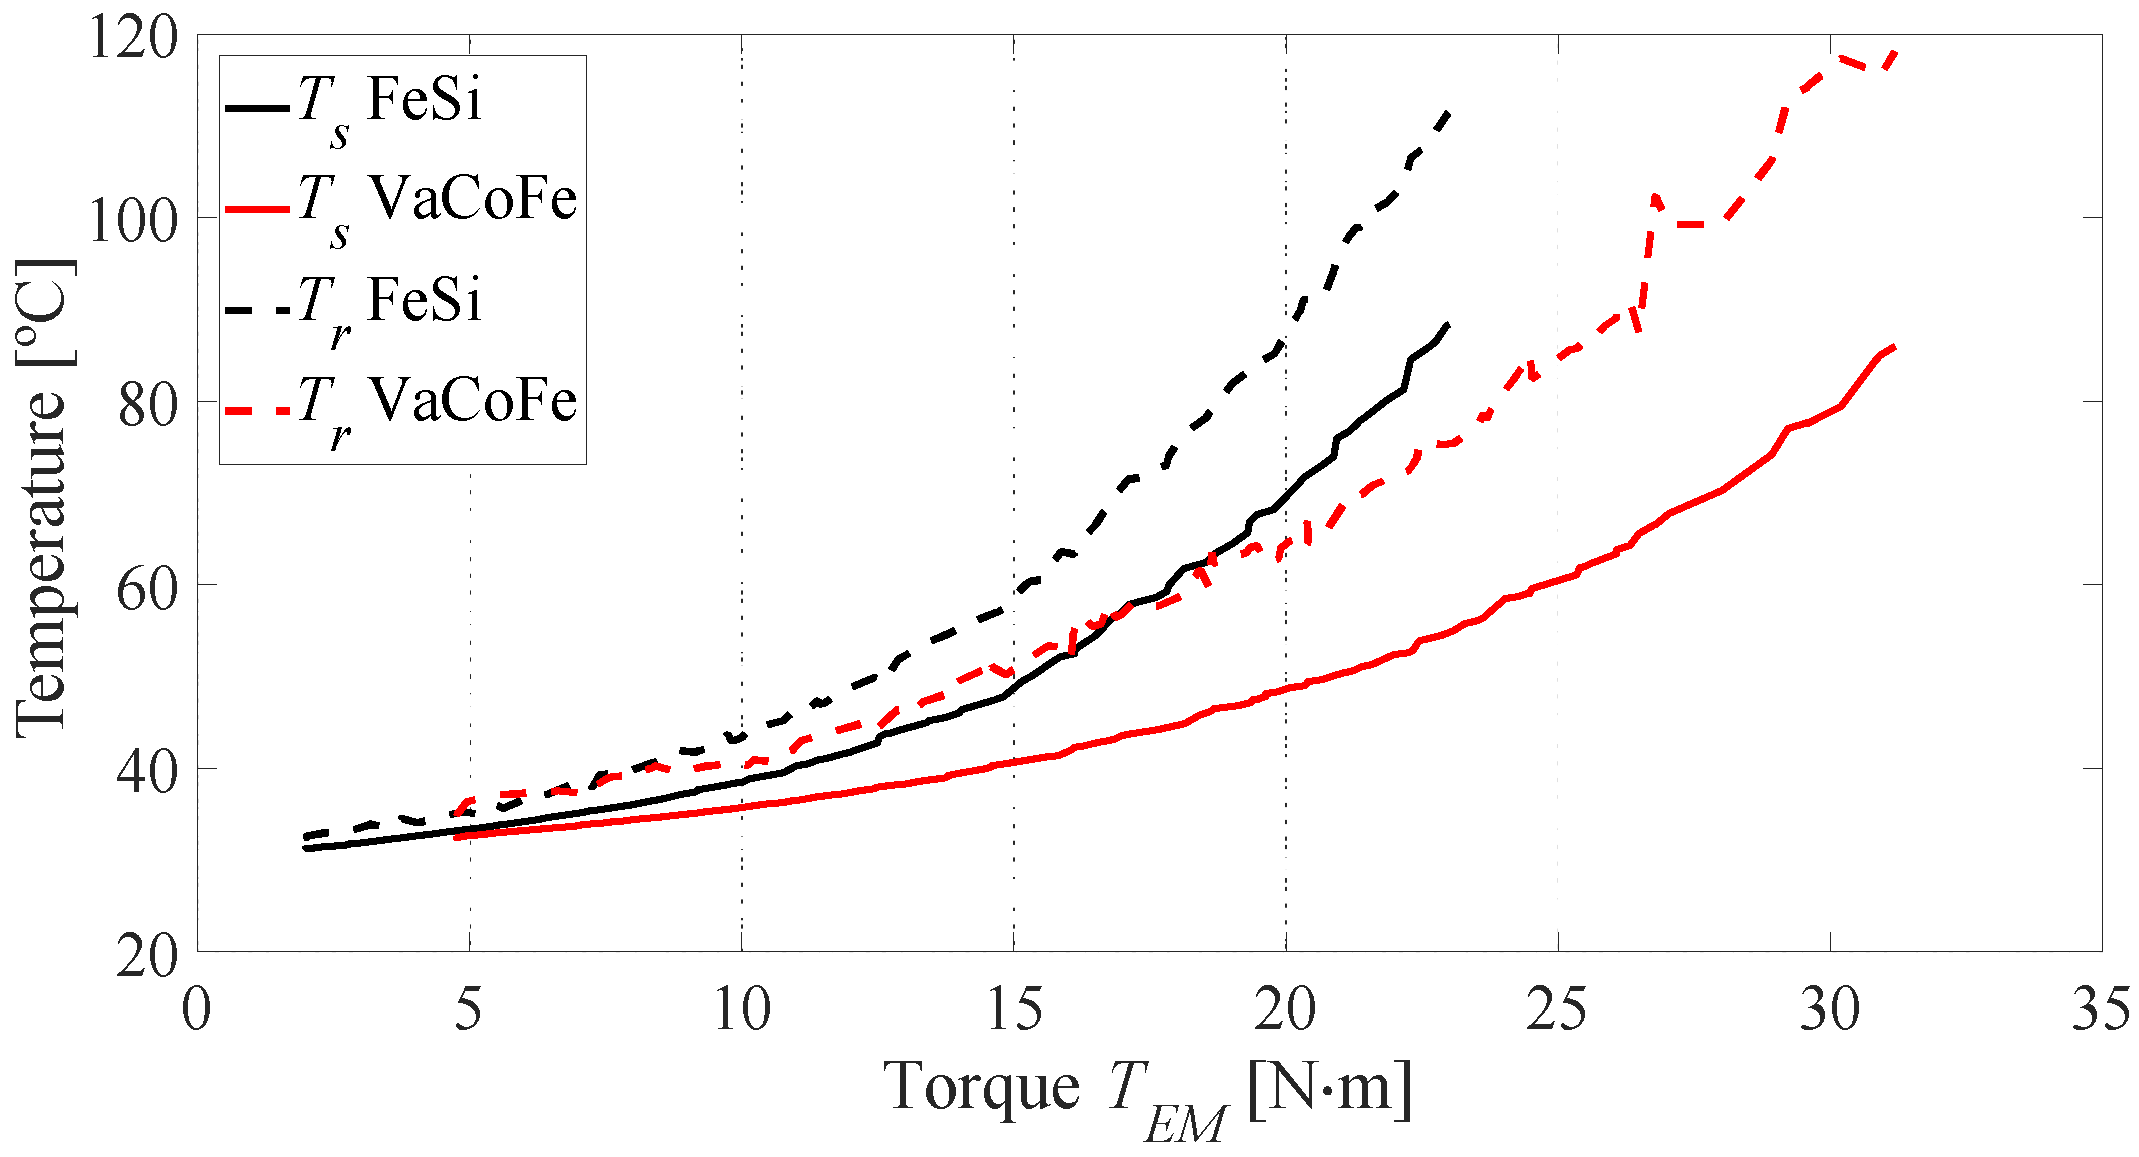
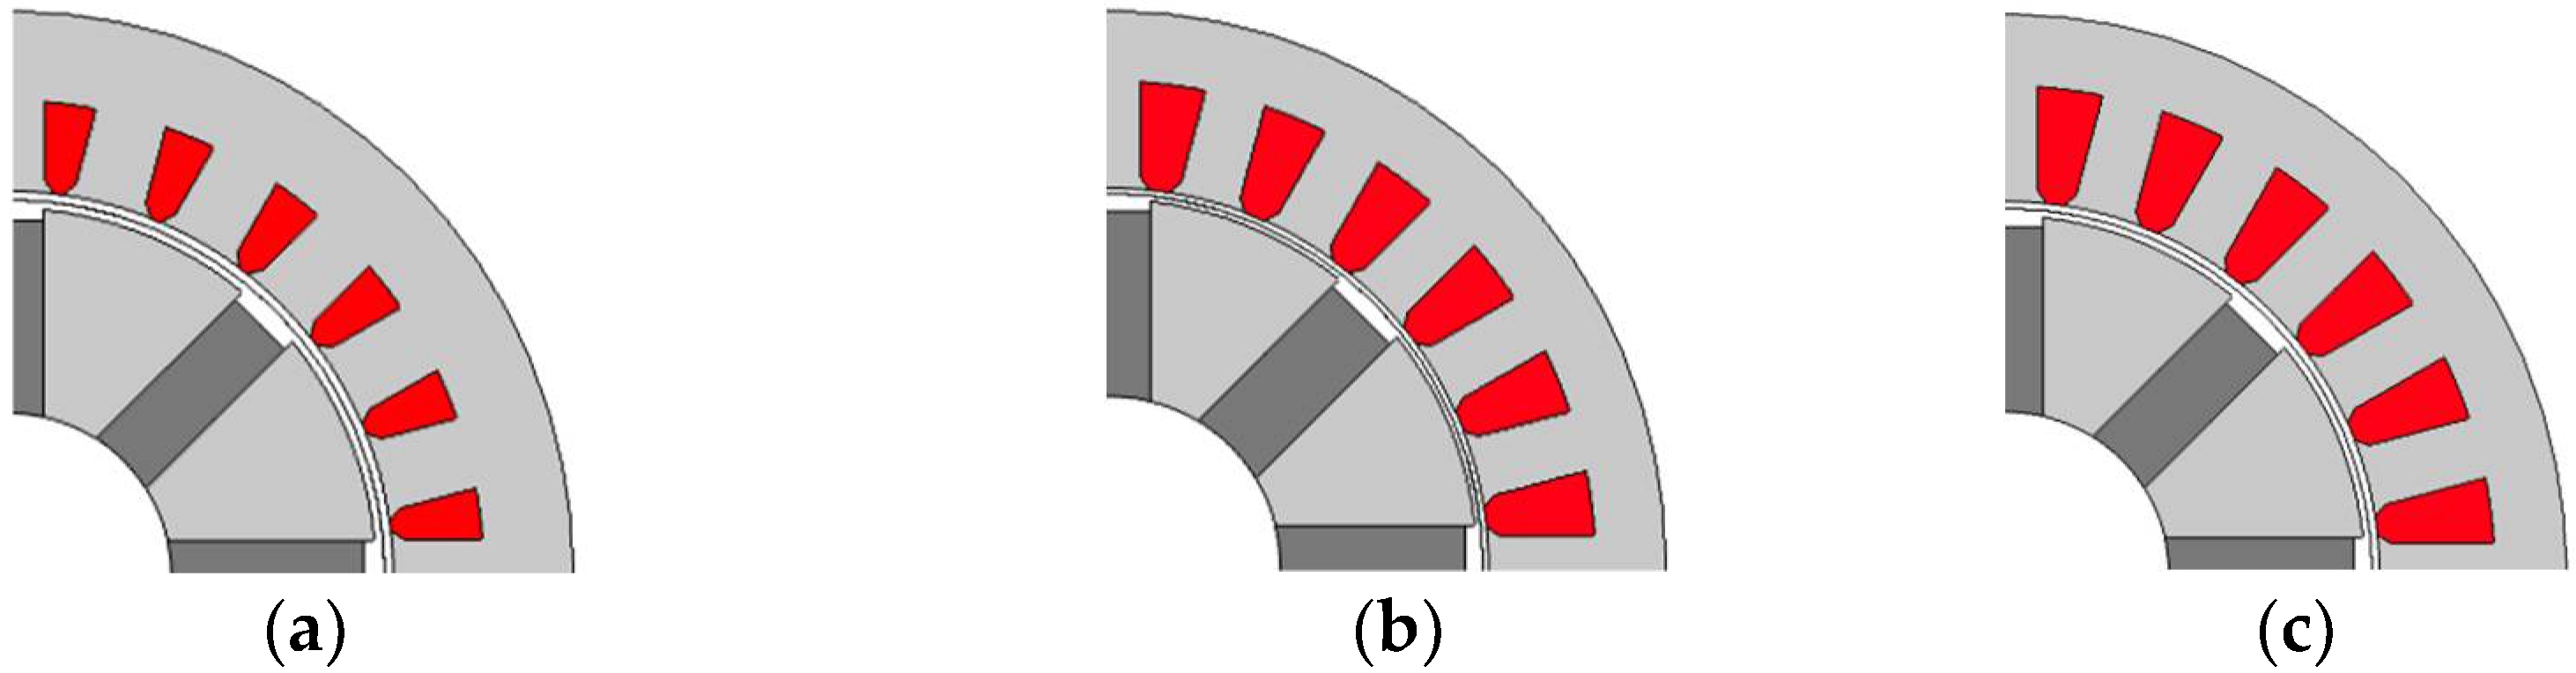
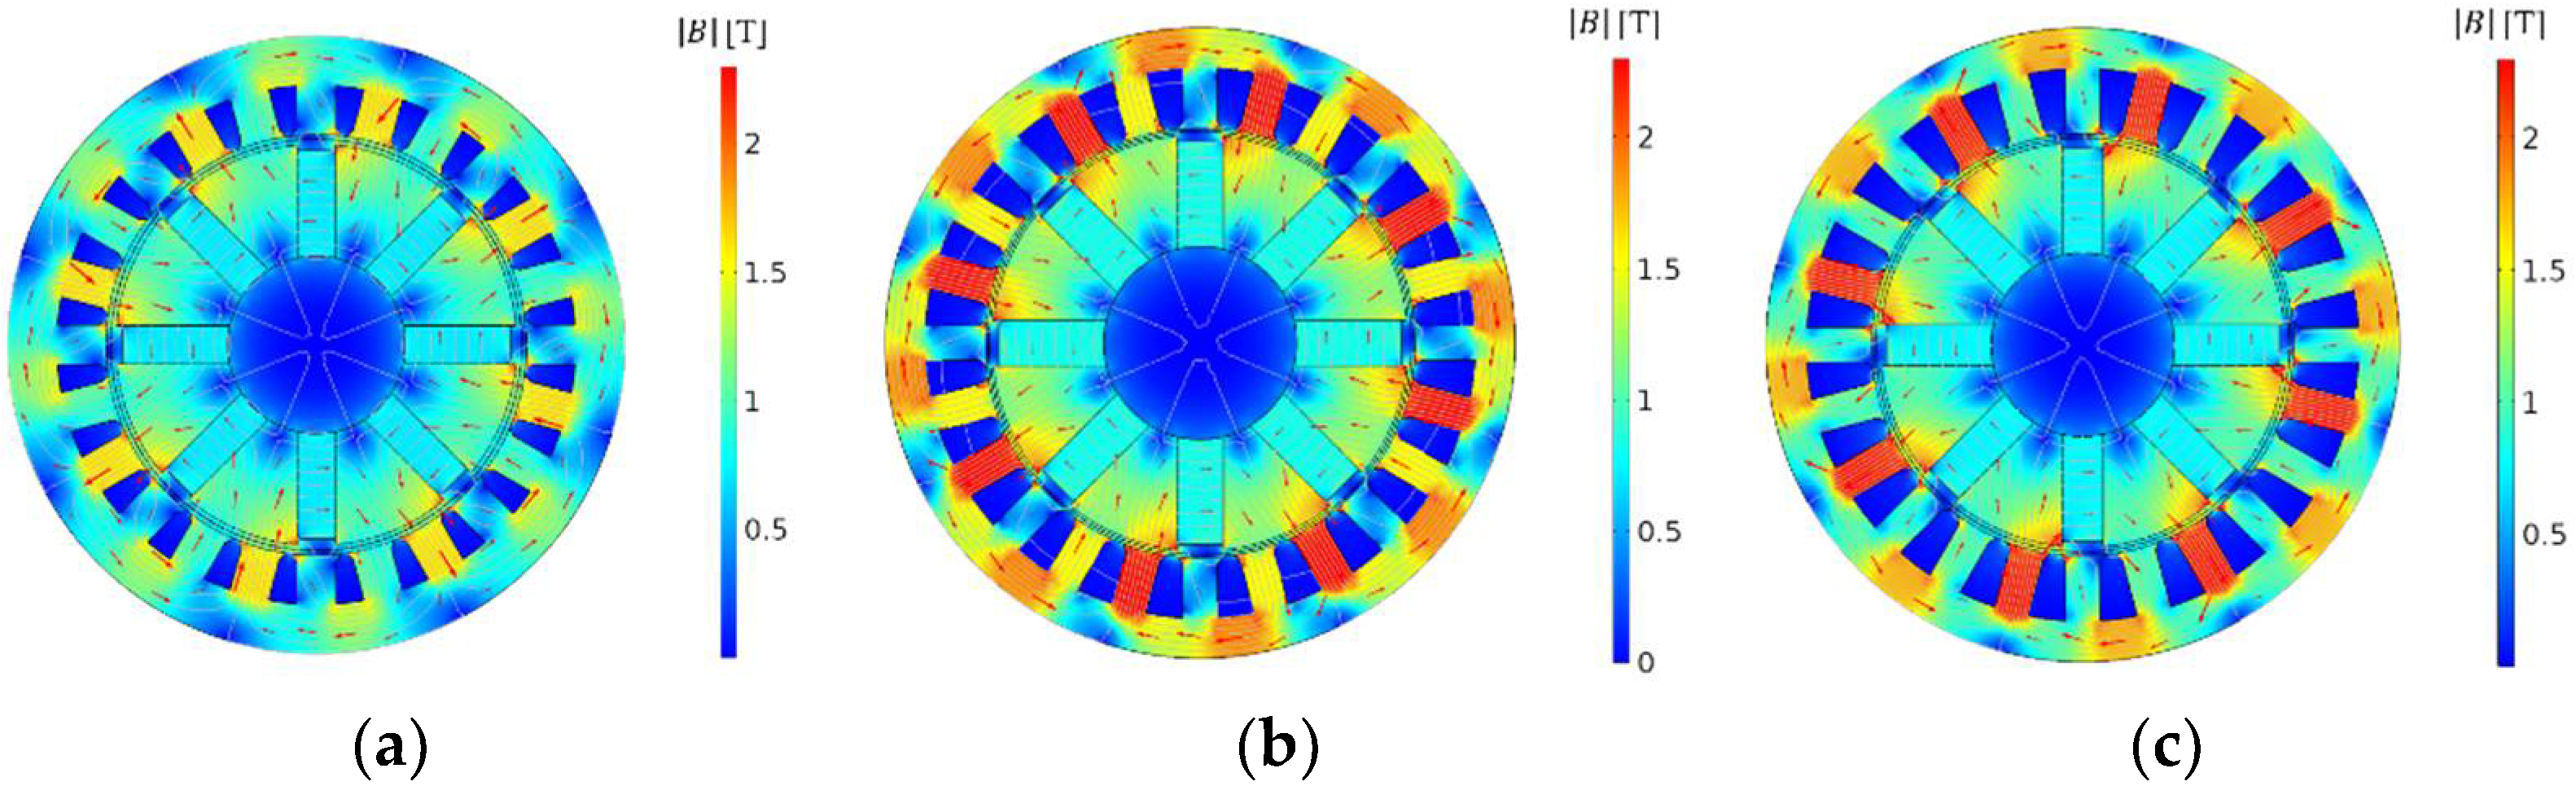
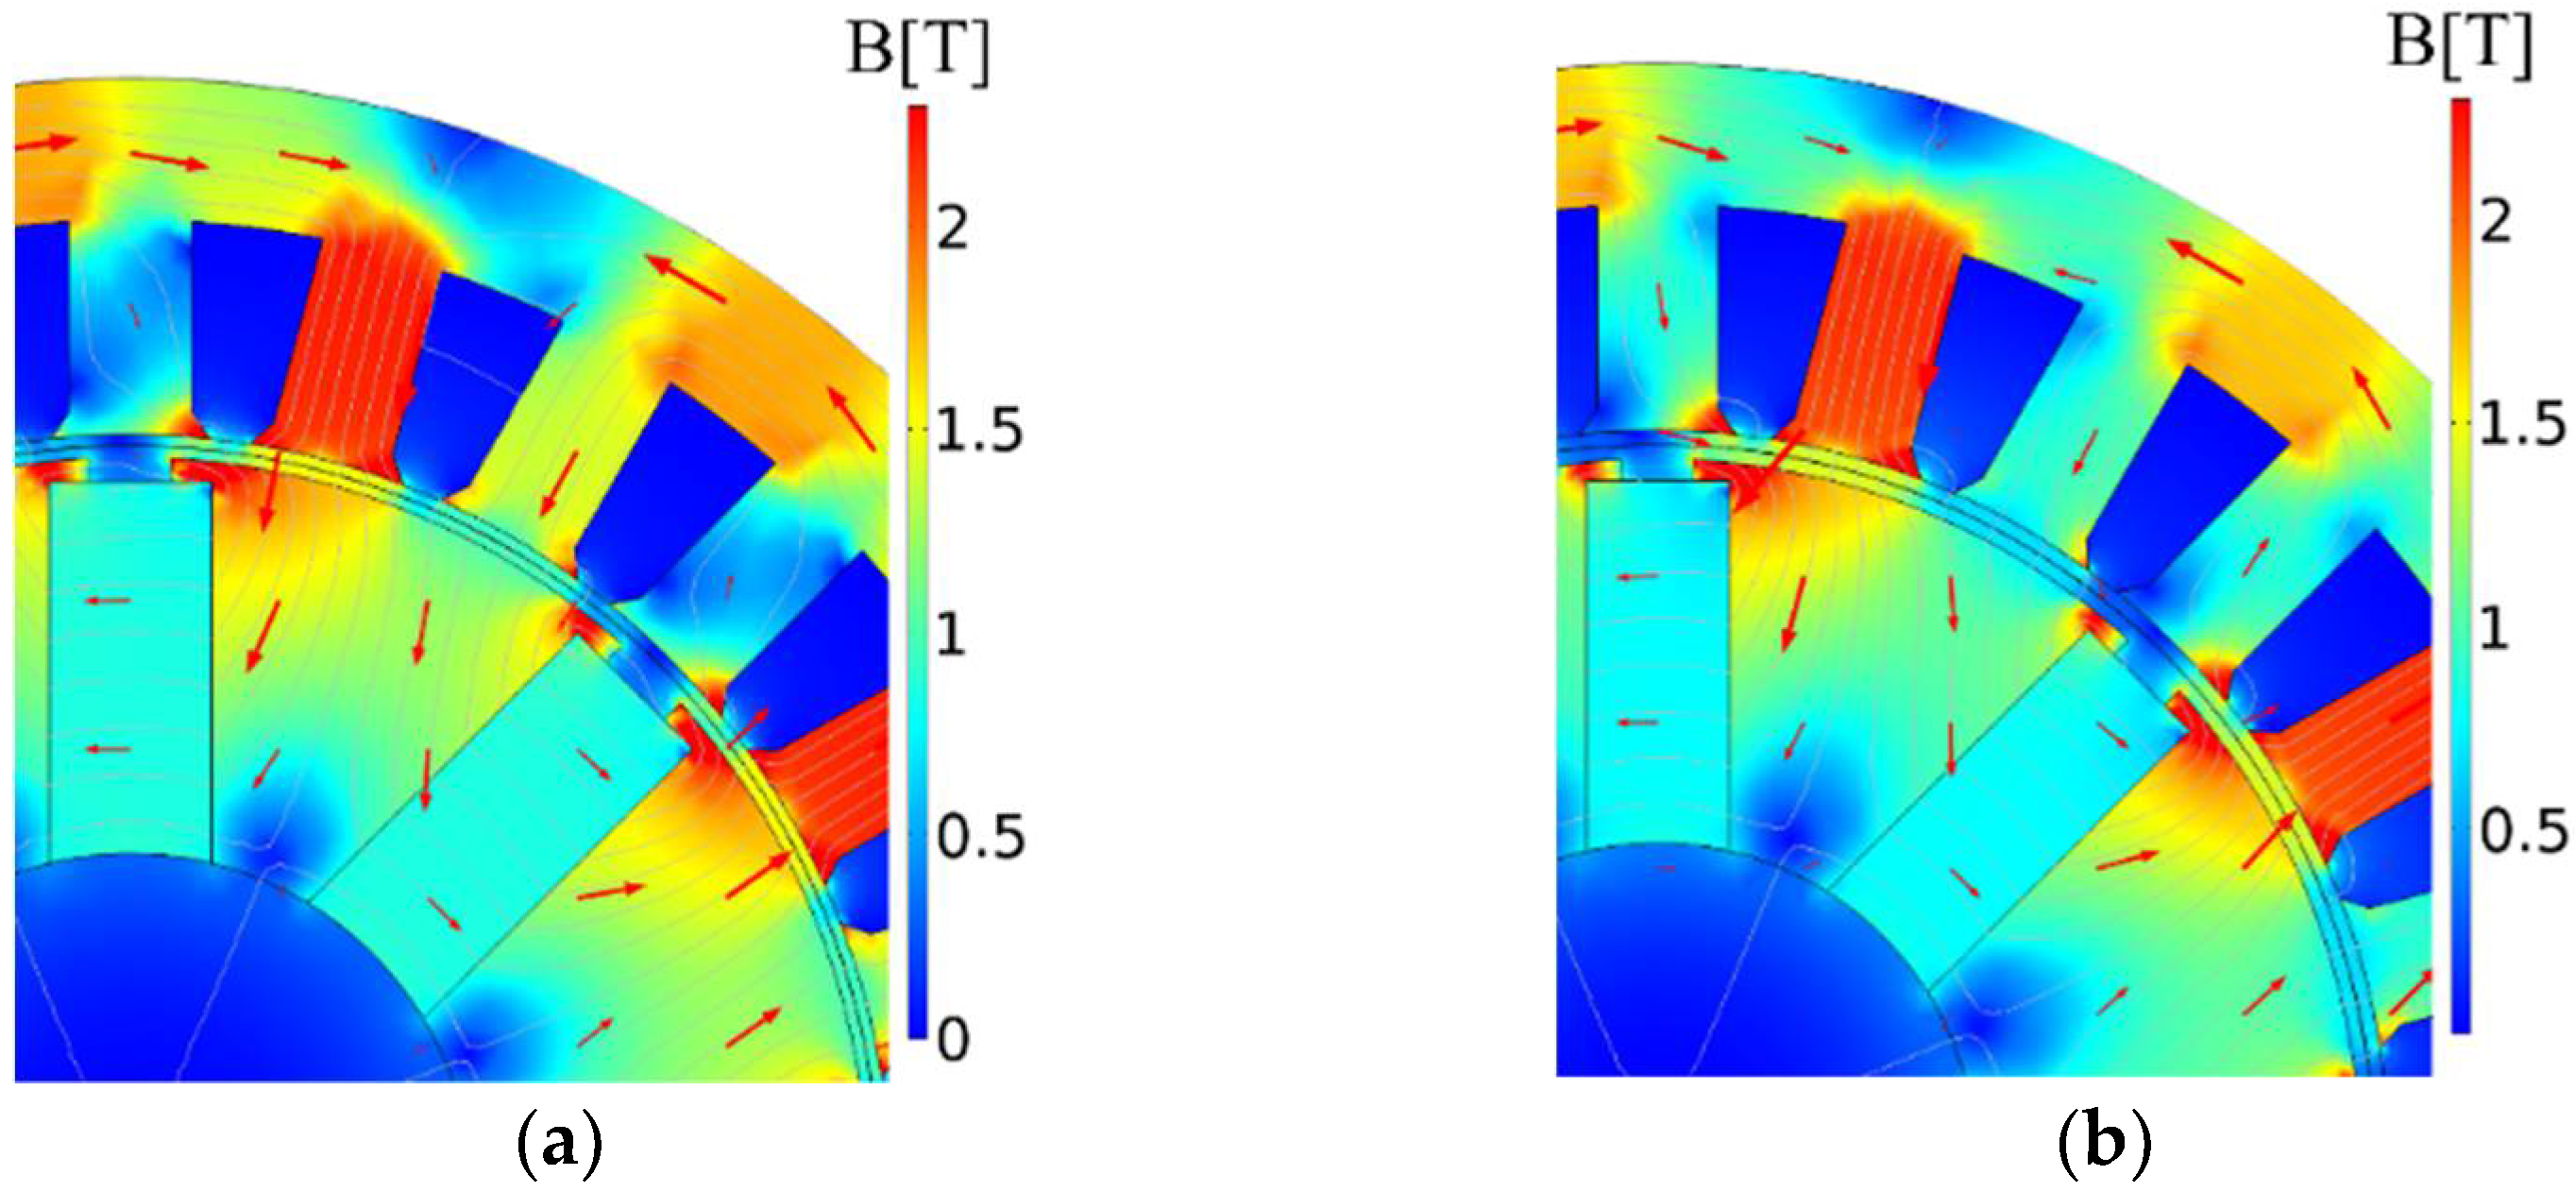
6. Detailed Analysis of Selected Geometries
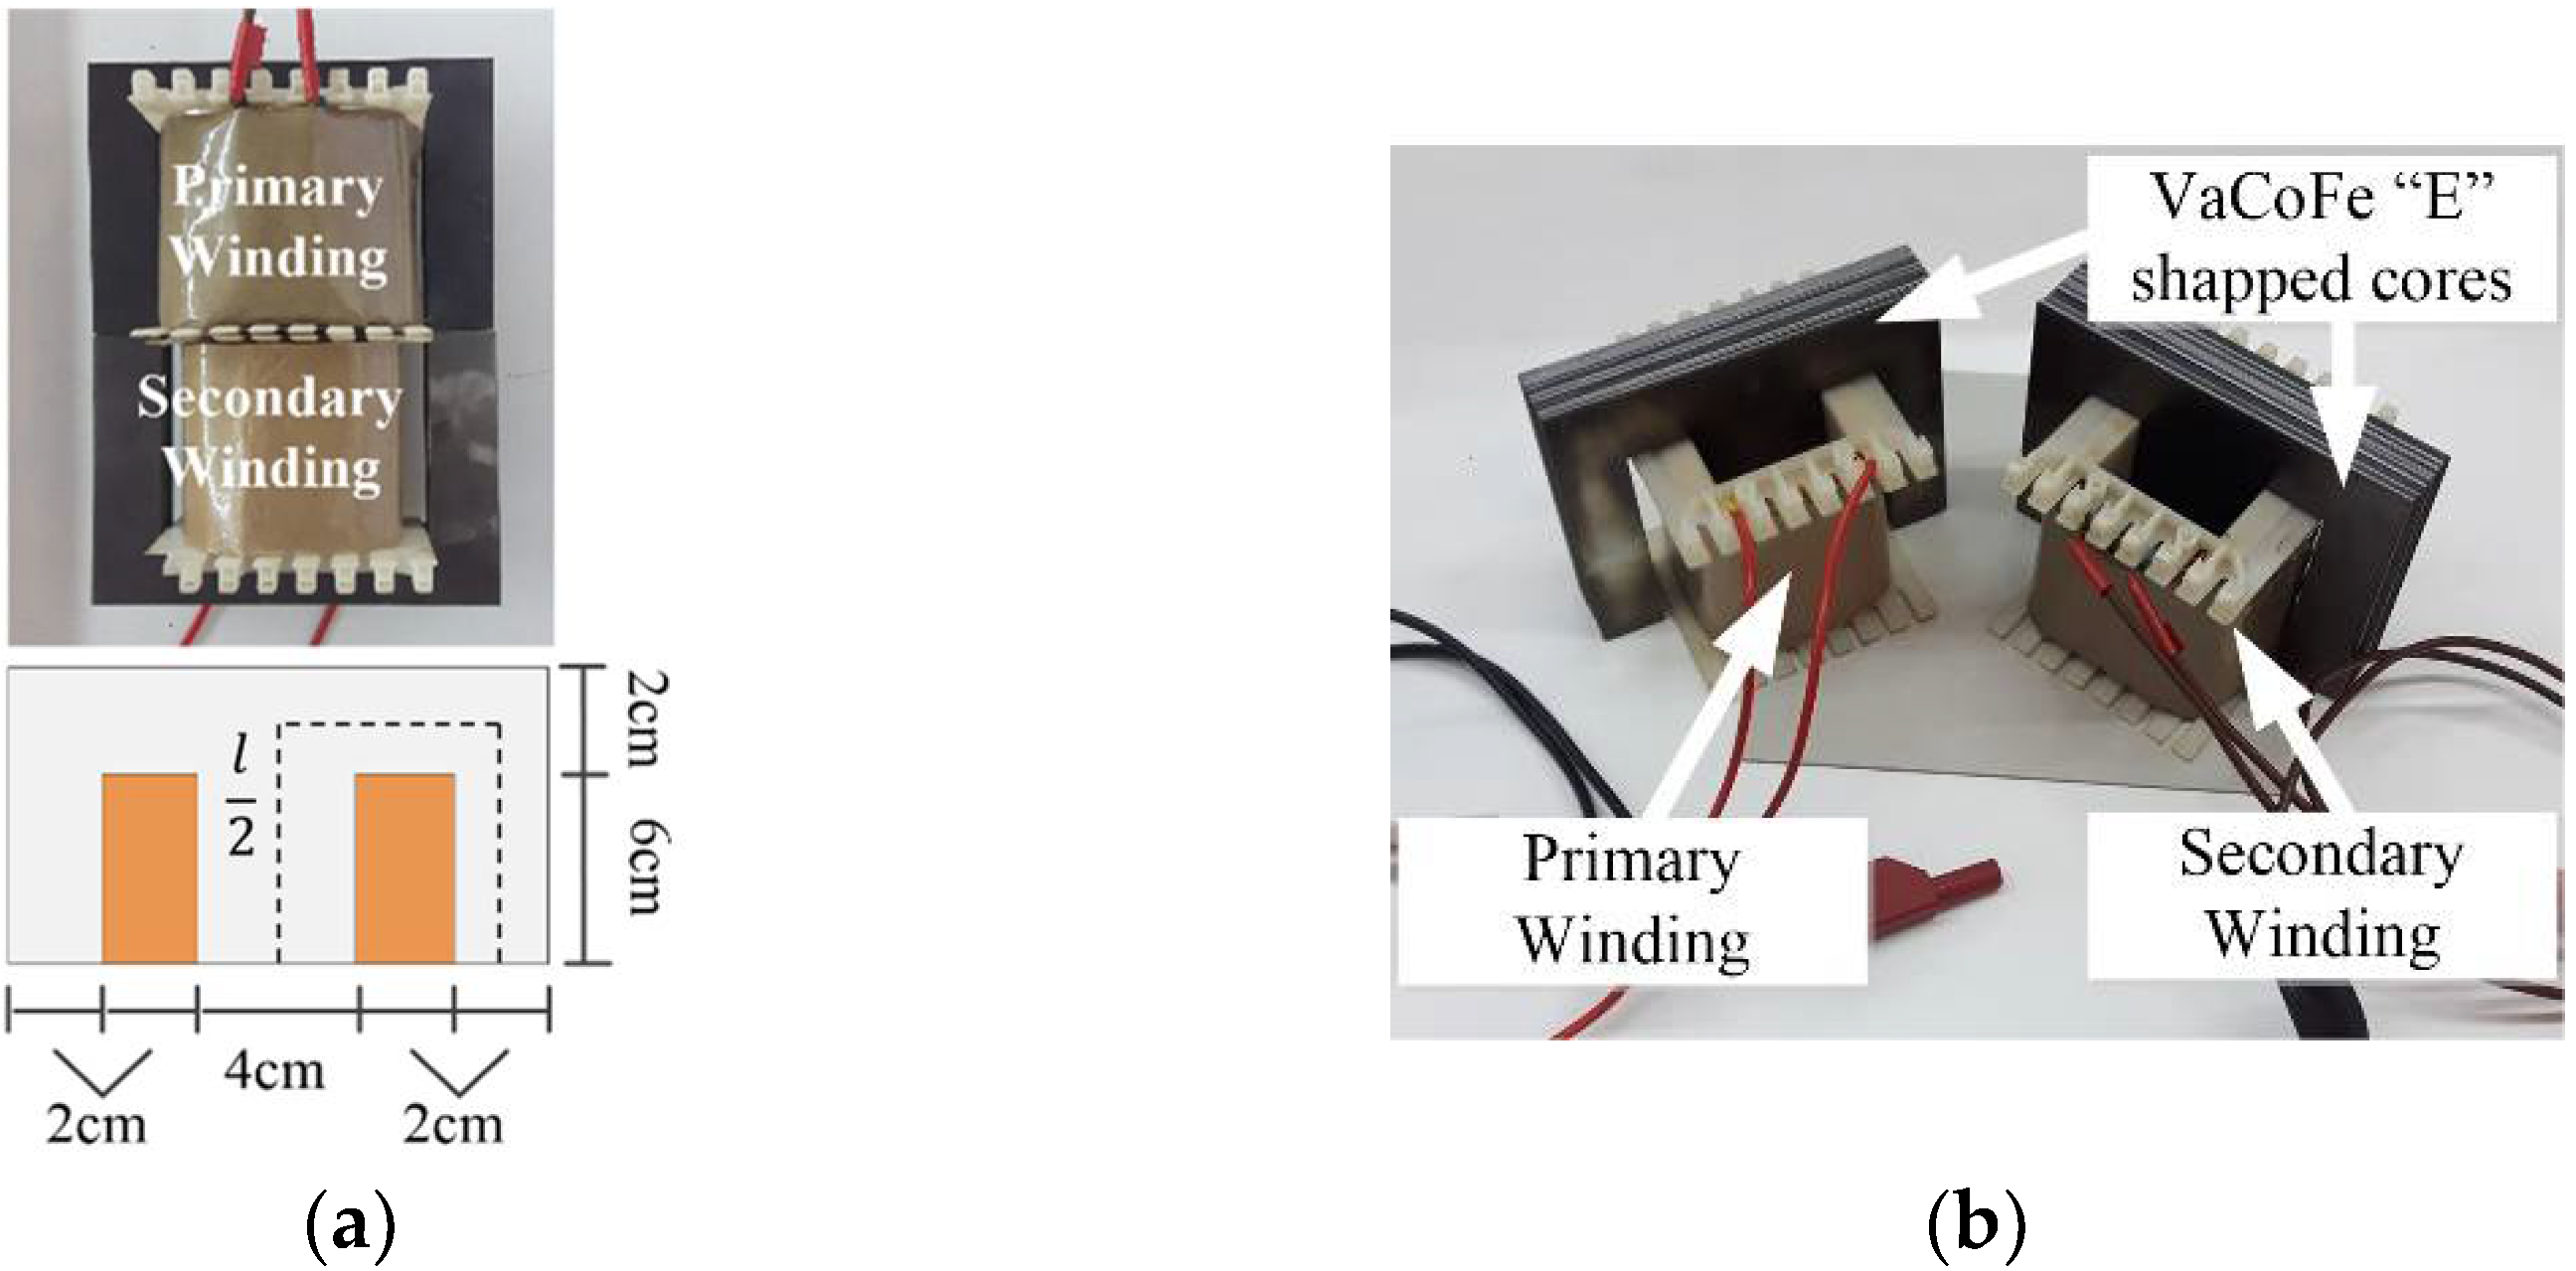
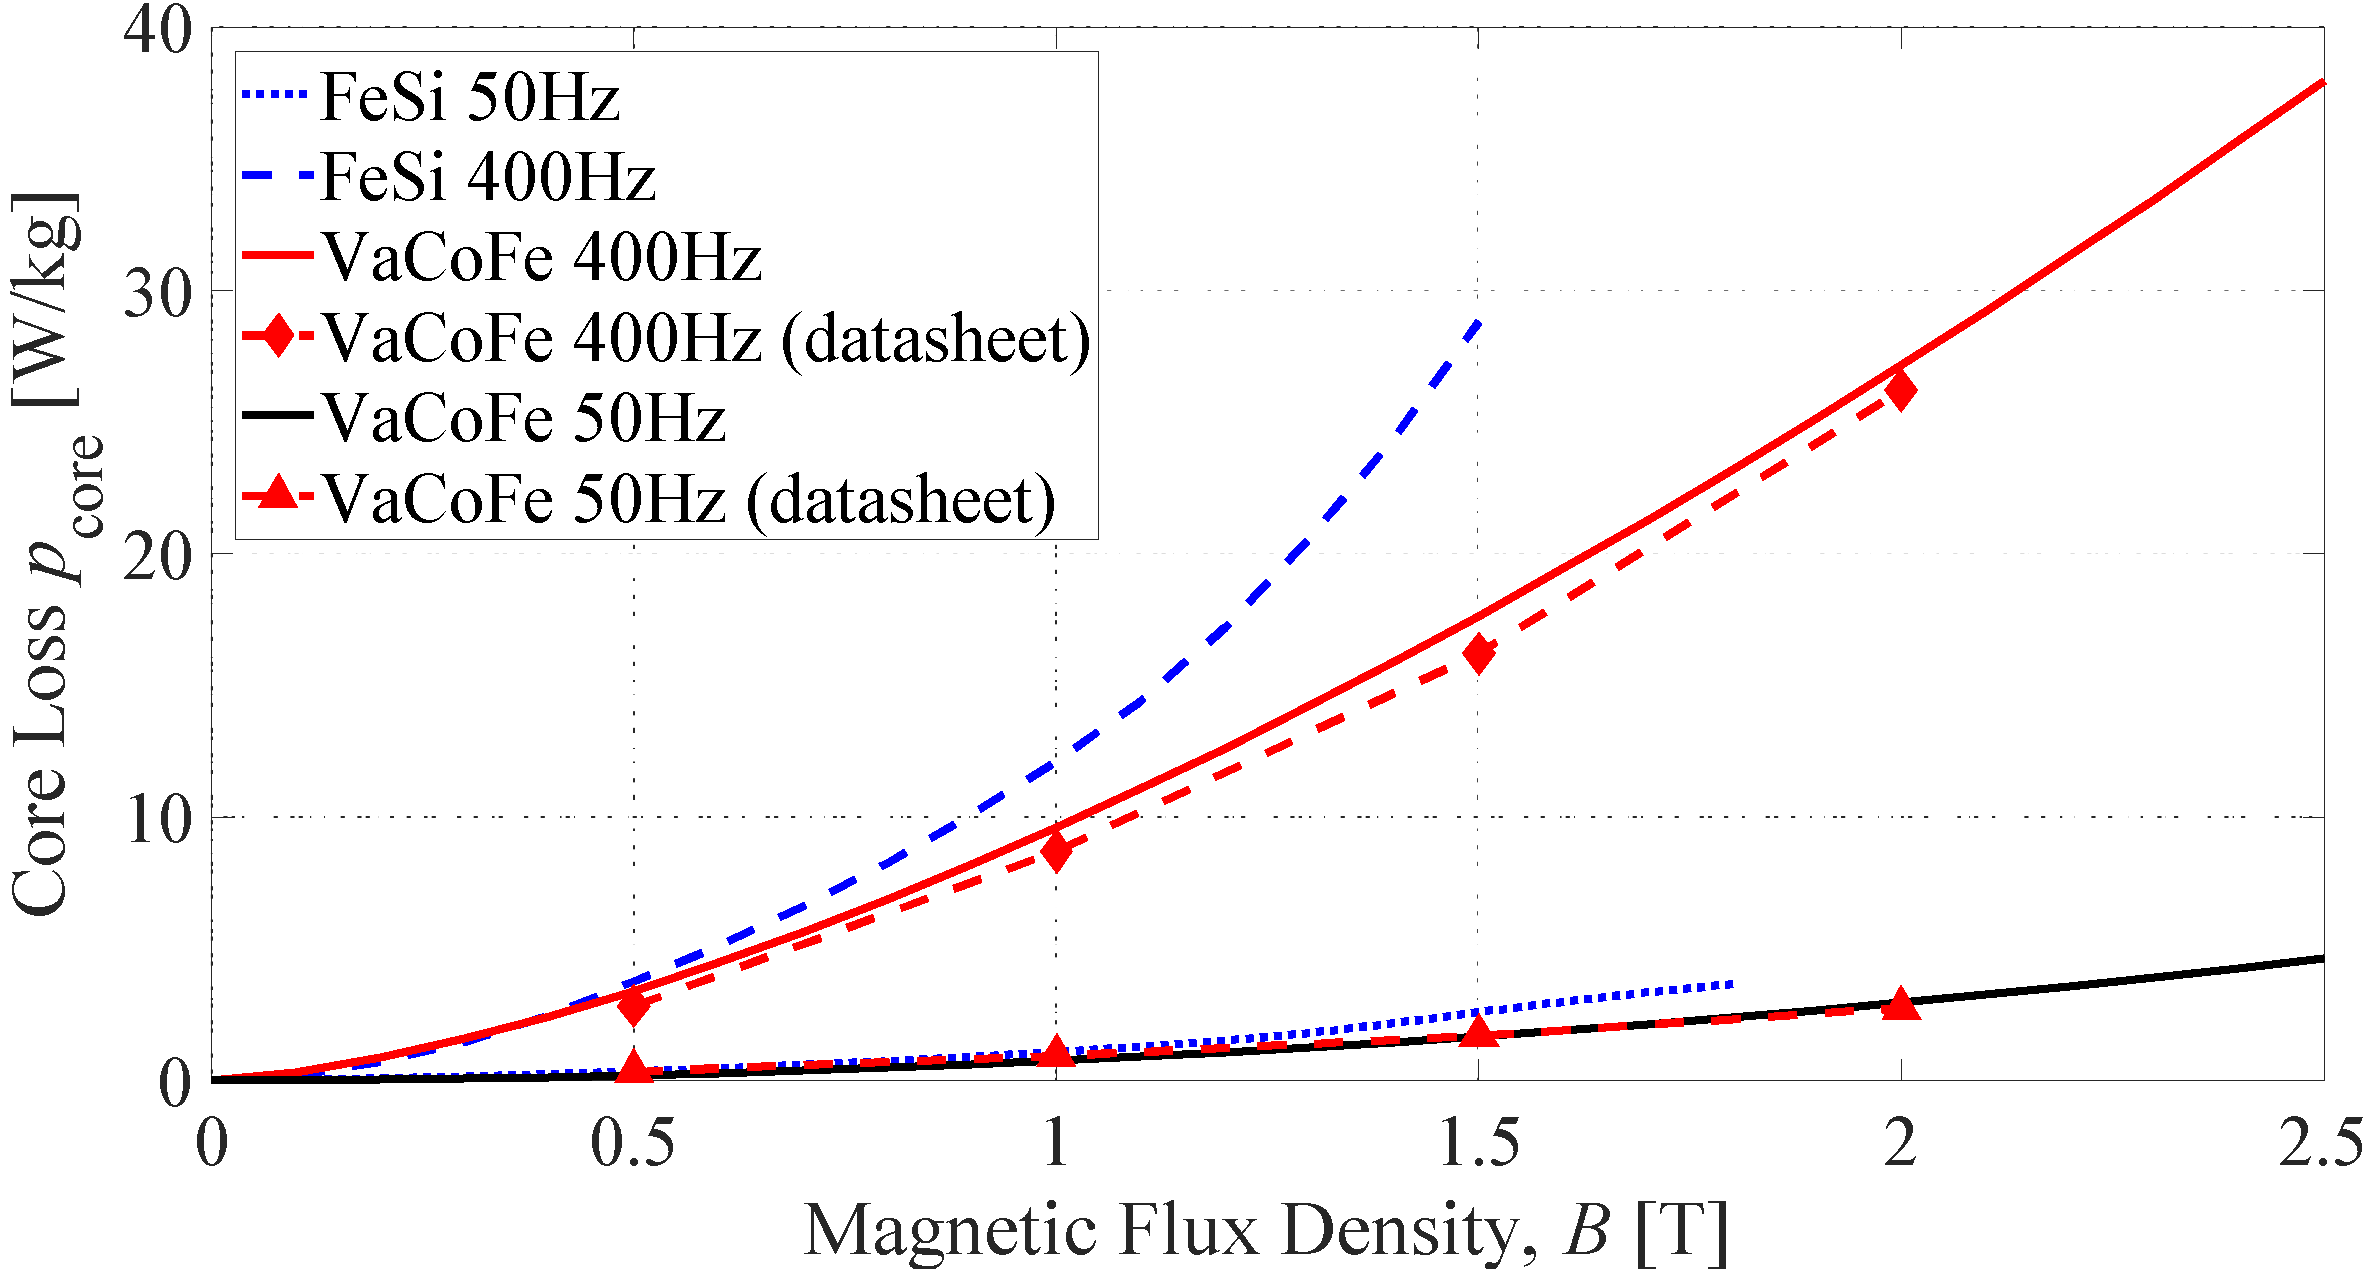
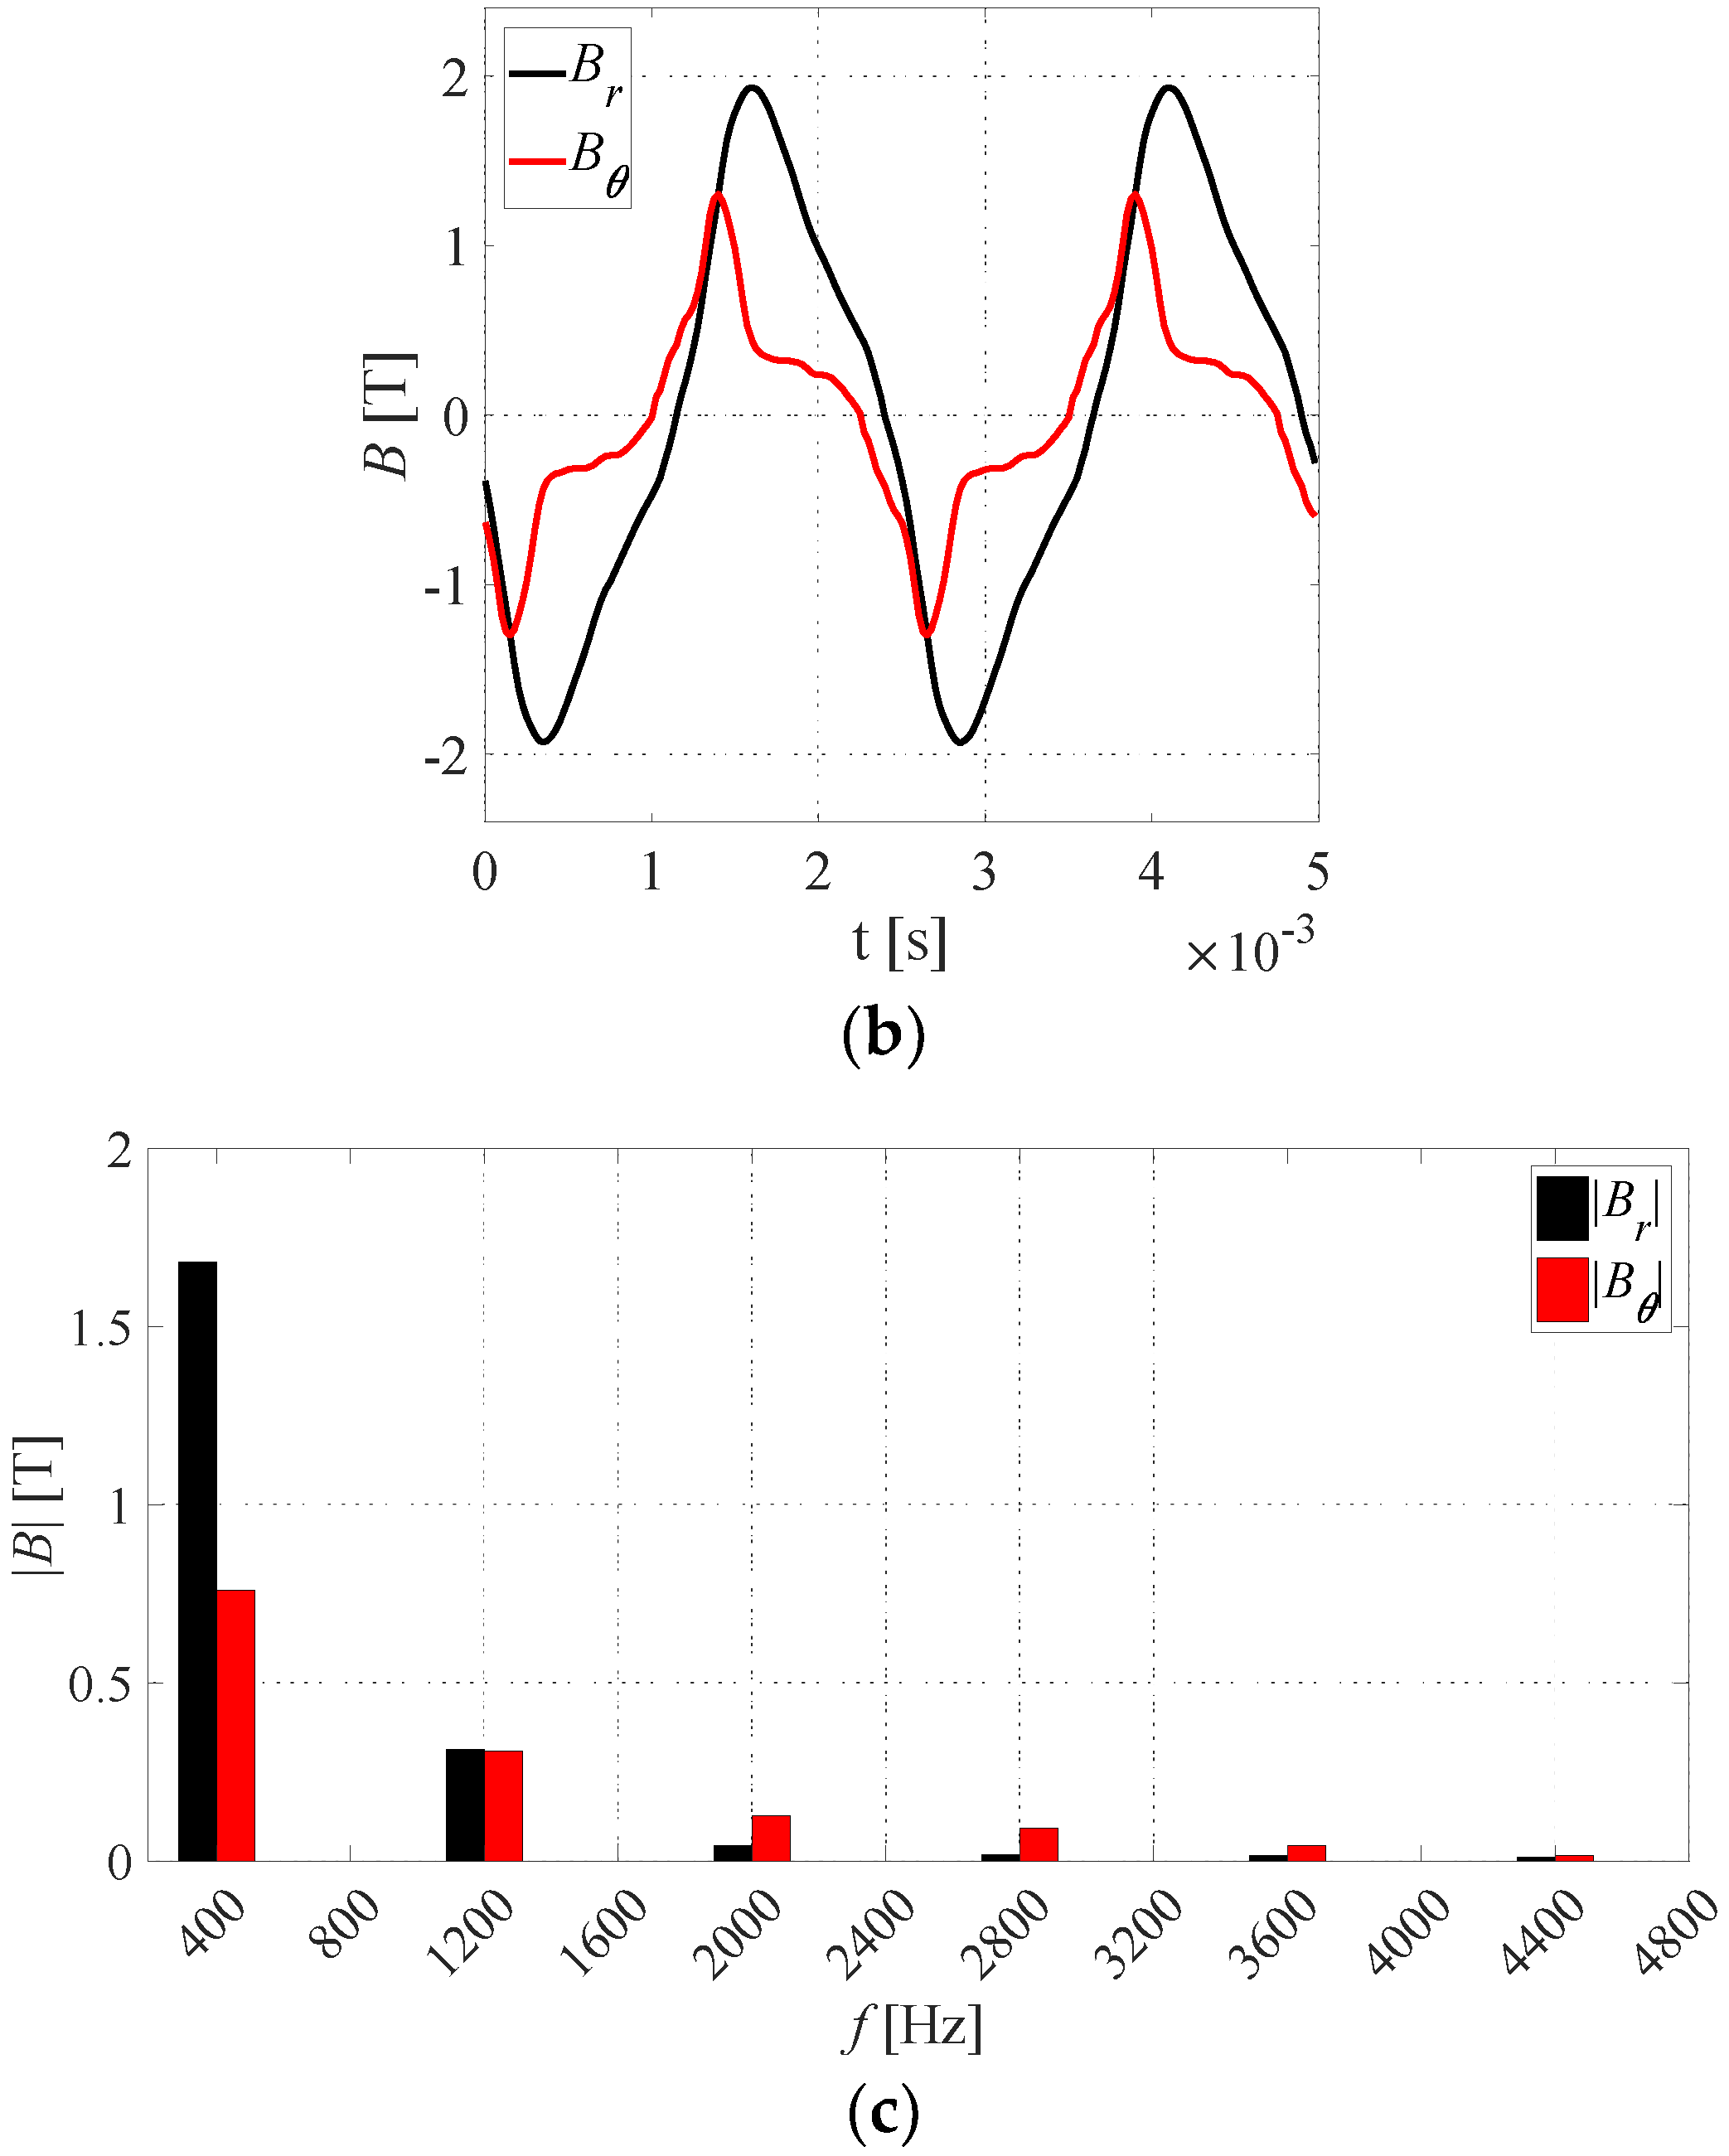
6.1. Core Losses
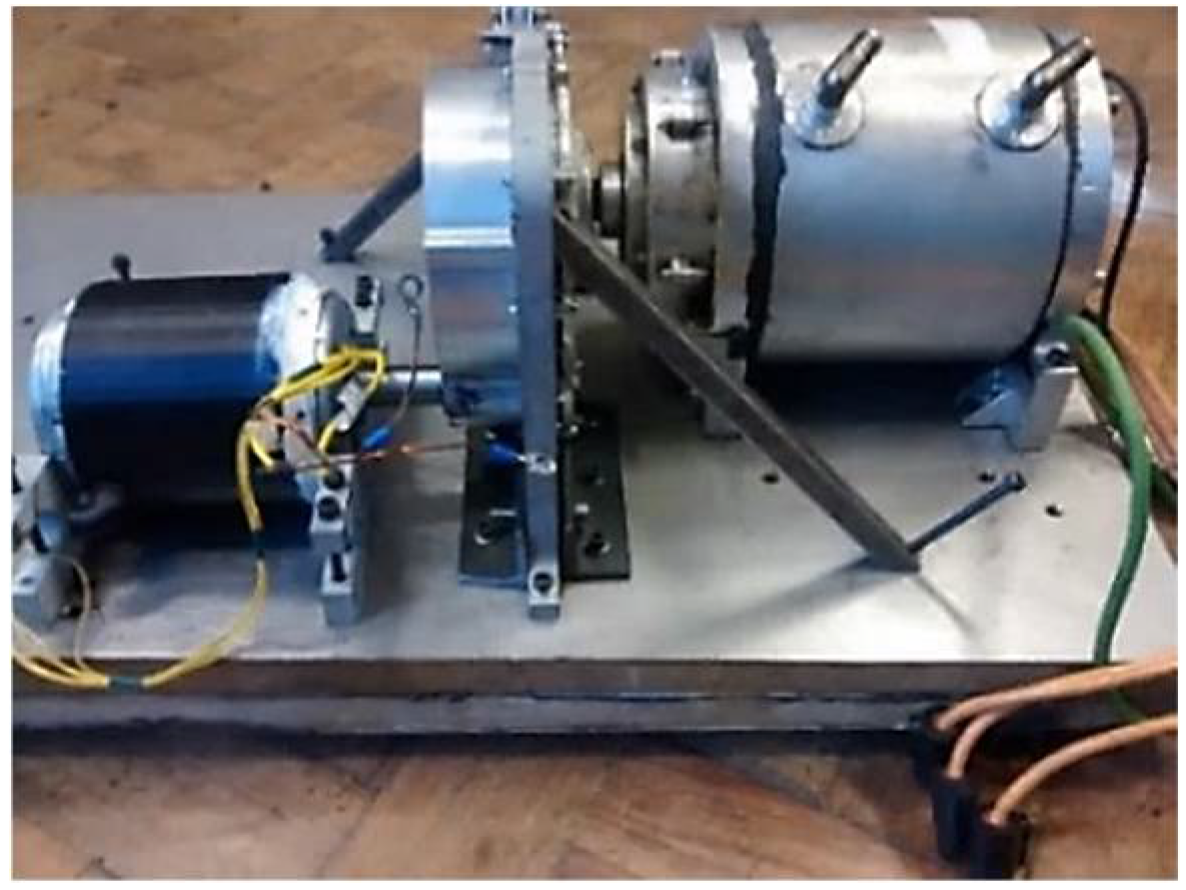
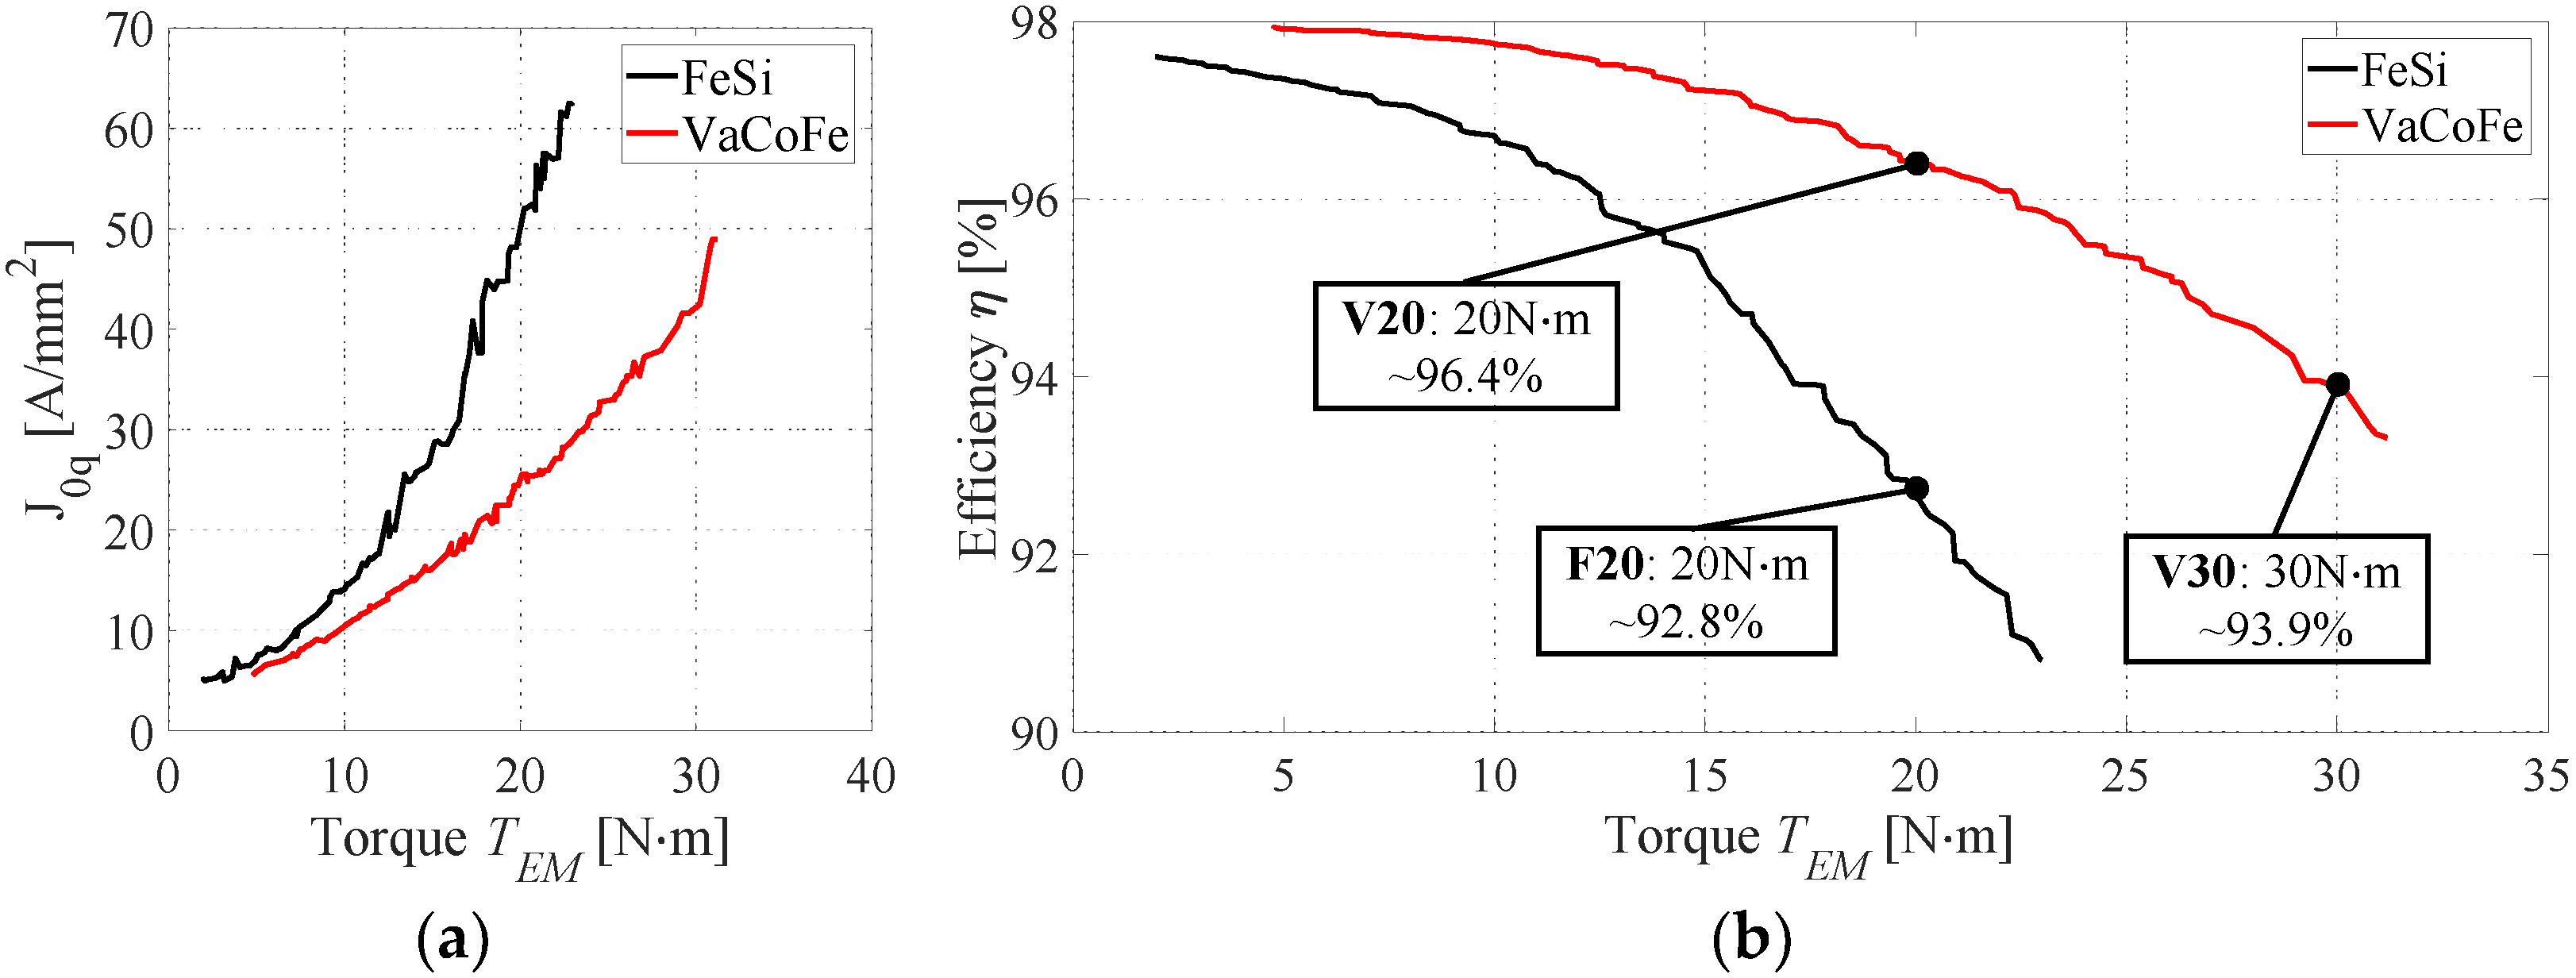
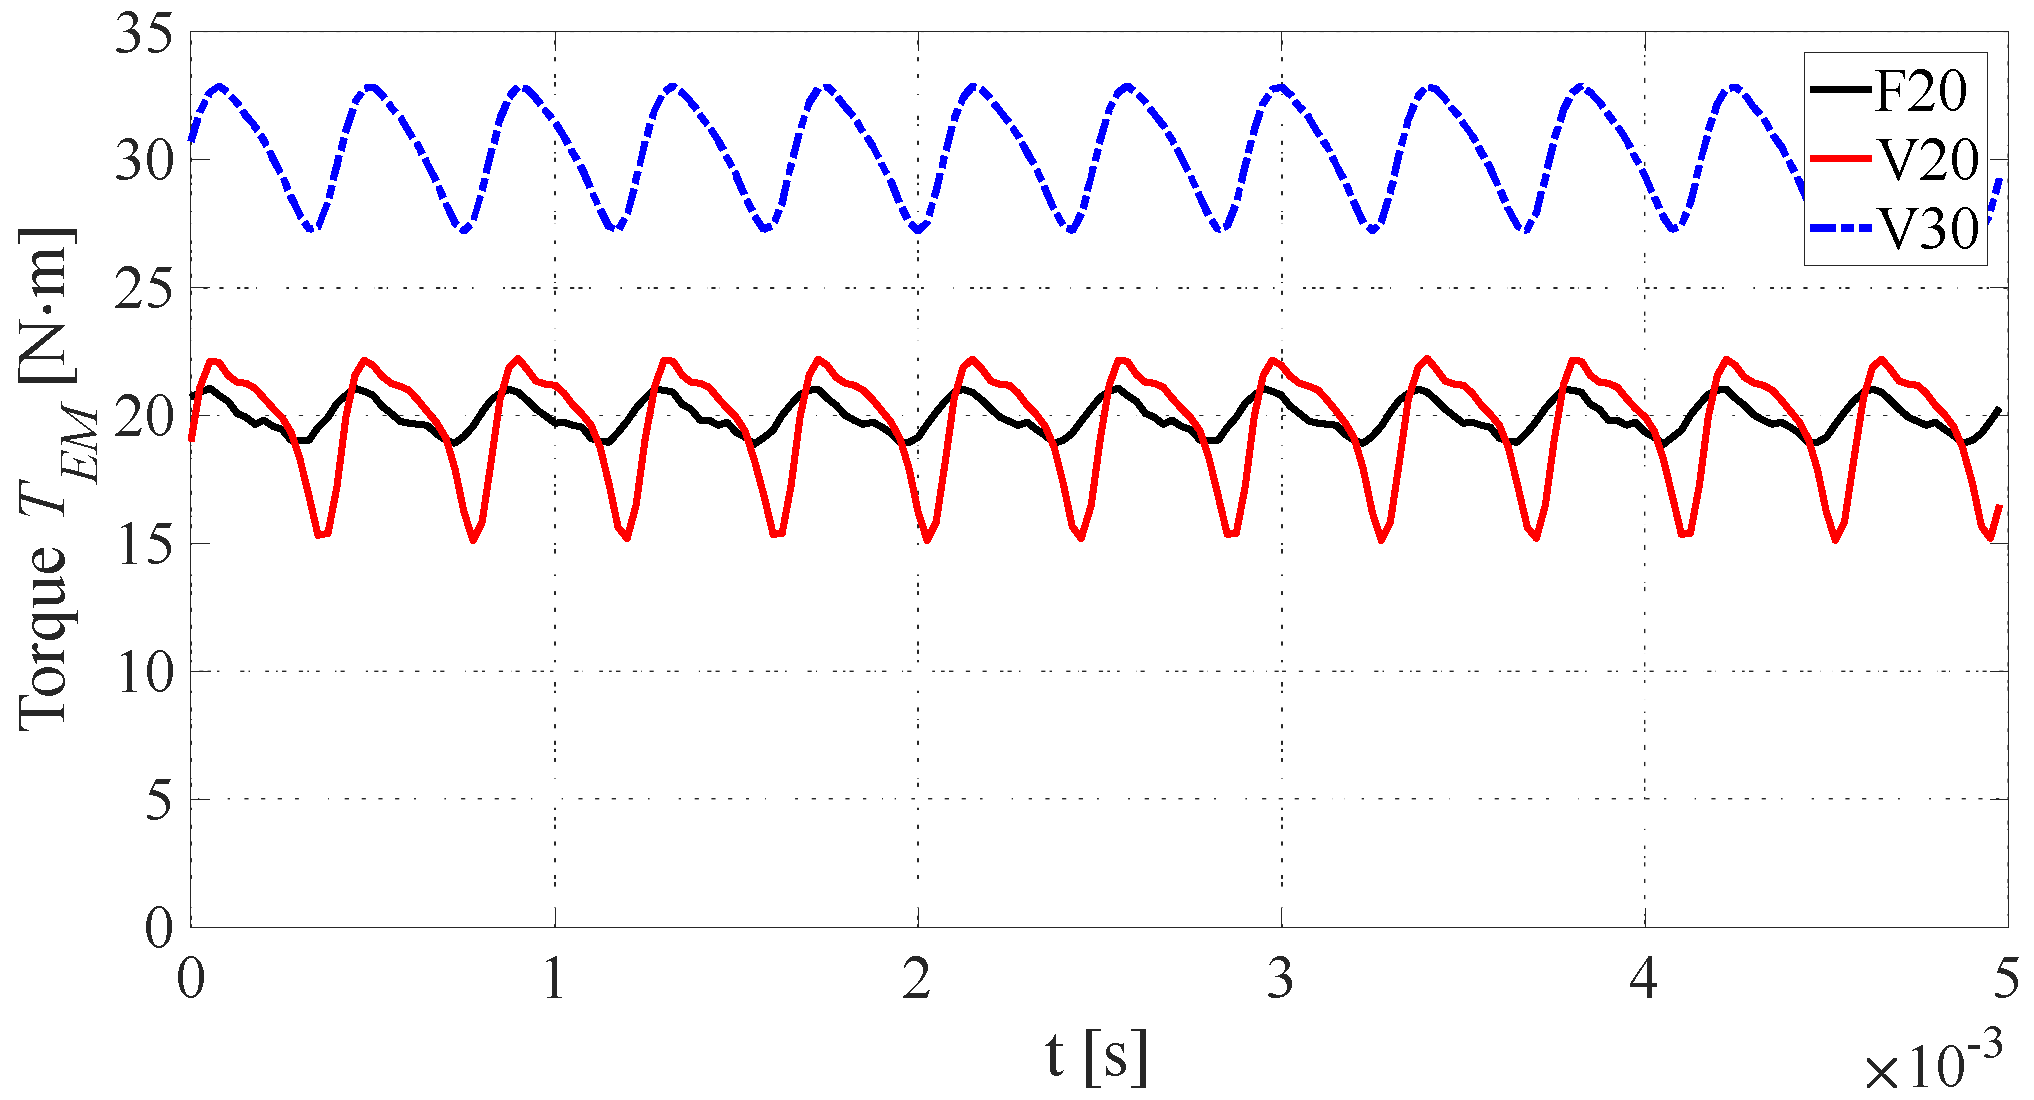
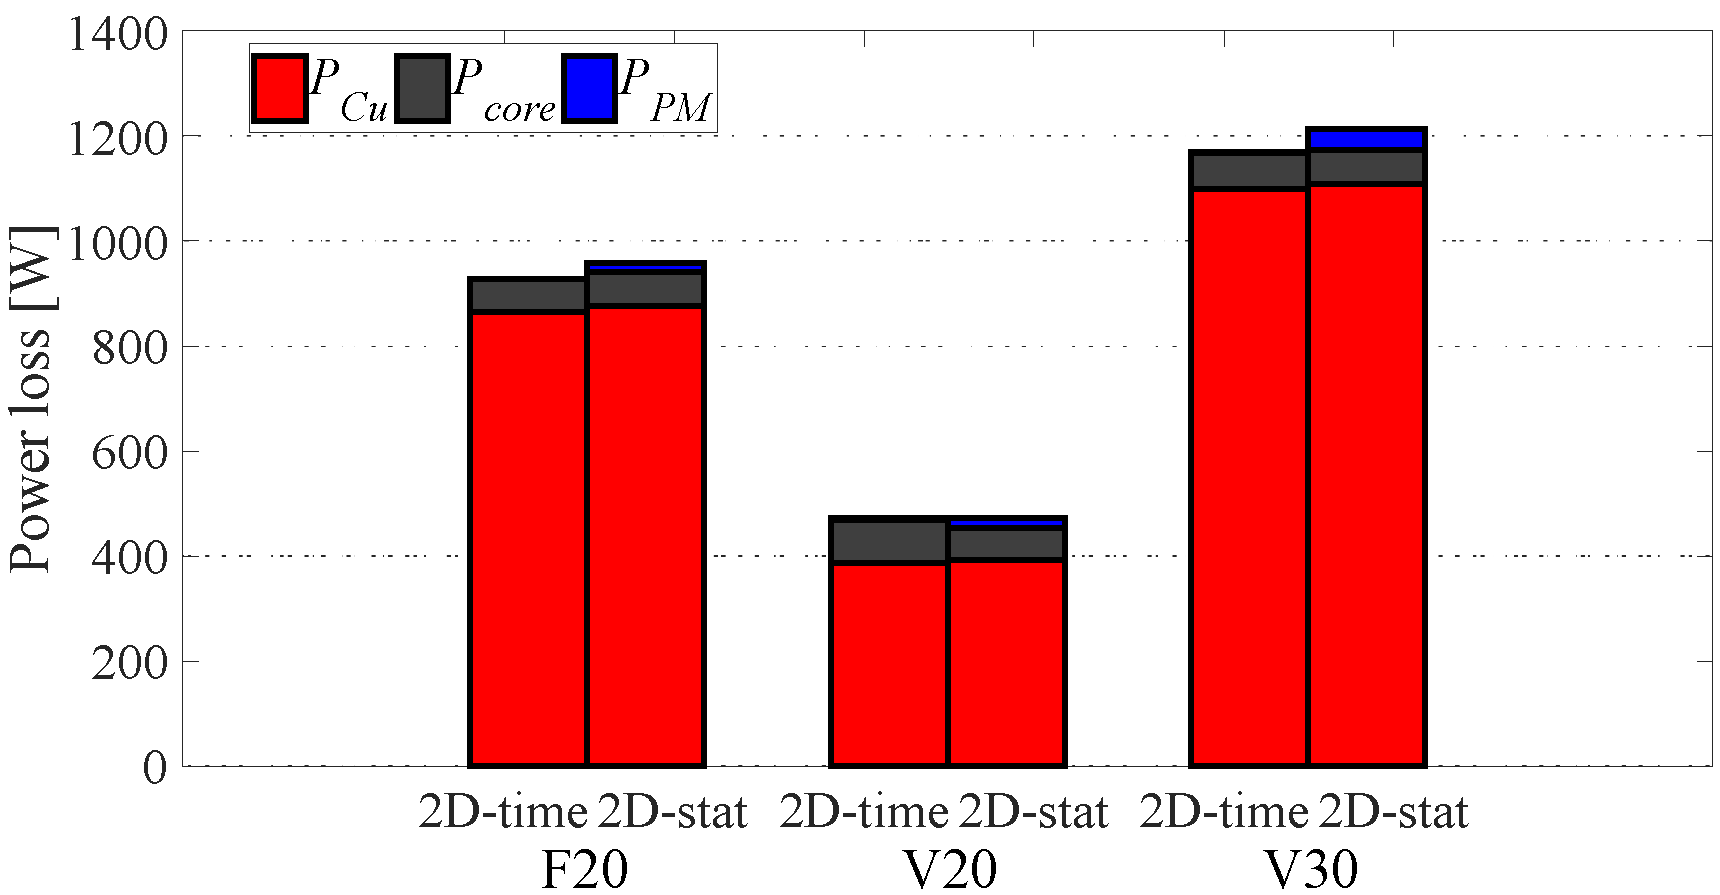
6.2. Results
7. Conclusions
Author Contributions
Funding
Institutional Review Board Statement
Informed Consent Statement
Data Availability Statement
Conflicts of Interest
References
- NASA Aeronautics. NASA Aeronautics: Strategic Implementation Plan: 2019 Update; Technical Report NP-2017-01-2352-HQ; National Aeronautics and Space Administration (NASA): Washington, DC, USA, 2019.
- Jayaraman, T. Effect of Processing of HIPERCO® 50 Alloy Laminates on Their Magnetic Properties. J. Electron. Mater. 2005, 44, 4379–4386. [Google Scholar] [CrossRef]
- Krings, A.; Cossale, M.; Tenconi, A.; Soulard, J.; Cavagnino, A.; Boglietti, A. Magnetic materials used in electrical machines: A comparison and selection guide for early machine design. IEEE Ind. Appl. Mag. 2017, 23, 21–28. [Google Scholar] [CrossRef] [Green Version]
- Zhang, X.; Haran, K.S. High-specific-power electric machines for electrified transportation applications-technology options. In Proceedings of the 2016 IEEE Energy Conversion Congress and Exposition (ECCE), Milwaukee, WI, USA, 18–22 September 2016. [Google Scholar]
- Palmieri, M.; Perta, M.; Cupertino, F. Design of a 50.000-r/min Synchronous Reluctance Machine for an Aeronautic Diesel Engine Compressor. IEEE Trans. Ind. Appl. 2016, 52, 3831–3838. [Google Scholar] [CrossRef]
- Fernando, N.; Vakil, G.; Arumugam, P.; Amankwah, E.; Gerada, C.; Bozhko, S. Impact of Soft Magnetic Material on Design of High-Speed Permanent-Magnet Machines. IEEE Trans. Ind. Electron. 2017, 64, 2415–2423. [Google Scholar] [CrossRef]
- Mecrow, B.C.; Jack, A.G.; Atkinson, D.J.; Green, S.R.; Atkinson, G.J.; King, A.; Green, B. Design and testing of a four-phase fault-tolerant permanent-magnet machine for an engine fuel pump. IEEE Trans. Energy Convers. 2004, 19, 671–678. [Google Scholar] [CrossRef]
- Krings, A.; Boglietti, A.; Cavagnino, A.; Sprague, S. Soft Magnetic Material Status and Trends in Electric Machines. IEEE Trans. Ind. Electron. 2017, 64, 2405–2414. [Google Scholar] [CrossRef]
- Volbers, N.; Gerster, J. High Saturation, High Strength Iron-Cobalt Alloy for Electrical Machines. Proc. INDUCTICA CWIEME Berl. 2012, 1–4. [Google Scholar]
- Zhang, X.; Bowman, C.L.; O’Connell, T.; Haran, K.S. Large electric machines for aircraft electric propulsion. IET Electr. Power Appl. 2018, 12, 767–779. [Google Scholar] [CrossRef]
- Bhagubai, P.; Sarrico, J.; Fernandes, J.; Branco, P. Design, Multi-Objective Optimization, and Prototyping of a 20 kW 8000 rpm Permanent Magnet Synchronous Motor for a Competition Electric Vehicle. Energies 2020, 13, 2465. [Google Scholar] [CrossRef]
- Deb, K.; Pratap, A.; Agarwal, S.; Meyarivan, T. A Fast Elitist Multiobjective Genetic Algorithm NSGA-II. IEEE Trans. J. Evol. Comput. 2002, 6, 182–197. [Google Scholar] [CrossRef] [Green Version]
- Han, W.; Van Dang, C.; Kim, J.; Kim, Y.; Jung, S. Global-Simplex Optimization Algorithm Applied to FEM-Based Optimal Design of Electric Machine. IEEE Trans. Magn. 2017, 53, 1–4. [Google Scholar] [CrossRef]
- Bianchi, N.; Bolognani, S.D. Design Optimisation of Electric Motors by Genetic Algorithms. IEE Proc. Electr. Power Appl. 1998, 145, 475–483. [Google Scholar] [CrossRef]
- Fatemi, A.; Ionel, D.M.; Popescu, M.; Chong, Y.C.; Demerdash, N.A.O. Design Optimization of a High Torque Density Spoke-Type PM Motor for a Formula E Race Drive Cycle. IEEE Trans. Ind. Appl. 2018, 54, 4343–4354. [Google Scholar] [CrossRef]
- Kesgin, M.G.; Han, P.; Taran, N.; Ionel, D.M. Optimal Study of a High Specific Torque Vernier-type Axial-flux PM Machine with Two Different Stators and a Single Winding. In Proceedings of the 2020 IEEE Energy Conversion Congress and Exposition (ECCE), Detroit, MI, USA, 11–15 October 2020. [Google Scholar]
- Fatemi, A.; Ionel, D.M.; Demerdash, N.A.O.; Nehl, T.W. Optimal Design of IPM Motors With Different Cooling Systems and Winding Configurations. IEEE Trans. Ind. Appl. 2016, 52, 3041–3049. [Google Scholar] [CrossRef]
- Bhagubai, P.P.C.; Cardoso, A.C.; Fernandes, J.F.P. Cobalt Iron Core Impact on Optimal Design of an Interior Permanent Magnet Synchronous Motor for Competition Electric Vehicle. In Proceedings of the 2020 2nd Global Power, Energy and Communication Conference (GPECOM), Izmir, Turkey, 20–23 October 2020. [Google Scholar]
- Gmyrek, Z.; Cavagnino, A.; Vaschetto, S.; Bramerdorfer, G. Loss Modeling for Interlocked Magnetic Cores. In Proceedings of the 2020 IEEE Energy Conversion Congress and Exposition (ECCE), Detroit, MI, USA, 11–15 October 2020; pp. 1060–1066. [Google Scholar]
- Lee, J.-Y.; Lee, S.-H.; Lee, G.-H.; Hong, J.-P.; Hur, J. Determination of Parameters Considering Magnetic Nonlinearity in an Interior Permanent Magnet Synchronous Motor. IEEE Trans. Magn. 2006, 42, 1303–1306. [Google Scholar]
- Yamazaki, K.; Seto, Y. Iron loss analysis of interior permanent-magnet synchronous motors-variation of main loss factors due to driving condition. IEEE Trans. Ind. Appl. 2006, 42, 1045–1052. [Google Scholar] [CrossRef]
- Yamazaki, K.; Fukuoka, T.; Akatsu, K.; Nakao, N.; Ruderman, A. Investigation of Locked Rotor Test for Estimation of Magnet PWM Carrier Eddy Current Loss in Synchronous Machines. IEEE Trans. Magn. 2012, 48, 3327–3330. [Google Scholar] [CrossRef]
- Huang, W.; Bettayeb, A.; Kaczmarek, R.; Vannier, J. Optimization of Magnet Segmentation for Reduction of Eddy-Current Losses in Permanent Magnet Synchronous Machine. IEEE Trans. Energy Convers. 2010, 25, 381–387. [Google Scholar] [CrossRef]
- Fénot, M.; Bertin, Y.; Dorignac, E.; Lalizel, G. A Review of Heat Transfer between Concentric Rotating Cylinders with or without Axial Flow. Int. J. Therm. Sci. 2011, 50, 1138–1155. [Google Scholar] [CrossRef]
- Hwang, K.Y.; Jo, J.H.; Kwon, B.I. A Study on Optimal Pole Design of Spoke-Type IPMSM With Concentrated Winding for Reducing the Torque Ripple by Experiment Design Method. IEEE Trans. Magn. 2009, 45, 4712–4715. [Google Scholar] [CrossRef]


| Variable | Description | Range |
|---|---|---|
| Rotor radius | 20–40 mm | |
| Stator outer ring width | 1–20 mm | |
| Magnet width | 1–15 mm | |
| Magnet length | 5–20 mm | |
| Teeth width | 1–10 mm | |
| Teeth length | 7–20 mm | |
| Airgap size | 1–1.5 mm | |
| Shaft radius | 5–30 mm | |
| Torque producing current density (q axis) | 5–80 A/mm2 |
| Constraint | Range |
|---|---|
| Geometrical | |
| Weight | <5 kg |
| Stator outer radius | <50 mm |
| Motor stack length | =80 mm |
| Thermal | |
| PM’s temperature | <120 °C |
| Windings’ temperature | <180 °C |
| Magnetic | |
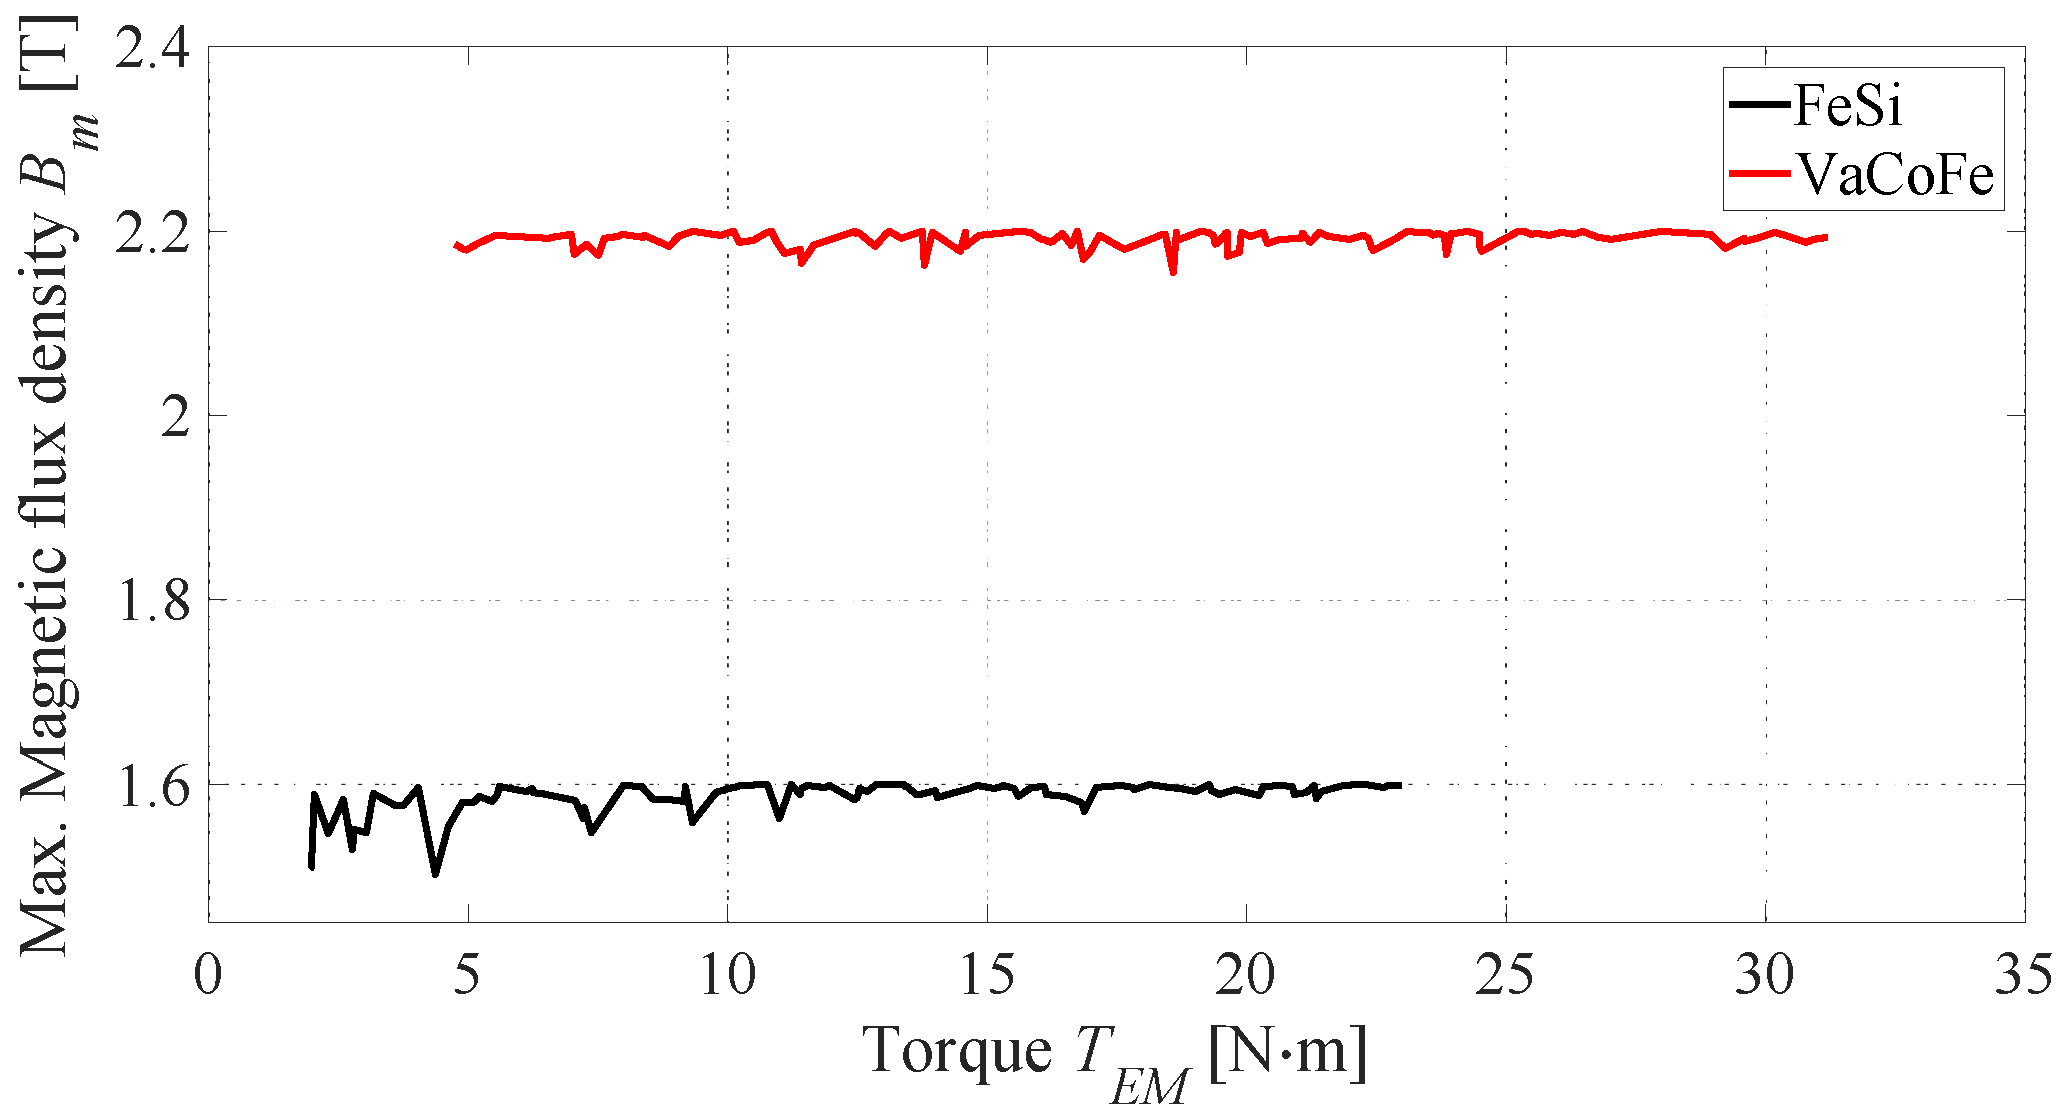
| Magnetic flux density | FeSi: <1.6 T VaCoFe: <2.2 T |
| Variable | F20 | V20 | V30 |
|---|---|---|---|
| 32.5 mm | 33 mm | 32 mm | |
| 7.9 mm | 6.3 mm | 6.4 mm | |
| 6.2 mm | 7.3 mm | 6.5 mm | |
| 17.0 mm | 16.6 mm | 16.5 mm | |
| 6.4 mm | 5.5 mm | 5.5 mm | |
| 8.0 mm | 9.6 mm | 10.3 mm | |
| 1.5 mm | 1.0 mm | 1.3 mm | |
| 14.4 mm | 15.3 mm | 14.5 mm | |
| 48.2 A/mm2 | 25.5 A/mm2 | 42.0 A/mm2 | |
| 17.57 W | 18.66 W | 39.27 W | |
| 65.1 W | 62.41 W | 64.66 W | |
| 875.5 W | 391.4 W | 1110 W | |
| Efficiency | 92.8% | 96.4% | 93.9% |
| Torque density | 4.7 N·m/kg | 4.7 N·m/kg | 7.1 N·m/kg |
| Avg. Torque [N·m] | Efficiency [%] | |||
|---|---|---|---|---|
| 2D-Time | 2D-Static | 2D-Time | 2D-Static | |
| F20 | 19.95 | 19.78 (−0.84%) | 93.11 | 92.84 (−0.27%) |
| V20 | 19.62 | 20.07 (+2.28%) | 96.31 | 96.39 (+0.08%) |
| V30 | 30.31 | 29.81 (−1.64%) | 94.21 | 93.92 (−0.29%) |
| Geometry | Avg. Torque [N·m] | Peak-Peak Torque Ripple [N·m] |
|---|---|---|
| V20 | 19.62 | 7.0 |
| V20—new | 20.78 | 4.3 |
| V30 | 30.31 | 5.6 |
| V30—new | 29.92 | 4.6 |
Publisher’s Note: MDPI stays neutral with regard to jurisdictional claims in published maps and institutional affiliations. |
© 2022 by the authors. Licensee MDPI, Basel, Switzerland. This article is an open access article distributed under the terms and conditions of the Creative Commons Attribution (CC BY) license (https://creativecommons.org/licenses/by/4.0/).
Share and Cite
Bhagubai, P.P.C.; Bucho, L.F.D.; Fernandes, J.F.P.; Costa Branco, P.J. Optimal Design of an Interior Permanent Magnet Synchronous Motor with Cobalt Iron Core. Energies 2022, 15, 2882. https://doi.org/10.3390/en15082882
Bhagubai PPC, Bucho LFD, Fernandes JFP, Costa Branco PJ. Optimal Design of an Interior Permanent Magnet Synchronous Motor with Cobalt Iron Core. Energies. 2022; 15(8):2882. https://doi.org/10.3390/en15082882
Chicago/Turabian StyleBhagubai, Pedro P. C., Luís F. D. Bucho, João F. P. Fernandes, and P. J. Costa Branco. 2022. "Optimal Design of an Interior Permanent Magnet Synchronous Motor with Cobalt Iron Core" Energies 15, no. 8: 2882. https://doi.org/10.3390/en15082882
APA StyleBhagubai, P. P. C., Bucho, L. F. D., Fernandes, J. F. P., & Costa Branco, P. J. (2022). Optimal Design of an Interior Permanent Magnet Synchronous Motor with Cobalt Iron Core. Energies, 15(8), 2882. https://doi.org/10.3390/en15082882