1. Introduction
In recent decades, mitigation strategies for climate change have come to the forefront of global interest. Increases in petroleum and natural gas prices—in combination with the gradual decrease of fossil fuel reserves, the continually growing environmental concerns of the general public and its awareness concerning the benefits of renewable energy—have highlighted heating through biomass as a valid and dynamic alternative to fossil fuels [
1].
Wood can be traditionally utilized in energy production as firewood or as a refined solid biofuel of smaller dimensions, such as wood chips, powder, pellets or briquettes, due to their easier use, packaging, storage, transport and more complete combustion [
2].
During the last years, the wood fuel pellet market has been one of the most dynamically developing solid biofuel markets in the energy sector, with the United States, Canada and EU-28 being the leading countries in wood pellet production. In 2018, the consumption of wood pellets in the EU was about 27 Mt, which corresponded to an increase of 2.1 Mt in comparison to 2017, representing a growth of 8% [
3,
4]. The largest producers in the EU are Germany, Sweden and Austria [
5]. Policy and financial incentives such as tax exemptions, certificates, renewable obligations and subsidies for pellet heating system installation [
6] have strongly contributed to the increase of pellet use and the attractiveness of this biofuel. Different scenarios suggest that European, as well as global, wood pellet markets will continue to grow still further [
3].
The feedstock of wood pellets can be waste from woodwork processing, logging processes, and crop harvests, as well as virgin wood of low quality—usually species of small-diameter logs with non-typical wood structure and defects. The use of such underestimated biomass material undoubtedly contributes to the generation of high added-value products and rational utilization of natural resources [
2].
Pellets constitute a standardized product, characterized by high consistency, resulting from the mechanical compaction of wood material through holes leading down into a die [
7,
8]. During their preparation, the high pressure and steam applied provide adequate adhesion of the particles and, therefore, pellet consistency and mechanical durability [
9]. Nevertheless, over recent years, many European producers have introduced several additives (binding agents) into the production of wood pellets, to ensure even higher coherence of the particles and mechanical durability and to decrease the energy consumption of pelletization, although these additives should be maintained at low levels (<2%), according to norm requirements [
10]. Pellet colour greatly varies depending on several factors, including the feedstock nature (chemical composition, type and content of extractives, lignin content, moisture content, particle size, age of raw material, potential mould etc.), the pelletization process (temperature, die channel length and diameter, residence time of pellets, die-hole slope angle, feedstock moisture content, etc.) and the potential incorporation of additives [
6,
10,
11,
12].
A high quality of pellets is required by heating devices in order to maintain their service life, enhance the control of the combustion process and to ensure high efficiency and low emissions. More specifically, pellets should be clean and compact, and they should not break and crumble easily—a fact which would have an impact on the storage and regulation of heating systems and could possibly interrupt automated fuel feeding [
6,
7]. The ash content is a crucial factor, which, as a by-product of combustion, remains at the bottom or floats in the air, contributing to slagging and corrosion phenomena [
5,
9]. Significant factors are also the bulk density and the calorific value, which both combined determine the energy density of pellets [
9]. Additionally, the high moisture content of wood pellets may negatively affect the performance of pellets by reducing the net energy output during combustion [
2] and generating high emissions of air pollutants [
13]. Generally, the optimum moisture content of feedstock during pelletisation seems to be 8–13% [
10].
The increase of pellet production and consumption has forced both traders and consumers to require a certification system that would ensure and certify that the pellets they deliver or receive fulfil all quality criteria. In this sense, periodic unannounced inspections of production plants are being implemented [
5], according to ISO/IEC 17020 [
14], while analyses are conducted by accredited laboratories, according to ISO/IEC 17025 [
15]. The international quality standard for pellets ISO 17225:2021 [
16] refers to solid biofuels, specifications and fuel categories for both wood pellets and non-wood pellets. It specifies qualitative requirements and property threshold values for the classification of pellet materials into three quality classes for residential applications (A1, A2 and B). Lower-quality pellets classified for industrial applications are certified as class I [
17].
However, pellet users still encounter pellet packages with no labels in market-quality wood, or no references to the quality class, standards or a certification system. Additionally, there are concerns emerging from the presence of various impurities during production or high levels of ash, which result in lower pellet performance [
12]. Due to this, researchers have attempted to assess the quality of pellets found in the market. Specifically, Duca et al. [
6] examined 130 pellet brands collected from the market in 2010, concluding that just more than half of the samples fulfil the best-quality class (A1) requirements. They reported that the ash content value could be used as a good representative parameter for an initial rapid quality assessment. Szyszlak-Bargłowicz et al. [
12] characterized wood pellets from 14 brands of the market, assessing the content of organic matter in the pellets on the basis of their elemental composition, aiming at the potential assessment of biomethane production in pellet quality evaluation. They found high calorific values and low ash and sulphur contents in the pellets, indicating that the pellets’ feedstock were of good quality, even though some pellets were found to contain impurities. More recently, Schön et al. [
18] collected and analysed 42 different pellet samples in bags, and revealed that 8 of the 42 samples did not fulfil the requirements for ISO 17225-2; however, overall, a positive result for wood pellet quality on the German and European market was confirmed. Interestingly, large differences in potassium content (280–900 mg/kg), which can influence the level of particle emissions, were observed. During the combustion of 12 selected pellet samples, no clear dependency between flue gas emission and ash content, potassium content, bulk density or pellet length were found. Furthermore, Sgarbossa et al. [
10] collected 51 pellet brands sold as certified products from the market and correlated the colour of the pellets to their quality, using different colour measurement techniques (CIE
L*
a*
b*, Red–Green–Blue, hue–saturation–lightness colour spaces). A good degree of correlation between the colour and ash content of pellets was revealed. Samples lighter in colour clustered in areas where heating values, mechanical durability and bulk density had higher scores.
Currently, there are only a few studies providing information concerning the real quality of wood fuel pellets being sold on the market, while there is not a thorough and comprehensive study in the literature so far providing information concerning the market of Southern Europe and Greece. Such a study would be required to provide crucial information to consumers, relevant market actors, authorities, certification bodies and other involved biofuel stakeholders. Additionally, it could possibly trigger concerns and the discussion of potential actions and policies that could be established to further improve the quality of solid biofuels being sold and consumed.
Therefore, in the current study, the most crucial qualitative characteristics of pellets produced in several European countries and sold on the Greek market were studied in terms of their ash content, calorific value, bulk density, mechanical strength and moisture content, in order to draw conclusions on the quality of the pellets using the ISO 17225 standard requirement thresholds as benchmarks. Two collection periods of the same pellet brands were applied to examine if the quality of the pellets was balanced over time. The reliability of the packaging information of the pellets was evaluated. Furthermore, the examined qualitative properties of the pellets were correlated to one another to investigate these properties’ potential contribution as pellet quality indicators.
2. Materials and Methods
For the purpose of this work, 1 pellet package (15 kg/bag) from 20 specific different brands were purchased twice (40 bags in total) from local distributors and stores of the Northern Greece market. The first of the two collections was implemented in January of 2019 and the second one in June–July of 2019, ensuring that different batches of the same 20 pellet brands would be included in the test. The criterion of sampling the 20 specific brands studied in this experimental work was employed to include the most common brands in the market that are sold in large quantities, according to market actors, and that are of varying origin (country/manufacturer). All of these pellet brands were sold as quality class A1 (certified), except for sample 17, for which no quality class was reported (not certified;
Table 1). The studied pellets originated from Serbia, Bulgaria, Romania, Hungary, Greece, Austria and Ukraine, while for 5 of them, the country was not reported. Additionally, information on the exact forest species or the mixture of species used as the feedstock for the produced pellets was not provided on the packages in most cases. In parallel, neither information on the exact time period of the production of these bags (duration from production till consumption), nor information on the handling of these bags after their production—during the stages of storage or transportation to a retailer etc.—could be obtained and utilised in this study in the quality analysis of the pellet samples. Of course, qualitative characteristics such as the ash content or calorific value are not expected to change due to transportation or storage processes, but other characteristics such as the mechanical durability, dimensions of pellets, bulk density, colour, roughness, etc., could be highly affected by several factors that act during transportation and storage. Therefore, this study deals with the real quality of pellets that the customer receives and not the quality of the pellets before leaving the plant.
The testing of the pellet properties, described in the following section, was implemented in the 40 bags of pellets, corresponding to the 20 brands over two collection periods (1 replication over time). The tables and diagrams in the results section correspond to the mean values obtained from measurements of the materials of these two collection periods put together (from the specific 20 brands), since high differences in property values were not revealed concerning the materials between the two collection periods; this practice also contributed to the feasibility of the statistical analysis implementation and examination of the potential correlations among the properties’ values.
The evaluation of the quality of these pellet samples was based on the determination of some of their most crucial properties, considered their quality criteria according to ISO 17225—namely, the moisture content, ash content, calorific value, mechanical durability, bulk density and dimensions, using the respective standard requirement thresholds as benchmarks.
The material of each bag was spread over a large, flat surface and divided into several subunits with the help of a splitter, to ensure that samples to be studied included pellets taken from the entire bag. Afterwards, the pellet-sampling process was carried out using a 2-dimensional rectangular sampling grid with points spaced 40 mm apart that had been placed over each of these created sub-unit areas. Pellets found at each intersection of the grid were included in the samples to be characterized. Particular attention was paid to ensure the representativeness of the samples.
The determination of pellet moisture content (MC) was implemented based on EN ISO 18134-1 [
19]. For each pellet category and for each collection period, five randomly selected pellet samples of 500 g were taken at the beginning of the bags’ storage period and weighted before being placed in the dry, empty and of known weight containers; then, the pellets were dried at 105 ± 2 °C until they reached a constant weight (<24 h) and were re-weighed.
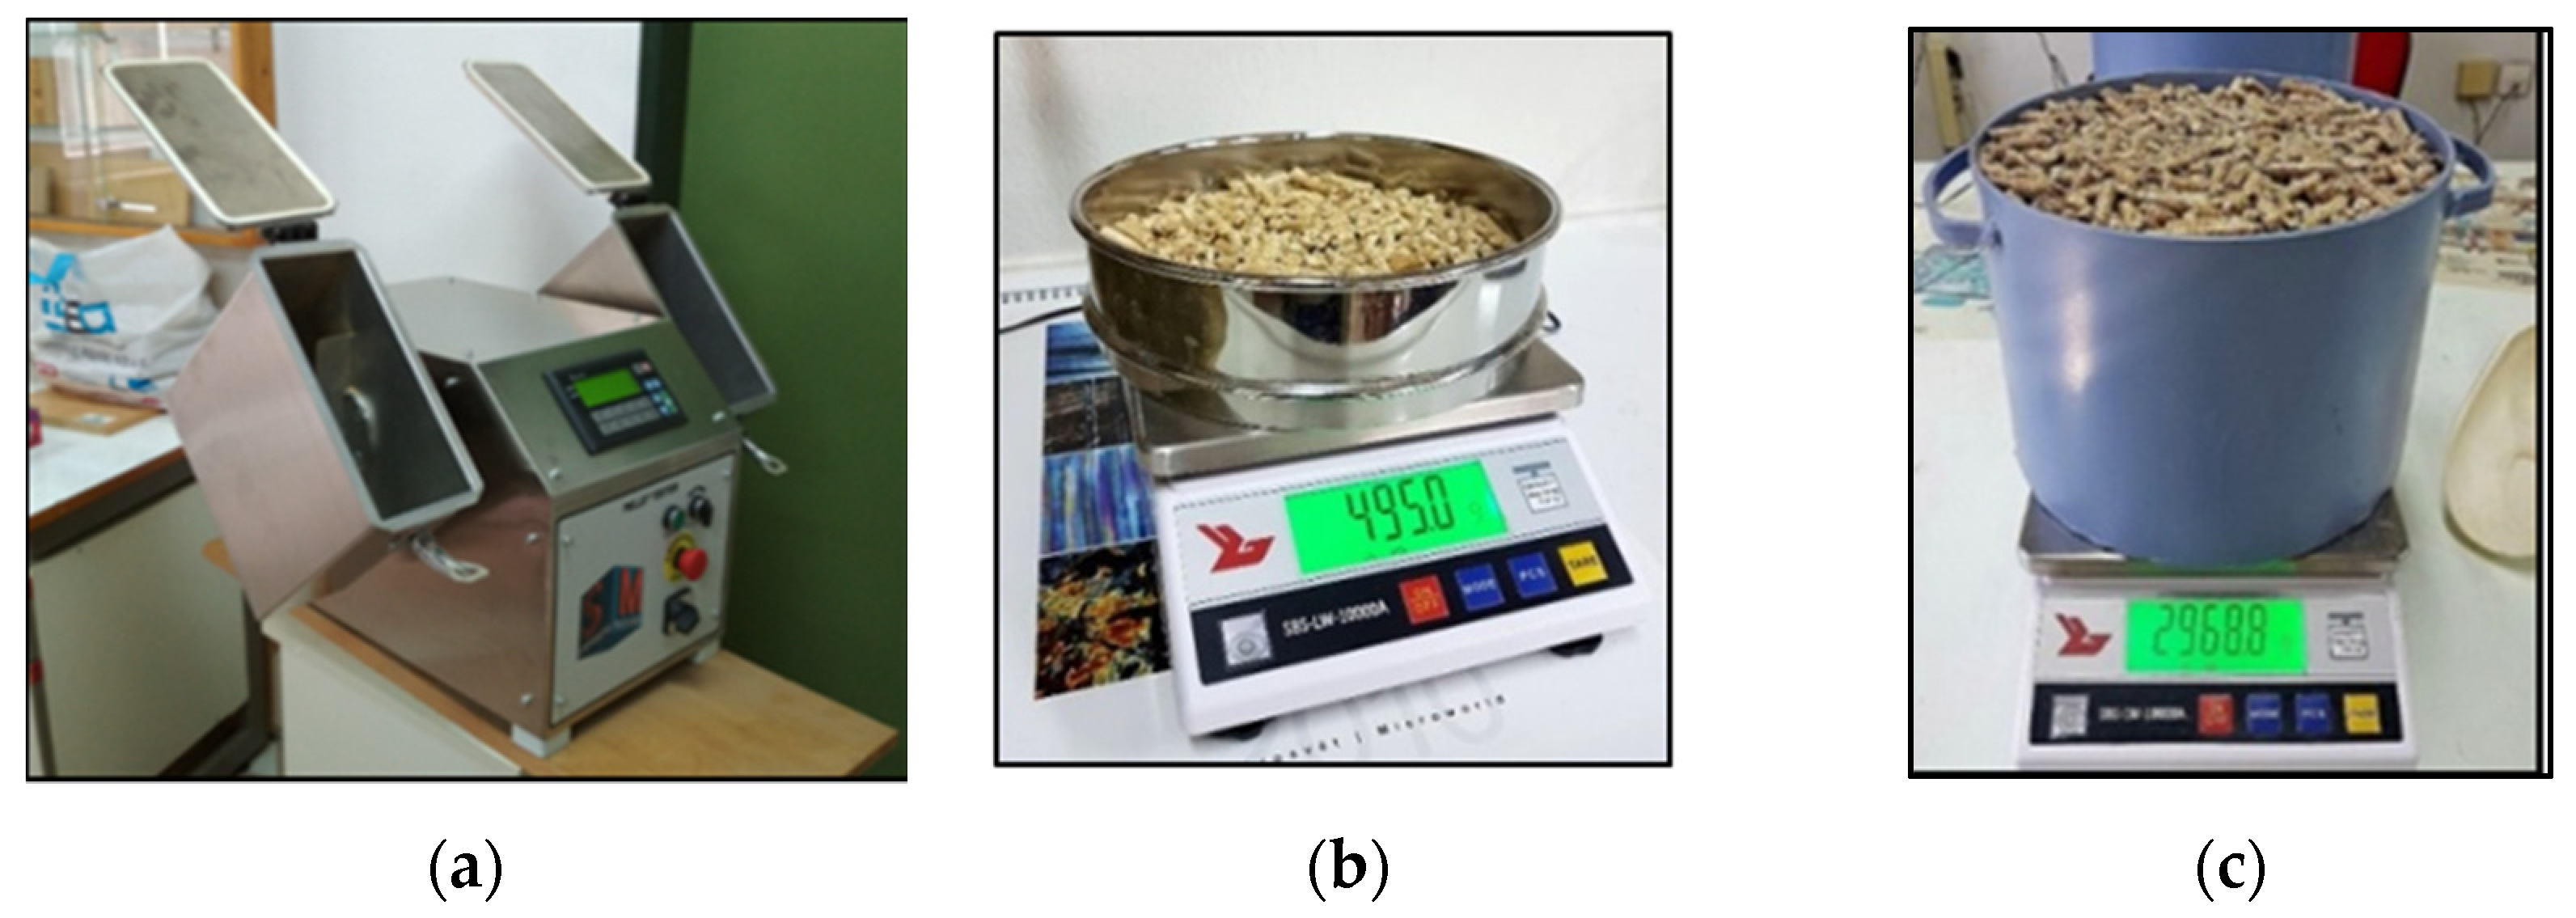
The mechanical durability of the pellets was determined following the methodology described in ISO 17831-1 [
20]. Two representative samples of pellets of 500 ± 10 g were obtained from the whole package for each pellet brand and placed in the special containers of the durability testing device (
Figure 1a). These containers rotate for a specific duration of time (10 min, 500 circles), causing friction and a partial disintegration of pellet mass into powder/fines. Using a sieve of 3.15 mm hole diameter (
Figure 1b), the detached, very fine-grained material was removed through the sieve holes, leaving only the remaining pellets. Two measurements were performed for each material (pellet brand/collection period).
The measurement of the pellet bulk density was based on the process described in ISO 17828 [
21]. Two standardized containers of specific dimensions and volumes (5 L and 50 L;
Figure 1c) were filled to the brim with pellets and condensed with a fixed exposure to mild vibrations, performed similarly each time. The pellets found on the top of the container were levelled using a spatula. The sample weight (pellets plus container) was measured and the already known weight of the container was subtracted. The bulk density was determined through the net weight per standard volume and was indicated by the specified moisture content of the material. Two measurements were carried out for each pellet category and for each collection period.
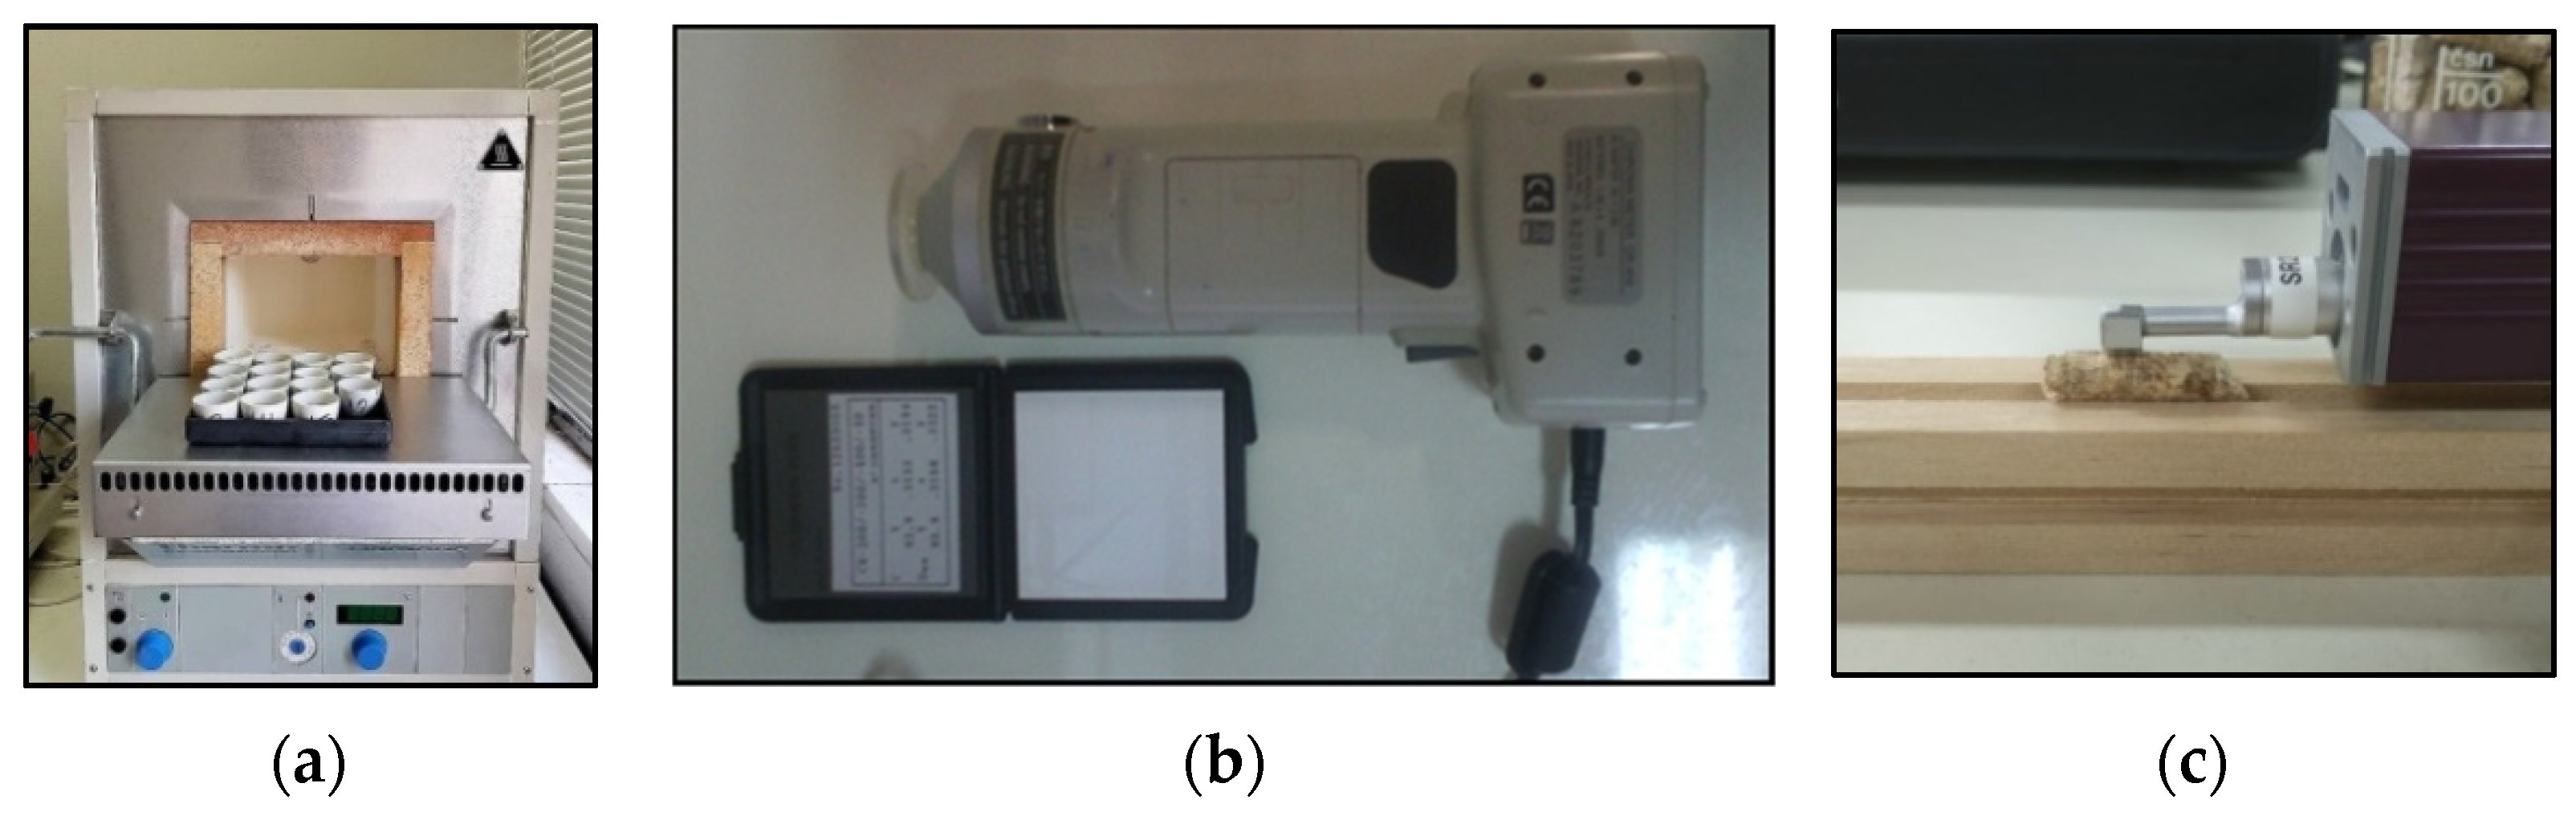
The methodology of ISO 18122 [
22] was followed for the determination of pellet ash content. A wood powder of pellet material was prepared using a rotating-blade “Willey” mill (Thomas Scientific, Swedesboro, NJ, USA), sieving twice to obtain the appropriate dimensions (40–60 mesh). Samples of at least 1 g were weighed to the nearest 0.1 mg in the dry, clean and pre-weighed porcelain crucibles, and then transferred to a cold muffle furnace (Heraeus MR 170;
Figure 2a) with a ventilation rate of about 5 changes per minute. The samples were heated to 250 °C within 50 min and the temperature was kept constant for 60 min. In the next step, the temperature was increased to 580 °C within 60 min and was maintained at that level for 3 h. Consequently, the crucibles were transferred to an empty desiccator without a lid for 5 min, followed by 15 min with a closed lid, and then weighed. Three replicates were tested for each pellet brand and for each collection period.
The calorific value corresponds to the absolute value of the specific energy of combustion in calories per unit mass of a solid biofuel burned in oxygen (in a calorimetric bomb) under specified conditions. Here, the lower heating value (LHV or net calorific value) was determined in an isoperibol bomb calorimeter (Parr 1261, Parr Instrument Company, Moline, IL, USA), according to the method described in EN ISO 18125 [
23]. Sample pellets with mass of 1.0 g ± 0.1 g, with a diameter of 13 mm, were produced in the shape of pills using a hydraulic pellet press (custom made, Athens, Greece) applying a load of approximately 7000 kg for 1 min. The pellets were weighed to the nearest 0.01 g in a crucible and then placed inside a Paar 1108 oxygen combustion bomb. The LHV measurements were conducted in 6 replicates for each material and for each collection period. Prior to the measurements, the calorimeter was calibrated and validated with 6 individual calibration routes using benzoic acid pellets. The LHV values were expressed in MJ/kg.
For each pellet brand, a representative sample of 100 pellets was obtained from the entire bag, and the pellets’ length and diameter were measured using a digital calliper (Mitutoyo 500-196-30) of 0.0005”/0.01 mm resolution, according to ISO 17829 [
24].
A system of three colour coordinates, called
CIE L*
a*
b*, was used according to the CIE standard, which is based on a D65 light source and provides a specific scale to define and compare colour values. These measurements were carried out using a Minolta (Chroma-Meter CR-300) Colourimeter (
Figure 2b), according to ASTM D2244-16 [
25]. For each pellet brand studied, 10 samples of 1.0 g ± 0.1 g—obtained from the grounded material from the initial pellets—were prepared in the shape of pills (13 mm diameter), according to the respective standard, using a hydraulic pellet press (1000 kg, 1 min). In this way, flat surfaces, wider than the surface of the initial pellets, were prepared in order for the colour measurement implementation to be feasible. On the surface of these 10 pills, 10–15 measurements of colour were implemented.
The surface roughness of the pellets was determined using a fine diamond stylus-type profilometer—Mitutoyo Surftest SJ-301—applying the profile tracing method, according to ISO 4287 [
26] on the surface of pellets. The measuring speed, diameter of the pin and the top angle of the pin tool were 10 mm/min, 4 µm and 90°, respectively. Roughness index values were determined within ± 0.01 µm. The sampling length was 2.5 mm, taken along the length of the pellets (
Figure 2c), and the evaluation length was 12.5 mm (5 times the sampling length).
The roughness of at least 15 randomly selected pellets was measured for each pellet brand and collection period. The three roughness parameters—the mean arithmetic deviation of profile (
Ra), the mean peak-to-valley height (
Rz) and the root mean square deviation of the assessed profile (
Rq)—that were recorded, have been widely used in previous studies concerning wood or wood-based products [
27,
28,
29]. Prior to each measurement, the apparatus was calibrated, and the measurements were carried out under ambient conditions—while the pellets had already been conditioned to attain an equilibrium moisture content (EMC).
The statistical package SPSS Statistics was used to determine the statistically significant differences among the mean values of the properties of the different pellet brands through a multiple linear regression analysis (F-test). Additionally, through the multilinear regression analysis, the potential, the significance (p < 0.05) and the degree (%) of influence of the independent variables (almost all the properties) on the dependent variable (examining one-by-one the most crucial qualitative properties) were investigated, in order to assess potential correlations among the properties and the potential for pellet quality prediction.
3. Results and Discussion
As mentioned previously, the following tables and diagrams demonstrating the results correspond to the mean values obtained from the measurements of the material obtained from both of the two collection periods together (from the 20 specific brands), since high differences in property values were not revealed concerning the materials between the two collection periods. This approach contributed to the feasibility of the statistical analysis implementation and the examination of potential correlations between the properties’ values.
3.1. Calorific Value
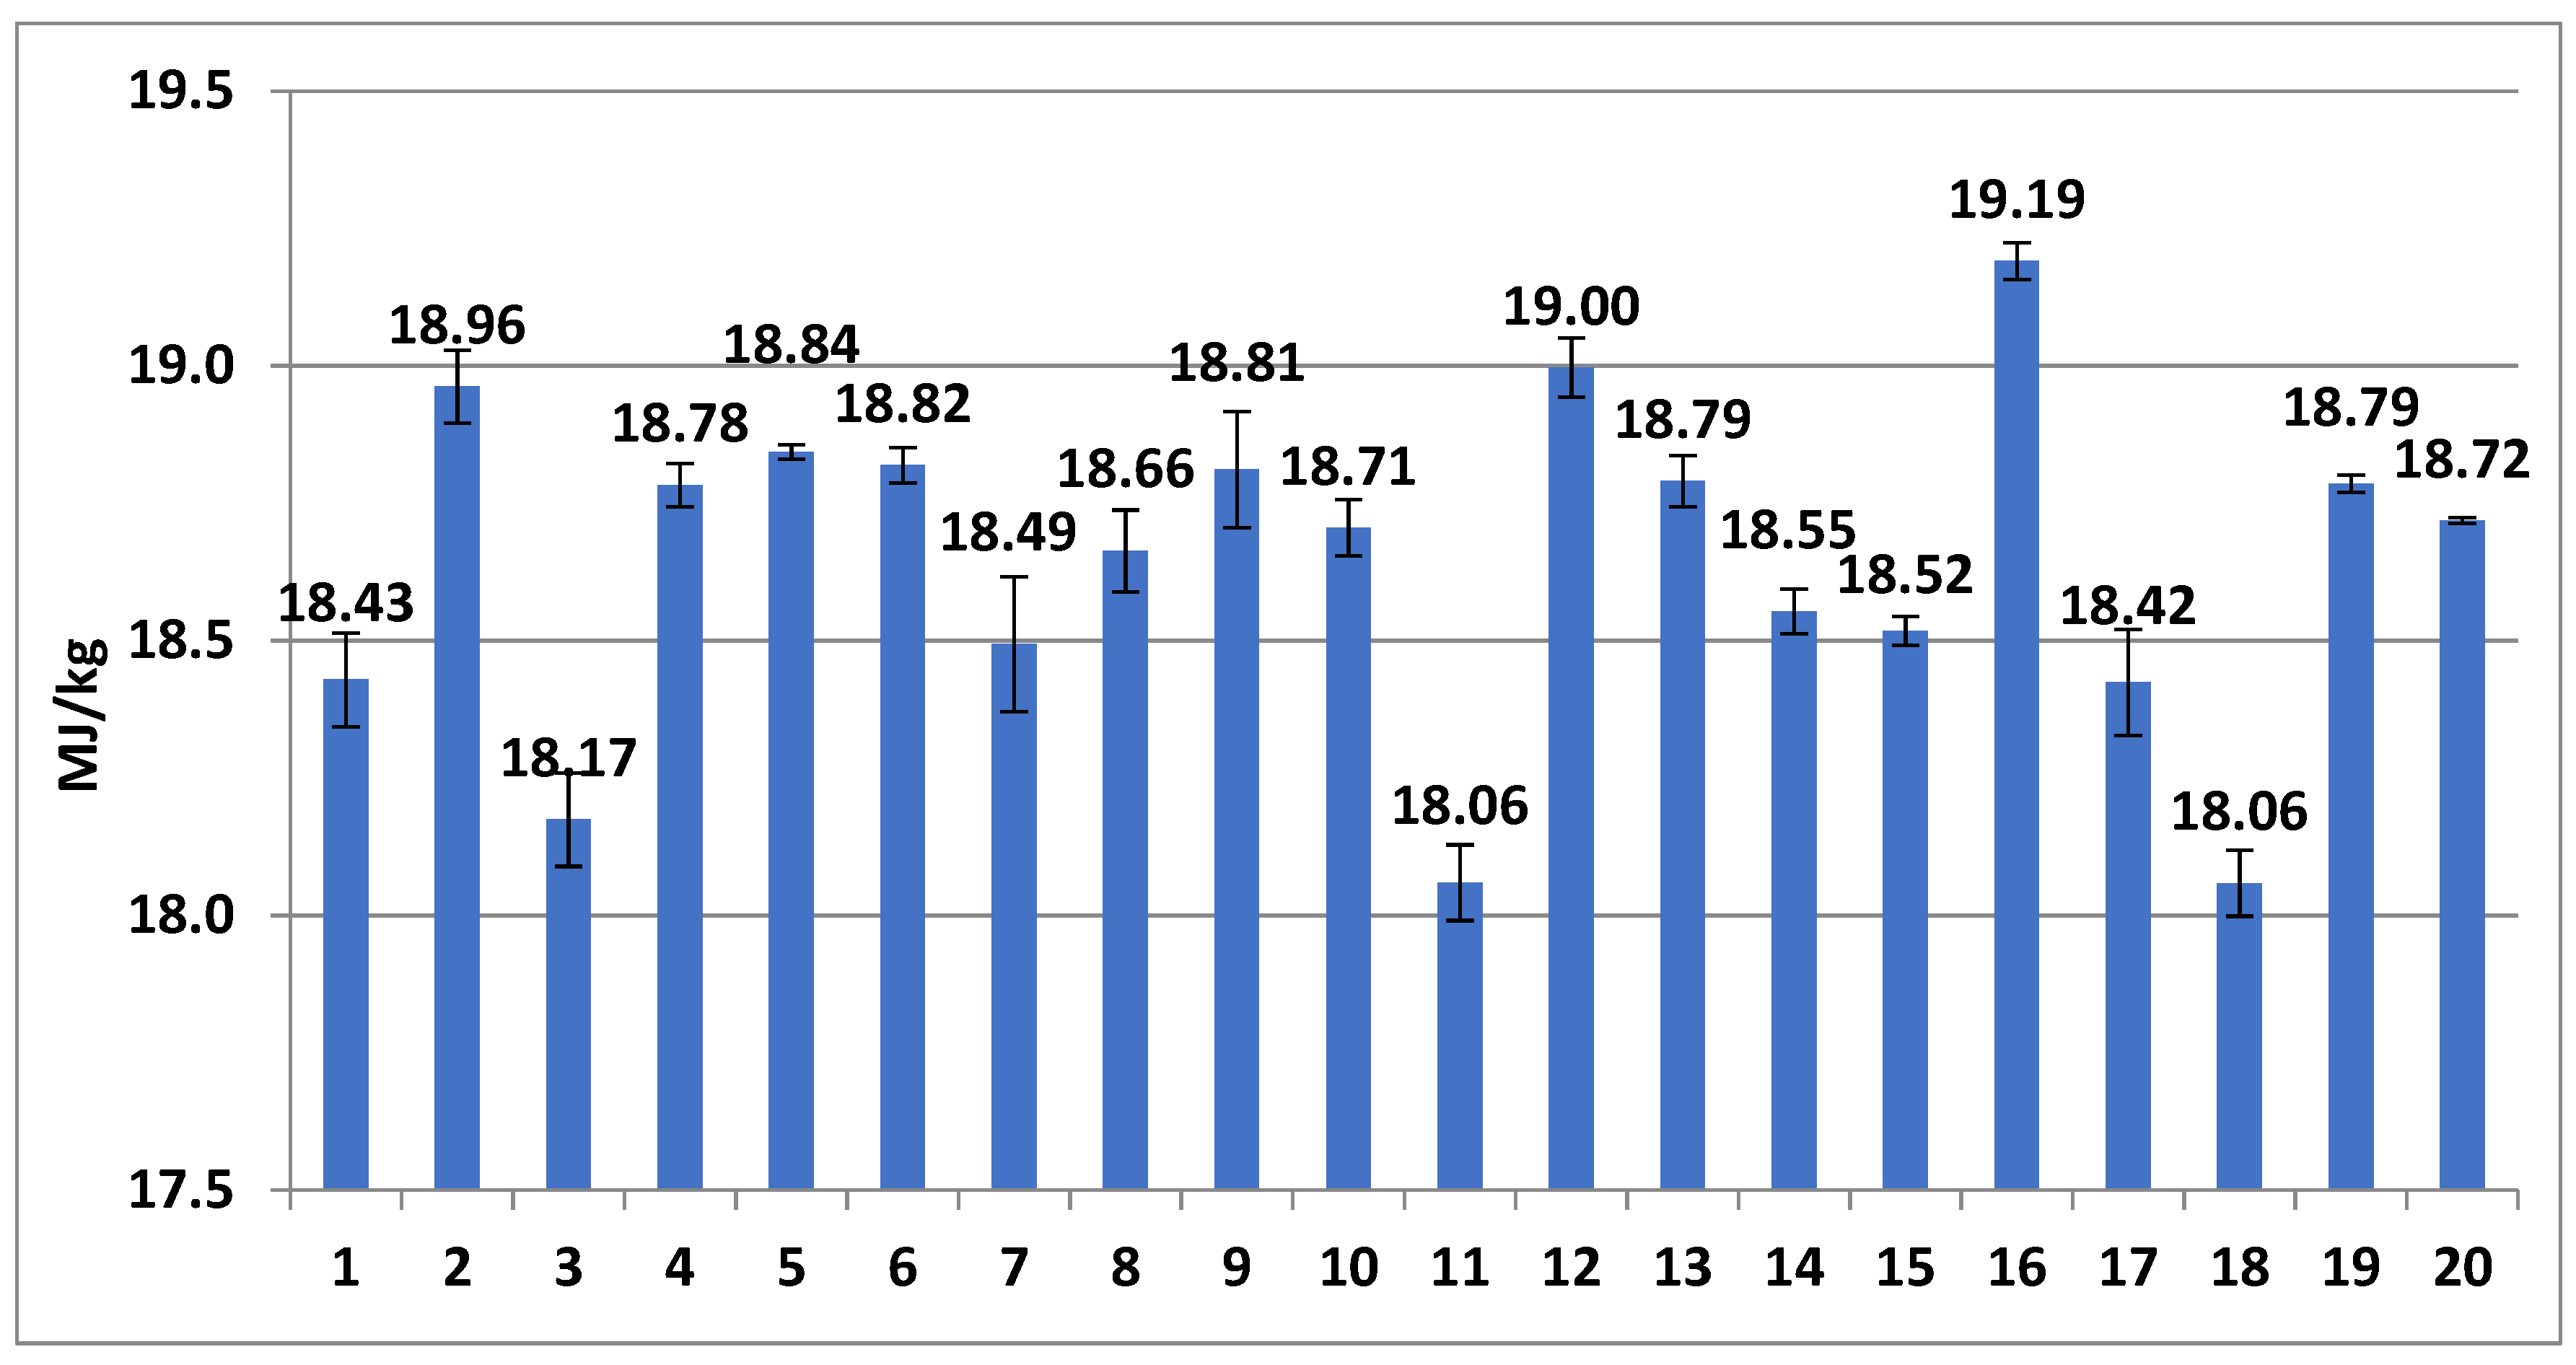
According to ISO 18125, the net calorific value should be ≥16.56 MJ/kg for the three quality classes for residential use (A1, A2 and B). As was observed (
Figure 3), all pellet samples demonstrated higher calorific values than the threshold value (18.057–19.188 MJ/kg), meeting the requirements of the standard for residential applications. Pellet samples 11 and 18—even though they met the standard requirements—presented the lowest calorific values, and it is noteworthy that in parallel, these two pellet samples also presented with the highest ash content values. The 16th pellet sample revealed the highest net calorific value among the studied samples.
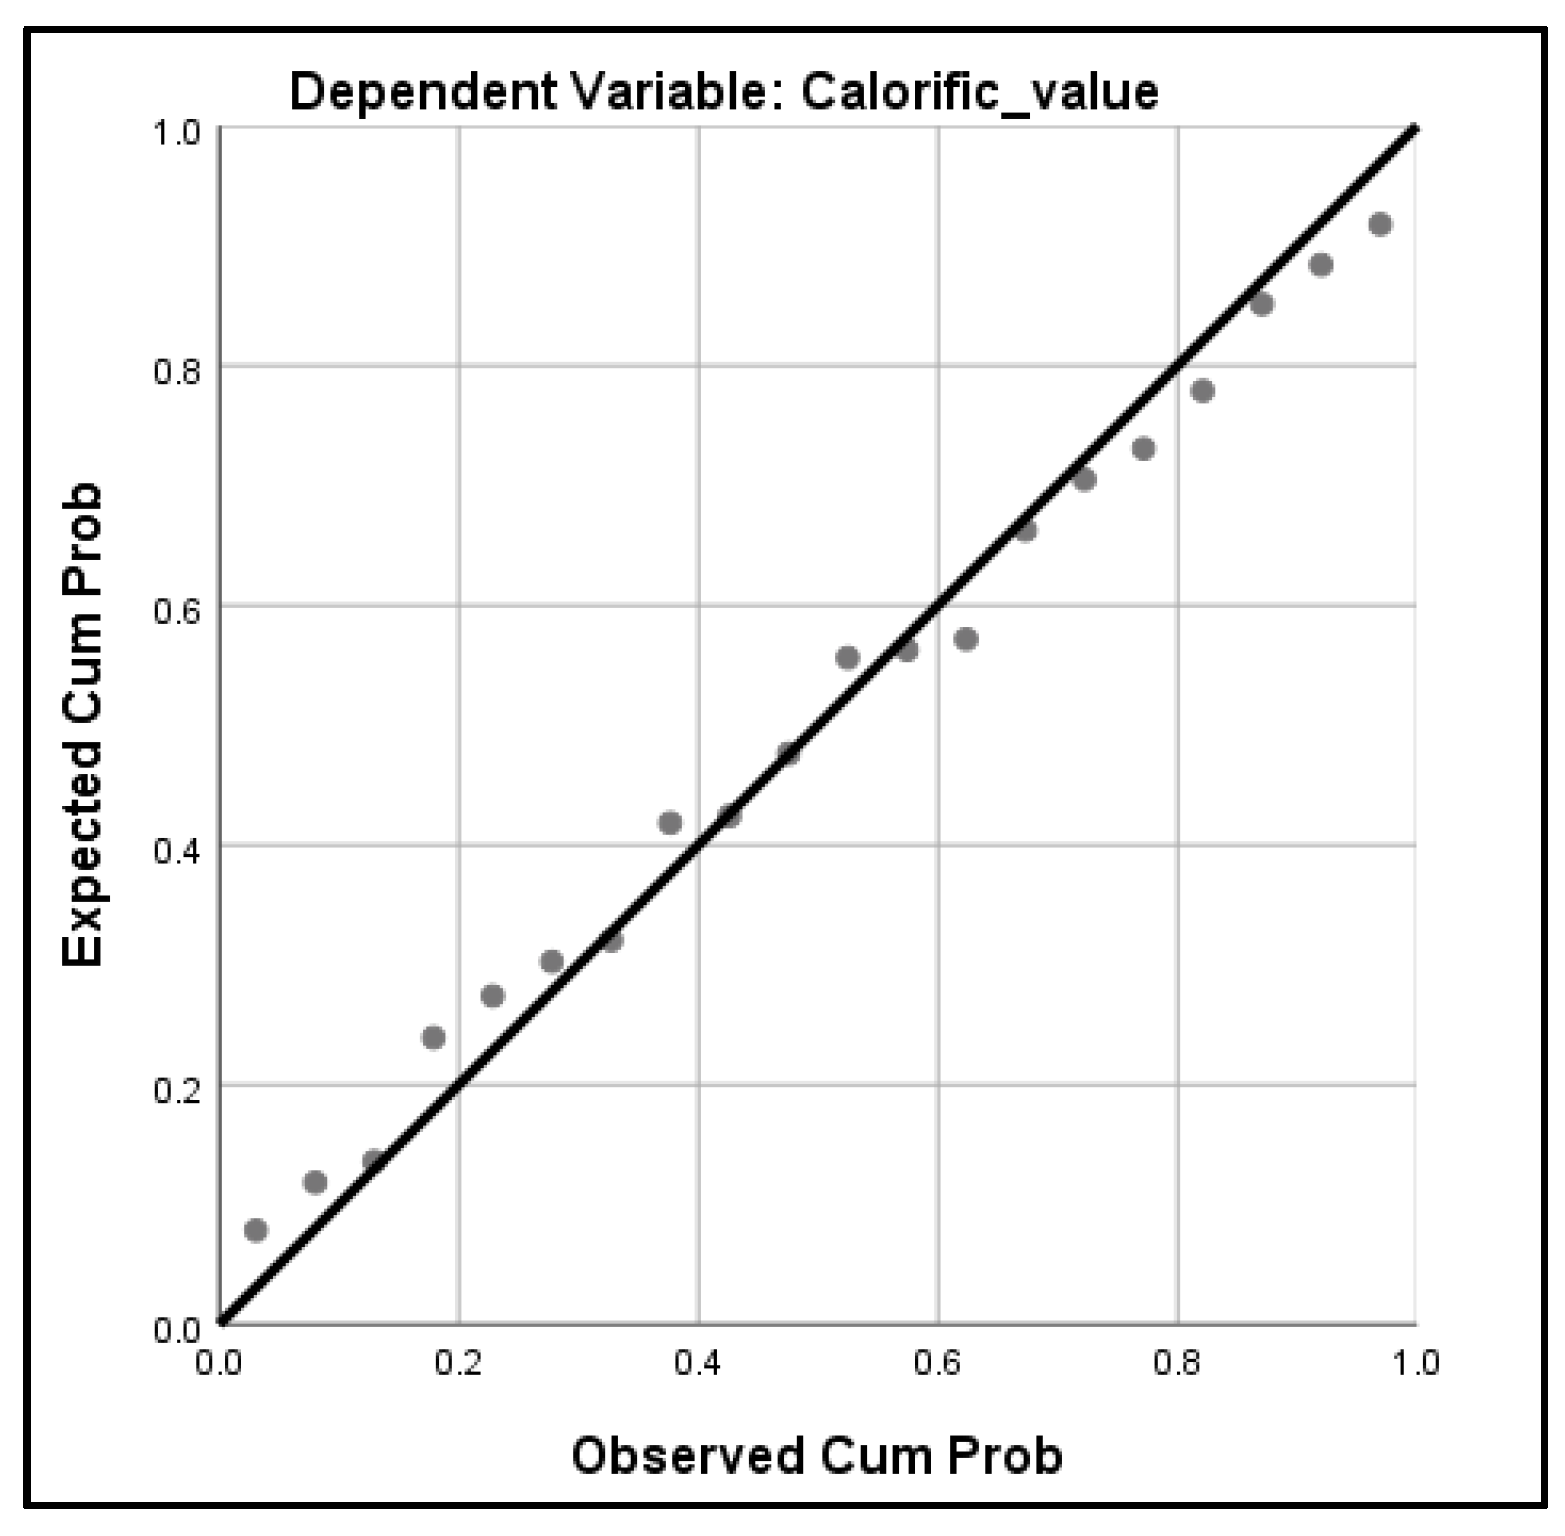
The results of the multiple linear regression analysis of the examined properties revealed that there was a statistically significant (sig. 0.0079) correlation between pellet calorific value and the rest of the pellet properties examined, which were considered independent variables (
Figure 4,
Table 2). Specifically, 74.3% of the calorific value variability was attributed to the interactions between all the examined properties. The property that most intensely and significantly, from a statistical point of view (0.0028), influenced the calorific value (by 62.9%) was the ash content, presenting a negative impact—indicating that as the ash content increases, the calorific value decreases. Additionally, a slight and not-statistically significant correlation between the calorific value (variability influenced by 9.8%) and light colour was detected. Furthermore, the mechanical durability of the pellets was found to be correlated in a positive way with the calorific value of the pellets, influencing its variability by 49.6%. This indicates that mechanical durability and calorific value are two qualitative characteristics that may mark parallel trends. In a marginally significant way (sig. 0.0504), moisture content was found to influence the calorific value variability by 52.2% in a negative way, indicating that as the moisture content increases, the calorific value decreases (even in this case, in which the net calorific value was correlated to moisture content). The rest of the properties examined, such as bulk density and surface roughness, were not found to be significantly correlated with the calorific value.
3.2. Ash Content
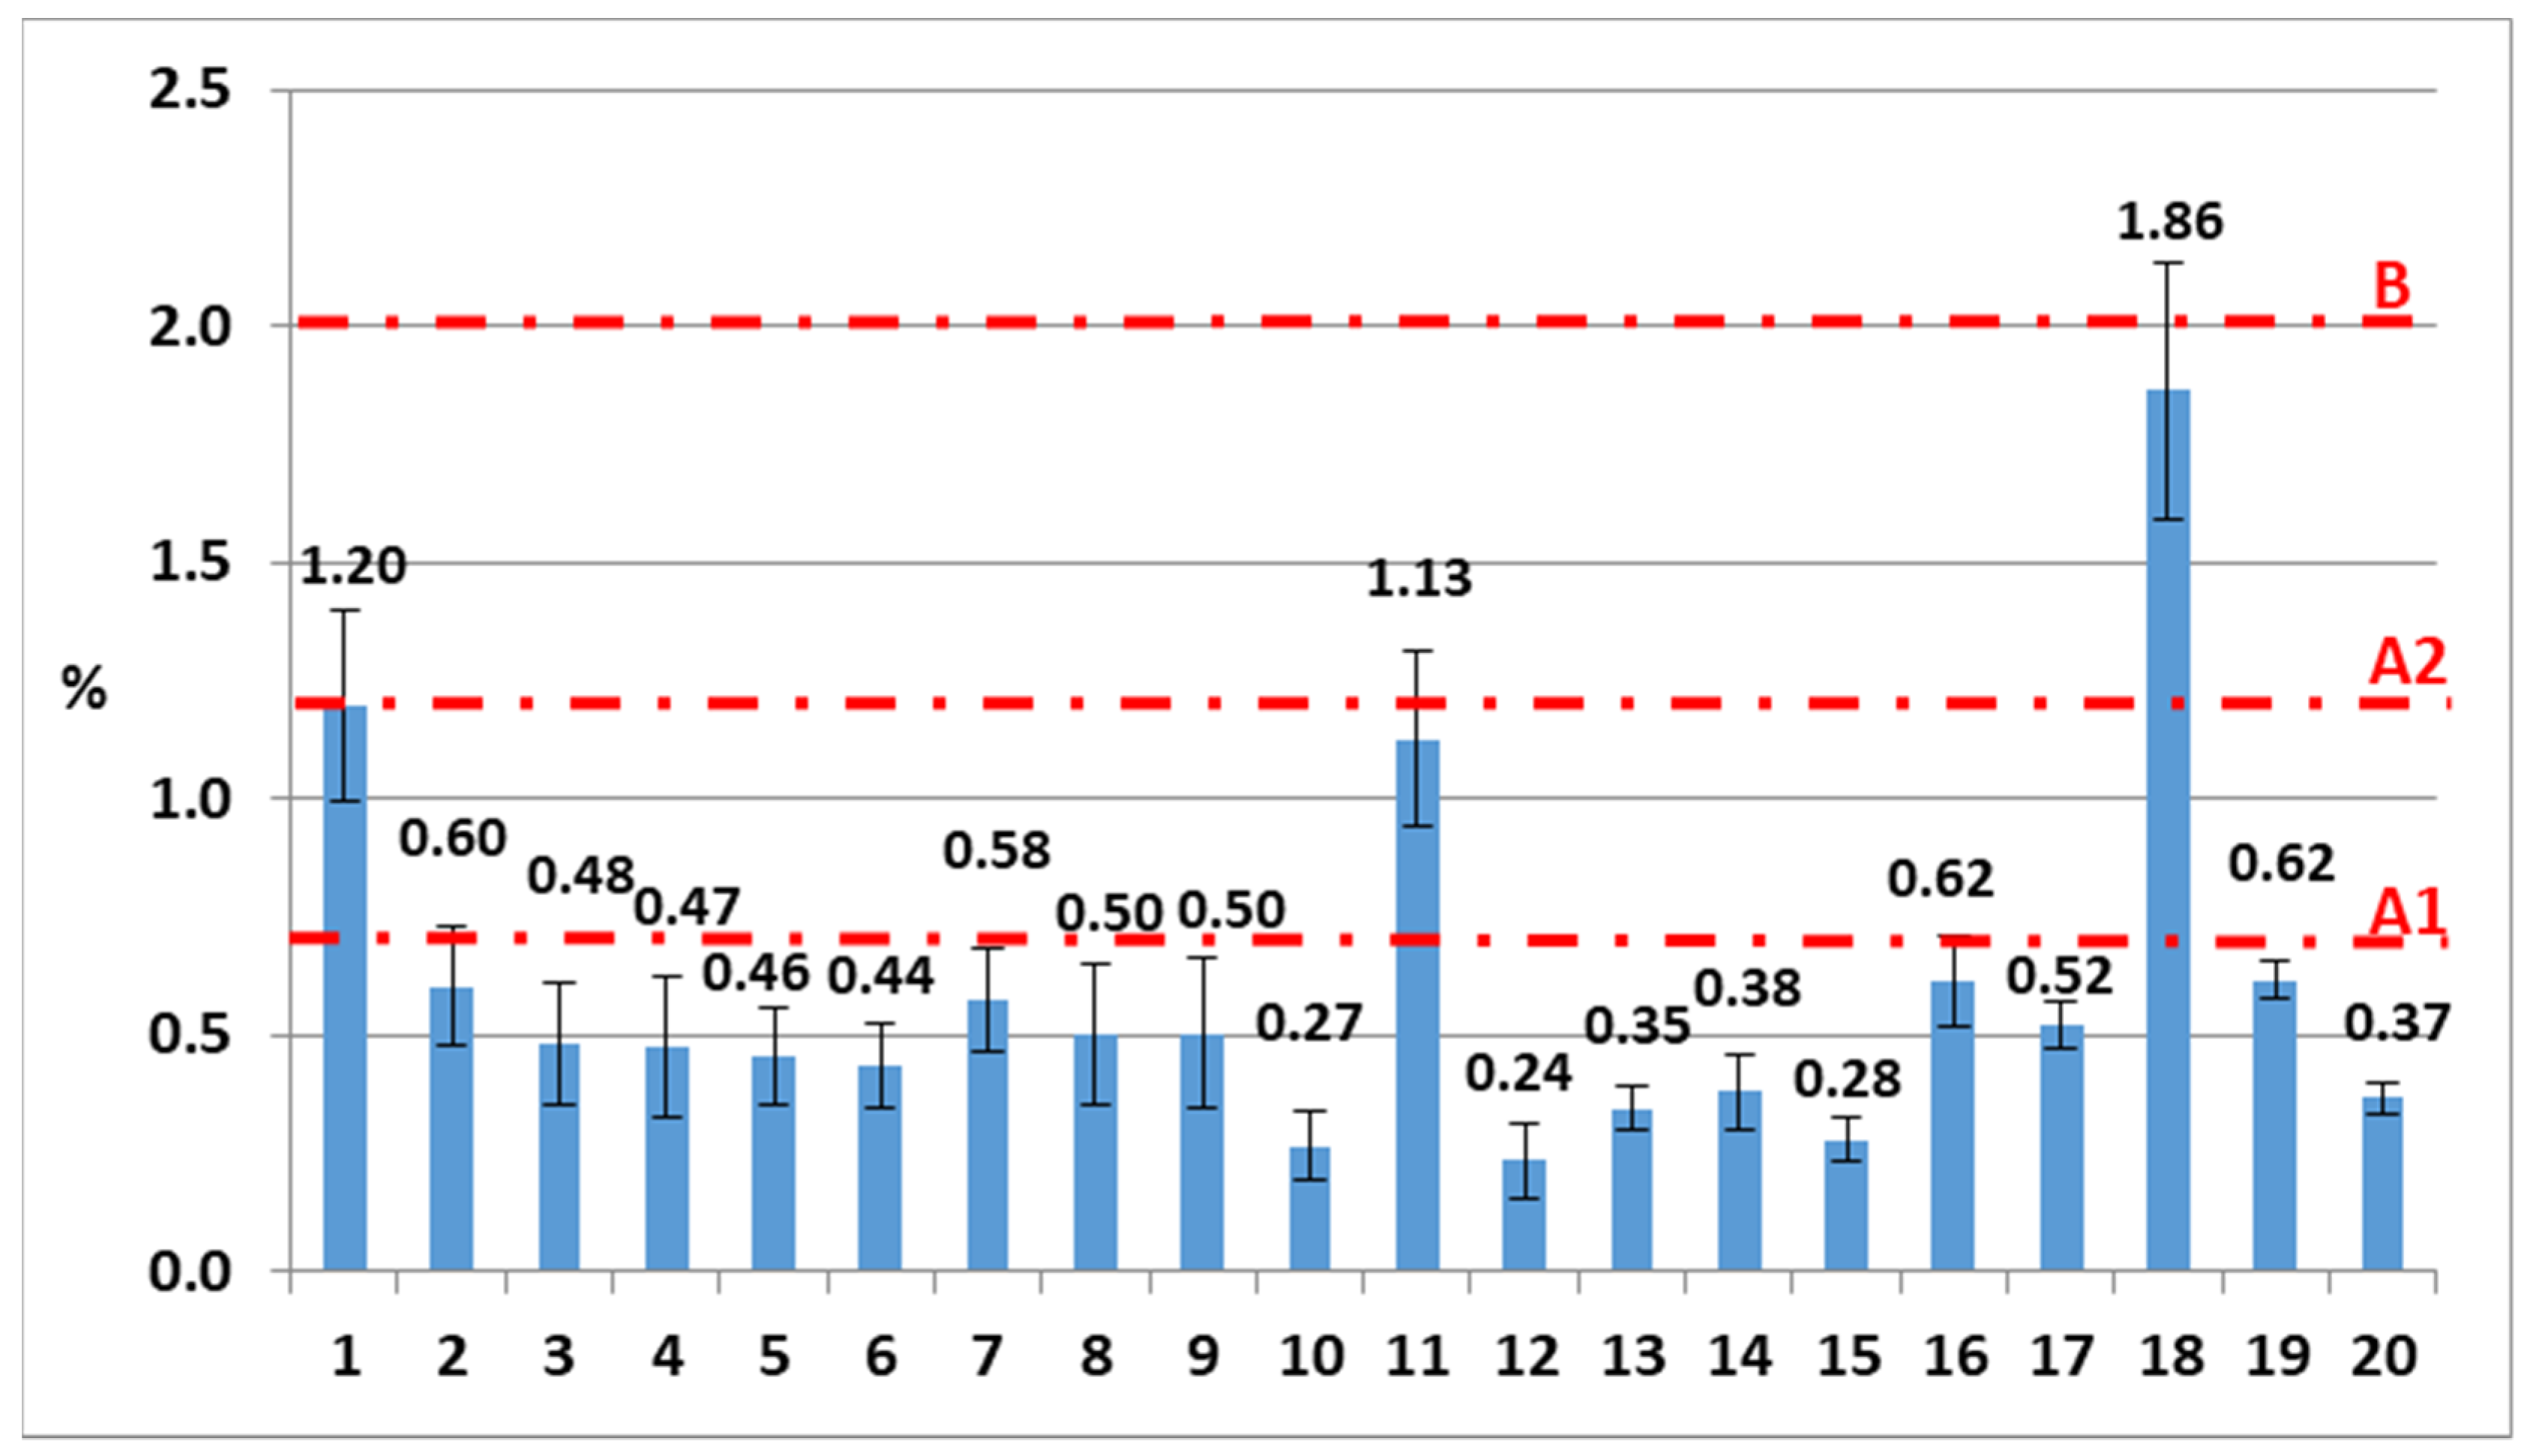
Based on ISO 18122, the threshold value of the ash content, referring to the best quality class A1, is 0.7% (dry basis), ≤1.2% for the second class A2 and ≤2% for the third class B, with regard to residential use. All the pellet brands met the requirements for a low percentage of ash for residential applications (≤2%;
Figure 5). Specifically, 17 pellet brands were found to meet the requirements of the best quality class A1, recording an ash content lower than 0.7%. However, brands 1 and 11 were classified into the second quality class (A2), while brand 18 was classified into the third quality class B—even though they are sold in the market as A1. On the package labels of pellet samples 1, 11 and 18, which after laboratory measurements showed the highest values of ash content, it is reported that 100% pure wood was used as the feedstock for these pellets. More specifically, “conifers”, “beech wood” and “100% wood” are mentioned, respectively, on the packages of these three pellet samples. Therefore, the information reported on the packages does not contribute significantly to the interpretation of these high ash content values. On the other hand, it could not be stated—without the implementation of further chemical composition analysis of these materials—that in these pellets’ mass, bark, sand or other impurities may have been present.
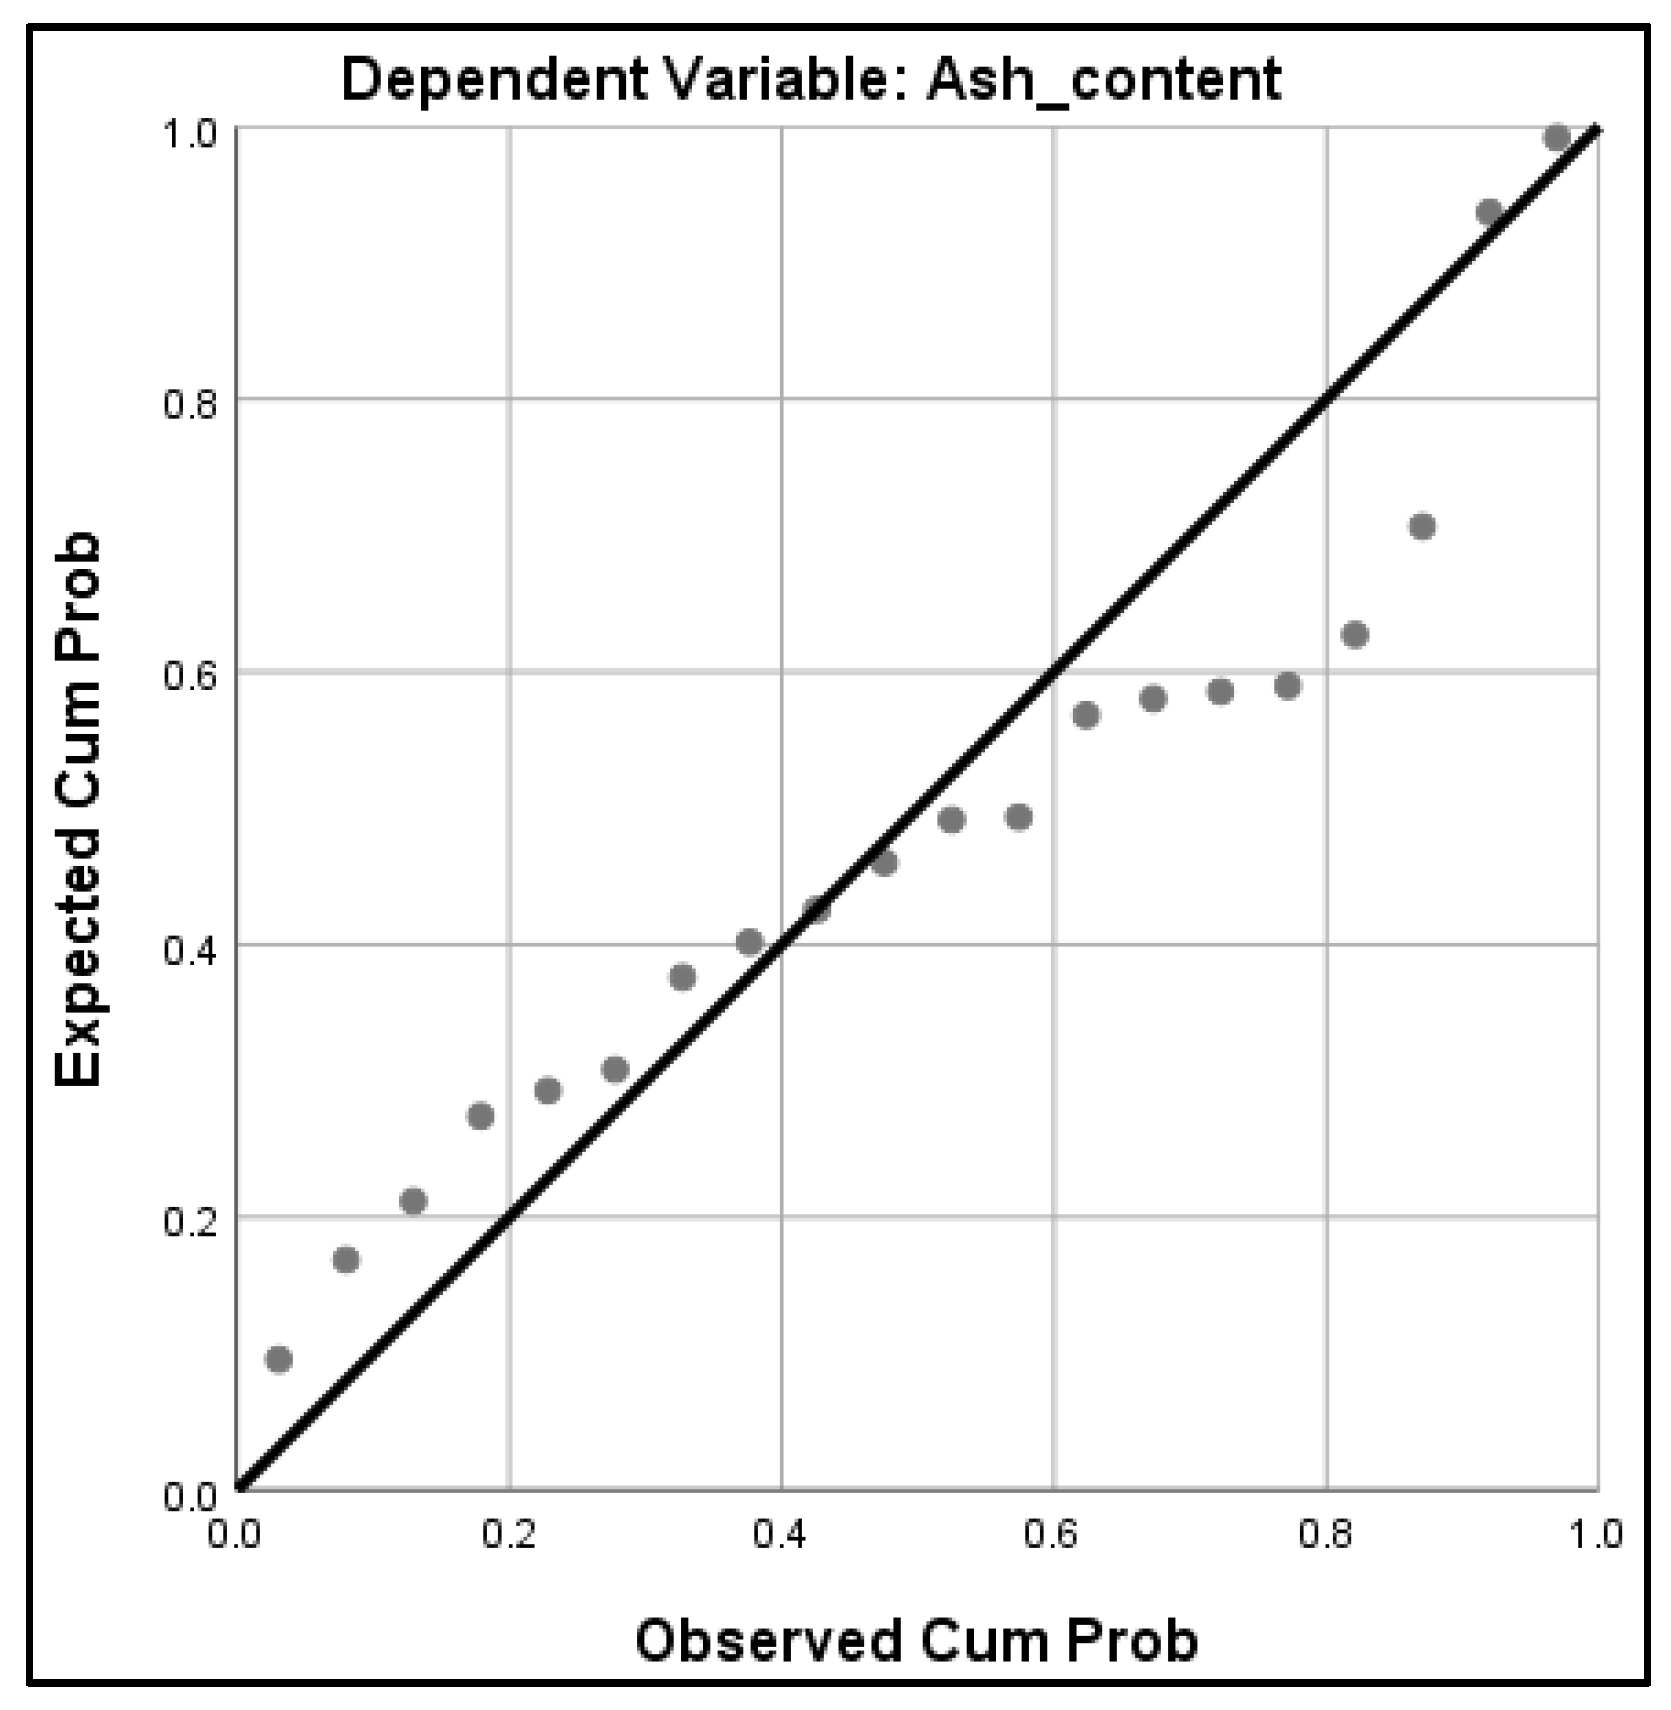
The variability of ash content was found to be influenced by 45.2% by all the other properties of the pellets examined in this study (independent variables)—although this influence could not be considered statistically significant (sig. 0.1790;
Figure 6). A statistically significant (sig. 0.0141) negative correlation was found between ash content and mechanical durability, with 49% of their variability attributed to one another. Therefore, pellets with a high ash content seem to present with lower mechanical durability, even though the mechanical durability may in parallel be associated with several production process parameters. The ash content is highly correlated (sig. 0.0049), in a negative way, to lightness by 56.2%, suggesting that the darker colour of pellets may correspond, among other factors, to a slightly higher ash content (
Table 2). Roughness presented a marginally statistically significant (0.0665) correlation to ash content, influencing its variability by 34.8%. A marginally significant correlation of roughness to the calorific value was marked, influencing negatively the calorific value variability by 35.9%. Duca et al. [
6] reported that the ash content value could be used as a good representative parameter for an initial rapid quality assessment, while Toscano et al. [
30] pointed out that ash content is mainly linked to sulphur, potassium and chlorine, revealing that low limit threshold values for ash content ensure low chlorine and sulphur contents.
3.3. Mechanical Durability
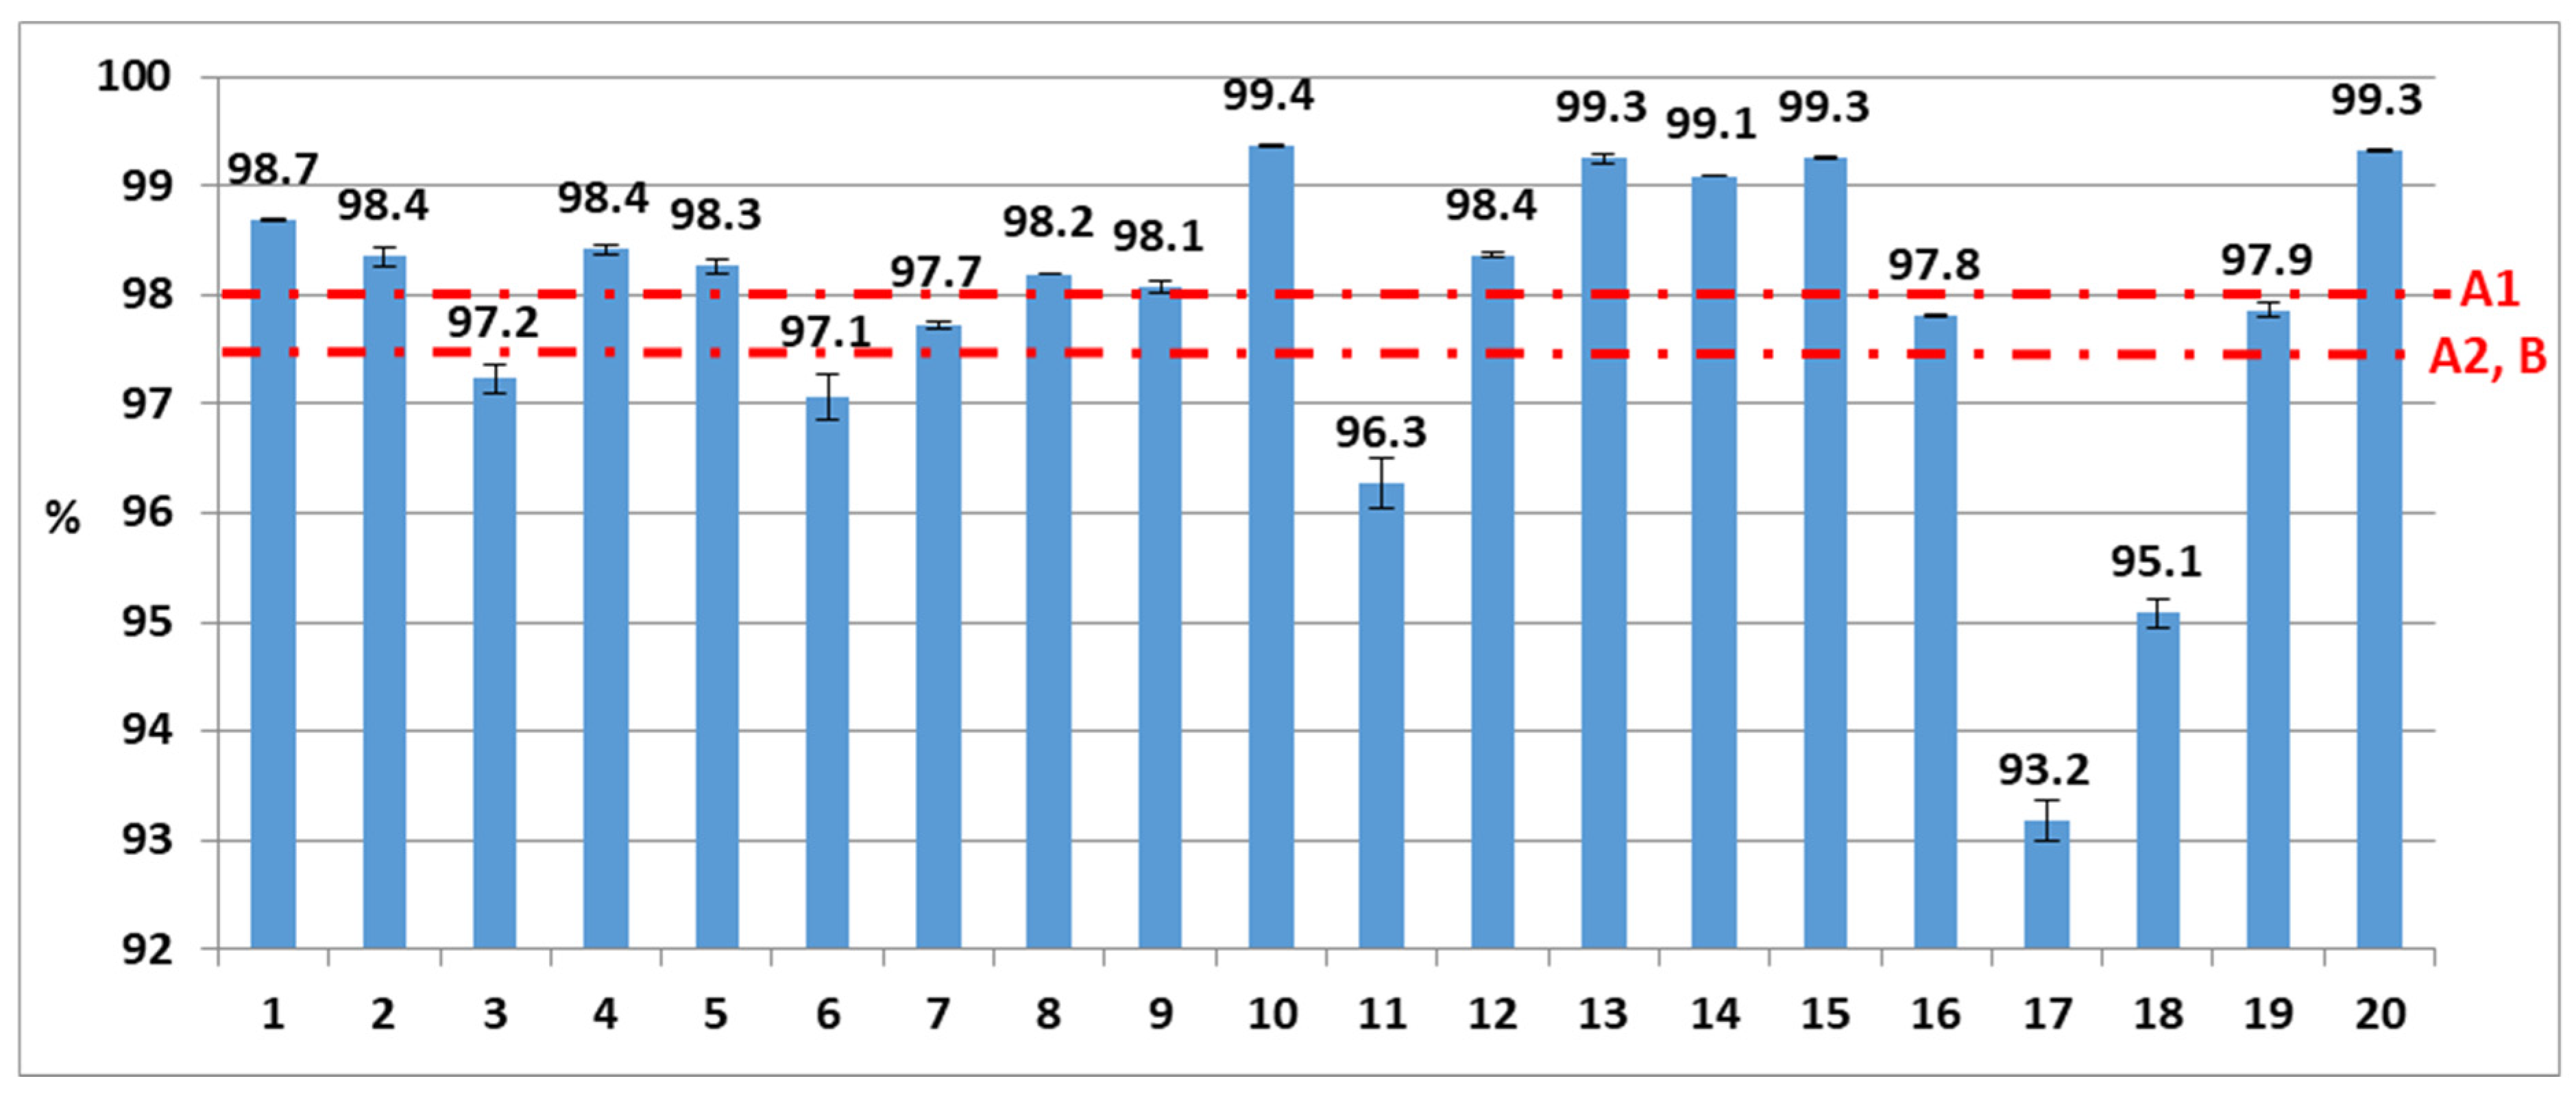
For the mechanical durability of pellets, the standard ISO 17831-1 defines ≥98% as the lowest threshold value for the best quality class A1, and 97.5% for the A2 and B quality classes, respectively. Twelve of the pellet brands were categorized into the A1 class, while three brands were classified into the A2 and B classes (
Figure 7), with concern to their mechanical durability. The remaining five brands (3, 6, 11, 17, 18) were found not to meet the standard requirements for residential use, recording values lower than 97.5%, and so should not be sold as A1. The consumption of these five brands of pellets could cause problems to consumers’ burning systems and loss of money due to material loss. The 17th pellet sample recorded the lowest mean mechanical durability value, while the 10th pellets sample showed the highest value, respectively.
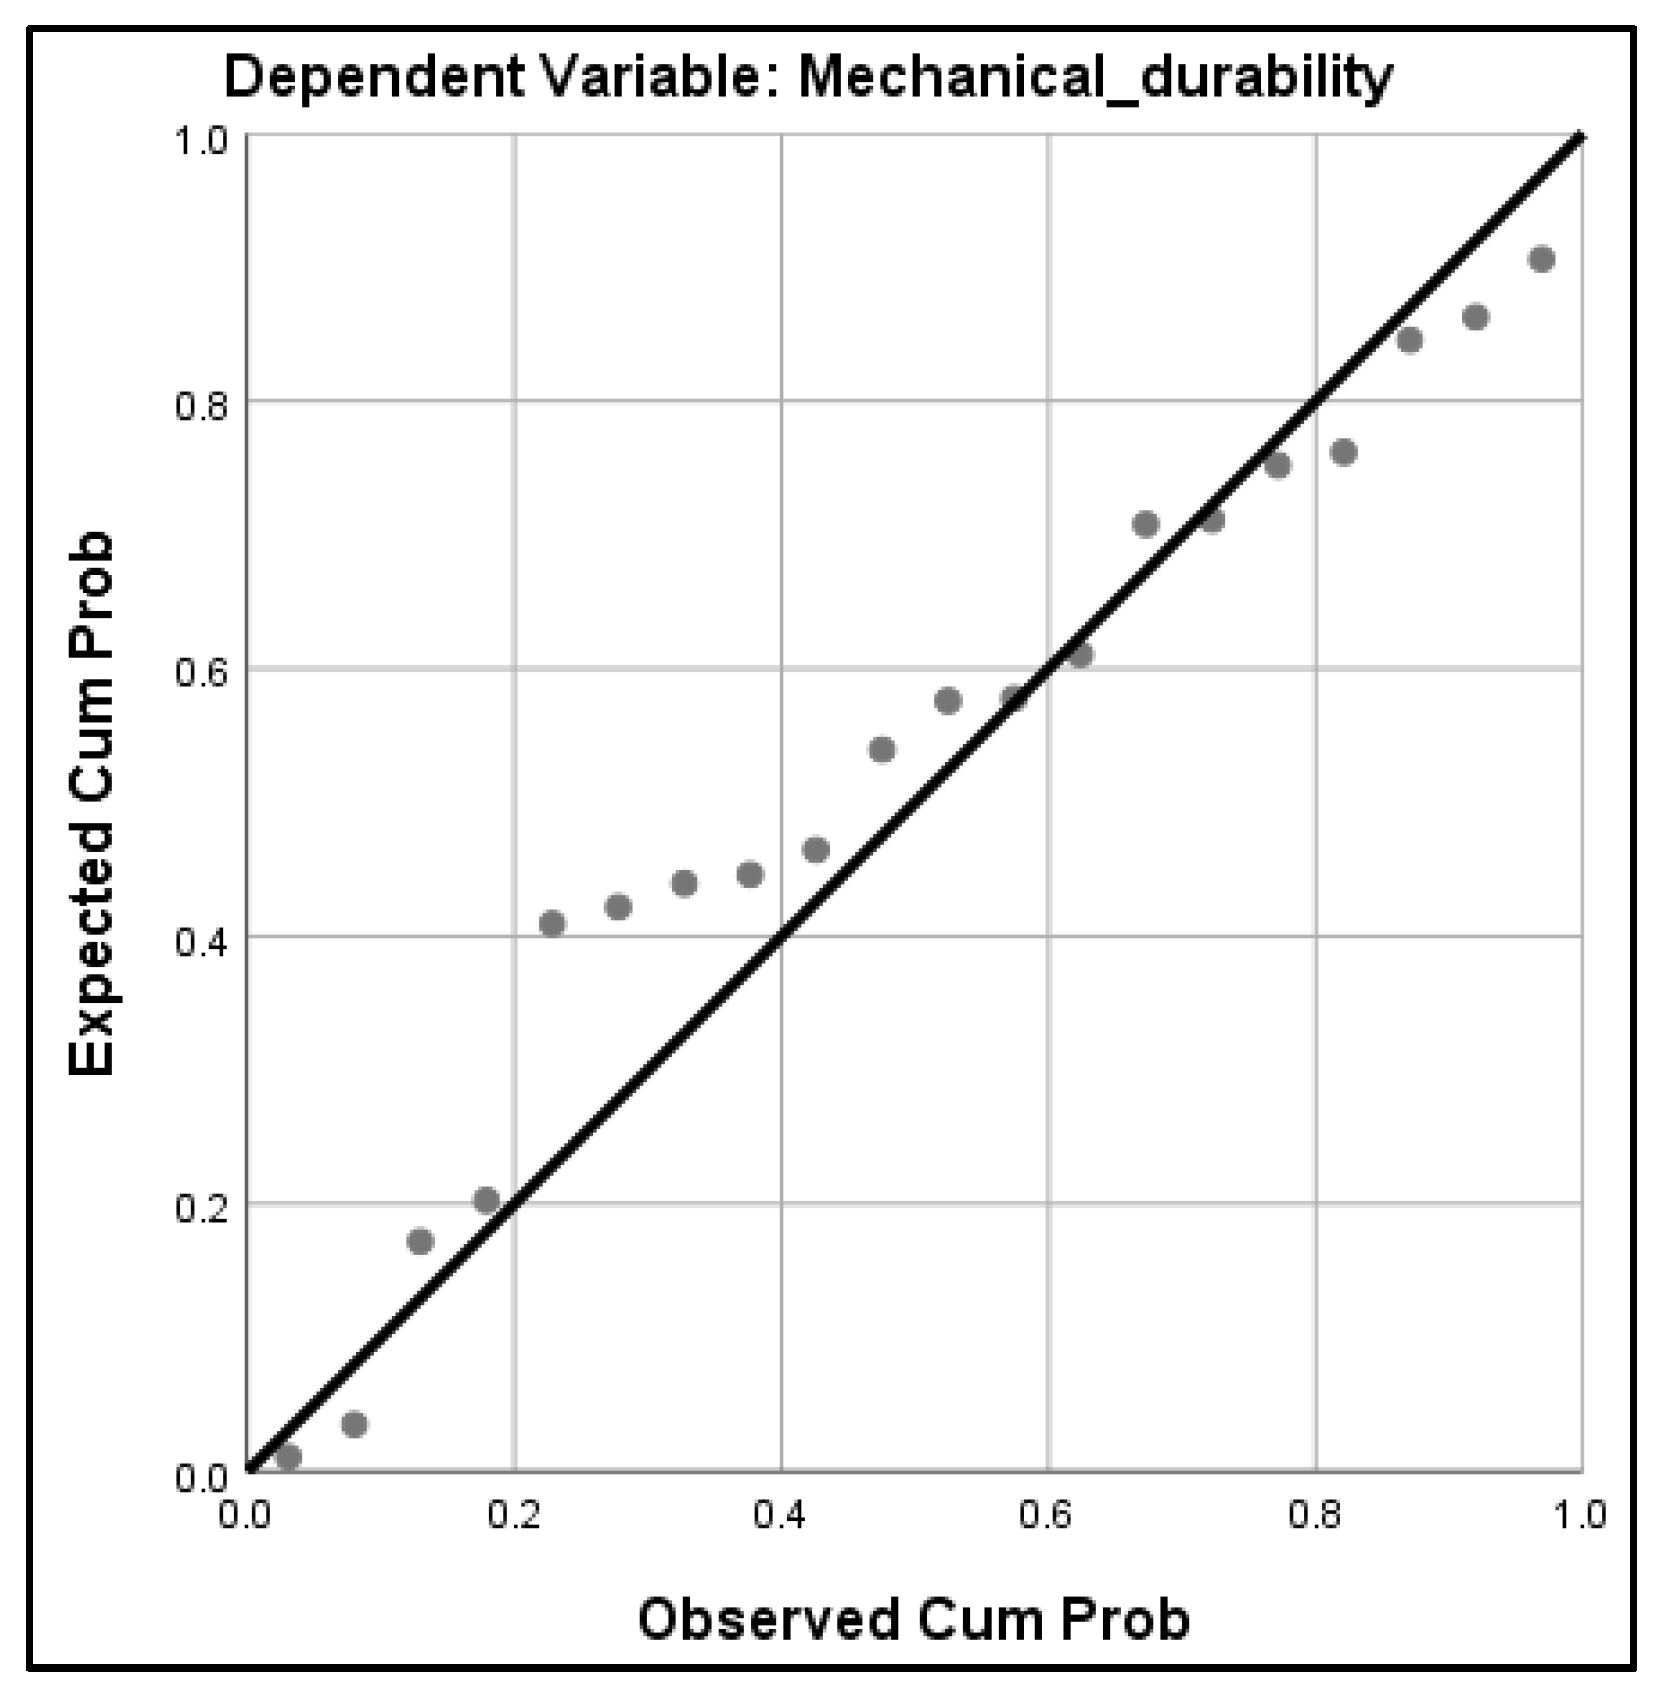
The mechanical durability variability was not significantly influenced (sig. 0.1806) by the interactions between the properties examined in this work, whereas it was found to be influenced significantly (sig. 0.0232), by 42.6%, by the interaction between moisture content, roughness and lightness (
Figure 8). Investigating the correlations between mechanical durability and the mentioned properties separately, lightness presented a statistically significant (sig. 0.0179) correlation with mechanical durability, influencing its variability by 47.1% in a positive way. The moisture content was found to significantly influence (sig. 0.0367) the mechanical durability by 40.9%, indicating that as moisture content increases up to 10%, the durability increases as well. Roughness did not present a statistically significant correlation with mechanical durability, when examining the properties one-by-one (
Table 2).
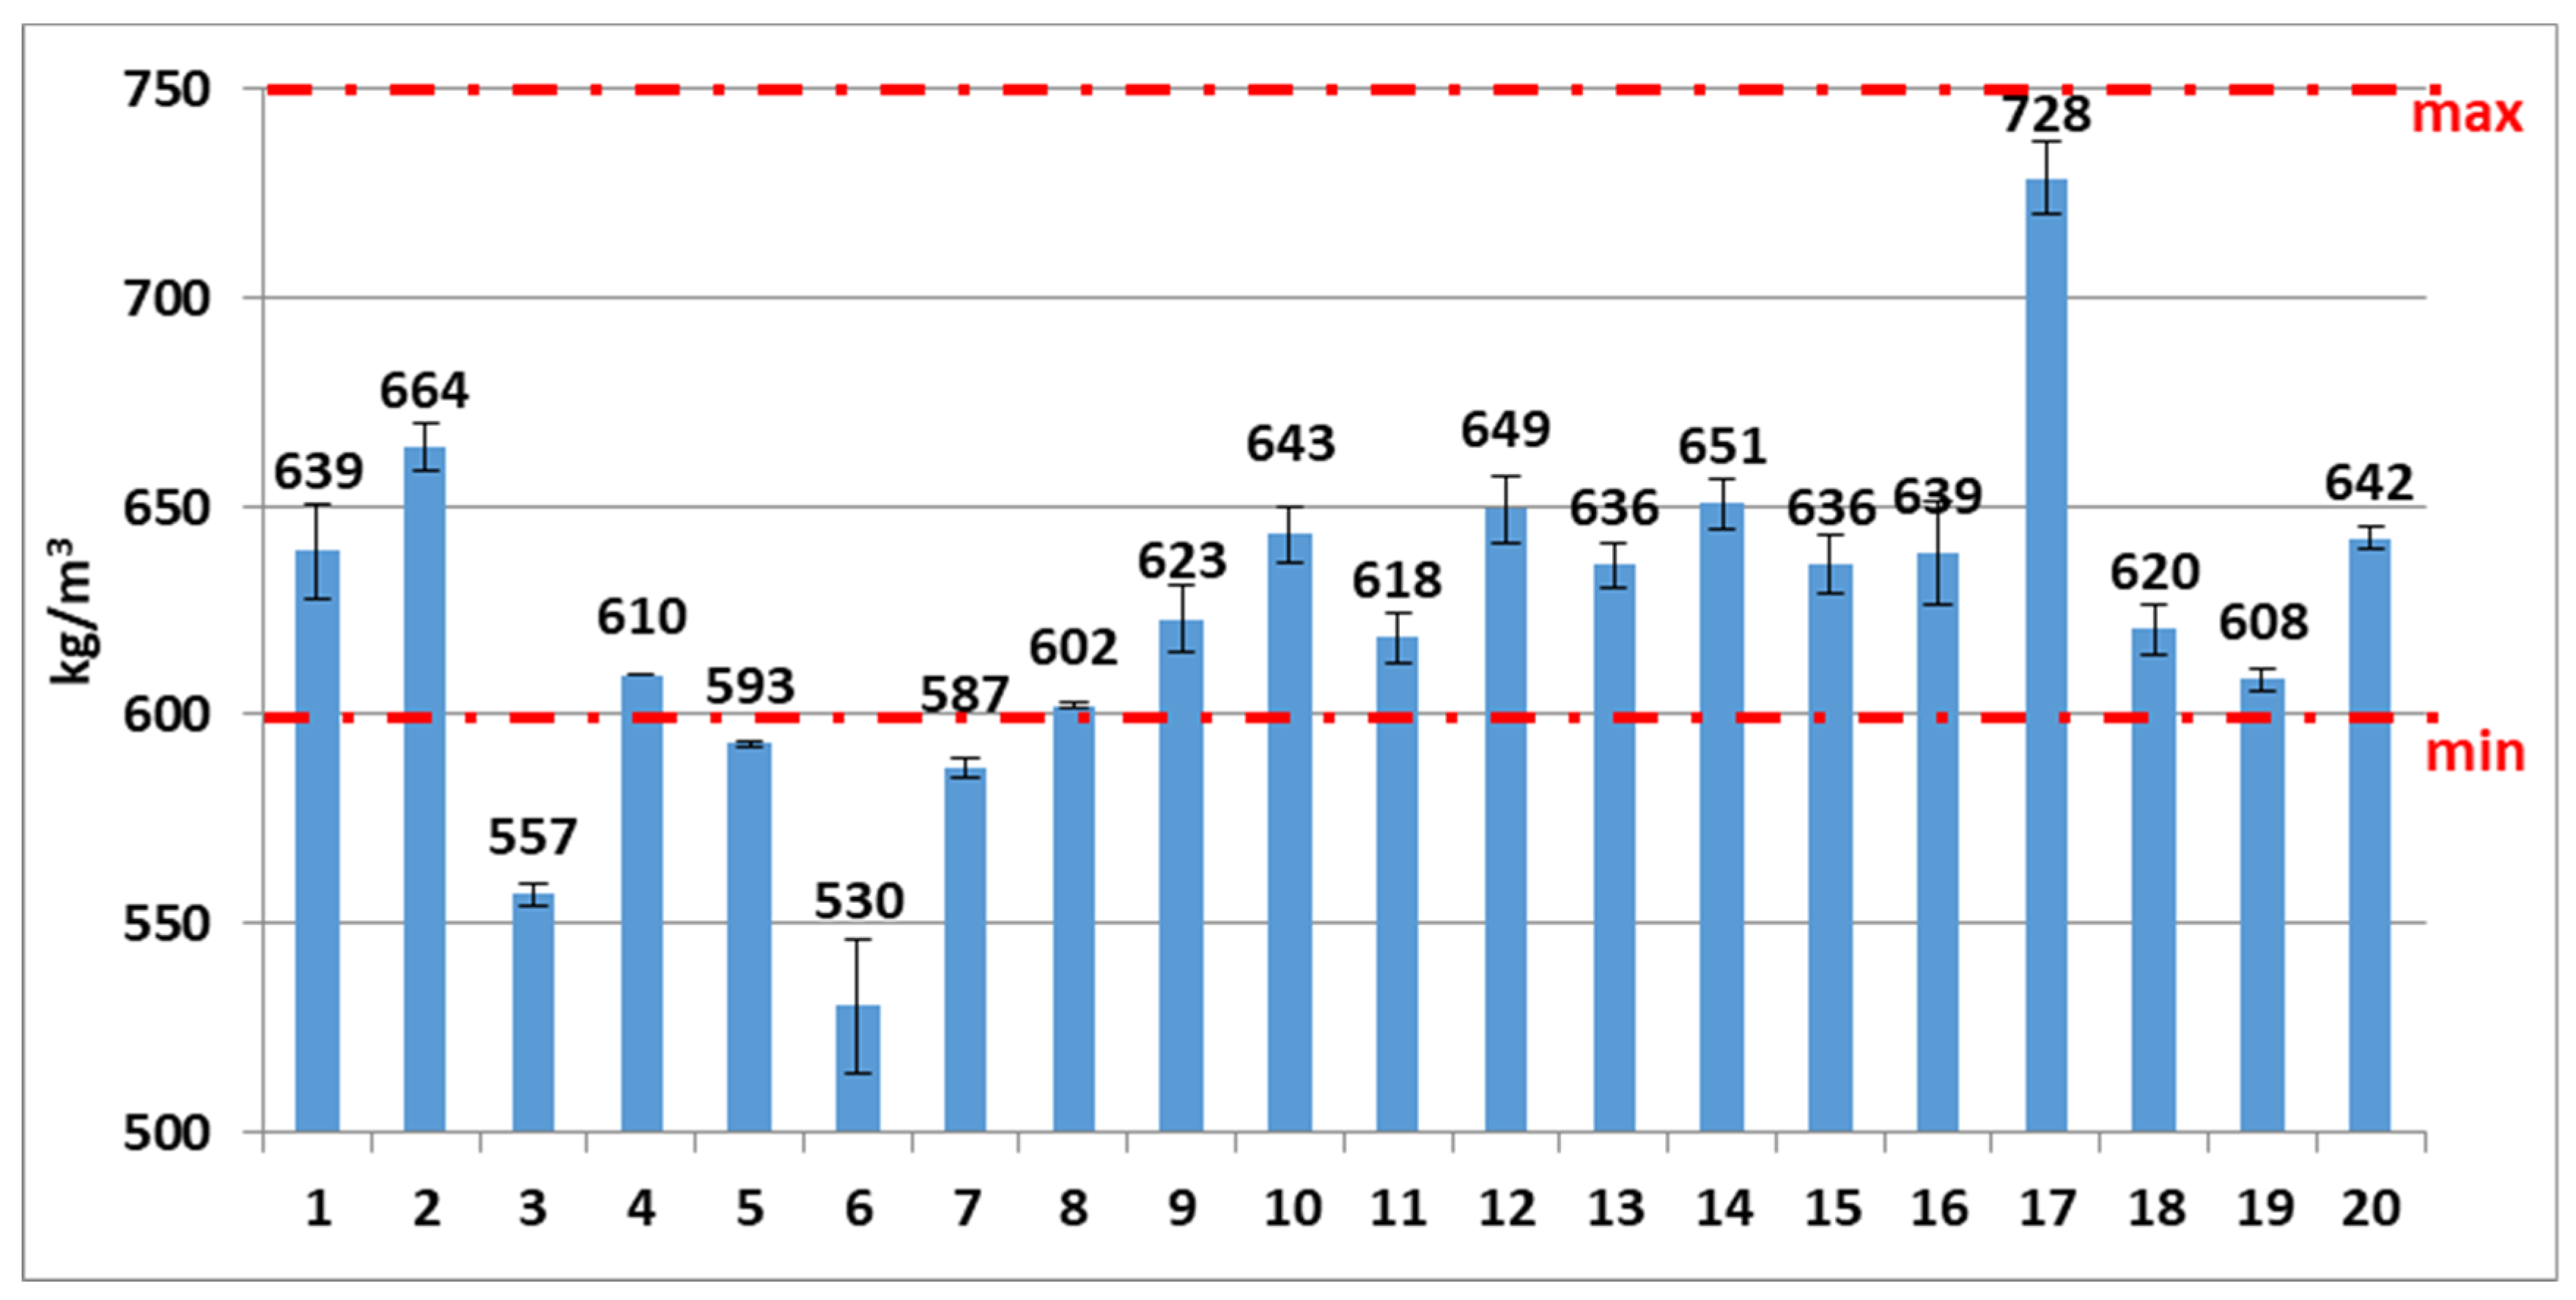
3.4. Bulk Density
Bulk density is a characteristic of great importance for solid biofuels, since it reflects the quantities of fuel that can be placed and transported in specific packaging bags and stored in specific spaces, etc.—also affecting the fuel cost [
9]. According to ISO 17828, the bulk density of pellets for residential use should range between 600–750 kg/m
3. Therefore, 16 of the studied brands met the requirements of the standard for residential use, while 4 brands (3, 5, 6, 7) presented a bulk density significantly lower than 600 kg/m
3, and should have been classified for industrial use (
Figure 9). The 6th pellet sample recorded the lowest mean bulk density value among the different samples. The 17th pellet sample presented the highest mean value of bulk density among the samples, and although this is considered to be a positive characteristic of solid biofuels, the higher bulk density could be attributed to its lower mechanical durability (
Figure 7); combined with the lowest MC value, this could be explained by the potential generation of large quantities of fine-grained material resulting from the pellets’ destruction.
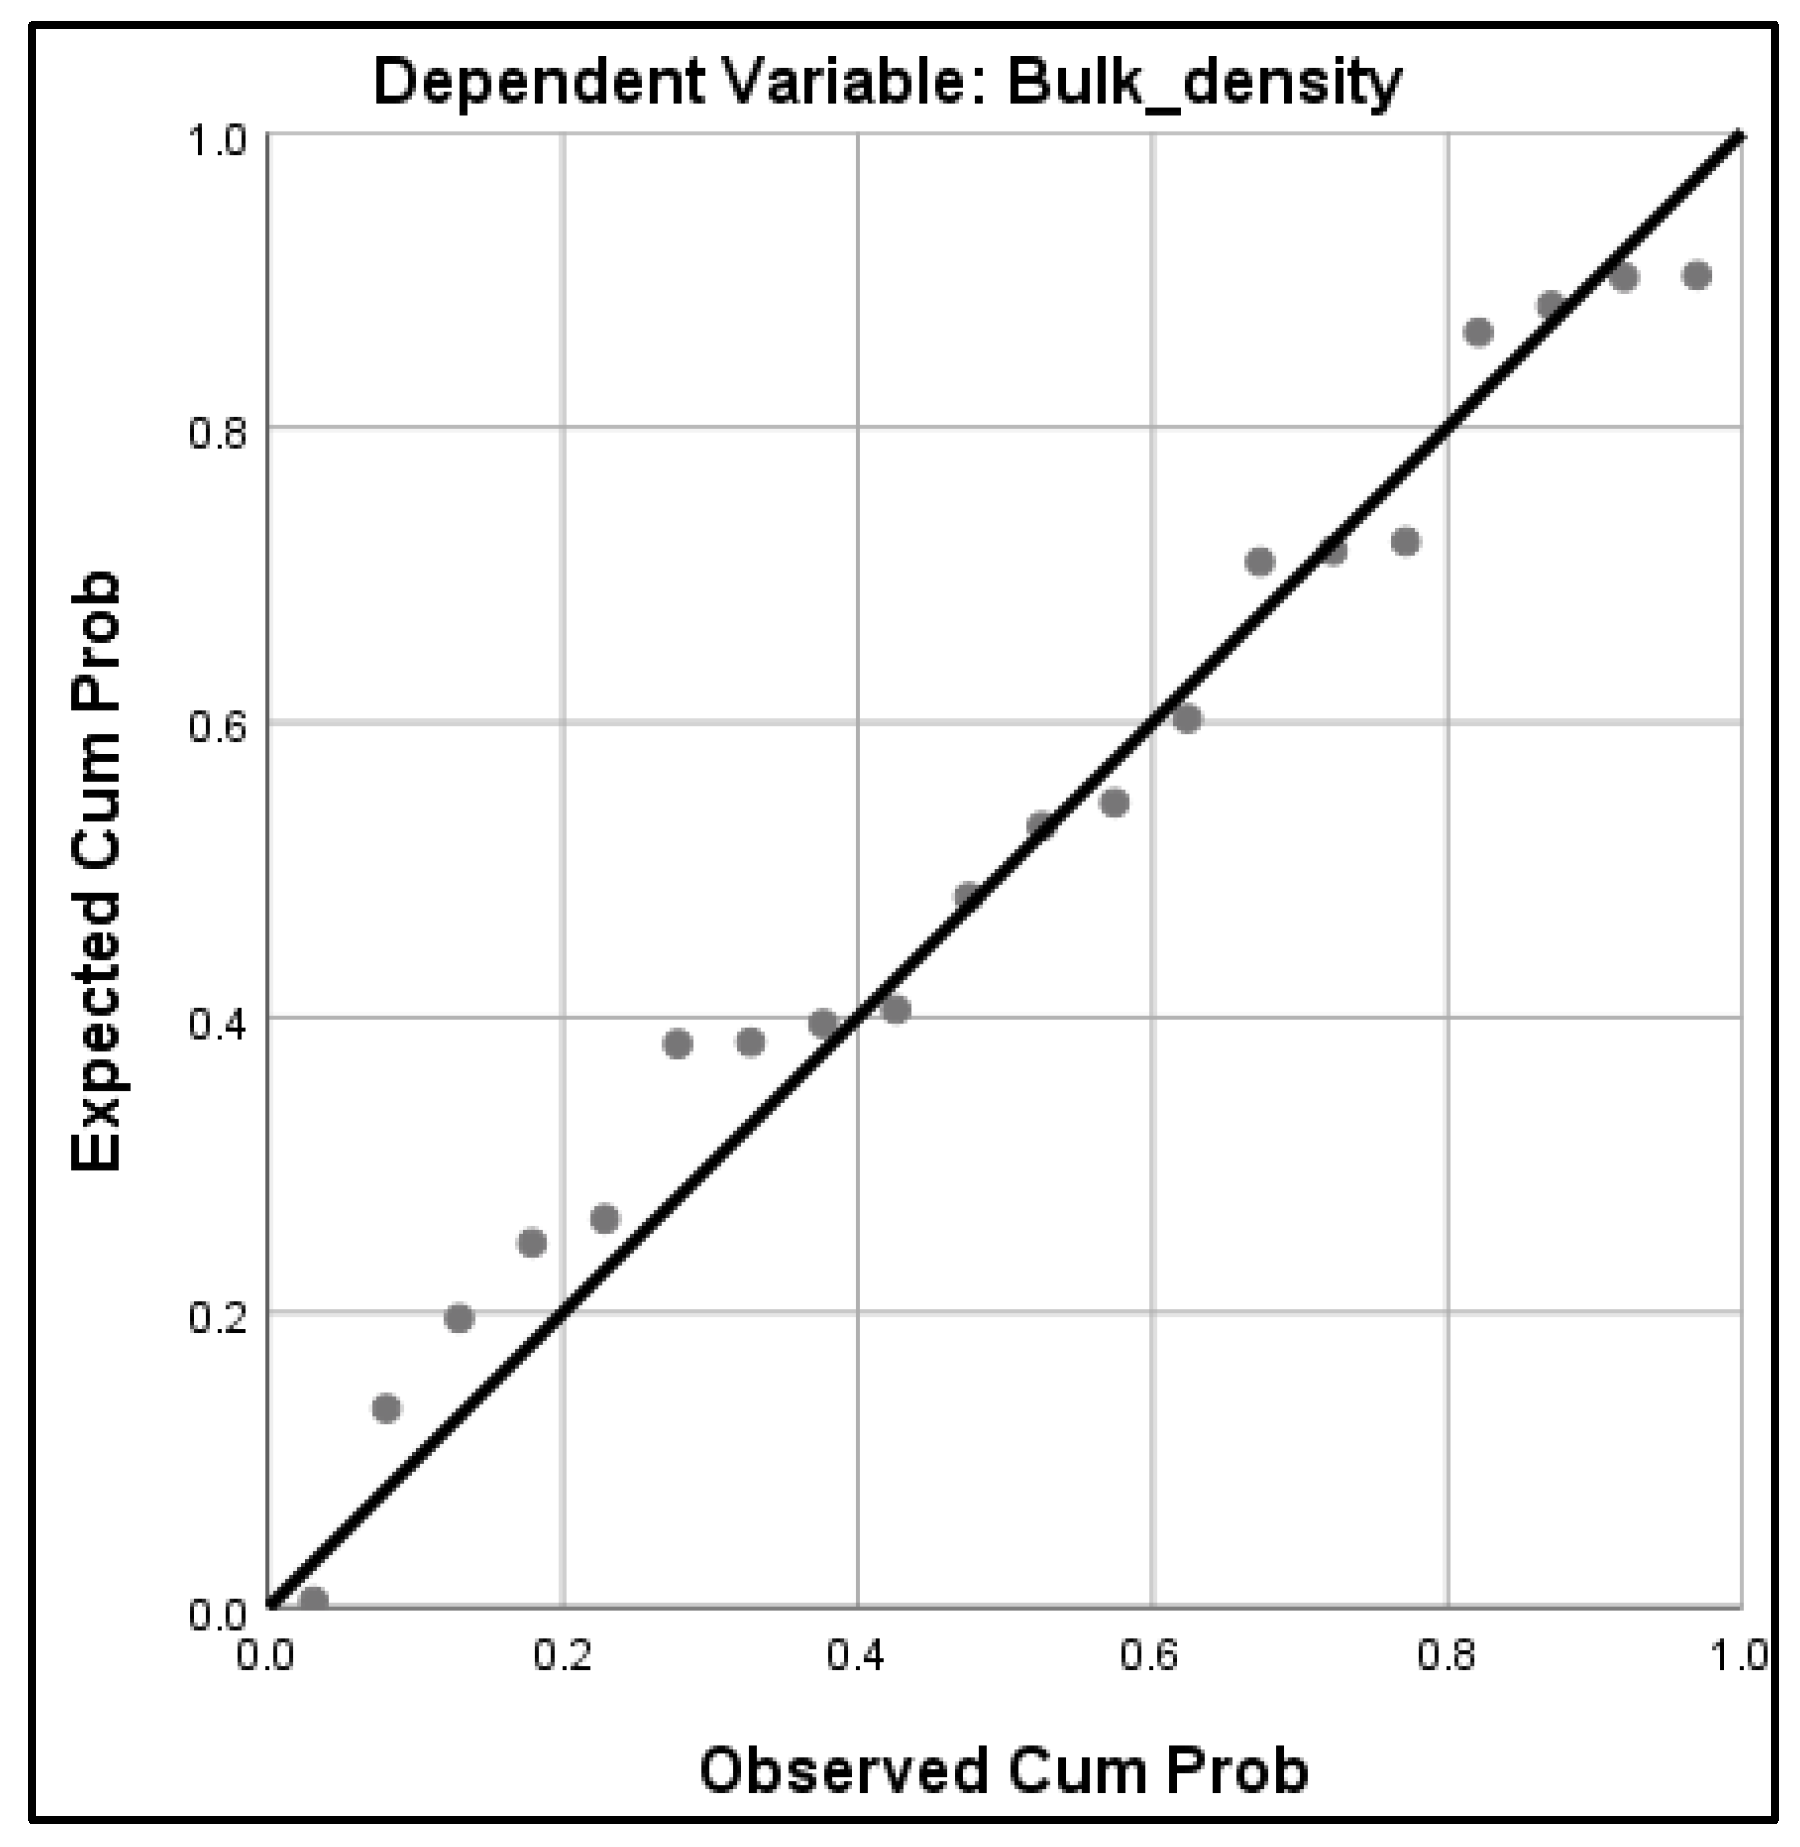
The variability of bulk density was found to be significantly influenced by the interactions of all the independent properties examined in this study by 64%. Specifically, 86.6% of the bulk density variability was attributed to the moisture content, revealing a highly significant negative correlation (sig. 0.0005). This would indicate that as pellets’ moisture content increases (up to 10%), the bulk density decreases—probably due to a simultaneous dimensional change in the pellets and the increased mechanical strength of the pellets, as stated previously (correlation between moisture content and mechanical durability). Length is a variable that was expected to be significantly correlated to the bulk density and the samples here presented a slight, though not statistically significant, correlation. The interaction between length and moisture content, as two independent variables, was found to influence the bulk density significantly (0.0029) by 50% (
Figure 10).
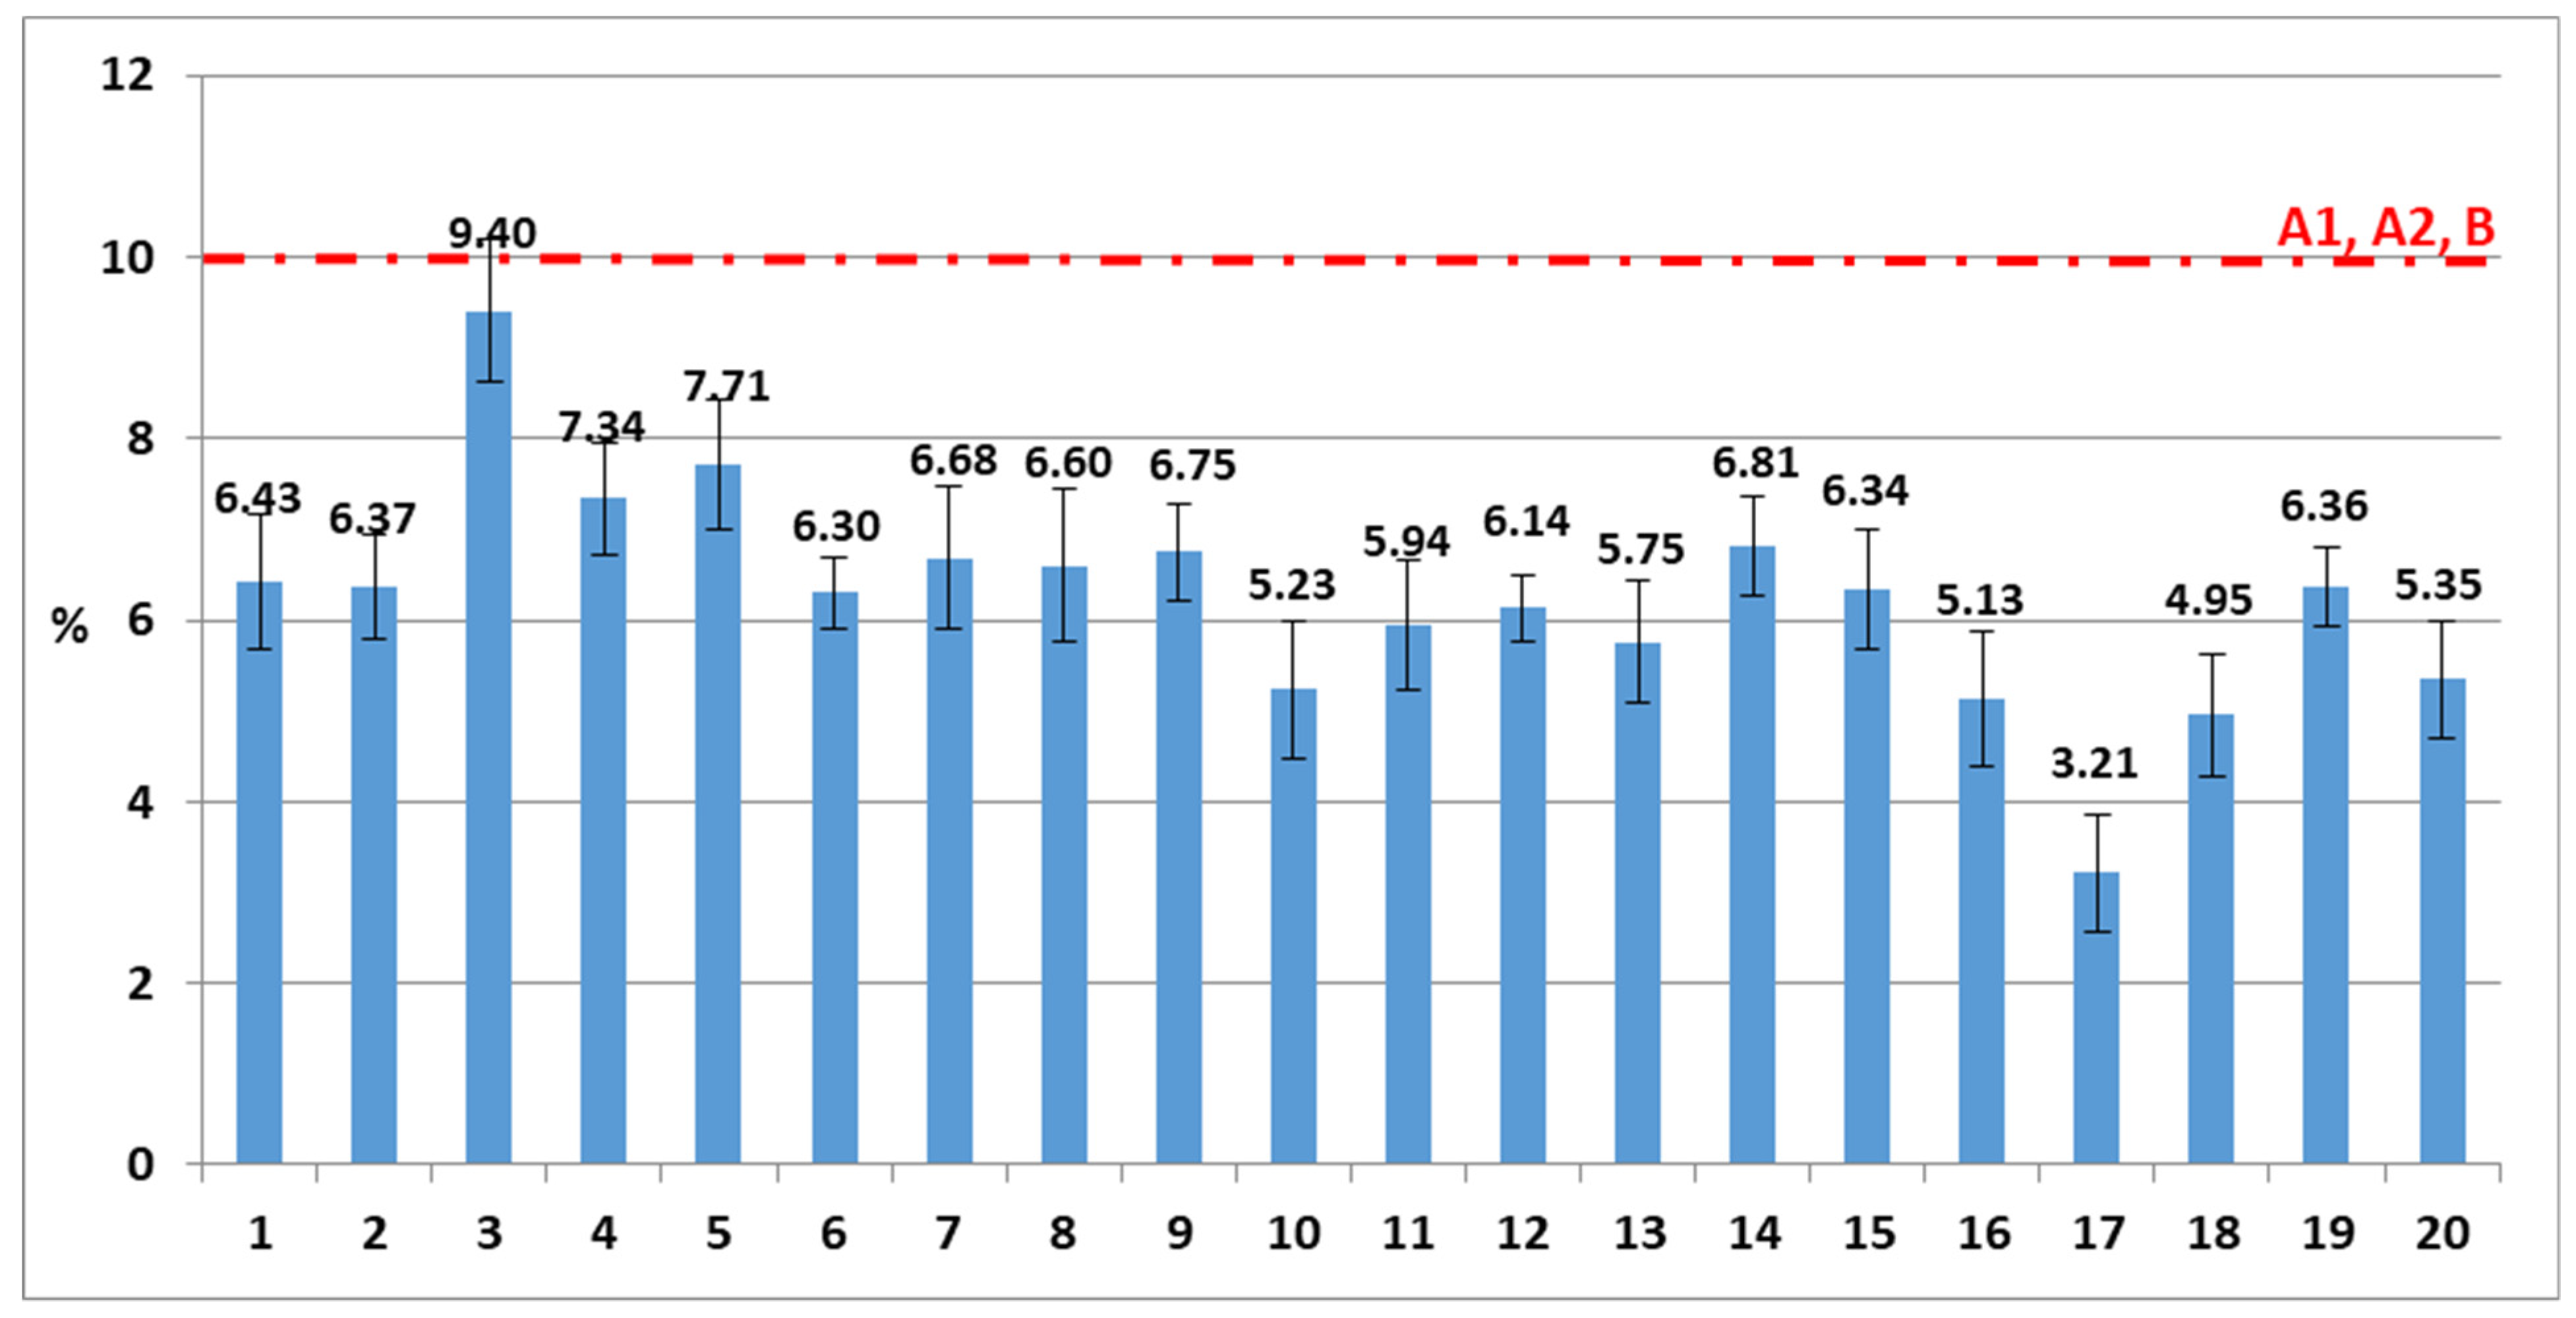
3.5. Moisture Content
MC is one of the most crucial factors affecting the efficiency, stability and completeness of combustion of a solid biofuel [
2]. The mean MC values of the samples were found to be quite low, ranging from 3.21% to 9.4% (
Figure 11). Therefore, all the samples had a MC lower than 10%, meeting the requirements of ISO 18134 for residential use, referring to the A1, A2 and B quality classes. The 17th pellet sample revealed the lowest mean moisture content value, while the 3rd pellet sample the highest value, respectively.
As already mentioned, the moisture content seemws to have a significant negative impact by 86.6% (sig. 0.0005) on the bulk density. Therefore, as the moisture content of the pellets increased up to 10%, the bulk density decreased—although the mechanical durability increased. Generally, the moisture content of pellets should not exceed a level of 10% according to the standard requirements, although preferably it should not be much lower than 8%, which is in line with the findings of Kofman [
31]. The rest of the properties examined in this study were not found to be significantly correlated with moisture content values.
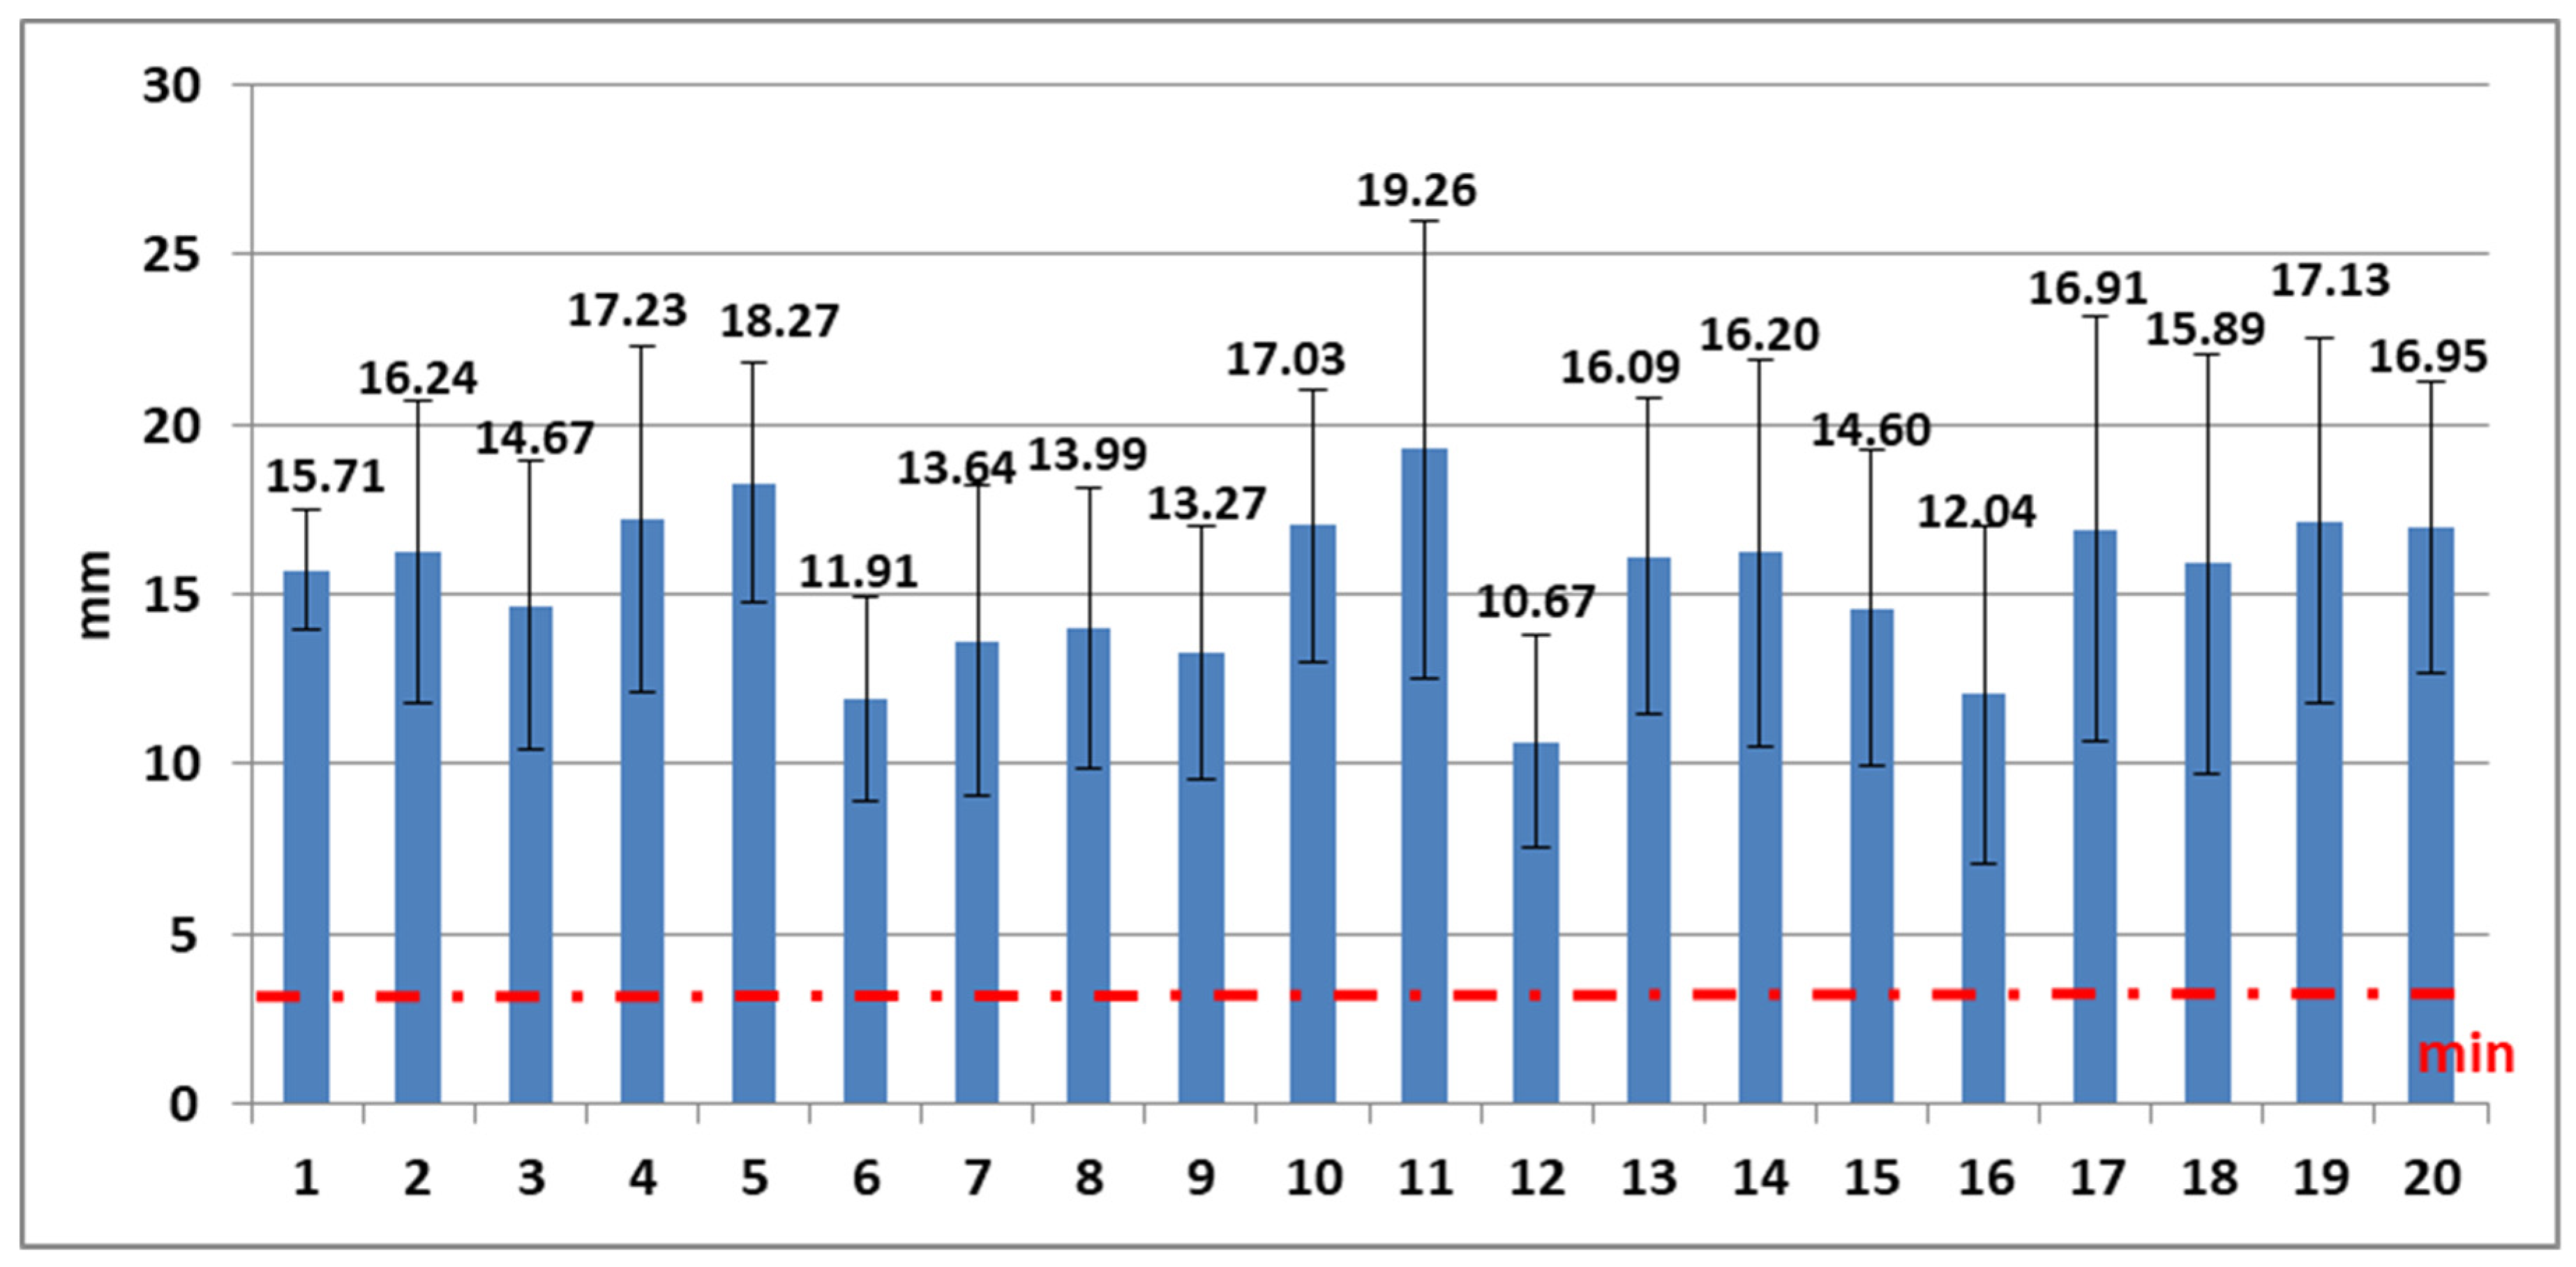
3.6. Dimensions
The standard ISO 17829, dealing with the determination of the length and diameter of pellets, states that they should range between 3.15–40 mm and 6 ± 1 mm, respectively, to be classified into quality classes for residential applications (A1, A2 and B). It was observed (
Figure 12) that the mean length values of the pellet brands ranged from 10.67 mm to 19.26 mm and were all within the dimensional length limits set by the corresponding standard. More specifically, pellet samples 6, 12 and 16 presented the lowest mean values of length, while the 11th pellet sample showed the highest value, respectively.
The only significant correlation detected between the length of the pellets and the rest of the studied properties was a negative correlation between length and calorific value (influence level of around 40%, sig. 0.0404). Nevertheless, it could be stated that the chemical composition of the feedstock is the critical factor affecting its calorific value [
2,
9] and not the pellet length.
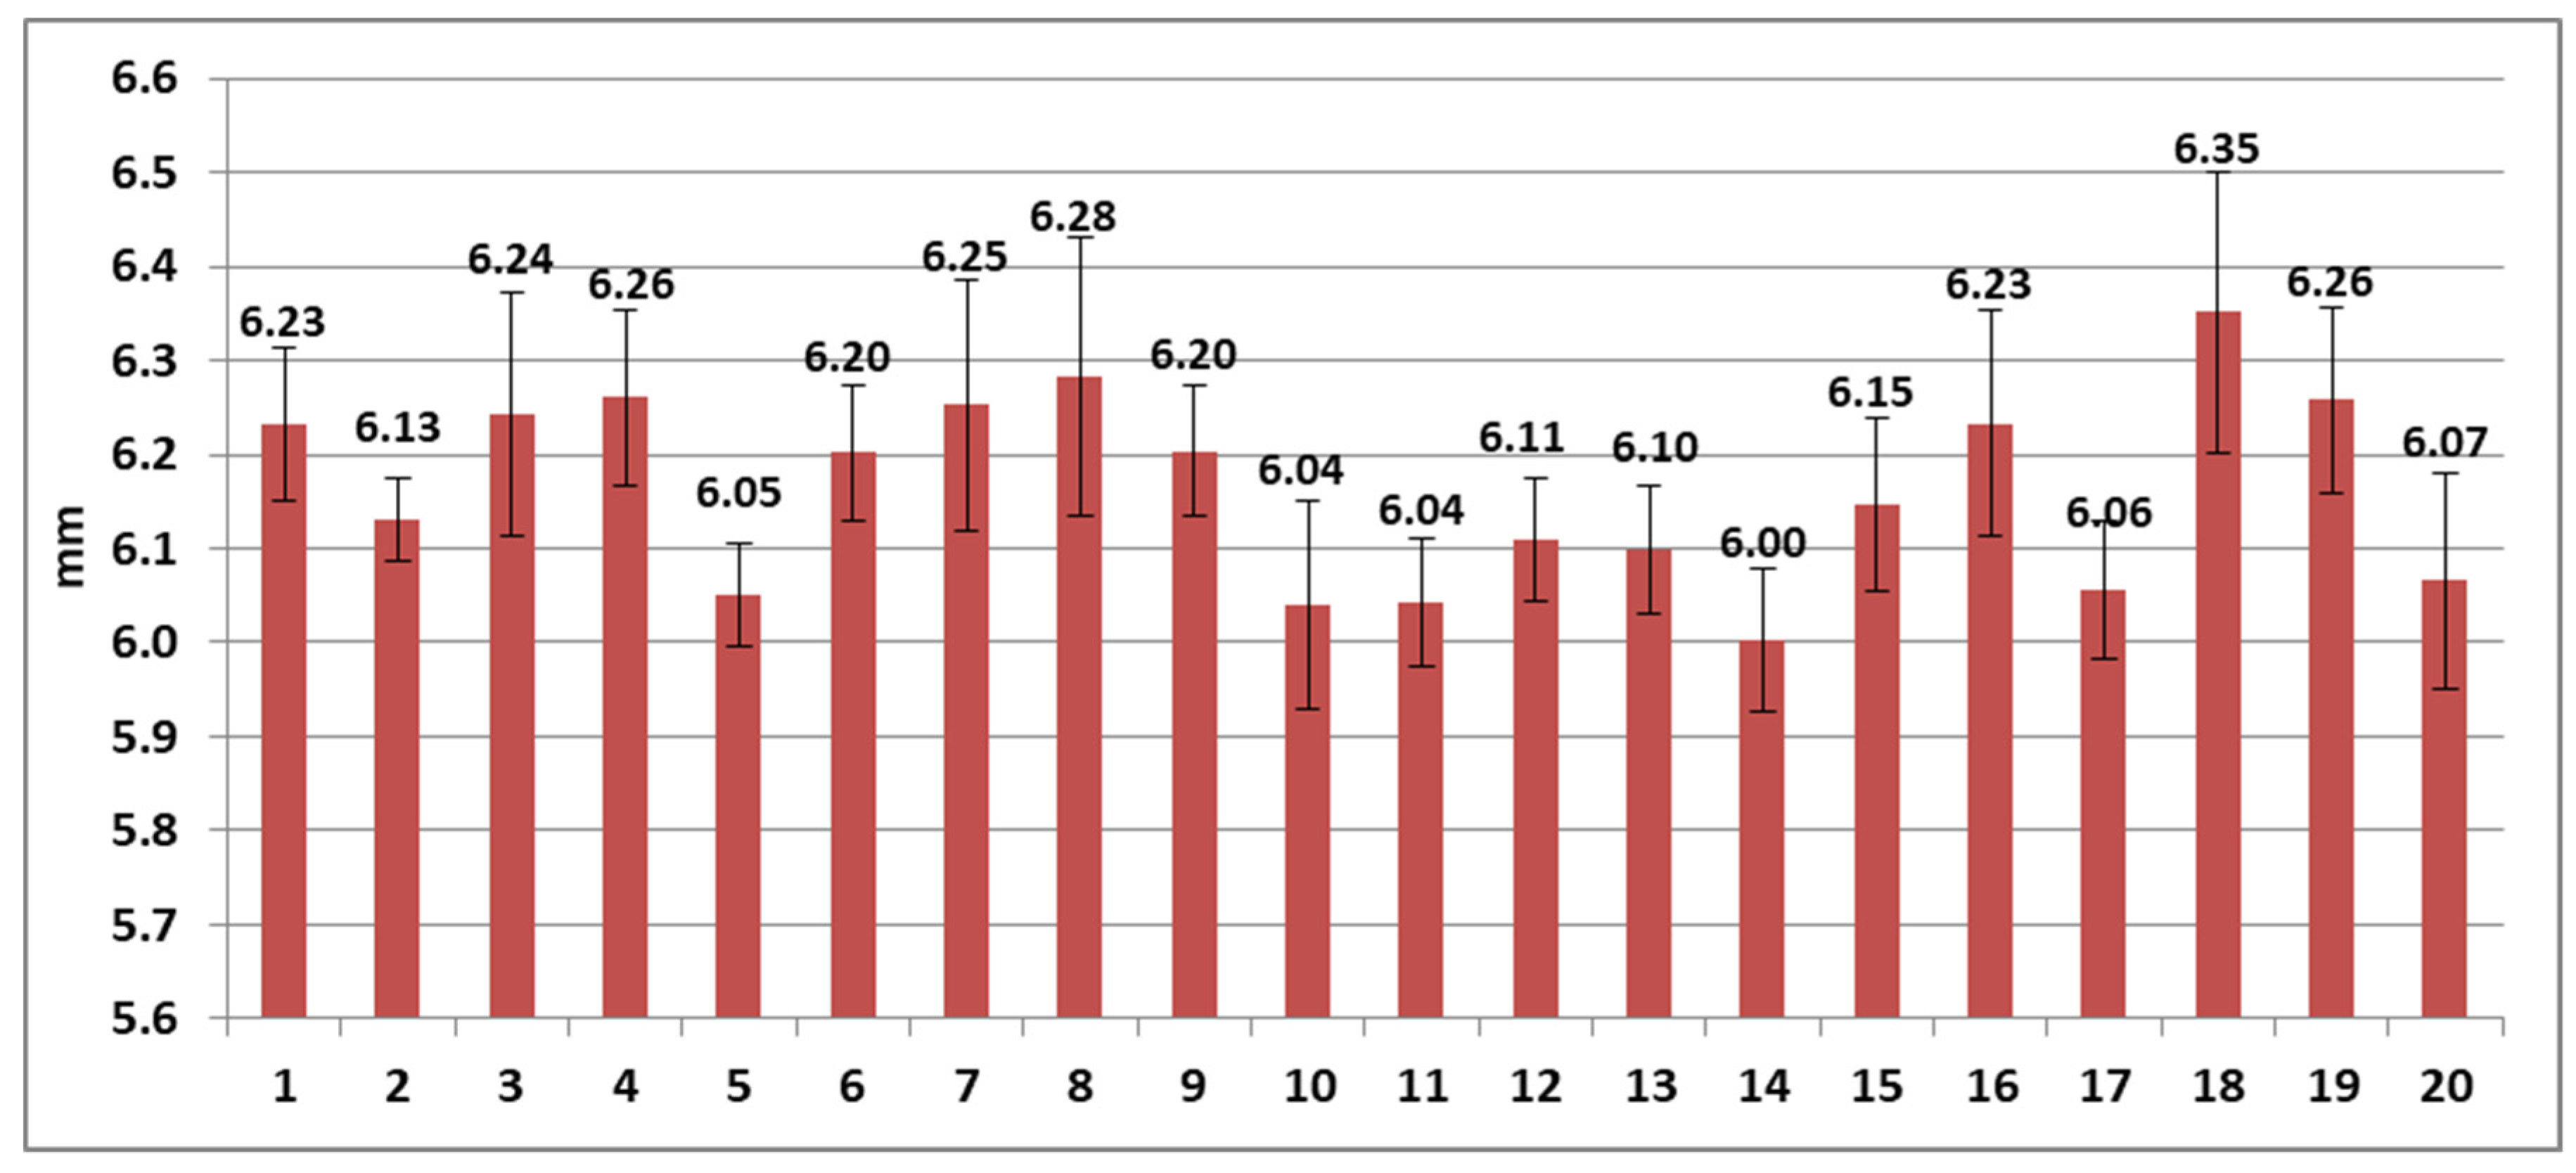
Slight differences were found among the mean diameter values of the different pellet samples (
Figure 13), with a range from 6.00 to 6.35 mm, meeting the requirements of ISO 17829 for the quality classes A1, A2 and B. A significant correlation between the length and diameter of the pellets was not detected, probably because both the length and diameter of the pellets is influenced highly by the pelletizing machine type, the configuration used during densification process, the pressure, the size of the specific die holes, the speed of the pelletizer, etc. [
32]. Of course, the EMC and, generally, the hygroscopic properties of wood materials used as feedstock influence the “relaxed” density of pellets and, therefore, could constitute additional factors that may affect the diameter of pellets.
3.7. Colour
The
L* colour coordinate describes the pellets’ lightness and ranges between 100, which represents a perfect reflecting diffuser, and 0, which represents black;
a* and
b* describe the chromatic coordinates on the green–red and blue–yellow axes, respectively, without specific numerical limits [
33,
34].
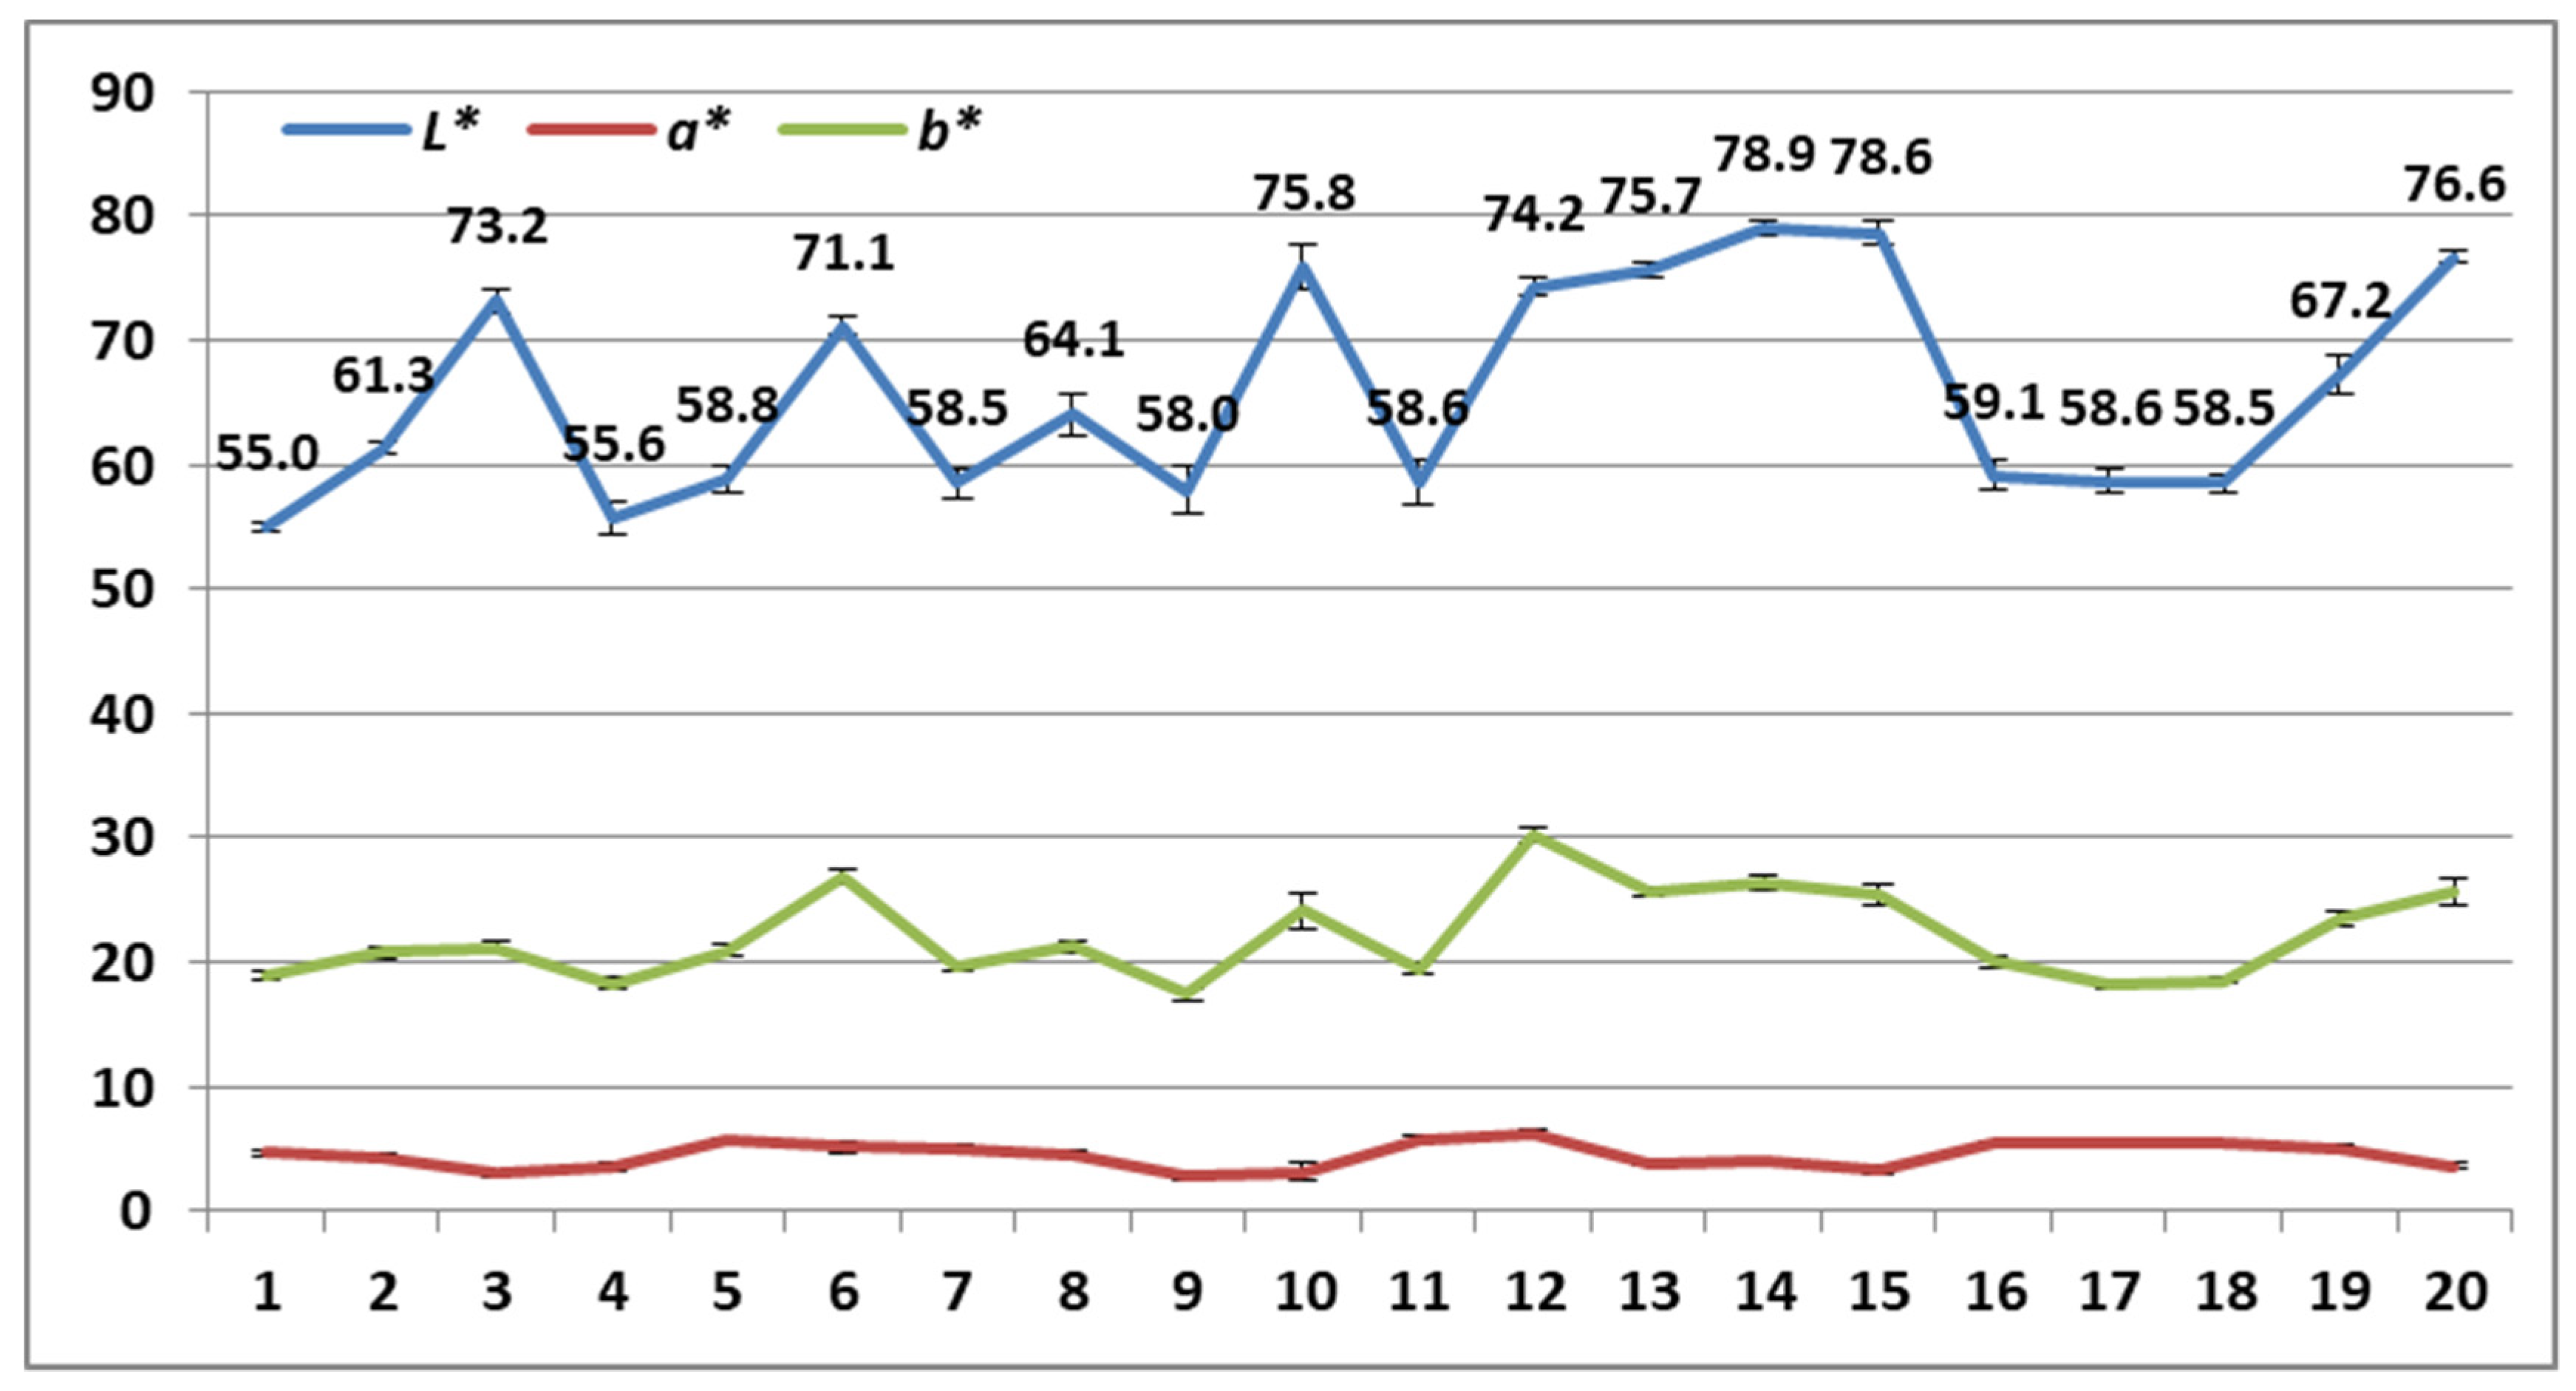
L* can be considered the most significant and representative among the three chromatic coordinates, since it presents the highest differences between the different pellet brands, and lightness constitutes a characteristic that can be easily estimated by consumers with the naked eye. Therefore, in this study,
L* was determined to be the colour coordinate that would be correlated to the other properties of the pellets.
L* ranged between 55 and 78.9 and presented with similar progress to that of the chromatic coordinate
b*. The lowest value of
L* was recorded by pellet brand 1, while the highest
L* was presented by pellet brand 14 (
Figure 14). The ash content was found to be highly correlated (sig. 0.0049), in a negative way, to lightness
L* by 56.2%, indicating that the darker colour of pellets could correspond to a higher ash content—among plenty of other factors relevant to the pelletisation process (
Table 2). The
L* also revealed a statistically significant (sig. 0.0179) correlation with mechanical durability, influencing its variability by 47.1% in a positive way. In parallel, a slight impact of lightness of 9.8% was detected on the calorific value of pellets, indicating that the pellets’ lightness and calorific value may represent parallel trends. Factors affecting only the surface colour of pellets have not been properly discussed so far. Therefore, the correlation between pellet colour and quality should be more thoroughly studied in the future, in order for it to be thoroughly investigated whether lightness could be utilized as a reliable pellet quality index.
3.8. Surface Roughness
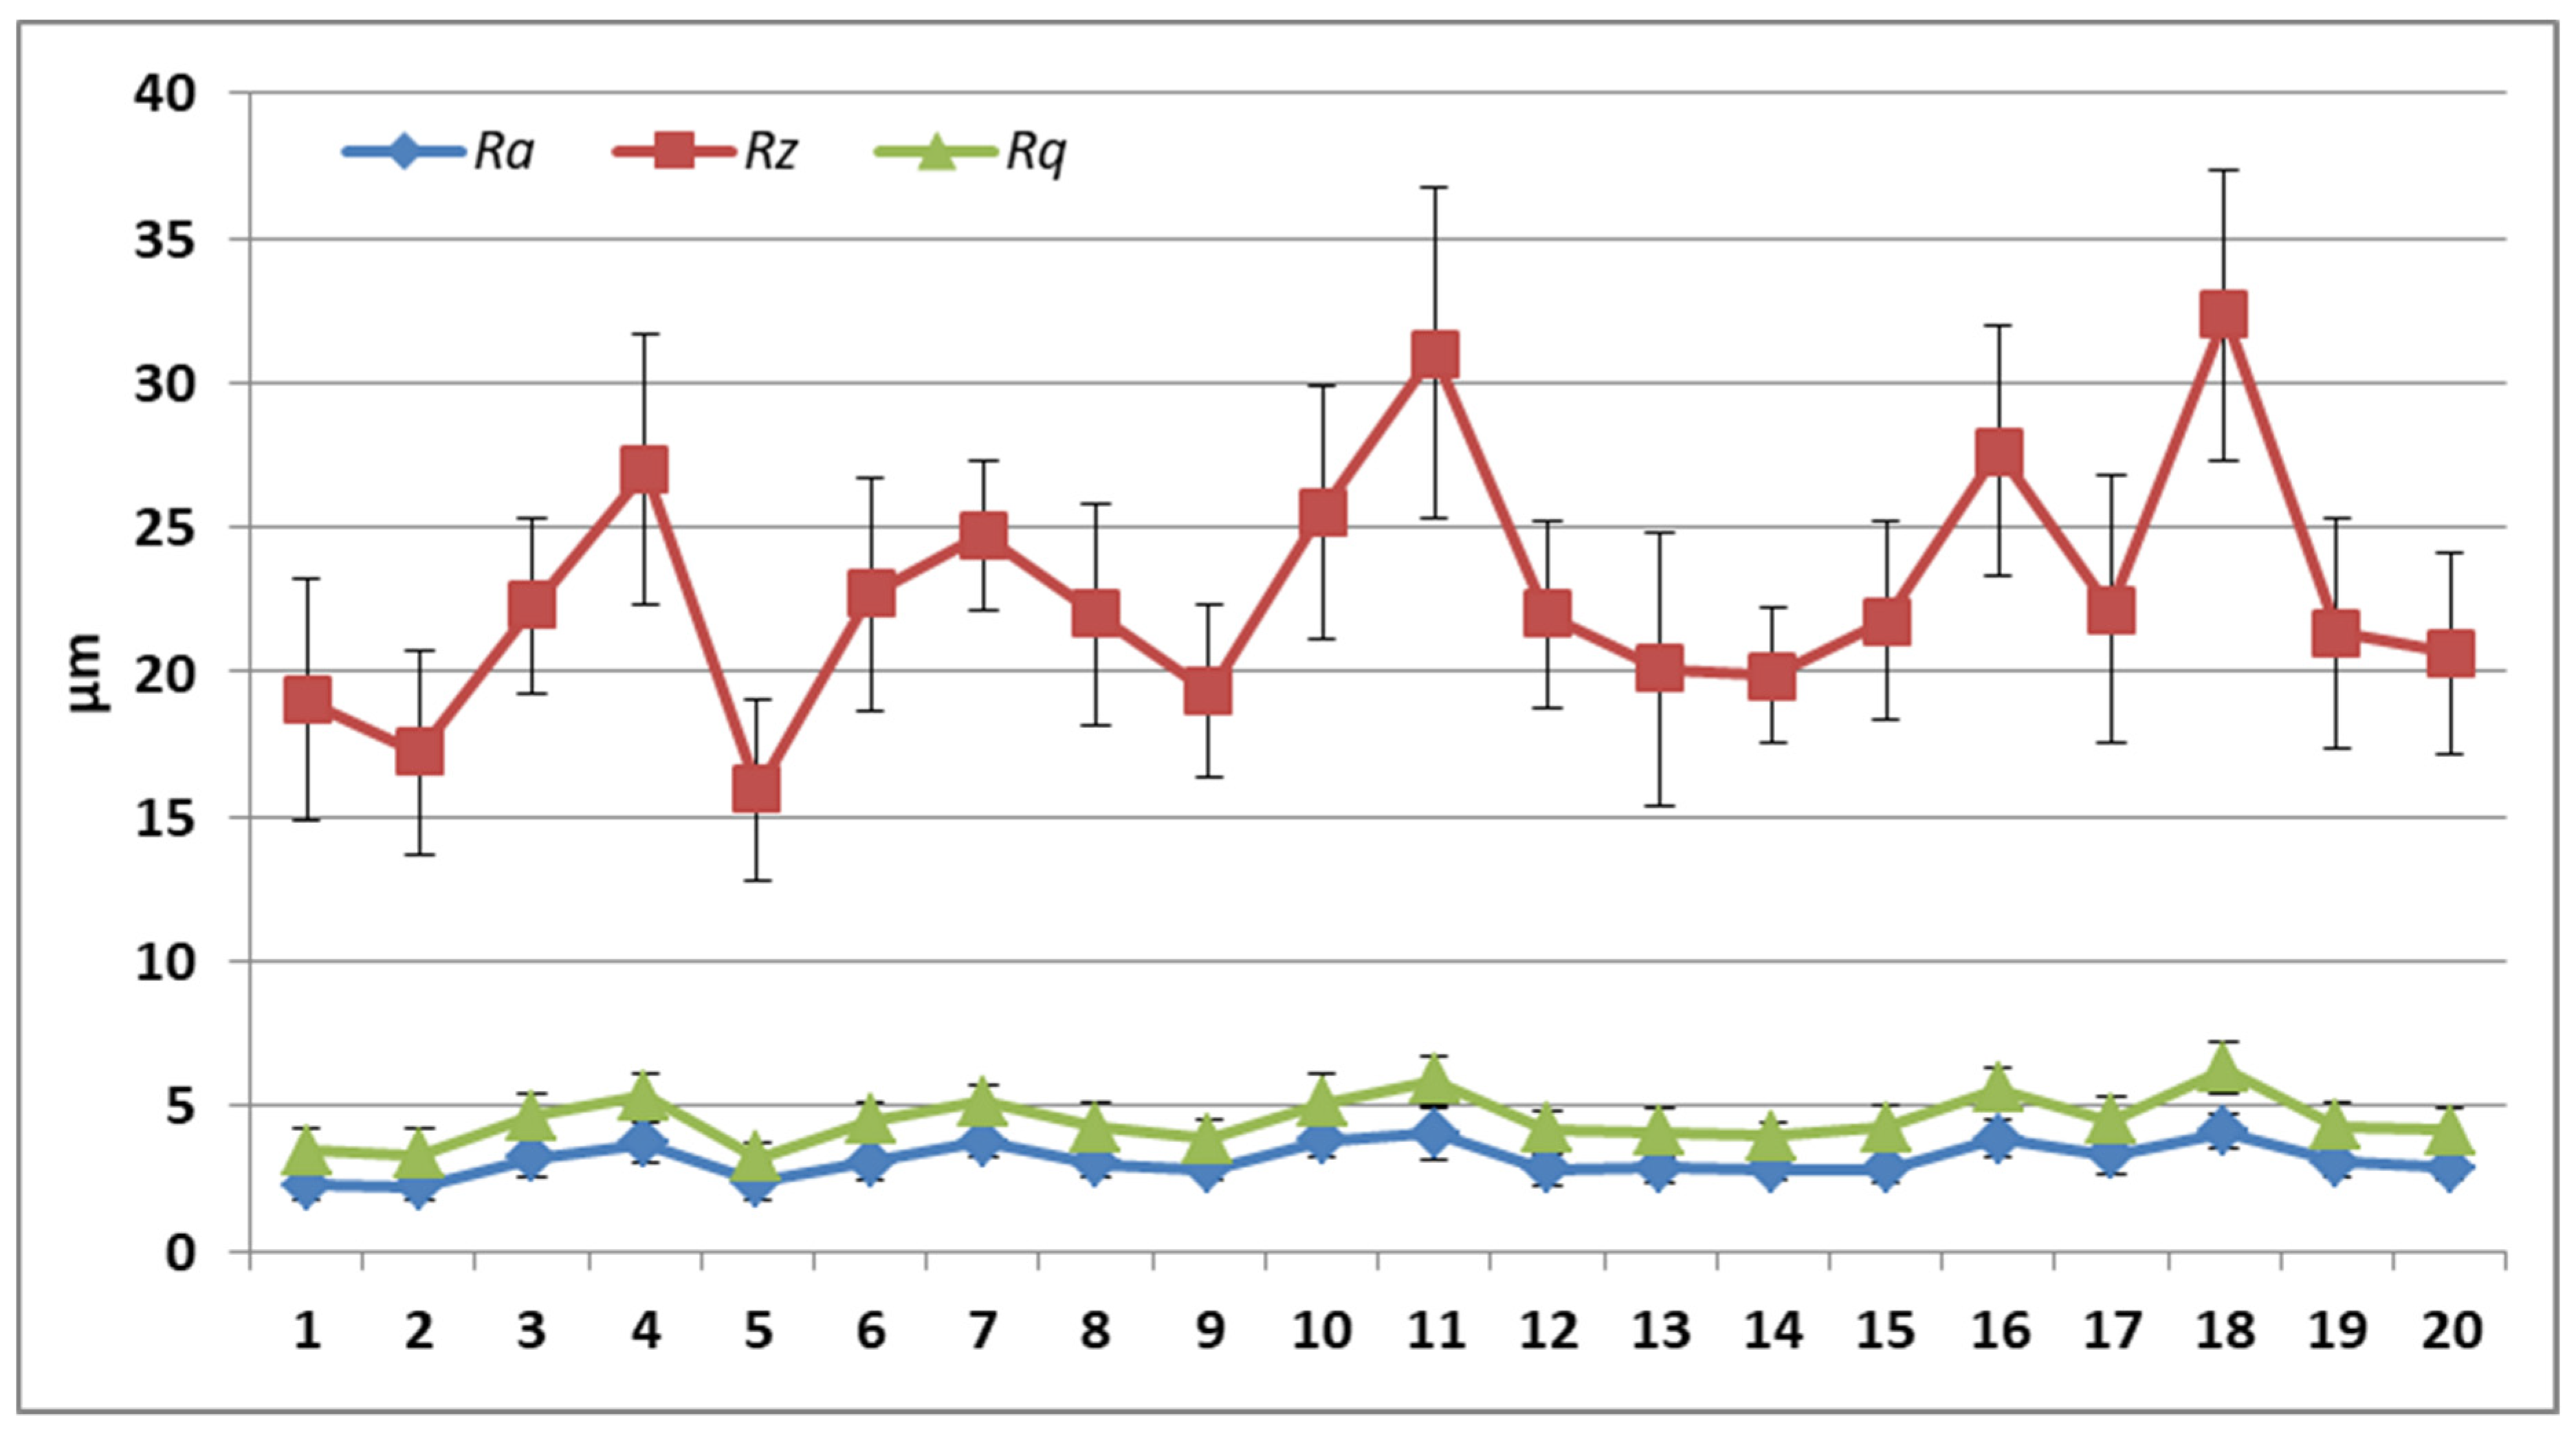
The three surface roughness parameters,
Ra,
Rz and
Rq, measured on the pellets’ surfaces, followed similar patterns to one another. Nevertheless,
Ra, as the mean arithmetic deviation of the profile, is considered to be the most representative factor among the three roughness parameters [
29,
35]; it ranged between 2.22 and 4.13 μm, with pellet brand 2 demonstrating the smoothest pellet surface and pellet brand 18 the roughest, respectively (
Figure 15). As was observed, differences between the surface roughness parameter values of pellet materials obtained from the two different collections were not statistically significant.
According to the statistical analysis, the surface roughness was found to be highly (sig. 0.0274) correlated to the mechanical durability, by 43.6%, with a negative relationship. Therefore, the high roughness of pellet surfaces is definitely accompanied by lower mechanical durability, and probably by a higher ash content and lower calorific value. Therefore, pellet roughness seems to result in the lower performance of pellets as solid biofuels and could serve as an indicator of lower fuel quality in a rapid evaluation process. Further investigation and validation processes are required in this direction.
According to the findings of the current study, the property values of the materials for the same pellet brands obtained over two different collection periods did not present with statistically significant differences, indicating a stability in quality over time. Generally, most of the pellet brands revealed low moisture and ash contents and acceptable calorific values for residential use (quality classes A1, A2 and B)—although the quality of half of the pellet brands was found to be lower than the reported one, as regards mainly the mechanical durability, ash content and bulk density. More specifically, even though all of the examined pellet brands were sold in the market as A1 quality class—except for sample 17, which did not present a quality class—the results of this study revealed a lower quality than that reported for almost half of the pellet brands and classified them into lower quality classes (
Table 3). Specifically, only 10 of the 20 pellet brands examined in this study are properly classified into the best quality class (A1). In the other half of the pellet brands, the quality class assessed after the measurements was measured to be lower than the respective one reported on the packaging. Three brands (1, 16 and 19) are suitable for residential use, but classified into lower quality classes (A2 or B) than the one reported, and seven brands (3, 5, 6, 7, 11, 17 and 18) correspond to materials of much lower quality—appropriate only for industrial applications (class I;
Table 3). The most crucial characteristic responsible for the classification of pellets in different (lower) quality classes was the mechanical durability, while to a lesser extent, the bulk density and ash content also contributed.
Lykidis and Mantanis [
36] observed in 2015 that only 6 out of the 10 studied international pellet brands sold on the Greek market exhibited excellent quality and were classified into class A1, as stated on their packaging labels, while two brands were categorized into class A2, one into class B and one sample was found not to fulfil the requirements of any quality class. In their study, the characteristic that made the quality of the studied wood pellets lag behind was the ash content, while in the current study, the inferior properties were mainly those of mechanical durability and bulk density. Schön et al. [
18] conducted a wood pellet screening including 42 different pellet assortments collected from all over Europe, with a main focus on the German market, and reported that only 8 of the 42 samples did not fulfil the requirements for the standard ISO 17225-2—mainly in terms of S and Cl content, fines and bulk density. The results of the current study agree more with the findings of Duca et al. [
6], who examined 130 pellet brands collected from the market in 2010, and concluded that just over half of the samples fulfilled the best-quality class (A1) requirements. Even though more than a decade has passed from the conduction of the abovementioned report, the reliability of the information reported on the packages of pellets still remains inadequately high; therefore, scepticism may be generated concerning the effectiveness of standards and the certification system.
Of course, the specific established standards of the classification of pellets in terms of different quality criteria are set to be fulfilled as the pellets leave the pellet plant and not after their transportation to a retailer, into storage, etc. (as in the case of the current work research material). Qualitative characteristics such as the ash content or calorific value are not expected to be significantly influenced by transportation or storage conditions and processes, but other characteristics such as the mechanical durability, dimensions of the pellets, bulk density, colour, roughness, etc., could be highly affected by several factors during the transportation and storage processes. Nevertheless, of great significance is the quality of pellets that the customers finally receive and consume. In parallel, according to traders and other pellet market actors, the quality class of such a certified product also reflects the product quality that the customers experience. In any case, there would not be any point in the certification system if the quality that the customers receive highly differed from the initial quality of the pellets in the plant, directly after pellet compaction and conditioning.
This is the reason why several measures, such as a plan for more frequent inspections of pellet quality by accredited and experienced bodies in the production stage, in the stage before leaving the plants and also in sale points (the market), should be applied, in order for both the quality of pellets and the reliability of the information stated on pellet packages to be gradually improved. Additionally, during the import/export of solid biofuels (pellets) at the customs offices of countries, frequent sampling and thorough testing of the most critical pellet quality characteristics should be carried out to ensure the quality of raw materials, certification, compliance to the standard requirements and higher pellet quality.
4. Conclusions
Half of the pellet brands examined in this study were found to be properly classified into the best quality class (A1), while the quality of the other half of the brands was found to be lower than that reported on the packaging. Although three of the brands were found suitable for residential use, they were of lower quality (A2 or B) than reported, and seven brands were found to be of much lower quality, appropriate only for industrial use. The most crucial characteristic responsible for the classification of pellets into lower quality classes was their mechanical durability, and to a less extent, the bulk density and ash content. The properties of the materials of the same pellet brands obtained over two different collection periods did not present with significant differences, indicating the stability of the quality level over time.
It was observed that the calorific value of the pellets decreased when the ash, moisture content and lightness increased. Pellets with low mechanical durability are highly likely to also be characterized by a low calorific value. The higher mechanical durability of pellets is correlated with a higher moisture content (up to 10%) and a lower ash content. The darker colour seems to correspond to a higher ash content and low mechanical durability; therefore, it could be considered to be correlated to lower fuel quality, although this should be further validated in the future. The roughness in pellet surfaces indicates a lower quality in terms of lower mechanical durability, lower calorific value and higher ash content. Therefore, easily verifiable properties of pellets, such as the lightness and surface smoothness, should be further investigated to elucidate their potential contribution as quality indexes in rapid pellet quality evaluations.
Accredited and experienced bodies should implement more frequent inspections of pellets in the stages before and after production in plants and at sale points as well, to ensure the quality of raw materials, certification, compliance to standard requirements and higher pellet quality. Such actions would, undoubtedly, increase the use of pellets and consumer confidence in biofuels.


