Article

Concept for the Use of Cotton Waste Hydrolysates in Fermentation Media for Biofuel Production

by
Michal J. Binczarski
1,
Justyna Z. Malinowska
1,
Joanna Berlowska
2,
Weronika Cieciura-Wloch
2,
Sebastian Borowski
2,
Malgorzata Cieslak
3,
Dorota Puchowicz
3 and
Izabela A. Witonska
1,*
1
Institute of General and Ecological Chemistry, Lodz University of Technology, 116 Zeromskiego Street, 90-924 Lodz, Poland
2
Department of Environmental Biotechnology, Lodz University of Technology, 171/173 Wolczanska Street, 90-924 Lodz, Poland
3
Department of Chemical Textiles Technologies, ŁUKASIEWICZ Research Network-Textile Research Institute, 5/15 Brzezinska Street, 92-103 Lodz, Poland
*
Author to whom correspondence should be addressed.
Energies 2022, 15(8), 2856; https://doi.org/10.3390/en15082856
Submission received: 10 February 2022 / Revised: 6 April 2022 / Accepted: 11 April 2022 / Published: 13 April 2022
(This article belongs to the Topic Sustainable Energy Technology)

Abstract

:
Currently, most cotton textile waste is sent to landfill. However, due to the use of synthetic additives and the chemical treatment of cotton fibers, cotton textile waste is difficult to biodegrade. Cotton textile waste can also be subjected to material recycling, or to incineration/gasification to produce energy. Here, we present the optimization of acid hydrolysis of cotton yarn fibers for glucose efficiency. The cotton yarn hydrolysates showed great potential for replacing simple sugar solutions in fermentation media. The highest glucose concentration was obtained in the hydrolysates of cotton yarn hydrolyzed in a 2% solution of sulfuric acid or phosphoric acid at 140–160 °C for 2 h. After 2 h of hydrolysis at 140 °C with 2% H3PO4, the concentration of glucose in the cotton yarn hydrolysate (13.19 g/L) increased fivefold compared with cotton yarn treated under the same conditions with H2SO4 (2.65 g/L). The structural modifications in the solid residues after acid hydrolysis were analyzed using a scanning electron microscope with energy dispersive spectroscopy (SEM-EDS), attenuated total reflectance Fourier-transform infrared spectroscopy (FTIR-ATR), and Raman spectroscopy. The SEM images, IR spectra, and Raman spectra revealed that the most significant changes in the morphology of the fibers occurred when the process was carried out at high temperatures (≥140 °C). Better growth of the yeast strains Saccharomyces cerevisiae Ethanol Red and Saccharomyces cerevisiae Tokay ŁOCK0204 was observed in the medium containing phosphoric acid hydrolysate. The maximum methane yield of 278 dm3/kgVS and the maximum hydrogen yield of 42 dm/kgVS were reported for cotton yarn waste after pretreatment with H3PO4. This might have been linked to the beneficial effect of phosphorus, which is a key nutrient for anaerobic digestion. The proposed hydrolysis method does not generate fermentation inhibitors.

Graphical Abstract

1. Introduction

Population growth, globalization, urbanization, and economic growth, as well as purchasing habits, are driving the development of industries throughout the world. As more and more material goods are produced, the production of waste is also increasing. By 2050, worldwide municipal solid waste generation is expected to rise by approximately 70% to 3.4 billion metric tons [1]. One of the largest and most rapidly developing industries is the textile industry. The development of the textile industry also has a negative impact on the environment, first, because textile production requires large quantities of water, energy, and chemicals, and second, because of the sewage and textile waste produced. Global production of textile materials in 2019 was estimated at approximately 100 Mt [2]. Estimated textile production in 2025 will be approximately 121 Mt [3]. In 2019, the global textile market increased to USD 1.053 trillion [4]. The global demand for textiles (clothes, decorative and utility fabrics, specialty fabrics, etc.) [5,6] is growing, and that trend looks set to continue.
Textile wastes can be divided into two main groups: pre-consumer (post-production) textile wastes, which are wastes generated during the textile production processes, and post-consumer textile waste, which is generated during use and disposal by consumers [7,8]. Post-consumer wastes cause problems related to their disposal. Currently, 63% of textiles are made from petrochemical raw materials that cannot be processed by microorganisms [9]. The other 37% are made from natural fibers (cotton, wool, linen, etc.). Large amounts of chemical substances are used to impart functional properties to natural fibers, such as water repellence, fire resistance, and protection from UV radiation. Antibacterial agents, fungicides, insecticides, and permanent pressing resins are also used [10,11,12,13]. Due to the use of synthetic additives and the chemical treatment of natural fibers, textile waste is difficult to biodegrade. Textiles, therefore, constitute a significant group of wastes. Currently, most textile waste is either sent to landfill [14,15] or incinerated [7,16,17]. New solutions to the problem of processing and disposing of textile waste are, therefore, being sought.
The main raw material used in all-natural fibers is cotton [18,19]. The annual world production of cotton in the 2018/2019 season amounted to approximately 25 million metric tons. The largest producers were India, the USA, and China [20]. In the UK, cotton accounts for 54.7% of total post-consumer clothing [21]. As a natural and biodegradable material, cotton may seem ecological; but its cultivation requires large areas of land and processing into textiles demands large amounts of water, chemicals, and energy. Therefore, there is great interest in the sustainable management of cotton waste [21,22,23,24,25]. Waste garments are mainly collected, sorted depending on the color/fabric type, and converted into regenerated/reclaimed fibers, which can be used in various yarns [26,27]. However, the amount of recycled fiber used for spinning is not more than 30% [28].
After it has been reused or recycled into new products, cotton finally becomes unsuitable for further textile processes. Such unusable waste includes cotton dust, post-production yarn waste, woven and knitted fabrics, scraps after processing used clothes into new clothing, and other products. In accordance with the principles of the circular economy (3R—reuse, reduce, recycle), cotton waste should be exploited as much as possible, not only by the textile industry. Various methods based on the destruction of the physical or chemical structure of cotton waste have been investigated [29,30].
Cotton is a natural polymer containing mainly cellulose (88.0–96.5%). Other components include pectins, proteins, waxes, fats, and minerals [31,32,33]. Cellulose is a linear polymer composed of glucopyranose residues linked by 1,4-β-glycosidic bonds. The heterocyclic rings found in cellulose contain one primary hydroxyl group (–CH2OH) and two secondary hydroxyl groups (–OH) [34,35].
The chemical properties of cotton are determined by the properties of its basic component, namely, cellulose. Cellulose is involved in addition and decomposition, with a decrease in the degree of polymerization (various types of hydrolysis) and substitution or oxidation (etherification, esterification). The most important reactions of cellulose fibers are oxidative degradation, thermal and radiation modification, hydrolysis, substitution, addition, cross-linking, dyeing, and interphase polycondensation [31]. Cotton hydrolysis is the process of breaking the β-1,4-glycosidic bonds in cellulose and reducing its degree of polymerization [36]. There are several methods that can be used for cotton fiber hydrolysis: acid hydrolysis, alkaline hydrolysis, enzymatic hydrolysis, and thermal hydrolysis. Hydrolysis is influenced by various factors, such as the type of solvent, the heating source, and the duration of the process. The hydrolysis process transforms cotton into glucose and solid fiber residues. The glucose can be used for various purposes, including bioethanol production [35,37,38,39,40].
An alternative method of processing textile waste containing cotton fibers is thermally assisted acid hydrolysis. After appropriate supplementation, the hydrolysates can be used as fermentation substrates for bioenergy production (biogas, bioethanol) or other bioproducts, such as lactic acid and gluconic acid. This study investigated the influence of temperature, type of acid, and acid concentration on the hydrolysis of cotton waste. The hydrolysates after supplementation were used as fermentation media in dark fermentation processes and for ethanol fermentation.

2. Materials and Methods
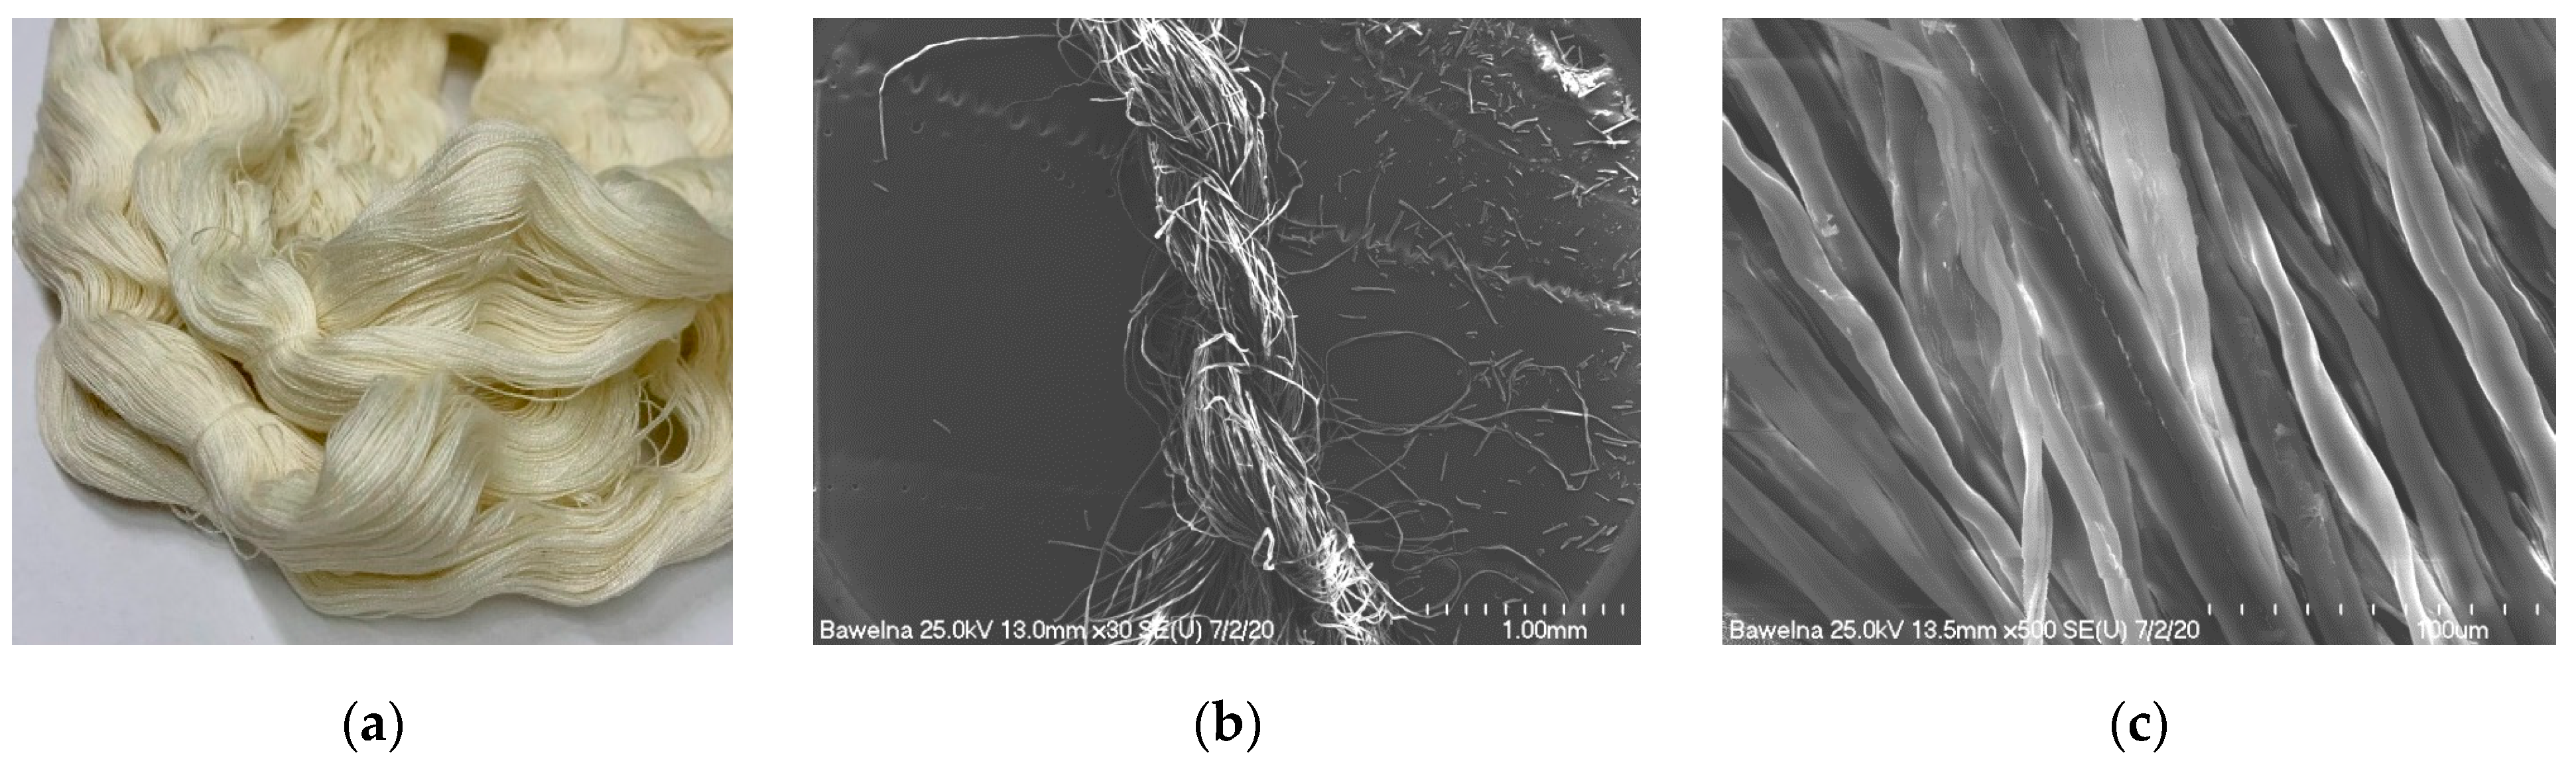
2.1. Materials

Cotton yarn Z689 × 2 S 542 with a linear density of 58.73 ± 0.641 tex, fiber length 15–32 mm, specific strength 18.44 ± 1.089 cN/tex, breaking strength 1083 ± 64 cN, and relative elongation at break 5.8 ± 0.3% was first cut in an MRC RJM30D ball mill. Cotton yarn is a post-production waste. It was washed at 60 °C and rinsed three times to remove spinning preparations. Images of the cotton yarn at various magnifications are presented in Figure 1.

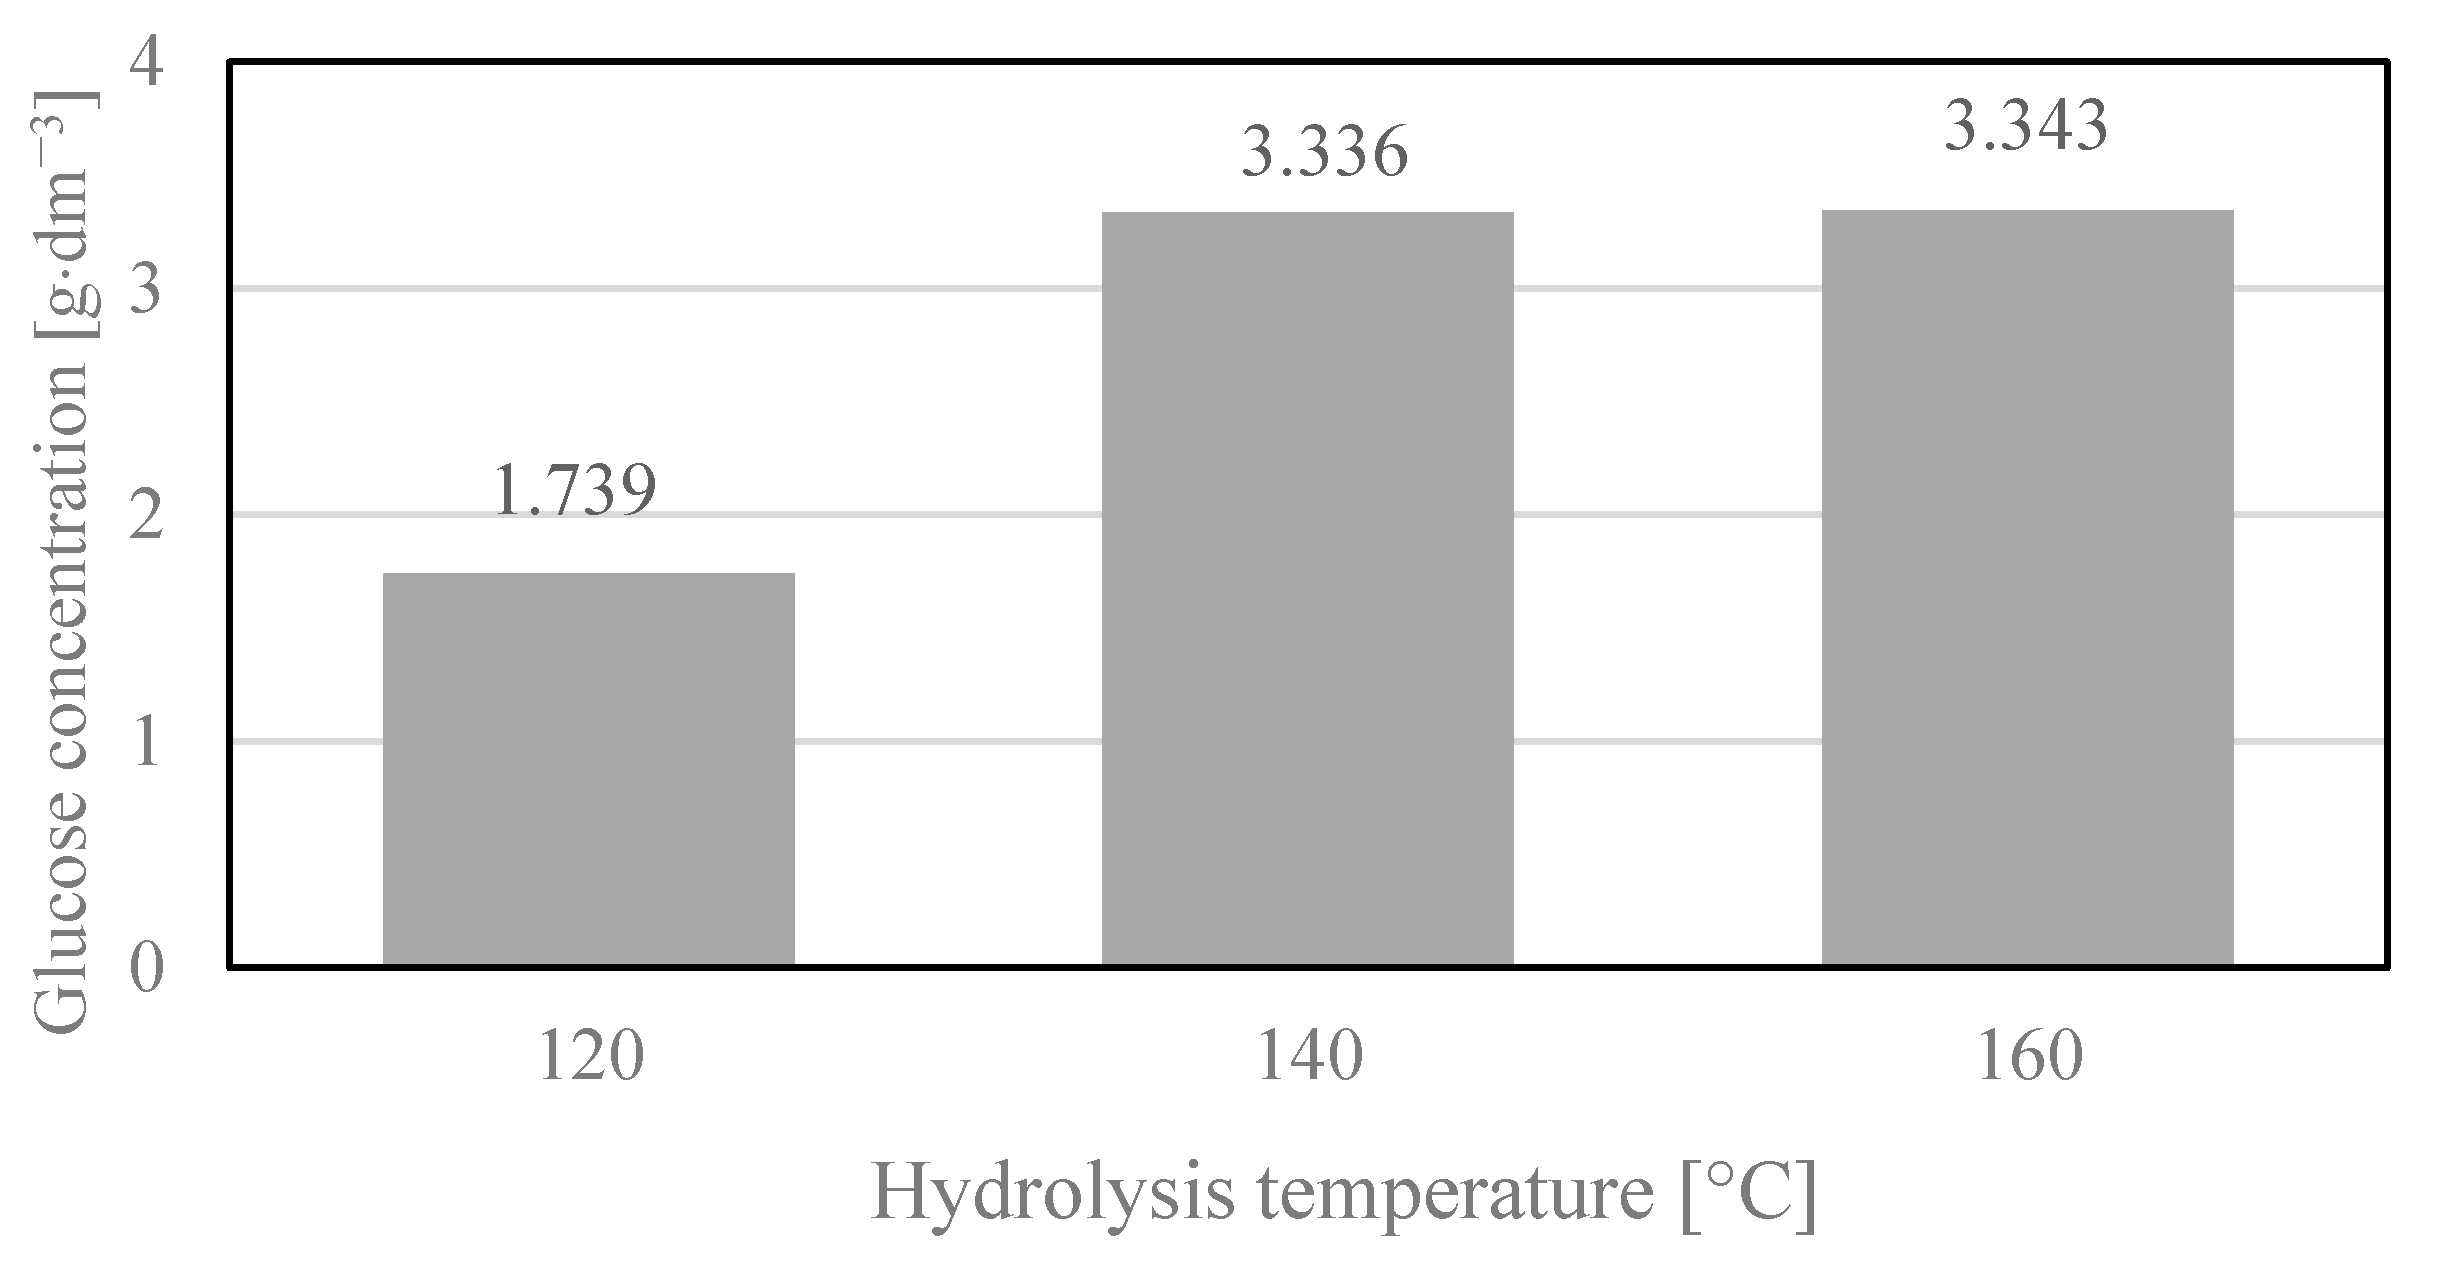
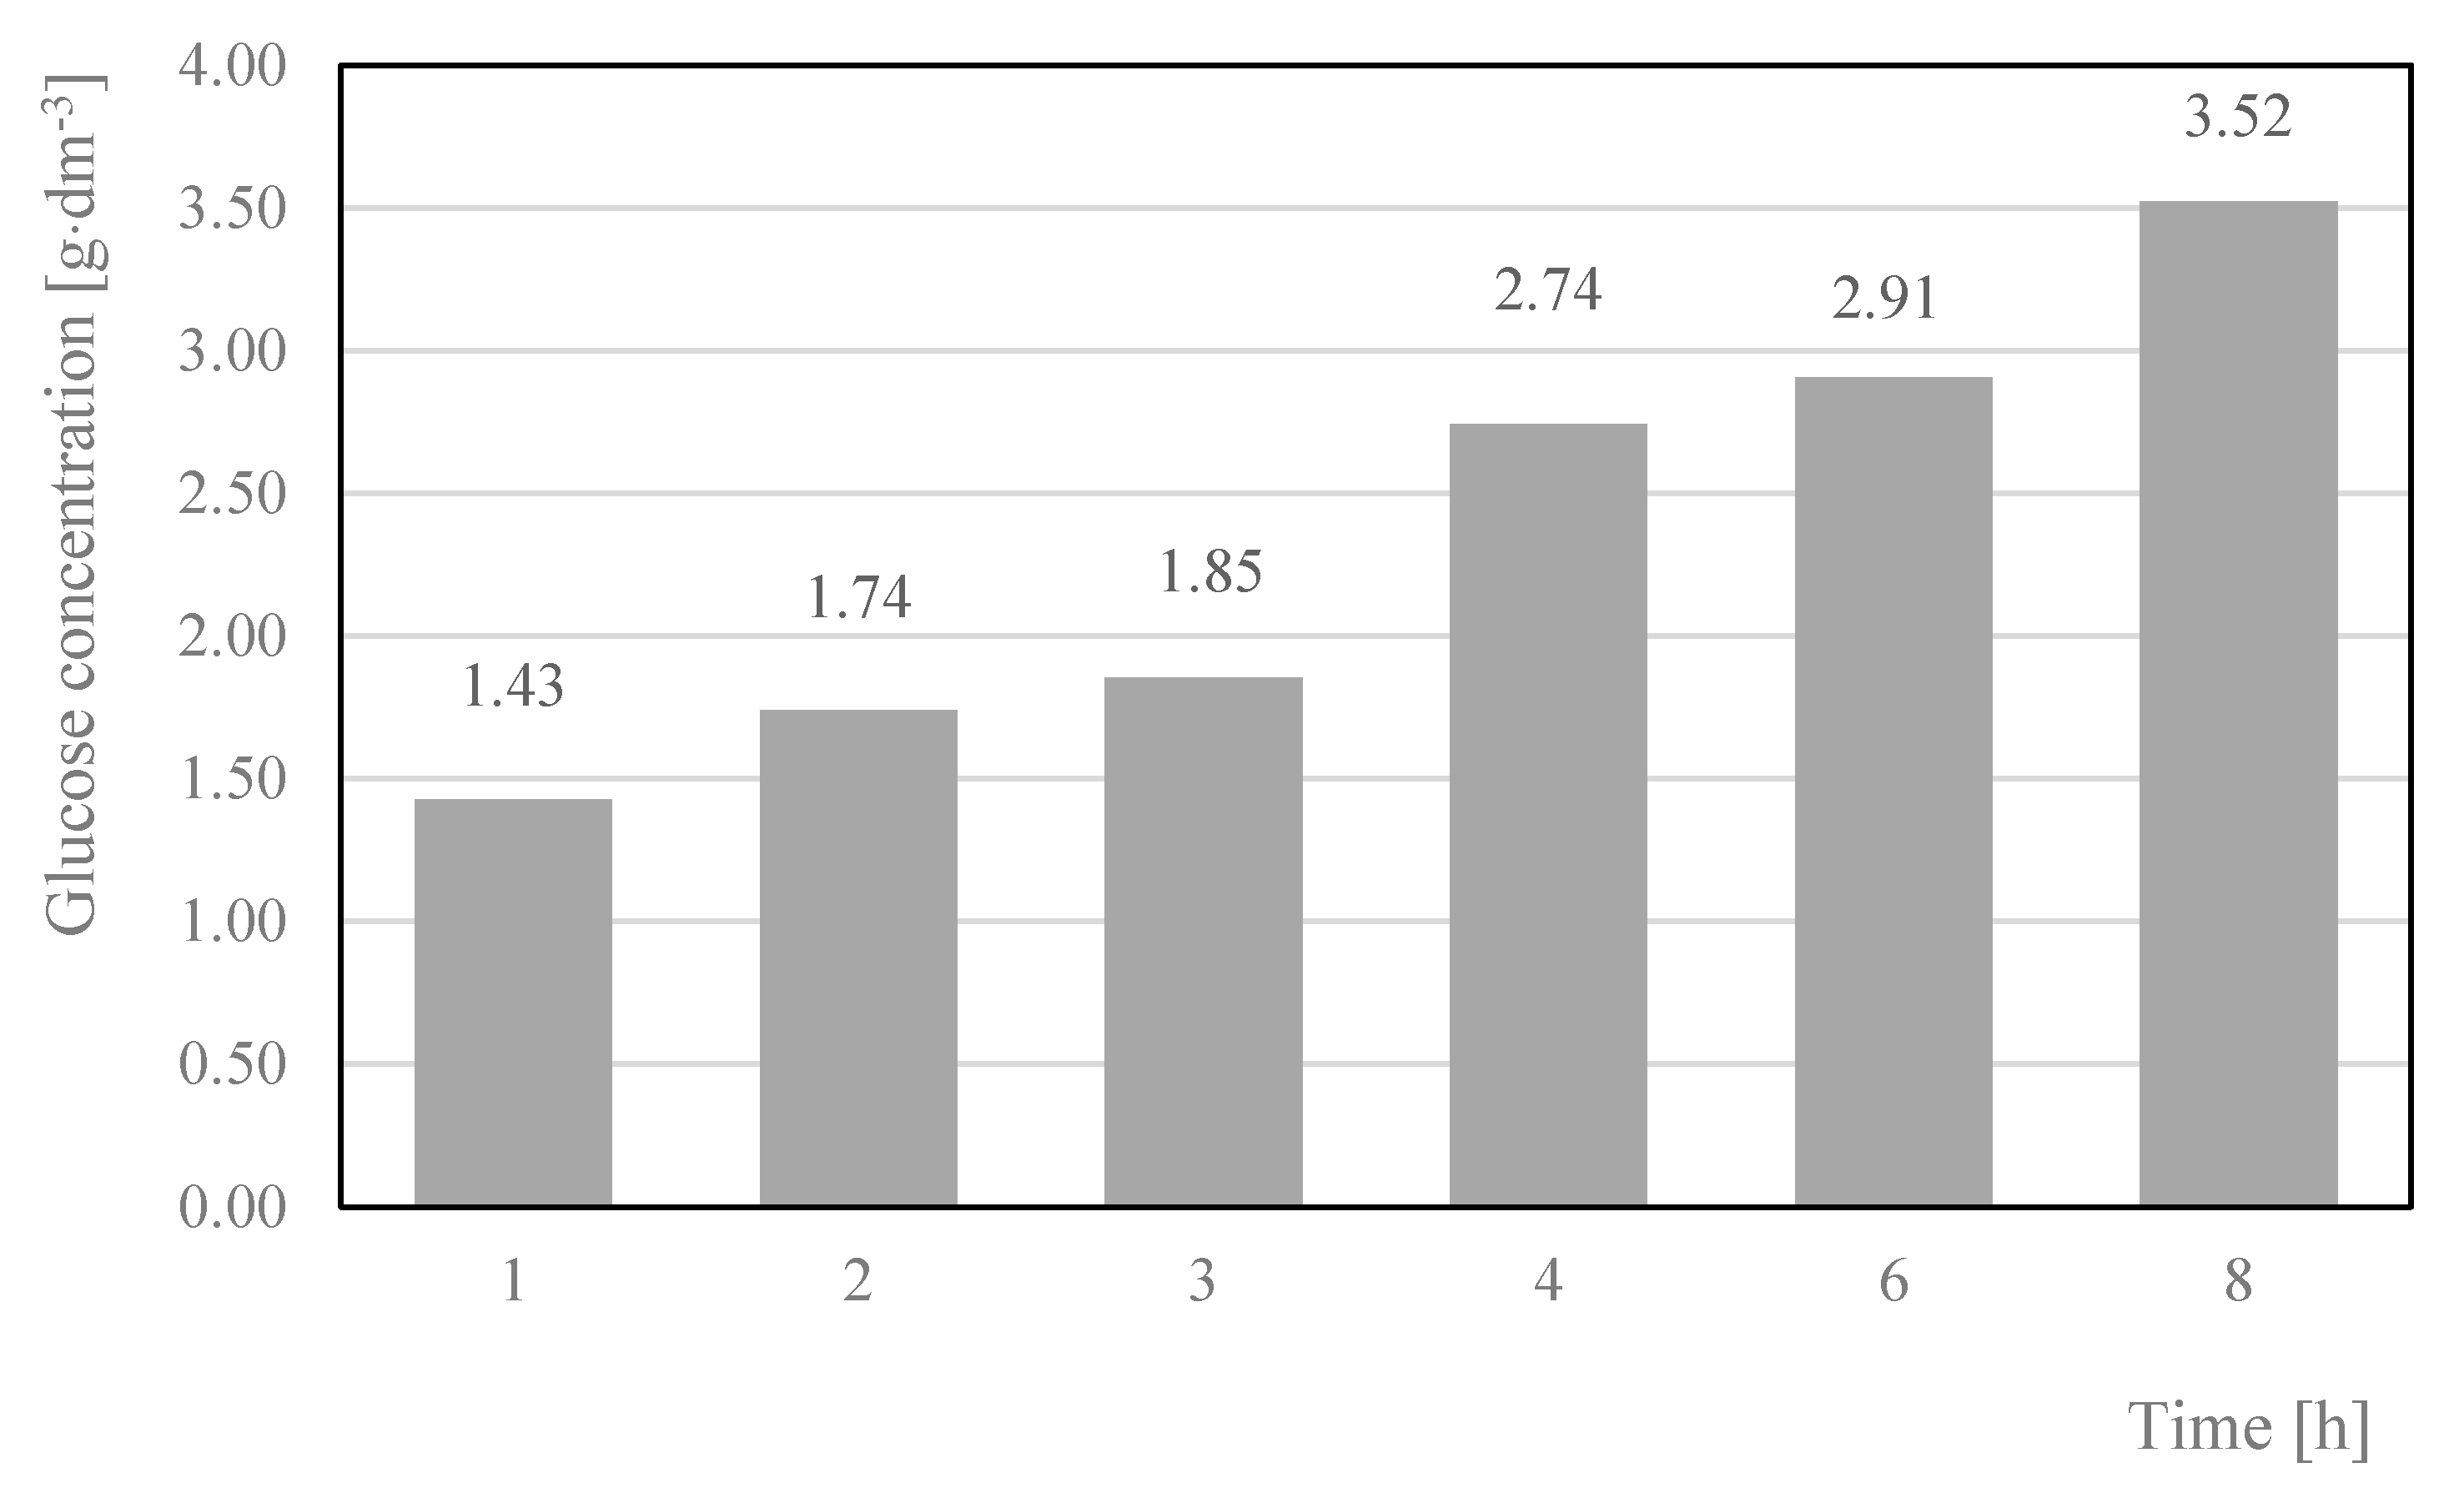
2.2. Acid Hydrolysis of Cotton
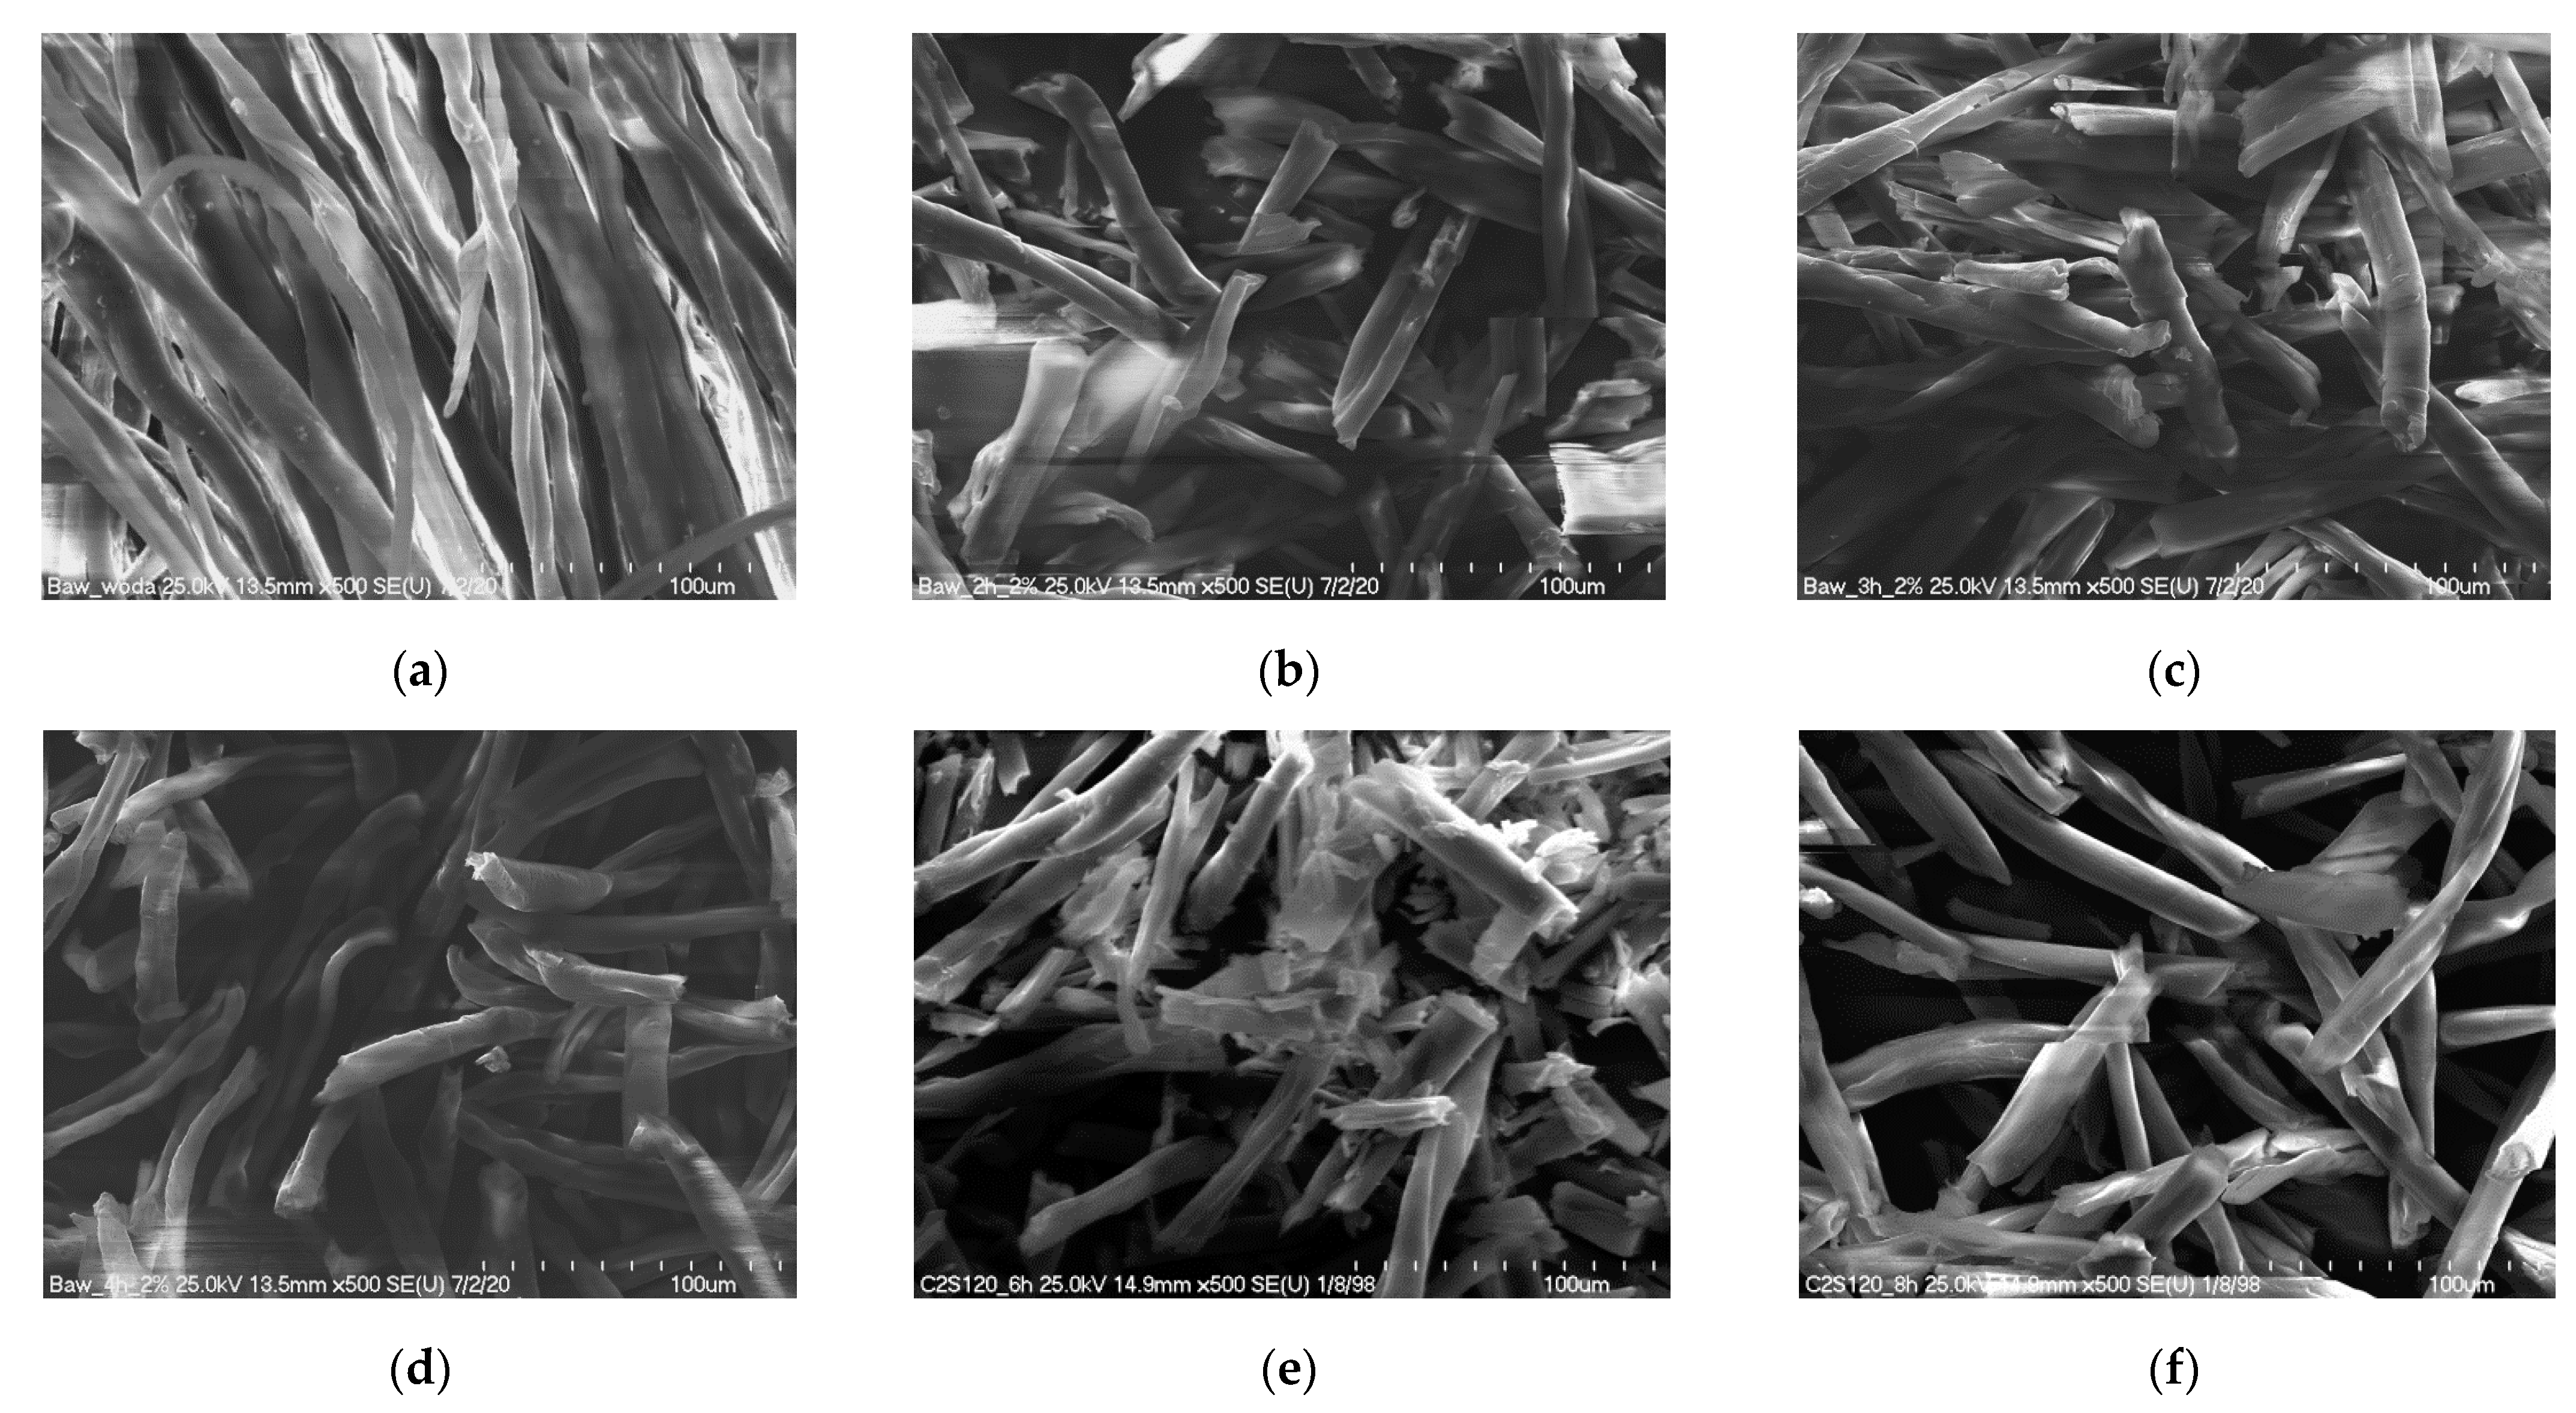
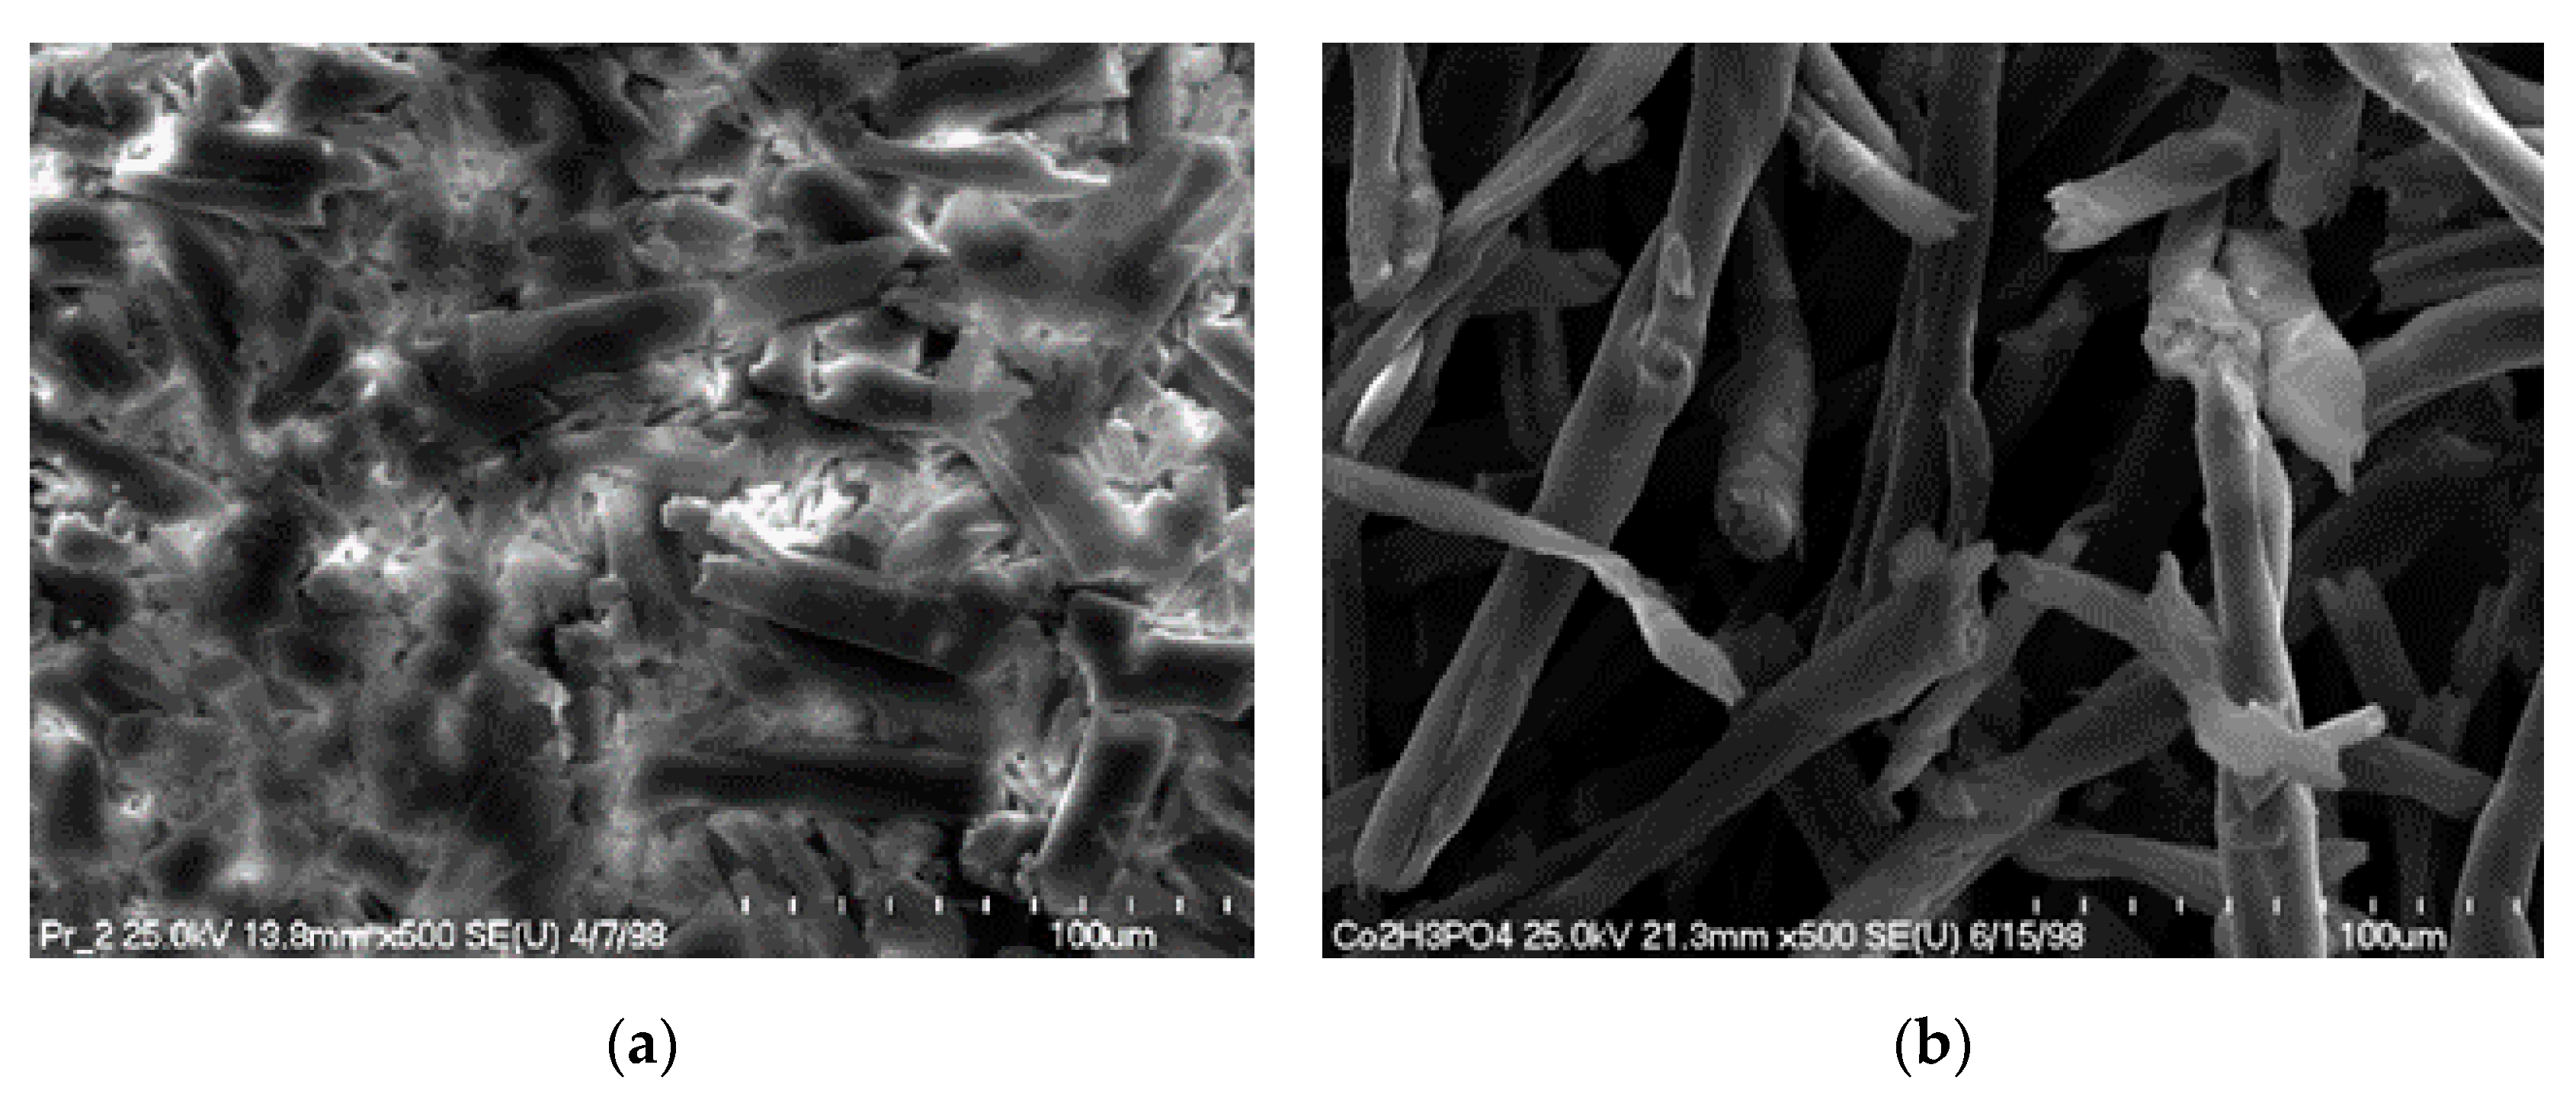
Aqueous glucose solutions were obtained from the cotton yarn via thermally assisted acid hydrolysis. Cotton yarn hydrolysis was performed in pressure reactors with volumes of 50 cm3 (Parr Instrument Company 4552 Series Mini Reactor, Moline, IL, USA), 1 L (Parr Instrument Company 4577 Series Reactor, Moline, IL, USA), and 7.99 L (Parr Instrument Company, 4551 Moveable Cart Stand Reactor with 4848 Controller, Moline, IL, USA). The hydrolysis reactions were carried out at 80–200 °C for 1–8 h in a 50 cm3 reactor, using 1 g of comminuted cotton yarn and 20 cm3 of an aqueous solution of sulfuric acid (H2SO4, 95%, Stanlab, Lublin, Poland) at concentrations of 0.5–10%. To scale up the reaction, reactors with a volume of 1 L and 7.99 L were used. The reactions were carried out under optimized conditions (140 °C for 2 h, 2% sulfuric acid/phosphoric acid (H3PO4, 85%, Stanlab, Lublin, Poland)), using 20 g or 150 g of crushed cotton yarn and 600 cm3 or 4500 cm3 of aqueous acid solution. The reaction mixtures were cooled in the reactor to room temperature, neutralized via the addition of NH4OH (25% NH4OH, POCh, Gliwice, Poland) to pH 7–7.5, and filtered to remove solid yarn residues on a funnel with a sintered disc lined with a quality hard filter (Filtrak, Ahlstrom-Munksjö Group, Helsinki, Finland). The glucose concentration in the hydrolysates were determined using high-performance liquid chromatography (HPLC, Sykam GmbH, Eresing, Germany, with an S1125 pump system, S 5300 autosampler, S 4115 column thermostat, and RI S 3585 detector). The sugars were separated on a SETREX IEX-H+ column (300 × 8.0 mm ID) at 80 °C using 0.008 mol·dm−3 H2SO4 + 2% v/v ACN (flow 0.8 cm3·min−1) as the mobile phase. Quantitative analysis of glucose was performed on the basis of a calibration curve plotted for the concentration range of 0–10 g·dm−3 (the curve in the analyzed range was linear y = 0.19733 x, R2 = 0.9998803).

2.3. SEM-EDS

A scanning electron microscope (SEM S-4700, Hitachi, Tokyo, Japan) equipped with energy dispersive spectroscopy (EDS) capability (Thermo-Noran Inc., Madison, WI, USA) was used for SEM analysis of the hydrolysates. Samples were embedded in conductive carbon pads and the excess loose powder was removed. To reduce electric charging, the samples were sputter-coated with carbon (Cressington 208 HR system). Images were acquired in back-scattered electron (BSE) mode. An accelerating voltage of 25 kV was used. For the purposes of comparison, the same samples were analyzed using an FEI Quanta 650 SEM (FEI Company, Hillsboro, OR, USA) equipped with a Bruker Energy Dispersive Spectroscopy (EDS) system (Bruker Corporation, Billerica, MA, USA). A 15 kV accelerating voltage was used with a 3.5 µA electron beam current and a 10 mm working distance. The compositions of each sample were measured at least three times at different locations that were approximately 0.25 mm2 in size.

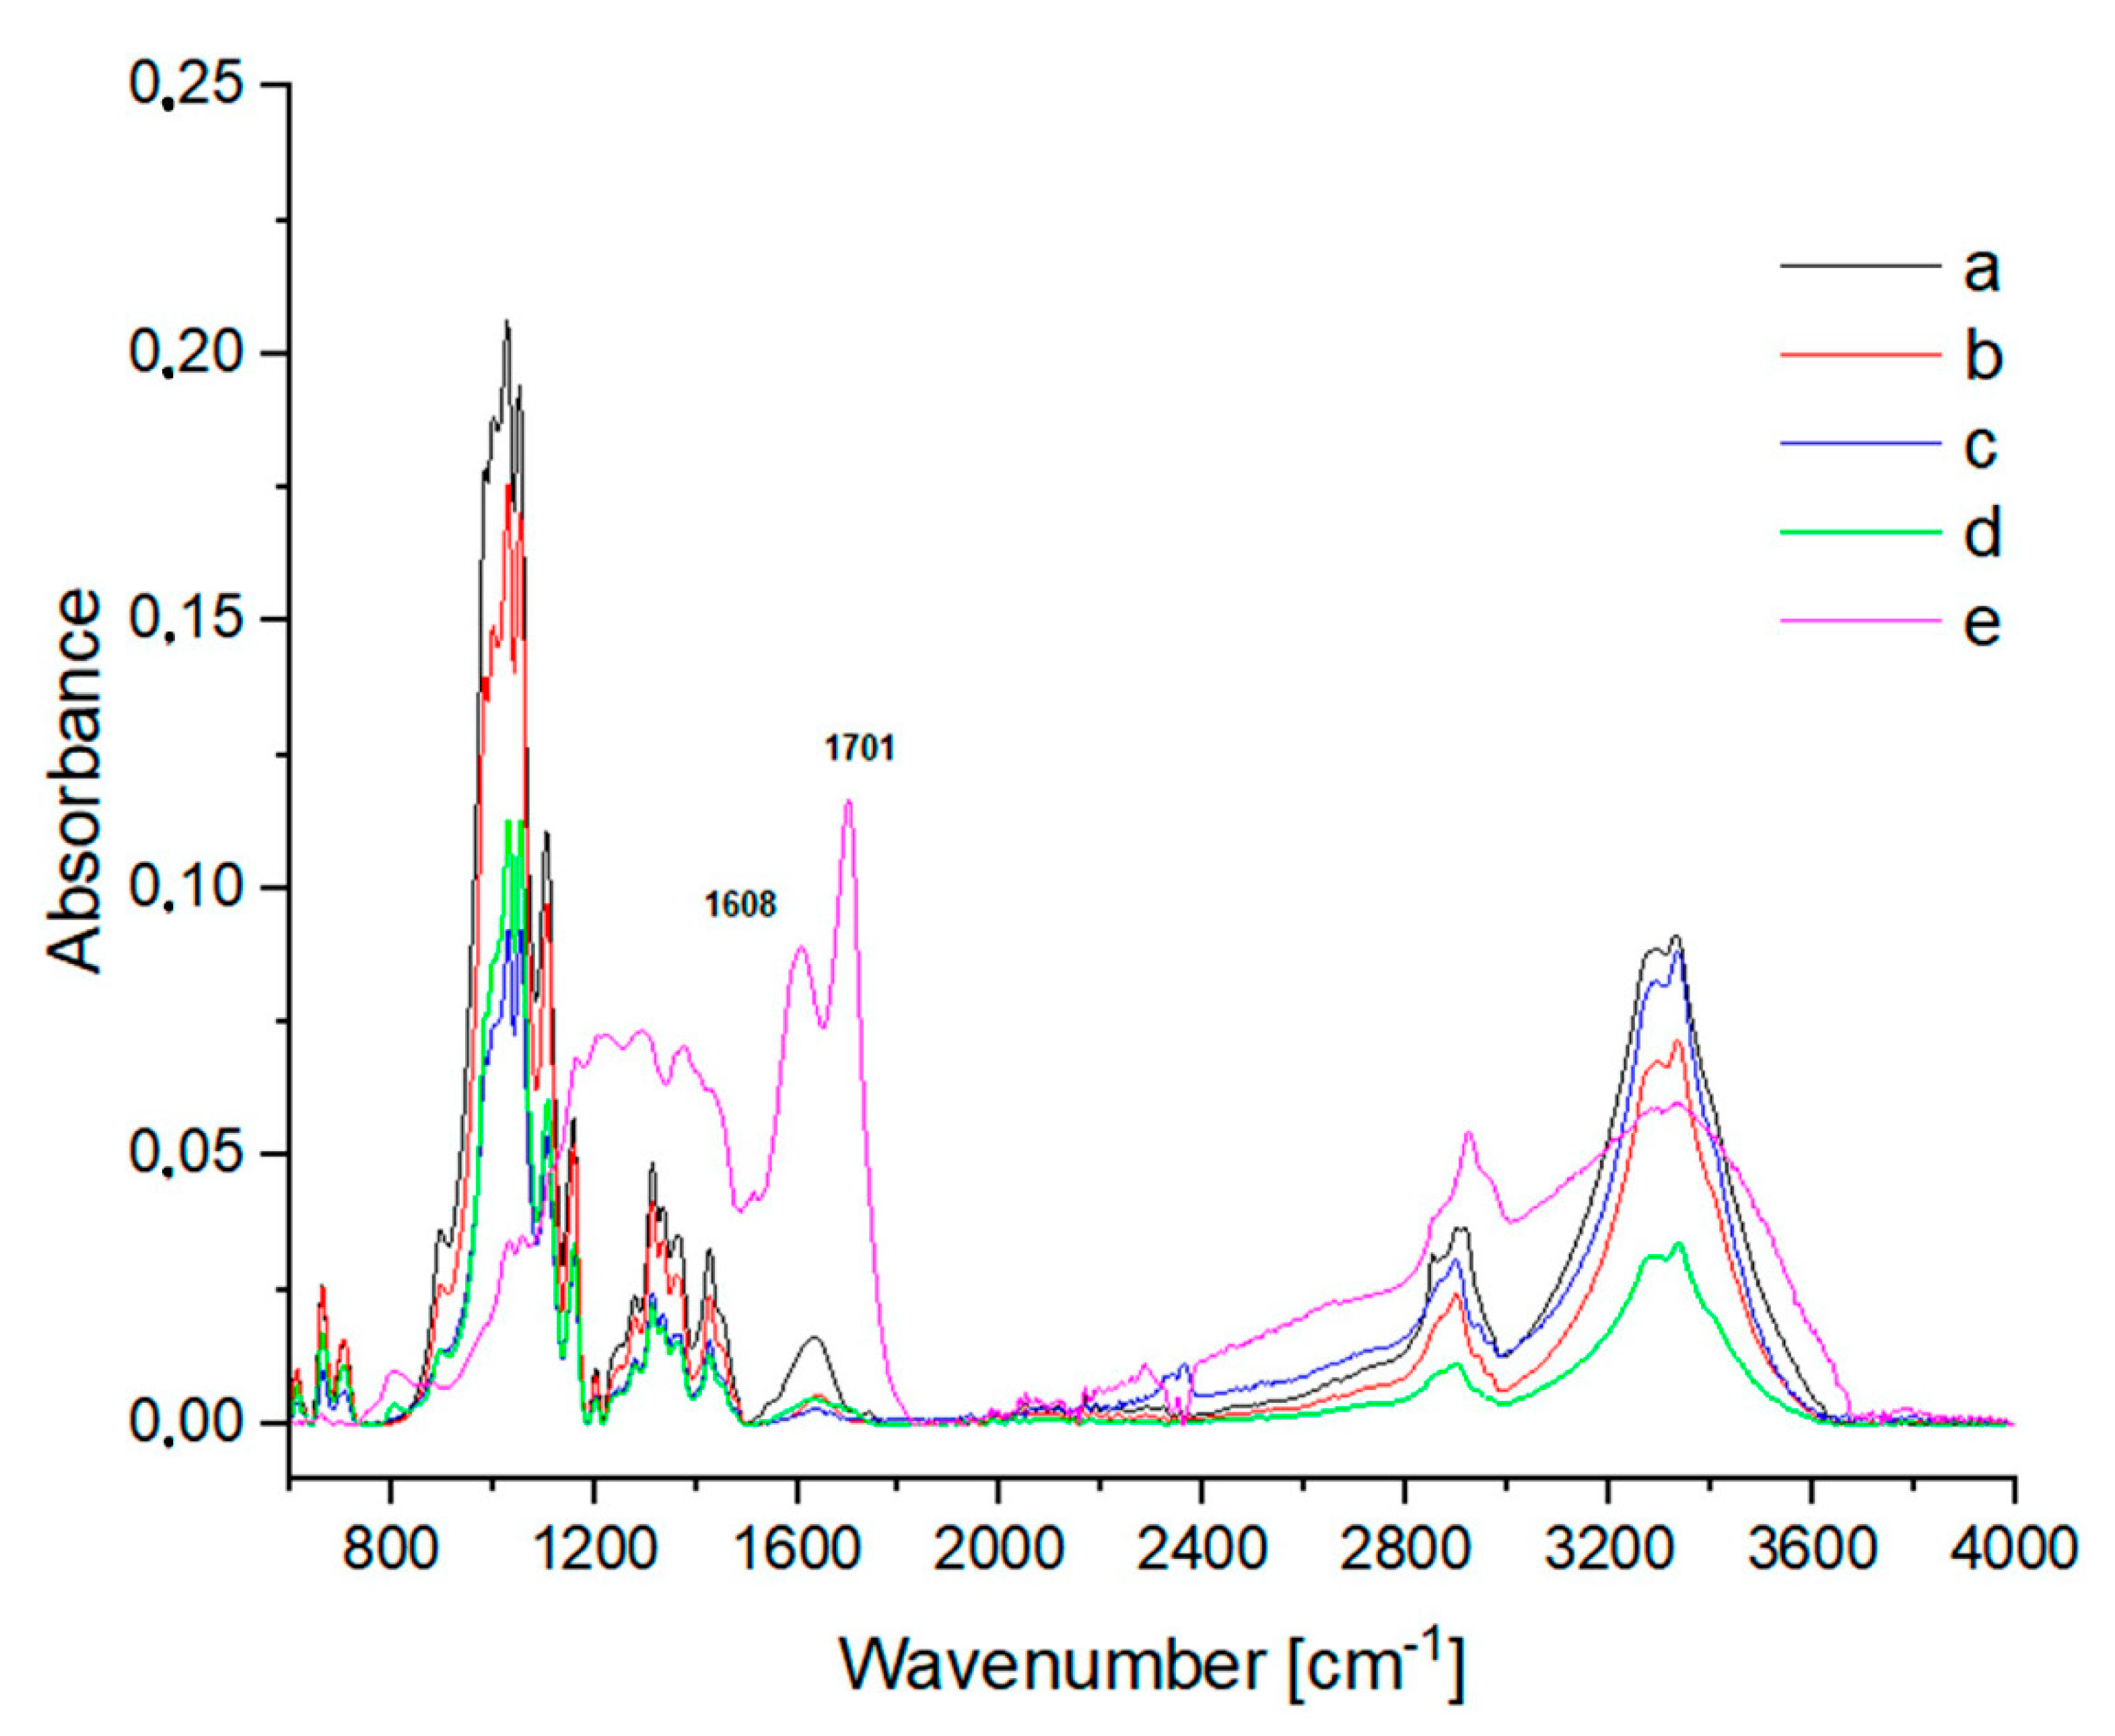
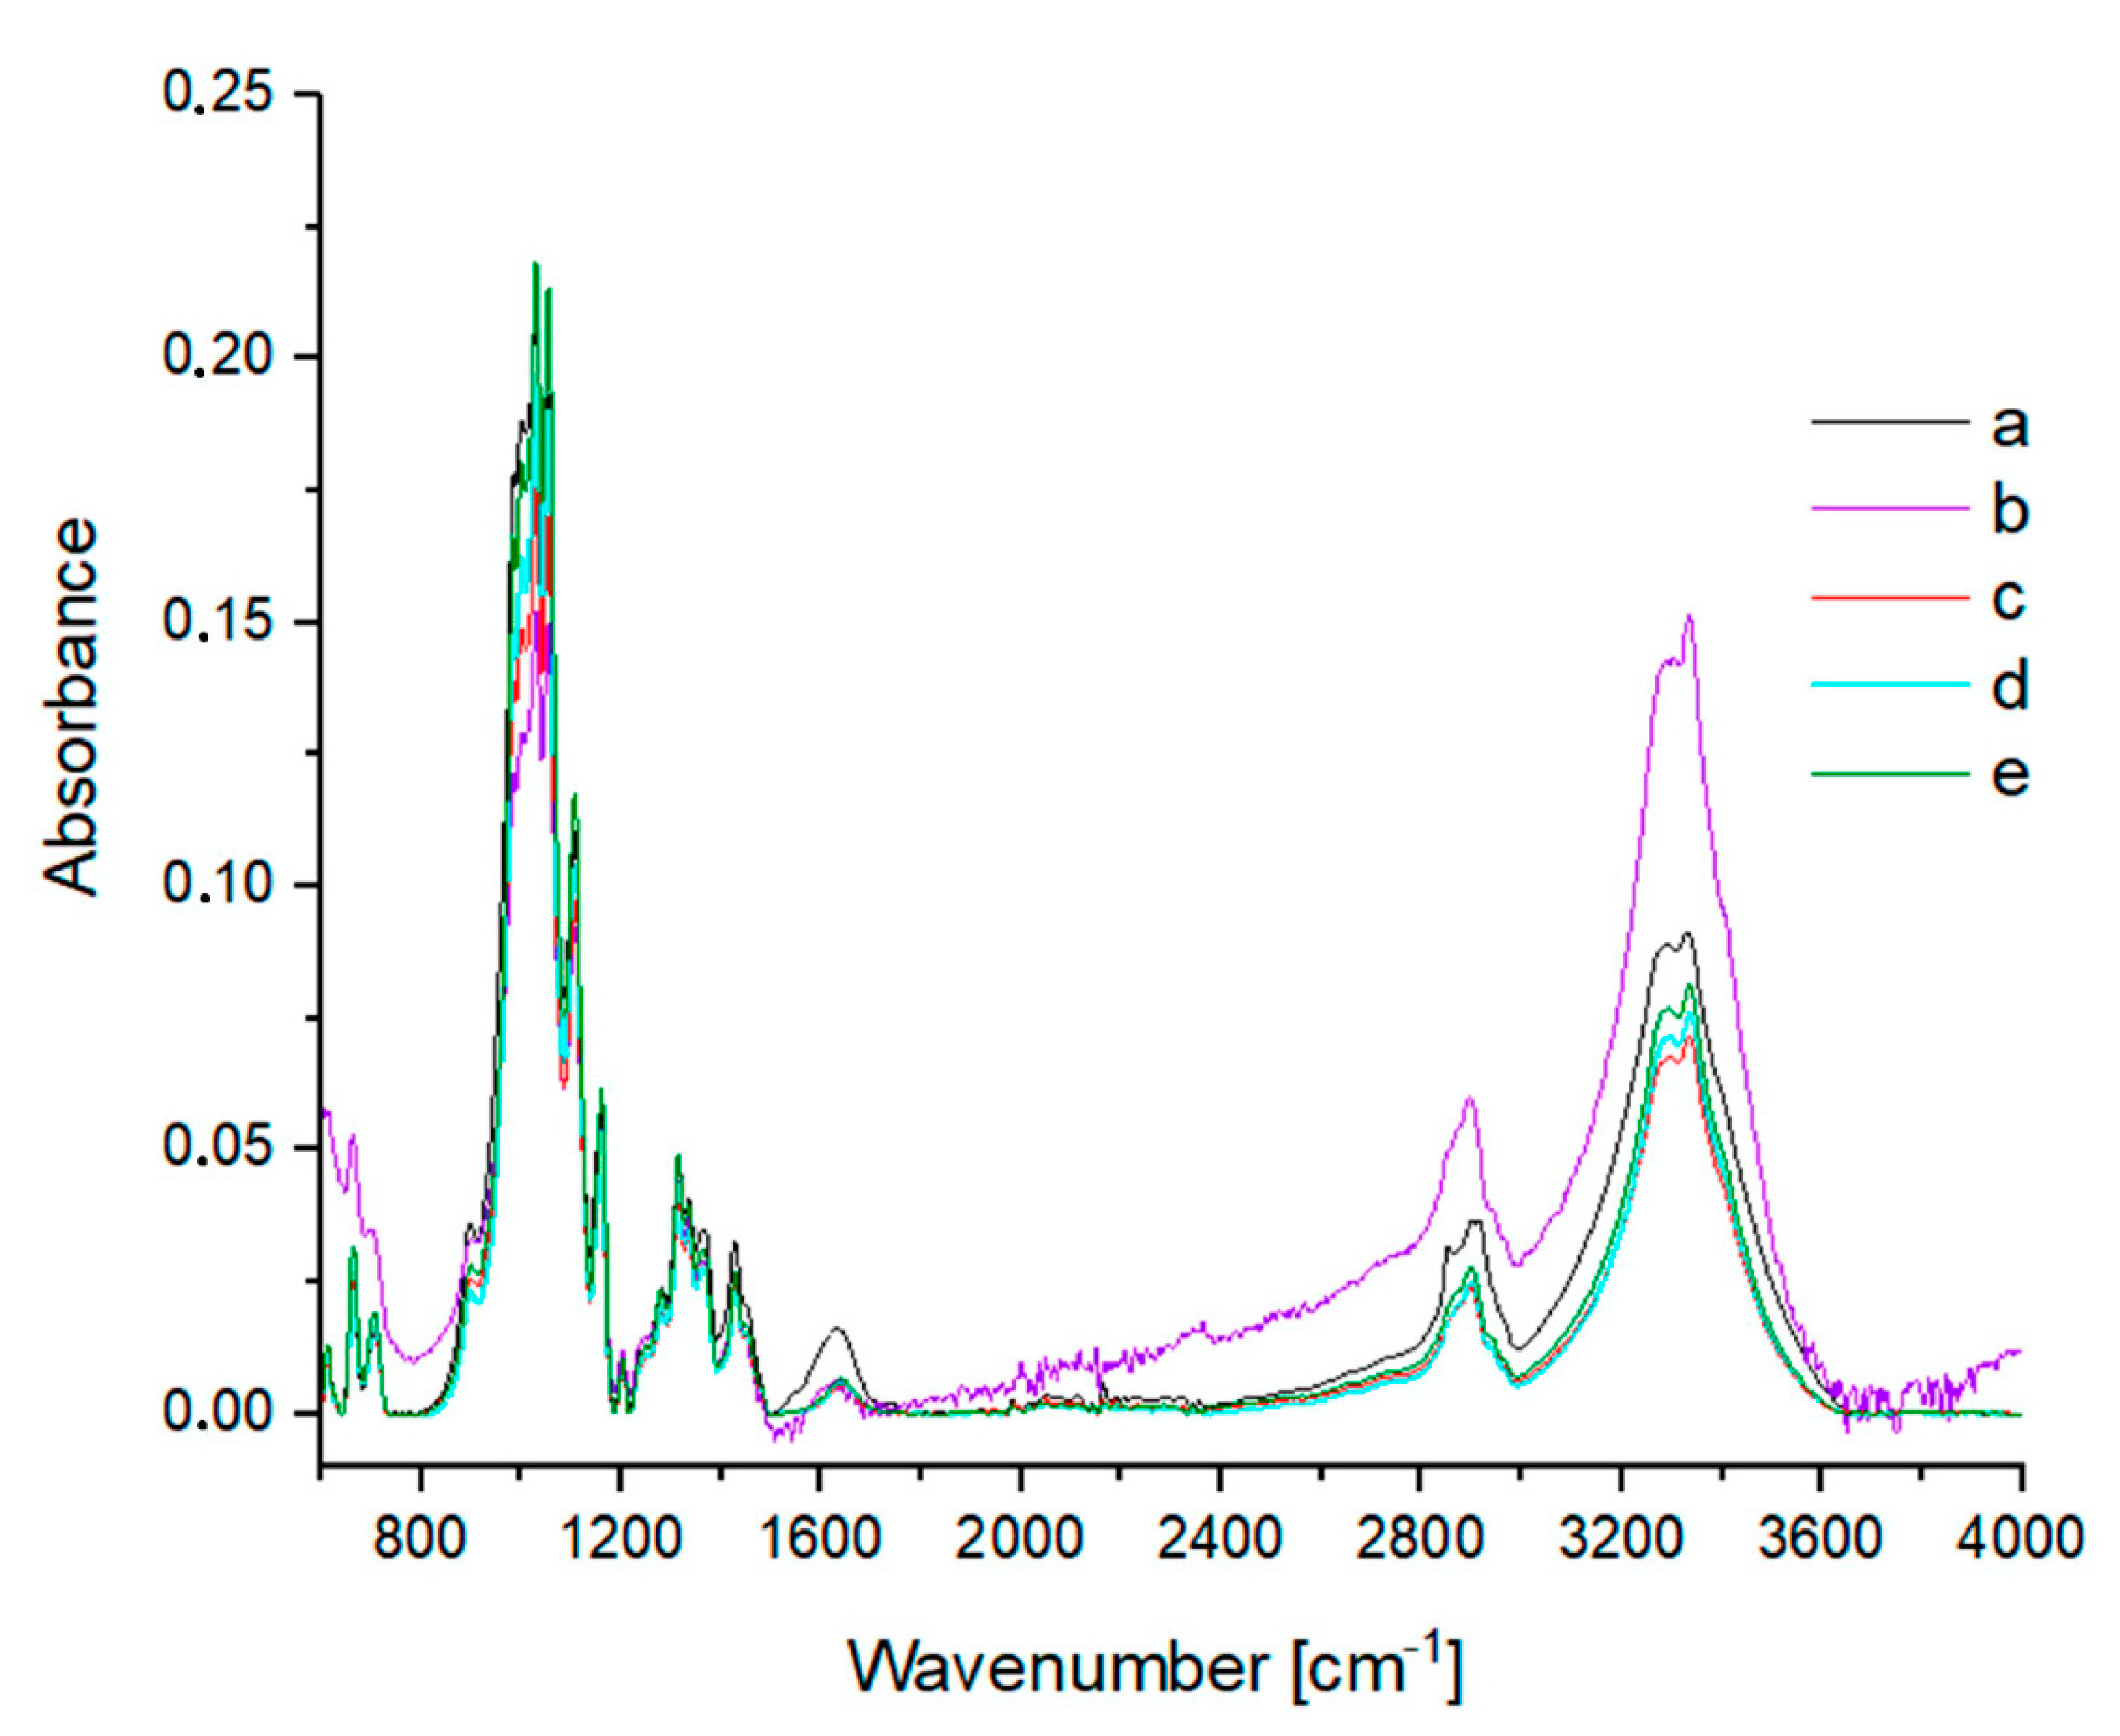
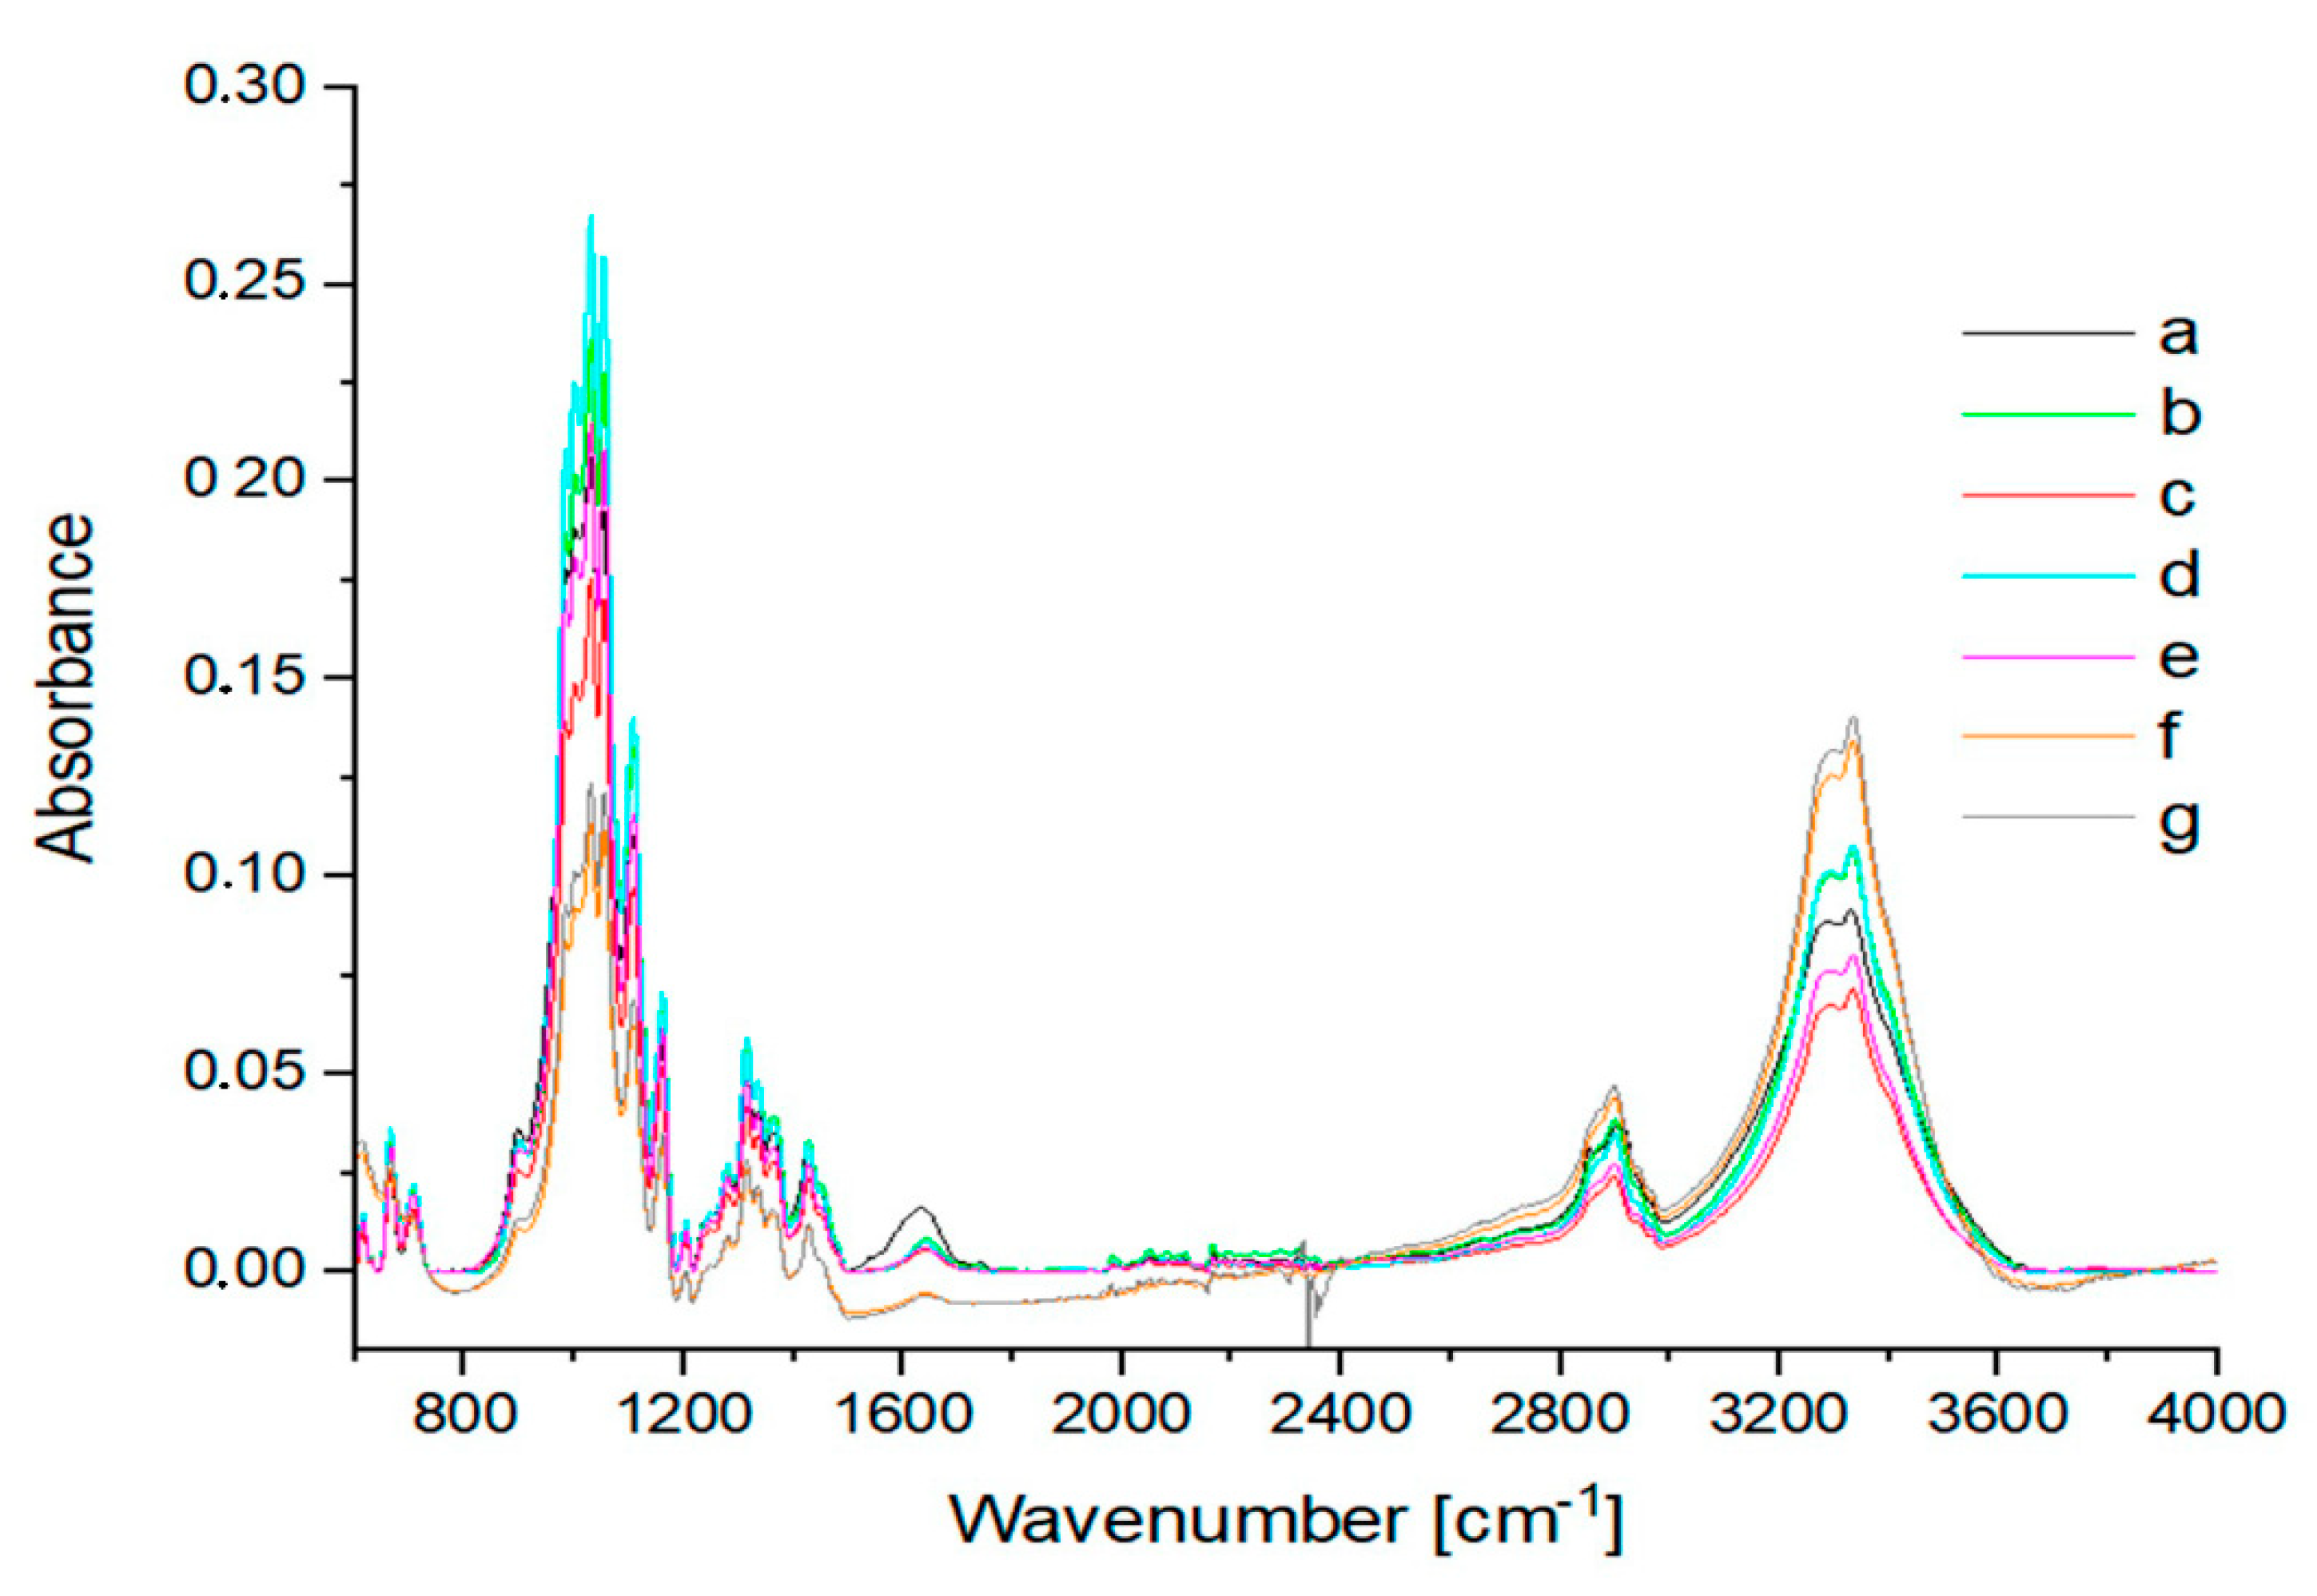
2.4. FTIR-ATR Spectroscopy

Infra-red (IR) analyses were made on a VERTEX 70 FTIR spectrometer (Bruker, Bremen, Germany) with an ATR Golden Gate Diamond Accessory (Specac, Orpington, UK). Spectra were obtained in absorption mode. The measuring range was from 600 cm−1 to 4000 cm−1. The spectral resolution was one data point per 2 cm−1. In most cases, 64 scans were acquired. The scans were Fourier-transformed and the values were averaged for each sample. Spectra were registered using Bruker OPUS 6.5 software (Version 6.5, Bruker, Kennewick, WA, USA), then processed with Microcal Origin 8.0 (Version 8.0, Originlab Corporation, Northampton, MA, USA) software [41].

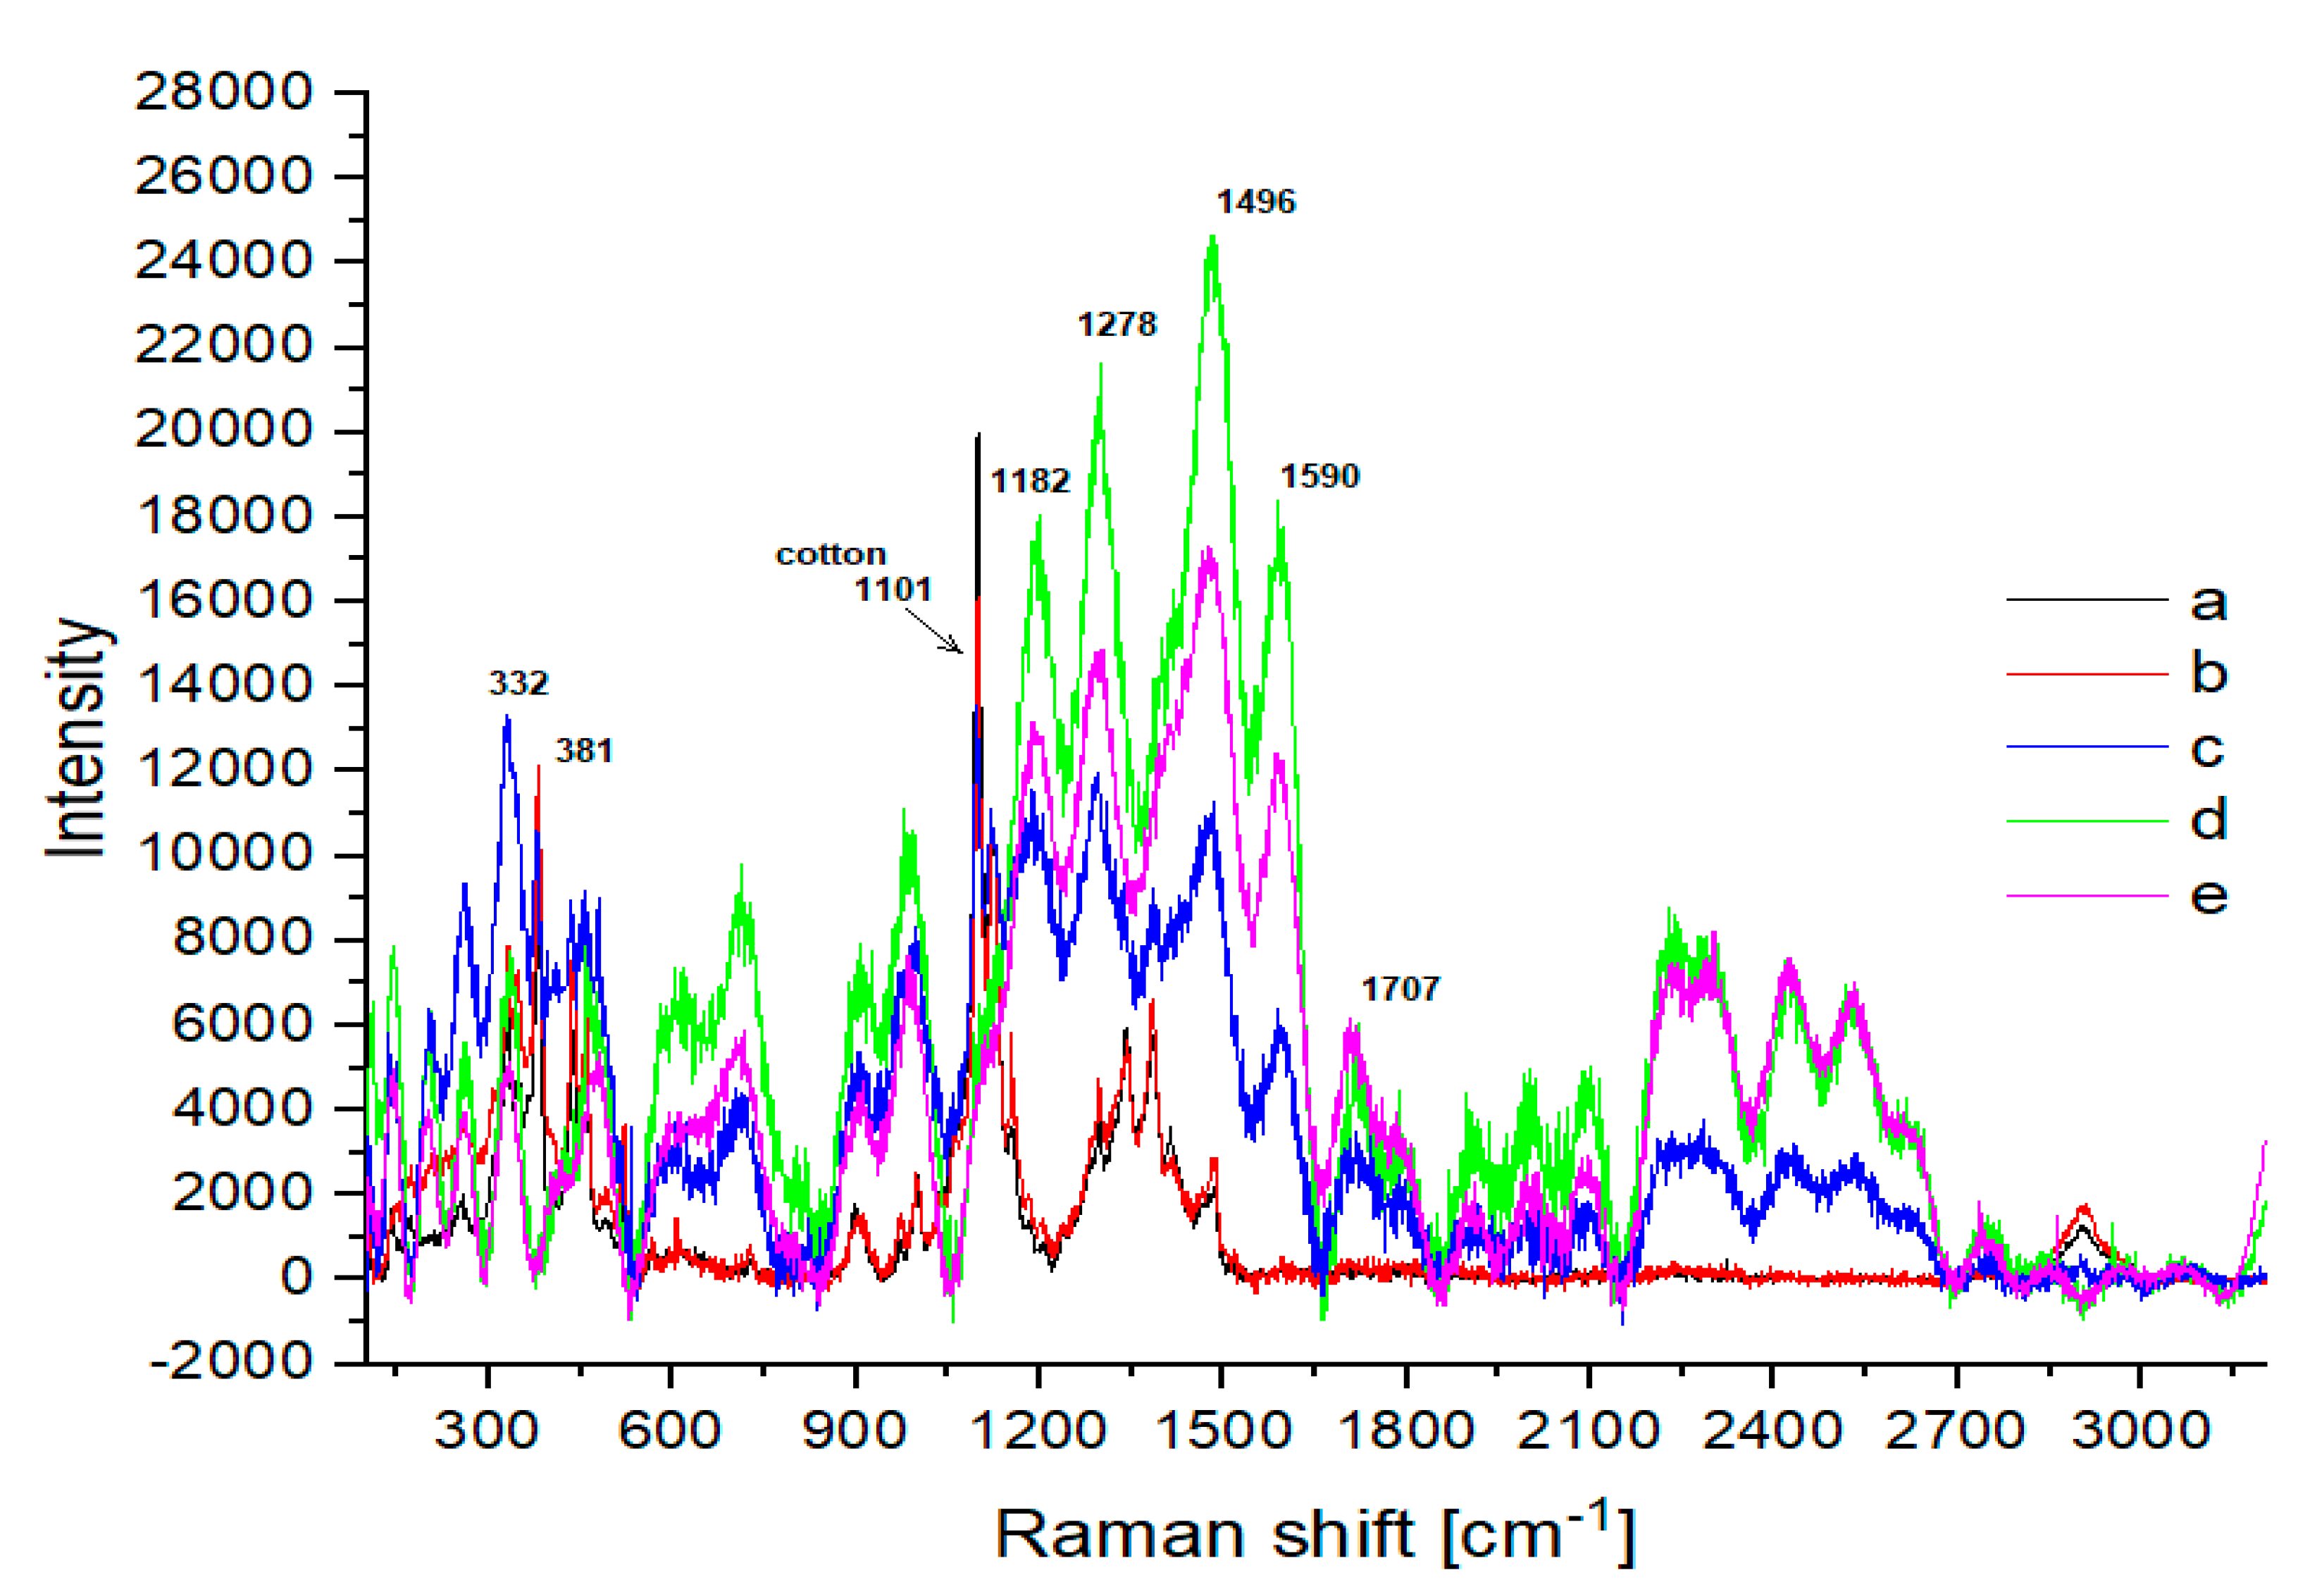
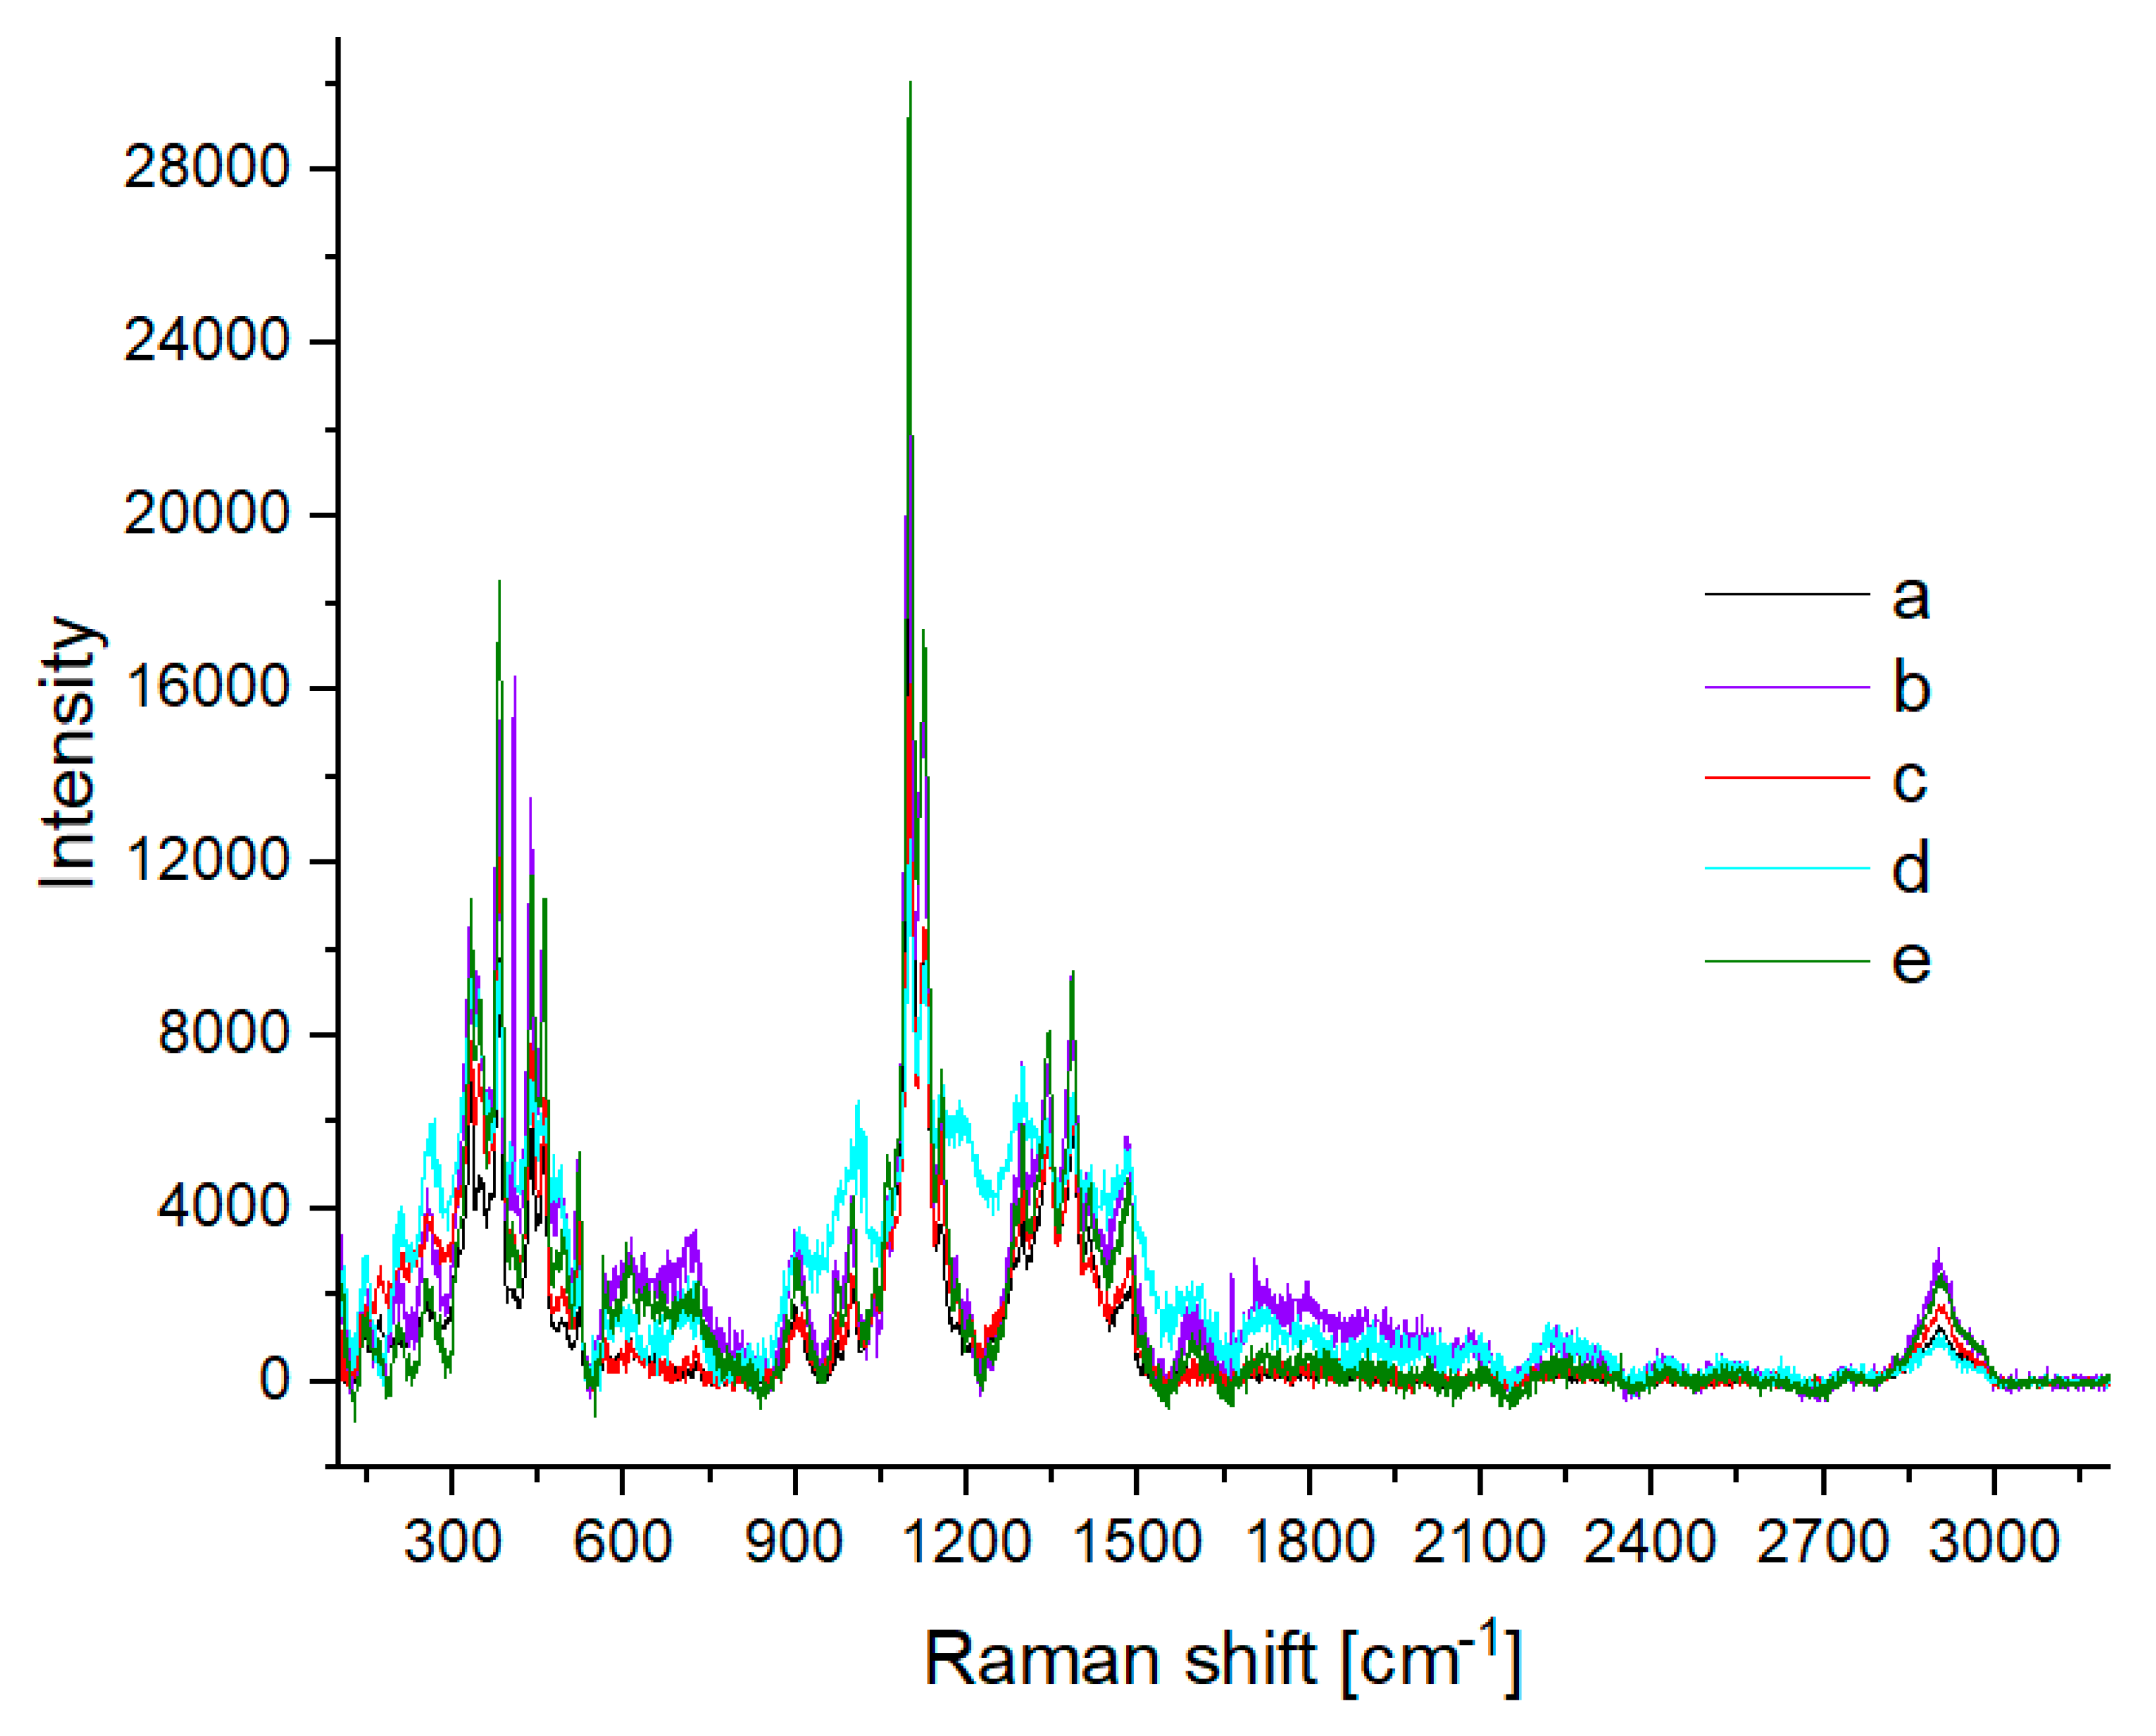
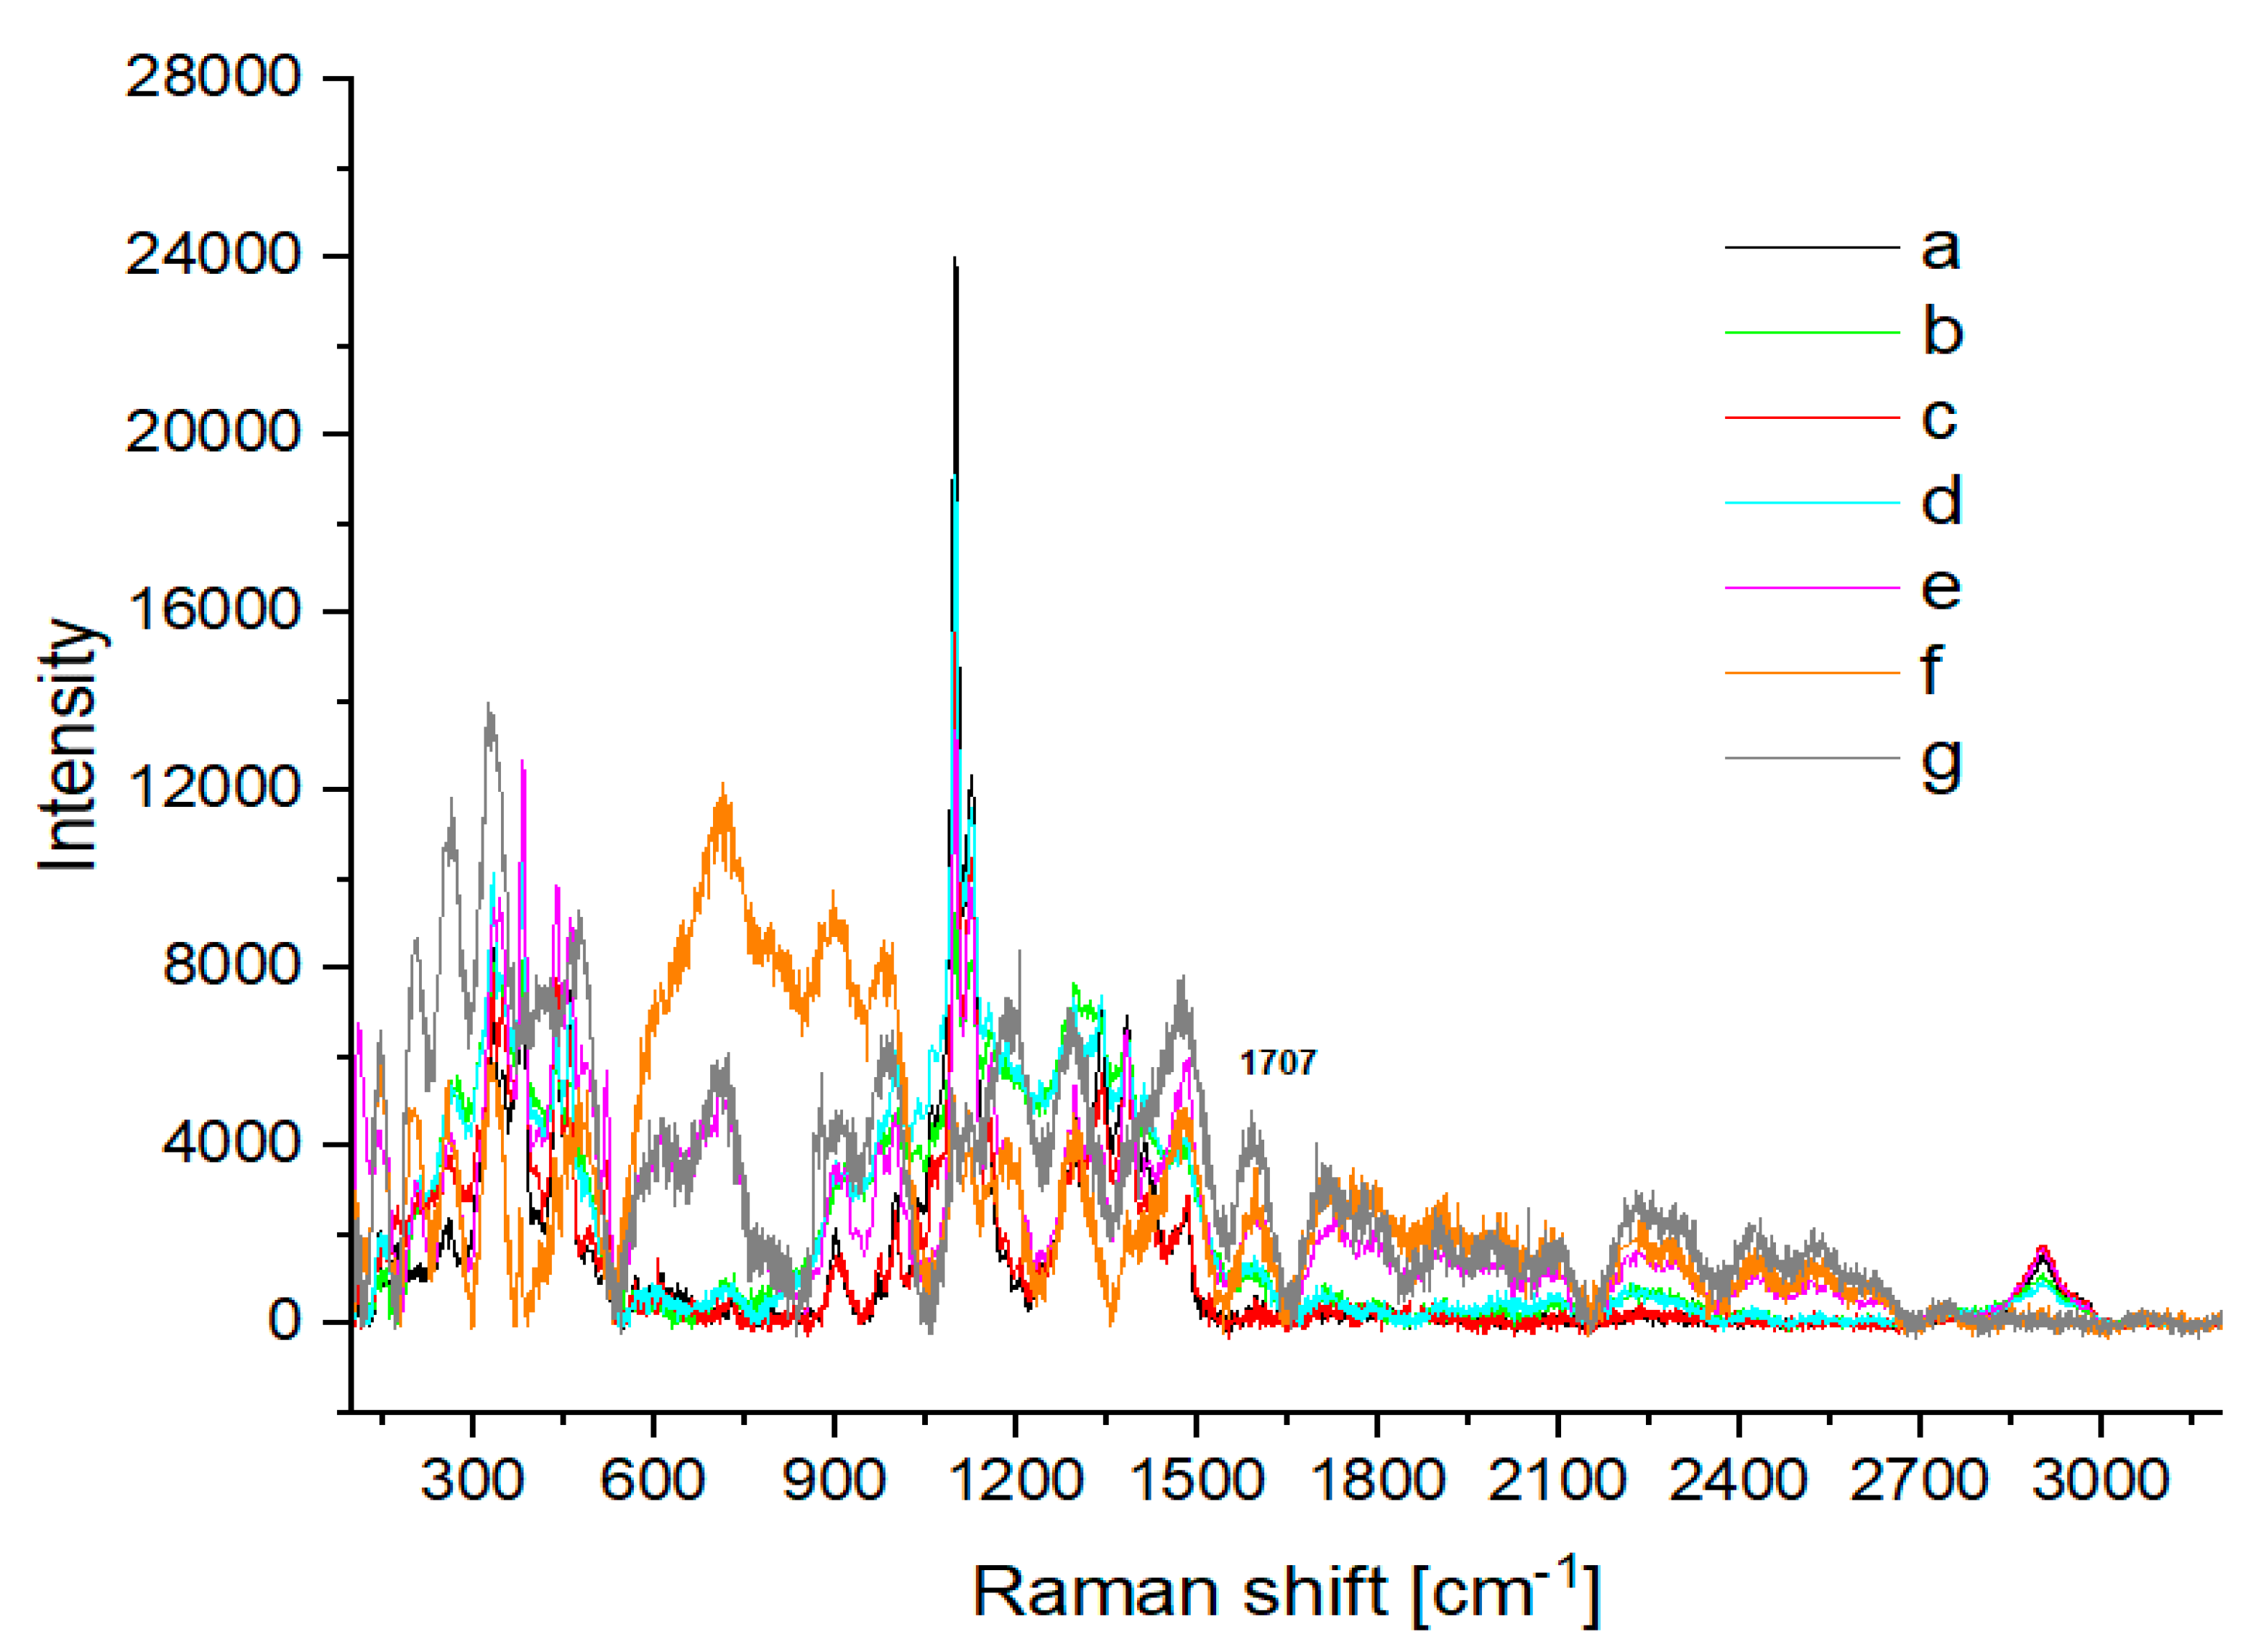
2.5. Raman Spectroscopy

A Renishaw InVia Reflex Raman-dispersive spectrometer (Renishaw, Wotton under Edge, UK) with a Leica microscope (Leica, Wetzlar, Germany) was used. Spectra were obtained in the range of 100–3300 cm−1 with a spectral resolution of 1 cm−1. An excitation source with λ = 785 nm at 300 mW was applied. The laser power (from 1% to 5%) that was used depended on the sample. The analysis was made in the closed microscope chamber of the spectrometer. Samples were situated in the focus of the laser light using a 50× microscope objective and CCD Camera. The results were recorded in the Renishaw WIRE 5.3 program (Version 5.3, Wotton under Edge, UK) [41] and then processed with Microcal Origin 8.0 software (Version 8.0, Originlab Corporation, Northampton, MA, USA).

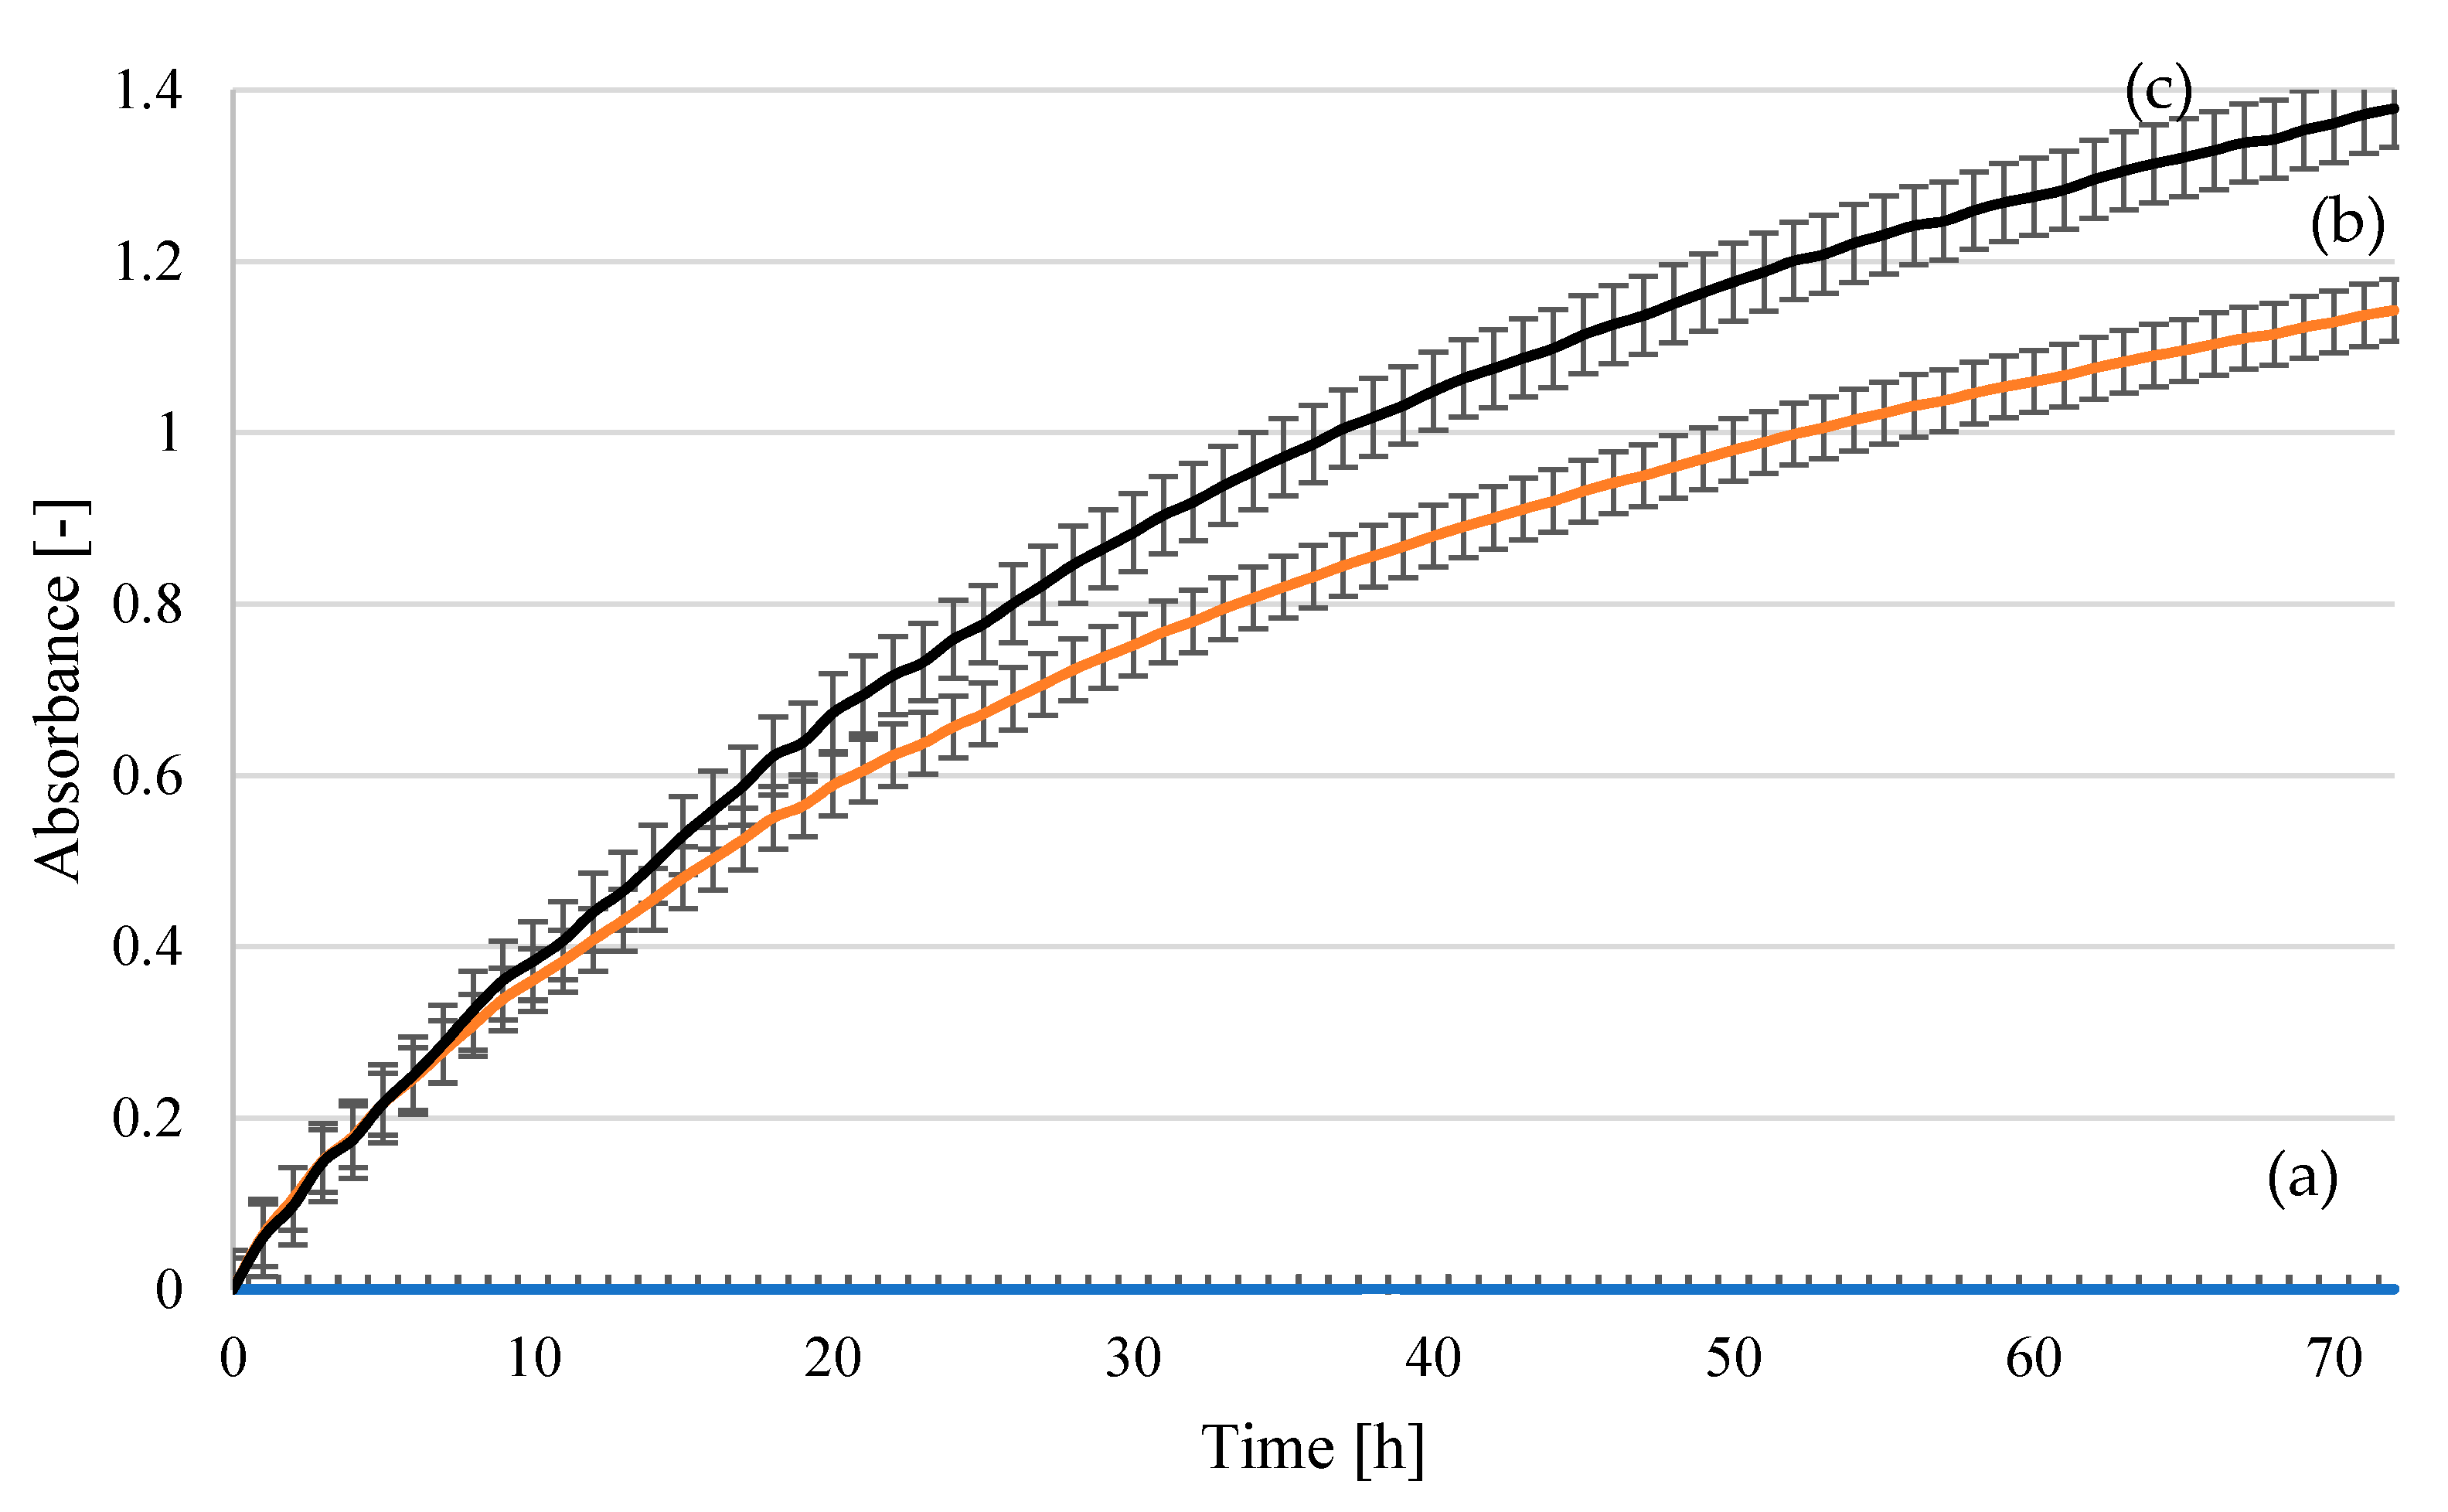
2.6. Yeast Cell Multiplication Using Cotton Hydrolysates as the Cultivation Medium

To prepare the fermentation medium, 40 cm3 of hydrolysate was collected, to which 0.4 g of yeast extract (ChemiLab, Tarnobrzeg, Poland) was added, together with 0.8 g of K-peptone (BTL sp. Z o.o., Lodz, Poland). The hydrolysate supplemented with yeast extract (1%) and K-peptone (2%) was sterilized at 121 °C for 15 min.
To describe the growth kinetics, tests in microtiter plates were carried out. The sterilized medium was transferred to a sterile microtiter 96-channel plate at 180 µL and inoculated with 20 µL of an inoculum suspension of yeast cells (containing at least 108 yeast cells) in MEB medium (Merck Millipore, Bedford, MA, USA). The yeast strains Saccharomyces cerevisiae Ethanol Red (Fermentis Division S.I., Lesaffre, Marcq-en-Baroeul, France) and Saccharomyces cerevisiae Tokay ŁOCK 0204 (ITFiM PŁ collection, Lodz, Poland) were used. Cultivation was carried out at 25 °C for 72 h in a Thermo Scientific Multiskan GO UV/VIS spectrophotometer equipped with a thermostat and mixing module (Thermo Fisher Scientific, Waltham, MA, USA). The absorbance of the solutions was measured at a wavelength of 620 nm. The increase in absorbance was proportional to the turbidity caused by the proliferation of microorganisms in the solution.
Probe tests were carried out to assess the level of yeast multiplication. The medium (supplemented hydrolysate) was transferred in 10 cm3 portions to glass probes and sterilized. The medium was inoculated with 0.5 cm3 of yeast suspensions of Saccharomyces cerevisiae Ethanol Red (Fermentis Division S.I., Lesaffre, Marcq-en-Baroeul, France) and Saccharomyces cerevisiae Tokay ŁOCK 0204 (ITFiM PŁ collection, Lodz, Poland) containing at least 108 yeast cells. Cultivation was carried out at 25 °C for 72 h. The number of colony-forming units was estimated using the standard plate count method.

2.7. Cultivation of a Microorganism Consortium for Methane and Hydrogen Production

In anaerobic digestion and dark fermentation tests, a consortium of anaerobic microorganisms was used as the inoculum. The inoculum represented anaerobically digested sewage sludge collected from the mesophilic anaerobic digestion tank of the Group Wastewater Treatment Plant in Lodz (Poland), with a biomass concentration of 24.59 g DM·dm−3. For the fermentation of methane and hydrogen, the cotton yarn hydrolysates were mixed with the inoculum in the ratio of 1:2 on a volatile solids basis.
For methane production (AD) tests, the anaerobic sludge was mixed with the substrate and adjusted to pH 7 with 20% NaOH (NaOH, Stanlab, Lublin, Poland), which is optimal for methanogenic archaea. To obtain the most efficient hydrogen production in dark fermentation experiments, it was necessary to eliminate hydrogen-consuming microorganisms, which were mainly methanogens. Therefore, the substrate and the inoculum were adjusted to pH 5.5 with 20% H2SO4 and then thermostated at 80 °C for 1.5 h. Both batch fermentations (DF and AD were carried out in glass reactors with capacities of 1 L (working volume 0.7 L), which were tightly connected to the biogas collection tanks. Daily biogas yield was measured on the basis of the amount of water displaced from the 1 L gas tank. Prior to initiating the fermentation process, to create anaerobic conditions air from the reactors was purged by flushing them with nitrogen gas for about 5 min. The glass reactors were incubated in a thermostat under mesophilic conditions, keeping the temperature constant at 35 °C. The reactors were mixed by hand twice a day. The fermentations were continued for 30 days or stopped when there was only residual biogas production.
The biogas efficiency was monitored qualitatively and quantitatively on a daily basis. The content of CH4 and H2 was measured with a Madur GA-21 plus portable gas analyzer (Madur Polska sp. z o.o., Zgierz, Poland). The yields of methane and hydrogen were converted into the amount of gas produced per kg of organic dry matter under normal conditions so that it was possible to compare the results with the literature data.

3. Results and Discussion

Cotton fibers consist almost entirely of cellulose (94–100%). Cotton hydrolysis, therefore, leads to glucose as the main product. Acid hydrolysis of the cotton yarn was performed in a Parr Instrument Company Series Mini Reactor 4592 with a volume of 50 cm3. Hydrolysis was carried out in the temperature range of 80–200 °C for 1–8 h with the use of a H2SO4 catalyst at concentrations of 0.5–10%. Prior to HPLC analysis, to determine the glucose concentration samples of the hydrolysates were neutralized with NH4OH to pH 7.5. The results are summarized in Figure 2, as the arithmetic means of the glucose concentrations of the hydrolysates from the three hydrolysis processes.
The highest concentration of glucose was obtained in the hydrolysates of cotton yarn hydrolyzed in a 2% solution of sulfuric acid in the temperature range of 140–160 °C for 2 h. Our previous studies of cotton hydrolysates obtained via the action of sulfuric acid revealed that only above the temperature of 160 °C, trace amounts of (4.970 min) furfural and (8.558 min) 5-methyl-2-furanocarboxaldehyde were formed in the reaction and a temperature increase led to the creation of other products, such as (7.885 min) 2(5H)-furanone, 5-methyl- and (12.438 min) levulinic acid [42]. What is more, further increasing the temperature of the process of cotton fiber hydrolysis to 200 °C reduced the glucose concentration in the hydrolysates as a result of caramelization and Maillard reactions [43], the products of which may be fermentation inhibitors.
SEM images (Figure 3) of the solid residue after hydrolysis of the cotton fibers clearly showed that the most significant changes in the morphology of the fibers occurred when the process was carried out at high temperatures (≥160 °C). The sample hydrolyzed at 160 °C contained the highest concentration of glucose (3.34 g·dm−3). However, when the temperature of hydrolysis was increased to 200 °C, glucose was not detected and the only products of the reaction were the products of its further transformation. Although no significant changes in the morphology of the cotton fibers were observed in the SEM images after hydrolysis at 140 °C, the amounts of glucose released into the hydrolysate were also very high (3.34 g·dm−3). To study the changes in the structure of cotton fibers, IR and Raman spectroscopy techniques were used.
Both in the IR spectra (Figure 4, Table 1) and Raman spectra (Figure 5, Table 1), changes in the cotton were observed at temperatures above 120 °C. However, the sample treated at 140 °C (Figure 4c) mainly showed changes in the IR band intensities. In the Raman spectra (Figure 5c), these changes were more pronounced, as the bands of the ring in the region 300–600 cm−1 were more intense. Glycosidic COC ring breathing and stretching vibrations (1101 cm−1, 1122 cm−1) decreased. In the region of 1200–1600 cm−1, new overlapping bands appeared. The CH stretching band at 2900 cm−1 disappeared and new bands of the decomposition products were visible at 1182 cm−1, 1278 cm−1, 1496 cm−1, 1590 cm−1, and 1707 cm−1. These changes were more evident in the Raman spectra for cotton treated at 160 °C (Figure 5d) and 200 °C (Figure 5e). The bands characteristic of cotton completely disappeared. In the IR spectra, C-OH and COC ring bands, as well as CH bending bands, became less visible when cotton was treated at 160 °C (Figure 4d) and finally disappeared when the sample was treated at 200 °C (Figure 4e). At the same time, new bands with maxima at 1701 cm−1 and 1608 cm−1 appeared and bands in the 2900–3600 cm−1 region differed significantly in shape and intensity. Characteristic cotton IR bands in the region 900–1200 cm−1 completely disappeared and a group of new overlapping bands in the region 1200–1500 cm−1 became more intense. These bands were derived from solid cellulose decomposition products after the release of gases, mainly hydrocarbons [44].
Another important parameter influencing the amount of glucose obtained in cotton hydrolysates is the concentration of H2SO4 used as the catalyst. Hydrolysis of glucose samples was carried out at 120 °C for 2 h. Each time, a different concentration of sulfuric acid was used in the range of 0.5–5%. Figure 6 presents the results of the HPLC analysis of the sugar composition of the hydrolysates.
High glucose concentrations were also noted in the hydrolysates when cotton yarn hydrolysis was performed for 2 h in concentrated H2SO4 solutions (5 and 10% v/v) at a temperature of 120 °C. The use of concentrated acid solutions in industrial reactors is undesirable due to their high corrosivity, as well as the low-quality fermentation media obtained. From the industrial point of view, it is therefore preferable that the hydrolysis process is carried out at the highest possible temperatures, namely, 140–160 °C, with the concentration of the acid catalyst as low as possible.
Figure 7 shows SEM images of the solid residue after hydrolysis. As can be seen, changes in the morphology of the fibers occurred when the process was conducted at 120 °C for 2 h with concentrations of 5% and 10% sulfuric acid. High glucose concentrations (5%—3.216 g·dm−3 and 10%—3.323 g·dm−3) were also recorded for both of these samples. The morphologies of the fibers in the solid residues after hydrolysis with a low concentration of sulfuric acid (0.5%) were not significantly altered. This was in agreement with the glucose concentration in the hydrolysate, which was also very low (0.277 g·dm−3). IR and Raman spectroscopy studies were additionally performed to confirm changes in the fiber structure.
No significant changes were noted in the IR and Raman spectra of the samples exposed to sulfuric acid at various concentrations (Figure 8 and Figure 9). The IR spectrum of the sample treated with 0.5% H2SO4 (Figure 8b) differs from the other spectra, but the changes concern only the band intensity. The higher intensity of the OH band (region 3200–3500 cm−1) indicates the influence of water. The Raman spectrum of cotton treated with 5% H2SO4 (Figure 9d) differed slightly from the others, but no new bands could be distinguished.
Another important parameter that influences the amount of glucose in cotton hydrolysates is the time of the hydrolysis process. The data presented in Figure 10 show that increasing the time of the hydrolysis process from 1 h to 8 h promoted the depolymerization of cellulose and the formation of more glucose.
Figure 11 shows SEM images of the solid residue after hydrolysis was performed for various reaction times. As can be seen, there were no visible changes in the morphologies of the fibers. To examine the changes in the cotton fibers depending on the hydrolysis time, IR and Raman tests were performed.
Differences can be observed in the IR and Raman spectra of the cotton treated at 120 °C with 2% H2SO4 depending on the duration of hydrolysis (Figure 12 and Figure 13). In the IR spectra for samples exposed for 6 h and 8 h to acid hydrolysis, bands for the cellulose ring C−OH and COC bands decreased (Figure 12f,g). The same time bands for OH at 3333 cm−1 increased in intensity. In the Raman spectrum, a new band at 1707 cm−1 was observed (Figure 13f,g). When cotton was exposed for 6 h to 2% H2SO4 at 120 °C (Figure 13f), bands characteristic of cotton disappeared, but a broad band between 600 cm−1 and 1000 cm−1 appeared. After 8 h of decomposition (Figure 12), new bands formed derived from solid cellulose decomposition products after the release of gases. The new bands were mainly for hydrocarbons [40], similarly to those presented in Figure 5.
Based on the results of acid hydrolysis carried out in the microreactor (V = 50 cm3), the cotton yarn was hydrolyzed at a larger scale under optimized conditions in a Parr Instrument Company Reactor 4577, which is a pressure reactor with a working capacity of 1 L. Cotton hydrolysis with sulfuric acid and phosphorus acid at a concentration of 2% was performed in the temperature range of 120–160 °C. The reactions were continued for 2 h. Prior to the HPLC analysis to determine glucose concentration (Figure 14 and Figure 15), samples of the hydrolysates were neutralized with NH4OH to pH 7.5. Samples of the hydrolysates were used for the preparation of fermentation media.
The use of 2% phosphoric acid as a catalyst for hydrolysis of the β-1,4-glycosidic bonds in cellulose present in cotton fibers had a positive effect on the amount of glucose formed. By continuing the cotton yarn hydrolysis at 140 °C with 2% H3PO4 for 2 h, the concentration of glucose in the hydrolysate was five times higher than that obtained under the same conditions with H2SO4. The use of phosphoric acid instead of sulfuric acid was also beneficial from the point of view of using hydrolysates as components of the fermentation medium because the ammonium phosphate formed as a result of neutralization was a source of nutrients, which were necessary for the growth of microorganisms.
The structure of the cotton fibers in the solid residue after hydrolysis with sulfuric acid showed much greater destruction compared to the structure of the solid residue after hydrolysis catalyzed with phosphoric acid. However, higher glucose yields were obtained after hydrolysis with phosphoric acid.
Hydrolysis was also carried out under optimized conditions in a Parr Instrument Company Reactor 4551 with a volume of 7.99 L. The results were very similar. The hydrolysates were used in biological materials as a nutrient.

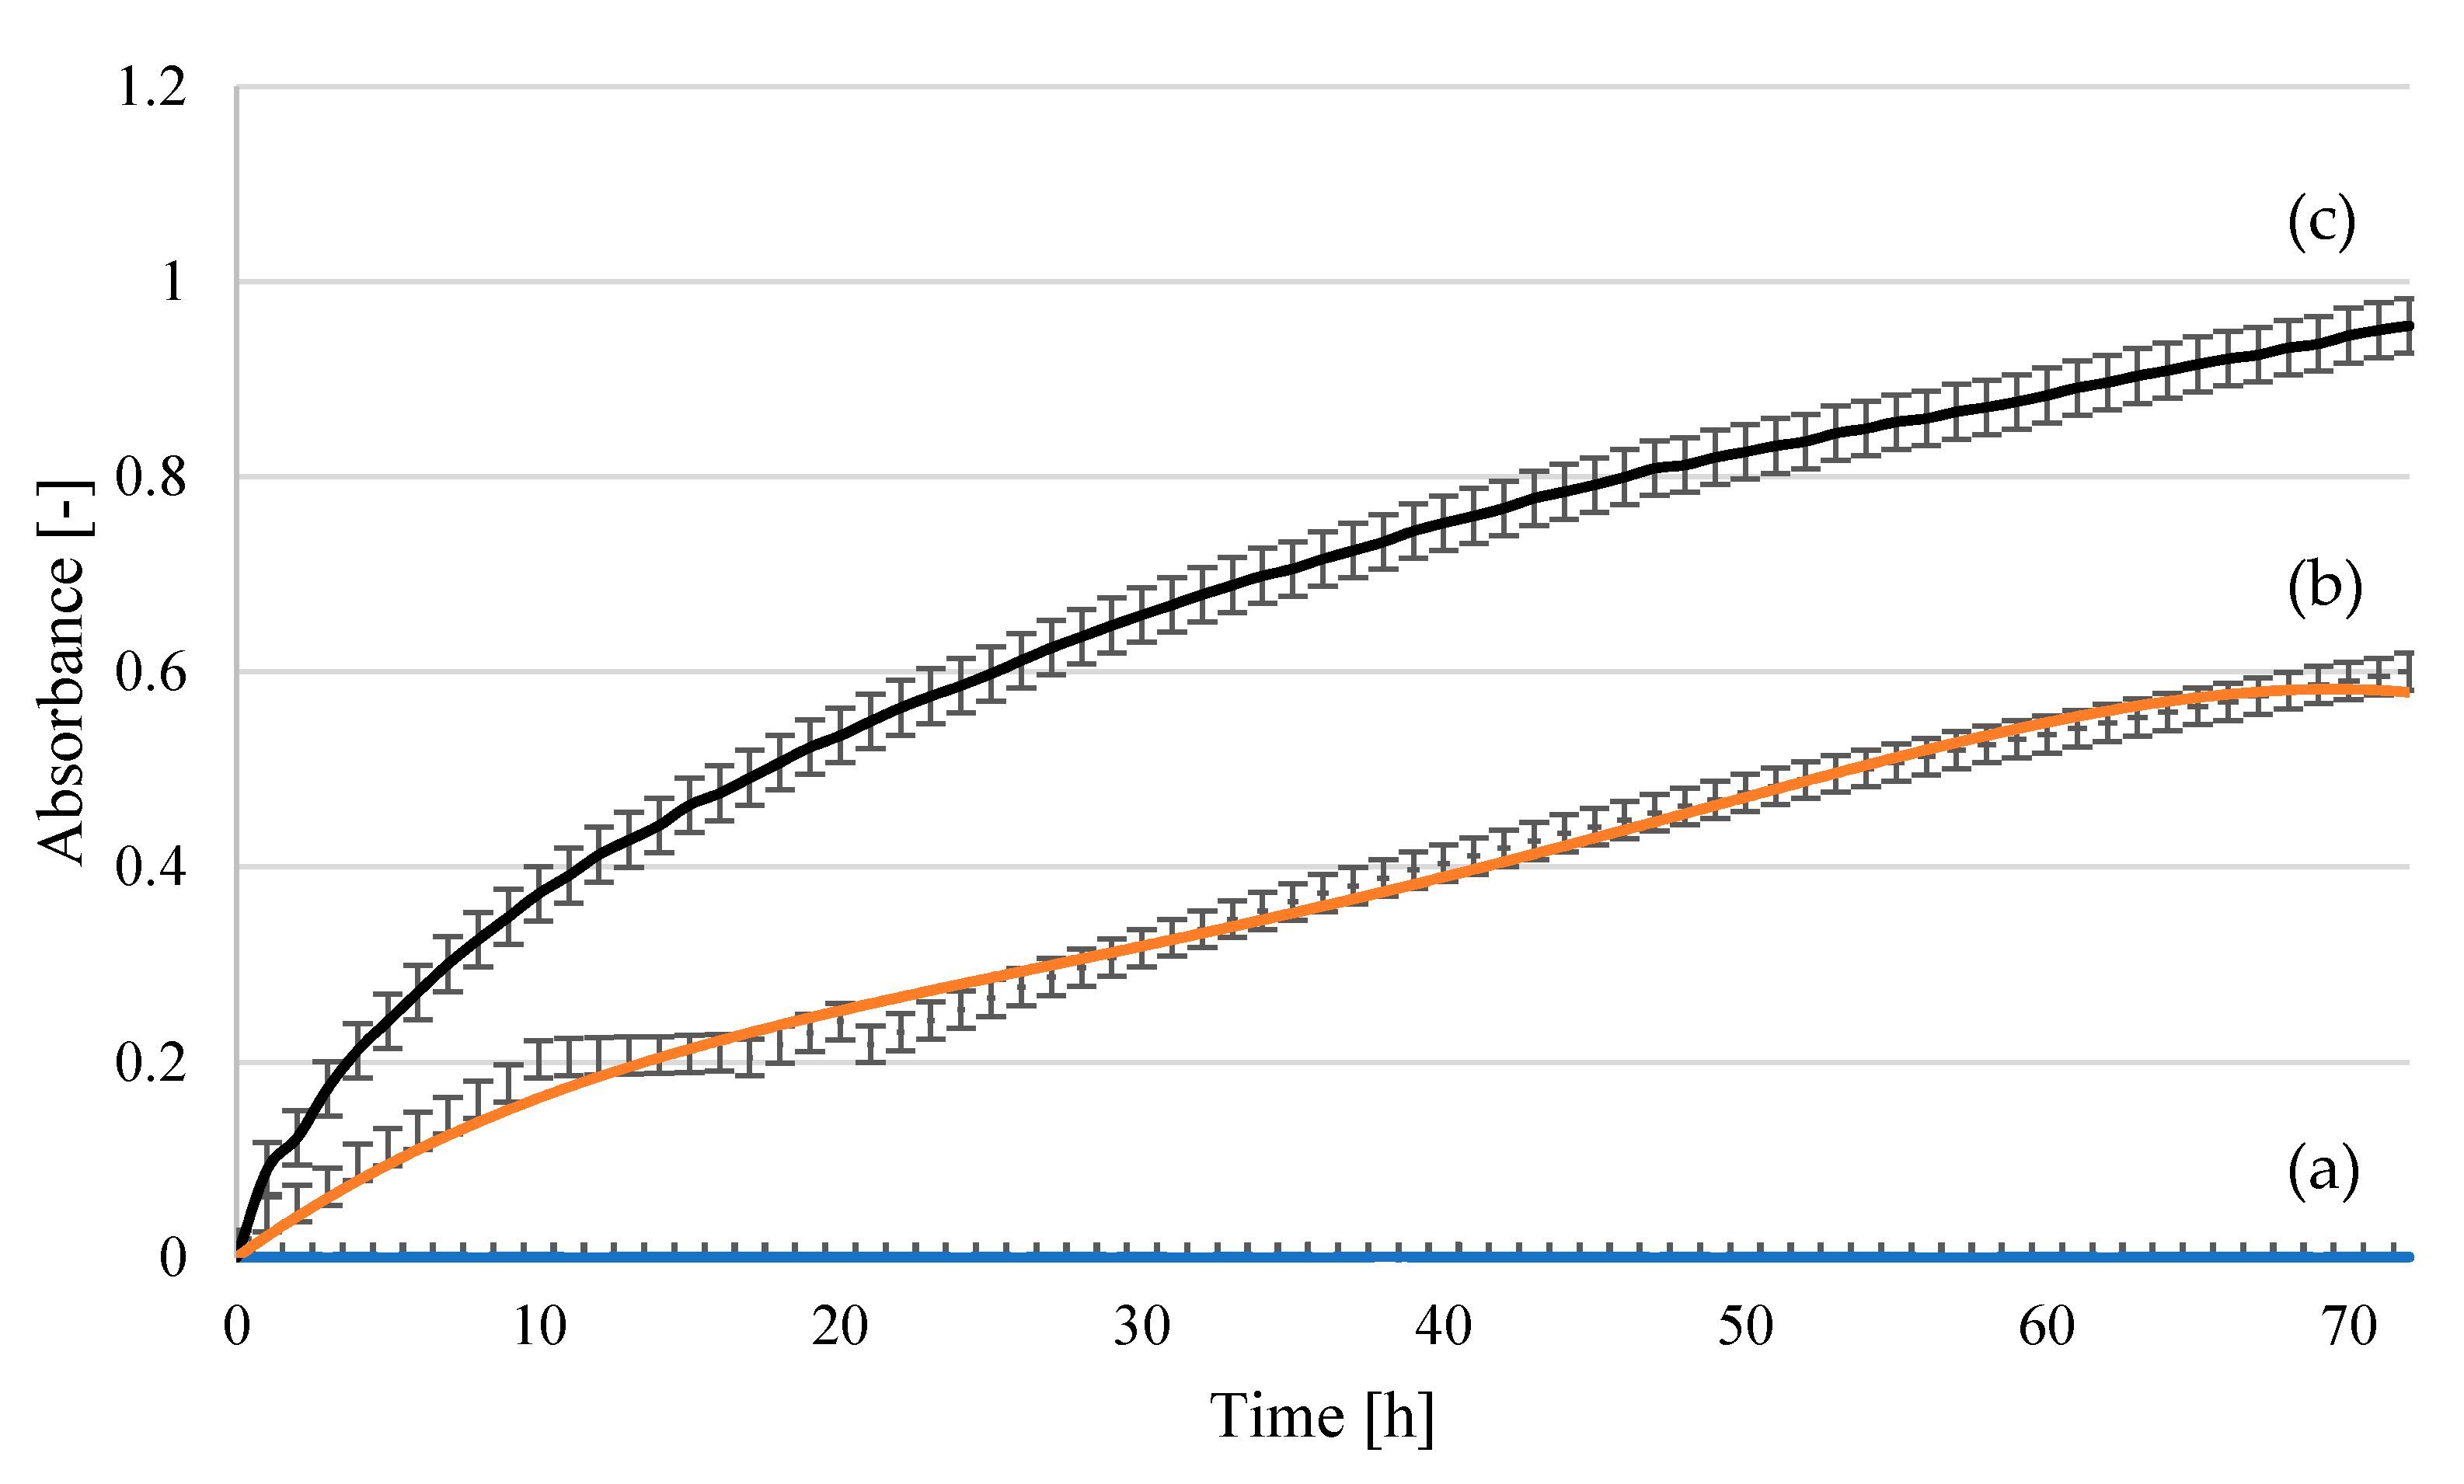
3.1. Yeast Cultivation on Cotton Substrates

A series of biological tests were conducted, which confirmed that the obtained hydrolysates were suitable for biotechnological applications. Cotton yarn hydrolysates neutralized with NH4OH to pH 6.5, mainly containing glucose, could be used as a carbon source for the biosynthesis of yeast biomass. The nutritional components of the hydrolysates were assimilated and metabolized, resulting in the multiplication of yeast cells. Both supplemented hydrolysates obtained via the action of H2SO4 and H3PO4 at 140 °C constituted suitable media for the cultivation of the selected yeast strains (Figure 16 and Figure 17). Both Saccharomyces cerevisiae Ethanol Red and Saccharomyces cerevisiae Tokay LOCK0204 showed greater increases in yeast biomass when cotton hydrolysates obtained via the decomposition of cotton yarn at 140 °C for 2 h with 2% H3PO4 were used as sugar nutrients. The highest absorbance was recorded for the yeast Saccharomyces cerevisiae Ethanol Red (Figure 16) in a fermentation medium containing hydrolysate from the process using phosphoric acid on cotton yarn at 140 °C for 2 h.
Lower optical density values and a lower number of colony-forming units (Table 2) were observed for the yeast strain Saccharomyces cerevisiae Tokay ŁOCK0204 than for Saccharomyces cerevisiae Ethanol Red, regardless of the hydrolysate used in the medium. Better growth was observed in the medium containing phosphoric acid hydrolysate. However, in all cases, the stationary phase of growth was not reached during the first 48 h, as happens in model media. The environment of the tested hydrolysates may be conducive to extending the growth time or the rate of utilization of nutrient compounds. This may be related to the release of biologically active compounds during the hydrolysis processes. As reported in previous research [47], this group does not include furfural and levulinic acid.
Our results showed that cotton yarn hydrolysate has great potential for replacing simple sugar solutions in fermentation media. The developed processes did not generate fermentation inhibitors. Regardless of the acid used, a systematic increase in yeast biomass was observed. In future work, processes conducted in glass reactors on a laboratory scale will enable full qualitative and quantitative analysis of fermentation products, with particular emphasis on ethanol.

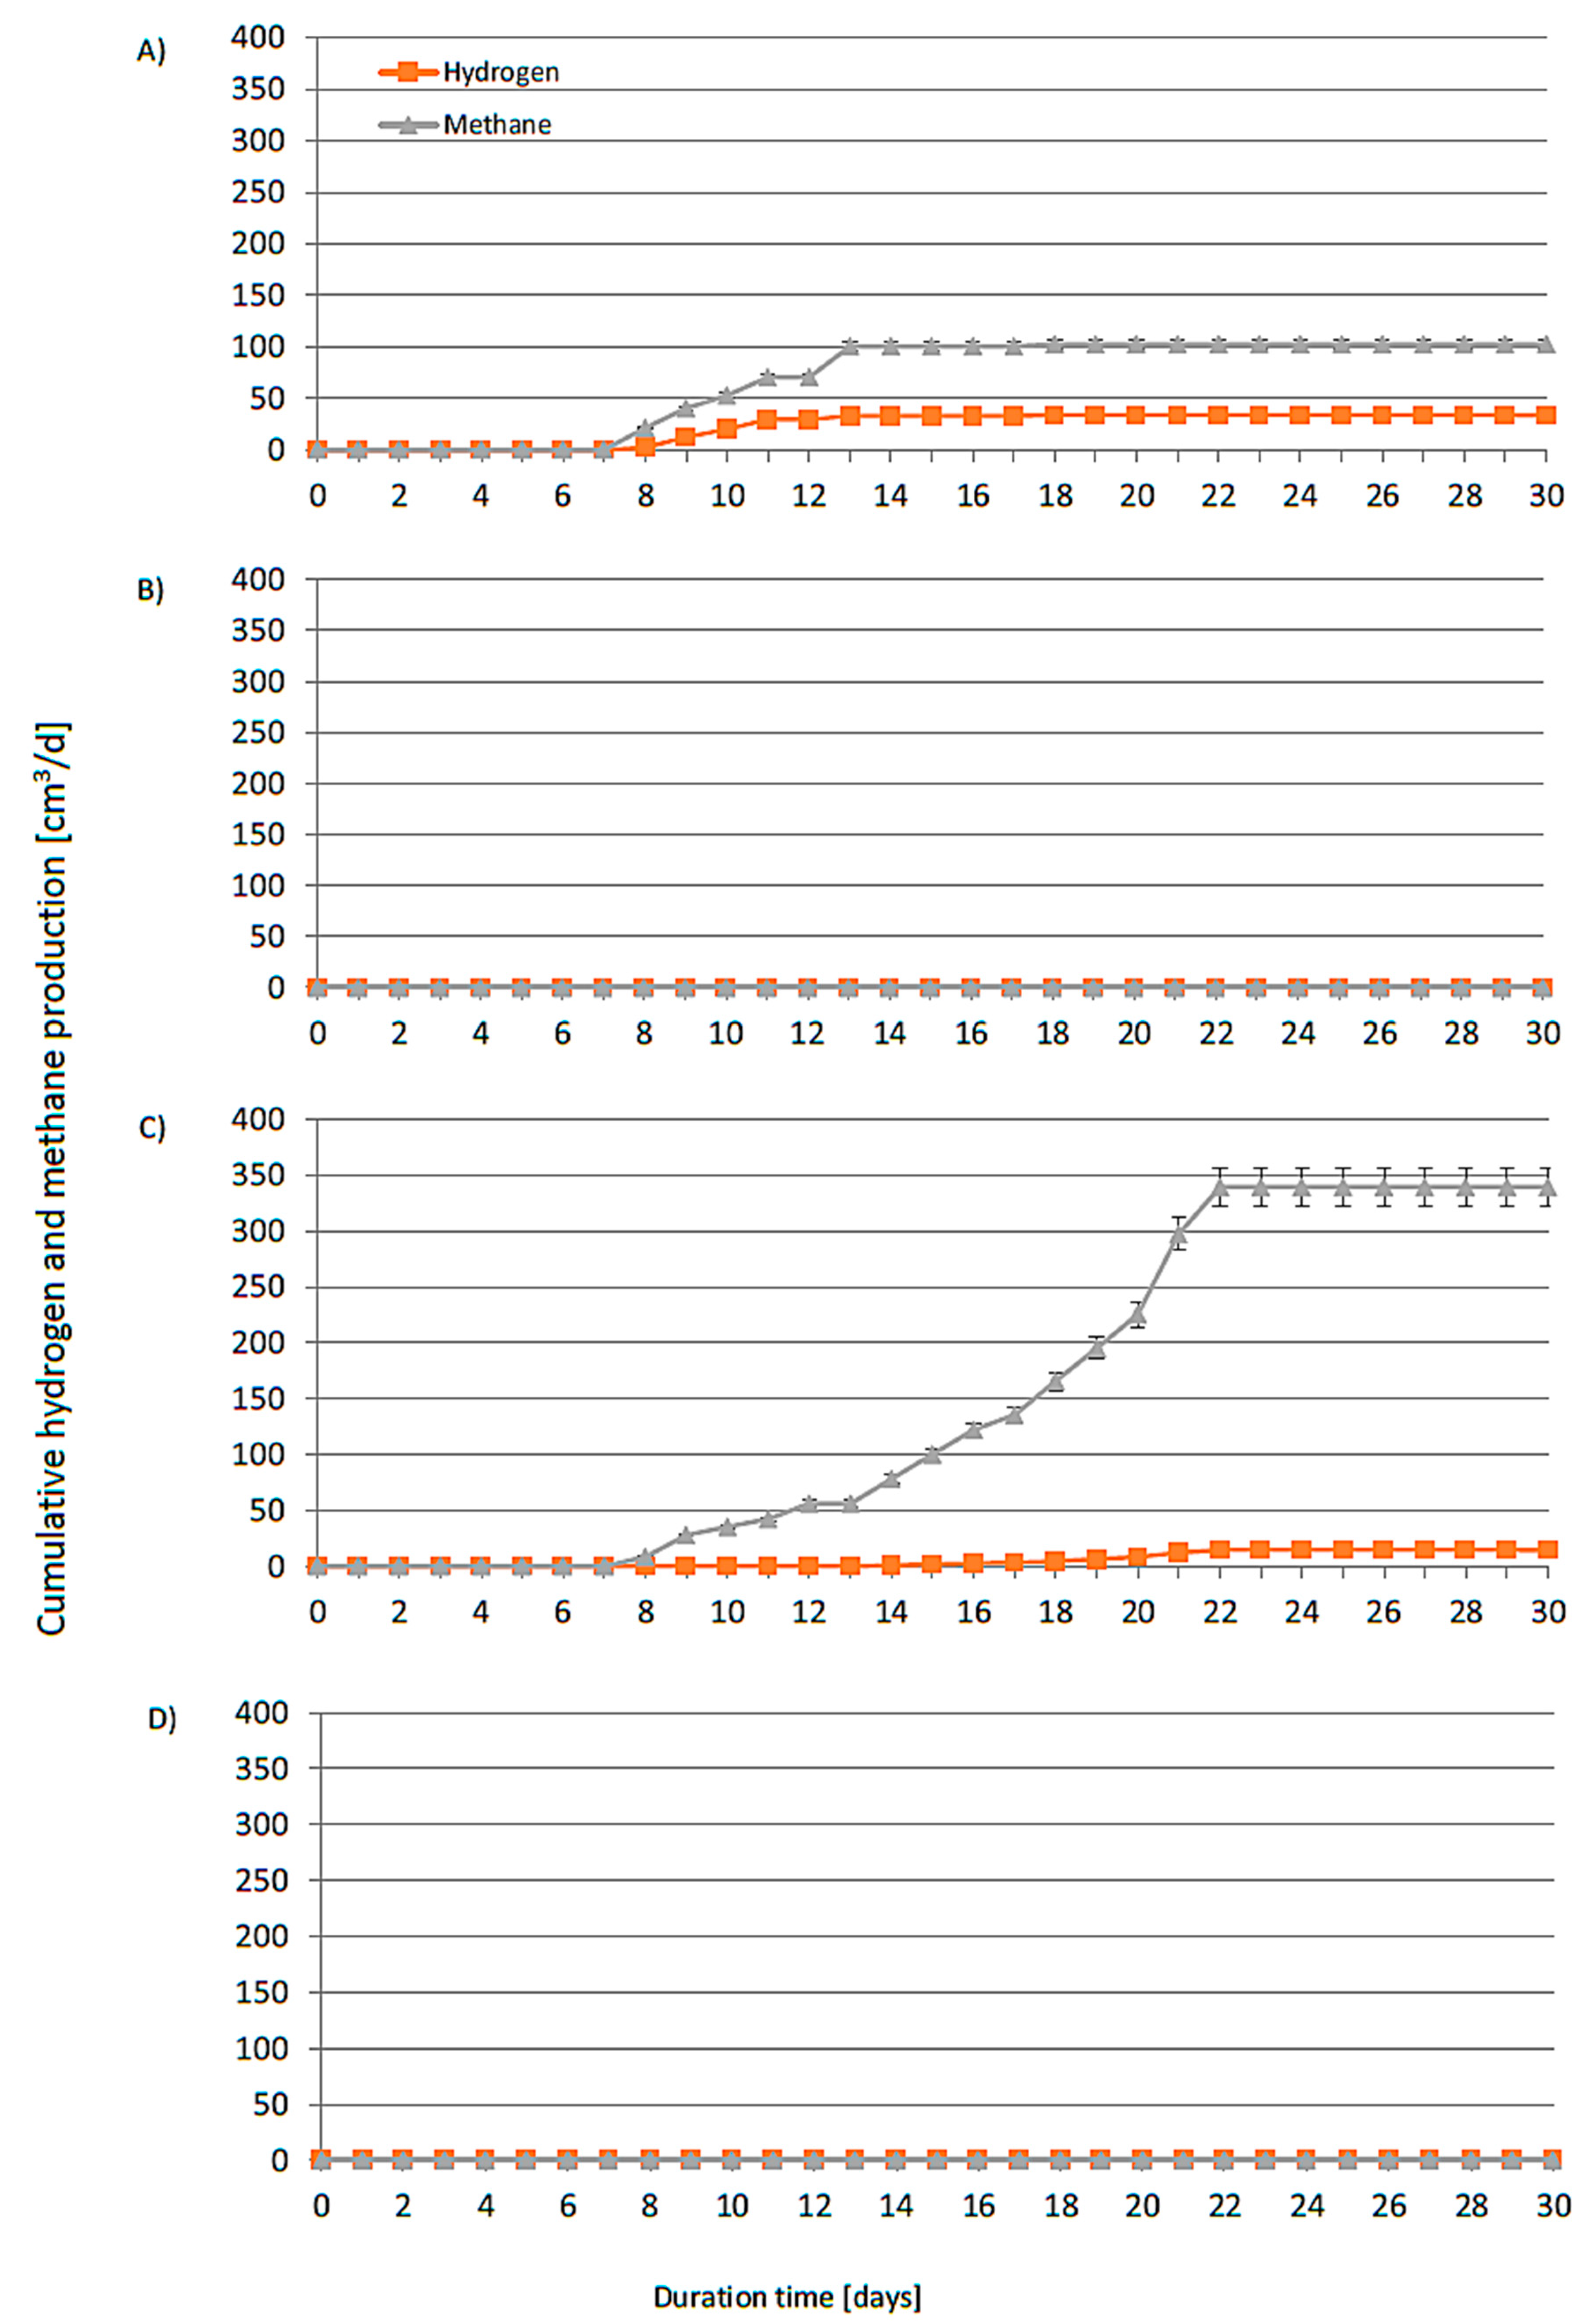
3.2. Cultivation of a Consortium of Microorganisms for the Production of Methane and Hydrogen on Substrates from Cotton Yarn Hydrolysates

Natural cotton fiber is composed of 88–95% cellulose, along with proteins (1.0–1.9%), waxes (0.4–1.2%), pectins (0.4–1.2%), and inorganic compounds (0.7–1.6%). Its composition suggests that it could be an appropriate substrate for methane and hydrogen production [48]. However, the complexity of its structure inhibits the process of fermentation and makes pretreatment necessary. Hydrolysis allows for the release of glucose, but also slightly increases the amount of nitrogen and phosphorus available to microorganisms. Among the numerous hydrolysis treatments available, dilute acid was shown to be the most suitable method for industrial applications and is the most commonly applied for a variety of lignocellulosic biomasses. Our previous research [49] also indicated that acid hydrolysis would be the most appropriate form of pretreatment.
In the present study, to improve the anaerobic digestion (AD) and dark fermentation (DF) efficiency, two acid pretreatment methods were used, with 2% H2SO4 (AD-1, AD-2, DF-1, DF2) and 2% H3PO4 (AD-3, AD-4, DF-3, DF-4). We also investigated the influence of pH adjustment using NaOH (AD-1, AD-3, DF-1, DF-3) and KOH (AD-2, AD-4, DF-2, DF-4) on the fermentation in batch tests under mesophilic conditions. The AD process was carried out at pH 7 under mesophilic conditions. The DF process was conducted at approximately pH 5.5, followed by heating (1.5 h, 80 °C) to avoid methanation. The characteristics of the applied inoculum and hydrolyzed cotton fibers are presented in Table 3. The inoculum showed greater levels of nitrogen and phosphorous and very low levels of COD, as well as total and volatile solids. Compared with the representative values of nitrogen and phosphorous found in cotton hydrolysates, these concentrations were typically 200 times higher or 300 times higher. The addition of anaerobic sludge not only inoculated the substrate with microorganisms but also provided missing micro- and macroelements, as well as dilution of toxic and inhibitory substances. The lack of elements such as nitrogen or phosphorus significantly reduces the efficiency of the digestion process, even if the substrate contains high amounts of sugars. This was confirmed by our recent study, in which the addition of nitrogen and phosphate compounds was found to have a positive effect on the process of fermentation [50].
Figure 18 shows the cumulative CH4 and H2 production from four different runs (AD-1–AD-4, average pH = 7, without thermal treatment). Figure 19 shows the cumulative production from four DF experimental runs (DF-1–DF-4, average pH 5.5, with thermal pretreatment for 1.5 h at 80 °C). The final pH in the DF runs increased significantly from approximately 5.50 to 7.25 (DF-1) (Table 3). After the end of the lag phase and with rising pH, methane was also generated with the appearance of hydrogen. The process of dark fermentation did not take place, despite the application of optimal conditions [51] for the production of hydrogen. In the test with H3PO4 (DF-3), half the hydrogen production compared to the yield obtained in the test with H2SO4 (DF-1) was noted. Adjusting the pH with KOH was found to completely inhibit the production of hydrogen in contrast with using NaOH. At high concentrations, potassium was found to be toxic to anaerobic bacteria. Searmsirimongkol et al. [52] reported that potassium concentrations in the range of 2500–4500 mg·dm−3 have a strong inhibitory influence on hydrogen production, with a toxicity level of 12000 mg·dm−3. According to Zou et al. [53], acid hydrolysis of cellulose produces not only glucose but also fructose (an isomer of glucose), 5-(hydroxylmethyl)furfural (HMF, dehydration from fructose), and other carbohydrates. In particular, HMF has a negative impact on the hydrogen formation pathway. At the highest concentration, the inoculum was unable to remove the HMF, resulting in strong inhibition of the hydrogen production. Interestingly, DF had a longer lag phase (approximately 6 days) than that of AD (2 days). The lag phase of dark fermentation usually lasts only a few hours [49]. Muñoz-Páez et al. [54] suggested that lower HMF concentrations improve the production of hydrogen. However, the higher HMF content affected the adaptation time and resulted in a sixfold increase in the lag time compared with the control treatment. The HMF content in our hydrolysates was probably too high and inhibited the process. Only after microbial adaptation and partial degradation of HMF did the pH in the reactor rise and the process shifted to AD, in which the methane production (120 dm3/kgVS) was much higher than the hydrogen yield (5 dm3/kgVS) (DF-3, Table 4).
The highest methane and hydrogen production, at 278 dm3/kgVS and 42 dm3/kgVS, respectively, was recorded in the AD trial (AD-3) with pH adjustment using NaOH. This was possibly due to the pretreatment with H3PO4, which is a much weaker inhibitor than sulfuric acid. Based on our previous research, the addition of phosphorous improves the digestion process efficiency [50]. Biogas from the AD-3 run consisted of 27% CH4 and 6.5% H2. The gas released in this experimental run was qualitatively worse than in the AD-1 and AD-2 runs (46% CH4, 5% H2) (Table 4). However, the highest cumulative biohydrogen production was observed in the AF-3 run, with an increase of over 50% compared to the other experimental runs. These results were better than those obtained by Yoruklu et al. [55] from the fermentation of cotton straw. In their study, methane and hydrogen production amounted to 83 dm3/kgVS and 33 dm3/kgVS, respectively (Table 4). The lower efficiency was due to the slightly different structure of the biomass. First of all, straw contains lignin, which makes hydrolysis more difficult. In the case of AD-1, AD-2, and DF-2, an additional negative effect was caused by sulfate ions. The lowest methane production (87 dm3/kgVS) was observed in AD-2 with overlapping inhibition (potassium and sulfate ions). Moreover, hydrogen was not produced in DF-2 with the addition of sulfuric acid and potassium hydroxide and in DF-4 with the addition of KOH. This showed that the addition of potassium had a much stronger effect on the bacteria that produce hydrogen at a lower pH (approx. 5.5). Several inhibition mechanisms were reported for sulfate ions in the literature. At very high concentrations (1000 mg·dm−3), sulfate ions were found to diffuse into the microbial cell [52].

4. Conclusions

In this study, we investigated the possibility of using acid hydrolysates from cotton waste as components in fermentation broths for the production of bioethanol and biogas. Currently, most cotton textile waste is sent to landfill. Cotton textile waste may also be subjected to material recycling, i.e., converted into useable yarn or non-woven fabrics. It can also be used to produce energy via incineration/gasification. The cotton yarn hydrolysates showed great potential for replacing simple sugar solutions in fermentation media. When the cotton yarn was treated with 2% H3PO4 at 140 °C for 2 h, the concentration of glucose in the hydrolysate (13.19 g·dm−3) increased fivefold compared to the same conditions with H2SO4 (2.65 g·dm−3). The effectiveness of the process of cotton fiber hydrolysis was confirmed by SEM-EDS, FTIR-ATR, and Raman spectroscopy. The acid hydrolysis of cotton fibers led to the formation of glucose in the hydrolysate, which could therefore be a suitable medium for microorganisms and a source of bio-based products, such as bioethanol or biogas. The production of hydrogen-rich biogas is the most interesting approach. However, a relatively high methane yield of nearly 280 dm3/kgVS can also be achieved by subjecting cotton textile waste to acid hydrolysis followed by anaerobic digestion.
Most textile products contain a mixture of cotton and synthetic fibers, such as poly (ethylene terephthalate) (PET) or polyamide (PA). Polymer additives and chemicals used in the textile processes could act as fermentation inhibitors and impede the production of biofuels. Therefore, future work will focus on processing cotton textiles with synthetic fibers and textiles modified with various chemical agents. The process of biogas production requires further optimization to increase the yield per unit weight of cotton waste. Biogas could then become an additional product of the textile waste treatment process, adding economic value while also contributing to energy sustainability. The presented solution for using cotton waste to generate bio-energy is, therefore, a step forward in the creation of systems for managing the large amounts of textile waste produced each year, in line with the concept of a circular economy.

Author Contributions

Conceptualization, M.J.B., J.Z.M., M.C. and I.A.W.; methodology, M.J.B., J.Z.M., J.B., W.C.-W., M.C. and I.A.W.; formal analysis, M.J.B., J.Z.M., M.C. and I.A.W.; investigation, M.J.B., J.Z.M., J.B., M.C., D.P., W.C.-W., S.B. and I.A.W.; writing—original draft preparation, M.J.B., J.Z.M., J.B., W.C.-W., M.C. and I.A.W.; writing—review and editing, M.J.B., J.Z.M., J.B., M.C. and I.A.W.; visualization, M.J.B., J.Z.M., D.P. and W.C.-W.; supervision, I.A.W.; project administration, I.A.W. All authors have read and agreed to the published version of the manuscript.

Funding

This research was funded by the National Science Center (Poland), grant number OPUS 2019/33/B/ST8/02005.

Institutional Review Board Statement

Not applicable.

Informed Consent Statement

Not applicable.

Data Availability Statement

The data presented in this study are available on request from the corresponding author.

Acknowledgments

This article was completed while the second author was a doctoral candidate in the Interdisciplinary Doctoral School at Lodz University of Technology, Poland.

Conflicts of Interest

The authors declare no conflict of interest.

Abbreviations

ADanaerobic digestion
BTbatch test
CODchemical oxygen demand
DFdark fermentation
SGPspecific gas production
SHPspecific hydrogen production
SMPspecific methane production
TANtotal ammonium nitrogen
TStotal solids
VFAvolatile fatty acids
VSvolatile solids

References

  1. Tiseo, I. Global Waste Generation—Statistics & Facts. Available online: https://www.statista.com/topics/4983/waste-generation-worldwide/ (accessed on 18 January 2022).
  2. Ruiz, L. Global Textile Fibre Demand: Trends and Forecast. Available online: www.icac.org (accessed on 18 January 2022).
  3. Sanchis-Sebastiá, M.; Ruuth, E.; Stigsson, L.; Galbe, M.; Wallberg, O. Novel sustainable alternatives for the fashion industry: A method of chemically recycling waste textiles via acid hydrolysis. Waste Manag. 2021, 121, 248–254. [Google Scholar] [CrossRef] [PubMed]
  4. Apparel and Textiles: Trade Statistics. Available online: https://globaledge.msu.edu/industries/apparel-and-textiles/tradestats (accessed on 18 January 2022).
  5. Sandin, G.; Peters, G.M. Environmental impact of textile reuse and recycling—A review. J. Clean. Prod. 2018, 184, 353–365. [Google Scholar] [CrossRef]
  6. The Fiber Year 2009/10 A World Survey on Textile and Nonwovens Industry. Oerlikon May. 2010. Available online: https://www.oerlikon.com/ecomaXL/get_blob.php?name=The_Fibre_Year_2010_en_0607.pdf (accessed on 18 January 2022).
  7. Pensupa, N.; Leu, S.Y.; Hu, Y.; Du, C.; Liu, H.; Jing, H.; Wang, H.; Lin, C.S.K. Recent Trends in Sustainable Textile Waste Recycling Methods: Current Situation and Future Prospects. In Chemistry and Chemical Technologies in Waste Valorization; Springer, Ed.; Springer International Publishing: Cham, Switzerland, 2017; Volume 375, pp. 189–228. [Google Scholar]
  8. Ghaly, A.E.; Ananthashankar, R.; Alhattab, M.V.V.R.; Ramakrishnan, V.V. Production, Characterization and Treatment of Textile Effluents: A Critical Review. J. Chem. Eng. Process Technol. 2014, 5, 1–19. [Google Scholar] [CrossRef]
  9. The Lenzing Group. The Global Fiber Market. Available online: http://www.lenzing.com/en/investors/equity-story/global-fiber-market.html (accessed on 18 January 2022).
  10. Paul, R. Functional Finishes for Textiles: Improving Comfort, Performance and Protection; Woodhead Publishing: Cambridge, UK, 2015. [Google Scholar]
  11. Giesz, P.; Mackiewicz, E.; Grobelny, J.; Celichowski, G.; Cieślak, M. Multifunctional hybrid functionalization of cellulose fabrics with AgNWs and TiO2. Carbohydr. Polym. 2017, 177, 397–405. [Google Scholar] [CrossRef]
  12. Giesz, P.; Celichowski, G.; Puchowicz, D.; Kamińska, I.; Grobelny, J.; Batory, D.; Cieślak, M. Microwave-assisted TiO2: Anatase formation on cotton and viscose fabric surfaces. Cellulose 2016, 23, 2143–2159. [Google Scholar] [CrossRef] [Green Version]
  13. Giesz, P.; Mackiewicz, E.; Nejman, A.; Celichowski, G.; Cieślak, M. Investigation on functionalization of cotton and viscose fabrics with AgNWs. Cellulose 2017, 24, 409–422. [Google Scholar] [CrossRef] [Green Version]
  14. Nørup, N.; Pihl, K.; Damgaard, A.; Scheutz, C. Evaluation of a European textile sorting centre: Material flow analysis and life cycle inventory. Resour. Conserv. Recycl. 2019, 143, 310–319. [Google Scholar] [CrossRef]
  15. Subramanian, K.; Chopra, S.S.; Cakin, E.; Li, X.; Lin, C.S.K. Environmental life cycle assessment of textile bio-recycling—Valorizing cotton-polyester textile waste to pet fiber and glucose syrup. Resour. Conserv. Recycl. 2020, 161, 104989. [Google Scholar] [CrossRef]
  16. Leal Filho, W.; Ellams, D.; Han, S.; Tyler, D.; Boiten, V.J.; Paco, A.; Moora, H.; Balogun, A.L. A review of the socio-economic advantages of textile recycling. J. Clean. Prod. 2019, 218, 10–20. [Google Scholar] [CrossRef]
  17. Xu, Z.; Qi, R.; Xiong, M.; Zhang, D.; Gu, H.; Chen, W. Conversion of cotton textile waste to clean solid fuel via surfactant-assisted hydrothermal carbonization: Mechanisms and combustion behaviors. Bioresour. Technol. 2021, 321, 124450. [Google Scholar] [CrossRef]
  18. Alay, E.; Duran, K.; Korlu, A. A sample work on green manufacturing in textile industry. Sustain. Chem. Pharm. 2016, 3, 39–46. [Google Scholar] [CrossRef]
  19. Campbell, B.T.; Saha, S.; Percy, R.; Frelichowski, J. Status of the global cotton germplasm resources (Crop Science, (2010), 10, (1161-1179)). Crop Sci. 2010, 50, 1161–1179. [Google Scholar] [CrossRef] [Green Version]
  20. Leading Cotton Producing Countries Worldwide in 2019/2020. Available online: https://www.statista.com/statistics/263055/cotton-production-worldwide-by-top-countries/ (accessed on 18 January 2022).
  21. Ward, G.D.; Hewitt, A.D.; Russell, S.J. Fibre composition of donated post-consumer clothing in theUK. Proc. Inst. Civ. Eng. Waste Resour. Manag. 2013, 166, 29–37. [Google Scholar] [CrossRef]
  22. Patti, A.; Cicala, G.; Acierno, D. Eco-sustainability of the textile production: Waste recovery and current recycling in the composites world. Polymers 2021, 13, 134. [Google Scholar] [CrossRef]
  23. Wanassi, B.; Azzouz, B.; Hassen, M. Ben Value-added waste cotton yarn: Optimization of recycling process and spinning of reclaimed fibers. Ind. Crops Prod. 2016, 87, 27–32. [Google Scholar] [CrossRef]
  24. Cuiffo, M.; Jung, H.J.; Skocir, A.; Schiros, T.; Evans, E.; Orlando, E.; Lin, Y.C.; Fang, Y.; Rafailovich, M.; Kim, T.; et al. Thermochemical degradation of cotton fabric under mild conditions. Fash. Text. 2021, 8, 1–14. [Google Scholar] [CrossRef]
  25. Schmidt, H.; Cieślak, M. Concrete with carpet recyclates: Suitability assessment by surface energy evaluation. Waste Manag. 2008, 28, 1182–1187. [Google Scholar] [CrossRef]
  26. Wagaye, B.T.; Adamu, B.F.; Jhatial, A.K. Recycled Cotton Fibers for Melange Yarn Manufacturing. In Cotton Science and Processing Technology. Textile Science and Clothing Technology; Springer: Singapore, 2020; pp. 529–546. [Google Scholar]
  27. Bedez Ute, T.; Celik, P.; Bunyamin Uzumcu, M. Utilization of Cotton Spinning Mill Wastes in Yarn Production. In Textile Industry and Environment; IntechOpen: London, UK, 2019; pp. 1–13. [Google Scholar]
  28. Béchir, W.; Béchir, A.; Mohamed, B.H. Industrial cotton waste: Recycling, Reclaimed fiber behavior and quality prediction of its blend. Text. Appar. 2018, 28, 14–20. [Google Scholar]
  29. Wang, S.; Yu, X.; Chen, X.; Hou, W.; Niu, M. Recycling of Cotton Fibers Separated from the Waste Blend Fabric. J. Nat. Fibers 2020, 17, 520–531. [Google Scholar] [CrossRef]
  30. Sun, X.; Lu, C.; Liu, Y.; Zhang, W.; Zhang, X. Melt-processed poly(vinyl alcohol) composites filled with microcrystalline cellulose from waste cotton fabrics. Carbohydr. Polym. 2014, 101, 642–649. [Google Scholar] [CrossRef]
  31. Low, J.H.; Rahman, W.A.W.A. Plant fibers: Renewable reinforcing filler in polyolefin bio-composites. In Natural Fibers; Kozlowski, R.M., Muzyczek, M., Eds.; Nova Science Publishers, Inc.: Hauppauge, NY, USA, 2017; pp. 303–324. ISBN 978-1-53612-071-4. [Google Scholar]
  32. Hsieh, Y.L. Chemical structure and properties of cotton. Cott. Sci. Technol. 2006, 3–34. [Google Scholar] [CrossRef]
  33. Degani, O. Synergism between Cutinase and Pectinase in the Hydrolysis of Cotton Fibers’ Cuticle. Catalysts 2021, 11, 84. [Google Scholar] [CrossRef]
  34. Szymański, Ł.; Grabowska, B.; Kurleto, Ż.; Kaczmarska, K. Celuloza i jej pochodne—Zastosowanie w przemyśle. Arch. Foundry Eng. 2015, 15, 129–132. [Google Scholar]
  35. Huang, Y.B.; Fu, Y. Hydrolysis of cellulose to glucose by solid acid catalysts. Green Chem. 2013, 15, 1095–1111. [Google Scholar] [CrossRef]
  36. Håkansson, H.; Ahlgren, P. Acid hydrolysis of some industrial pulps: Effect of hydrolysis conditions and raw material. Cellulose 2005, 12, 177–183. [Google Scholar] [CrossRef]
  37. Sasaki, C.; Kiyokawa, A.; Asada, C.; Nakamura, Y. Glucose and Valuable Chemicals Production from Cotton Waste Using Hydrothermal Method. Waste Biomass Valorization 2019, 10, 599–607. [Google Scholar] [CrossRef]
  38. Dahlbo, H.; Aalto, K.; Eskelinen, H.; Salmenperä, H. Increasing textile circulation—Consequences and requirements. Sustain. Prod. Consum. 2017, 9, 44–57. [Google Scholar] [CrossRef]
  39. Ioelovich, M. Study of Cellulose Interaction with Concentrated Solutions of Sulfuric Acid. ISRN Chem. Eng. 2012, 2012, 428974. [Google Scholar] [CrossRef] [Green Version]
  40. Nguyen, T.M.; Chang, S.C.; Condon, B.; Thomas, T.P.; Azadi, P. Thermal decomposition reactions of cotton fabric treated with piperazine-phosphonates derivatives as a flame retardant. J. Anal. Appl. Pyrolysis 2014, 110, 122–129. [Google Scholar] [CrossRef]
  41. Puchowicz, D.; Nejman, A.; Kamińska, I.; Cieślak, M. Effect of Reactive Dyeing on Fabrics Modification with Silver Nanowires (AgNWs). ACS Omega 2021, 6, 26077–26085. [Google Scholar] [CrossRef]
  42. Binczarski, M.J.; Malinowska, J.; Stanishevsky, A.; Severino, C.J.; Yager, R.; Cieslak, M.; Witonska, I.A. A Model Procedure for Catalytic Conversion of Waste Cotton into Useful Chemicals. Materials 2021, 14, 1981. [Google Scholar] [CrossRef] [PubMed]
  43. Woo, K.S.; Kim, H.Y.; Hwang, I.G.; Lee, S.H.; Jeong, H.S. Characteristics of the Thermal Degradation of Glucose and Maltose Solutions. Prev Nutr Food Sci. 2015, 20, 102–109. [Google Scholar] [CrossRef] [PubMed] [Green Version]
  44. Garside, P.; Wyeth, P. Identification of cellulosic fibres by FTIR spectroscopy: Differentiation of flax and hemp by polarized ATR FTIR. Stud. Conserv. 2006, 51, 205–211. [Google Scholar] [CrossRef]
  45. Kavkler, K.; Demšar, A. Examination of cellulose textile fibres in historical objects by micro-Raman spectroscopy. Spectrochim. Acta—Part A Mol. Biomol. Spectrosc. 2011, 78, 740–746. [Google Scholar] [CrossRef]
  46. Puchowicz, D.; Cieslak, M. Raman Spectroscopy in the Analysis of Textile Structures. In Recent Developments in Atomic Force Microscopy and Raman Spectroscopy for Materials Characterization; IntechOpen: London, UK, 2022. [Google Scholar]
  47. Modelska, M.; Berlowska, J.; Kregiel, D.; Cieciura, W.; Antolak, H.; Tomaszewska, J.; Binczarski, M.; Szubiakiewicz, E.; Witonska, I.A. Concept for Recycling Waste Biomass from the Sugar Industry for Chemical and Biotechnological Purposes. Molecules 2017, 22, 1544. [Google Scholar] [CrossRef] [Green Version]
  48. Wakelyn, P.J.; Bertoniere, N.R.; French, A.D.; Thibodeaux, D.P.; Triplett, B.A.; Rousselle, M.A.; Goynes, W.R., Jr.; Edwards, J.V.; Hunter, L.; McAlister, D.D. Cotton Fiber Chemistry and Technology; CRC Press: Boca Raton, 2007; ISBN 9780429141263. [Google Scholar]
  49. Cieciura-Włoch, W.; Binczarski, M.; Tomaszewska, J.; Borowski, S.; Domański, J.; Dziugan, P.; Witońska, I. The use of acid hydrolysates after furfural production from sugar waste biomass as a fermentation medium in the biotechnological production of hydrogen. Energies 2019, 12, 3222. [Google Scholar] [CrossRef] [Green Version]
  50. Cieciura-Włoch, W.; Borowski, S.; Domański, J. Dark fermentative hydrogen production from hydrolyzed sugar beet pulp improved by nitrogen and phosphorus supplementation. Bioresour. Technol. 2021, 340, 125622. [Google Scholar] [CrossRef]
  51. Cieciura-Włoch, W.; Borowski, S. Biohydrogen production from wastes of plant and animal origin via dark fermentation. J. Environ. Eng. Landsc. Manag. 2019, 27, 101–113. [Google Scholar] [CrossRef]
  52. Searmsirimongkol, P.; Rangsunvigit, P.; Leethochawalit, M.; Chavadej, S. Hydrogen production from alcohol distillery wastewater containing high potassium and sulfate using an anaerobic sequencing batch reactor. Int. J. Hydrogen Energy 2011, 36, 12810–12821. [Google Scholar] [CrossRef]
  53. Zou, J.; Zhang, G.; Xu, X. One-pot photoreforming of cellulosic biomass waste to hydrogen by merging photocatalysis with acid hydrolysis. Appl. Catal. A Gen. 2018, 563, 73–79. [Google Scholar] [CrossRef]
  54. Muñoz-Páez, K.M.; Alvarado-Michi, E.L.; Buitrón, G.; Valdez-Vazquez, I. Distinct effects of furfural, hydroxymethylfurfural and its mixtures on dark fermentation hydrogen production and microbial structure of a mixed culture. Int. J. Hydrogen Energy 2019, 44, 2289–2297. [Google Scholar] [CrossRef]
  55. Civelek Yoruklu, H.; Koroglu, E.O.; Ozdemir, O.K.; Demir, A.; Ozkaya, B. Bioenergy production from cotton straws using different pretreatment methods. Int. J. Hydrogen Energy 2020, 45, 34720–34729. [Google Scholar] [CrossRef]
Figure 1. (a) Macroscopic photo of the cotton yarn used in this study; (b) SEM image at 30× magnification of the cotton yarn; (c) SEM image at 500× magnification of the cotton yarn.
Energies 15 02856 g001
Figure 2. Glucose concentration in hydrolysates depending on the temperature of hydrolysis. Reaction conditions: 2 h, 2% H2SO4. Glucose concentrations were the arithmetic mean of the results obtained in the three hydrolysis processes with the standard deviations: 1.739 ± 0.157; 3.336 ± 0.167; 3.343 ± 0.137.
Energies 15 02856 g002
Figure 3. SEM pictures of the solid residue after hydrolysis of cotton, depending on the temperature of the process (2 h, 2% H2SO4): cotton treated at (a) 120 °C, (b) 140 °C, (c) 160 °C, and (d) 200 °C.
Energies 15 02856 g003
Figure 4. IR spectra of (a) washed cotton and cotton treated for 2 h with 2% H2SO4 at various temperatures: (b) 120 °C; (c) 140 °C; (d) 160 °C; (e) 200 °C.
Energies 15 02856 g004
Figure 5. Raman spectra of (a) washed cotton and cotton treated for 2 h with 2% H2SO4 at various temperatures: (b) 120 °C; (c) 140 °C; (d) 160 °C; (e) 200 °C.
Energies 15 02856 g005
Figure 6. Glucose concentration in hydrolysates, depending on the concentration of the acid used. Reaction conditions 2 h, 120 °C. Glucose concentrations were the arithmetic means of the results obtained in three hydrolysis processes with the standard deviations: 0.277 ± 0.055; 1.739 ± 0.157; 3.216 ± 0.154; 3.323 ± 0.263.
Energies 15 02856 g006
Figure 7. SEM photos of the solid residue after hydrolysis (120 °C, 2 h) of cotton with various concentrations of H2SO4: (a) 0.5%; (b) 2%; (c) 5%; (d) 10%.
Energies 15 02856 g007
Figure 8. IR spectra of (a) washed cotton and cotton treated at 120 °C for 2 h with various concentrations of H2SO4: (b) 0.5%; (c) 2%; (d) 5%; (e) 10%.
Energies 15 02856 g008
Figure 9. Raman spectra of (a) washed cotton and cotton treated at 120 °C for 2 h with various concentrations of H2SO4: (b) 0.5%; (c) 2%; (d) 5%; (e) 10%.
Energies 15 02856 g009
Figure 10. Glucose concentration in hydrolysates, depending on the time of the process. Reaction conditions: 120 °C, 2% H2SO4. Glucose concentrations were the arithmetic means of the results obtained in the three hydrolysis processes with the standard deviations: 1.43 ± 0.16; 1.739 ± 0.16; 1.85 ± 0.15; 2.74 ± 0.19; 2.91 ± 0.24; 3.52 ± 0.33.
Energies 15 02856 g010
Figure 11. SEM pictures of the solid residue after various hydrolysis times (120 °C, 2% H2SO4): cotton treated for (a) 1 h, (b) 2 h, (c) 3 h, (d) 4 h, (e) 6 h, and (f) 8 h.
Energies 15 02856 g011
Figure 12. IR spectra of (a) washed cotton and cotton treated at 120 °C with 2% H2SO4 for various reaction times: (b) 1 h; (c) 2 h; (d) 3 h; (e) 4 h; (f) 6 h; (g) 8 h.
Energies 15 02856 g012
Figure 13. Raman spectra of (a) washed cotton and cotton treated at 120 °C with 2% H2SO4 for various reaction times: (b) 1 h; (c) 2 h; (d) 3 h; (e) 4 h; (f) 6 h; (g) 8 h.
Energies 15 02856 g013
Figure 14. Glucose concentration in hydrolysates, depending on the type of acid used. Reaction conditions: 2 h, 140 °C, 2% H2SO4 or 2% H3PO4. Glucose concentrations were the arithmetic means of the results obtained in the three hydrolysis processes with the standard deviations: 2.694 ± 0.172; 13.19 ± 0.475.
Energies 15 02856 g014
Figure 15. SEM pictures of the solid residue after hydrolysis (140 °C; 2 h), depending on the type of acid used: (a) cotton treated 2% H2SO4; (b) cotton treated 2% H3PO4.
Energies 15 02856 g015
Figure 16. Yeast growth curves for Saccharomyces cerevisiae Ethanol Red strain in fermentation media: (a) uninoculated medium–reference sample; (b) hydrolysate following treatment at 140 °C, 2 h, 2% H2SO4; (c) hydrolysate following treatment at 140 °C, 2 h, 2% H3PO4. The curves show the mean values obtained in three independent measurements.
Energies 15 02856 g016
Figure 17. Yeast growth curves for the Saccharomyces cerevisiae Tokay LOCK0204 strain in fermentation media: (a) uninoculated medium—reference sample; (b) hydrolysate following treatment at 140 °C, 2 h, 2% H2SO4; (c) hydrolysate following treatment at 140 °C, 2 h, 2% H3PO4. The curves show the mean values obtained in three independent measurements.
Energies 15 02856 g017
Figure 18. Daily average specific hydrogen and methane production from cotton hydrolyzed in AD systems (mesophilic conditions) with (A) H2SO4 neutralized with NaOH, (B) H2SO4 neutralized with KOH, (C) H3PO4 neutralized with NaOH, and (D) H3PO4 neutralized with KOH.
Energies 15 02856 g018
Figure 19. Daily average specific hydrogen and methane production from cotton hydrolyzed in DF systems (mesophilic conditions) with (A) H2SO4 neutralized with NaOH, (B) H2SO4 neutralized with KOH, (C) H3PO4 neutralized with NaOH, and (D) H3PO4 neutralized with KOH.
Energies 15 02856 g019
Table 1. IR and Raman characteristic bands of cotton.
IR [cm−1]Description [44]Raman [cm−1]Description [45,46]
330, 383CCC, CCO ring deformation
1029C-OH alcohol stretching437, 461CCC ring deformation
1053C-OH alcohol stretching523COC glycosidic linkage deformation
1106COC in glycosodic linkage stretching902, 1001CH skeletal rotation
1160CCC ring asymmetric stretching1101COC glycosidic ring breathing symmetric stretching
1314CH bending1122COC glycosodic ring breathing asymmetric stretching
1426CH bending1344CH2 vibration
1600H2O adsorbed1385CH2 vibration
2916CH stretching1484CH2 vibration
3333OH stretching2900CH stretching
Table 2. Yeast cell multiplication.
StrainCultivation TimeMedium
Hydrolysate following Treatment at 140 °C, 2 h, 2% H2SO4Hydrolysate following Treatment at 140 °C, 2 h, 2% H3PO4
Colony forming units [cfu/cm3]Saccharomyces cerevisiae
Ethanol Red
0 h1.8 · 1061.7 · 106
48 h6.8 · 1078.6 · 107
72 h9.2 · 1071.0 · 108
Saccharomyces cerevisiae
Tokay ŁOCK0204
0 h1.1 · 1061.4 · 106
48 h3.5 · 1075.5 · 107
72 h5.2 · 1078.7 · 107
Table 3. Characteristics of undiluted substrates used for batch tests.
IndicatorUnitInoculumCotton Hydrolysate (H2SO4)Cotton Hydrolysate (H3PO4)
pH-7.47 ± 0.125.51 ± 0.155.83 ± 0.09
Total solidsg/kg17.81 ± 0.6829.04 ± 1.0827.64 ± 1.21
Volatile solidsg/kg11.85 ± 0.3926.48 ± 1.1125.03 ± 1.36
CODgO2/kg3.14 ± 0.047.18 ± 0.066.45 ± 0.02
Glucoseg/dm3-2.48 ± 0.0510.56 ± 0.02
TANmgN/dm3233.82 ± 0.122.13 ± 0.011.79 ± 0.02
P-PO43-mgP/dm3308.25 ± 3.770.76 ± 0.014.89 ± 0.01
IronmgFe/dm30.30 ± 0.010.28 ± 0.010.35 ± 0.01
± standard deviation.
Table 4. Operating parameters and performance of batch tests to establish the optimal inoculum/SBP ratio.
Experimental Run
IndicatorUnitAD-1AD-2AD-3AD-4DF-1DF-2DF-3DF-4
TSg/kg67.16 ± 1.0870.06 ± 0.5250.90 ± 0.6752.99 ± 1.2567.16 ± 1.0870.06 ± 0.5250.90 ± 0.6752.99 ± 1.25
VSg/kg36.77 ± 1.1135.65 ± 0.8732.07 ± 0.9732.64 ± 1.3536.77 ± 1.1135.65 ± 0.8732.07 ± 0.9732.64 ± 1.35
Hydrolysis 2% H2SO42% H2SO42% H3PO42% H3PO42% H2SO42% H2SO42% H3PO42% H3PO4
NaOHKOHNaOHKOHNaOHKOHNaOHKOH
X/S *gVS/gVS2:12:12:12:12:12:12:12:1
Inoculumg300 ± 0.25300 ± 0.25300 ± 0.25300 ± 0.25200 ± 0.25200 ± 0.25200 ± 0.25200 ± 0.25
Substrateg48.34 ± 1.2549.86 ± 2.4755.43 ± 1.8254.46 ± 2.1548.34 ± 1.2549.86 ± 2.4755.43 ± 1.8254.46 ± 2.15
pHinitial-7.11 ± 0.097.02 ± 0.127.09 ± 0.177.12 ± 0.085.51 ± 0.155.48 ± 0.065.53 ± 0.185.47 ± 0.15
pHend-7.61 ± 0.056.33 ± 0.106.52 ± 0.0867.32 ± 0.157.25 ± 0.026.50 ± 0.136.22 ± 0.247.10 ± 0.23
Durationdays3030303030303030
Cumulative biogas volumecm3/d785.00 ± 8.05694.00 ± 6.021940.00 ± 10.541160.00 ± 9.25500.00 ± 4.12249.00 ± 1.08100.00 ± 0.56630.00 ± 2.68
SGPNdm3/kgVSfeed435.69 ± 3.45198.67 ± 3.15687.61 ± 7.28407.18 ± 2.70316.36 ± 4.62217.47 ± 2.49318.99 ± 1.47138.20 ± 3.58
SHPNdm3H2/kgVS20.64 ± 1.5210.53 ± 0.9842.47 ± 2.459.15 ± 0.9618.18 ± 0.920.00 ± 0.005.08 ± 0.580.00 ± 0.00
SMPNdm3CH4/kgVS195.56 ± 6.4886.59 ± 9.56277.61 ± 15.0494.97 ± 1.2056.86 ± 1.000.00 ± 0.00120.22 ± 8.440.00 ± 0.00
H2 content%4.93 ± 0.255.31 ± 0.486.55 ± 0.783.92 ± 1.289.15 ± 1.060.00 ± 0.002.59 ± 0.540.00 ± 0.00
CH4 content%45.83 ± 2.0245.76 ± 3.2527.01 ± 2.0135.10 ± 2.0021.04 ± 2.000.00 ± 0.0044.00 ± 1.770.00 ± 0.00
CO2 content%16.00 ± 0.6212.00 ± 0.1411.00 ± 0.689.00 ± 0.205.00 ± 0.540.00 ± 0.0012.00 ± 1.085.00 ± 0.04
H2S contentppm986.00 ± 0.00640.00 ± 0.0921.00 ± 0.0810.00 ± 0.1426.00 ± 0.0521.00 ± 0.0039.00 ± 2.5613.00 ± 0.53
TANmgN/dm3120.24 ± 0.02138.35 ± 0.02159.76 ± 0.0285.65 ± 0.02230.59 ± 0.02293.18 ± 0.02224.00 ± 0.02105.41 ± 0.02
P-PO43−mgP/dm3156.63 ± 0.02132.48 ± 0.02206.88 ± 0.02301.52 ± 0.02229.73 ± 0.02168.38 ± 0.02194.48 ± 0.02246.04 ± 0.02
* inoculum/substrate ratio, ± standard deviation.
Publisher’s Note: MDPI stays neutral with regard to jurisdictional claims in published maps and institutional affiliations.

