1. Introduction
Increasing energy demands from all sectors, a growing world population, and a sharp reduction in low-cost fossil fuel sources worldwide are a few of the most critical matters facing the planet in the 21st century. Importantly, the use of fossil fuels is polluting the environment in alarming dimensions, and they cannot therefore be deemed as everlasting or viable options for worldwide energy necessities. As the use of fossil fuels surges around the world, community air quality deteriorates and greenhouse gas (GHG) emissions escalate, causing the deleterious global warming or climate change [
1,
2]. Climate change remains a serious problem affecting every facet of the natural environment. Scientists acknowledge that its occurrence is from natural sources; however, it is directly traceable to anthropogenic actions and several scientific studies definitively affirm that global warming is responsible for harshly and unfavorably altering the balance in the Earth’s climate via emissions of harmful GHGs. On 12 December 2015, 194 countries signed the Paris Agreement [
3,
4], with its main objective being to limit the global temperature increase to 1.5 °C from pre-industrial levels. Since then, many states have been conducting research to identify the sectors in which performance can be improved to enable attainment of this target. Vehicles are a significant aspect of the concern, both domestically and internationally. Road transport represents a substantial part of total energy consumption in the transport sector, with nearly 45% of total energy use attributed to road transport, especially by heavy-duty vehicles (HDVs), which consume more than half of this amount [
5,
6]. Notably, road freight transport relies heavily on fossil fuels, and medium- and heavy-duty freight trucks account for 24% of total oil-based fuel utilization [
5,
6]. Diesel is the primary fuel utilized in road freight transport, and it accounts for 84% of all oil commodities consumed, and half of the total diesel demand. In spite of their comparatively small portion in road vehicles, medium-duty vehicles (MDVs) and HDVs contribute excessively to transport GHG, air-polluting emissions, and fossil fuel consumption. This is because of the high rate of fuel consumption by trucks, the substantial distances they travel annually, and extended idling periods. In the European Union, HDVs are responsible for approximately 30% of traffic GHG emissions, despite having only 4% of the physical traffic fleet [
6]. Correspondingly, in the United States, MDVs and HDVs represent 26% of transport GHG emissions [
5,
6]. Moreover, road cargo trucks generate half of particulate matter (PM) emissions and one third of nitrogen oxide (NO
x) emissions of the transport segment in municipalities [
5,
6]. Importantly, diesel exhaust emission is categorized as carcinogenic to humans (Group 1) by the World Health Organization (WHO) [
7]. In Canada, in 2018, the transport segment represented the second greatest quantity of GHG emissions, contributing to 25% (185 mega tonnes of CO
2 equivalent) of overall nationwide emissions. Moreover, in Canada, between 1990 and 2018, GHG emissions from the transport sector rose by 53%. This augmentation in emissions was principally directed by rises in cargo trucks and commuter light trucks [
8,
9,
10].
Conventionally, most commercial merchandise in North America is transported by road in heavy-duty trucks. It is safe to say that these trucks transport approximately 90% of the total volume of customer goods and foods from Canada to the United States [
11]. Although these commercial transactions, which are facilitated by road transport, are evidently critical to economic growth and sustenance, they are nevertheless a main cause of dangerous GHGs, with more than 10.5% of GHG emissions emanating from cargo transport by heavy-duty trucks [
10,
12]. With projected expansions in truck activities and fewer vehicles having optimized efficiency when compared to light vehicles, emissions from cargo are projected to surpass comparable emissions from commuter transport towards 2030. It is thus critical to reinforce the promotion of a change to cleaner energy for trucking. This must be a leader of climate action plans across the planet if total emissions are to be reduced by 45–50% from 2010 levels by or before 2030 [
10,
12].
As mentioned earlier, the massive long-haul, heavy-duty (LHHD) trucking in Canada’s economy causes a significantly harmful effect to Canada’s ecosystem due to carbon emissions caused by the trucks’ use of diesel fuel. Owing to its low efficiency and high carbon output, it is imperative to consider alternative, greener fuels. Making a change to alternative fuels in the long-haul trucking industry also involves the significant matter of refuelling. Currently, long-haul trucks are refuelled by thousands of diesel fuel stations located throughout Canada’s major highways. This phenomenon necessitates a study of the technical and economic feasibility involved in constructing a network of refuelling stations using alternative fuels, which have the capacity to support the long-haul truck industry.
This paper focuses on refuelling infrastructure for long-haul, heavy-duty (LHHD) trucks, and, in particular, the conversion of the main source of fuel from diesel to hydrogen. Hydrogen was selected because it can be used as an energy carrier in modified internal combustion engines (ICEs), which eliminates the need to purchase new vehicles. The current diesel engines can be readily adapted to support hydrogen fuel, thus rendering the implementation of hydrogen both easy and cost-effective compared to implementing fuel cells.
The use of hydrogen will be as safe as other fuels if suitable standards are observed and safe operational procedures are respected. When stored at high pressures, the common regulations and standards for pressurized gas tanks and usage must be fulfilled, and detection systems must be utilized to prevent any accident or failure of components that may occur due to hydrogen attack or hydrogen embrittlement [
1,
2,
13,
14,
15,
16]. All components employed in hydrogen refuelling stations must be certified by the applicable safety authority. For instance, the California Energy Commission in the United States categorized 153 potential failure modes at hydrogen delivery stations by means of liquid hydrogen and/or compressed gas hydrogen stations, and at on-site hydrogen generation stations via steam methane reforming (SMR) and electrolysis hydrogen production. In the case of stations with electrolysers, there are two low-potential failure types and one medium-potential failure type. Tube trailers have medium-potential failure types, such as dispenser cascade control failure plus hydrogen leaks as a result of trailer influence in accidents [
2,
17].
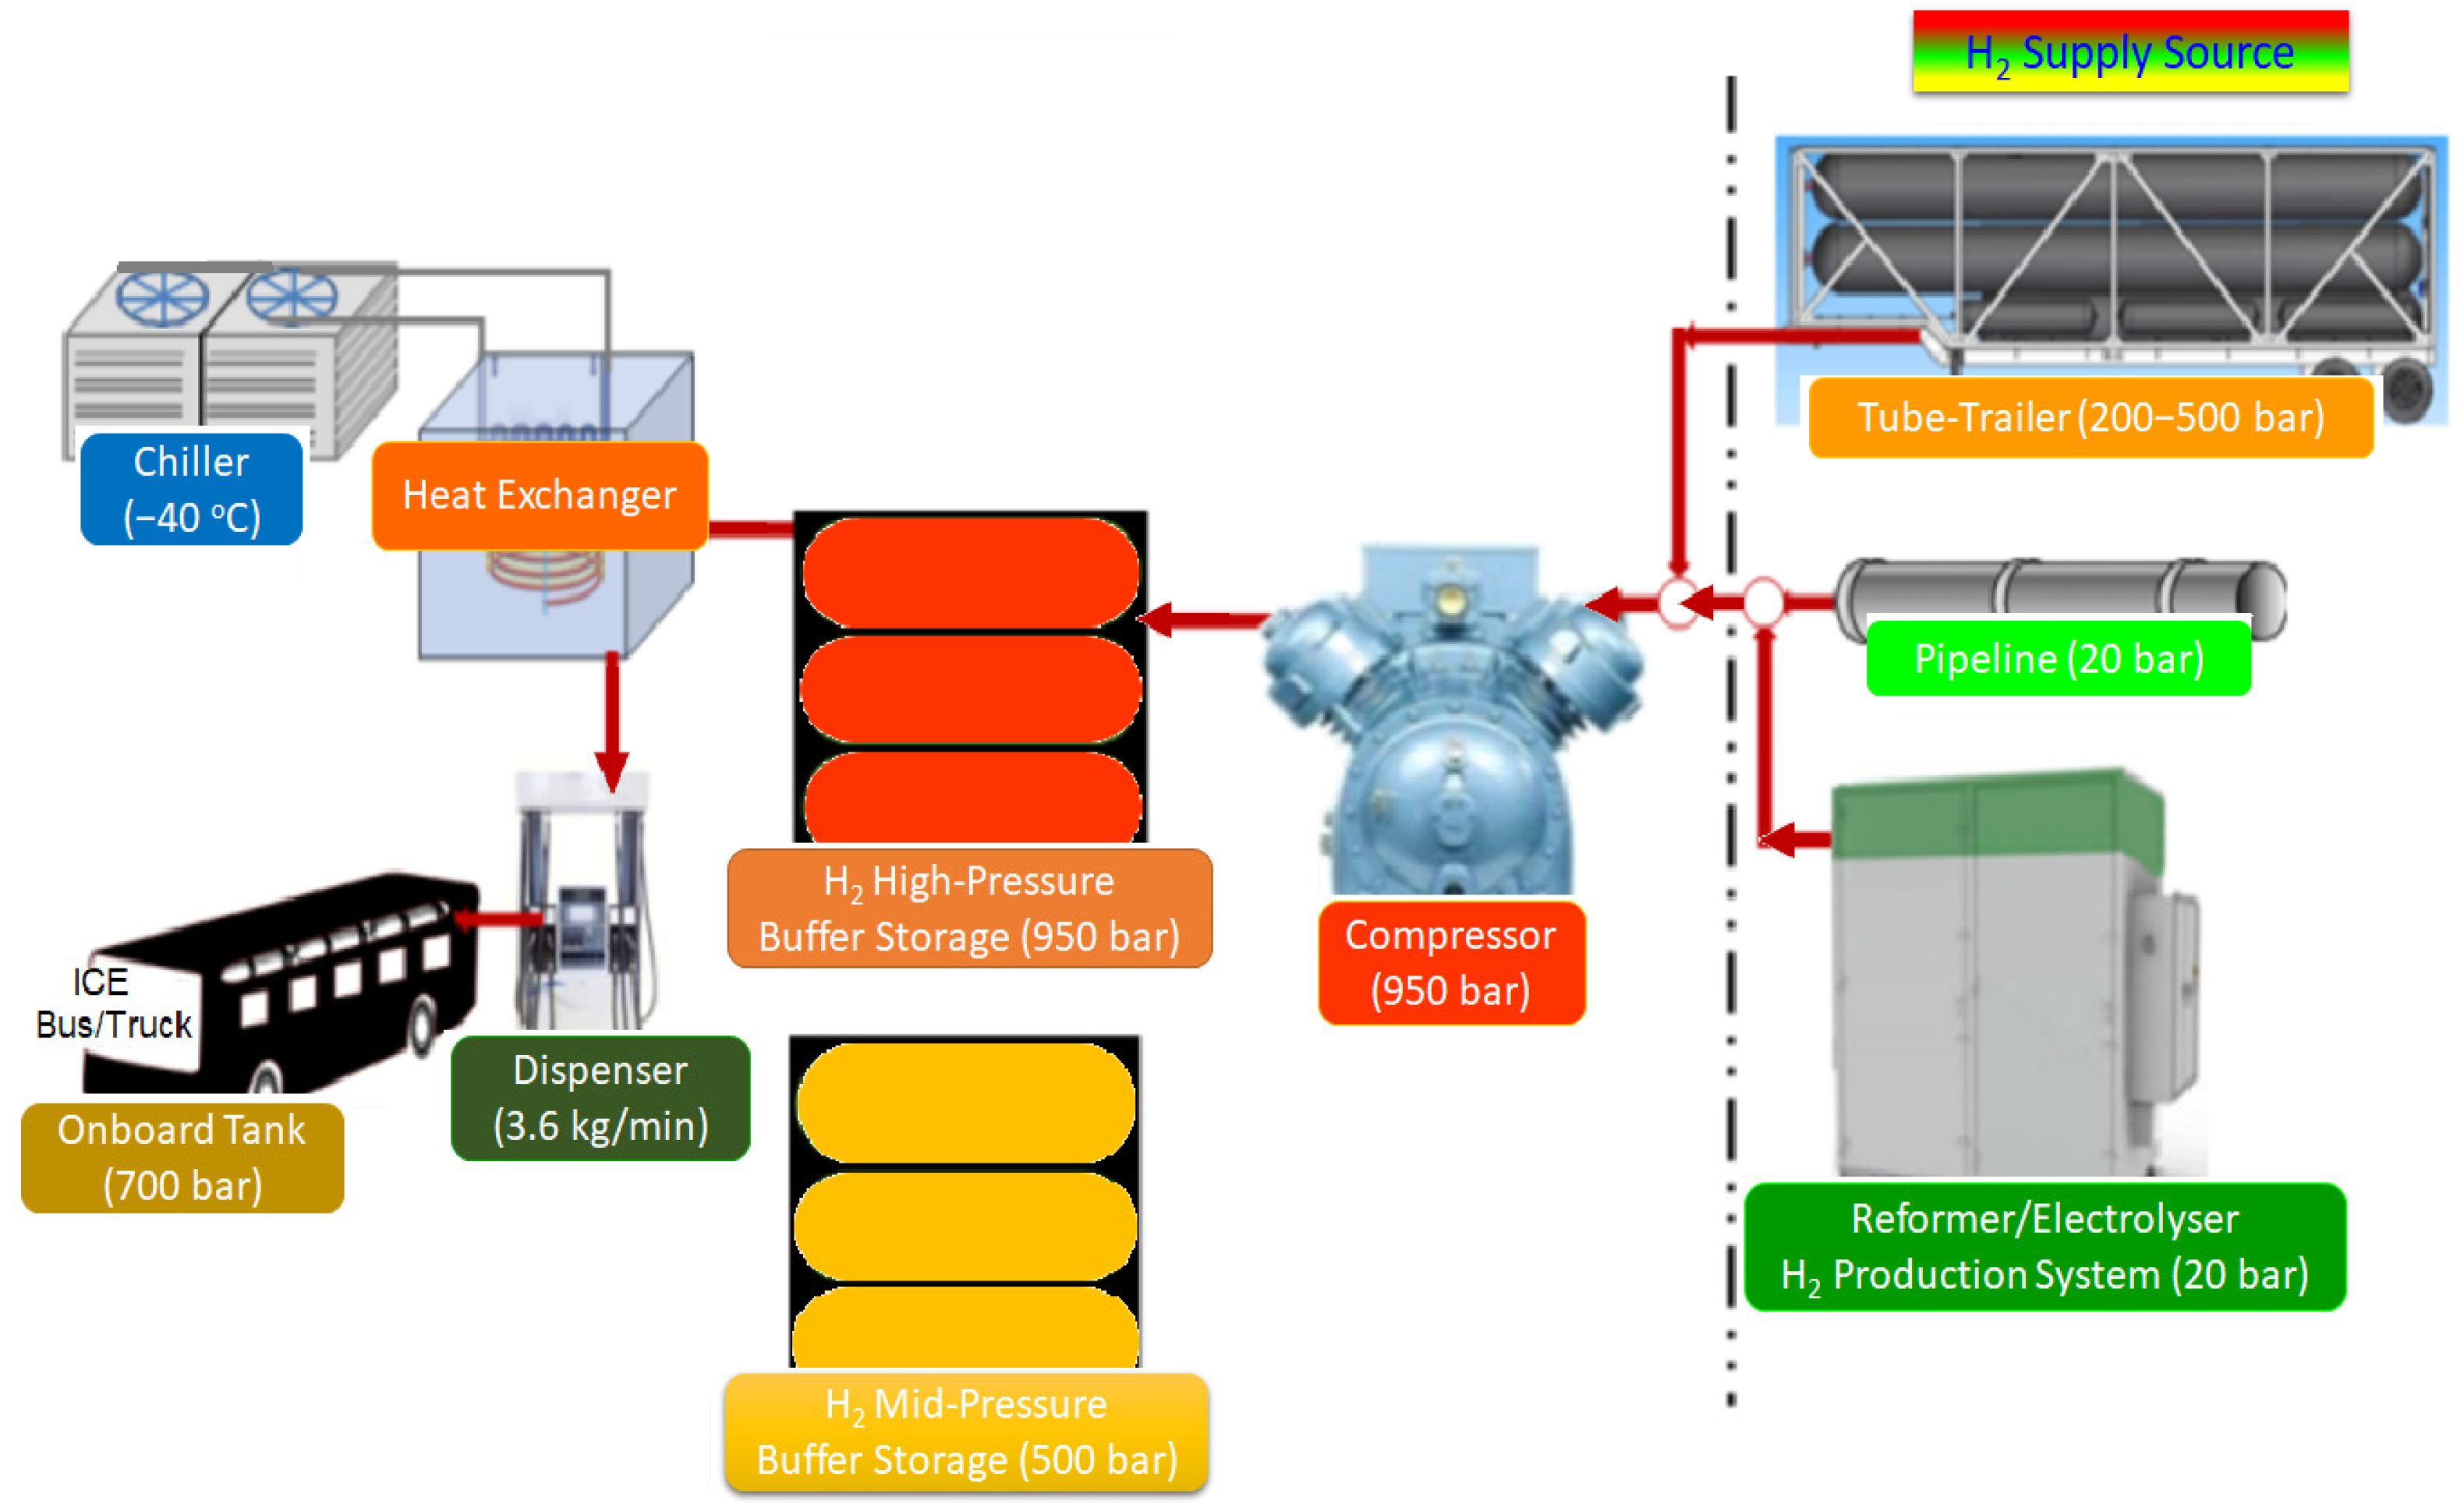
Two kinds of hydrogen fuelling stations exist. They are: (i) Type 1 stations in which the hydrogen is produced elsewhere and delivered to the station for local storage and dispensing to vehicles; (ii) Type 2 stations in which hydrogen is produced onsite, and stored in readiness for transfer to in-vehicle hydrogen storage. Some stations may be a combination of both types, using distributed hydrogen to increase onsite production as necessary. Once the hydrogen is obtained, hydrogen stations operate in the same manner as those of conventional gasoline or NG stations—for instance, storing hydrogen in a tank, transporting it to a dispenser, and then filling on-board hydrogen tanks as hydrogen-powered vehicles encompass refuelling. Hydrogen dispensers for high pressure tolerate a physical similarity to liquefied petroleum gas (LPG) or compressed NG dispensers and connect to vehicle tanks in an analogous mode. In Type 1 stations with hydrogen delivery, hydrogen is manufactured offsite at an industrial plant (commonly petrochemical) and supplied to the site by means of a pipeline, road or rail tanker, or ship. In an onsite hydrogen filling station, numerous manufacturing processes can be utilized to produce the hydrogen from nearby accessible energy and raw materials such as water, fossil fuels, or renewable fuels. In Type 2 stations with onsite hydrogen generation, hydrogen can be manufactured through one of the hydrogen production processes determined by the energy resource. Some of these processes exploit a renewable energy system such as solar or wind energy (green hydrogen), whereas others employ a fossil fuel resource. The two principal processes of onsite hydrogen production are water electrolysis and SMR [
2]. More details on this topic can be found in [
1,
2,
17,
18,
19,
20,
21].
Figure 1, adapted from [
22], illustrates the basic components and arrangements of hydrogen refuelling stations.
One major obstacle encountered in attempting to convert long-haul, heavy-duty truck fleets to hydrogen is the lack of current refuelling infrastructure. Irrespective of the percentage of the truck fleet that is adapted to hydrogen, it is required to have a refuelling network that is safe, accessible, and economically feasible. The final selling price of hydrogen is a definite indicator of the feasibility (or otherwise) of investing in such infrastructure. If the selling price is proved modest and reasonable compared to that of diesel, then it can be deemed economically justifiable to execute such a project. Elements that go into the final selling price of hydrogen will comprise the project capital costs, operational costs, and the amount of fuel required to support a fleet of trucks.
As evidenced by the literature that has been discussed extensively in
Section 2, there has not been any notable technical or economic feasibility study or other work carried out on hydrogen refuelling infrastructure for hydrogen-fuelled ICE-powered LHHD trucks under differing operating conditions, delivery methods and their associated costs, varying input parameters of daily truck traffic flow and distance between refuelling stations, and for varying technology integration factors. Furthermore, most existing refuelling stations that have been assessed or implemented have a relatively low capacity. The hydrogen refuelling infrastructure considered in this contribution is significantly larger than what currently exists.
Therefore, building on and extending the work of the authors [
21], this paper seeks to assess the feasibility of realizing a nationwide network of hydrogen refuelling stations with the objective of assisting in converting ICE-LHHD trucks from diesel fuel to hydrogen. This measure is adopted in an attempt to decrease vehicle emissions, and reinforce responsibilities to the climate change policies.
In the authors’ previous work, two methods based on constant traffic and variable traffic, with data on hydrogen gas infrastructure and vehicles, were developed to assess fuelling situations for LHHD trucks. In addition, an economic analysis was performed on various test cases to examine the effect of different variables on the final selling price of compressed hydrogen gas.
In the present paper, the investigation discussed involves performing a detailed techno-economic feasibility analysis of hydrogen refuelling infrastructure for LHHDVs under variable truck traffic flows.
A model was constructed to evaluate various important parameters related to the nationwide integration of these stations. These parameters include: (i) the capital costs per refuelling station, (ii) normalized investment cost, and (iii) the price of fuel sold at the pumps.
This model compares the feasibility of different delivery methods and their associated costs in order to optimize the transition to hydrogen fuel stations as well as the ongoing operations. In general, these delivery methods involve (i) truck delivery, (ii) pipeline fed fuel, and (iii) onsite production of fuel. These options are not only common across Canada, but are relatively low in cost, thus making them ideal for this study.
In order to accurately model this for Canada-wide integration, these models are assessed using (i) varying input parameters of daily long-haul truck traffic flow and (ii) distance between refuelling stations. These multiple test cases allow for a spread of normalized cost data, which are then compared to Canada’s major long-haul trucking routes to predict the total investment cost that will be required to construct these stations.
Furthermore, this model is tested for varying technology integration factors to determine the feasibility of these refuelling stations depending on the number of long-haul, heavy-duty trucks equipped for hydrogen fuel. This is also important to predict the optimal refuelling station operation for increasing hydrogen fuel technology usage across Canada.
The objective of this work is to acquire a spread of data for varying scenarios, which is useful in planning the transition to hydrogen fuel. These data can then be used to design the nationwide refuelling station infrastructure in the best case for emissions, total investment, economic growth, and sustainability. The techno-economic model developed in this investigation will be valuable to design and optimize new and more efficient hydrogen refuelling stations.
2. Literature Review
There have been numerous works on hydrogen refuelling infrastructure [
21,
22,
23,
24,
25,
26,
27,
28,
29,
30,
31,
32]. For instance, the following researchers have carried out interesting studies on hydrogen refuelling stations.
Rothuizen et al. [
23] developed a dynamic model to evaluate and optimize the thermodynamics and design of hydrogen refuelling stations. Their model was based on Dymola software. They simulated the designs of two refuelling stations and compared them to each other. Their results indicated that pressure loss in a vehicle’s storage system is one of the main determinants of the mass flow and peak cooling conditions of the refuelling process.
Rothuizen et al. [
24] analyzed the power consumption of refuelling stations as a function of the following indices: number of tanks, volume of the tanks, and the pressures in the tanks for a whole refuelling cycle. Their results showed that energy consumption decreases with the number of tanks, approaching an exponential function.
Melaina and Penev [
25] contributed to knowledge by comparing hydrogen station cost estimates (provided by expert stakeholders through the Hydrogen Station Cost Calculation (HSCC)) to a select number of other cost estimates. Results from the HSCC do not distinguish between stations, which have different production or delivery timelines. Rather, the cost estimates and reduction trends apply generally to various kinds of hydrogen stations, which are likely to be installed over the next 5 to 10 years. The researchers summarized HSCC results for each of four station classifications according to indices.
Reddi et al. [
26] developed a refuelling model to assess the effect of several refuelling compression and storage configurations and tube trailer operating strategies on the cost of hydrogen refuelling. Their modelling results showed that a number of strategies could be utilized to decrease fuelling costs. These include proper sizing of the high-pressure buffer storage, which reduces the compression requirement considerably, and thereby reduces refuelling costs. Another approach is to employ a tube trailer to firstly fill the vehicle’s tank to reduce the compression and storage requirements, and thus further reduce refuelling costs.
Reddi et al. [
27,
28] performed a techno-economic and thermodynamic study of precooling units (PCUs) at hydrogen refuelling stations, and the researchers configured a cost-minimizing design algorithm for the PCU by observing the SAE J2601 refuelling protocol for T40 stations (requiring −40 °C precooling temperature). They developed a parameterized precooling energy intensity prediction formula as a function of the ambient air temperature and station utilization rate.
Talpacci et al. [
29] analyzed the thermodynamics of a hydrogen fuelling station to understand the effects of the cascade storage system configuration on the energy consumption for the cooling facility. They found that the energy consumption for cooling rises, expanding the total volume of the cascade storage system. They compared the optimal and the minimal volume configurations of the cascade storage tanks at different ambient air temperatures.
Mayer et al. [
30] conducted techno-economic studies of different hydrogen refuelling station architectures for 2015 and 2050. The compressor (gaseous hydrogen) vs. pump (liquid hydrogen) output and maximum pressures and volumes of the cascaded high-pressure storage system tanks were dimensioned in an approach to minimize lifecycle costs. Their results showed that, for all station concepts, liquid truck-supplied hydrogen as well as stations with gaseous truck-supplied or onsite-produced hydrogen, provided significant potential for cost reduction.
Blazquez-Diaz [
31] performed a techno-economic study to derive the best design of a hydrogen refuelling station in terms of the number of tanks and their sizes. The study demonstrated that high-pressure tanks have to be larger in volume than the low-pressure tanks in order to minimize the total cost of the station, including setup and operational costs along its timeframe.
Finally, Rose and Neumann [
32] investigated the relationship between heavy-duty vehicle (HDV) hydrogen refuelling stations (HRS) that produce hydrogen locally and the power system by coupling an infrastructure location planning model and an electricity system optimization model that takes grid expansion alternatives into account. Two scenarios—one sizing refuelling stations to support the power system, and another sizing them independently of it—were evaluated for their respective influences on the total annual electricity system costs, regional with reference to integration and the levelized cost of hydrogen. Adding HDV-HRS effects power transmission extension. They concluded that the co-optimization of various energy sectors is essential for investment planning and has the capacity to optimize concerted efforts.
3. Techno-Economic Methodology and Case Variances
In this section, the developed techno-economic model of hydrogen refuelling infrastructure for LHHDVs, evaluated scenarios, and model variance are described in detail.
3.1. Model Description
This sub-section provides the details of the proposed techno-economic model of hydrogen refuelling infrastructure, the derived predicted capital costs, pump fuel prices, and total nationwide investments.
The model evaluates numerous key variables correlated to the nationwide integration of these stations. These variables include (i) the capital costs per refuelling station, (ii) normalized investment cost, as well as (iii) the price of fuel sold at the pumps.
This model compares the feasibility of different delivery methods and their associated costs in order to optimize the transition to hydrogen fuel stations as well as the ongoing operations. These delivery methods comprise (i) truck delivery, (ii) pipeline-fed fuel, and (iii) onsite production of fuel.
In order to accurately model this for Canada-wide integration, the models take also into account varying input parameters of daily long-haul truck traffic flow and distance between refuelling stations. These multiple test cases allow for a spread of normalized cost data, which are then compared to Canada’s major long-haul trucking routes to predict the total investment cost required to construct these stations. Additionally, the models account for varying technology integration factors to ascertain the feasibility of these refuelling stations depending on the number of LHHD hydrogen-fuelled trucks.
Major long-haul routes across Canada are found using data in [
33,
34], which show the annual average daily traffic (AADT) for each stretch of recognized highways in Canada.
Hydrogen has a low diesel liter equivalency (DLE) per kilometer. To compare hydrogen and diesel, measurement is done by DLE, which is the amount of hydrogen it takes to have the same energy content as a liter of diesel. This involves 0.35 DLE/km consumption for driving plus 0.05 DLE/km consumption for idling [
21]. This means that for every liter of diesel used per kilometer of driving, 0.40 liters of hydrogen could be used instead. Using these data, a model is constructed to determine the capital costs per refuelling station, as well as the price for fuel at the pump.
Most existing refuelling stations that have been implemented have a relatively low capacity. This is because the stations will need to be significantly larger than what currently exists. This is translated into a lack of information on the capital costs required for large-capacity hydrogen refuelling stations. To compensate for this, a cost model was developed, so that capital costs can be estimated for this work.
The capital cost and cost per refuelling station are determined by summing (i) the total hardware, (ii) installation, (iii) storage, and (iv) utility costs necessary for maintaining a hydrogen refuelling station.
Table 1 [
25,
35,
36] presents the hardware associated with pumping hydrogen, which includes, as per
Figure 1, fuel pumps, a compressor, and a cooling unit, as well as the costs of a pump canopy and electronic card reading system.
The compressor cost is based on the energy (or DLE) supply rate required for refuelling trucks. The required energy supply rate is determined by the estimated output of fuel per hour depending on the traffic flow of long-haul, heavy-duty trucks that use hydrogen fuel technology.
To estimate this, certain input parameters must be reasonably assumed, including the distance between stations, long-haul truck traffic flow rate, peak traffic flow ratio, and long-haul truck energy requirements (
Table 2).
From
Table 2, Parameters 1 and 2 vary from case to case (discussed in the next section,
Section 3.2), but parameters 3 and 4 are fixed at 3 and 0.401, respectively.
Parameter 3 represents the peak traffic flow ratio [T], which is defined as a ratio between peak AADTT and average AADTT.
The required compressor rate, or required energy supply, is estimated using Equation (1) and the parameters listed in
Table 2.
Once this rate is computed, for the sake of simplifying further calculations, it is converted from its liter of diesel equivalency unit [DLE/h] to mass of hydrogen units [kg/h] or peak hydrogen mass supplied, using Equation (2).
The final compressor cost is then linearly interpolated in Equation (3) using the compressor base unit cost in
Table 1:
Fuel storage costs make up a portion of the capital costs.
A hydrogen storage system requires a large low-pressure tank for long-term storage and a high-pressure buffer tank for peak usage and rapid filling. These tanks are priced per kilogram of storage; the low-pressure tank being
$1333 per kilogram for gaseous hydrogen,
$67 per kilogram for liquid hydrogen, and the high-pressure tank at
$2400 per kilogram of storage for hydrogen in both states, as shown in
Table 3 [
27]. Since the low-pressure tank is used for daily storage, assuming that the tank is depleted daily, it must take into account the mass of fuel needed daily. Using the input parameters in
Table 2, the tank costs are estimated via Equation (4).
Furthermore, the high-pressure storage cost can be calculated with Equation (5), using the peak hydrogen mass supply rate from Equation (2), as well as the high-pressure tank cost in
Table 3 below.
Finally, there exist two other capital costs consisting of the (i) grid/pipeline connection and (ii) hydrogen synthesizing equipment.
These costs vary by scenario and are discussed in
Section 3.2.
Additionally, the fuel pump cost calculation method and, thus, further model computation varies by fuel delivery scenario and is also discussed in
Section 3.2.
Furthermore, the calculated number of fuel pumps required at each station relies on this energy supply rate and two other input assumptions:
These two values are used to find the required output of the pump and, thus, the number of pumps needed, using the required energy supply rate for long-haul truck traffic via Equation (6).
The capital costs for pumps at each refuelling station are then calculated using the value in
Table 1 and Equation (1).
Other than the pumps and compressor, the hardware costs match those in
Table 1.
The capital cost is then summed with the values mentioned above, along with a fuel storage cost and grid/pipeline connection cost, which both vary from case to case (discussed in
Section 3.2).
This capital cost can then be considered in terms of normalized investment cost using Equation (7). This is the capital cost in terms of each kilometer of highway between stations and the number of trucks per day, which are represented by input parameters 1 and 2 from
Table 2:
The annual income ‘
’ is computed using Equation (8) [
37], where ‘
’ is an estimated rate of return on investment of 6.0%, ‘
nmax’ is an estimated equipment lifecycle of 20 years, ‘
B’ is the capital cost (evaluated above), and ‘
C’ is the annual operational costs found using Equation (9).
Finally, using the total annual income (
), the pump price of fuel is determined using Equation (10):
3.2. Evaluated Scenarios and Model Variance
The hydrogen infrastructure feasibility study analyzes 5 major scenarios as shown in
Table 4, namely (i) delivery by truck containing gaseous hydrogen, (ii) delivery via pipeline in a gaseous state, (iii) delivery by truck containing liquid hydrogen, (iv) onsite hydrogen production using SMR, or (v) electrolysis.
A maximum and minimum (or high and low) hydrogen fuel price are trialled with each delivery scenario; these prices range from
$261 to
$164 per cubic meter of hydrogen, respectively [
27].
The exception to this is the onsite production methods; since hydrogen would be produced on site, there would be no need to purchase it directly, but invest in equipment and purchase raw material for production. This causes an increase in capital investment for onsite production scenarios but possibly lower operational costs. This also means that the calculation of the pump price differs from onsite production scenarios and delivery scenarios.
In addition, the pipeline delivery scenarios do not include low-pressure storage capital costs. Due to the fact that hydrogen is provided as an on-demand supply via a pipeline, there is no need for long-term storage for fuel.
As mentioned in
Section 3.1, some capital costs vary for different scenarios.
Firstly, the pipeline delivery scenarios include a capital cost for grid/pipeline connection of approximately
$74,564,400, assuming that each refuelling station is approximately 100 km from the Trans-Canada Pipeline [
38,
39], and costs
$745,644 per kilometer of pipeline built (assumed to be three times more than the RNG pipeline [
40]).
Alternatively, the scenarios involving onsite production include an investment for production equipment. The steam methane reforming and electrolysis equipment capital cost is calculated on a logarithmic scale based on the required daily mass of hydrogen fuel supplied per refuelling station via Equations (11) and (12) [
27].
The cost of pumping, or operational cost, also varies by scenario.
The truck delivery scenarios for hydrogen consist of the summed costs of (i) hydrogen fuel, (ii) electricity cost of pumping, (iii) commodity delivery cost, and (iv) maintenance cost (
Table 5).
The maintenance cost with hydrogen is assumed to be 15–40% of the operational costs [
41]. This is averaged and rounded to an even 30% for calculation simplicity, and maintenance costs are then determined with Equation (13).
The pipeline delivery operational costs are identical; however, they do not contain the commodity delivery cost, as they do not rely on delivery services to provide the hydrogen fuel. Given this, the operational costs for truck and pipeline delivery scenarios are determined using Equation (14).
The onsite production scenarios are more complex. They involve multiple input parameters for producing hydrogen operationally.
SMR production involves the (i) cost of electricity, (ii) water, and (iii) natural gas consumed during production, (iv) natural gas delivery and commodity costs, as well as (v) the usual electricity and maintenance costs,
Table 6 [
42,
43,
44].
The parameters in
Table 6 below are used to calculate the operational costs using Equation (15).
Furthermore, electrolysis production involves the cost of (i) electricity for production, (ii) the cost of water for production, as well as the usual (iii) electricity and maintenance costs,
Table 7 [
42,
43,
44].
The parameters in
Table 7 below are used to estimate the operational costs using Equation (16).
Each of the scenarios in
Table 4 contains four cases of varying (decreasing) distance between stations [
] and increasing long-haul truck traffic flow rates [
], as shown in
Table 8.
The purpose of this is to obtain a spread of data to interpolate the normalized cost for major long-haul routes across Canada.
As previously mentioned, each route is broken down into sub-routes, with their distance and annual average daily truck traffic (AADTT) used to calculate the investment cost for developing a network of refuelling stations on that route with Equation (17). This is computed for all routes across Canada and summed to obtain a national total investment value for each refuelling station scenario [
33,
34].
where
is determined using Equation (7).
Furthermore, each of the hydrogen station scenarios in
Table 4 is studied at varying technology integration levels, meaning that the model takes into account the fact that only a fraction of long-haul trucks may contain the hardware necessary to run on hydrogen.
These integration levels consisted of 100%, 75%, 50%, 20%, and 10% technology penetration.
This means that the long-haul, heavy-duty truck traffic flow rate input parameter [] would be fractionalized by these percentages, affecting capital costs as well as pump prices.
Finally, in total, with the 8 scenarios (
Table 4) run at these (i) 5 integration levels and at (ii) 4 cases of varying (decreasing) distance between stations [
] and increasing long-haul, heavy-duty truck traffic flow rates [
] (
Table 8), there were 160 total models trialled.
Table 9 presents the total number of scenarios assessed.
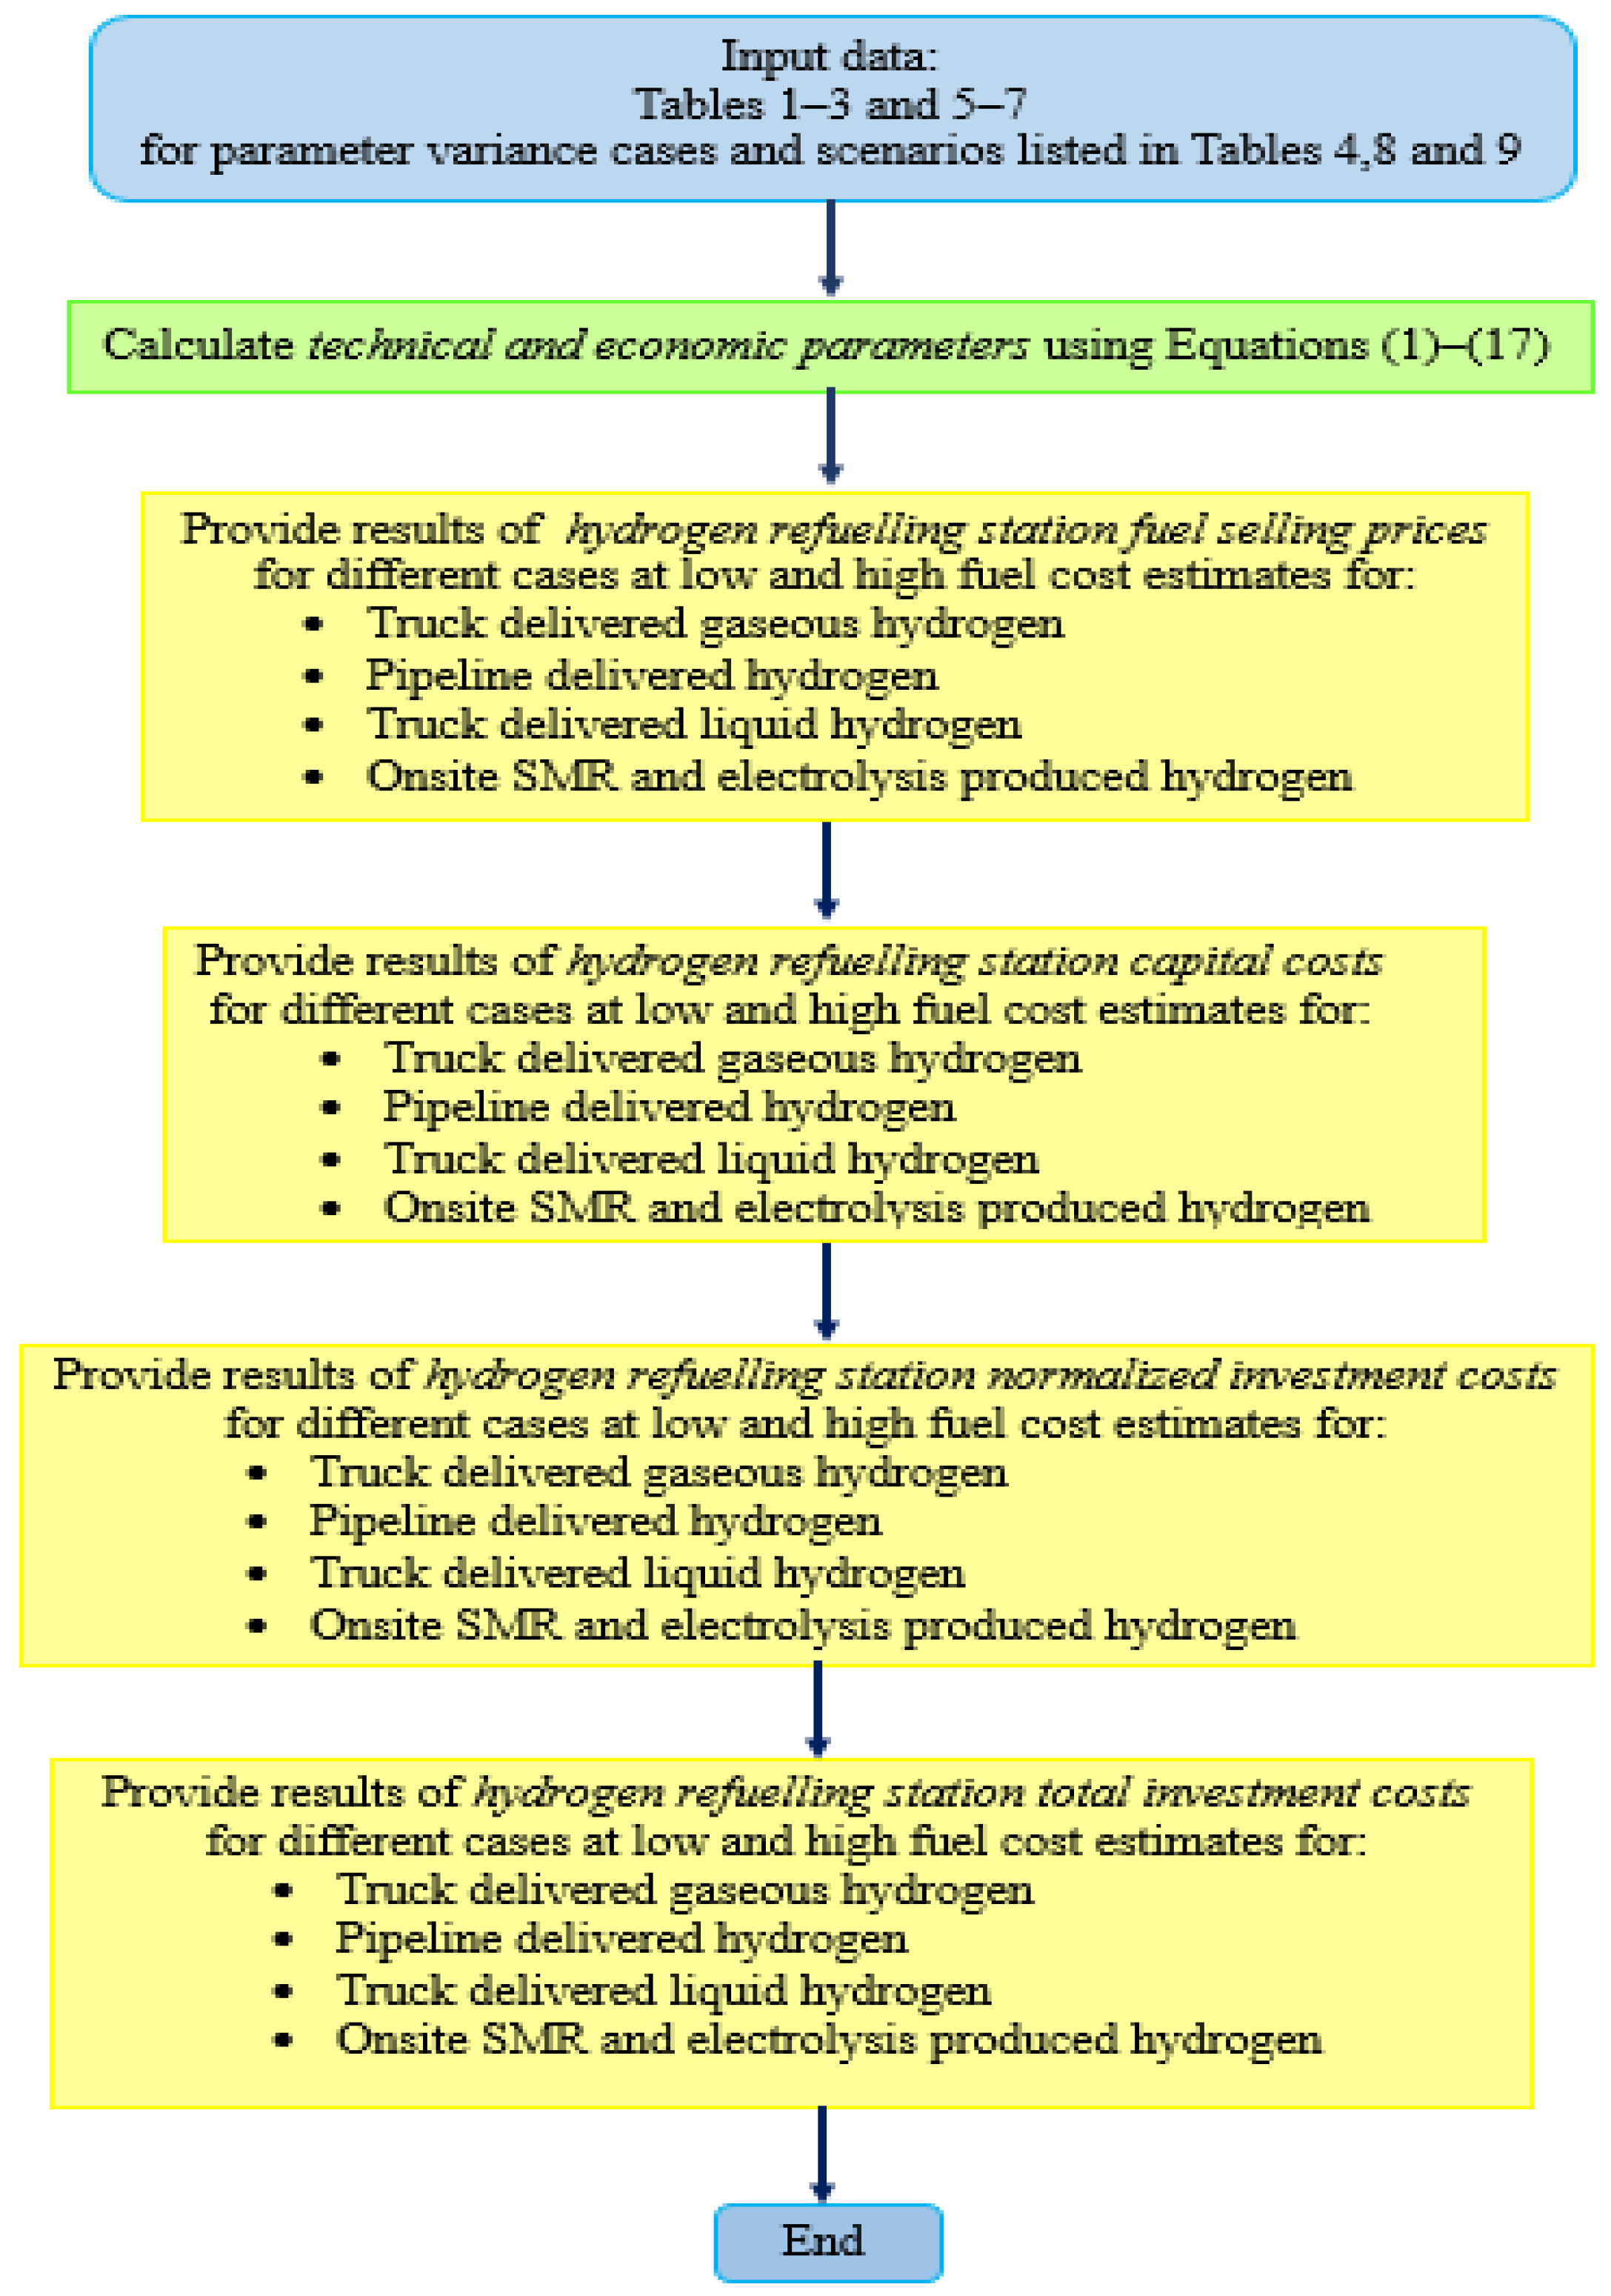
The simplified flowchart for the techno-economic computation procedure of hydrogen refuelling infrastructure is given in
Figure 2. MATLAB and Excel environments were used for the modelling and simulations of the different scenarios.
4. Results and Discussion
In this section, the results with their discussion are presented in detail for the fuel selling price, capital price, and normalized investment costs for the hydrogen refuelling infrastructure derived from the techno-economic assessment. The taxed fuel selling prices, capital costs, normalized costs, and total investment costs are provided after running the techno-economic model presented in
Section 3, summarized in the calculation procedure in
Figure 2, for the various scenarios listed in
Table 4,
Table 8 and
Table 9, using input data in
Table 1,
Table 2 and
Table 3 and
Table 5,
Table 6 and
Table 7 and Equations (1)–(17).
4.1. Fuel Selling Price
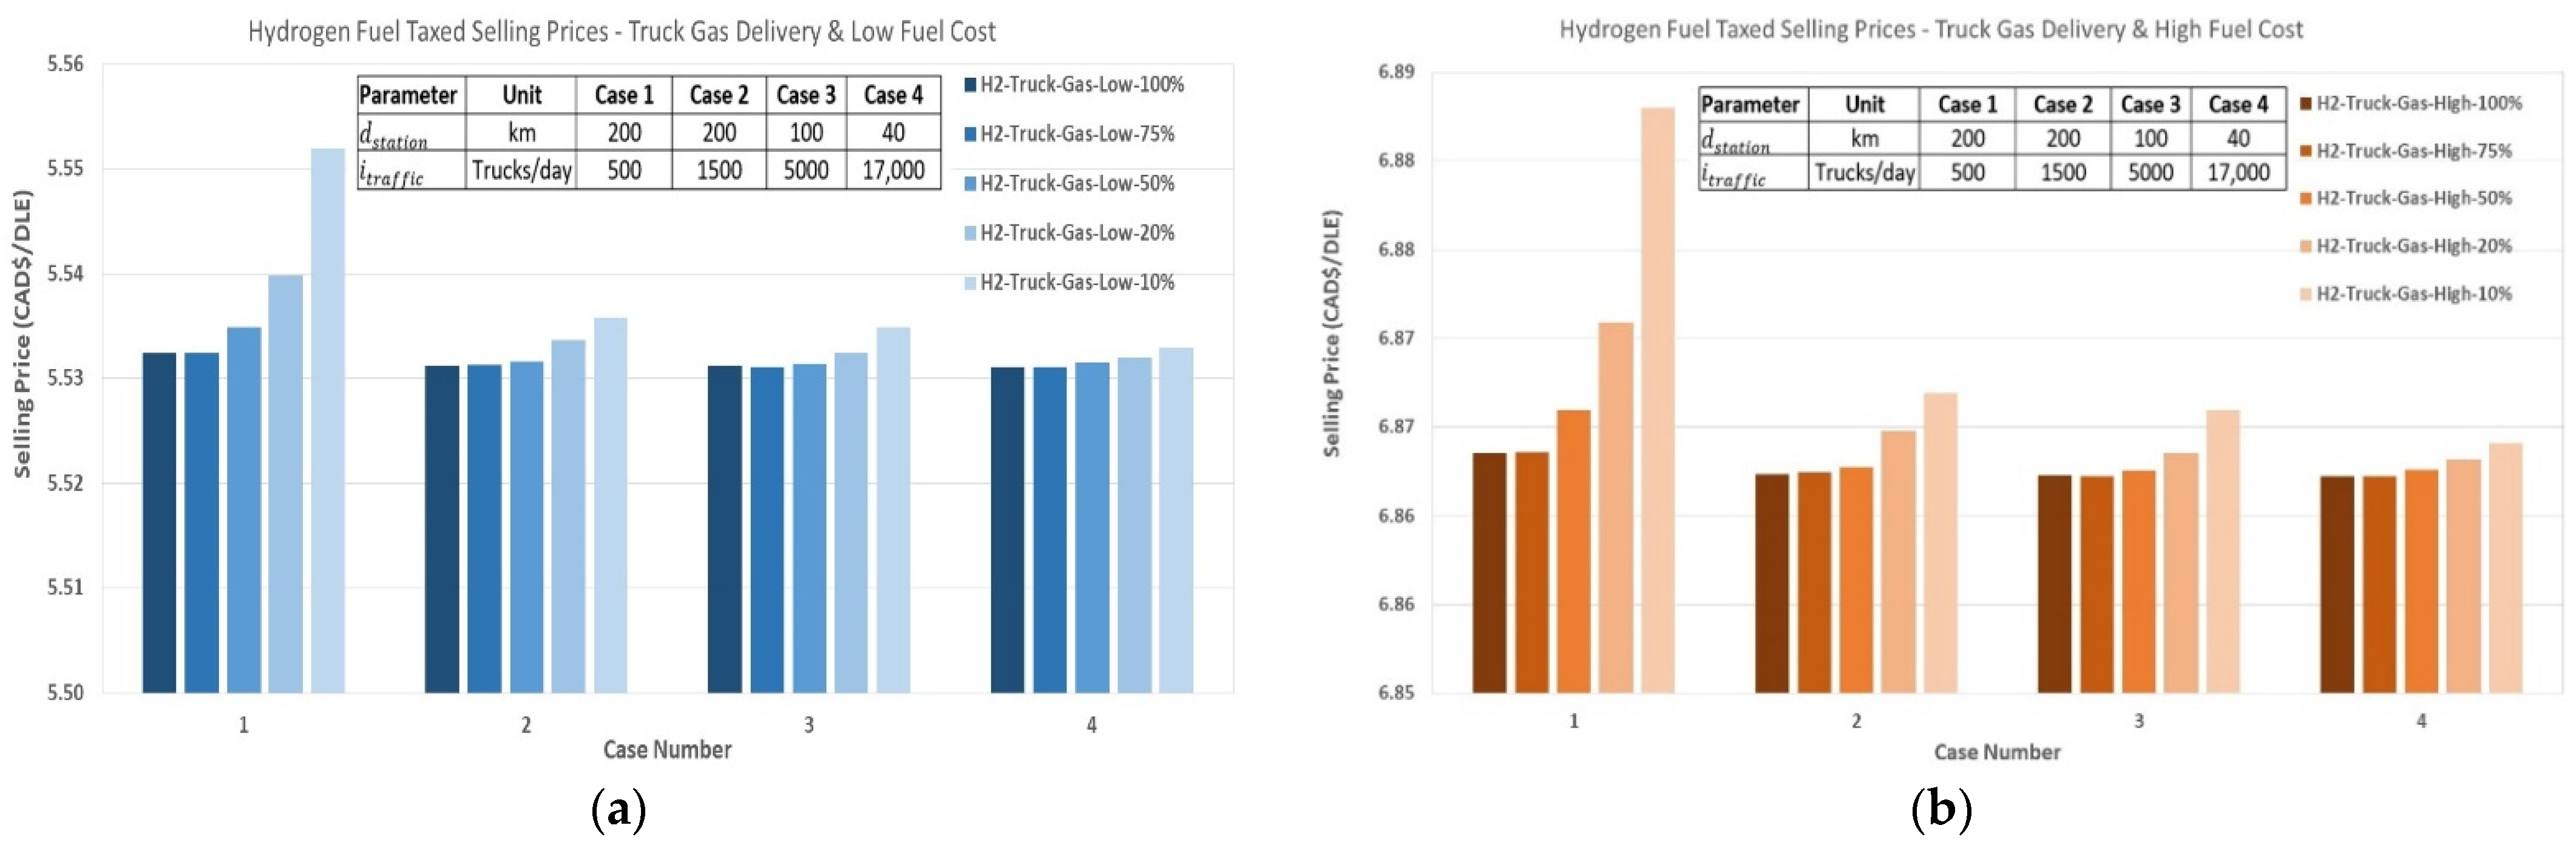
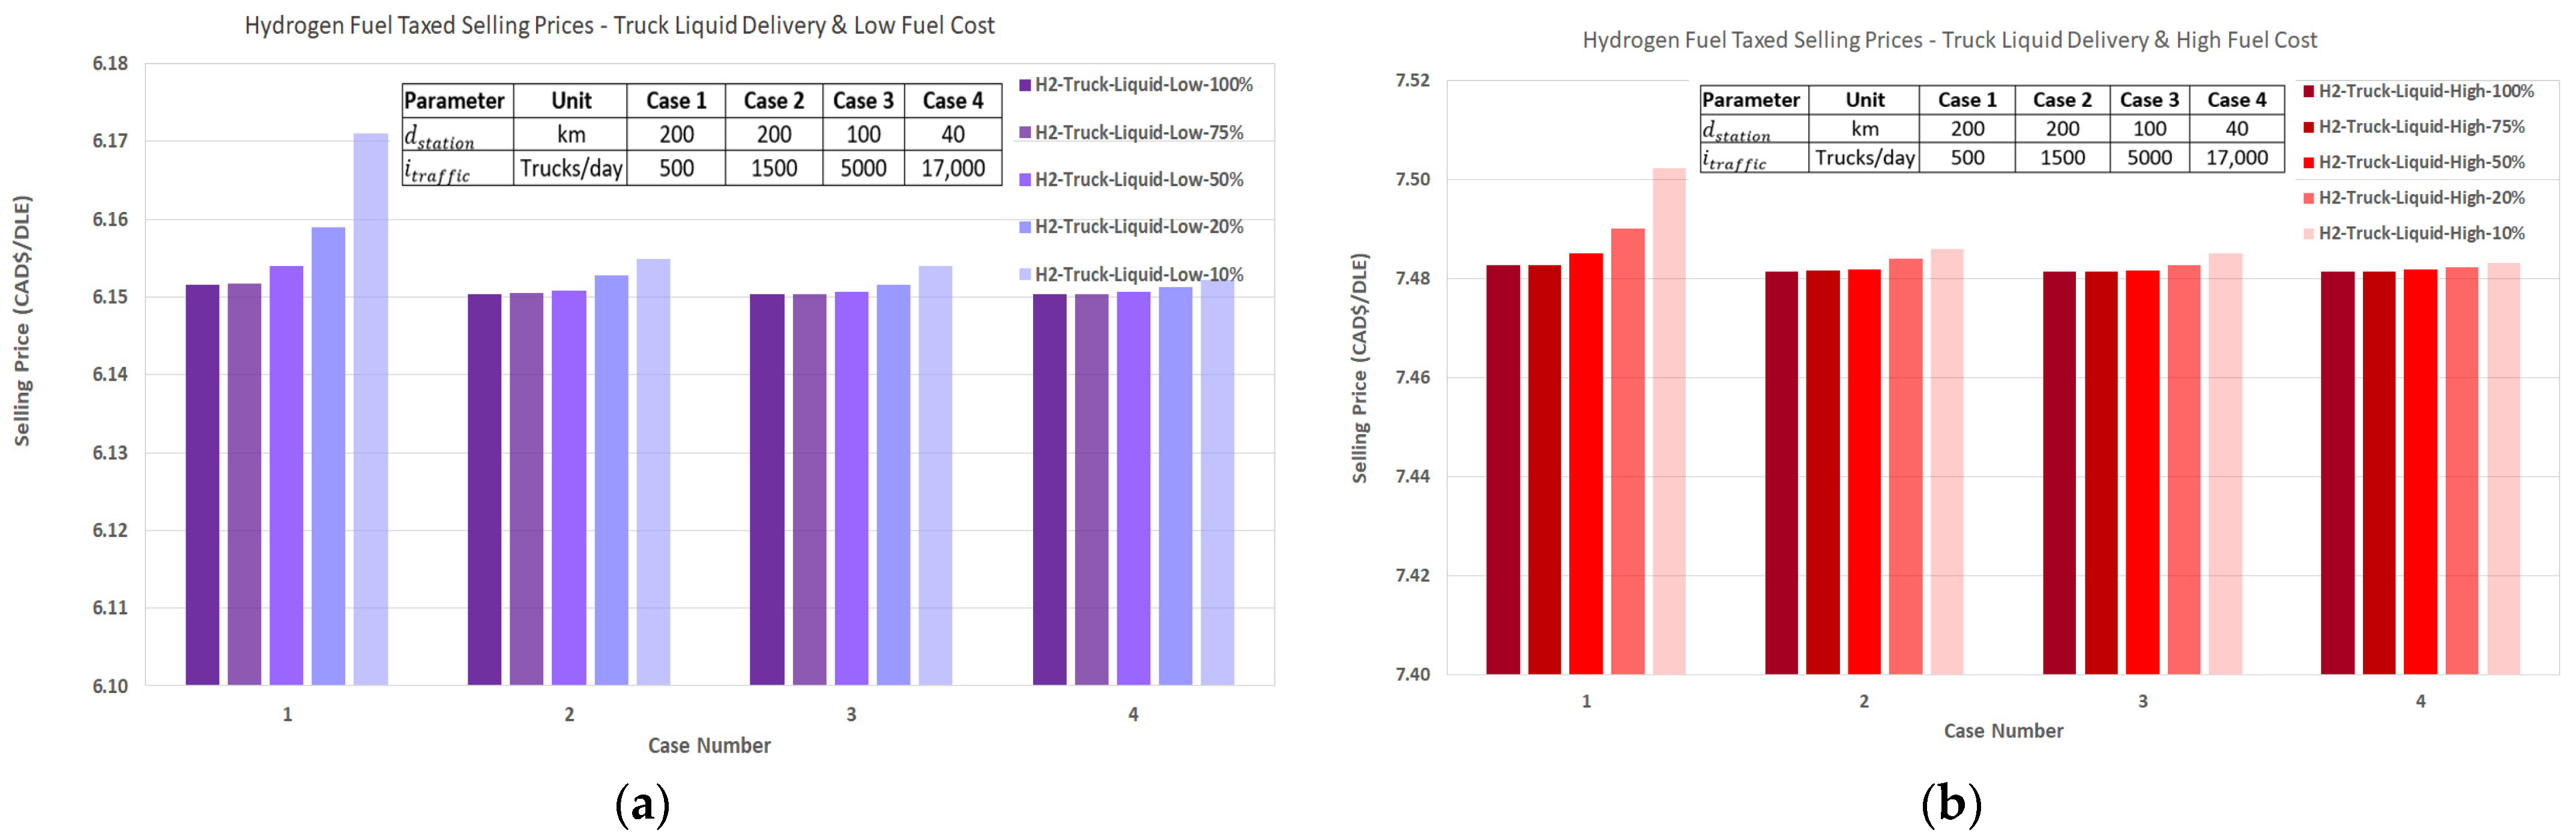
Figure 3a,b,
Figure 4a,b,
Figure 5a,b,
Figure 6a,b,
Figure 7a,b,
Figure 8a,b,
Figure 9a,b and
Figure 10a,b present the taxed fuel selling prices derived from the techno-economic model presented in
Section 3 and scenarios listed in
Table 9. For a better perspective, the results are provided in both Canadian dollars per liter of diesel equivalency (diesel fuel price is approximately CAD
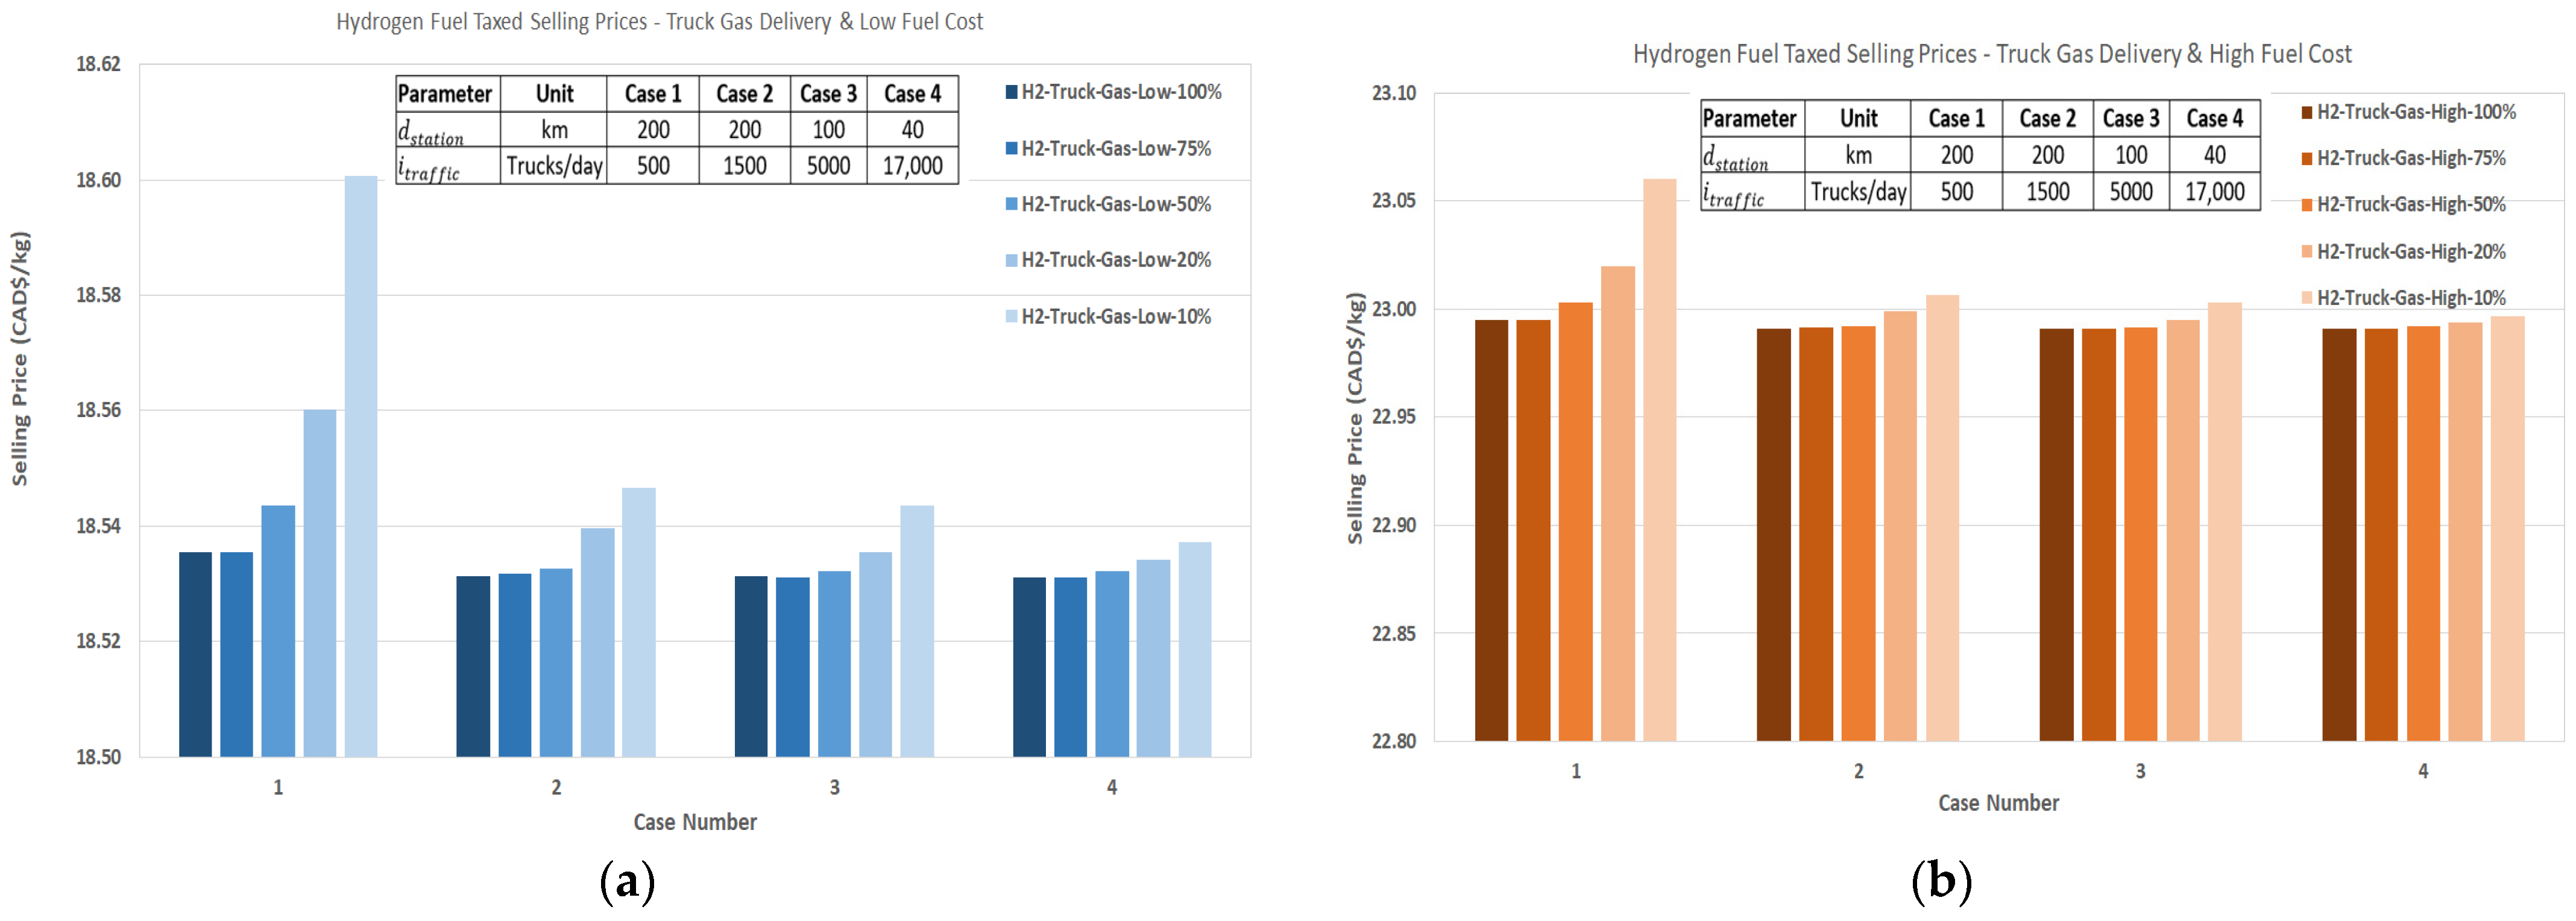
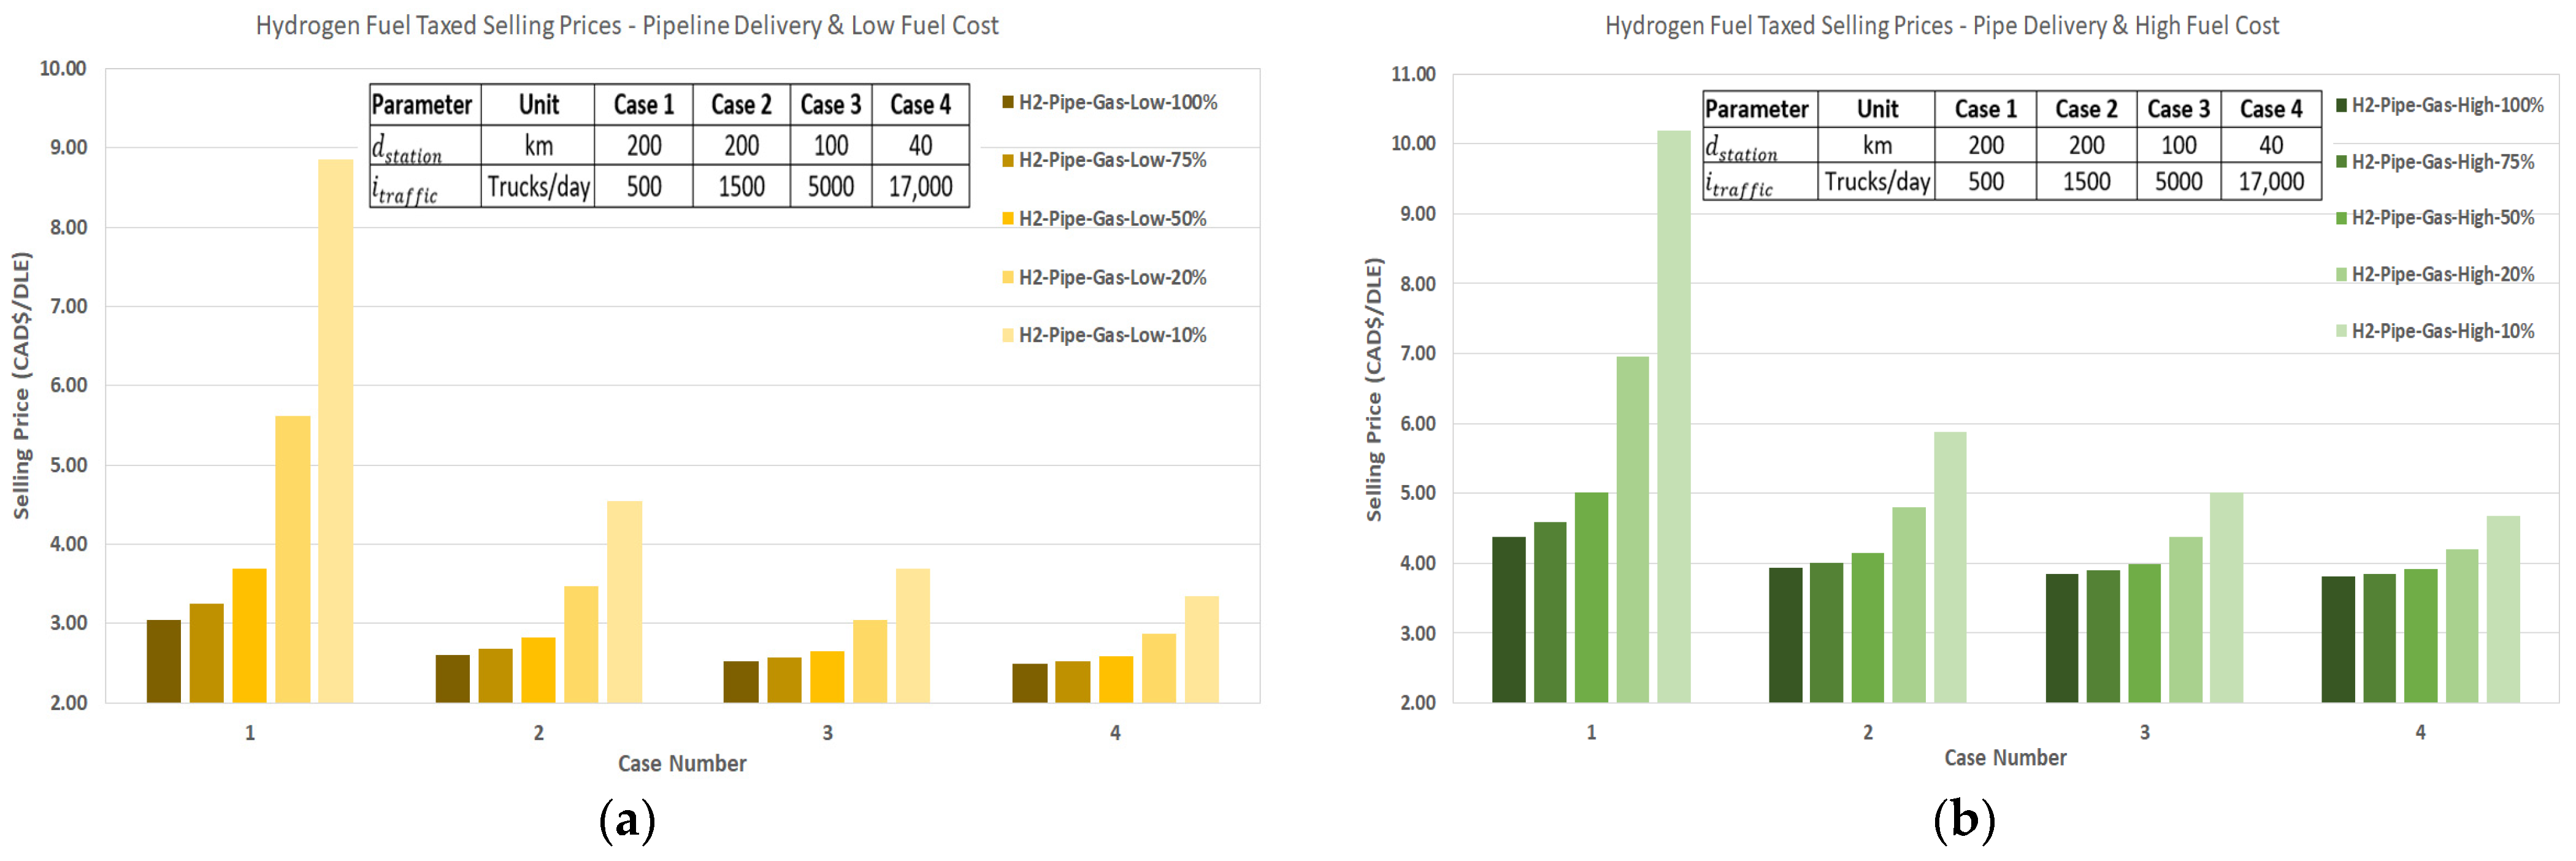
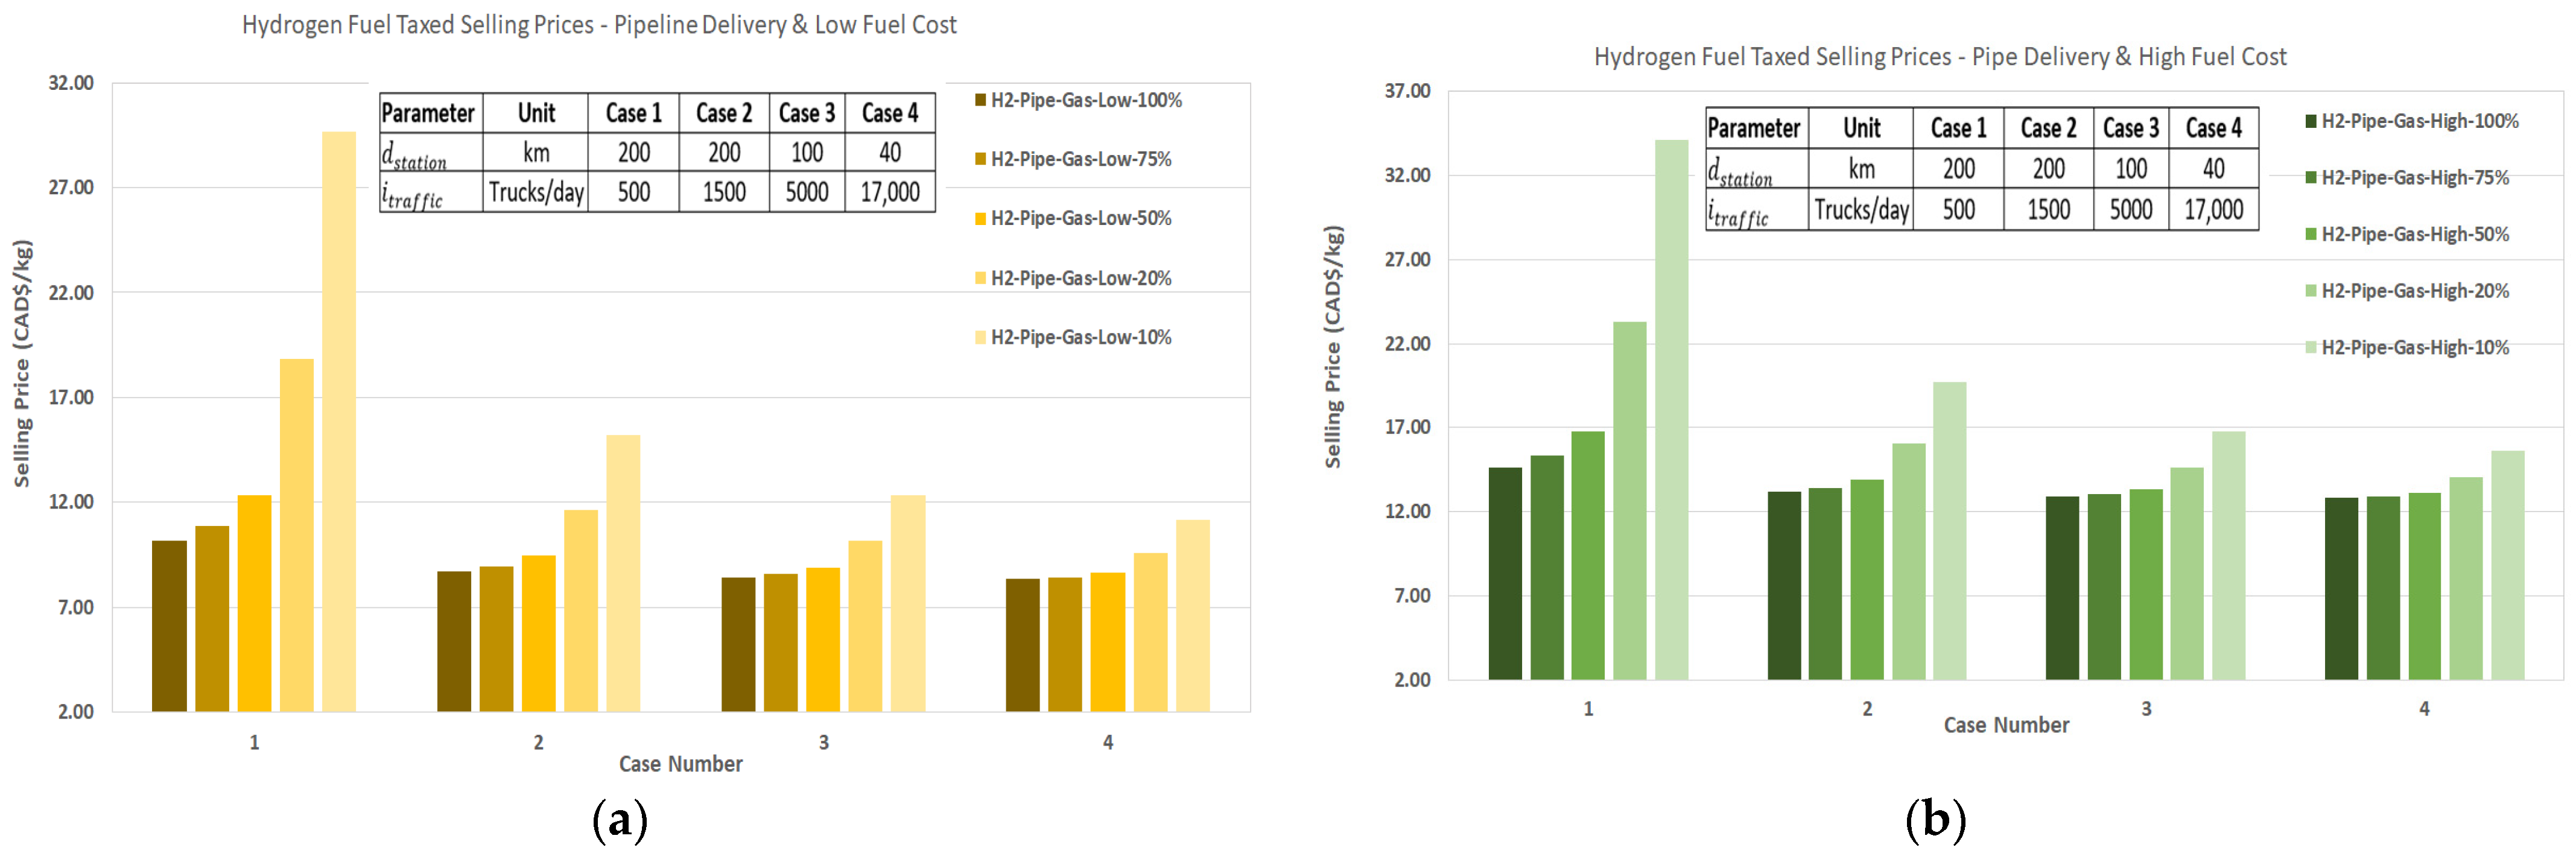
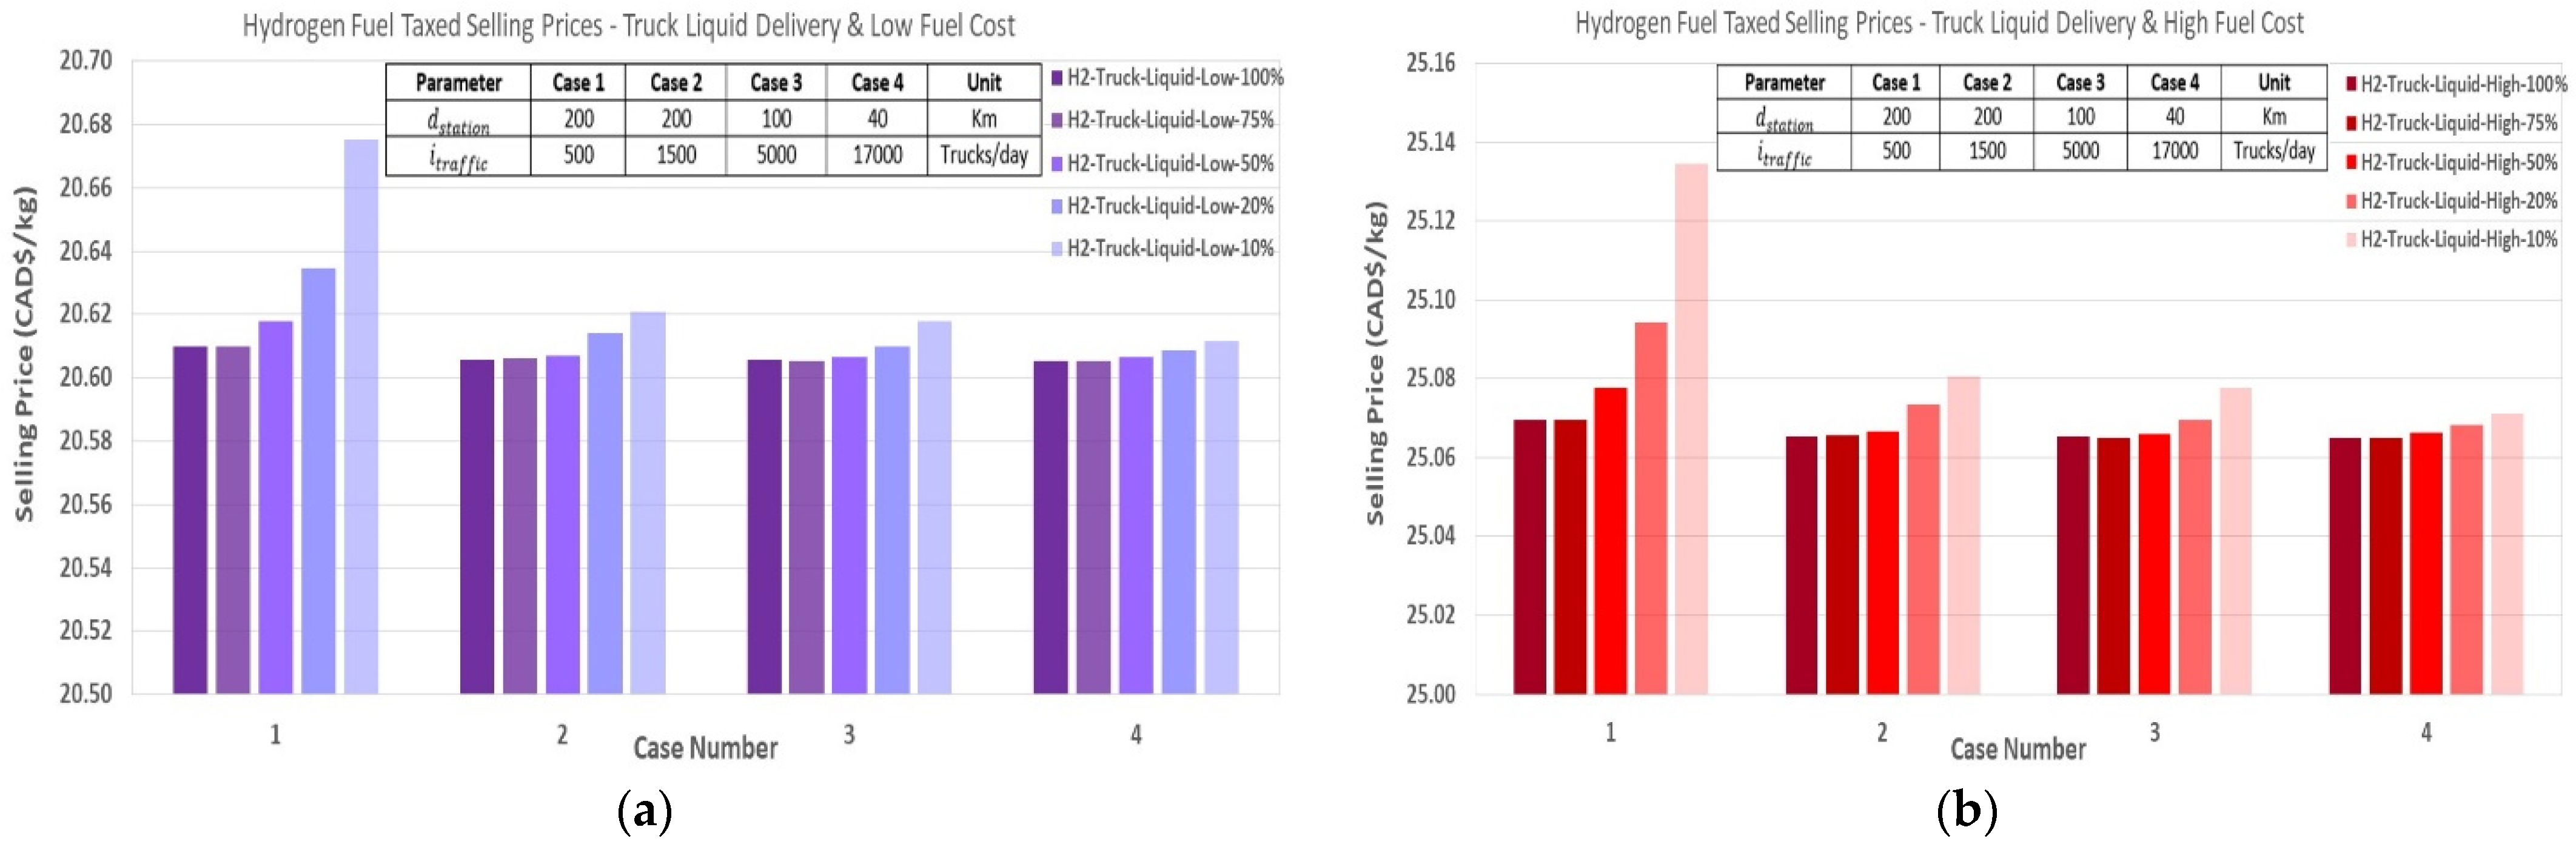
$1.20/L) and dollars per kilogram of hydrogen. As expected, the fuel selling price increases with decreasing traffic, and hence with decreasing technology integration and through Cases 1 to 4. Comparing truck delivery methods (gas vs. liquid hydrogen delivery), gaseous delivery results in a lower pump price, likely due to the fact that gas delivery has a significantly lower commodity delivery cost (
Table 5) and, thus, lower maintenance cost (Equation (13)). Comparing truck and pipeline delivery, it can be noticed that pipeline delivery generally has a much lower selling price, with the exception of 10% technology integration in Case 1. The rapid increase of this specific case is because of the high capital costs associated with pipeline equipment that need to be recovered and, given a low traffic rate, selling prices must be increased exponentially compared to truck delivery. Aside from this case, the low selling price of pipeline-delivered fuel is due to eliminated high commodity delivery costs that are associated with truck delivery.
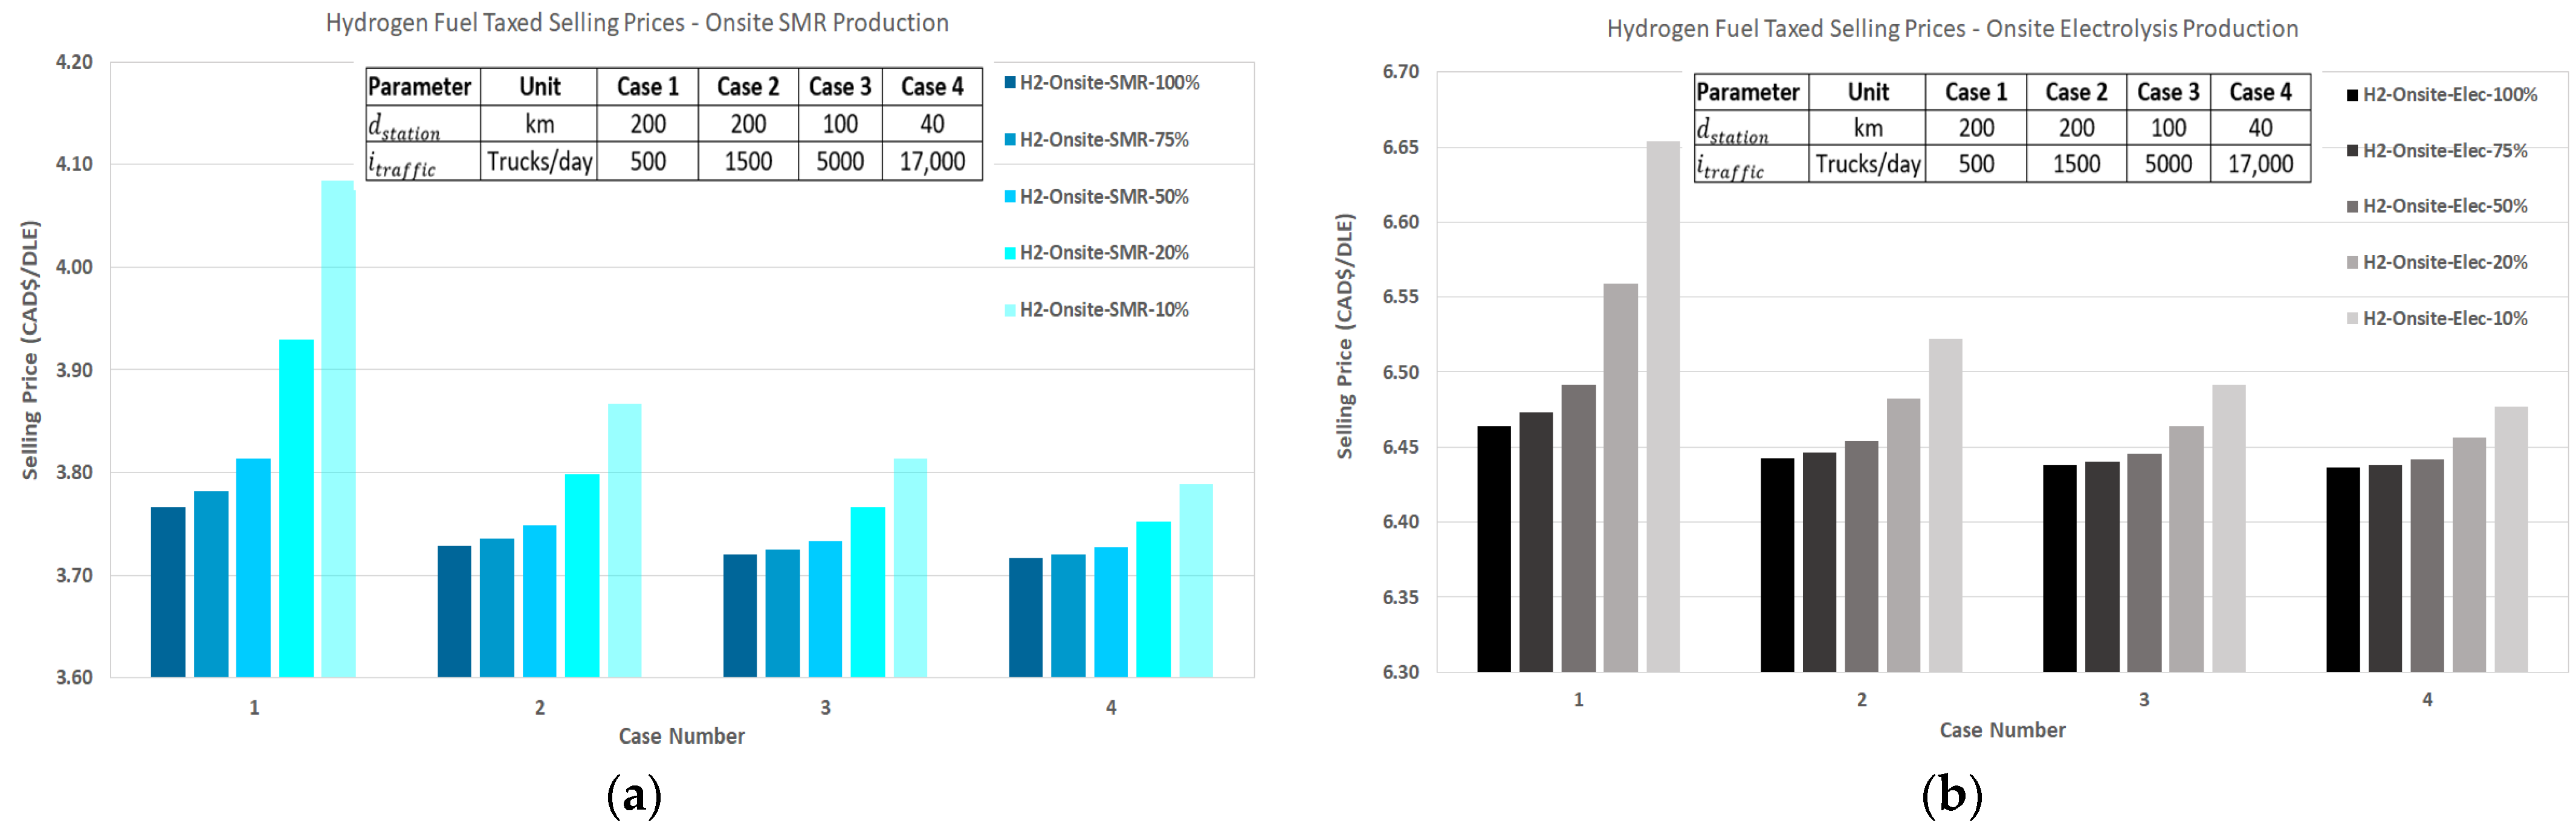
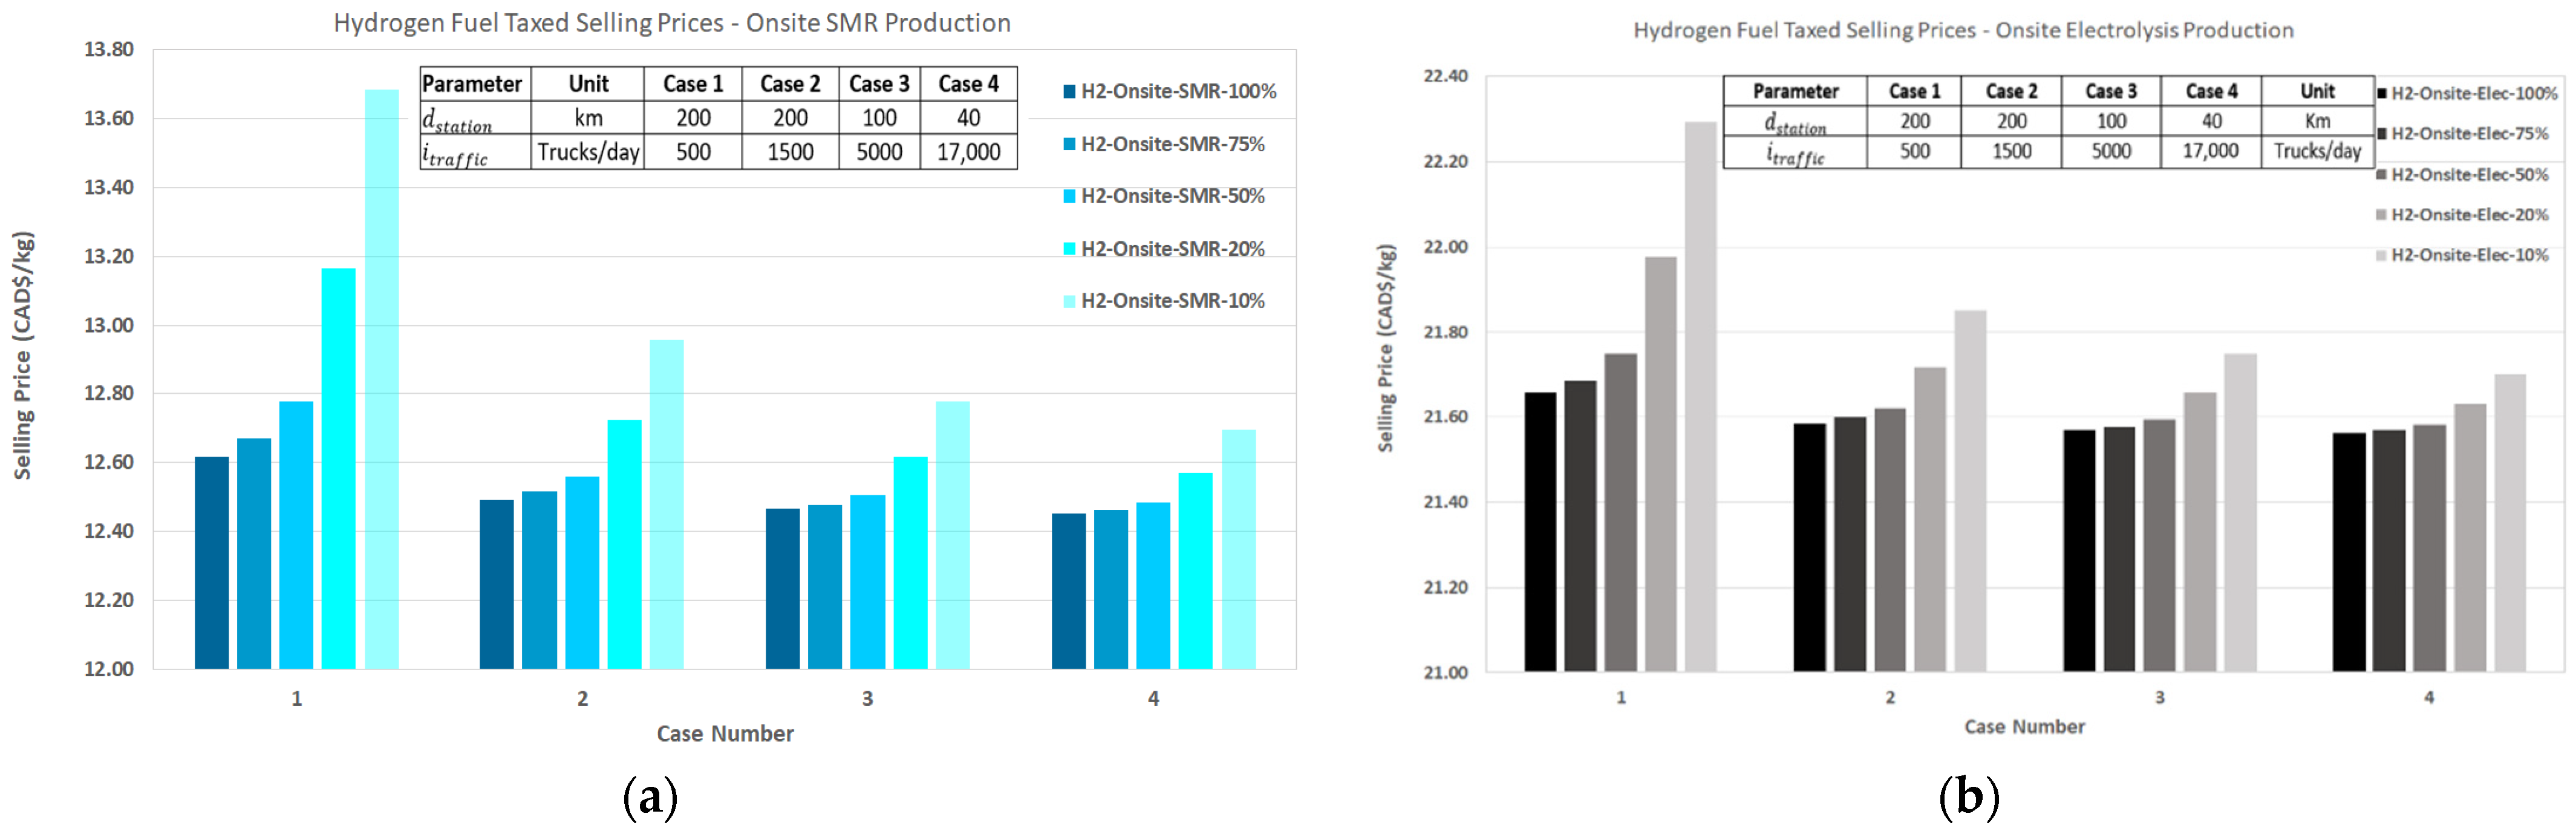
Comparing the two onsite production methods, SMR and electrolysis, SMR is significantly cheaper operationally. This is due to the high electricity usage associated with electrolysis production, with a relatively high electricity cost (
Table 7). Comparing this to the very low cost of water and natural gas, as well as the low electrical usage associated with SMR, this price difference is very apparent. For perspective, the SMR production method prices are roughly in between the pipeline high and low hydrogen cost estimates, whereas electrolysis lies roughly in between the truck delivery methods. In general, pipeline delivery is the cheapest method of delivery at relatively high technology integration and traffic. However, with the fluctuating price of hydrogen, it may be beneficial to choose a production method such as SMR to maintain a stable price line of hydrogen that is relatively low.
In summary, it can be established that at 100% technology integration, the range in selling prices is between 8.3 and 25.1 CAD
$/kg. At 10% technology integration, the range is from 12.7 to 34.1 CAD
$/kg. Although not exactly in the same design and operating conditions of the refuelling infrastructures, the range of hydrogen selling price is satisfactory compared with the average selling price, which ranges from 5 to 40 CAD
$/kg in other refuelling stations for electric vehicles or fuel cell vehicles found in the literature [
20,
30,
32].
Moreover, truck-delivered liquid hydrogen, in general, produced the highest selling price because of its excessive operational storage costs. Selling price is a key element as it is the only dataset that wholly concerns the users in the long-haul trucking industry. It may be the element that persuades Canadians and national businesses to switch from diesel to hydrogen trucks. Proposing lower costs and an ecologically friendly alternative for long-haul trucking is the principal stimulating reason for the national acceptance of hydrogen fuel.
Another interesting aspect that is worth mentioning is that hydrogen ICE-based trucks are much affordable than fuel cell trucks or electric trucks. Hydrogen vehicles are identified as any vehicle that utilizes hydrogen (in either liquid or gaseous state) as its source of fuel. The key components comprise the ICE engine, the fuel tank, and the different control systems. Hydrogen ICE engines employ a spark-ignition system, contrary to compression-ignited engines in diesel-powered trucks. The spark plugs also need to be cold-rated, which means that, between sparks, the temperature is as low as is feasible, so as to prevent pre-ignition [
13,
15]. Because of hydrogen’s very low density, fuel tanks might be pressurized up to 700 bar to contain more fuel. The principal options for onboard hydrogen storage are gaseous storage at 350 or 700 bar hydrogen storage in thermally insulated tanks or in materials with excellent chemical properties, such as metal hydrides or organic composites. Presently, the dominant research focus is on 350 bar and 700 bar storage in Type III (metallic liner) or Type IV (plastic liner) tanks. Type IV pressure tanks possess a plastic liner overwrapped by expensive carbon fiber composite material to provide strength. The use of carbon fiber composites results in substantially lower weight than all metal pressure tanks could possess. The use of Type IV pressure tanks, however, increases the cost of storing hydrogen in LHHD vehicles, mainly due to the high cost of the carbon fiber composite material [
21].
Additionally, to lower the cost of liquid hydrogen storage, metal hydrides could be an alternative. Rivard et al. [
45] provided some insights on the use of metal hydrides, which are composites enclosing metal(s) and hydrogen, for hydrogen storage. Per their survey, magnesium hydride is an interesting material for hydrogen storage due to its large quantity and inexpensiveness. Nevertheless, the high temperatures, high energy, and slow kinetics associated in the reaction of simple hydrides are usually a hindrance for reversible storage. In its pure structure, magnesium needs to be heated considerably, up to 260–425 °C, in order to be transformed into hydride. Kinetics involving the hydrogenation and dehydrogenation rate could be enhanced by adding nanoparticles [
46]. They also point out that, even with the favorable outcome regarding enhanced kinetics and reduced decomposition temperatures, for metal hydrides, there is yet a requirement for more investigations to formulate an optimal material [
45].
On the other hand, according to von Colbe et al. [
47], one positive application of hydrogen storage was described in a metal hydride-based hydrogen fuel cell forklift, which, during its operation, involved the usage of a substantial weight offset, whilst encountering stringent space limits. These restrictions established the realization of the fuel cell power unit and hydrogen storage system. A successful combination of metal hydride hydrogen storage in an electric forklift equipped with a fuel cell power module has been demonstrated by HySA Systems Competence Centre in South Africa [
47].
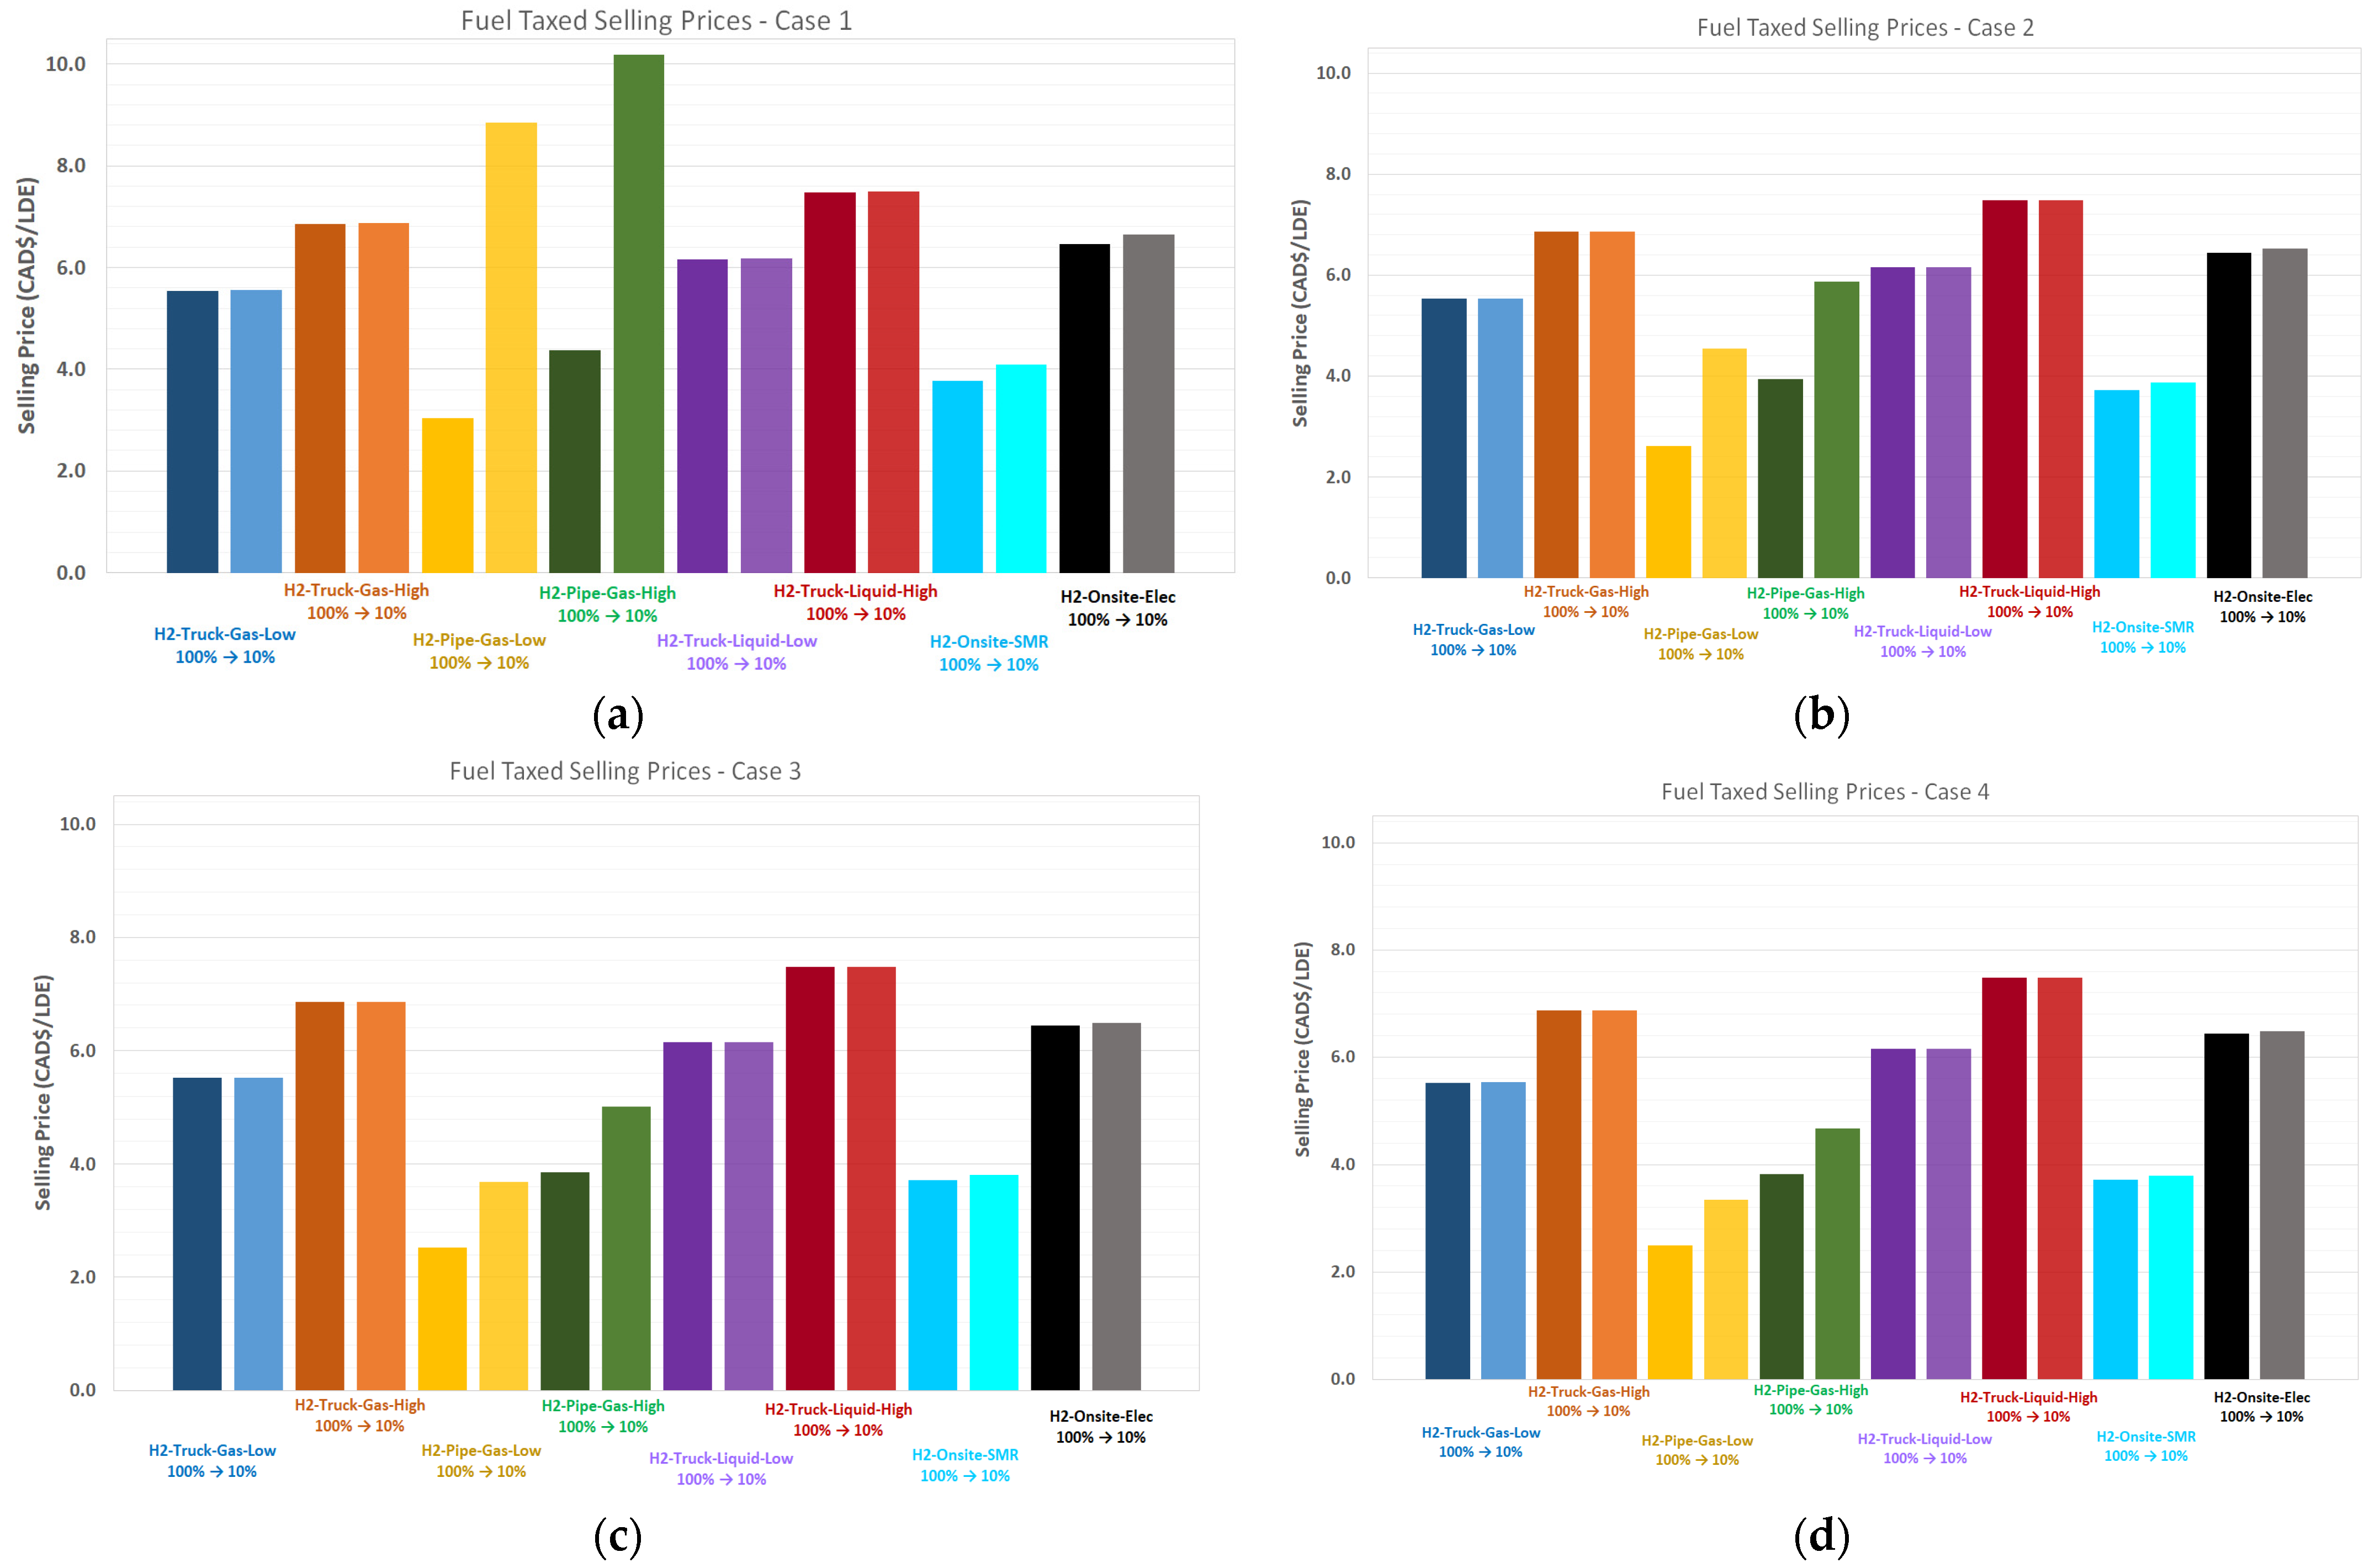
Figure 11a–d and
Table 10 present the comparison of hydrogen taxed selling prices for Cases 1 through 4. For the purpose of profile organization, only the technology integration levels of 100% and 10% are displayed for each scenario as they tend to show a minimum and maximum for each case (see figures below). The range of values between 10% and 100% technology integration is displayed in
Table 10 From the figures above and
Table 10, it is apparent that the delivery methods used in refuelling stations matter greatly when taking the fuel selling price into account.
4.2. Capital Costs
Next, the capital costs are provided in
Figure 12a,b,
Figure 13a,b,
Figure 14a,b and
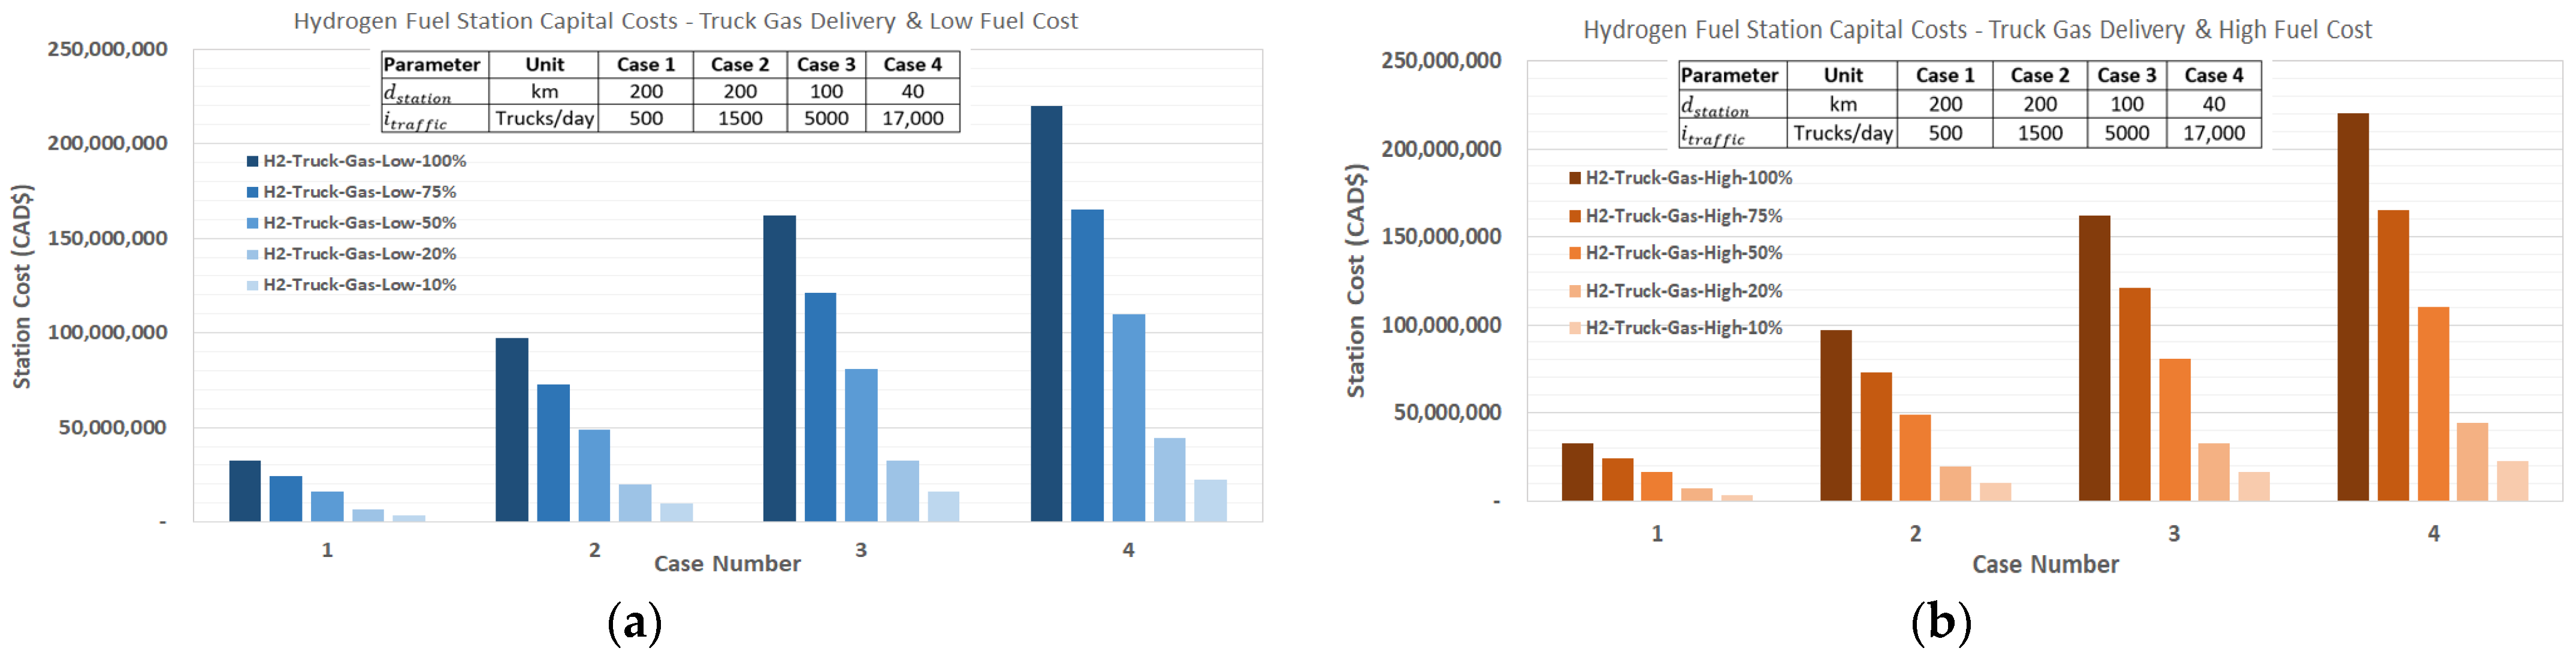
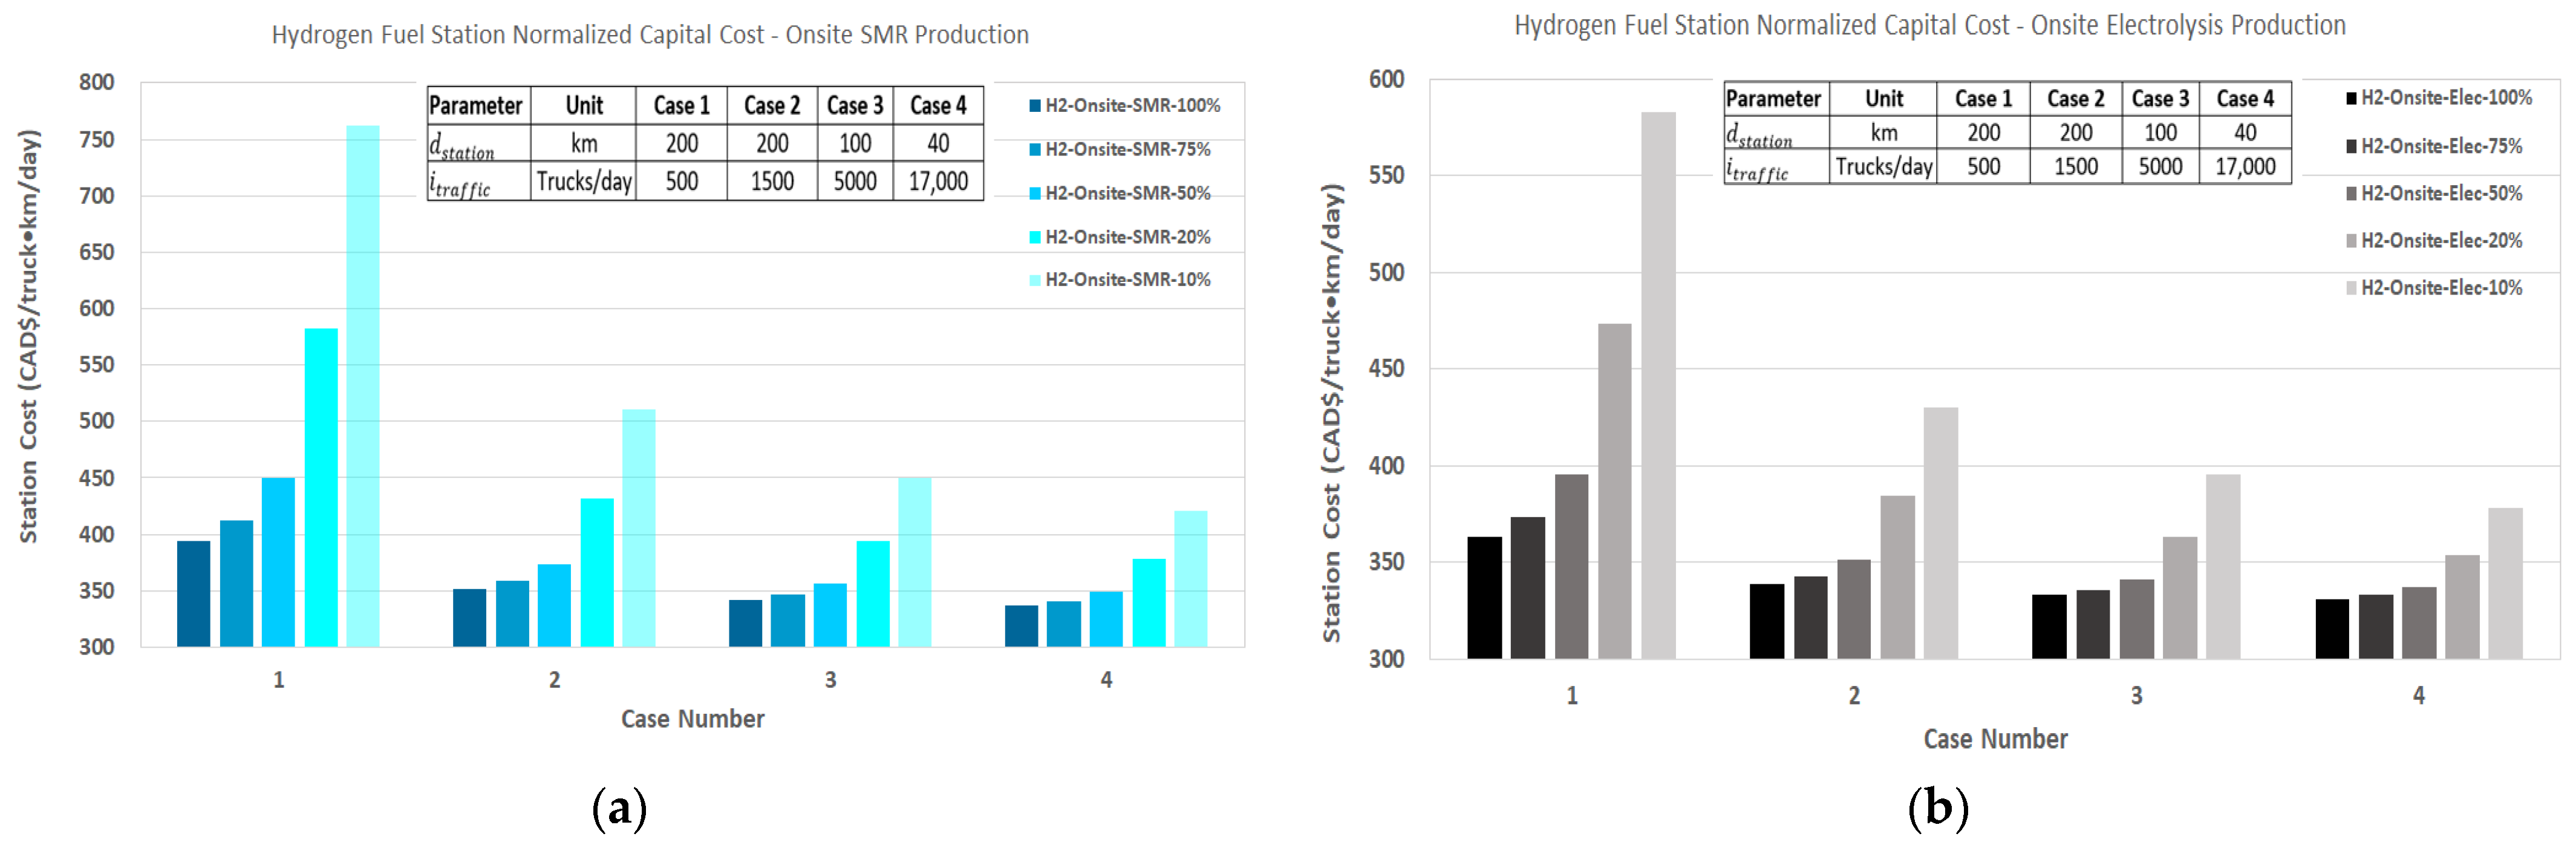
Figure 15a,b Capital costs are not reliant on fuel costs; thus, high and low fuel price profiles contain the same data for each scenario. As expected, the capital cost increases with increasing traffic rates including technology integration and through Cases 1 to 4; this is due to the capital costs that rely on the traffic rate. It is apparent that the gaseous truck delivery of hydrogen requires higher capital costs than liquid truck delivery. This is because of the significantly higher cost of storage per kilogram of gaseous hydrogen compared to that of liquid hydrogen (
Table 3).
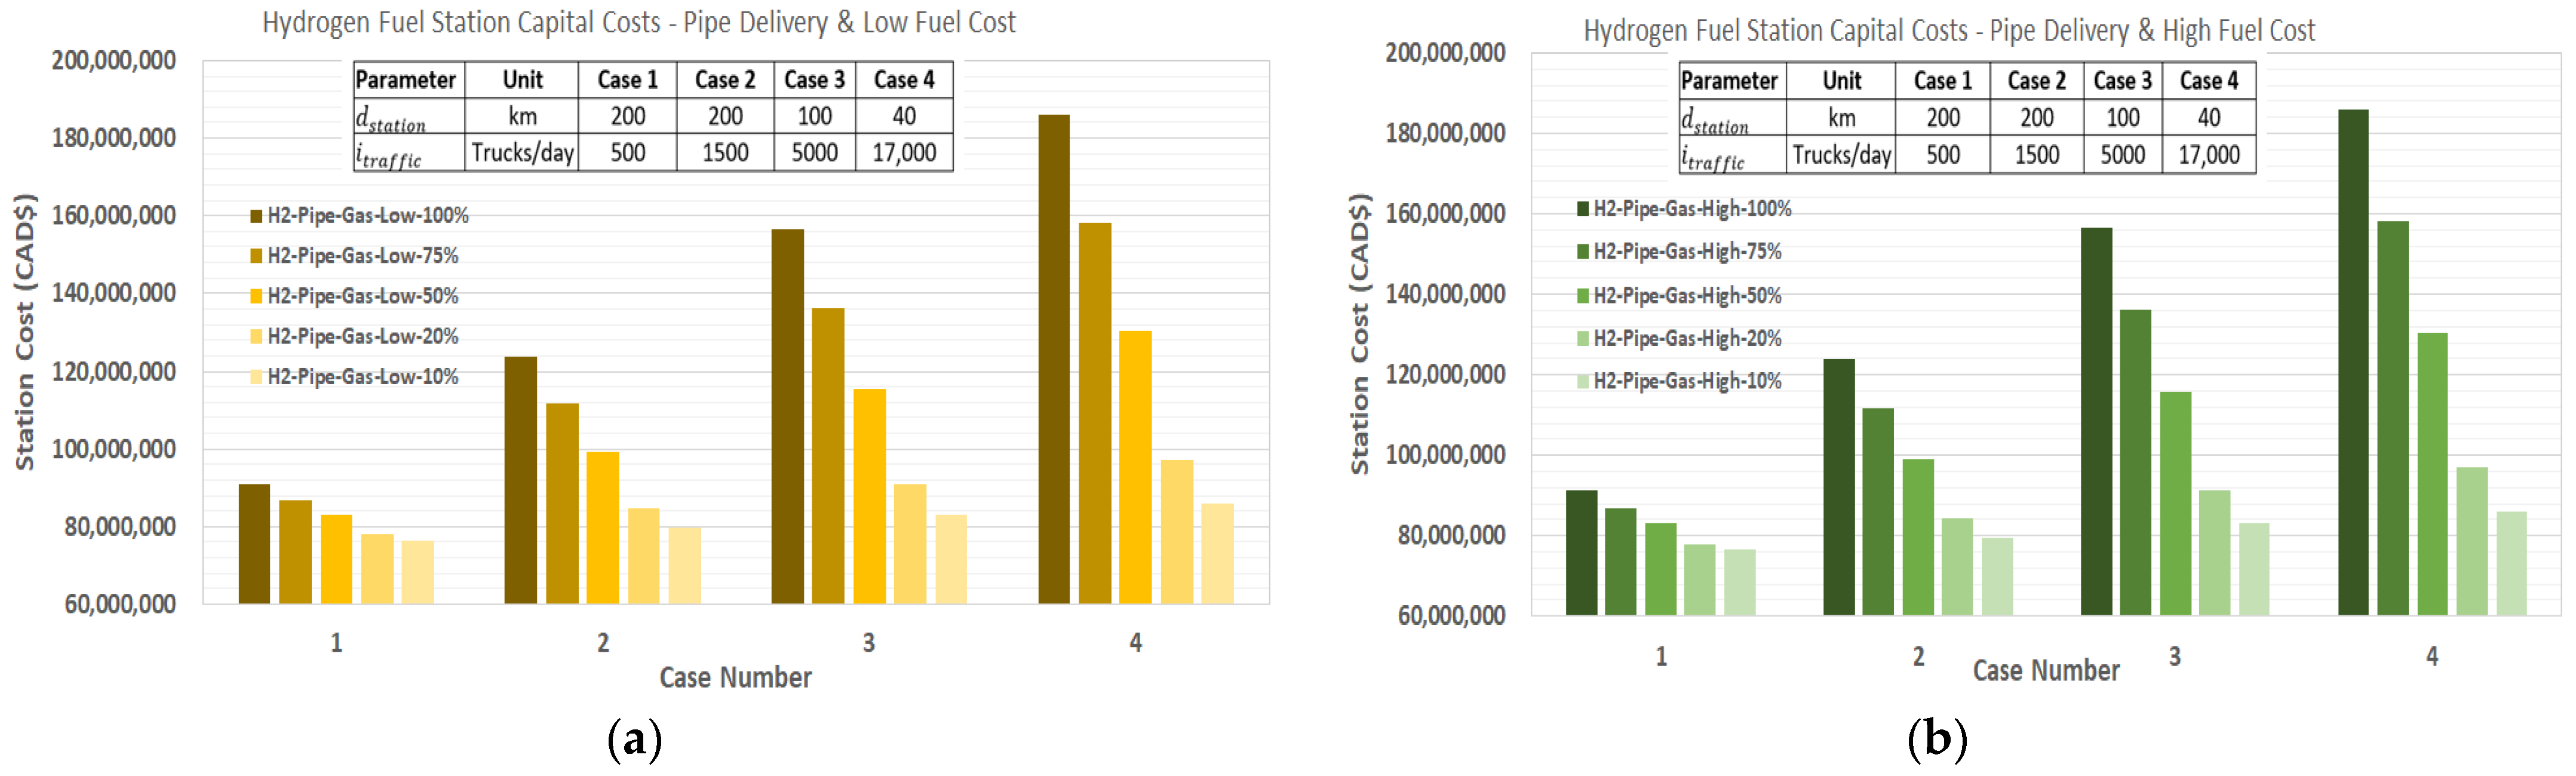
It is also apparent that the capital costs for pipeline delivery stations exceed those of truck delivery in nearly all cases. This is because of the CAD 74 million cost added for the pipeline grid connection associated with pipeline delivery. Although pipeline delivery capital investments do not include low-pressure storage costs, the amount saved by this is nearly negligible at lower traffic rates. The exception to this is Case 3 and Case 4 at 100% technology integration, where the capital costs of gaseous hydrogen truck delivery exceed those of pipe delivery.
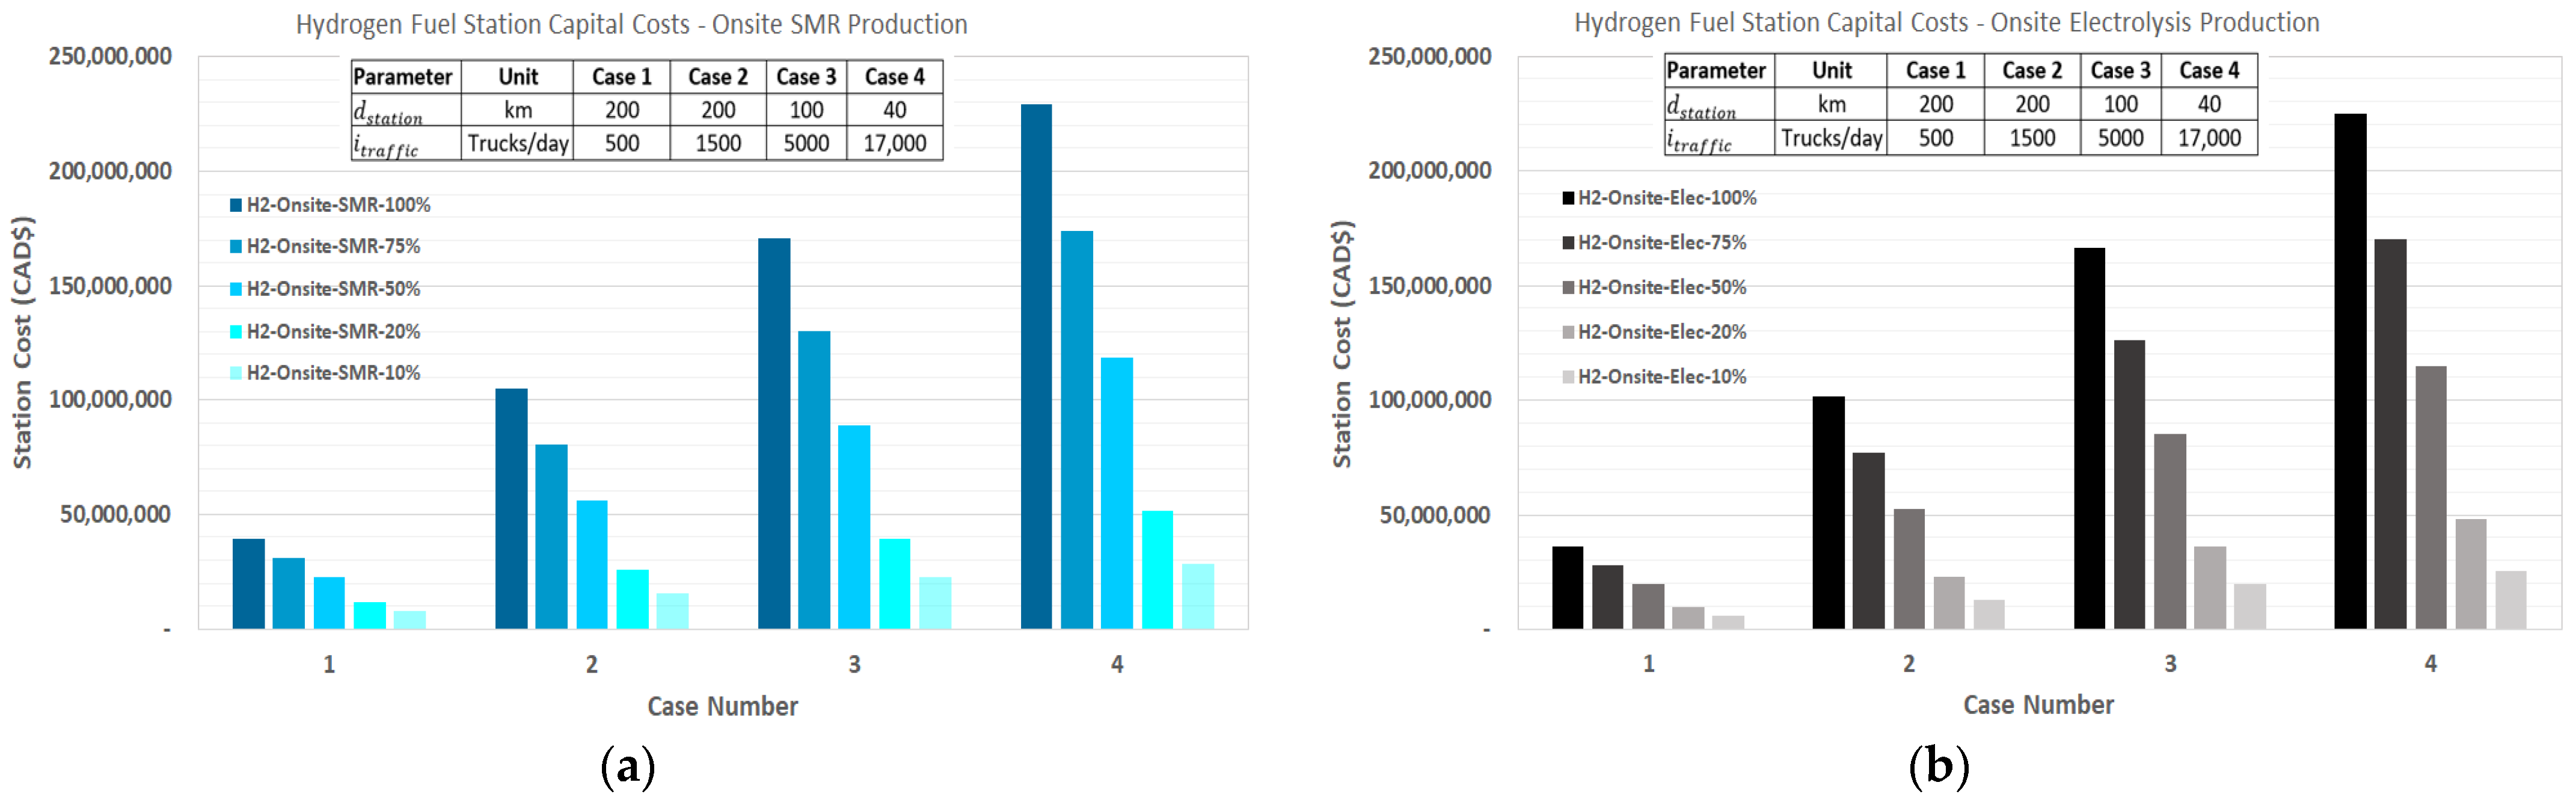
Comparing the two onsite production methods, SMR requires a slightly higher capital cost than electrolysis by a consistent CAD 2–3 million among all data points. This is simply due to the more expensive equipment associated with SMR (
Table 7 and
Table 8). Comparing these to the other delivery scenarios, Case 4 and 100% technology integration of the onsite production methods require the highest capital costs. As the technology integration decreases in Case 3, pipeline and gaseous hydrogen truck delivery overtake them for all other cases. However, liquid hydrogen truck delivery still remains the lowest capital cost in all hydrogen scenarios. Consequently, if it is favored to decrease capital costs to undertake this project, it may be beneficial to choose the liquid truck delivery method for station restock.
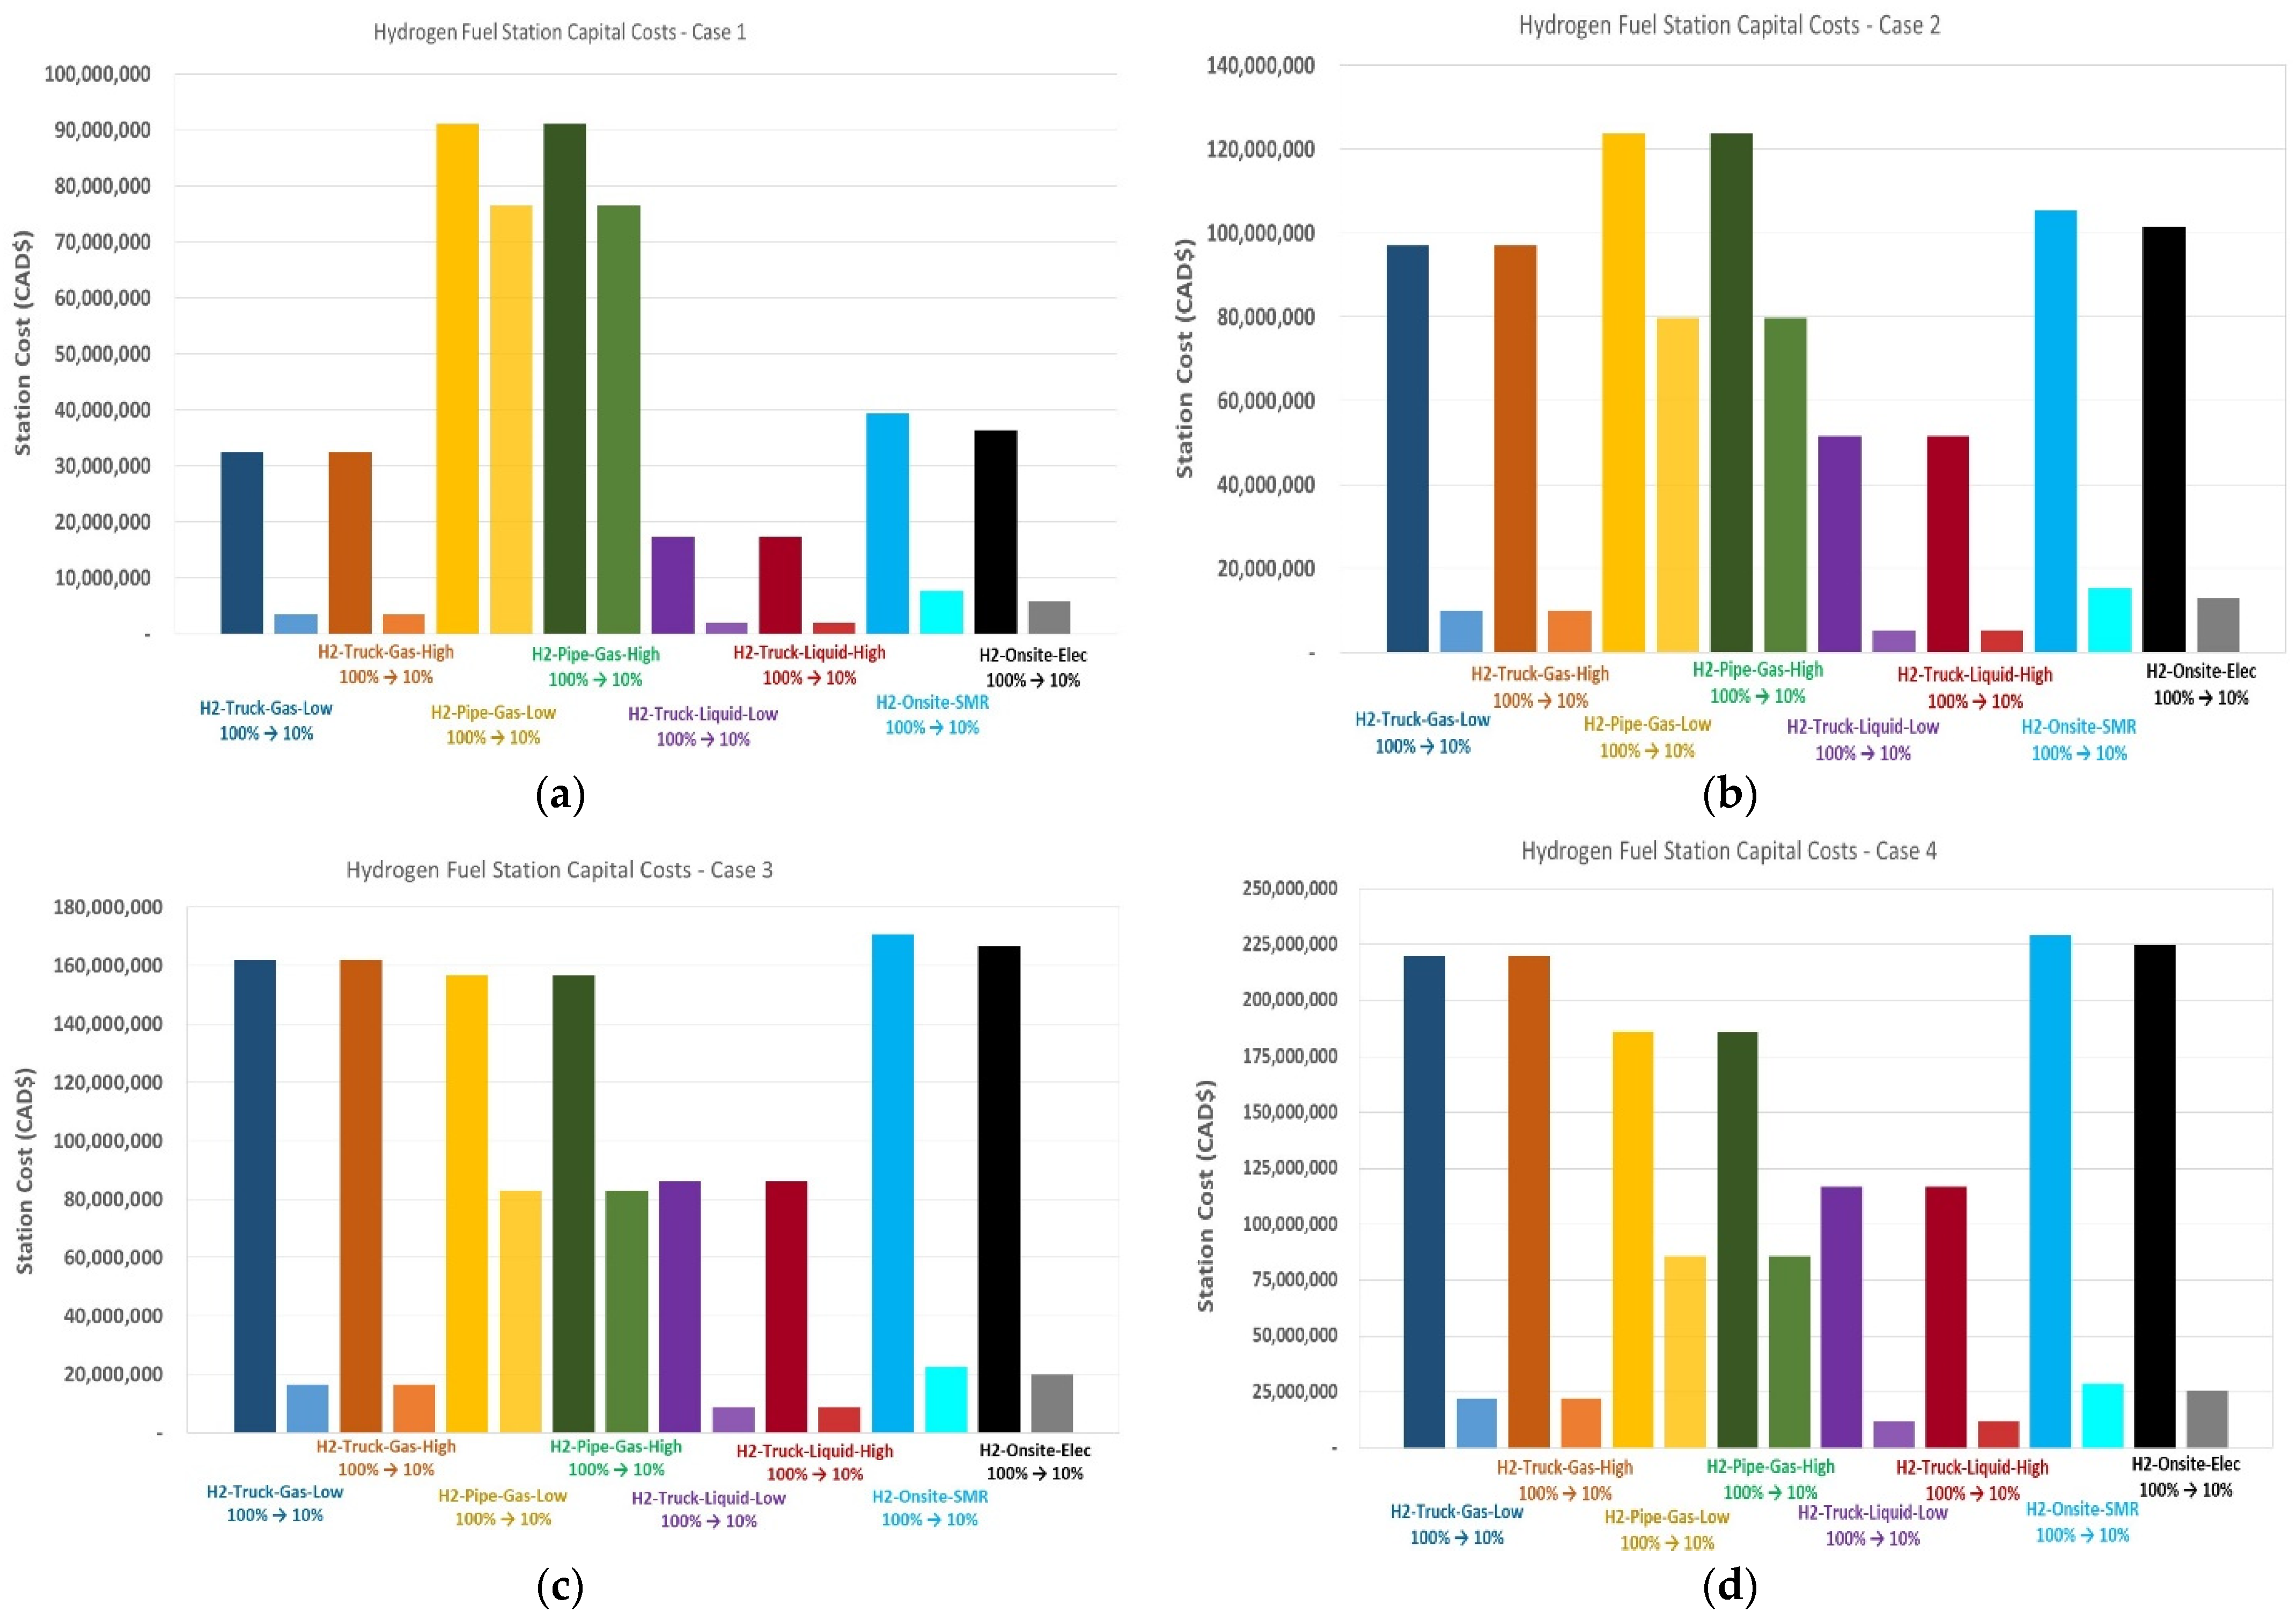
Figure 16a–d and
Table 11 show a comparison of hydrogen refuelling infrastructure capital costs for Cases 1 through 4.
It can be seen that pipe-delivered hydrogen is the most expensive option with low traffic rates (in Case 1); however, at higher traffic rates (Case 4), it is overtaken by gaseous hydrogen truck delivery and onsite production of hydrogen. This is due to the high storage cost of gaseous hydrogen that is used for both of these scenarios, as well as the cost of production equipment, all of which rely on traffic flow. The range in values for capital cost is quite significant considering that the difference between the maximum and minimum values for 100% technology integration is approximately CAD 222 million.
4.3. Hydrogen Refuelling Station Normalized Investment Costs
Figure 17a,b,
Figure 18a,b,
Figure 19a,b and
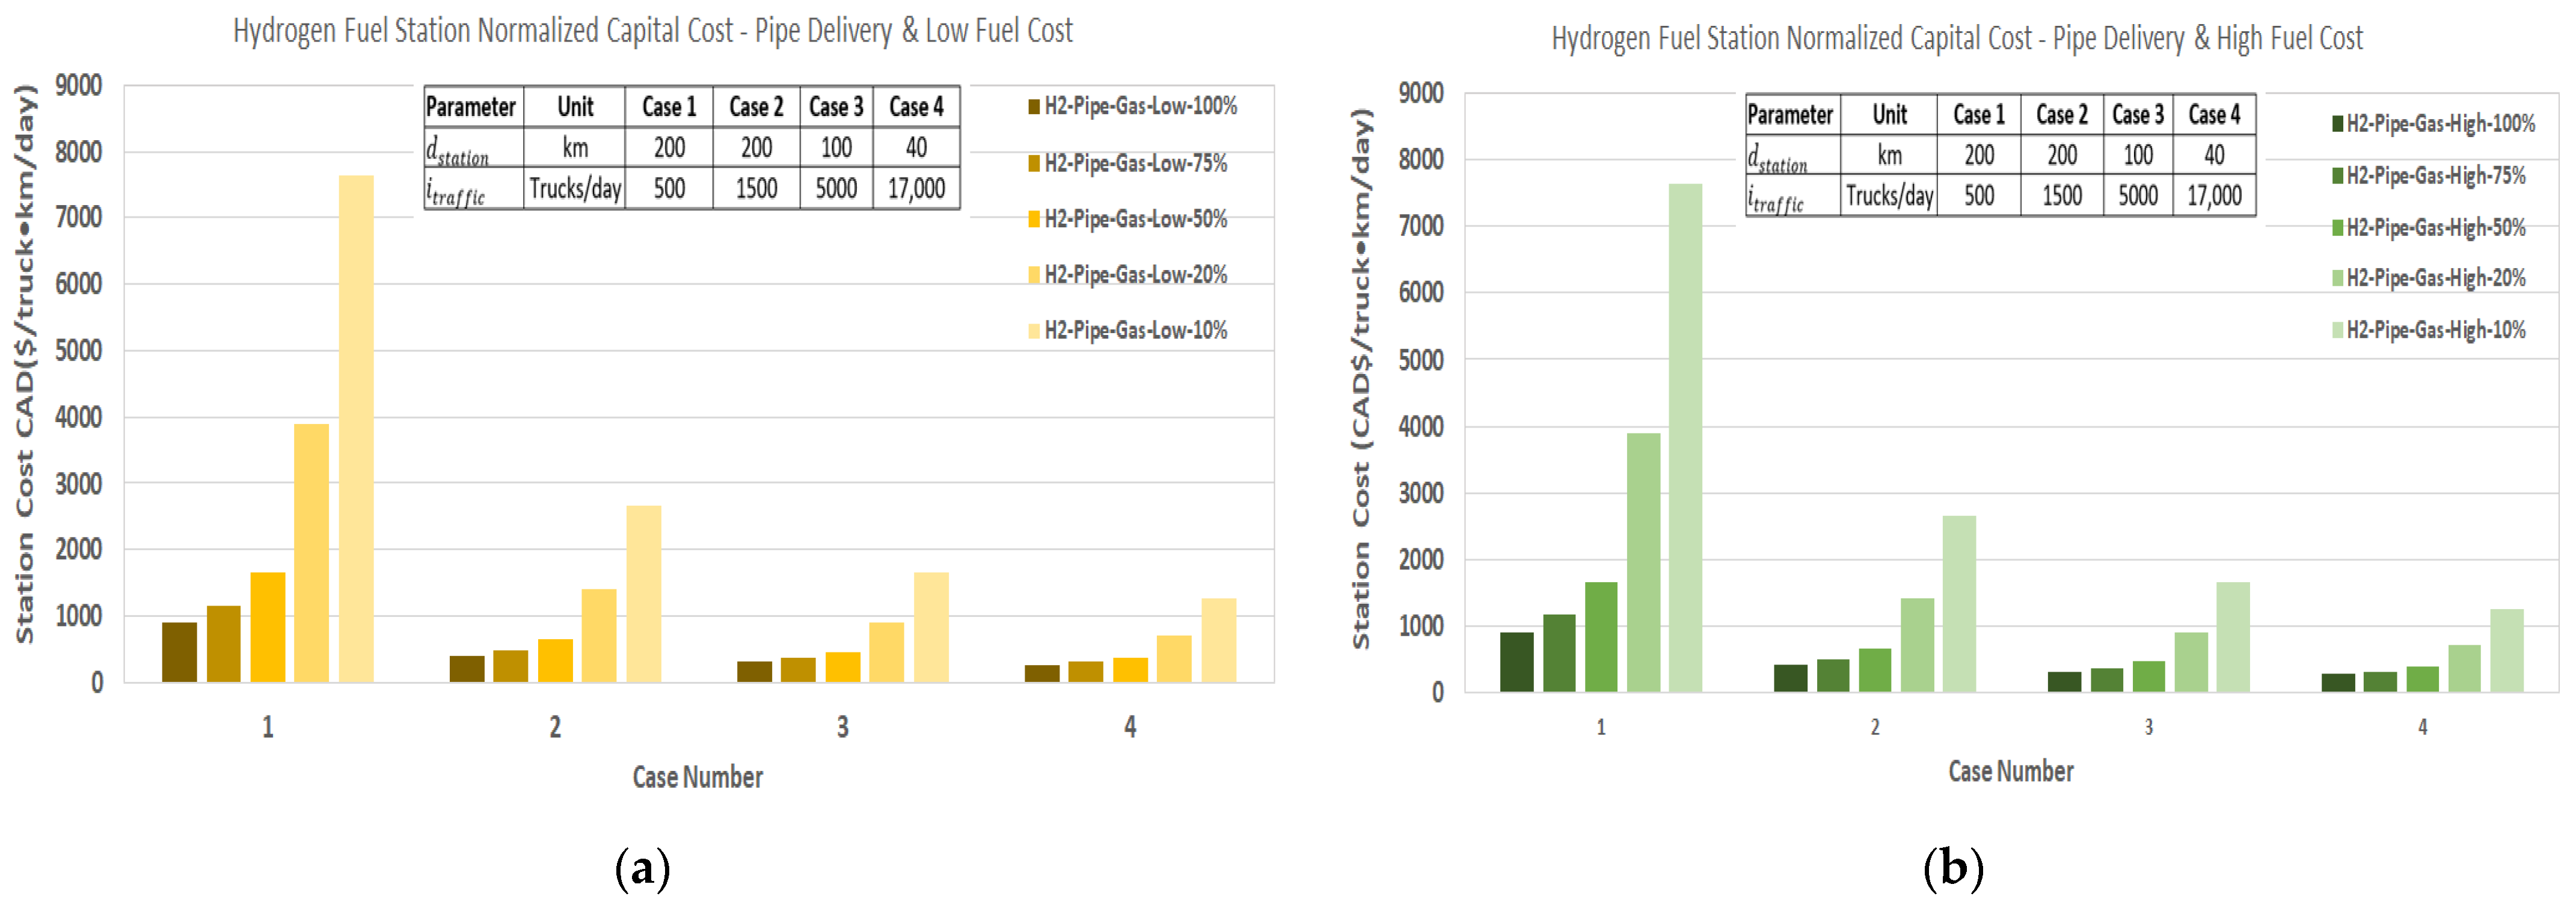
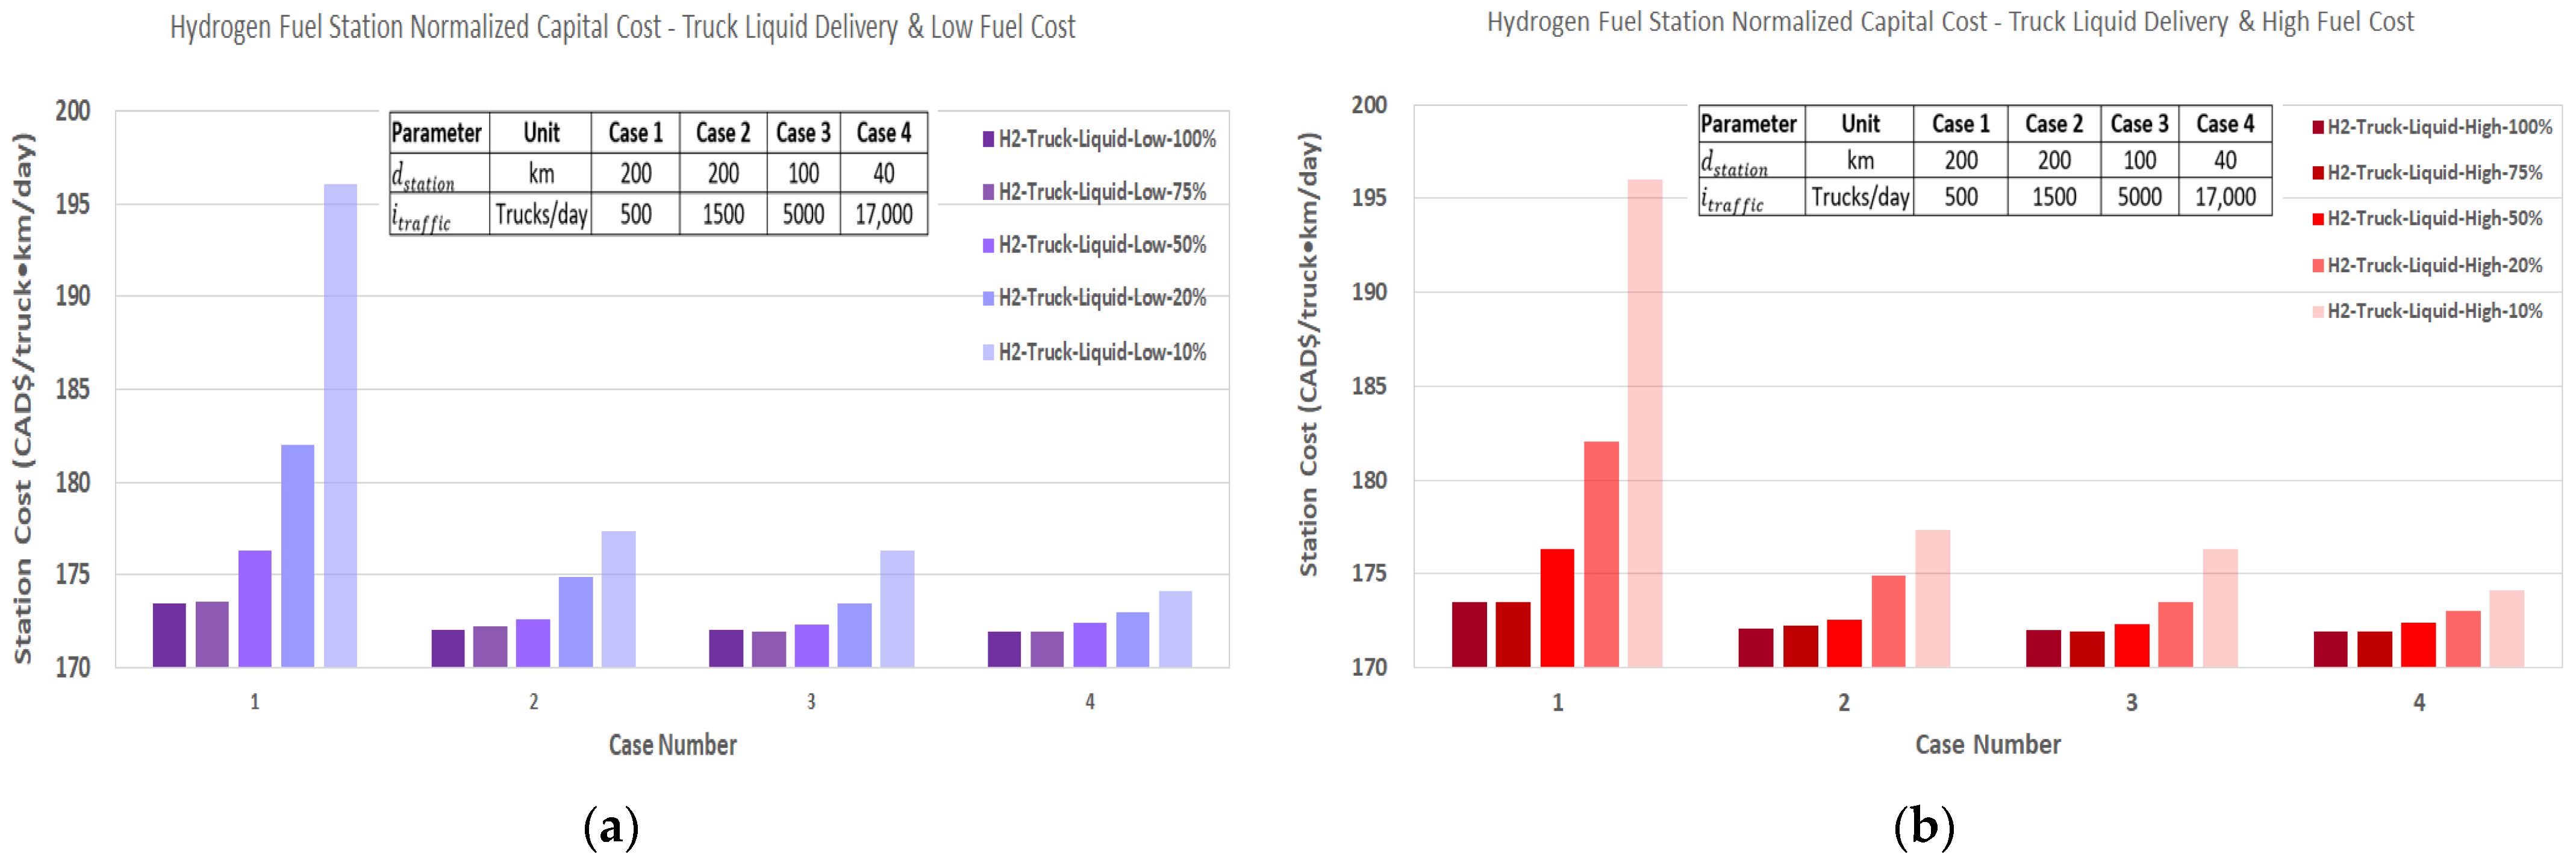
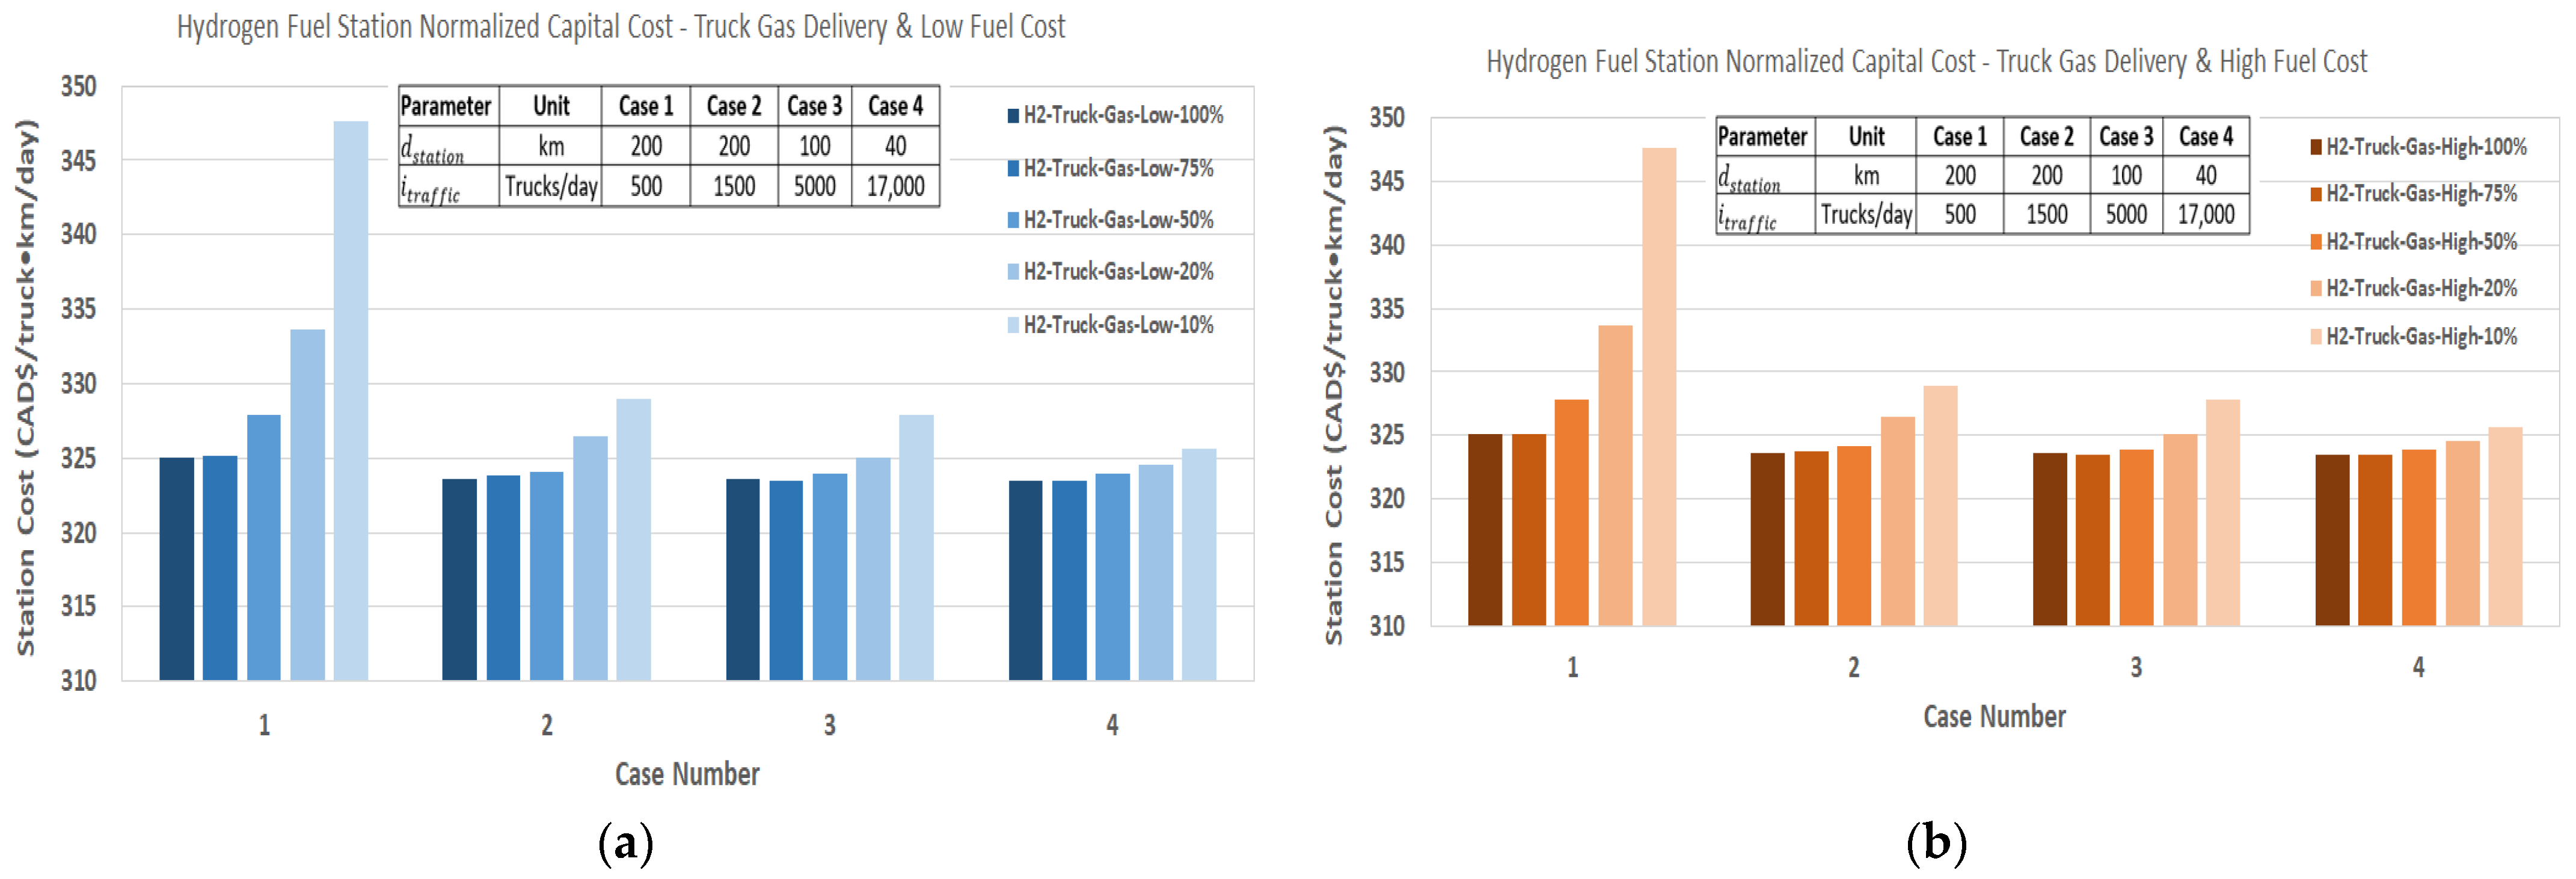
Figure 20a,b present the normalized costs. As expected, given Equation (7), the normalized capital cost has an inverse relationship with traffic and distance between stations and a linear relationship with capital cost and, therefore, does not rely on hydrogen cost. Thus, the normalized cost decreases with increasing technology integration and through Cases 1 to 4.
Following the trend of capital costs, the gaseous truck delivery method has a higher normalized cost than liquid truck delivery. Normalized costs for pipeline delivery exceed both truck delivery methods, with the exception of 100% integration of Cases 3 and 4. Pipeline delivery also has a very rapid increase in normalized cost as technology integration (or traffic) decreases. This is because of the minimal increase in capital cost for pipeline delivery compared to other scenarios by technology integration.
Due to the relationship between capital cost and traffic rate in Equation (7), a minimal decrease in capital cost and a large decrease in traffic will result in a rapid increase in normalized cost, which is the case for pipeline delivery. Meanwhile, truck delivery has a more rapid decrease in capital cost by technology integration and thus Equation (7) is more stabilized and results in a more stabilized normalized cost. Lastly, the normalized costs for the onsite production methods are very similar to one another simply due to the fact that their capitals costs are very similar.
Comparing the normalized capital cost is important in determining the success of each scenario for nationwide integration. Once again, through all cases and technology integration levels, pipe-fed hydrogen fuel at 10% integration seems to be alarmingly high throughout all cases; this is due to the very high capital cost imposed on hydrogen pipeline grid connection. Given the equation for normalized cost (Equation (4)), a very high capital cost with a low traffic rate at 10% integration yields a very large normalized cost and, thus, total investment.
4.4. Hydrogen Refuelling Station Total Investment Costs
The total investment costs are then calculated for each scenario using the method in
Section 3.2 and given in
Figure 21. This, of course, is calculated using the normalized investment cost and thus follows similar trends as seen in
Figure 17a,b,
Figure 18a,b,
Figure 19a,b and
Figure 20a,b.
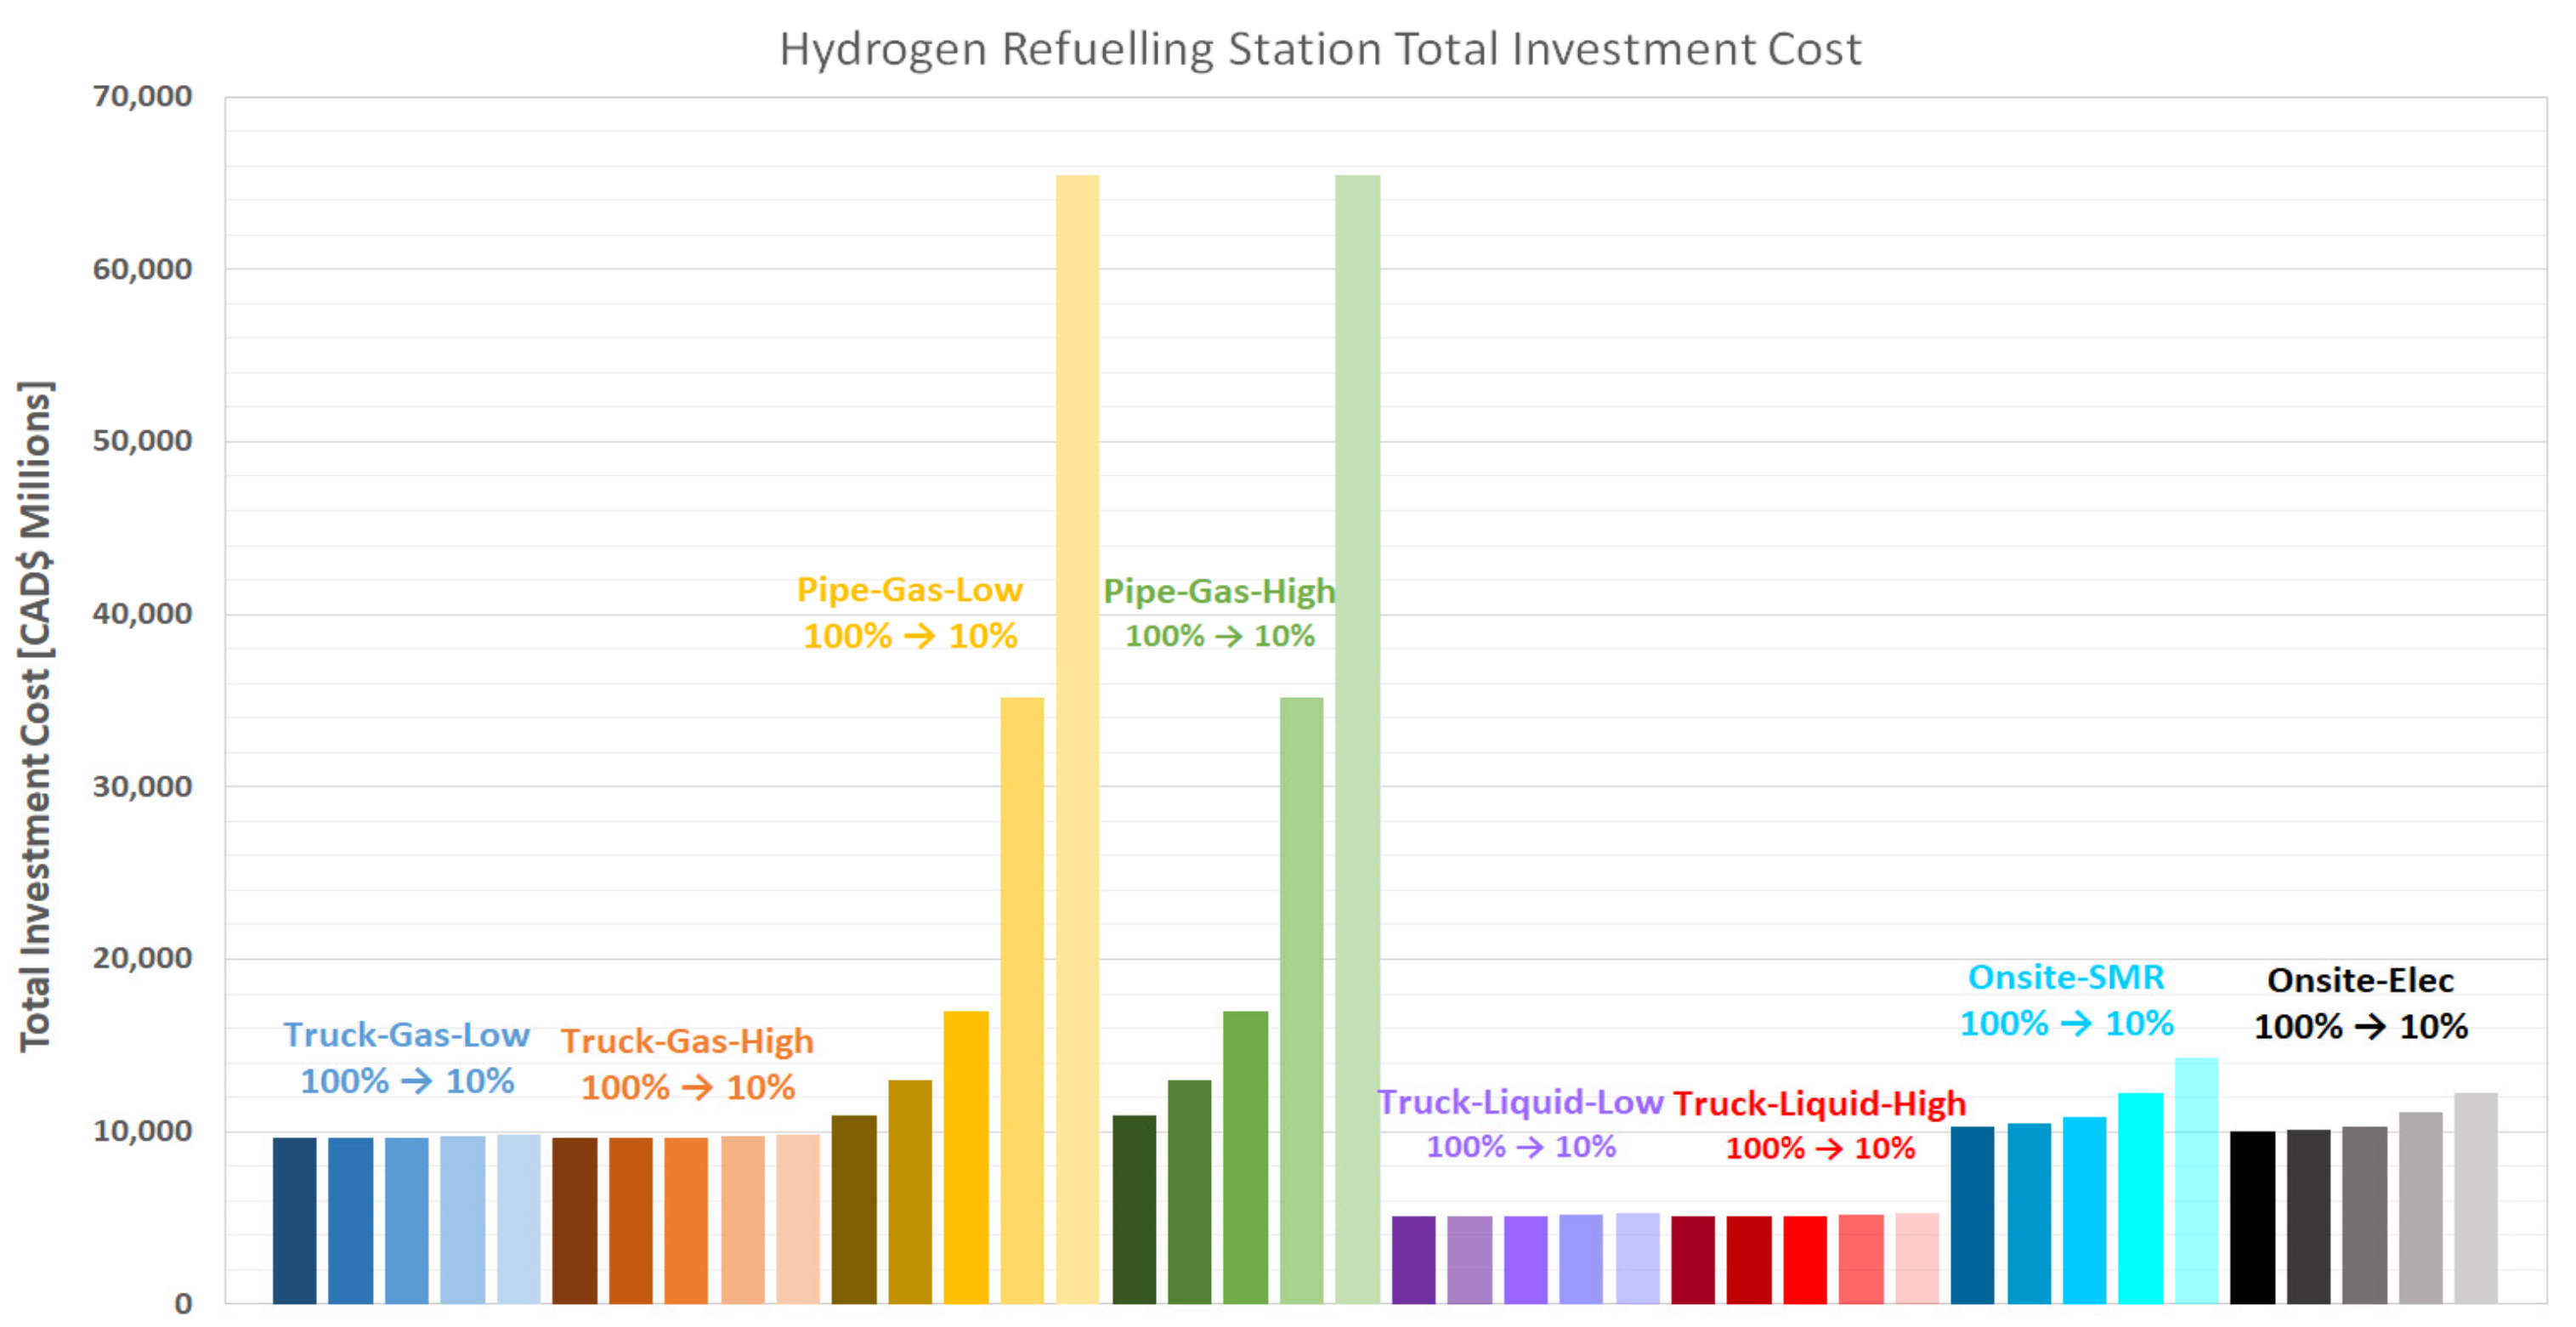
In all scenarios, the total investment cost for pipeline delivery exceeds that of all other methods. The pipeline delivery investment costs increase rapidly compared to others as technology integration decreases. This is due to the trends of rapid increase in the normalized investment costs seen in
Figure 18a,b, but amplified by nationwide integration.
Liquid hydrogen truck delivery requires a significantly lower nationwide investment than all other scenarios. The onsite production methods are very similar to gaseous truck delivery scenarios at high technology integration rates but increase as these rates decrease.
As expected, in
Figure 21, the highest normalized cost results in the highest overall total investment nationwide, which is pipe-fed hydrogen at both integration levels.
At 100% integration, pipeline-fed hydrogen is followed by onsite production methods, and then gaseous and liquid truck-delivered hydrogen. Alternatively, at 10% integration, pipeline-fed hydrogen is followed by the onsite production methods, gaseous, and finally liquid hydrogen truck delivery.
For perspective,
Table 13 displays the maximum and minimum investment values and their associated delivery methods. Pipe-fed hydrogen requires the highest total investment.
In summary, truck-delivered hydrogen stations offer, in general, the lowest total investment cost. At 100% technology integration, the total investment cost varies between CAD 5125 million and CAD 10,927 million, comprising a normalized capital cost in the order of 174–911 $/truck/km/day. On the other hand, at 10% technology integration, the cost ranges between CAD 5273 million and CAD 65,429 million, comprising a normalized capital cost of 196–7644 $/truck/km/day. The highest is shown by pipe-delivered hydrogen and onsite hydrogen production processes using high technology integration methods.
These aspects are likewise particularly crucial to the realization of hydrogen fuel integration in terms of guaranteeing funding. Government funding and/or investment by companies is crucial for such a huge project. Proposing an irrationally expensive project to these stakeholders could be unfavorable to its accomplishment. Meanwhile, low or modest capital and investment costs will substantially support the foundation and empower the conversion to hydrogen by supplying credible rationales and sound justifications for the success of hydrogen as a feasible, sustainable, and reliable alternative fuel in the long-haul trucking industry. Some useful considerations on the above aspects and on the ways to advance the optimization of supply chain management using, for instance, the product–service system (PSS) method, aiming at combing the needs of manufacturers and customers in an efficient and effective manner, can be found in [
48,
49].
4.5. Sensitivity Analysis
A sensitivity analysis was performed on the 40 scenarios, including the parameter variance by case (Cases 1–4), in order to investigate the effect of refuelling stations’ capital cost reduction on the selling price of hydrogen. The aim of this sensitivity analysis was to predict the selling price based on future hydrogen infrastructure resulting from economies of scale. For each case, the project capital cost was reduced between 5% and 25% in 5% increments, and the selling price of hydrogen was re-calculated. Results indicate that reductions in capital cost variations in the range from 5% to 25% result in hydrogen taxed selling price reductions in the range from 0.10% to 16.21%. The detailed analysis for the main scenarios is provided in
Appendix A,
Table A1,
Table A2,
Table A3,
Table A4 and
Table A5.
5. Conclusions
Hydrogen fuel, which is a safe substitute for fossil fuels, is expected to substantially reduce the rate of GHG emissions into the environment from combustion engines [
13,
14,
15,
16]. HDVs are notorious for emitting a very large proportion of these harmful gases and have thus become the subject of growing concern by regulators globally. However, a major limitation to the proliferation of this desirable hydrogen-fuelled vehicles option is the intricate refuelling stations that vehicles will require.
This study investigated in detail the viability of setting up a nationwide network of hydrogen refuelling stations to enable the transition of ICE-powered heavy-duty vehicle fleets from diesel fuel to hydrogen fuel. To achieve this objective, a techno-economic model was developed to simulate a network of refuelling infrastructure using hydrogen across Canada. It took into account varying technology integration levels, truck traffic flows, and operational methods, including truck and pipeline delivery of hydrogen to stations, and also considered the possibility of producing hydrogen onsite. The model proposed and created for this study predicted important economic parameters such as the selling price of fuel, capital costs for station construction, and also provided an estimate of the total investment cost for infrastructure that will be required for a nationwide refuelling station. A wide range of results were obtained for each of these parameters, which indicated that the selling price of the hydrogen gas pipeline delivery option will be more economically stable because the high commodity delivery costs that are usually associated with truck delivery will be eliminated. Specifically, it was found that at 100% technology integration, the range in selling prices was between 8.35 and 25.10 CAD$/kg. Alternatively, at 10% technology integration, the range is from 12.70 to 34.12 CAD$/kg. On the other hand, truck-delivered liquid hydrogen generally required the highest selling price due to its very high operational storage costs. Selling price is a very important parameter in this study as it is the only dataset that directly affects the users within the long-haul trucking industry. It may be the factor that convinces Canadians and national businesses to transition from diesel to hydrogen trucks. Introducing lower costs and an environmentally friendly option for long-haul trucking is the main motivating factor for the national acceptance of hydrogen fuel.
As shown through this study, truck-delivered hydrogen stations provided the lowest total investment cost, which includes capital costs and normalized investment cost. At 100% technology integration, the total investment cost ranges between CAD 5125 million and CAD 10,927 million, representing a normalized capital cost in the range of 174–911 $/truck/km/day. In addition, at 10% technology integration, the cost ranges between CAD 5273 million and CAD 65,429 million, representing a normalized capital cost of 196–7644 $/truck/km/day. The highest is shown by pipe-delivered hydrogen and onsite hydrogen production processes using high technology integration methods. These factors are also extremely important to the success of hydrogen fuel integration in terms of securing funding. Government funding and/or investment by corporations is critical for such a huge project, and therefore, presenting an unreasonably expensive or exorbitant project to these investors could prove detrimental to its success. Conversely, low or modest capital and investment costs will significantly promote the cause and enable the transition to hydrogen by providing plausible reasons and convincing arguments for the success of hydrogen as a viable, environmentally friendly, and safe alternative fuel in the long-haul trucking industry for the future. It is also worthy of mention that although hydrogen technology is still in its early deployment stage, yet over time, it has the potential to be very economical and stable because of the benefits of equipment cost reduction, as revealed by the sensitivity analysis. However, for the time being, as this study has shown, hydrogen technology still requires either very high investments or high selling prices to initiate and maintain a project such as this. It is important to note that hydrogen technology is currently expensive because of low deployment; once it is more developed and deployed widely, the refuelling infrastructure cost is expected to decrease significantly.
The methodology and techno-economic models developed in this study could be used to design a national network that is optimized for investors and trucking businesses in terms of low emission rates, fuel and resource availability, ease of construction, and reasonable project deadlines. These benefits can all be harnessed to build a network of hydrogen fuel stations that is both economically and environmentally sustainable.


