1. Introduction
This paper is an extension of the work originally presented at the TEMSCON conference in October 2020, entitled “Virtual and Augmented Reality Applied in Power Electric Utilities for Human Interface Improvement—A Study Case for Best Practices” [
1].
The emerging of new technologies and the arrival of the Fourth Industrial Revolution have favored the development of intelligent cities concept [
2] and transformed the electrical sector on the way [
3]. Thus, a need for technological development through intelligent management of assets and distribution network infrastructures surges [
1,
2,
3,
4]. In 2002, the term digital twin (DT) was introduced by Michael Grieves and immediately showed great innovative potential to be applied in electric power utilities due to the potential such tools have to bring improvement for the electric power grid operation, by reducing unplanned interruptions and improving the maintenance process of active network assets [
5]. According to Gabor et al. [
6], the DT is a special simulation, built on specialized knowledge and real data collected to perform a more accurate simulation at different scales of time and space. One can say that DT is a digital representation that can portray a system, a process, or a service [
7]. Thus, it indicates being a good tool for the improvement of labor services at the human interface (HI) layer of energy utilities.
DT is commonly known as a replica, or a virtual model of an object or physical structure [
8]. Its scanning process occurs through data, sensors, scanners, and simulators, which make it possible to monitor, optimize, and control those assets in real-time [
9]. According to [
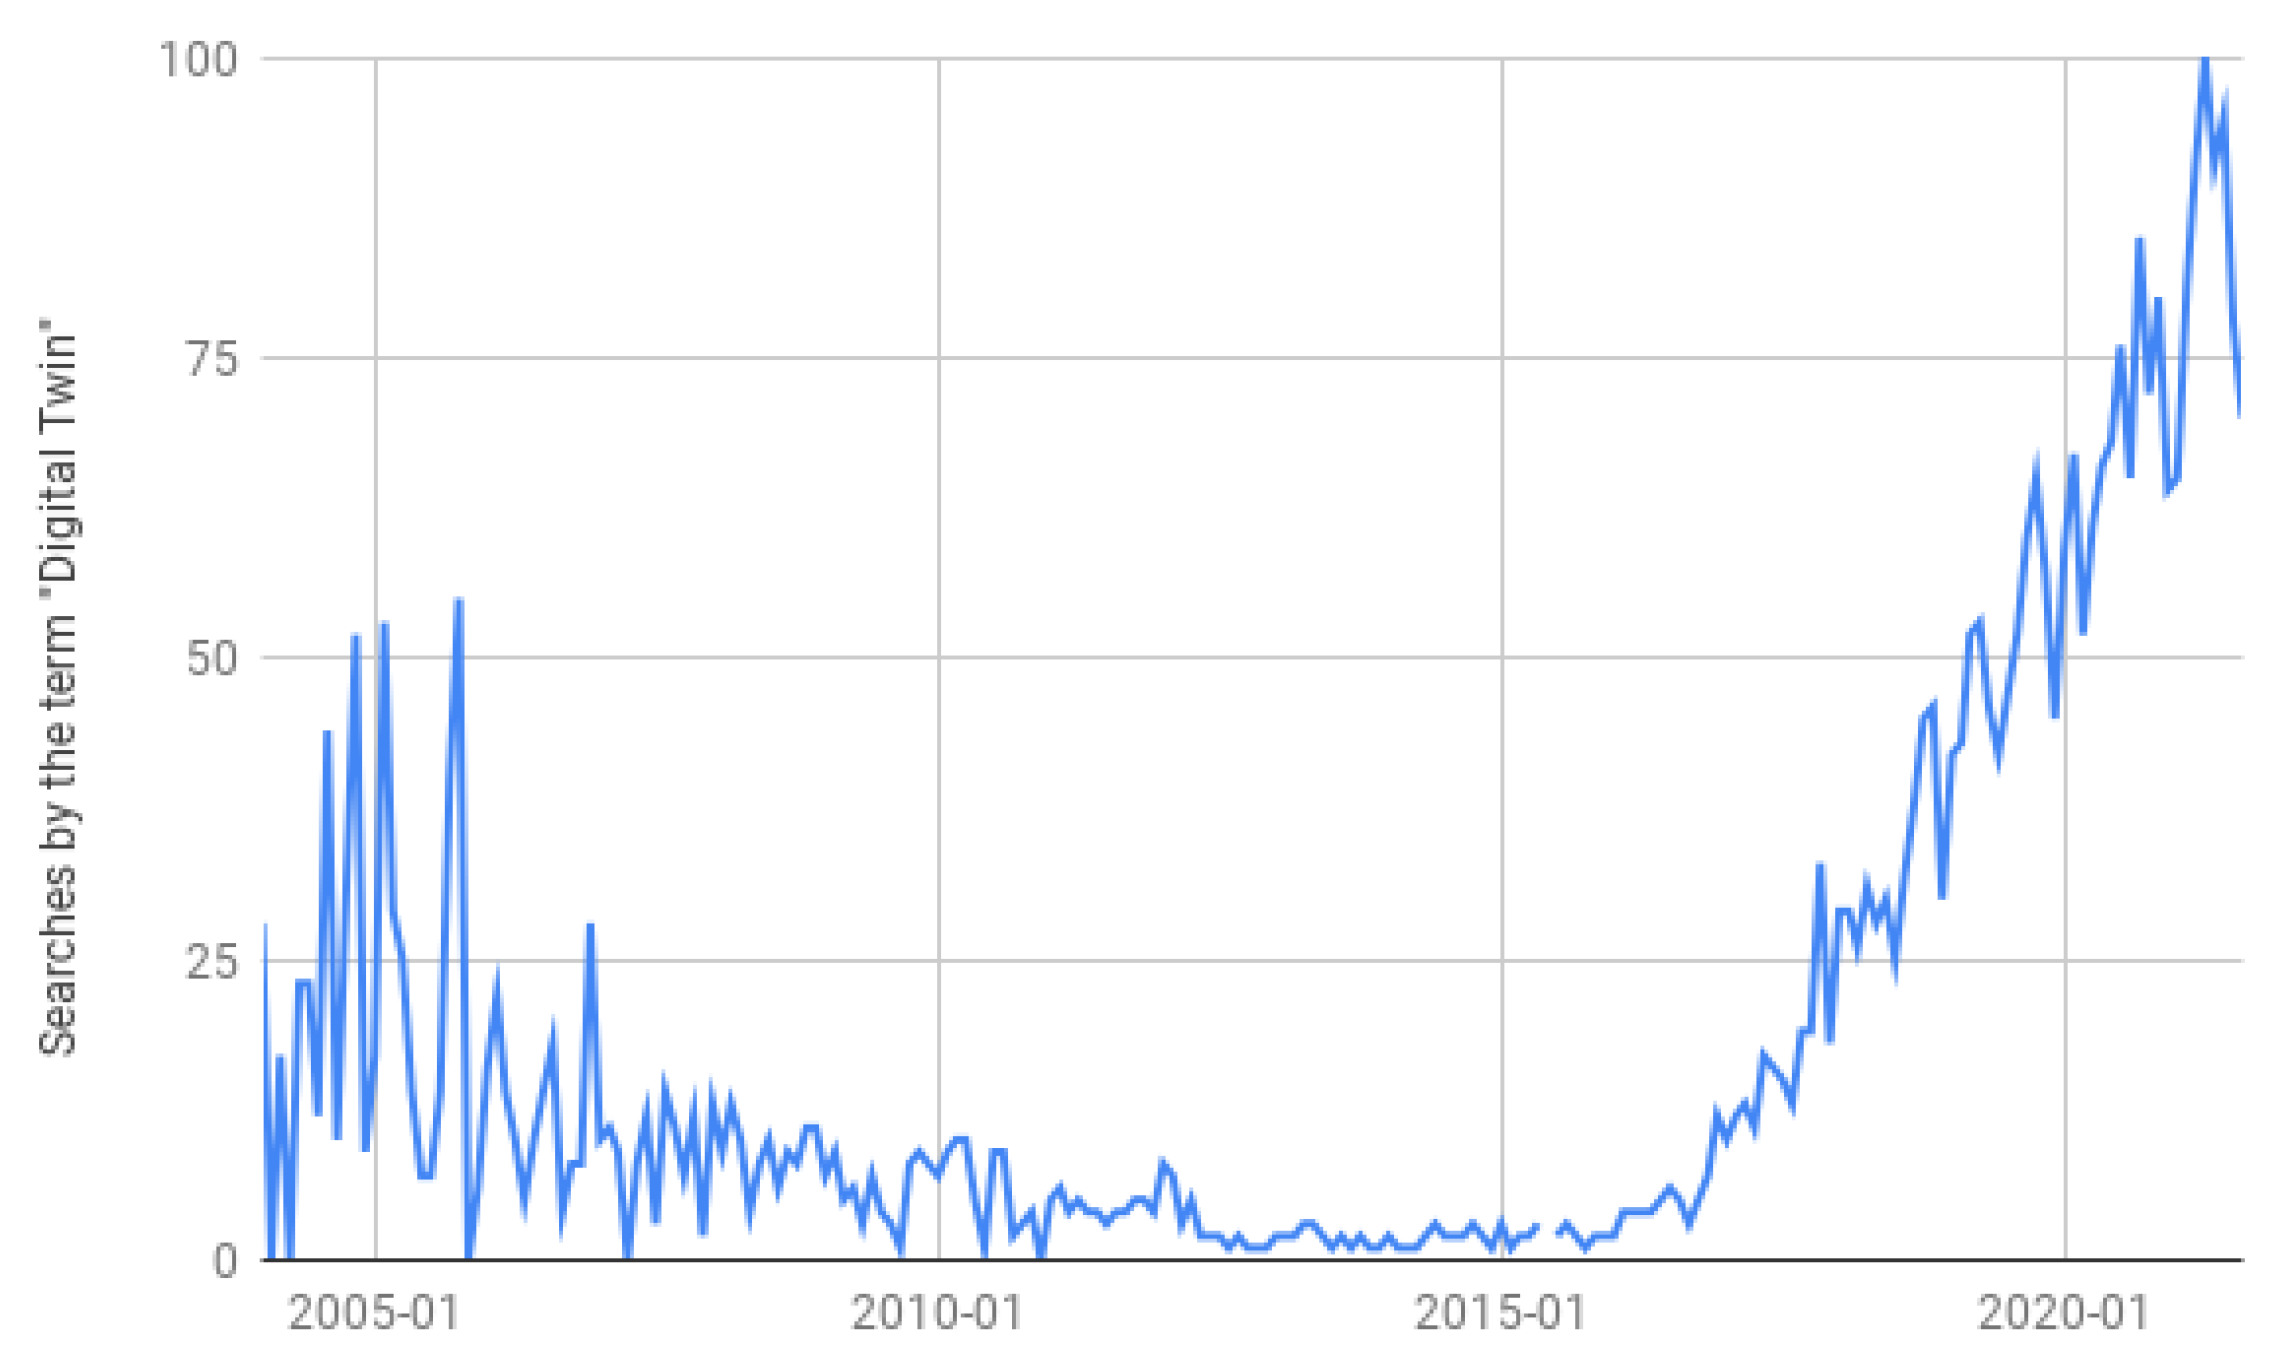
10], the DT has three main milestones: the year of its conception (2003), which is described as the training stage; the first published theoretical work (2011), which initiated the so-called incubation stage; and, finally, the first published practical work (2014), demarcating the growth stage [
11]. The graph in
Figure 1 shows the number of times the term “Digital Twin” was searched on the Google search site from 2004 to August 2021. It is interesting to observe that there has been an exponential growth in interest in DT in recent years.
The DT implementation brings great benefits to the electrical company. It provides faster inspection of the network and more control in the assets management and efficiency for the anomalies identification [
12]. Furthermore, it increases safety and productivity during field activities.
Enel conceived the Network Digital Twin©(NDT) and applied this technology for the first time in Brazil, within the scope of the R&D project called Urban Futurability (UF), which is an innovation project engaging local stakeholders and communities in a living lab where the electricity network works as a platform to originate, enable, and develop new urban services and sustainable living [
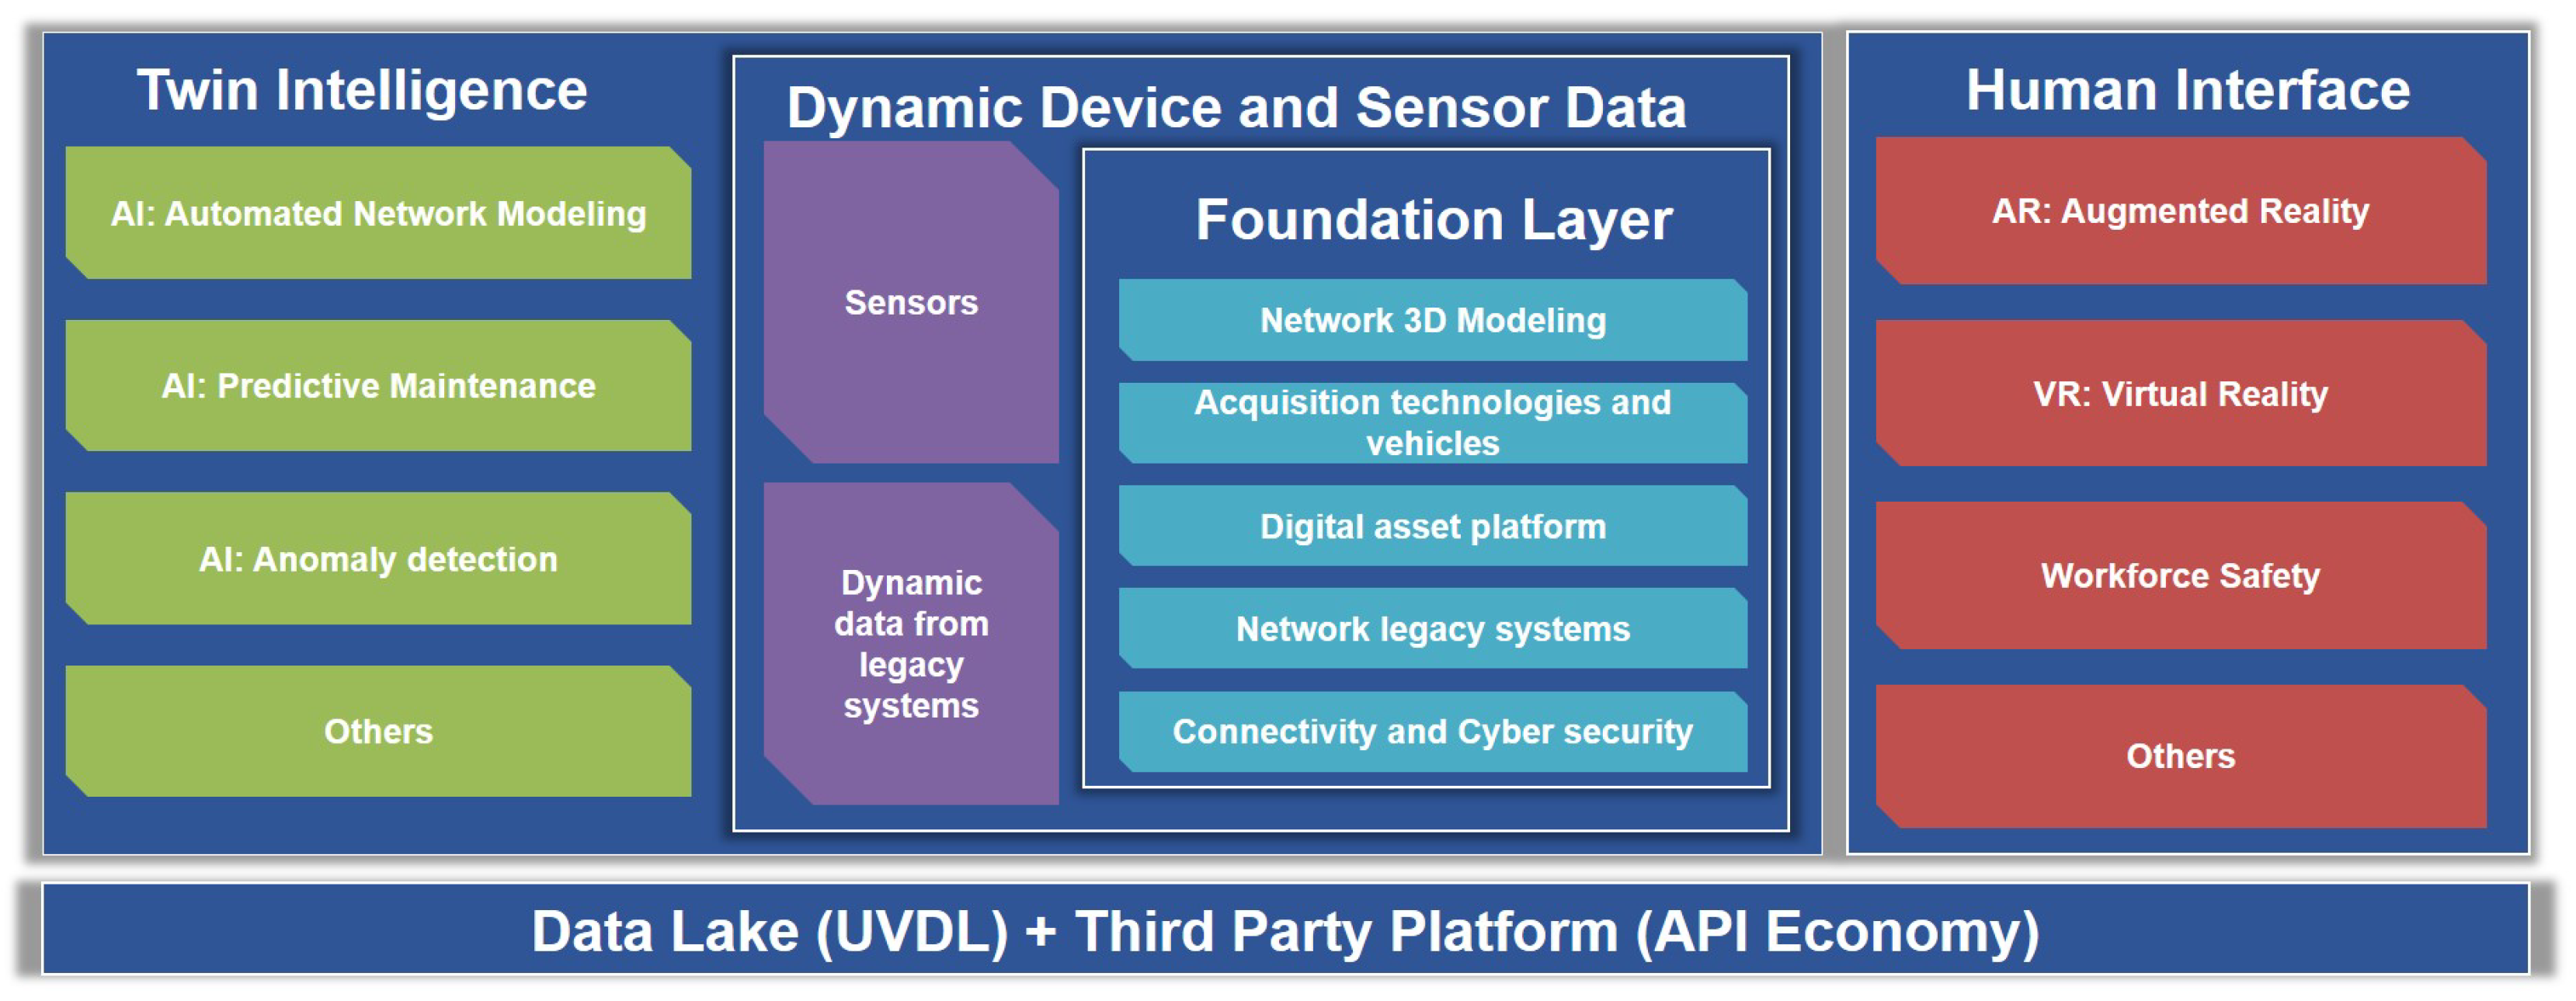
13]. The project area extends through Vila Olímpia, a neighborhood in São Paulo, where thousands of people live and work every day. To better develop the NDT©in Brazil, four layers were designed through the project: the Dynamic Devices—which includes the foundation layer, the Twin Intelligence, and the HI layers.
Figure 2 illustrates those layers and their sublayers.
The foundation layer is the basis for digital network modeling. It includes the global 3D modeling repository, systems methodologies to gather on-field images such as vehicle usage, a digital platform development and legacy system integration, data universalizing, and cybersecurity criteria. The layer of dynamic devices and sensors data increases the vision of the previous layer with the real-time monitoring of assets through the internet of things (IoT) devices, providing a dynamic DT. The artificial intelligence (AI) layer aims to automate activities that are currently carried out manually, such as anomaly detection and register update. This layer includes vegetation management and shift from corrective to predictive maintenance. In the HI layer, there is virtual and remote assistance through augmented reality (AR) and new tools for field force empowerment, e.g., thermal cameras, smart bluetooth badges, remote assistance with AR features, and the use of virtual reality (VR) for training. While the foundation and dynamic and sensor layers are the basis of NDT© development, the twin intelligence and HI Layers are the DT on-field application. Among the layers, a universal virtual data lake unifies the information shared within all the DT applications. The third-party platform aims to share the information with stakeholders who can use it to increase network digitalization.
Regarding the Twin Intelligence work front, the UF project published three papers: the aim of [
14,
15] is to present the concept of Predictive Maintenance 4.0, the building blocks of a predictive system architecture, its applications in the electricity sector, and its benefits as an innovative technology. In [
16], the authors describe the potential to use an UAV in scanning almost three hundred underground structures (transforming chambers and manholes) for initial tests, with the possibility of expanding the use to thousands of other structures.
The Dynamic Device and Sensor Data studies are described in five papers: Ref. [
17] shows how thermographic devices can facilitate the early detection of faults in the electrical distribution network before they can cause interruption of operation and cause damage and incidents due to short circuits and fires. The study in [
18] proposes the digitalization and 3D modeling of the power distribution network through a Mobile Mapping System (MMS) with different technologies that compound the NDT©. The case study presented in [
19] shows a practical example of the usage of the GPR in the underground distribution grid in the city of São Paulo, Brazil. In [
20], the authors describe the use of a thermographic camera in the MMS. The camera is attached to a vehicle for testing in an area of 150 km of a medium voltage network. The overhead transformer monitoring device described in [
21] aims to provide the utility with more information about the main asset of the overhead distribution network and the transformer, with the data of the electrical quantities on the low voltage side of the transformer and calculation of the temperature of the transformer’s hot spot, in order to avoid major damage to the distribution network and mitigate any errors not detected by the utility.
The Human Interface work front resulted in the publication of four papers: Ref. [
1] aims to evaluate VR and AR analyzing their trends towards an innovative technology applied to energy utilities. In [
22], the authors have as a main goal to observe what is needed to have a complete VR application in a risky operation in the electricity sector and propose features that can improve immersion and satisfaction in VR training procedures. The solution described in [
13] implements PPE (personal protection equipment) management courses and resources with the objective of guaranteeing and safeguarding the lives of employees working in field activities. In addition, it provides an update of inspection information in real time, in order to improve training and PPE management. The study in [
23] proposes a smartphone application with the objective of simplifying the access to information during the execution of activities in the field. The app can automatically recognize some assets and show relevant information about them in Augmented Reality.
Regarding the Data Lake, the study is presented in one paper: Ref. [
24] presents a Data Lake solution with its architecture in the UF project. This Data Lake approach uses databases from new systems deployed by the project and databases from the company’s legacy systems with structured data, e.g., GIS, semi-structured as XML files and unstructured data, e.g., maintenance files as data sources.
To carry out the foundation layer, some different technologies are used. One of them is a mobile mapping system (MMS) [
18], whose main objective is to build the basis of the DT model of the power grid. The MMS consists of the creation of a 3D point cloud model in conjunction with the capture of visual and thermographic images of the network. This foundation layer along with the dynamic devices layer, through their 3D modeling generation and real-time information gathering, provides static and dynamic data to the twin intelligence layer. With the AI services, the NDT© optimizes the time spending in routine activities of the distribution network through the HI layer, reducing costs with materials and operational processes of the company. Furthermore, the HI layer aims to increase the workforce operation ability with VR and AR training and on-field AR guidance application.
Through the foundation layer, contactless 3D scanners use radiation technology (lasers, infrared, X-rays, etc.) to perform the overhead network scans, where each radiation has a specific technique for scanning the data. Laser scanners are used to capture points with high precision on the surface of an existing physical object or region (e.g., power substation and overhead cables) and save these data as a point cloud. Infrared technology will be used to obtain a precise measure of asset distance or a real position for utility legacy systems.
Regarding the underground networks, the foundation layer uses unmanned aerial vehicles (UAVs), also called drones, to gather underground vault 3D and thermal images. The drones are used in closed ambients to inspect, and they count with a high-resolution digital camera and a thermal camera on-board, so they can examine the structures and surfaces of network assets, generating thermographic images for data formation and on-field inspection operation. In general, the use of this equipment makes it possible to reduce the risk of accidents, as it reduces the need for people to enter into confined spaces. These structures are full of biological, electrical, ergonomic, and other related risks. Thus, the objective is to bring more safety to the inspection processes and reduce the fault tracking time, increasing the assertiveness of maintenance [
16].
In addition to the use of drones, ground-penetrating radar (GPR) technology is also used to build the 3D model. The GPR is capable of capturing reflections on the ground, forming high-resolution lines of shallow subsurface and underground utility cables. These lines are processed by a specialist who draws a final 3D model. The equipment works with a wide frequency range: the low-frequency waves allow for identifying larger objects at greater depths, and the high-frequency waves detect smaller objects at lower depths [
19].
This work proposes to expose a trend for the use of the DT directed towards the electric power utilities and also presents a case study applied in a Brazilian energy distribution utility. As a result of the project, this article describes the implementation of the technologies showing the main form of field application in the electrical sector and the foundation layer outputs. Finally, the overall cost–benefit analysis is evaluated.
Background
The Vila Olímpia neighborhood is considered the financial heart of São Paulo. Several corporations headquarters are located in this area, as well as a huge diversity of electrical installations. For this reason, the UF project selected this region. It has all the elements that can be found in a distribution network utility: primary and secondary substations, overhead and underground grids. In addition, it serves almost 100,000 customers (commercial, residential, and industrial) in an urban environment. Currently, the region has about 15 km of underground grid and 28 km of overhead grid in medium voltage (MV), of which 4.8 km will be converted into underground during the project. In low voltage (LV), the underground grid is 17 km, and the overhead grid is 21 km. In addition, there are 16 feeders and over 500 transformers in a region of high load density.
The project aims to demonstrate in a real live laboratory scenario the benefits of the complete digitalization of an urban area in a megacity, starting from the electrical grid, involving and engaging all local stakeholders. The technological solutions to be deployed include all the best network technologies developed by Enel Distribuição São Paulo for network improvement, network automation, connectivity, field operation technologies, and sensing, allowing the implementation of the NDT© based on the complete digitalization of the neighborhood and the Enel’s infrastructure.
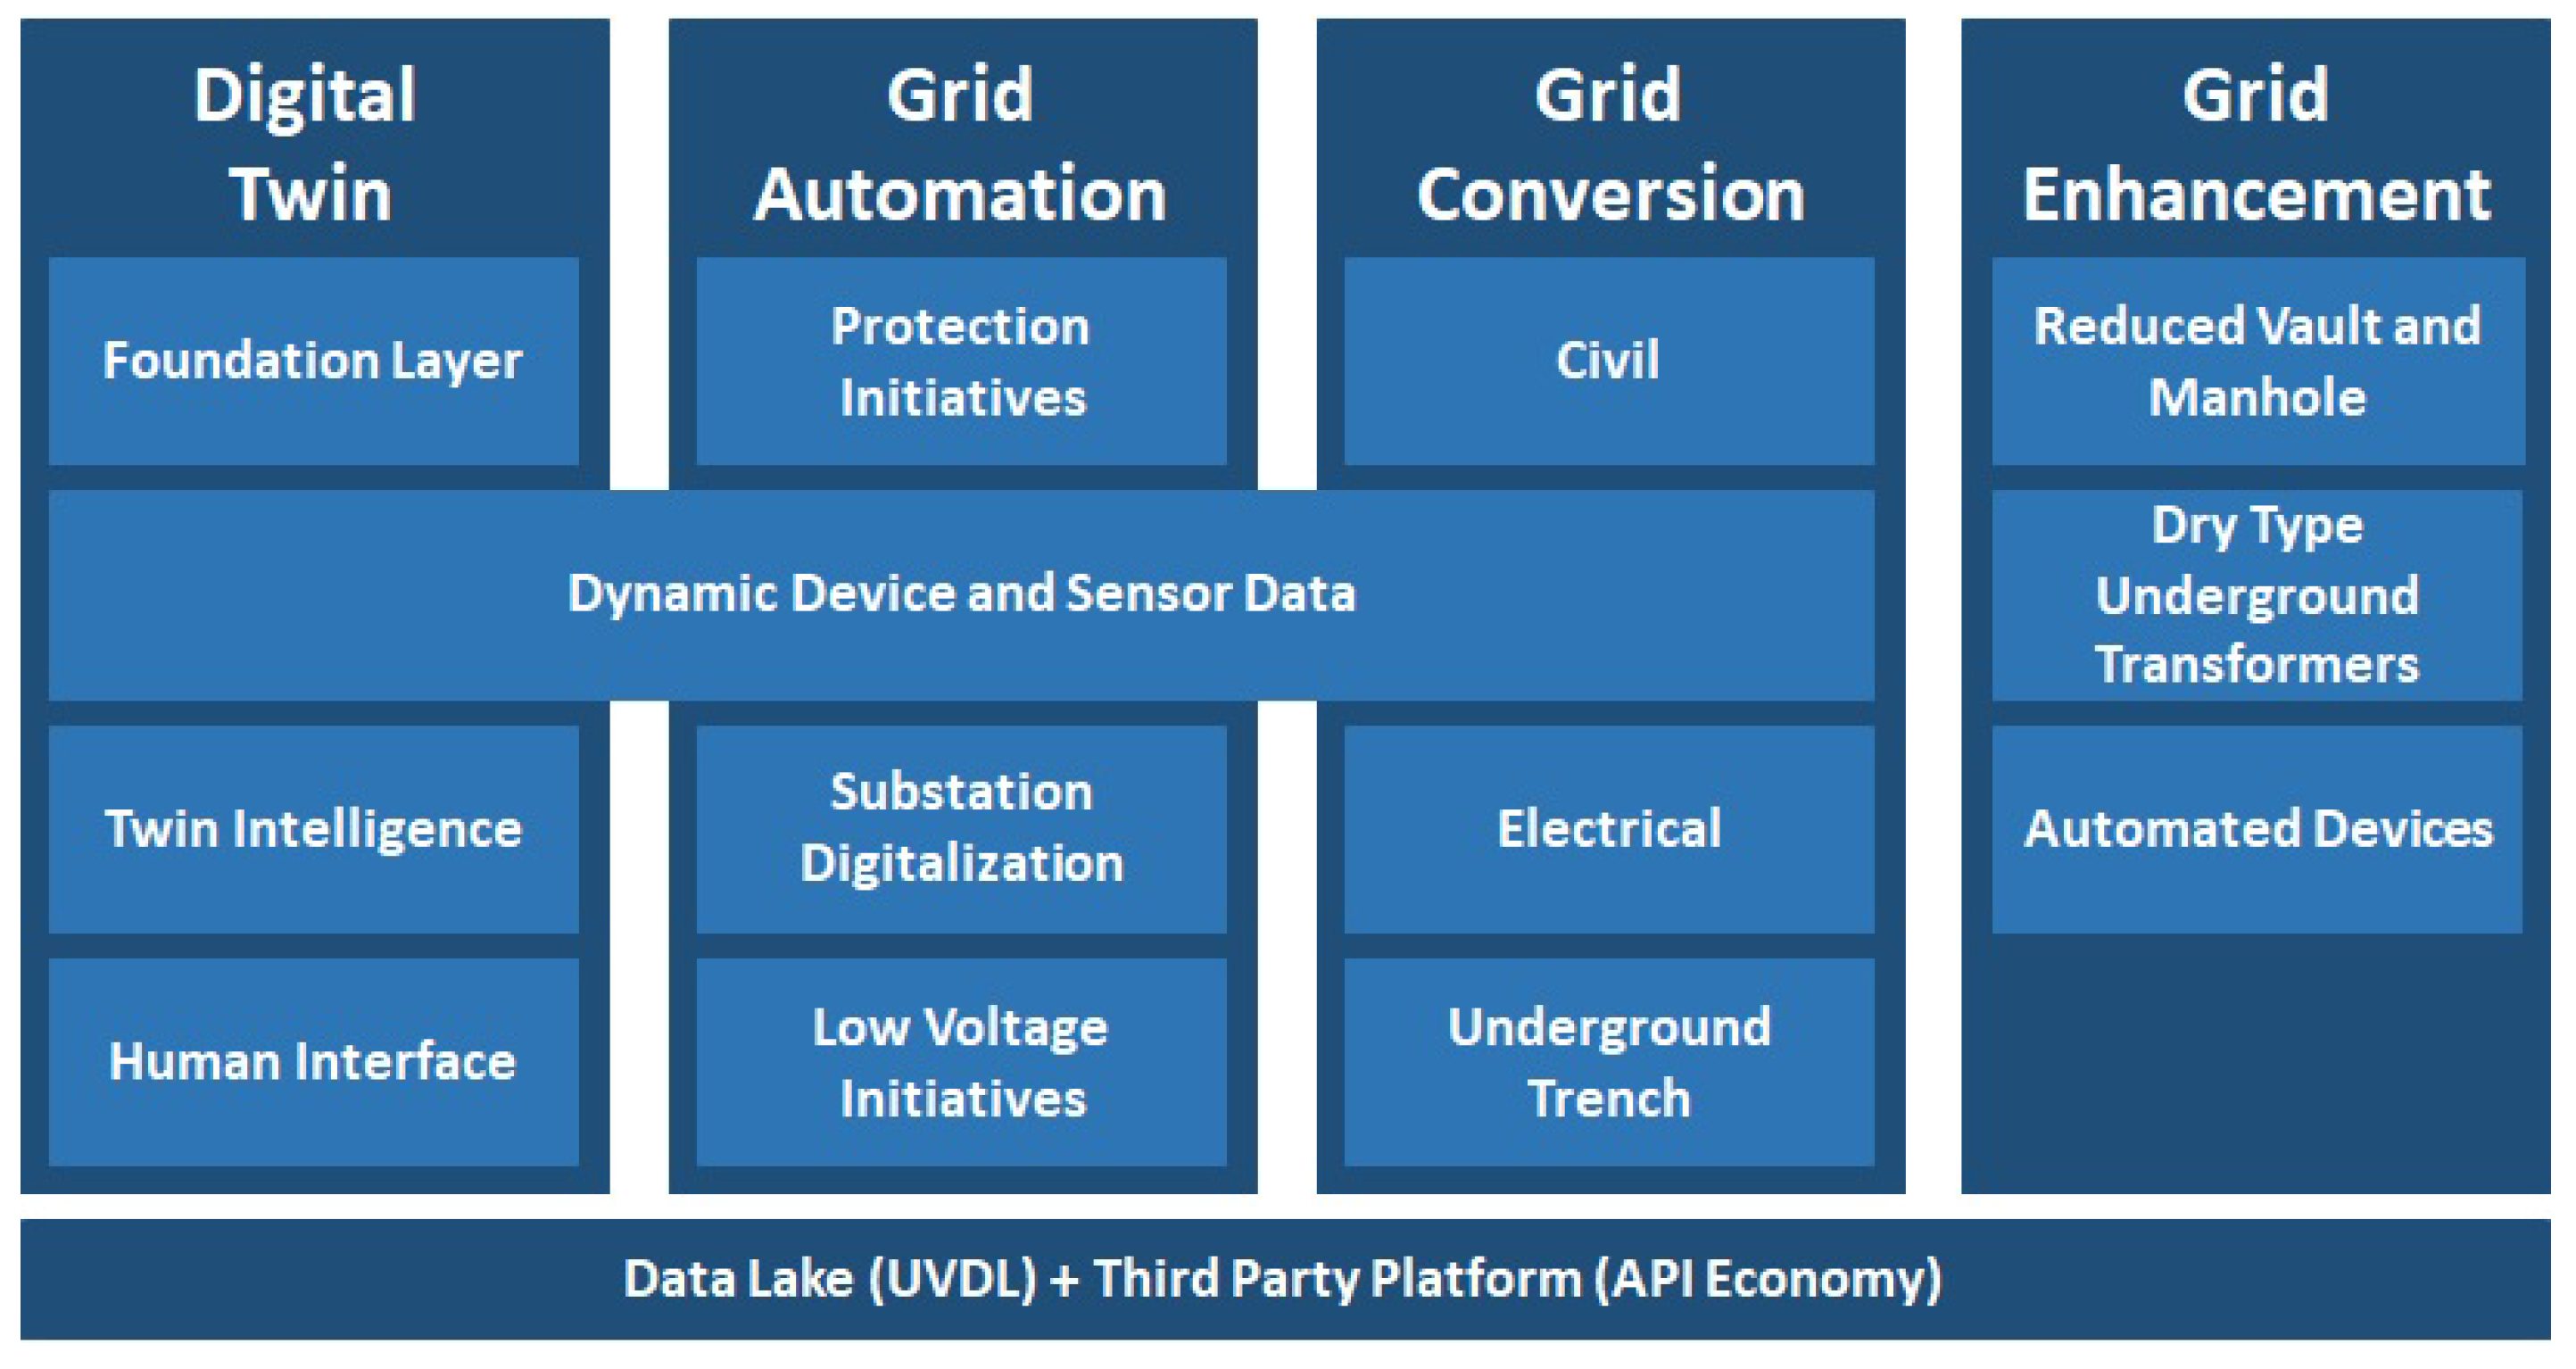
In general, the UF is divided into four pillars: DT, grid automation, grid enhancement, and grid conversion. Whereas the DT is responsible for NDT© forming, the Grid Automation aims to improve and digitalize the protection systems, the Grid Enhancement provides general improvements on general equipment for the distribution electrical grid, and the Grid Conversion handles advancement for the conversion from overhead to the underground grid. These pillars are represented in
Figure 3.
Whereas the DT pillar approaches the layers described in
Figure 3, the grid automation focuses on the improvement of protection aspects in MV/LV and the digitalization of electrical substations. As far as the grid conversion pillar, its goal is to ground the cables approaching civil and electrical aspects through the underground trench. The grid enhancement pillar applies automated devices such as switches and hatches and improves the system with dry type transformer in underground vaults and with reduced vault and manhole manufactured with recycled materials (e.g., plastic) and constructed with size reduced to minimize unnecessary excavation work.
The goal of the API Economy is to share data generated by the UF as well as the data that Enel already has stored, and managed in the data lake. The sharing of information is done through the generation of catalogs and the creation of infrastructure that allows users outside the company to connect to the company’s databases and consume the information. In addition, API Economy aims to bring Enel closer to other utility companies that operate in its areas, such as water distribution, gas, and telecommunication companies. Thus, it is possible to have more engagement with external stakeholders, enabling them to perform analyses and generate insights for their businesses.
2. Network Digital Twin© Developing
The digitalization and creation of a DT of the distribution power grid enable the integration of virtual maps, images, and 3D models of real assets, network device data, and IoT sensors measurements into a single platform [
25]. Those contents, along with AI-based models, and advanced solutions for field operations, bring benefits and opportunities for the electrical sector. However, to build a foundation layer for the NDT©, one needs to develop three basic aspects: image processing; image capturing devices; and database organization. Considering the achievements in the UF project, this section aims to present the best practice evaluated to form the first NDT© in Latin America.
2.1. Image Processing
As a starting point, the image processing delineation creates the basis of the whole NDT©. In doing so, one needs to structure what images need to be captured, how those images will be processed, and where they will be stored. Once this initial structuring is done, it is necessary to unify the process by defining a unique file format to archive each information, as well as defining the flow of which that information will have to follow through to result in a DT grid representation.
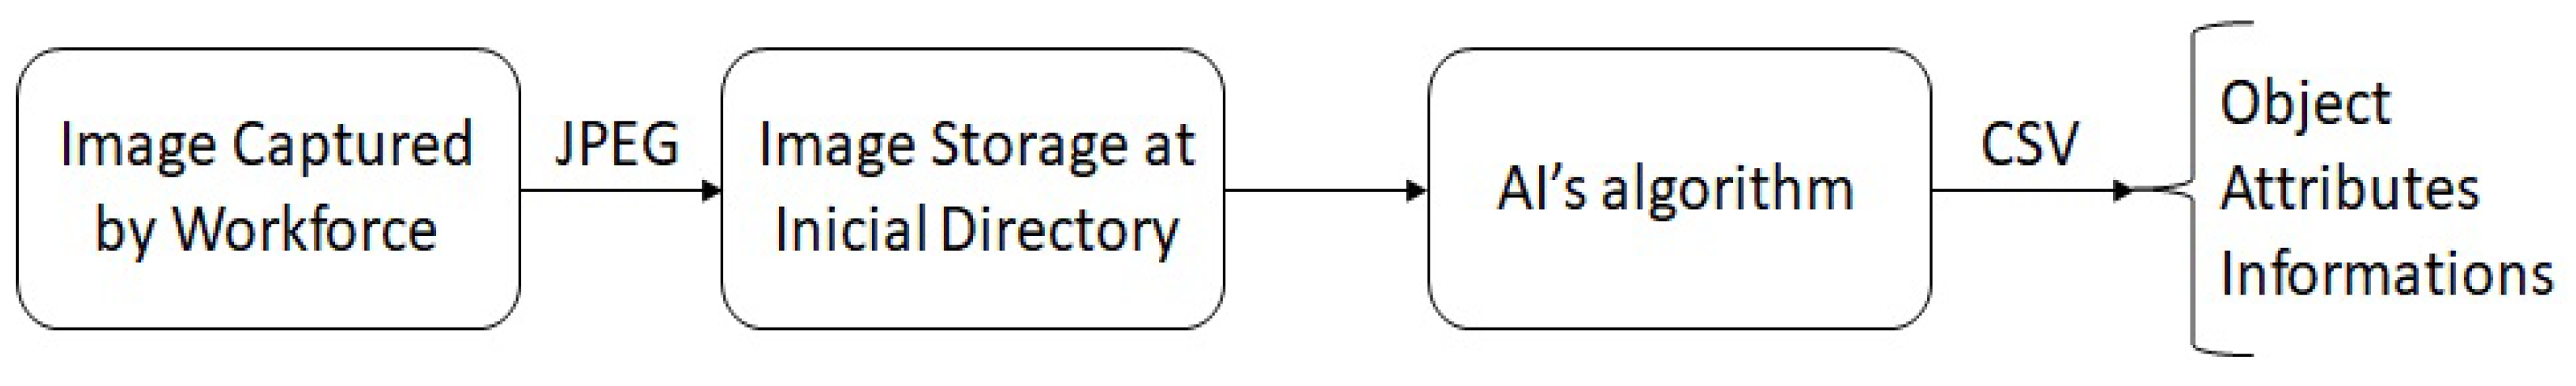
The comma-separated values (CSV) file building is a good way to gather all relevant information captured and put them into an on-field image. This way, the file can form an organized document with image location through GPS coordinates, capturing date, percentage of asset recognition reliability, asset’s name, grid portion registered, etc. The CSV file can also have additional information such as the amount of vegetation around the assets and their thermal situation, and other relevant data to build on-field operation mitigation.
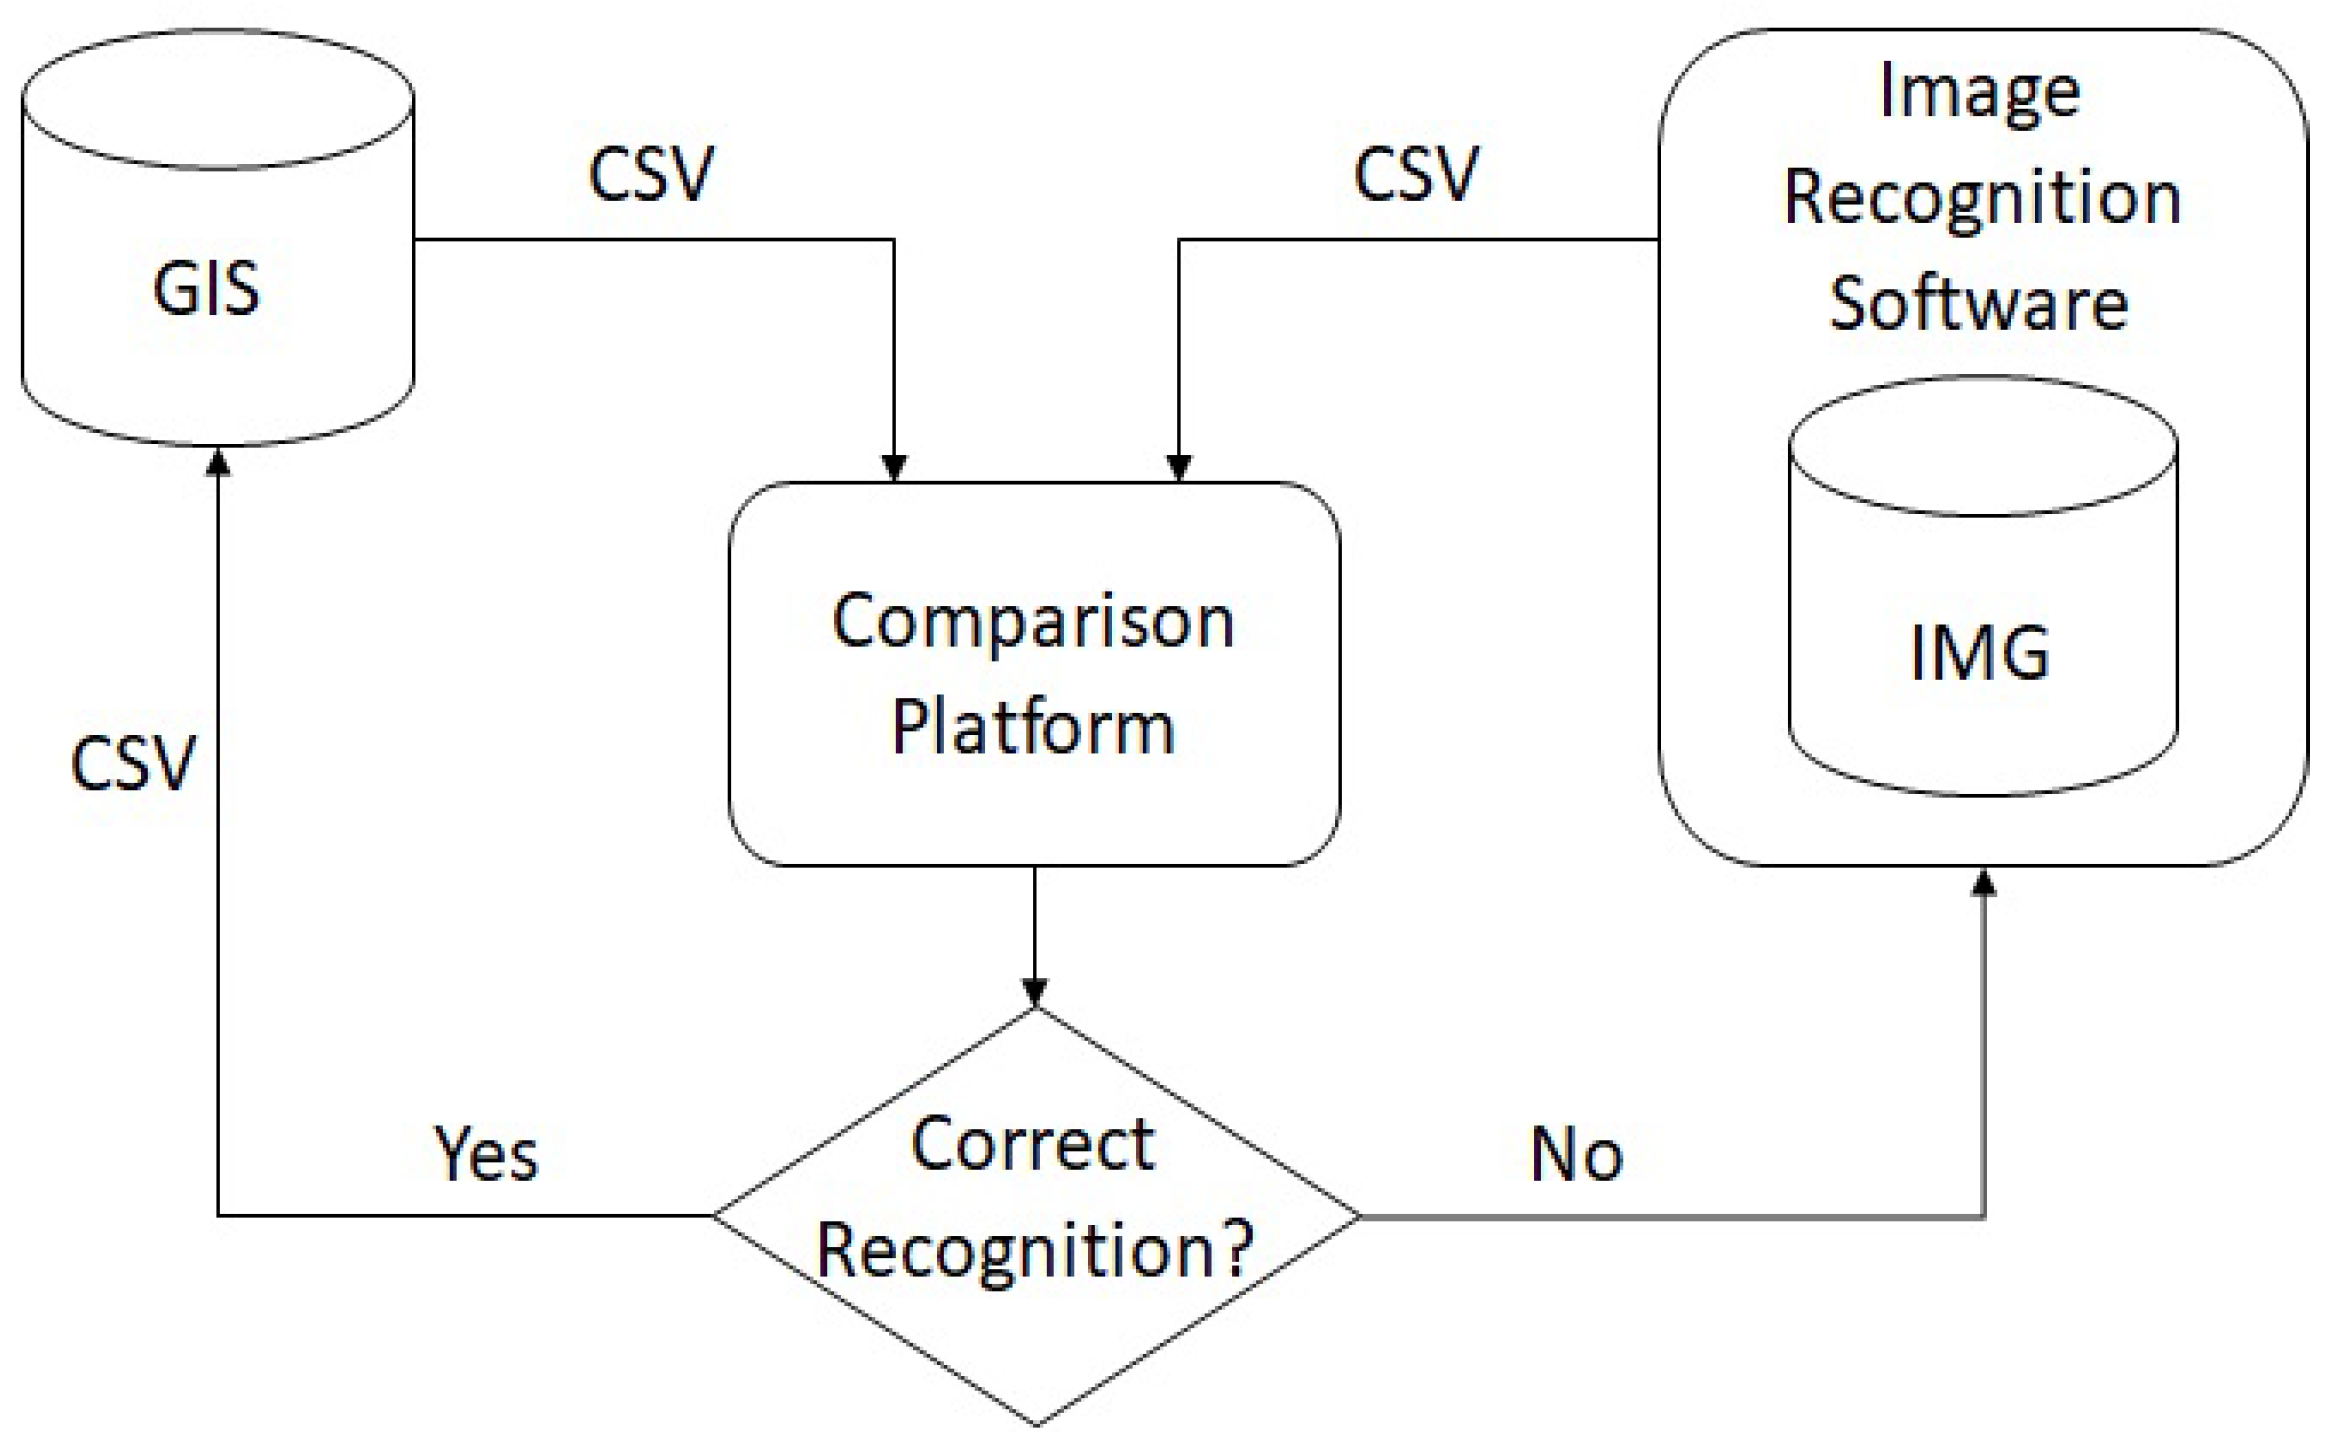
The process to capture an asset’s image and transform it into a CSV file can be summarized as presented in
Figure 4. After capturing the image, it is stored and then an AI algorithm for image recognition runs, gathering and sorting all the attributes and the information of the object.
Notwithstanding, the CSV information file needs to be checked with the existing information in the utility legacy system. In order to represent the DT in the power systems, the geographic information systems (GIS) database has the potential to check and compare all the asset information at the network [
26]. Hence, one needs to make the GIS’s information output as a CSV file similar to the previous one formed from the captured images. As a best practice for that process, the CSV file from image capture needs to be adapted according to the CSV provided from GIS.
The process of comparing and checking these files is summarized in
Figure 5. In this process, both files, from the GIS and image capturing, enter into an information comparison platform, where the data from each file are checked for compatibility of information. In case of similarities, the information re-feeds automatically to the GIS database. Otherwise, the comparison system returns the data to the image recognition process, indicating an image failure recognition training. Thereby, two important pieces of feedback are noticed: one is responsible for feeding the GIS database with real and validated up-to-date information; the other is responsible for feeding the image recognition training process, which will improve its power of recognition as it increases the sample of failure/successes output.
The process described so far is the core of the NDT© concerning information standardization. These standards are also applied for dynamic real-time sensing. The process of how the images and real-time measures are captured is equally important to provide a feasible forming and implementation of the DT within the power system grid. Using the workforce daily activities, it provides a better way to gather image and data of the grid. Thus, the data can be constantly updated and fed with relevant on-field information. That information may be pictures of the general activities performed in the assets, thermal analysis for maintenance of the assets, operational registering of the operation, confirmation of real state and the real measure of assets, etc.
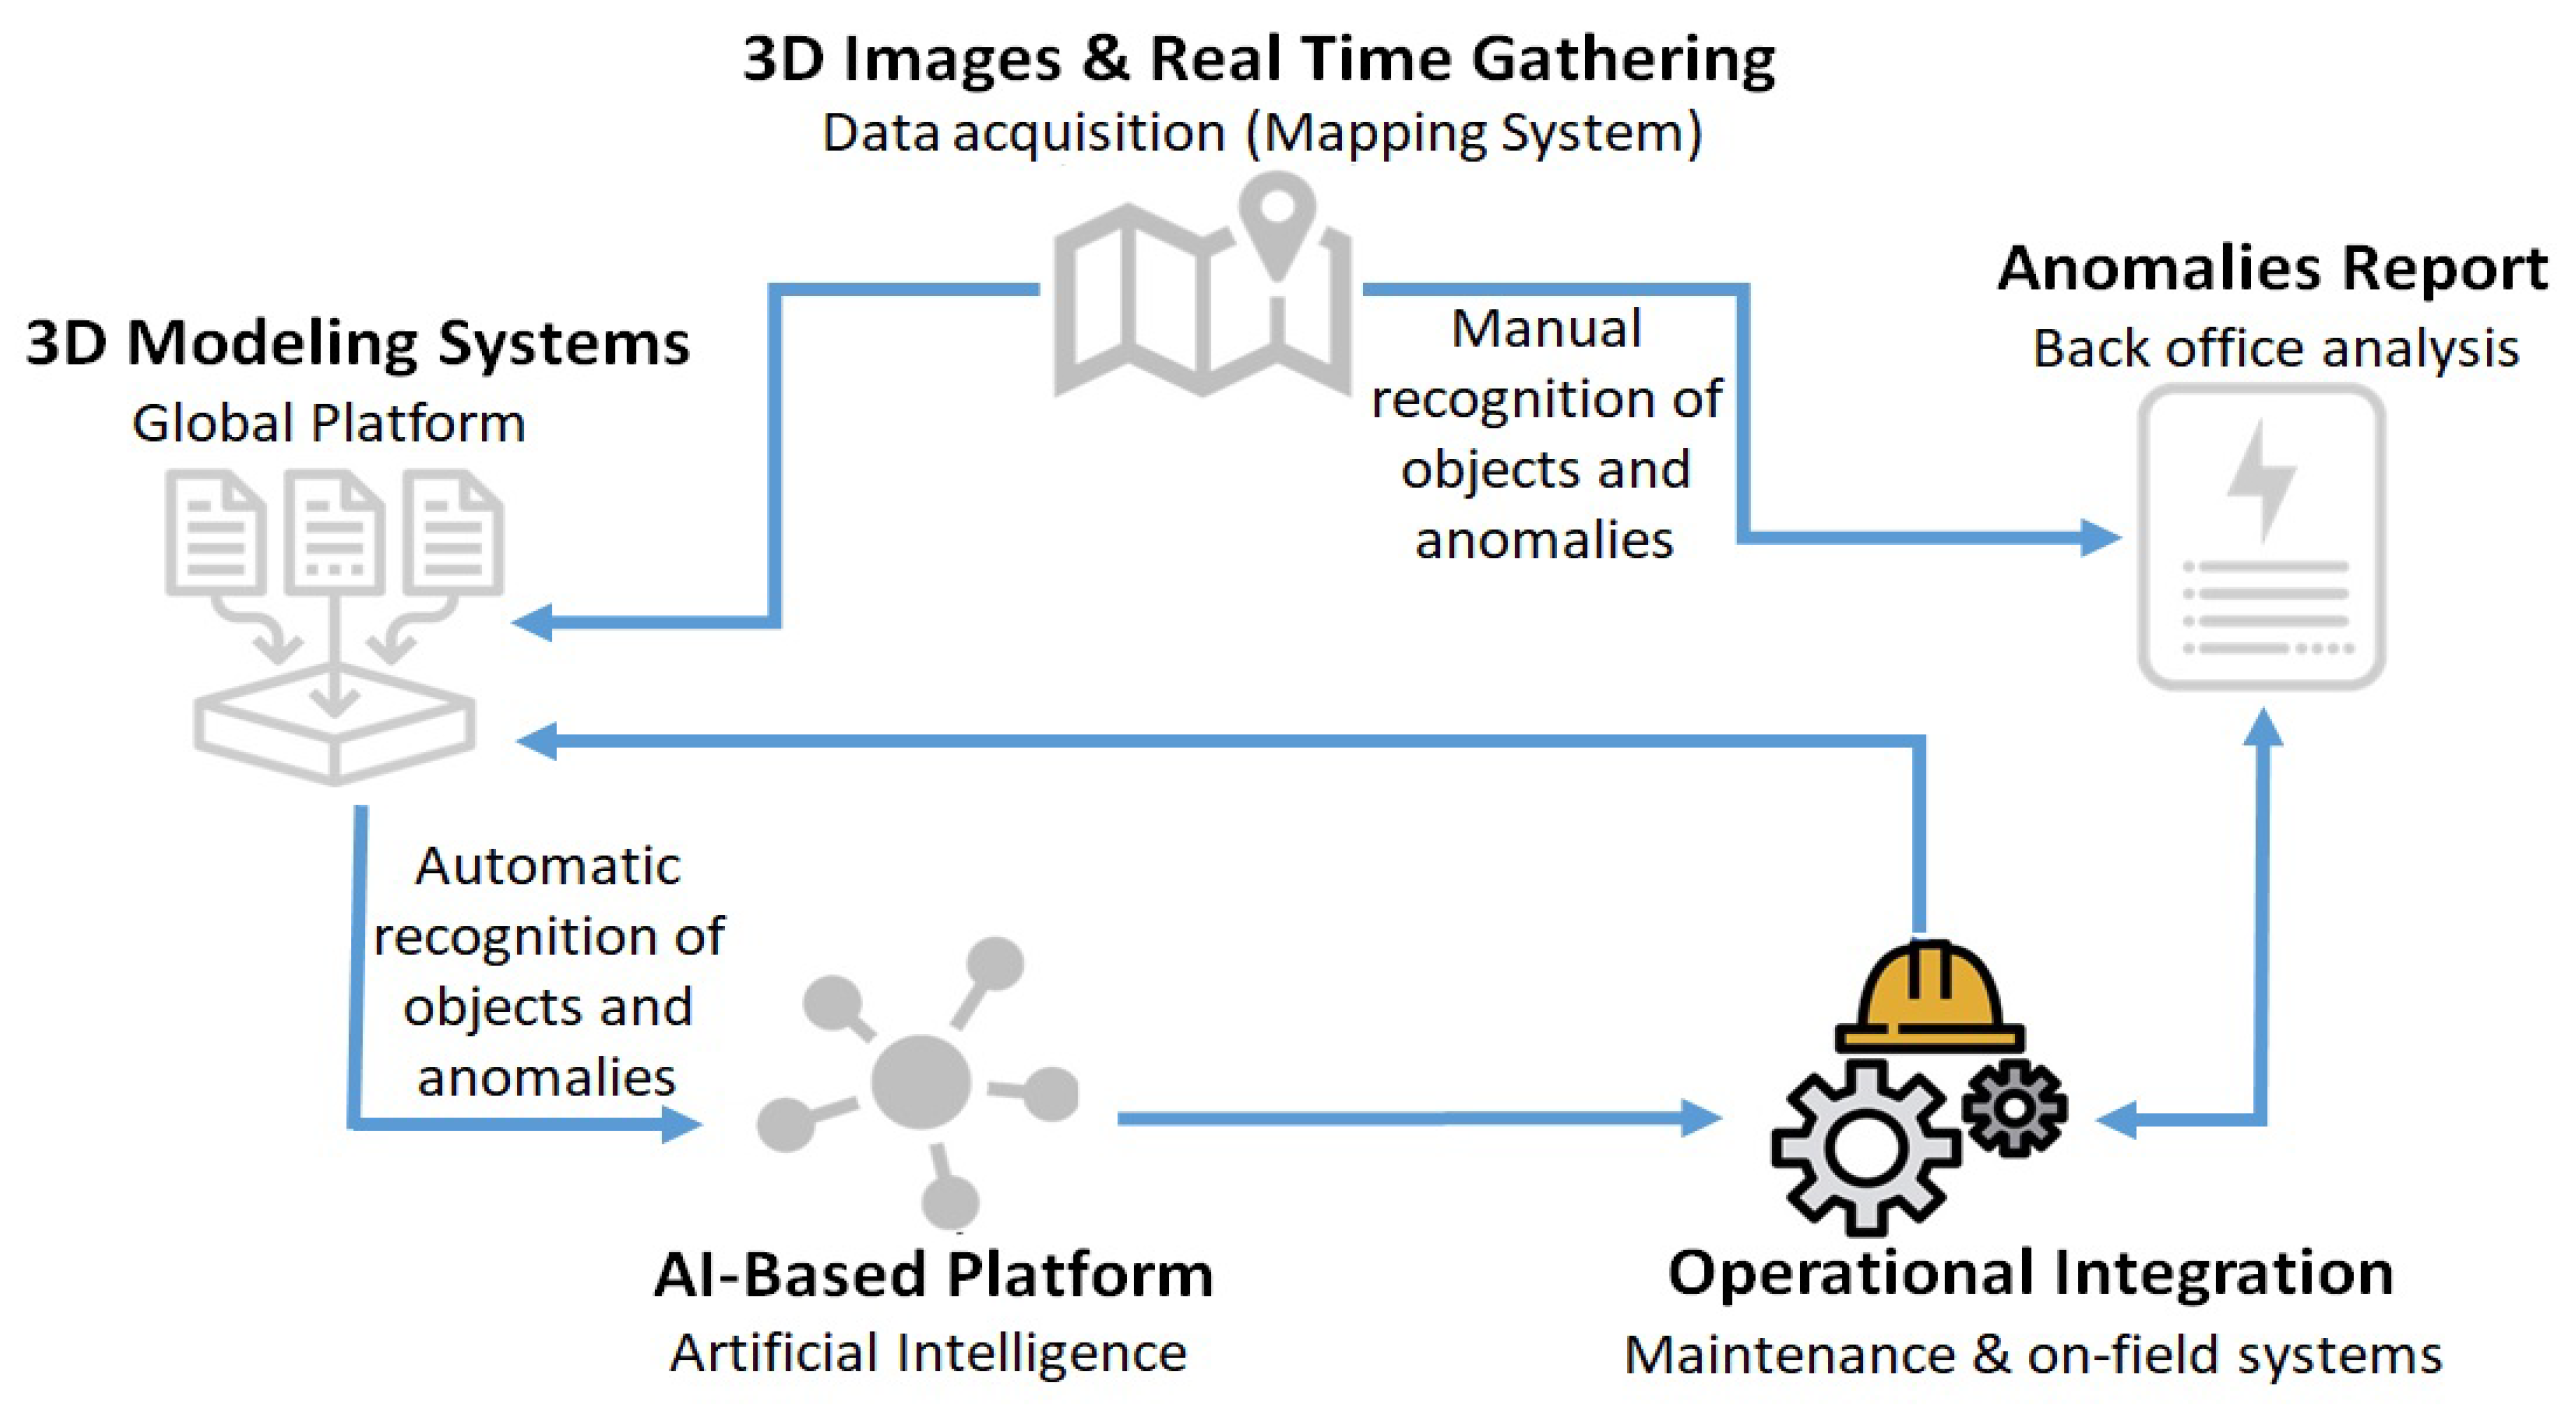
To provide intelligent integration of 3D modeling and real-time sensing for a mapping system, a global platform is created with visualization and application layers. This platform is responsible for AI data sharing, where intelligent decisions are made for maintenance or other on-field activities. With the integration of an on-field system platform, the global platform can be fed back and automatic anomalies detection reports on the grid are generated based on the 3D images gathered.
Figure 6 illustrates this integration.
2.2. Application Tools
Even though the DT concept appeared in the literature around 2003, the application in the industry is still new [
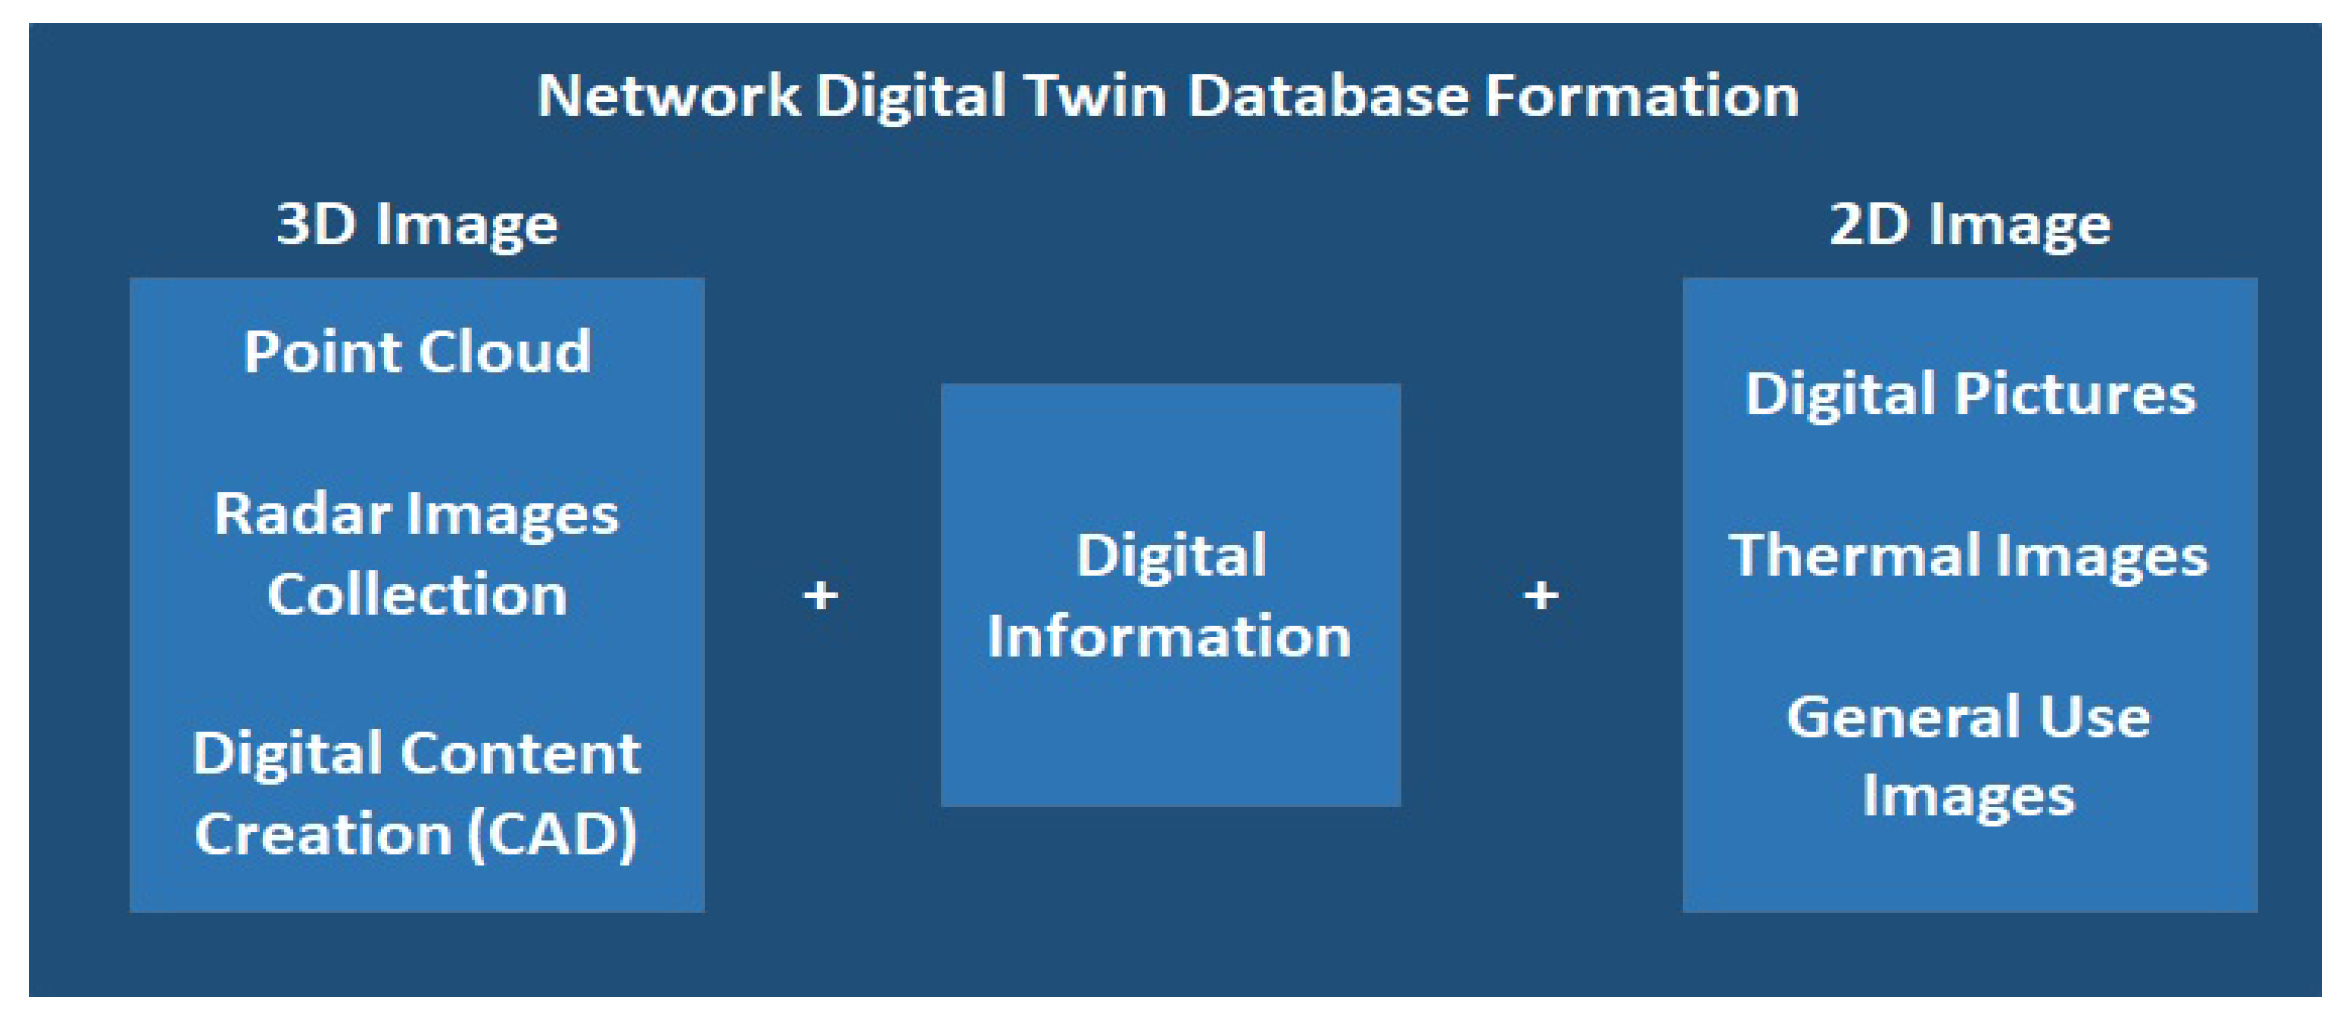
27]. It implies that, for its implementation, new technologies need to be used to accurately develop a DT system. Aiming to develop an NDT©, the digital information gathered can be divided into groups such as those presented in
Figure 7.
For each small group presented in
Figure 7, a set of tools is best fit to form an NDT©. Those tools aim to build 3D and 2D image representations, as well as gather digital information of the assets. The 3D image may be generated by point cloud tools, radar technology images collection, and others. As far as the 2D images, simple high-quality digital images, and other general on-field images used from the workforce will be utilized to complement the NDT©.
The point cloud concept uses beams of light, such as lasers, to identify object characteristics and register them as an individual pixel represented in an image. Light detection and ranging (LiDAR) is a commercial technology that can be used to obtain these point clouds and turn them into a 3D image representation of the environment [
28]. Beyond the 3D image development, the point cloud also allows for identifying the precise distance between objects, e.g., one can identify if a certain grid asset is close to trees or other objects which may cause a power outage [
29]. All this information is registered in an NDT© database, and may be used at operational centers.
Considering the overhead grid elements, the LiDAR is a suitable tool, with the georadar system being more suitable for the underground grid. The georadar system uses radio waves, acting as an ultrasound into the ground. For every object the wave hits, a return signal is identified by the tool, and this signal is registered in a parabolic form. As far as the object is from the surface, the system must have a higher frequency range to identify it. For the power grid, a frequency of 600 MHz is evaluated in order to work well [
30]. After the radar images are captured, a subsequent step needs to be performed, where the parabolic images are transformed into a 3D representation.
For the UF project, both technologies are used to perform an NDT© of the São Paulo grid. The set of those technologies is summed with thermal images, where a vehicle is equipped with those technologies and real-time measures. This entire system forms the foundation layer of the NDT©. Furthermore, to complement the 3D modeling of the grid, towards a DT representation, drones are used to obtain different image angles in underground vaults and overhead assets. The drone used is capable to obtain digital images and thermal images. Moreover, as the new assets are being installed on the grid, its 3D representation can be provided by their supplier through a CAD model.
Aside from the MMS platform, handheld devices are used to build 3D models of the grid assets. These devices aim to digitalize close and accessible elements through the point cloud. In general, for the point cloud technology, one needs to specify a minimum of 300,000 points per second in the application, as well as less than 10 mm resolution. The field of view (FoV) of the device has to be 360° horizontally and 300° vertically. It also needs to follow the standard IEC60825.
To gather 2D digital images, the usual workforce routine is enough to provide relevant content. As the camera of the smartphone is an essential tool to workforce activities nowadays, its camera resolution is not adequate to perform an NDT© forming. Hence, a high-resolution camera of 30 megapixels is recommended. Furthermore, the operational activities are complemented with a thermal camera to detect hot spots in the assets. It can be achieved with a coupling device in the smartphone. That solution is commercially available and brings good results [
31].The use of drones can also serve the same purpose in the overhead grid and underground vaults [
16,
17,
18,
19,
20,
21,
22,
23,
24,
25,
26,
27,
28,
29,
30,
31,
32]. Considering a technical specification for thermal cameras usage in the electrical system, it is recommended to consider a device that supports −20 °C to 330 °C and has the thermal sensibility of less than 150 mK.
To complete an NDT© development, other tools present relevance to gather digital information. One of them is based on global navigation satellite system (GNSS) technology, where a precise location is obtained through satellite systems [
33]. Furthermore, devices with laser measurement are useful tools in the process of developing an NDT©. These technologies, as well as those aforementioned, are commercially available and with the technological trends around IoT, clouds platform, long term evolution (LTE) 5G, and interconnected systems, the DT in the electrical system is becoming more equipped with advantageous tools.
2.3. Data Organization
The amount of data gathered to form an NDT© is immense. Therefore, one needs to organize all the data in a way to make their access and use easier. Furthermore, in a power electrical system, it is interesting to have an integration with electrical power legacy systems. To perform this organization, a universal virtual data lake (UVDL) is proposed [
24].
The UVDL consists of a unification of all storage data for any application. Practically, the UVDL links each data file with an address, in a way that the end application asks for a specific location, and then the UVDL returns with the needed data. In other words, it acts as a pointer of data. This system also has an analytic platform that produces statistical analyses and reports. Nevertheless, the most advantage of the UVDL for the NDT© is its capability to virtualize information and present visual data for the application without the need to return all the documents.
A representative data workflow is presented in
Figure 8. The workflow represents a unification of the data collected and data from the supervisory control and data acquisition (SCADA) system. SCADA is a critical database. Hence, it needs a specific tunnel for information. For this reason, SQL server integration services (SSIS) are necessary for SCADA migration. The data unification leads to a catalog, where the data address is located. As a complementary function, the UVDL proposed has integration with public services, which has information shared with many stakeholders in the electrical sector.
The concept of the data lake is new and proposes an innovative and essential way to better perform an NDT©. This system is being applied on Enel Distribuição São Paulo to embrace a DT concept in the distribution grid.
3. Application and Its Benefits
Developing and applying technologies on power systems can become difficult tasks—not just because of the new way to do the process or to leave old manners, but to a mindset changing. As approached on [
23], the electrical power sector workforce is passing through an aging process, which can lead to a loss of work knowledge and work expertise, as well as resistance to technological trends application. However, the new workforce arriving in the power sector has a high digital immersive potential, meaning that this workforce is prepared to use full digital grid tools, bringing a digital mindset to the sector [
34]. It is in this context that the NDT© can bring potential benefits through its application in the electrical power sector.
3.1. On-Field Operational Activities
On the power systems on-field activities, tasks as inspection of assets, listing and checking asset operational conditions, etc., are common in the daily workforce operation. These operations are used to make decisions about activities in the grid, such as equipment replacement, remodeling the electrical network, or even trimming trees that may interfere with the electrical grid. All those activities are reinforced and improved with digital tools.
General visualization is the first action for initial inspections of the grid, the assets, or even the workforce. This action aims to find visual flaws that may compromise the energy services. Each conclusion for the inspector needs to be followed with a photo registration from their smartphone. That process is necessary to guarantee the safety of the operation. Later, another inspector checks the images on-office. In that situation, the full grid digitalization, through a 3D real-time replica, improves the on-office inspection and refines on-field activity and safety. Some tools that can be used to provide such digitalization are the same used to gather 3D images for the NDT© development, such as handheld scanners, drones equipped with cameras, and tools as those aforementioned.
Concerning asset inspections, thermal equipment is used to find hot spots in the asset which may cause future equipment failure [
35]. Thermal cameras are the way to do it, where drones and even smartphones are suitable to use. Since the workforce uses its smartphone to do their activities, a coupled gadget adaptation can be used through many commercials apparatus of the smartphone. Thermal data outputs are synchronized with real-time sensors and electrical measures in the power systems’ legacy platforms. All the measures, such as sensing, thermal analyses, SCADA/GIS data, etc., lead to an efficient and smart asset maintenance process, where the NDT© provides it through an IoT data platform and real-time on-field activities.
The process of trimming trees is one of the most relevant for the distribution power systems in terms of on-field activities. Trees are responsible for grid transient fault and can lead to permanent consumer power outage [
36]. Daily workforce teams perform trimming on trees that have twigs close to the grid. Usually, these activities are scheduled by consumer complaints or after a fault detection. Using a real 3D replica of the grid and its surrounding environment, an analysis of the situation between trees and network cables without the need for complaints or fault identification can be made. For that analysis, the point cloud and infrared measures are used to represent situations in the critical neighborhood and estimate the twigs’ growth. Thus, the NDT© together with AI increases the grid resilience, avoiding or mitigating unexpected outages.
In the electrical power grid, there are two main grids: the overhead and the underground. The overhead has its assets and structure visible to the workforce, while the underground has its equipment hiding in the ground. This fact encumbers the underground inspection and maintenance routine activities. Even though the underground grid has a confined vault for inspection, and its access is hard and risky. The use of drones to gather images, such as the thermal and high-resolution pictures, is necessary to compare the previous inspection and provide risk-free analyses and diagnoses. In addition, the NDT© replica for the underground grid brings to the workforce the network situation through technologies like AR or simple visualization in its smartphone.
The NDT©has the goal to bring many benefits for the power grid operation. The implementation of such a system is mitigated to a mindset changing in the on-field operational activities, which uses technological trends to do its tasks. The gathered data are stored in a UVDL platform, which provides many opportunities for smart decision-making and foresees assets situation. The on-field inspection is the key point to start an NDT©developing through a foundation layer, and operation & maintenance (O&M) is an area to first appropriate its technology through predictive maintenance. All the final NDT©usage area takes advantage of the automatizing process, high data density in the cloud, and the AI process.
During the UF project prospecting, the aforementioned on-field operational activities are the basis for the NDT©foundation layer development. Nevertheless, one can find many benefits for the future workforce activities and methodology, which will be endorsed with digital tools in a grid digitalization process. The NDT©forming is the first step to a full digital grid.
3.2. Virtual and Augmented Reality
Since the DT is defined as a virtual model of a system, a process, or a service, AR and VR can be used to enhance many off-field activities of the workforce. For instance, according to approaches in [
22], the VR is well fit for workforce training in utilities. Through this technology, the workforce can have an immersive training experience of its activity, without risks or the need to spend scarce materials.
Simple use of VR training in the electrical power sector can be social and occupational, where the electrical company can make the population aware of electrical hazards and provide them with an overview of the electrical grid operations. For example, with the VR, the company can aware the community of the risk of kites touching the grid, and the effect it has on the power grid through an immersive experience. Furthermore, the electrical company becomes a more cooperative integration among its areas, creating a systemic workforce sharing many operational tasks, resulting in assertiveness when one team needs to call another experienced workforce team [
37]. In addition, VR brings interaction and motivation for training and learning.
Although VR can have immediate use socially and administratively, its direct application to training the workforce is not recommended. This is due to the high quality of the electrical workforce, meaning that the procedure repetition or following steps will not aggregate knowledge to them. Thus, to provide efficient use of VR for workforce training, one needs to develop a virtual scenario where the cognition of their workers has to be activated. In order to do it, VR is developed with intelligence, where random risky scenarios are created according to real on-field situations. This development will bring a worker’s reaction training for real adversities and will simulate an escape route for an emergency situation. Such situations are approached theoretically in traditional training, but the practical knowledge only happens upon real risk. Using VR for training, the electrical power sector can better prepare its workforce to act in an emergency, without having to expose its employees in a risky situation. Furthermore, the workforce can have a muscle memory retrained to avoid mechanized movements during the on-field activity [
38].
The AR has different applications in the power sector. The most notorious one is to bring relevant information for on-field activities. Through AR, one can use smart glasses to overlap real images with virtual ones creating an operational system to improve workforce duties [
39]. One application approach on [
23] is the reduction of paperwork on-field. This paperwork, as manual and data sheets, is usually heavy and demands a long time to find important information. Furthermore, this paperwork is out of date and does not bring the electrical power to real conditions. Concerning relevant information, the operational experience exchanging can be better performed with AR, where digital registration can be achieved and replicated through digital content for the new workforce.
Using the NDT© development, with grid 3D modeling, one provides a useful replica of the grid, supplying the workforce with real visualization of electrical structure and quantities, whereas providing an interactive digital way to execute its job. Regarding on-field support, the AR can be well fit for remote assistance. With AR, the remote assistance can be interactive, with the sharing of virtually made drawings in an office, and is overlapped with the real supported equipment. It provides better support, faster problem-solving, and rapid grid restoration.
The AR application can be done with smart glasses, which will provide hands-free for the operational activity. It increases the safety of the employees and results in a better service with attention focused on the equipment. Smartphones are also able to have AR applications, which will have fewer resources but many benefits.
AR and VR are powerful tools to enhance workforce operation capacity, and these applications use the outputs of a DT implementation. There are many possibilities to use VR and AR in the power sector. All the aforementioned is the initial implementation of the UF project and consists of the application performed to prove the NDT© concept into the power electrical systems.
3.3. New Trend’s Nest
The NDT© forming cannot be seen as a closed box of application. As the technological trends advance, the NDT© will increase its potential. For this reason, the NDT© has to be considered as a nest for new trends. Technologies such as AI and machine learning are in great evolution, and their application may bring unknown benefits for utilities. Images recognition, chatterboxes, deep learning processes, smart decision-making algorithms, etc. can ride through the DT forming.
To elucidate some trends, one can point out the augmented intelligence as a way to have a high-level algorithm running together with the operation on-field activities, which will help the workforce to take an optimal operational decision without the need to wait for information sending [
23]. Blockchain is a new trend that is being evaluated and applied in the energy market, the decision-making process, cybersecurity, IoT operations, etc. [
40]. Blockchain can be used for various applications in the electricity sector, such as the automation of transactions within the electricity grid (automatic conclusion of contracts upon fulfillment of a certain condition) and monitoring of energy consumption and production, in addition to being used as a basis for digital transactions in areas such as the electricity market (decentralized settlement of transactions), increasing the options for business models in the sector [
41]. This nest can be the crib for edge and fog computing new applications. With the data lake concept, the IoT can be used at a high level for the power electrical sector [
24]. Together with 5G technology, it will have a fast application with minimum latency [
42].
It is not possible to completely measure the NDT© forming potential. However, with a digitalization wave, the 4.0 industrial revolution, and many technological trends, it makes clear that the power electrical sector evolution is far from completion.
4. Results
The development of the NDT© leads to many outputs. The main one is the group of images gathered by the tools used for data capture. Those images are archived in a database, where the electrical power employees can use to facilitate their on-field activities through an AI-based analysis platform. Moreover, the on-field usage can enhance the database, through activities like image registration, inspection registration by photos, thermal maintenance activities, etc. Furthermore, financial results give a cost–benefit analysis to validate the return of investments. Finally, power electrical sector indicators, as system average interruption duration index (SAIDI) and system average interruption frequency index (SAIFI), are considerable outputs for an NDT© forming applicability results.
4.1. Image Captures as Results
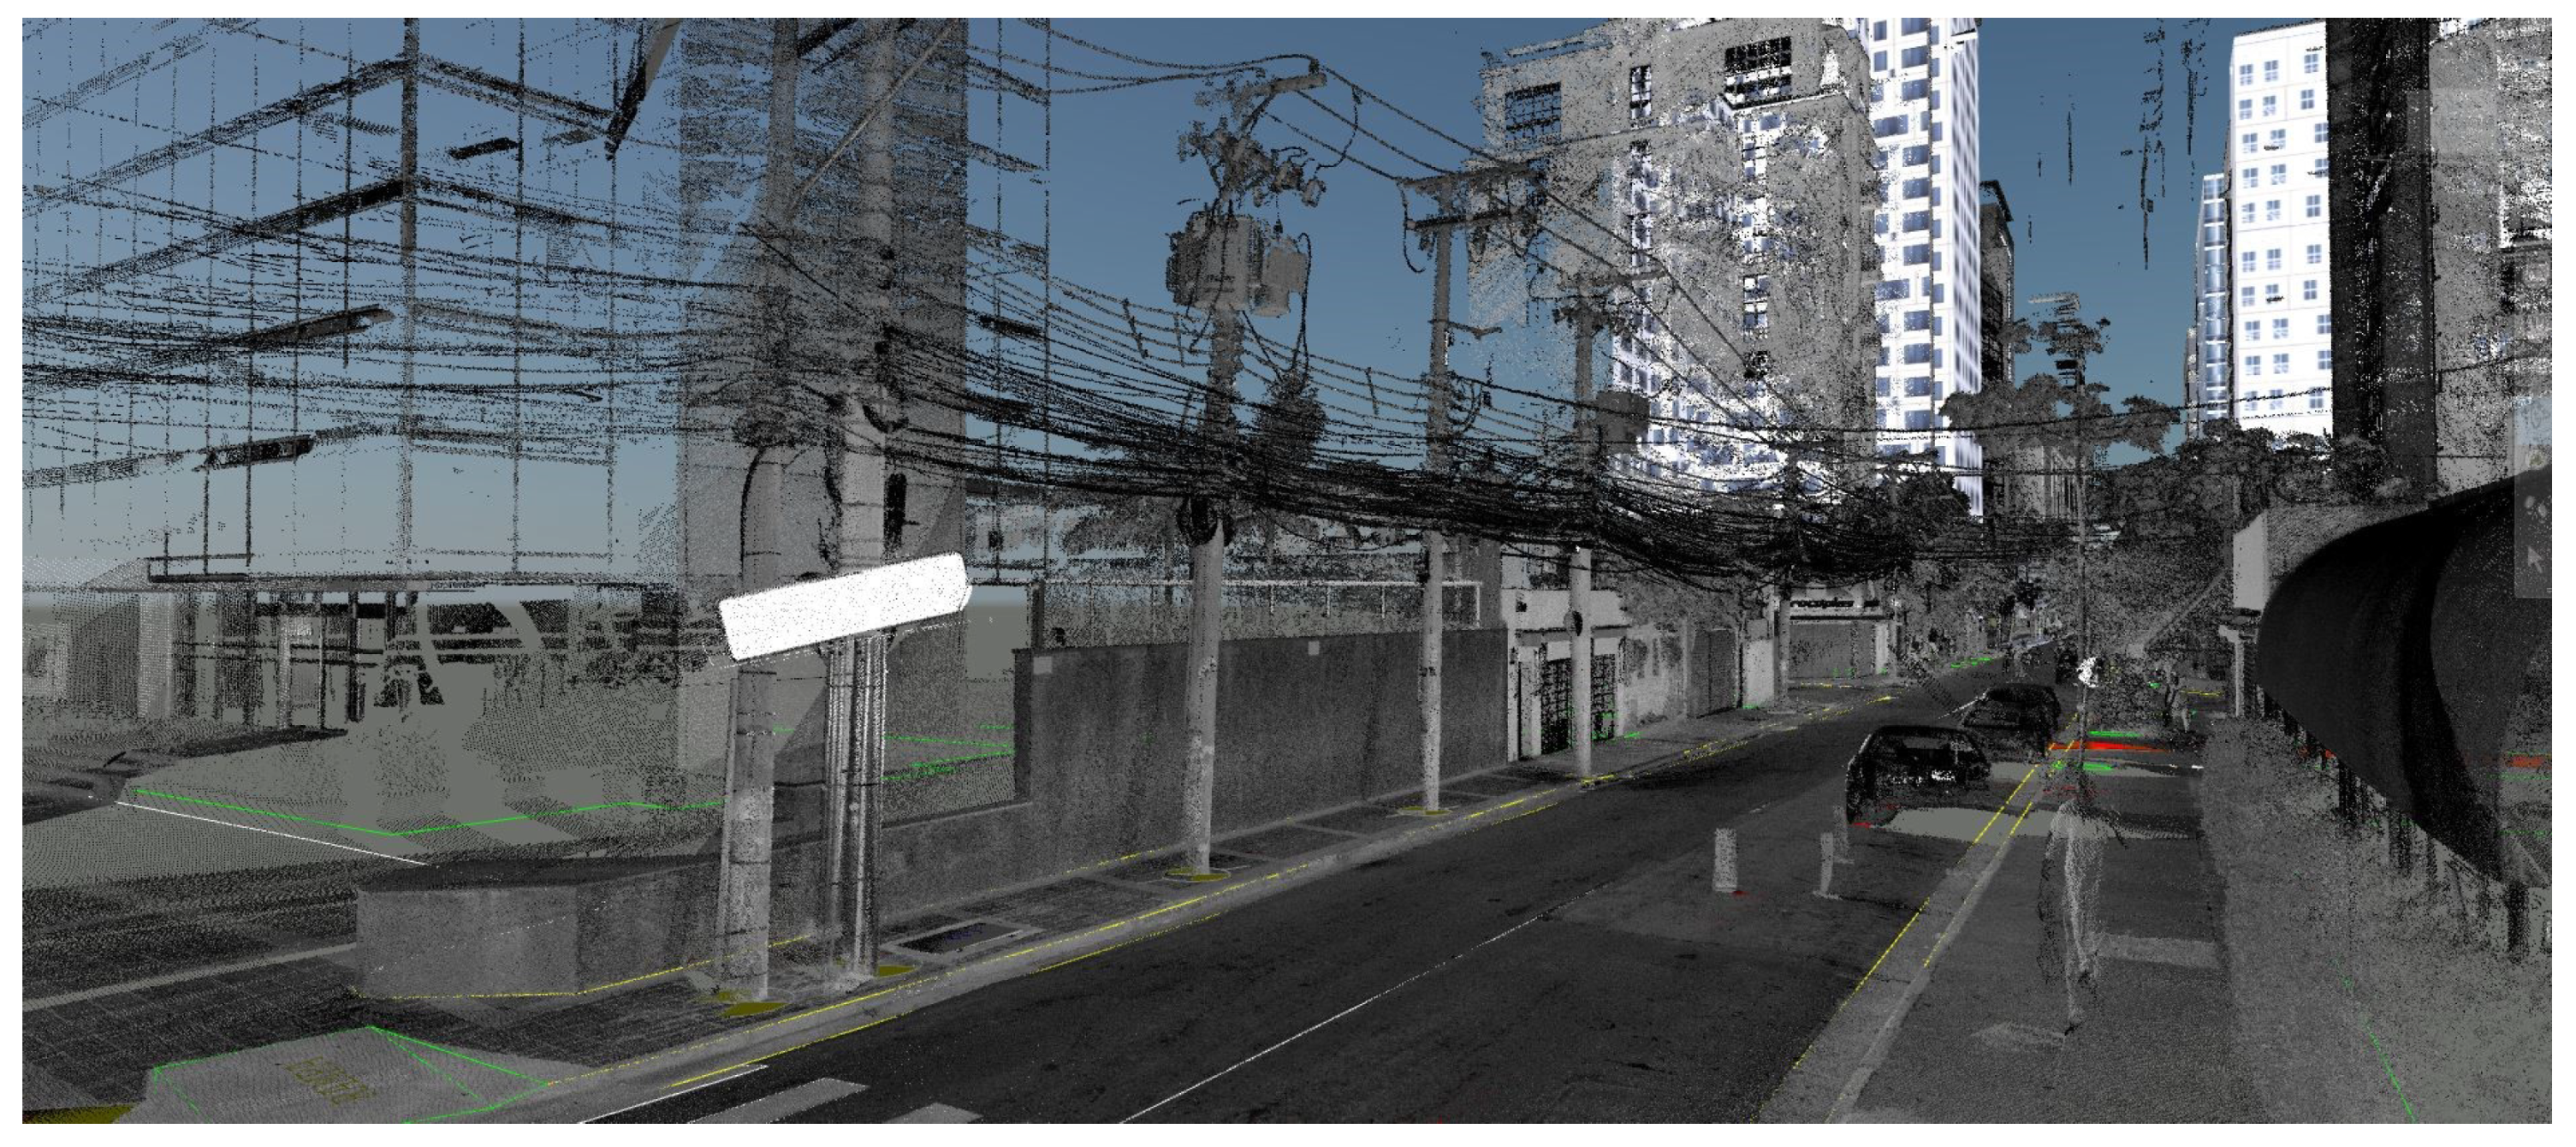
The 3D modeling performed by the MMS is one of the main results for an NDT© foundation layer development, where assets located on the street are mapped in 3D data. With this information stored, one can work directly on anomaly detection by an AI algorithm, including the possibility to work on vegetation analysis. In
Figure 9, the output of the MMS System is shown.
It is possible to notice in
Figure 9 equipment, as MV/LV transformers are placed in electrical poles as well as the grid cables. In addition, fuse and its position, trees, and even buildings around the grid, can be analyzed. The whole image assemble is made by a point cloud technology in the MMS.
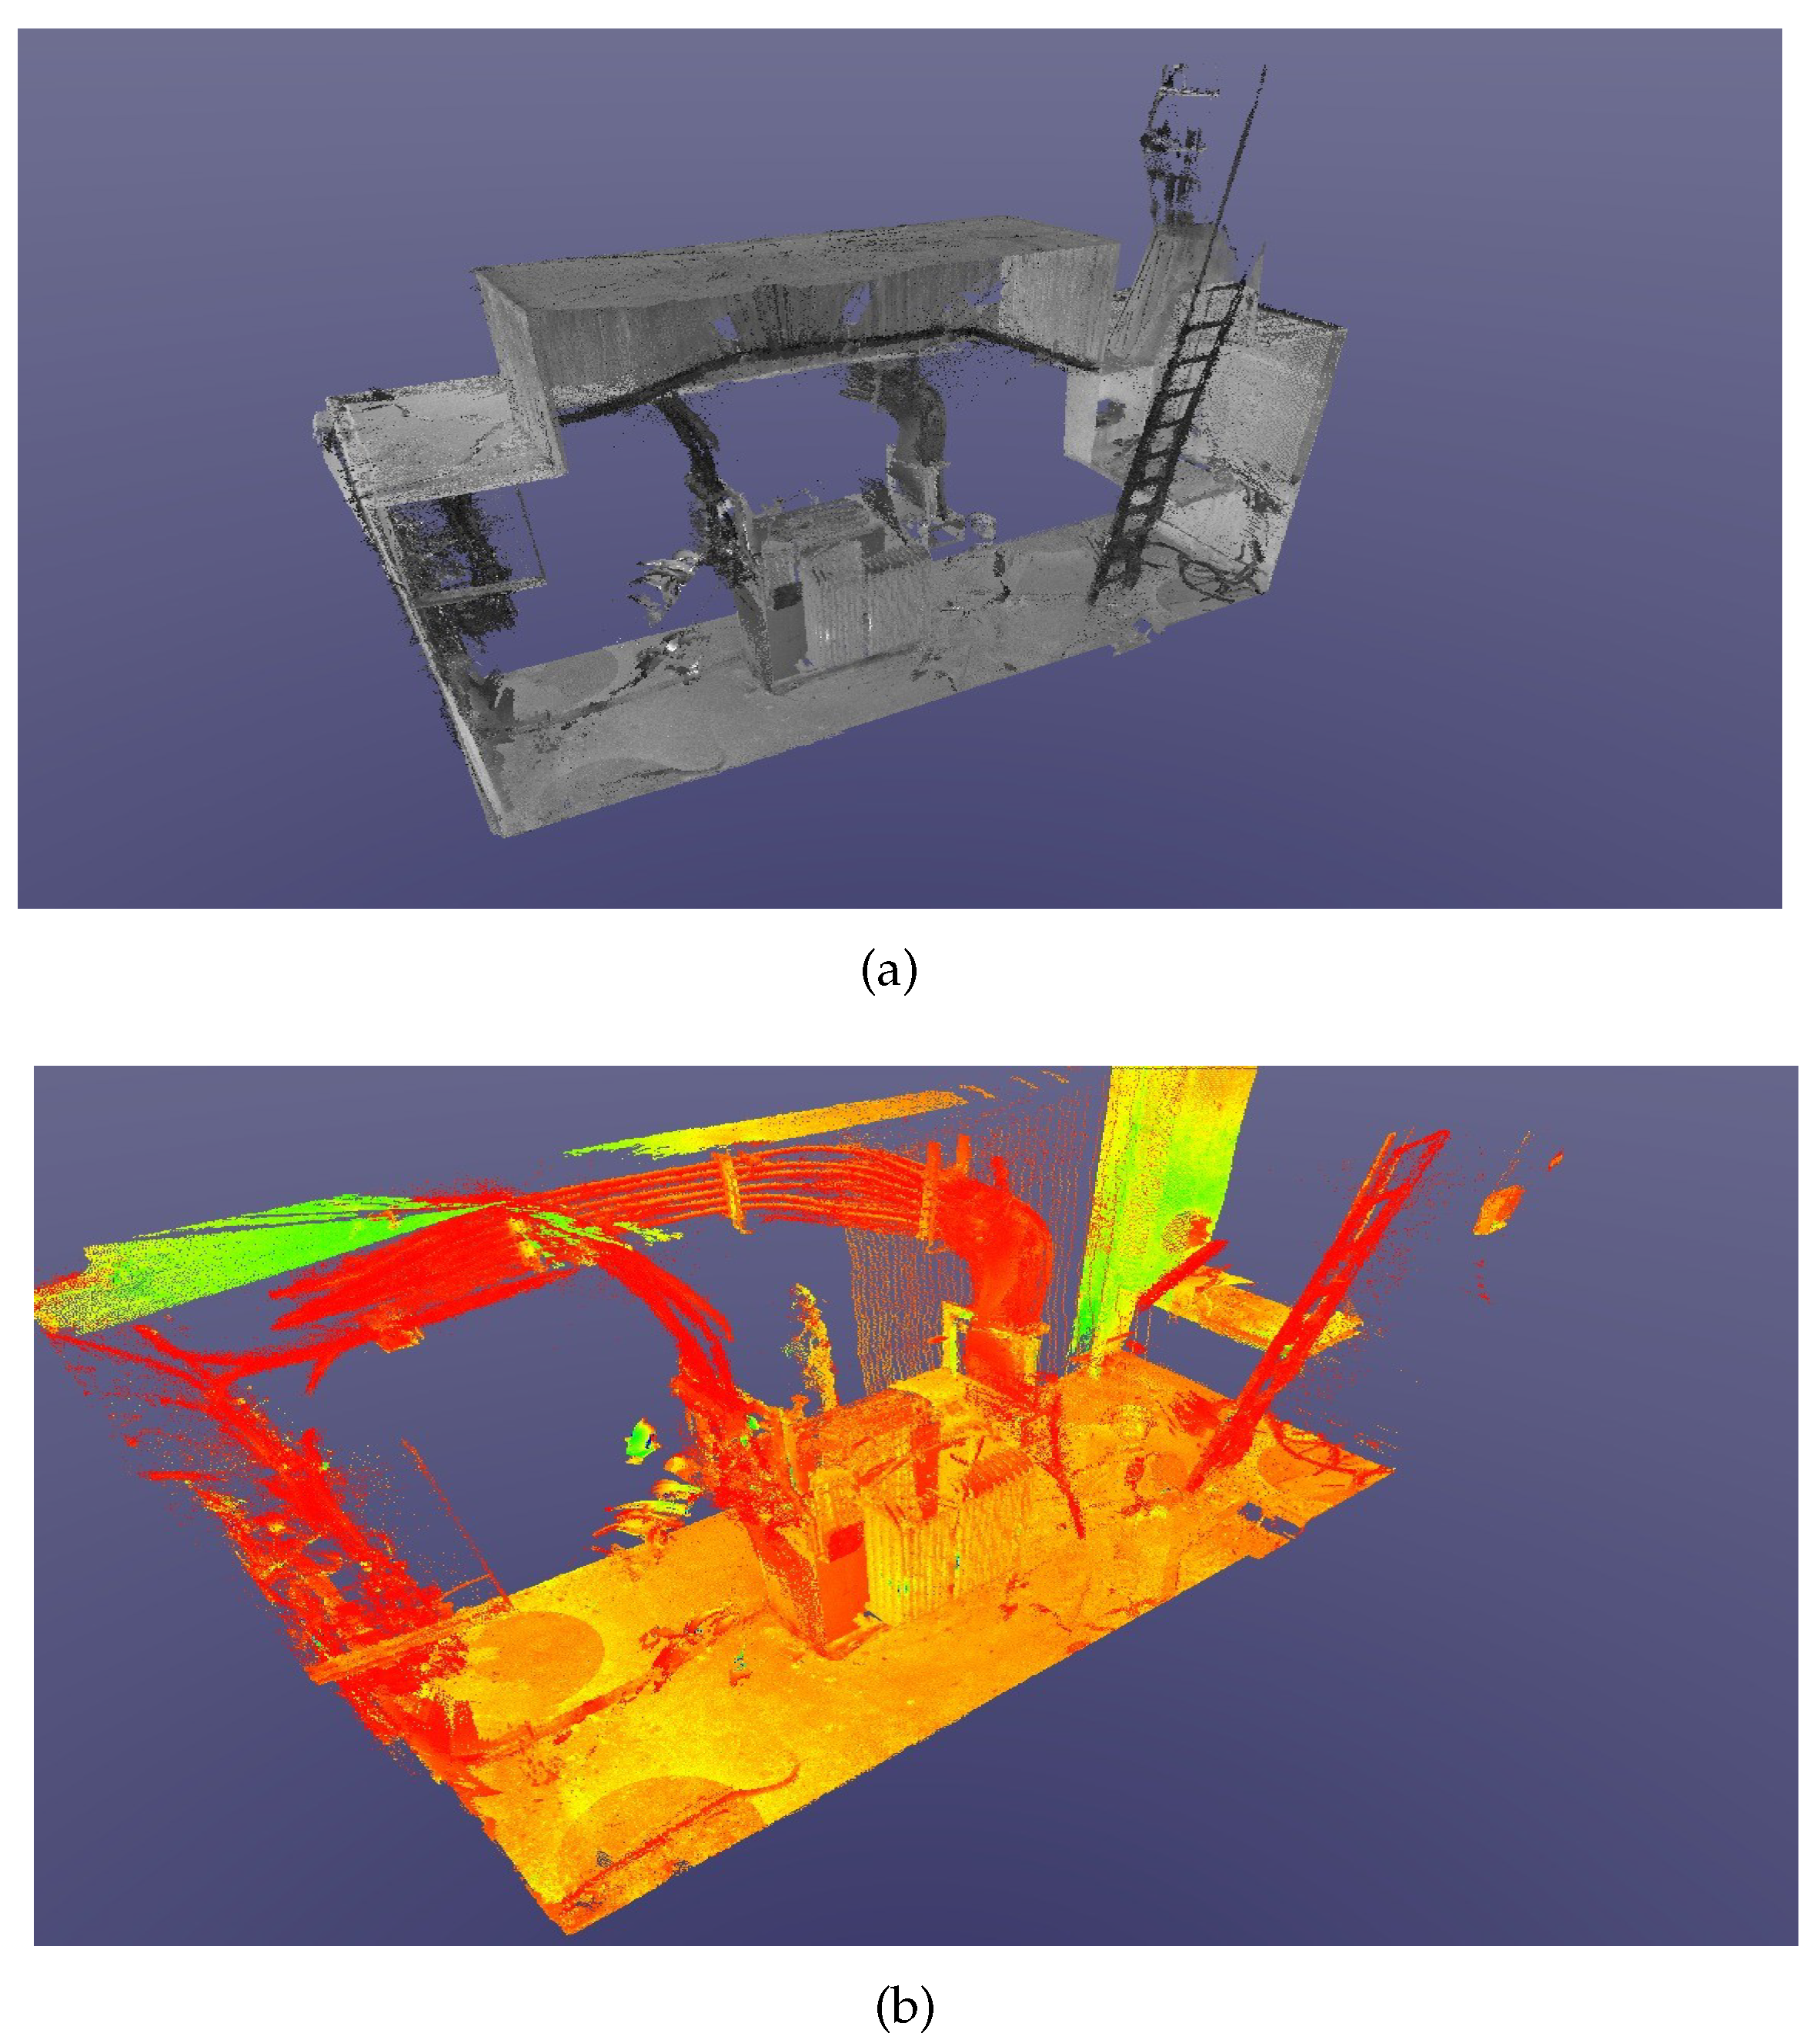
The same technology of the point cloud can be used with a handheld tool. With this tool, the workforce acting directly in its activity performs the asset scanning. The results are shown in
Figure 10, where
Figure 10a shows the point cloud results and
Figure 10b presents an automatic analysis of the point cloud outputs merged with a thermal picture overlapped. The asset scanned is a transformer located in an underground vault.
When merging point cloud outputs with a thermal capture of an asset, the user has a 3D thermal analysis of the equipment scanned. It brings many benefits for inspection and, mainly, in predictive maintenance activities of the power electrical assets. Whereas the MMS is a great system for overhead grid, the handheld systems can be suitable for underground vaults where the access is limited, as well as for closed spaces where it needs a specific scanning process.
An example of closed space is the electrical substation, where many specific assets can be scanned with major details. An alternative option for this scanning is the static scanner, which uses point cloud technology. The result of this system is presented in
Figure 11. In
Figure 11a, a detailed asset is scanned, whereas
Figure 11b brings a whole visualization of the substation through the point cloud.
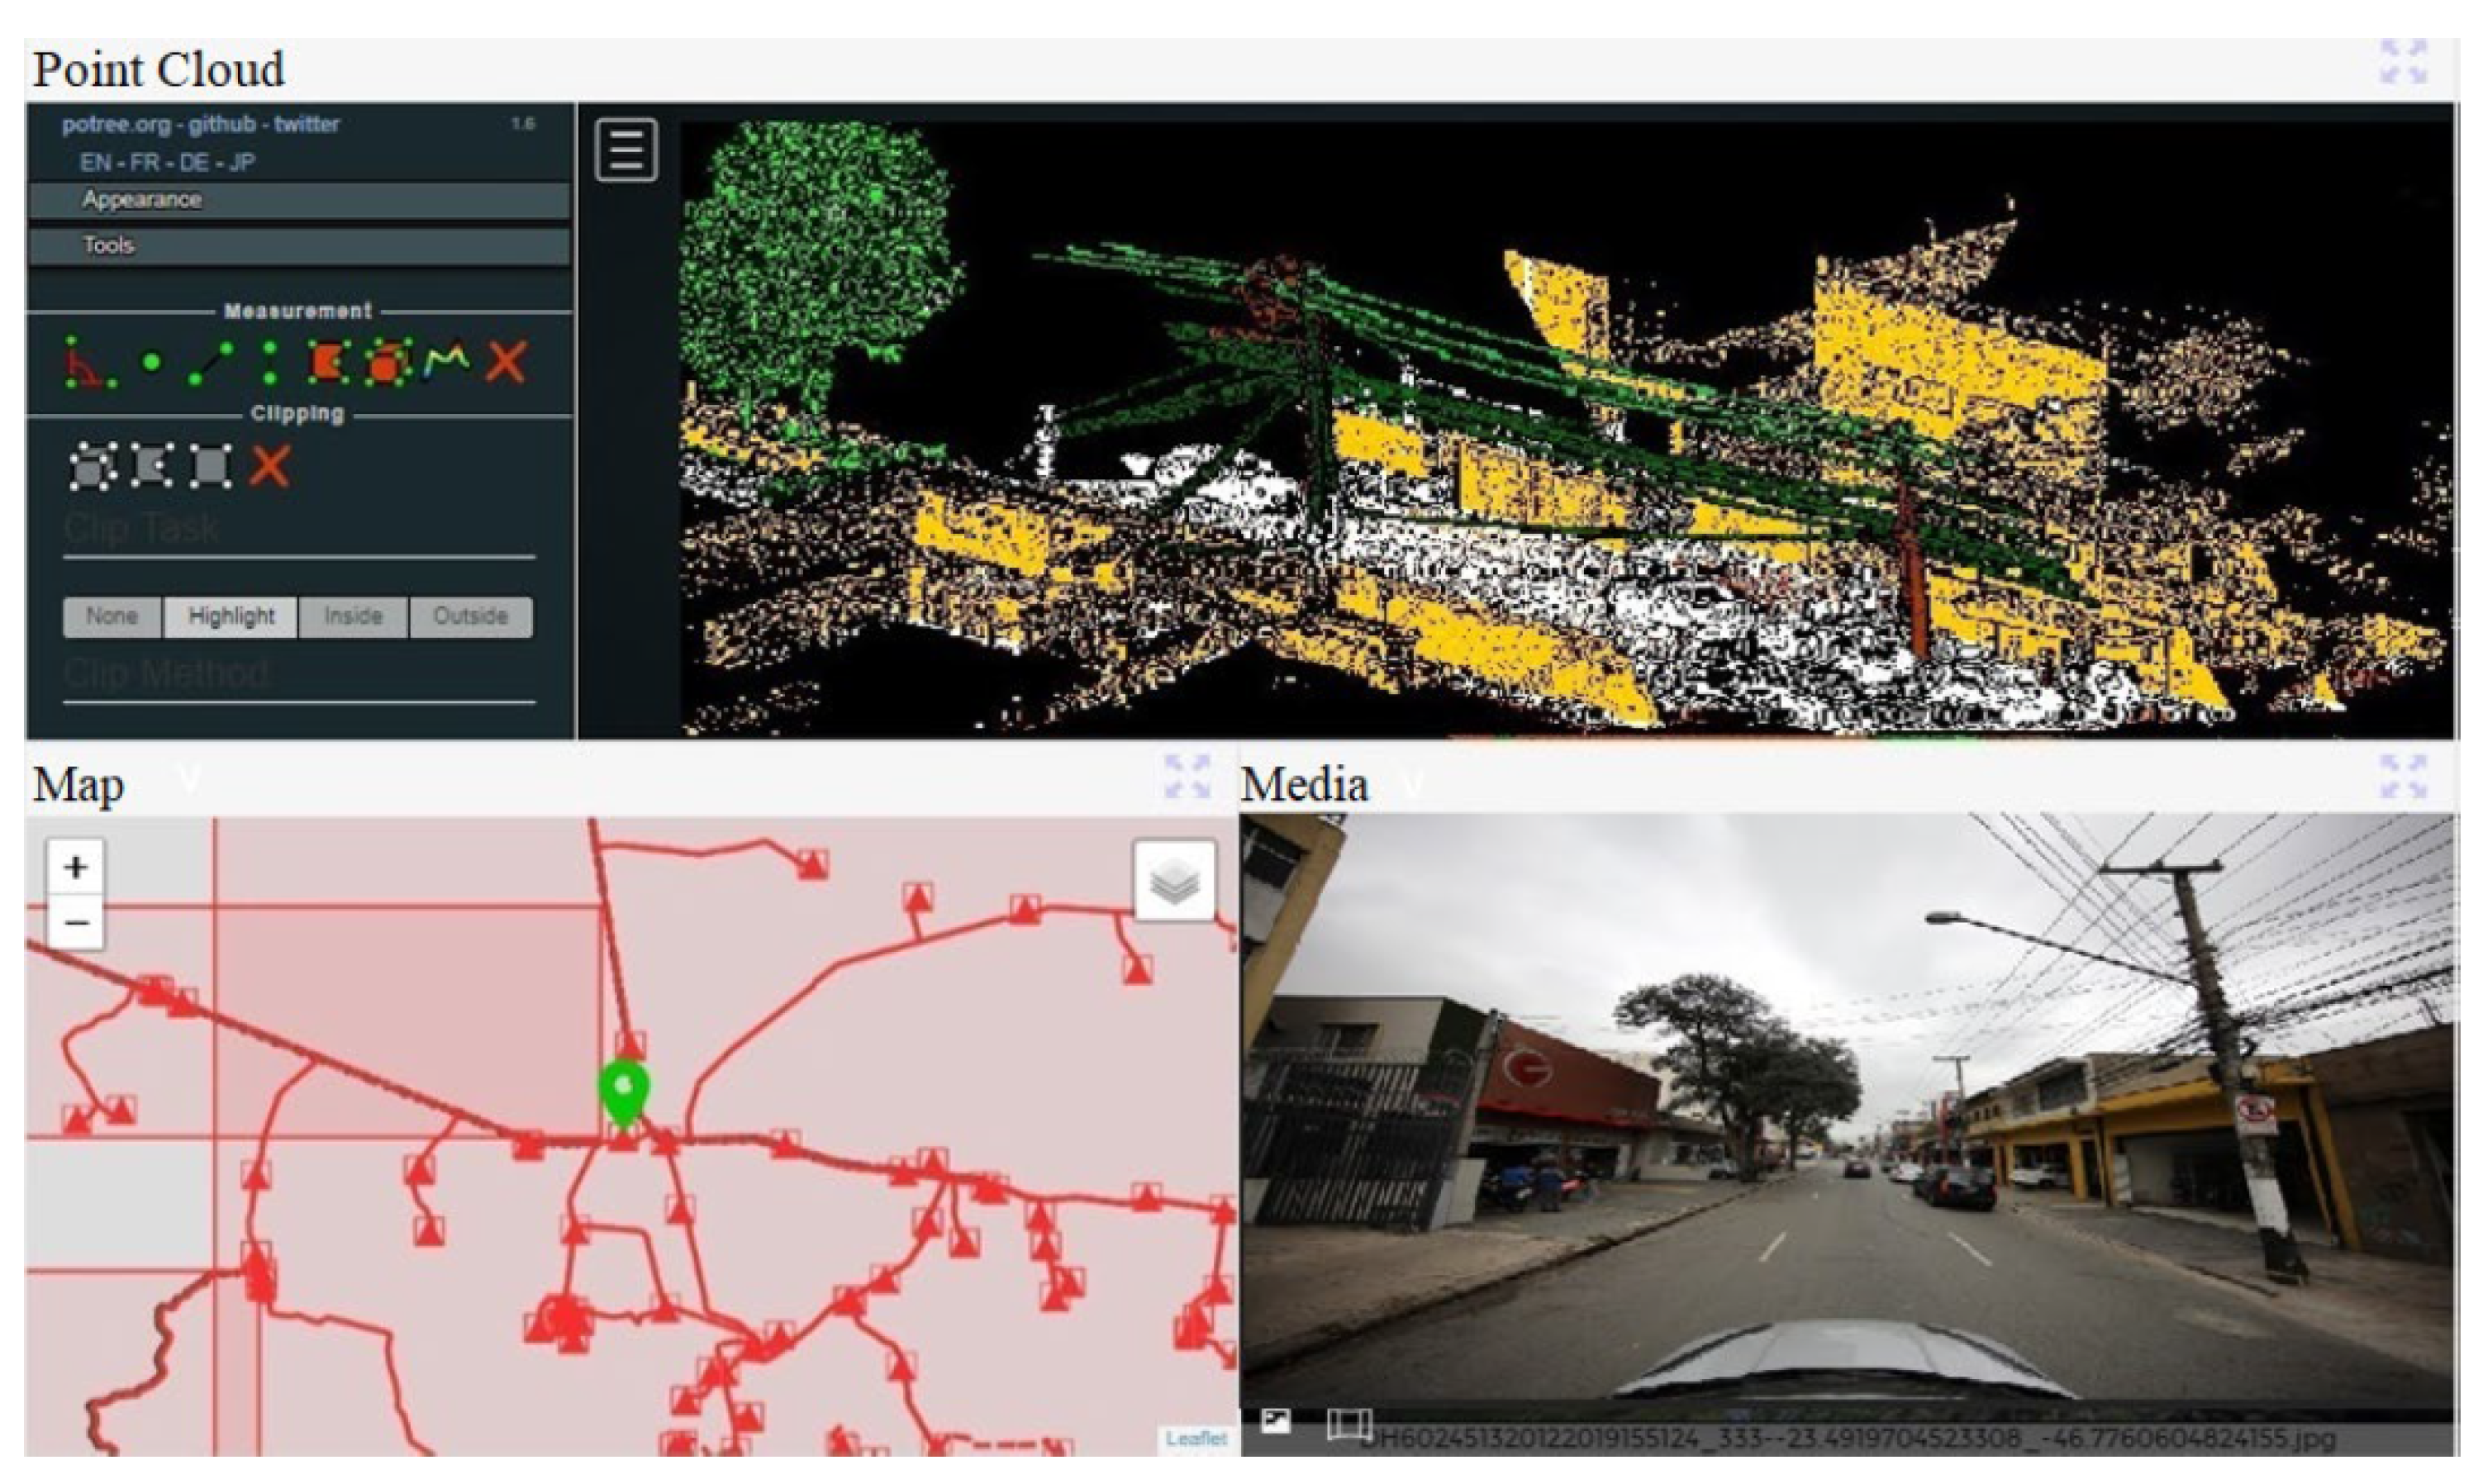
The “3D modeling system and repository” is the company’s platform used to store and access information collected in the field by the MMS. This system allows the simultaneous visualization of the previously segmented and classified point cloud, the images, and the cartography of the same location, as it is used in conjunction with the company’s GIS. The user can measure distance, area, and volume on the 3D point cloud model and filter it for greater detail and measurement view. Whenever a point on the cloud or map is selected, the image of the same point is loaded. This is possible because all information is georeferenced and has high precision (image, cloud, and map). The images allow users to check electrical grid assets and components, zoom in for more details, and view the location in 360°. As this platform is web-based, and the data are stored in a global company repository at the cloud, everyone in the company can access and benefit from it [
18].
A result for the MMS can be visualized in
Figure 12.
The platform already receives the segmented and classified 3D model, indicating which group or type of object each point belongs to, thus making it possible to filter only what the user wants to see. The classified point cloud allows the global platform to identify clashes and generate reports automatically, allowing the user to view their location and export the list of clashes by type. In this way, the team that performs the trimming of trees can generate their prioritization by distancing them from the network and be more efficient in the execution of these cuts. The evolution of this point cloud over time can allow predictive maintenance software to predict when a particular tree will be close to the network, thus allowing for trimming planning with current and near future needs [
18].
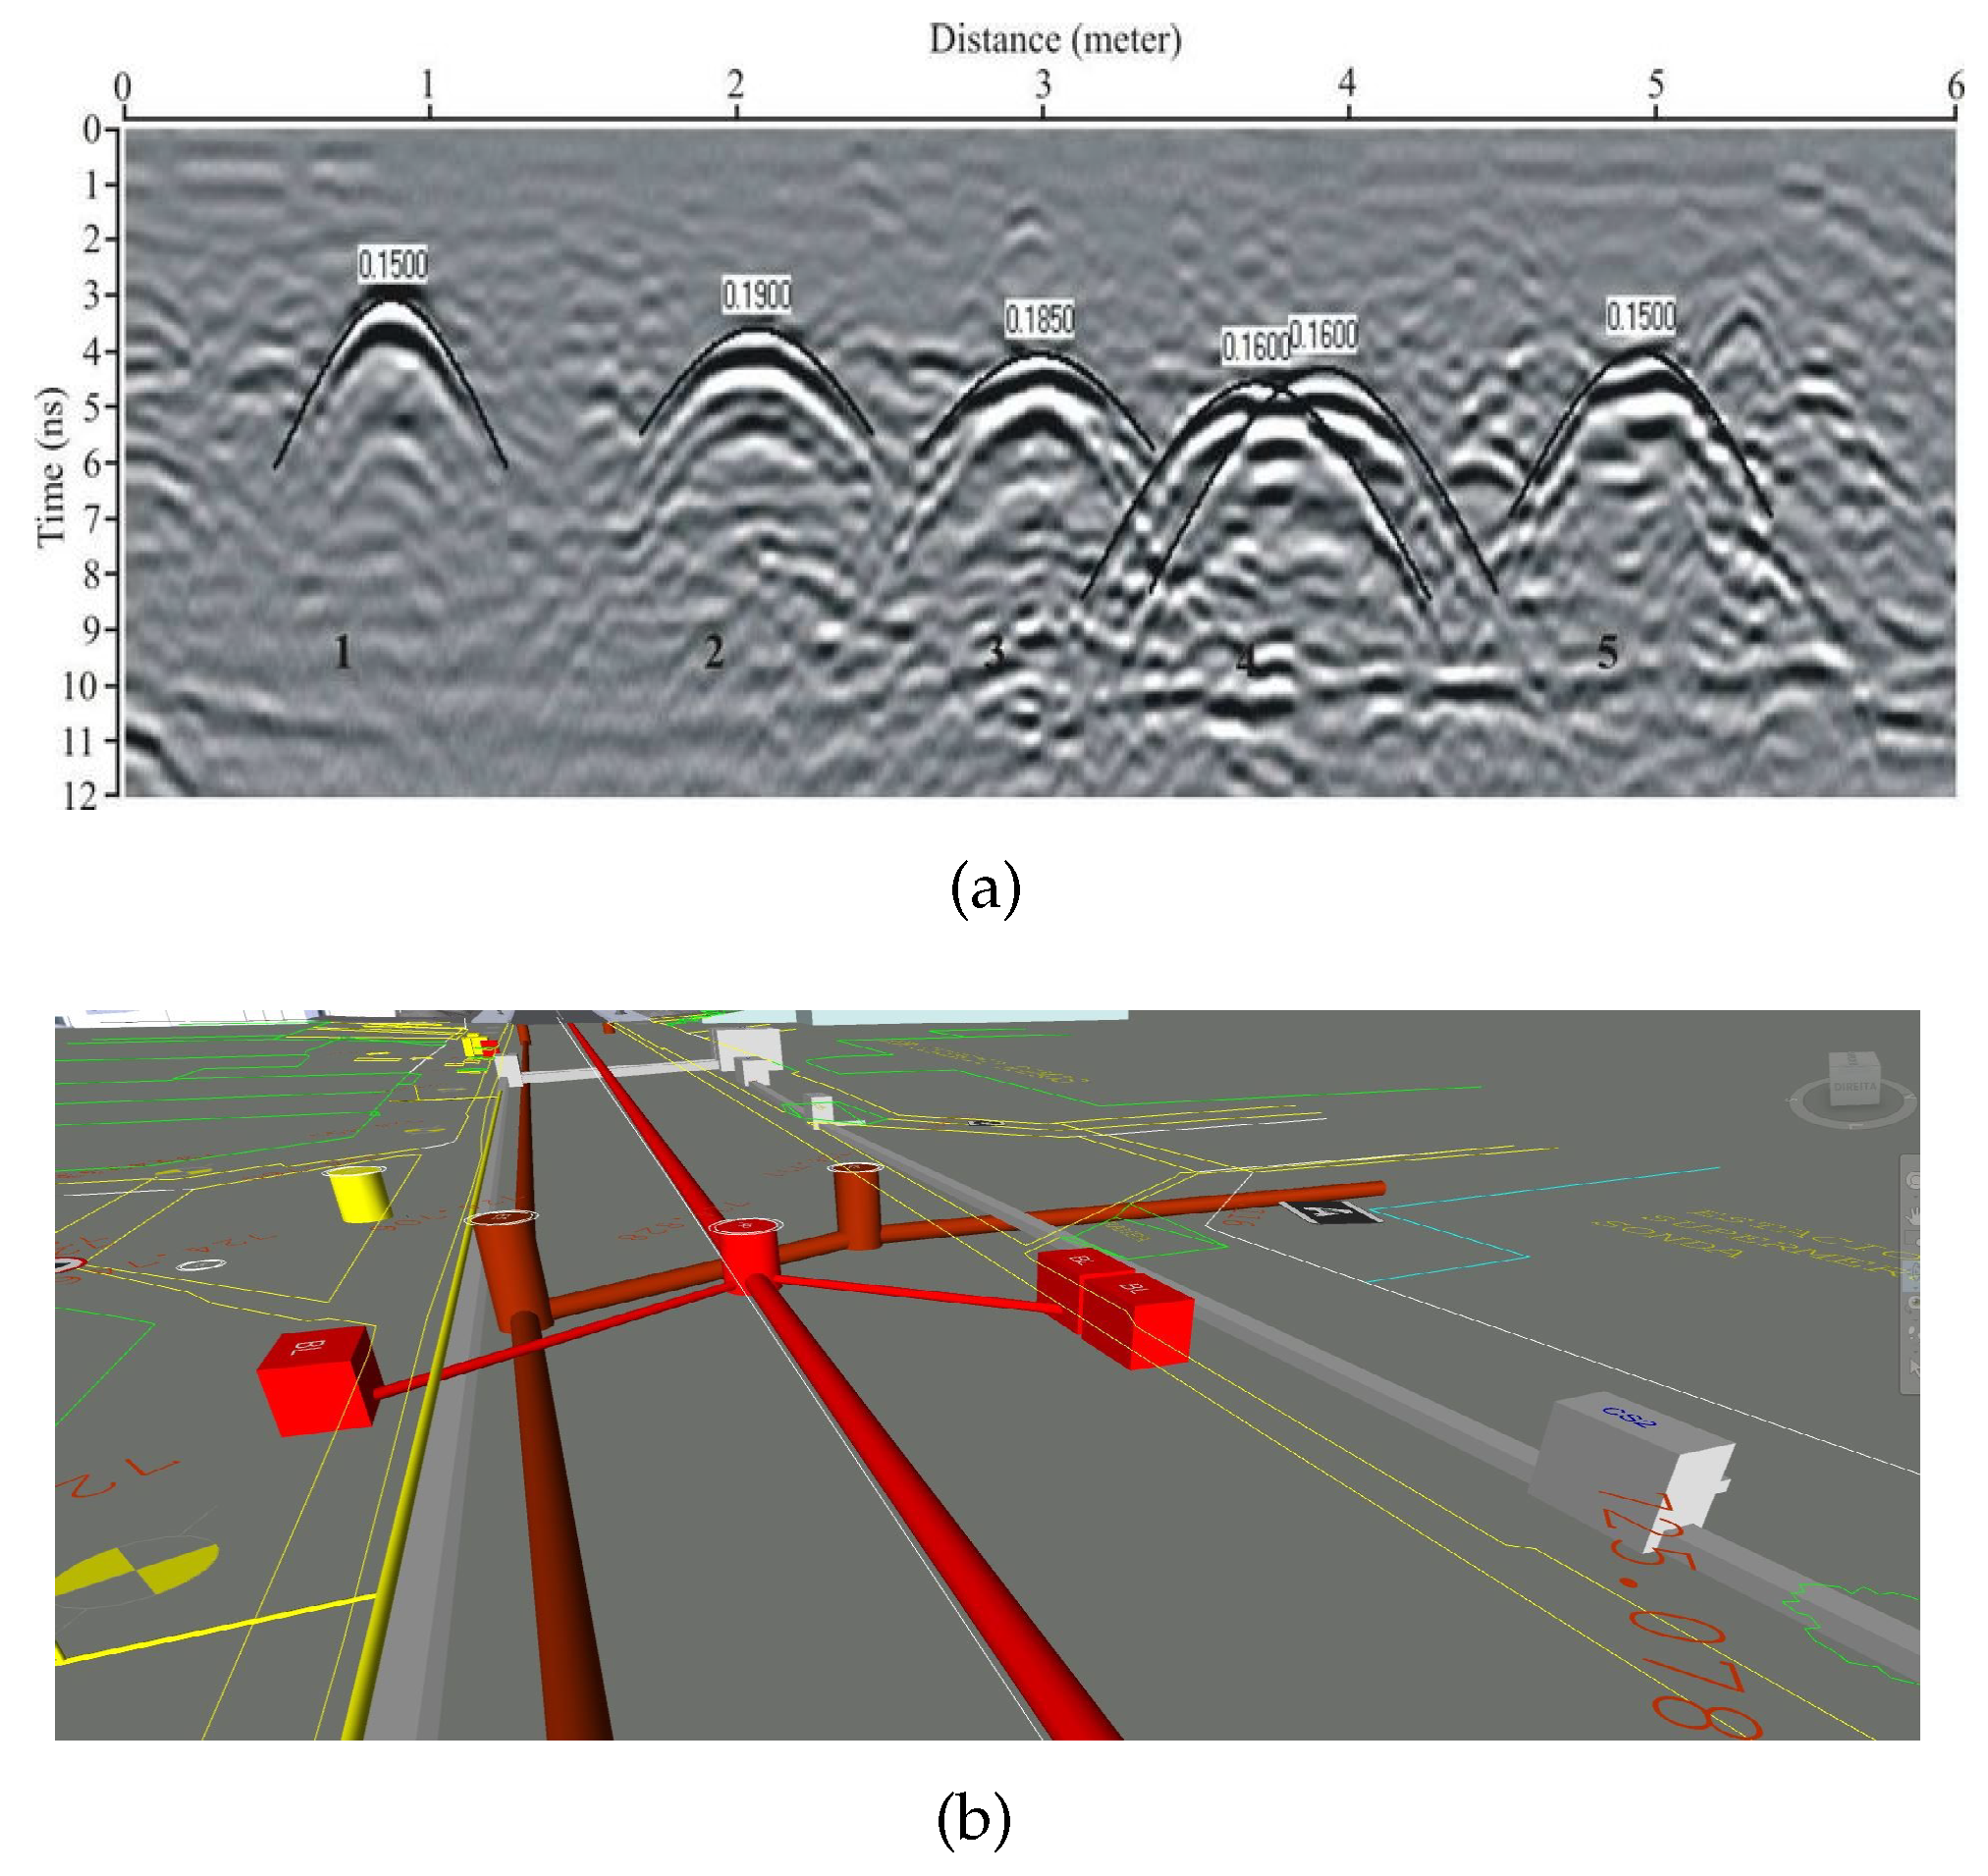
Whereas the point cloud is a great technology for scanning visible and touchable assets, there are other kinds of grid elements that are not visible. Underground grid cables, for instance, are a modern realization in the power grid. Those ducts are not exclusive to the electrical grid, but also gas or telecommunication companies occupy the same underground path. To scan these elements, a GPR technology is suitable. This method needs a deep analysis after the radar data gathering to draw a real perspective of the underground grid. An example of the radar data is shown in
Figure 13. The raw data are presented in
Figure 13a, whereas a processed output is illustrated in
Figure 13b.
Concerning images output, the examples presented are the initial outputs of the UF project, using the tools chosen to develop the foundation layer of an electrical NDT© in São Paulo, Brazil.
4.2. On-Field Services
To perform the NDT© development, workforce activities merging is essential. In fact, there are many on-field activities that can feed the NDT© databases, and many incipient NDT© outputs that can be used to enhance workforce activities.
One application developed in the UF project uses GNSS technology along with a laser measuring device. It aims to facilitate the workforce; at the same time, the asset’s georeference is updated in the utility’s system. This application allows the workforce team to navigate and consult data and graphical maps of the MV and LV power grids. The application guarantees logistical and operational benefits, resulting from the availability of updated electrical network diagrams, in an interactive and integrated way.
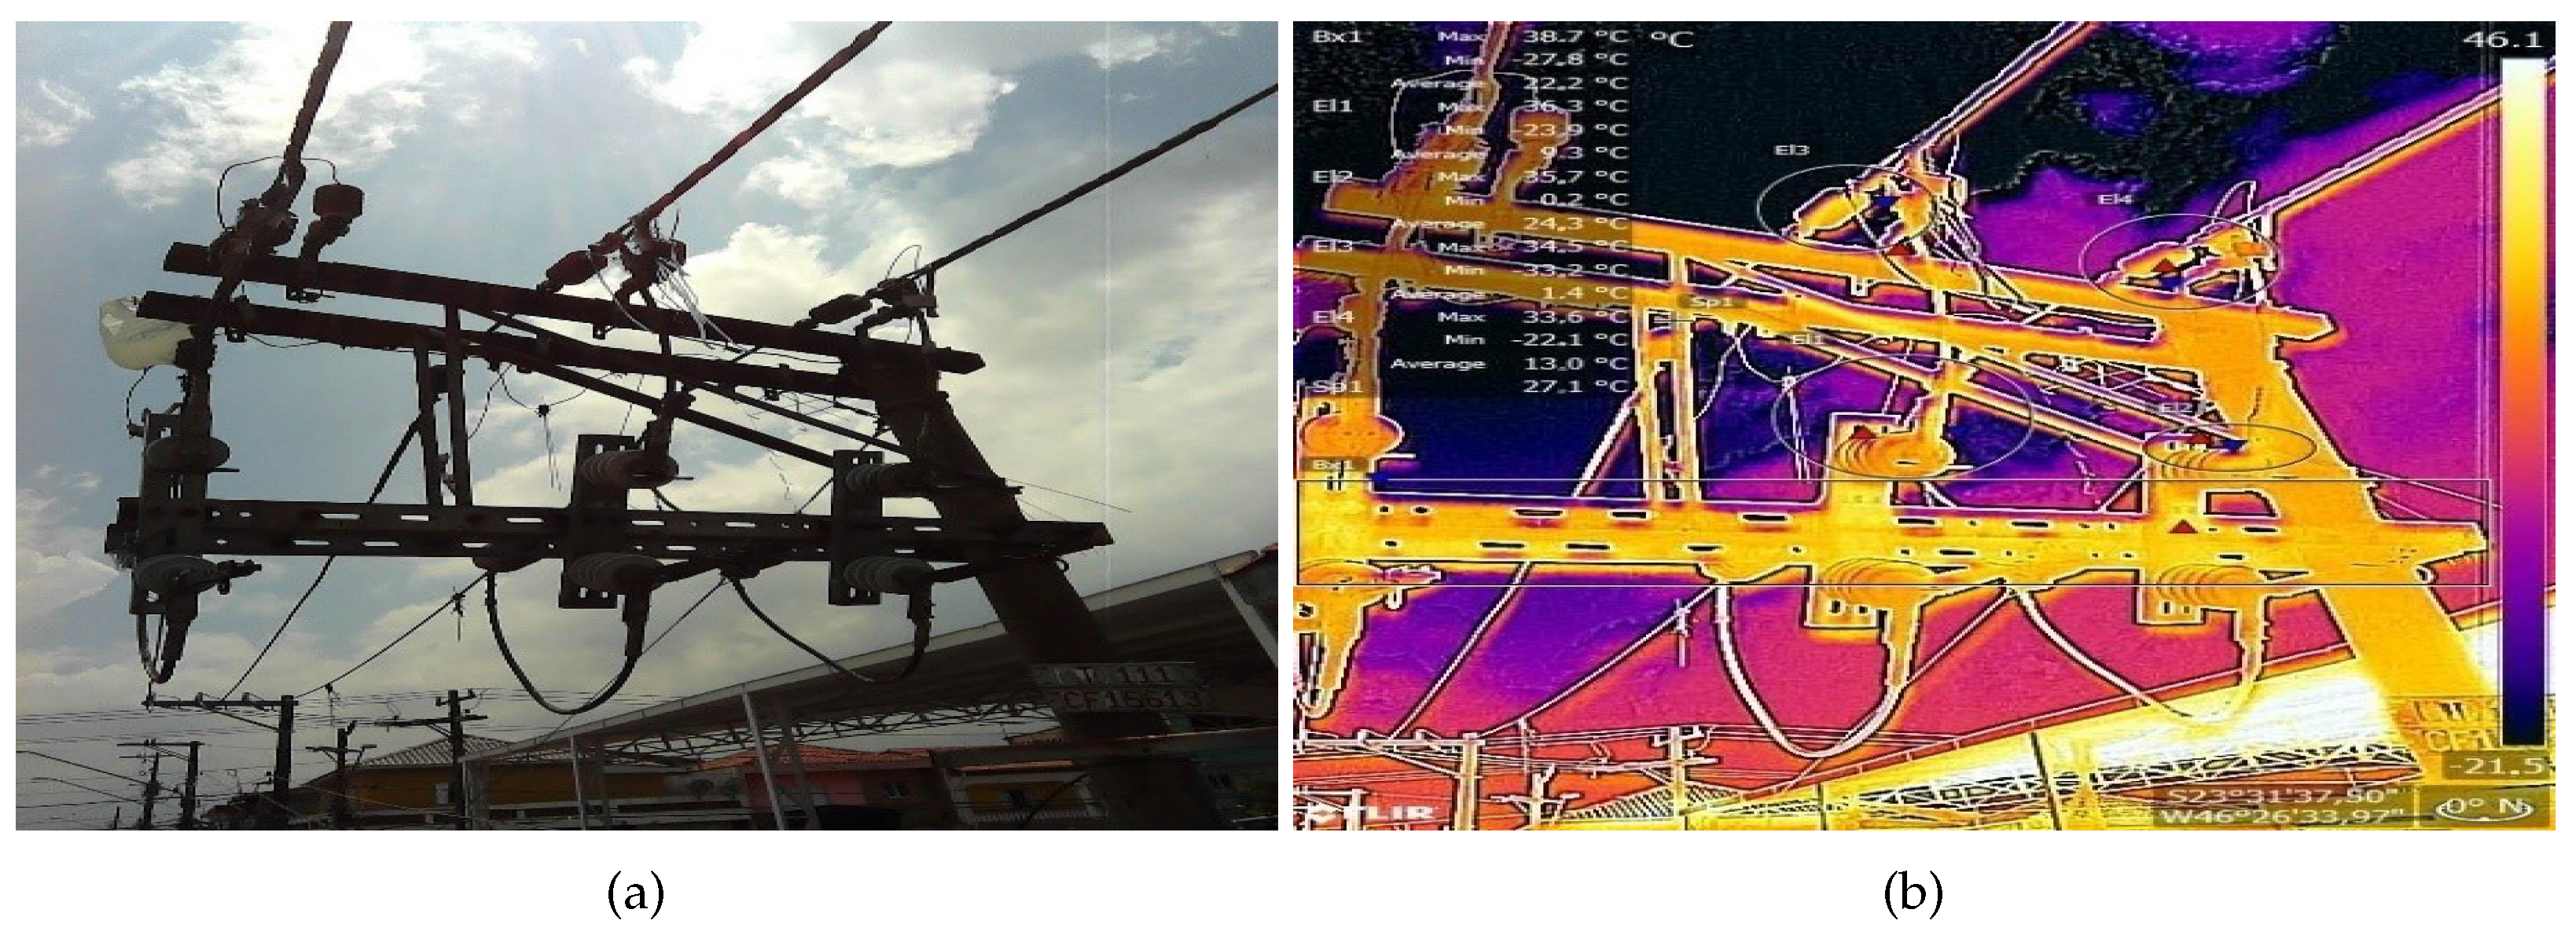
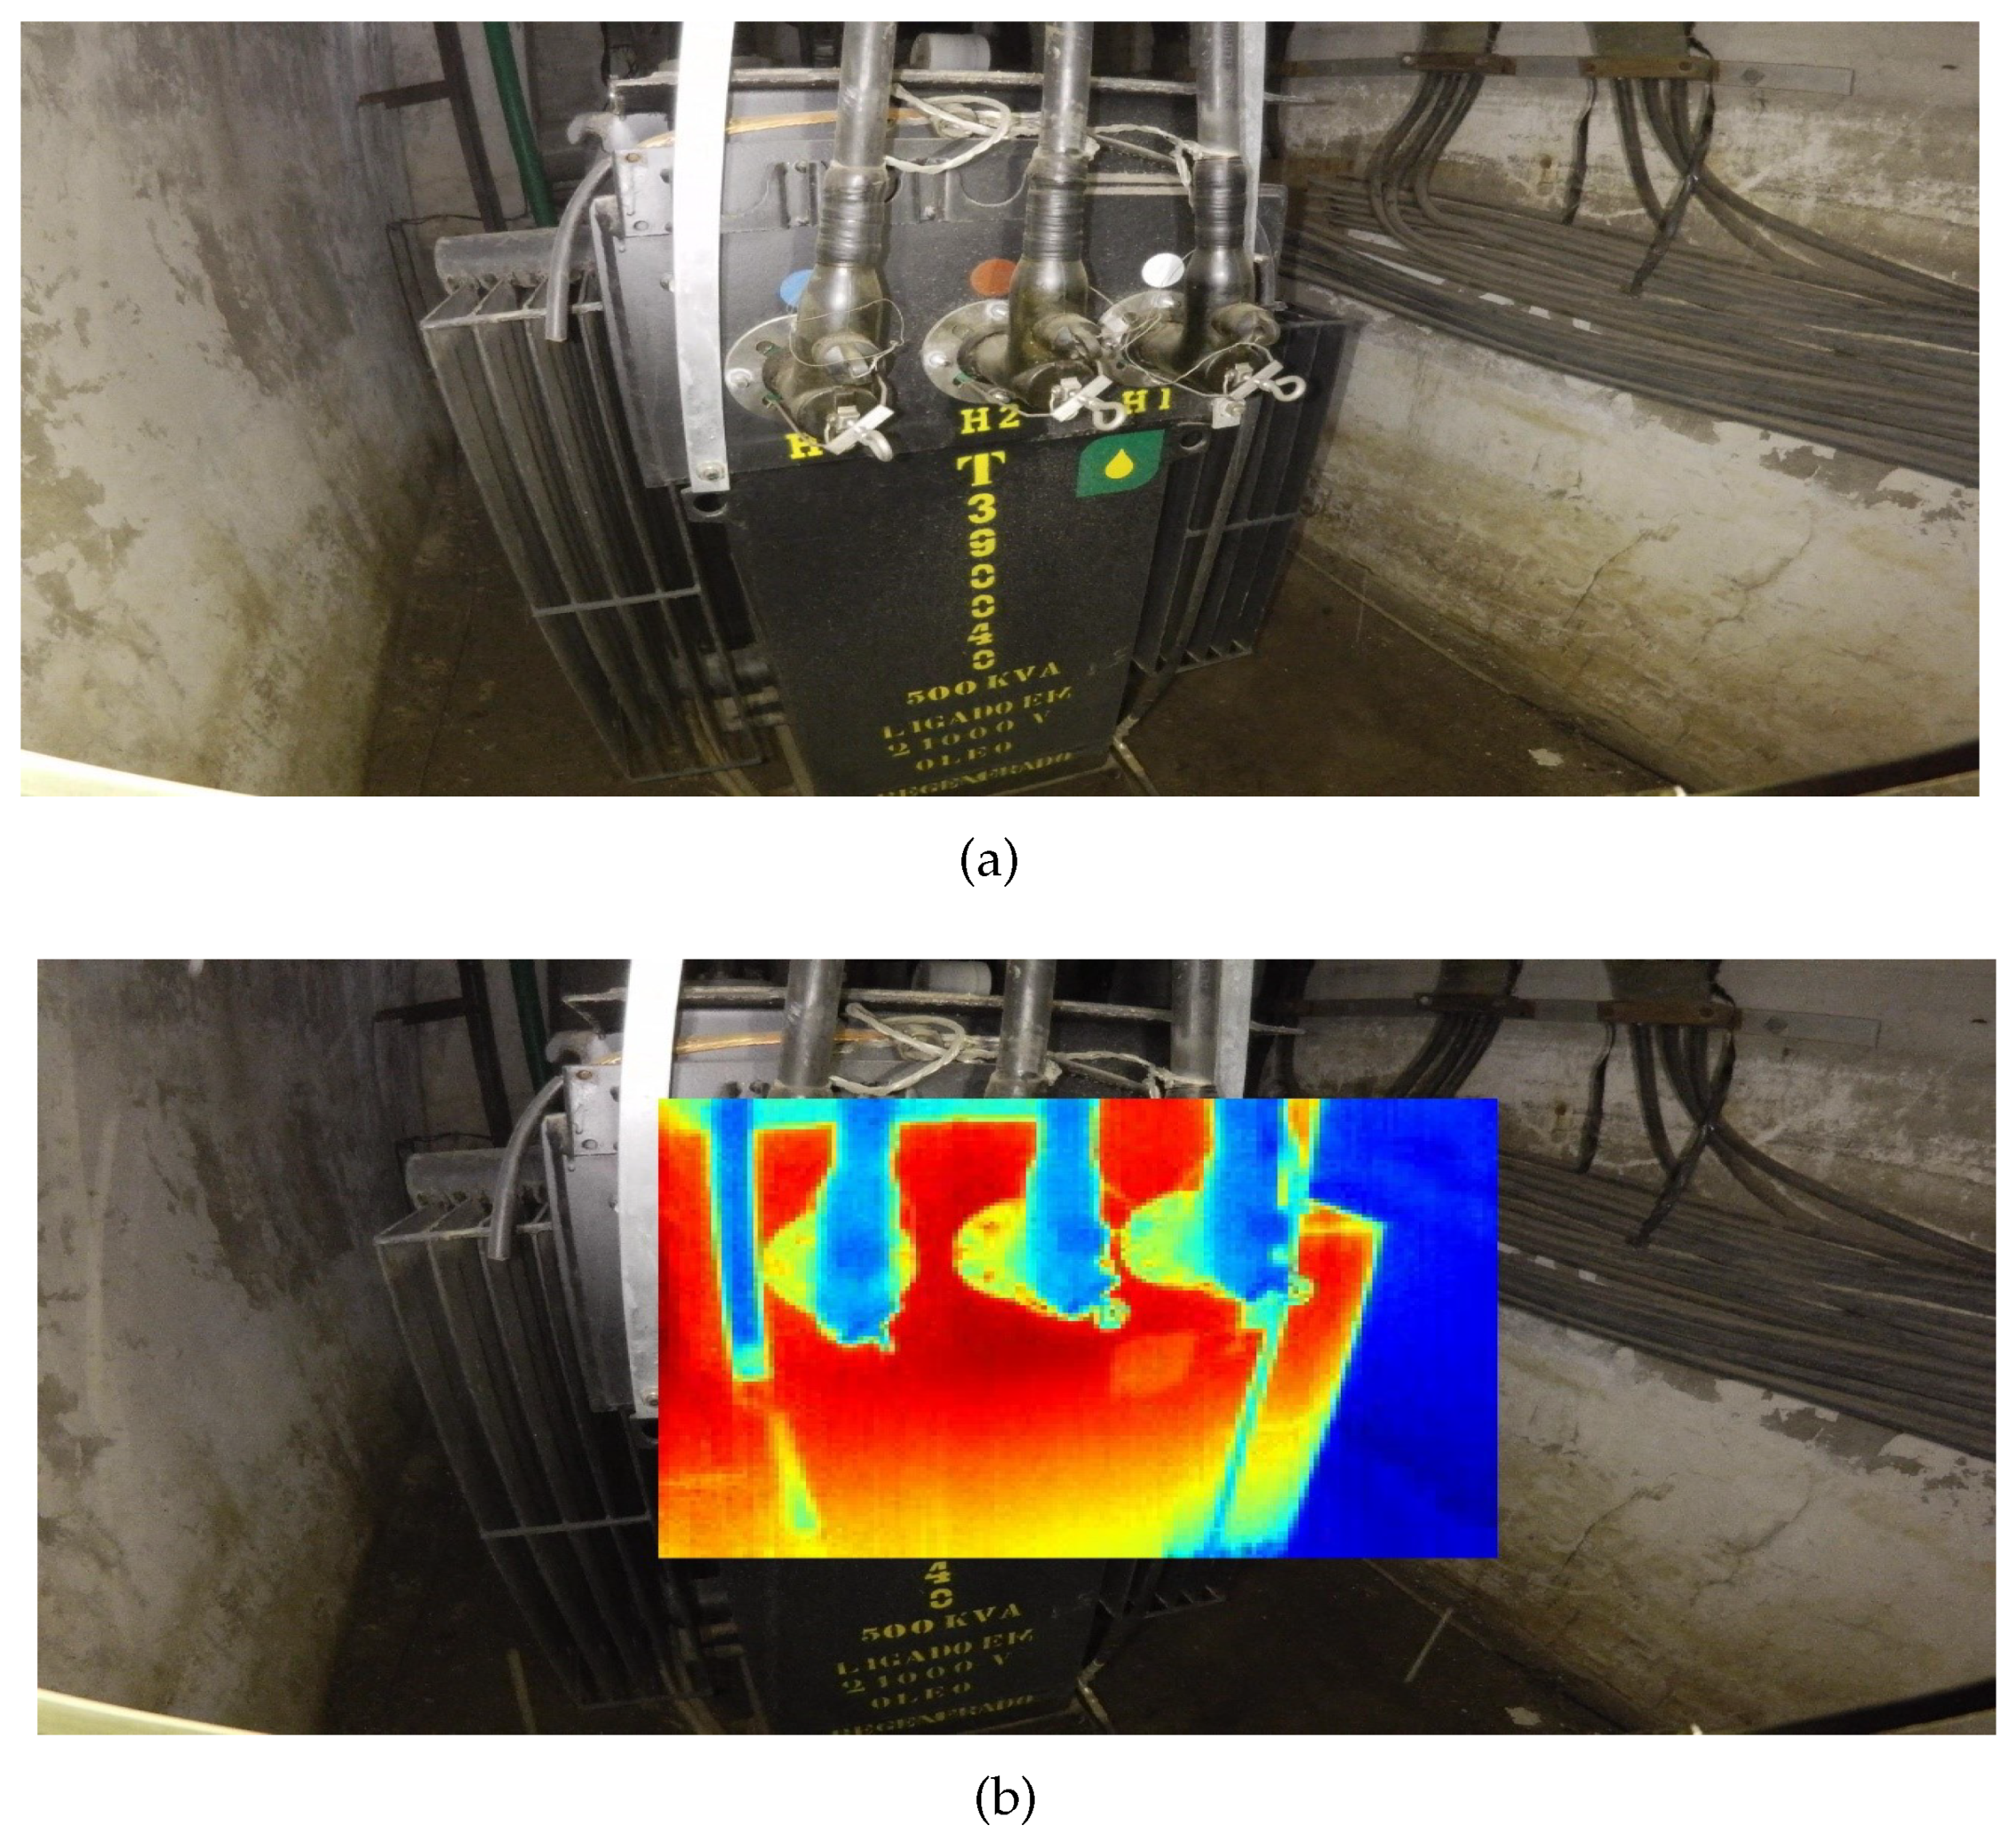
Considering an immediate use of NDT© data gathering, thermal images collected through workforce smartphone gadget help the workforce with inspection activity, and preventive and predictive maintenance. The image illustrated in
Figure 14 shows the thermal result in on-field activity. While
Figure 14a shows the original image,
Figure 14b presents the thermal output of the asset.
As the NDT© development tools are being used, the inspection and preventive maintenance is improved simultaneously. The use of drones in the electrical grid is a way to enhance such activities, and brings useful data for the NDT© development. An application for such tool relates to underground vault inspection.
Figure 15 presents a drone inspection in a transformer underground vault with digital picture output and its thermal analysis.
The use of AR presents itself as a great potential to enhance workforce activities in the power electrical sector. The UF project is being used for remote assistance and workforce manual simplification. The major benefit to have remote assistance through AR is to have real-time interactive assistance, whereas the employee remains with heads-up and hands-free in its activities. The data shared during the assistance can be from the NDT© database as it is being formed and updated.
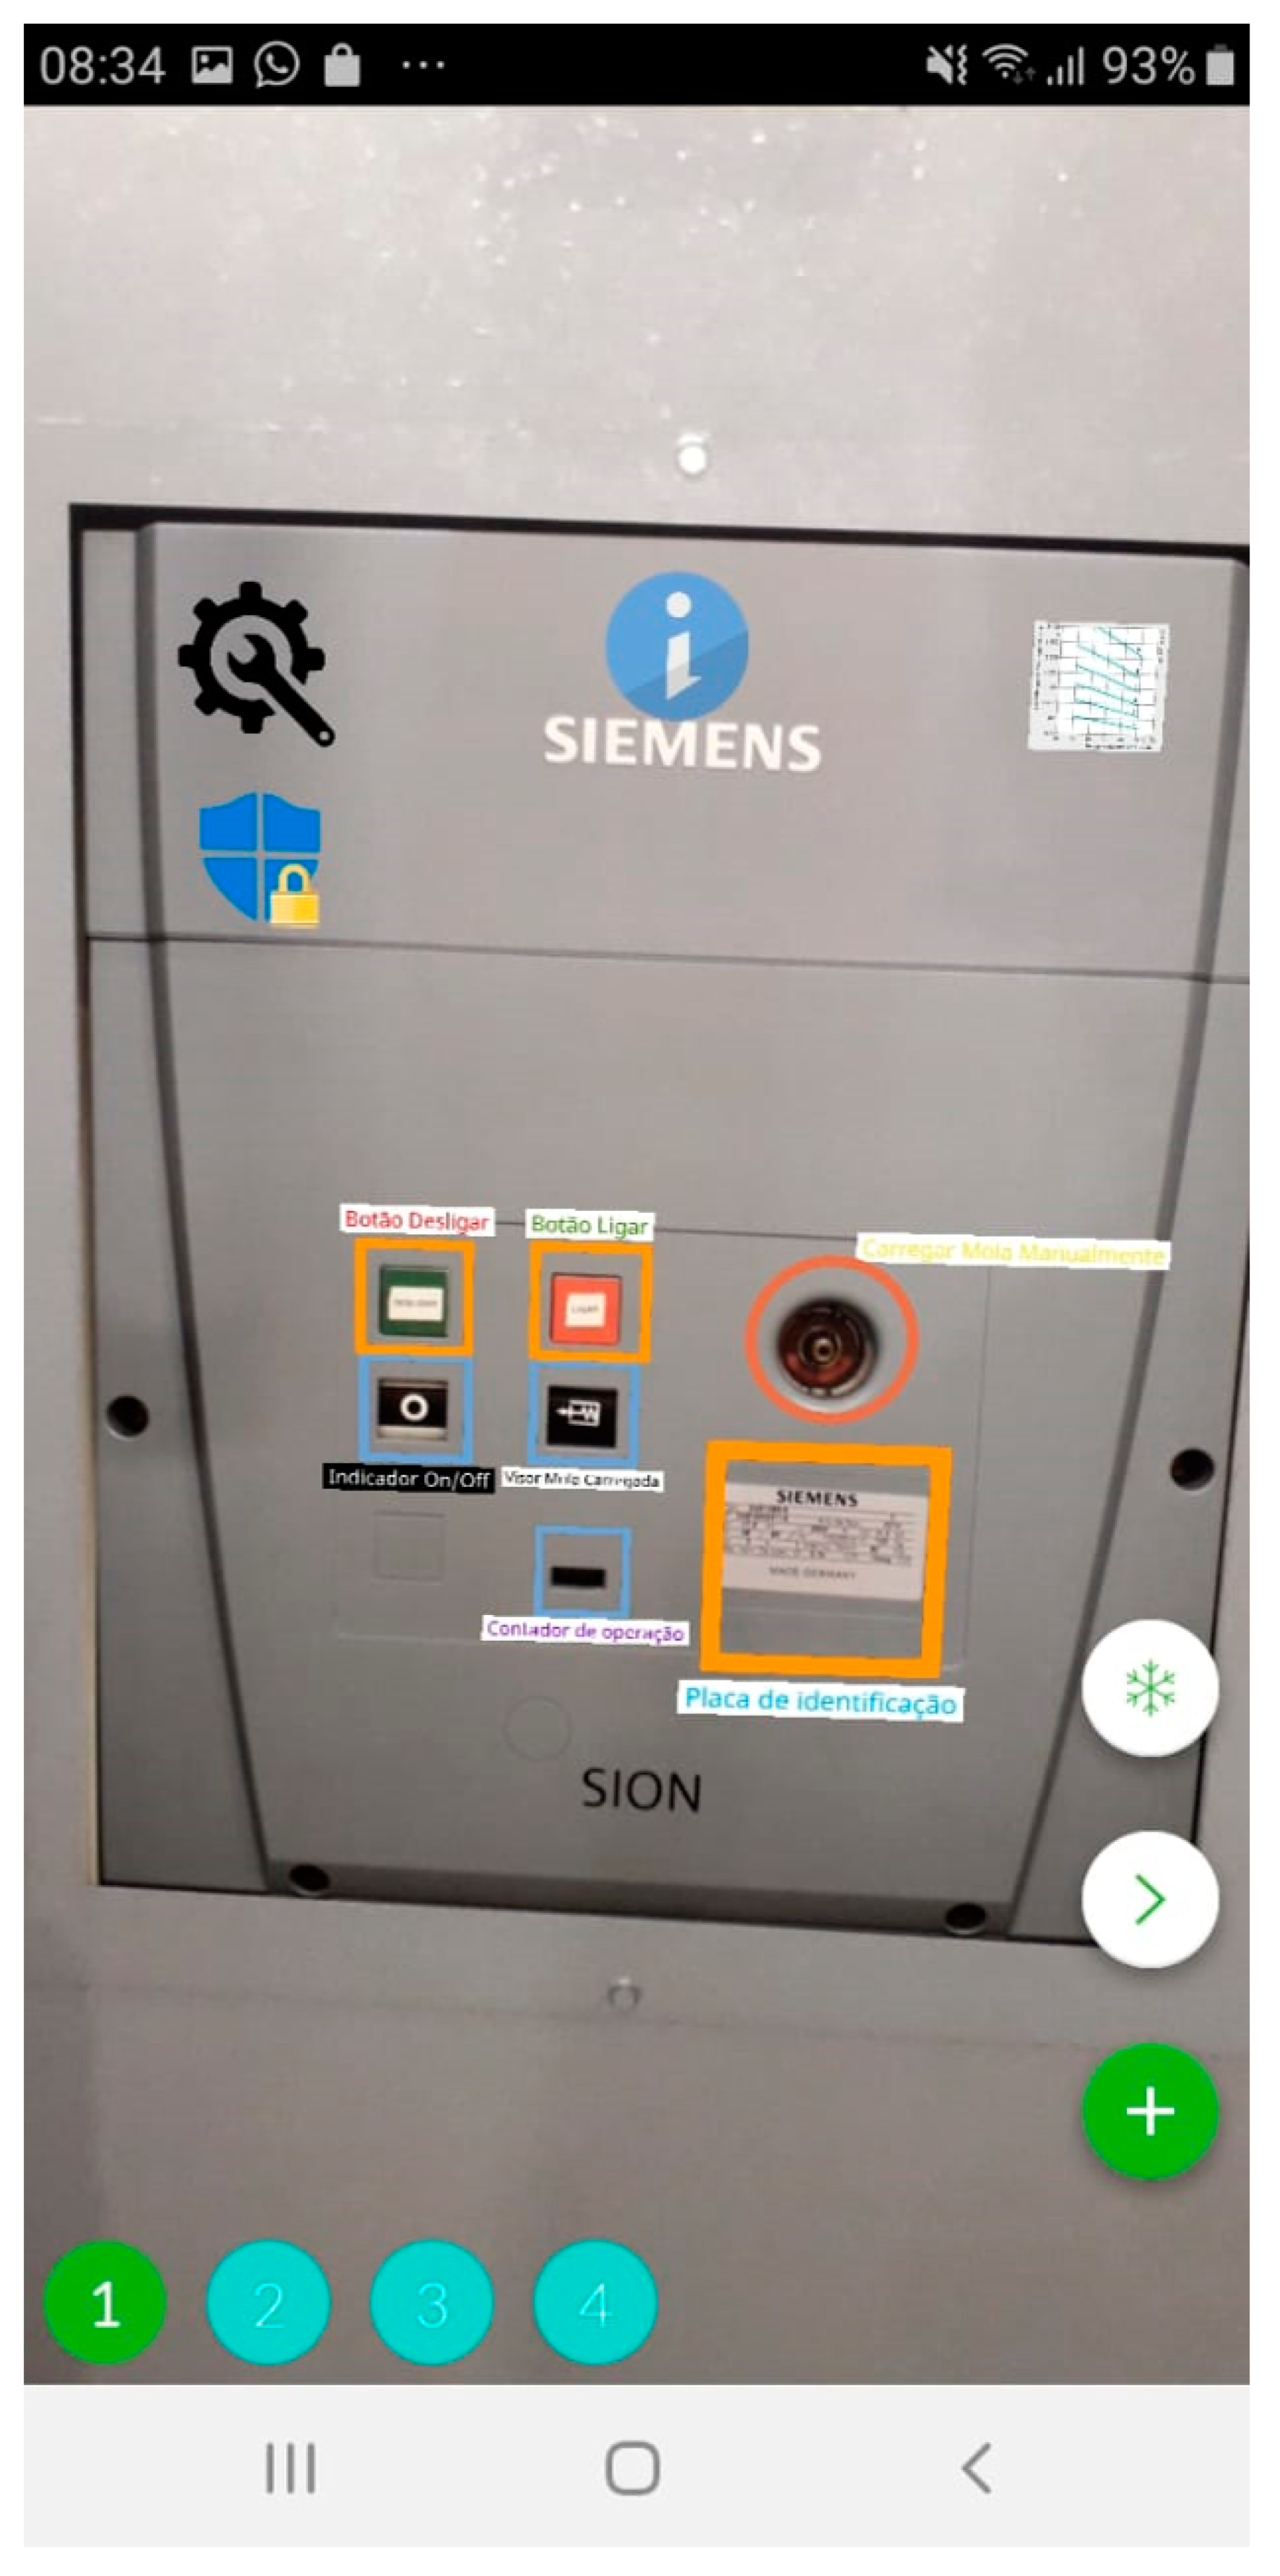
AR goes beyond, using digital images overlapping the real scenario of an on-field activity. The manual in AR kit overlay application implemented in the UF project uses automatic asset recognition, bringing any kind of document in an augmented reality form. This application is demonstrated in
Figure 16, where a substation circuit breaker is being overlapped with virtual icons linked in relevant documentation for the workforce employees’ usage.
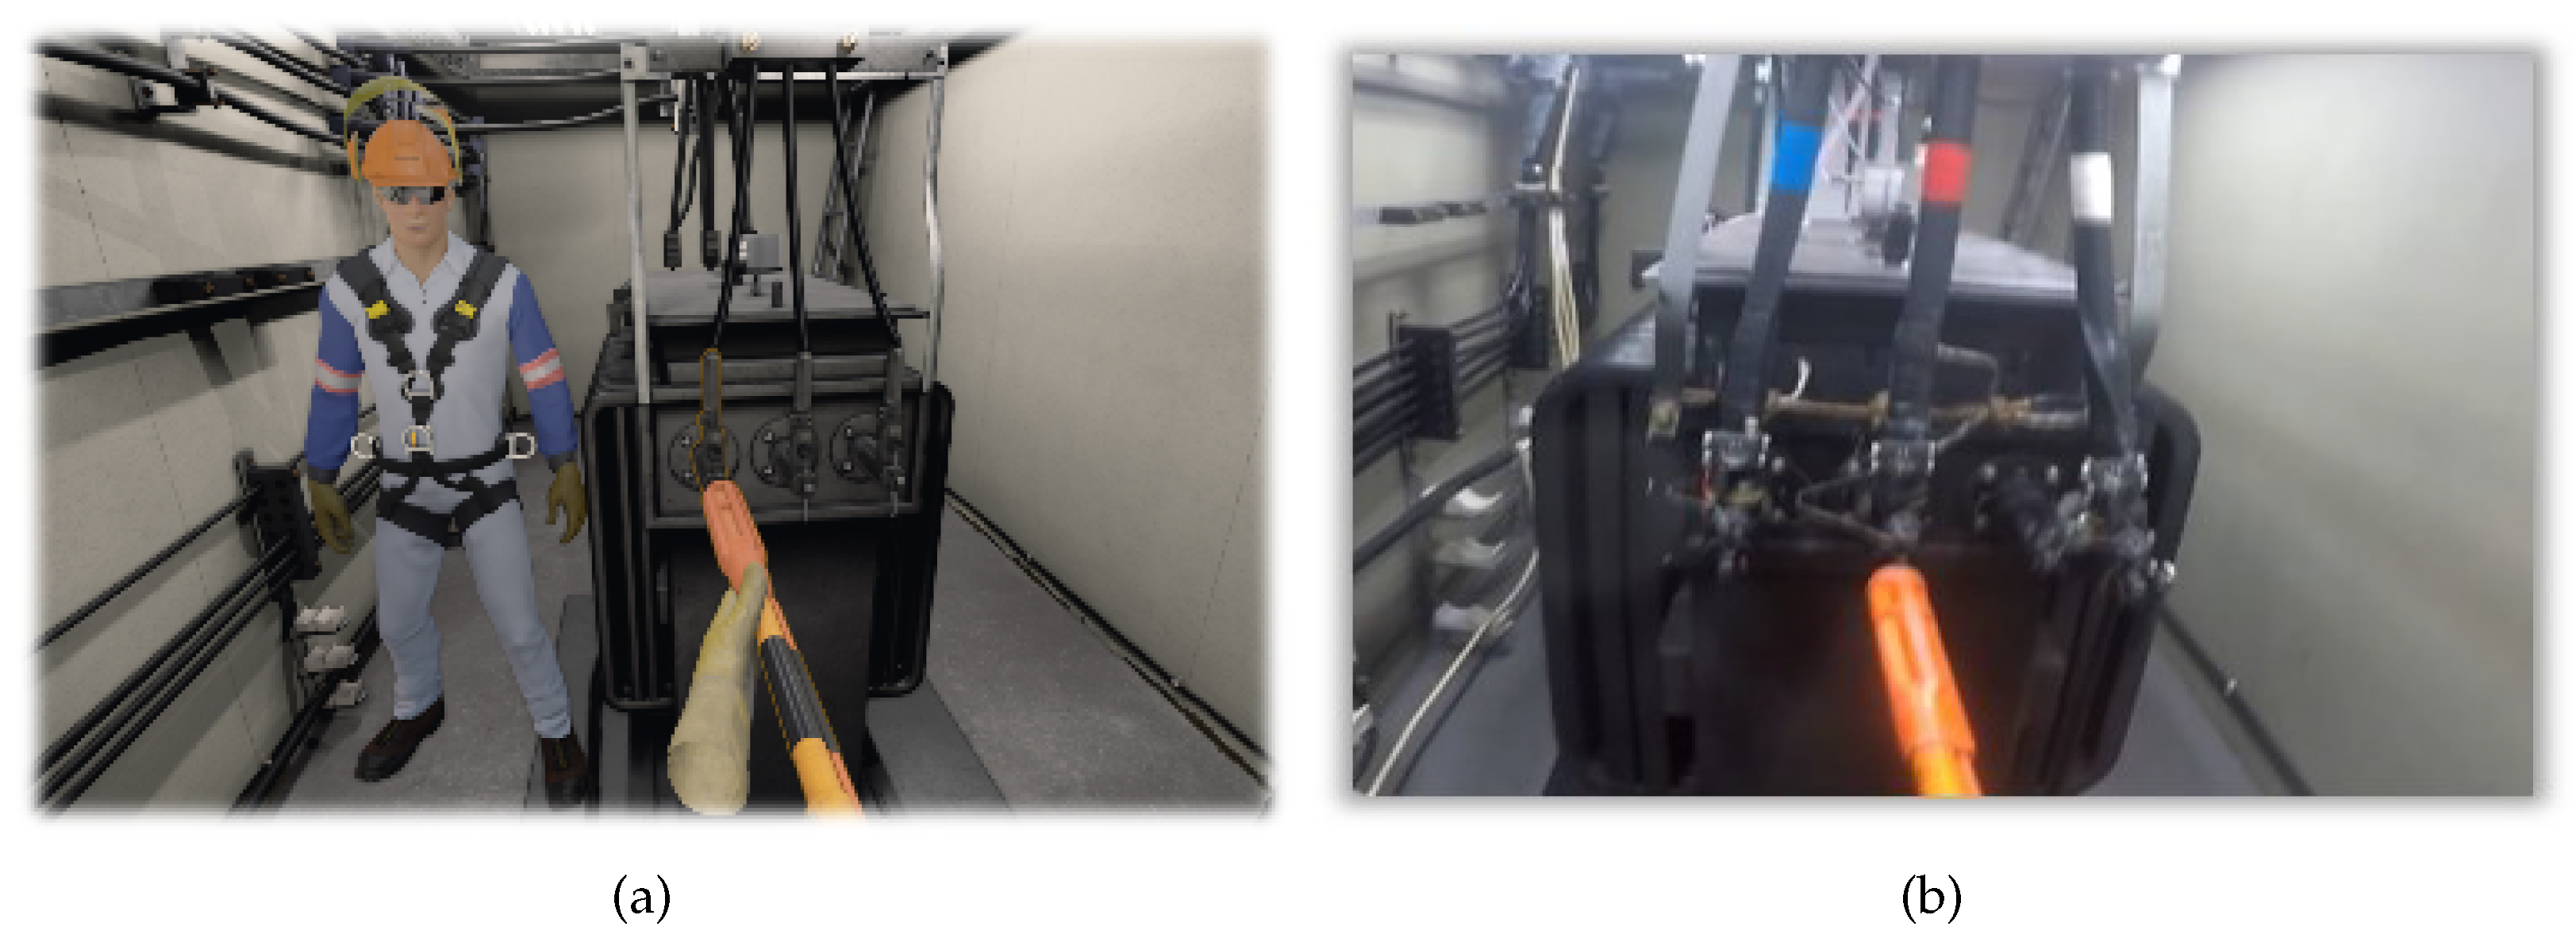
Off-field workforce activities utilize NDT© data for aspects as training, or administrative visualization or demonstration. For training, VR is applied, aiming to recreate the on-field situation in a virtual environment, where risks and adversities can be simulated in a controlled environment. The image presented in
Figure 17 shows a virtual training developed in the UF project. The image in
Figure 17a illustrates a specific step of the virtual training, while
Figure 17b shows the same step in real activity. That scenario represents a confined space, where the employee needs to interact with an energized transformer. Simulating this risky activity, the workforce can have interactive training with real-time feedback, simulating adversities and random cases, without risking its safety.
The use of the NDT© data are not restricted to few applications. As the digitalization of the sector is increasing, these data can serve for more purposes. However, considering the digital and thermal images for asset management, the use of AR and VR to enhance workforce activities are the most relevant value nowadays.
4.3. Operational and Financial Aspects
Operational aspects in power electrical utilities can be measured by the reduction of workforce time activities, as well as SAIDI and SAIFI indicators. Considering the productive impact, the initial analysis from the UF project foresees a time reduction according to
Table 1, regarding the anomaly detection on public illumination (PI) and mutual use (MU) of the power grid. These impacts are estimated from the NDT© foundation layer as 3D modeling implementation.
The information presented in
Table 1 is based on a 3000 km of grid inspection per year, where the NDT© will provide the possibility to scan 21,000 km in the same period. The percentages evaluated are related to two company activities: PI and MU.
The impact is calculated by obtaining the real monthly hours spent in each activity estimating the time reduction by introducing the technology. The results take to the impact percentage, as shown in Equation (
1).
It was found in the benefit analysis that 25% of the anomalies identification is performed by thermal visualization. In addition, the vegetation is responsible for 50% of the workforce anomaly inspection. Thus, the use of NDT© for anomaly detection has the benefit of acting directly on these indicators. Considering the analysis of the energy supplier quality, the grid 3D modeling has the estimative to reduce 0.9% of SAIDI and 0.47% of SAIFI.
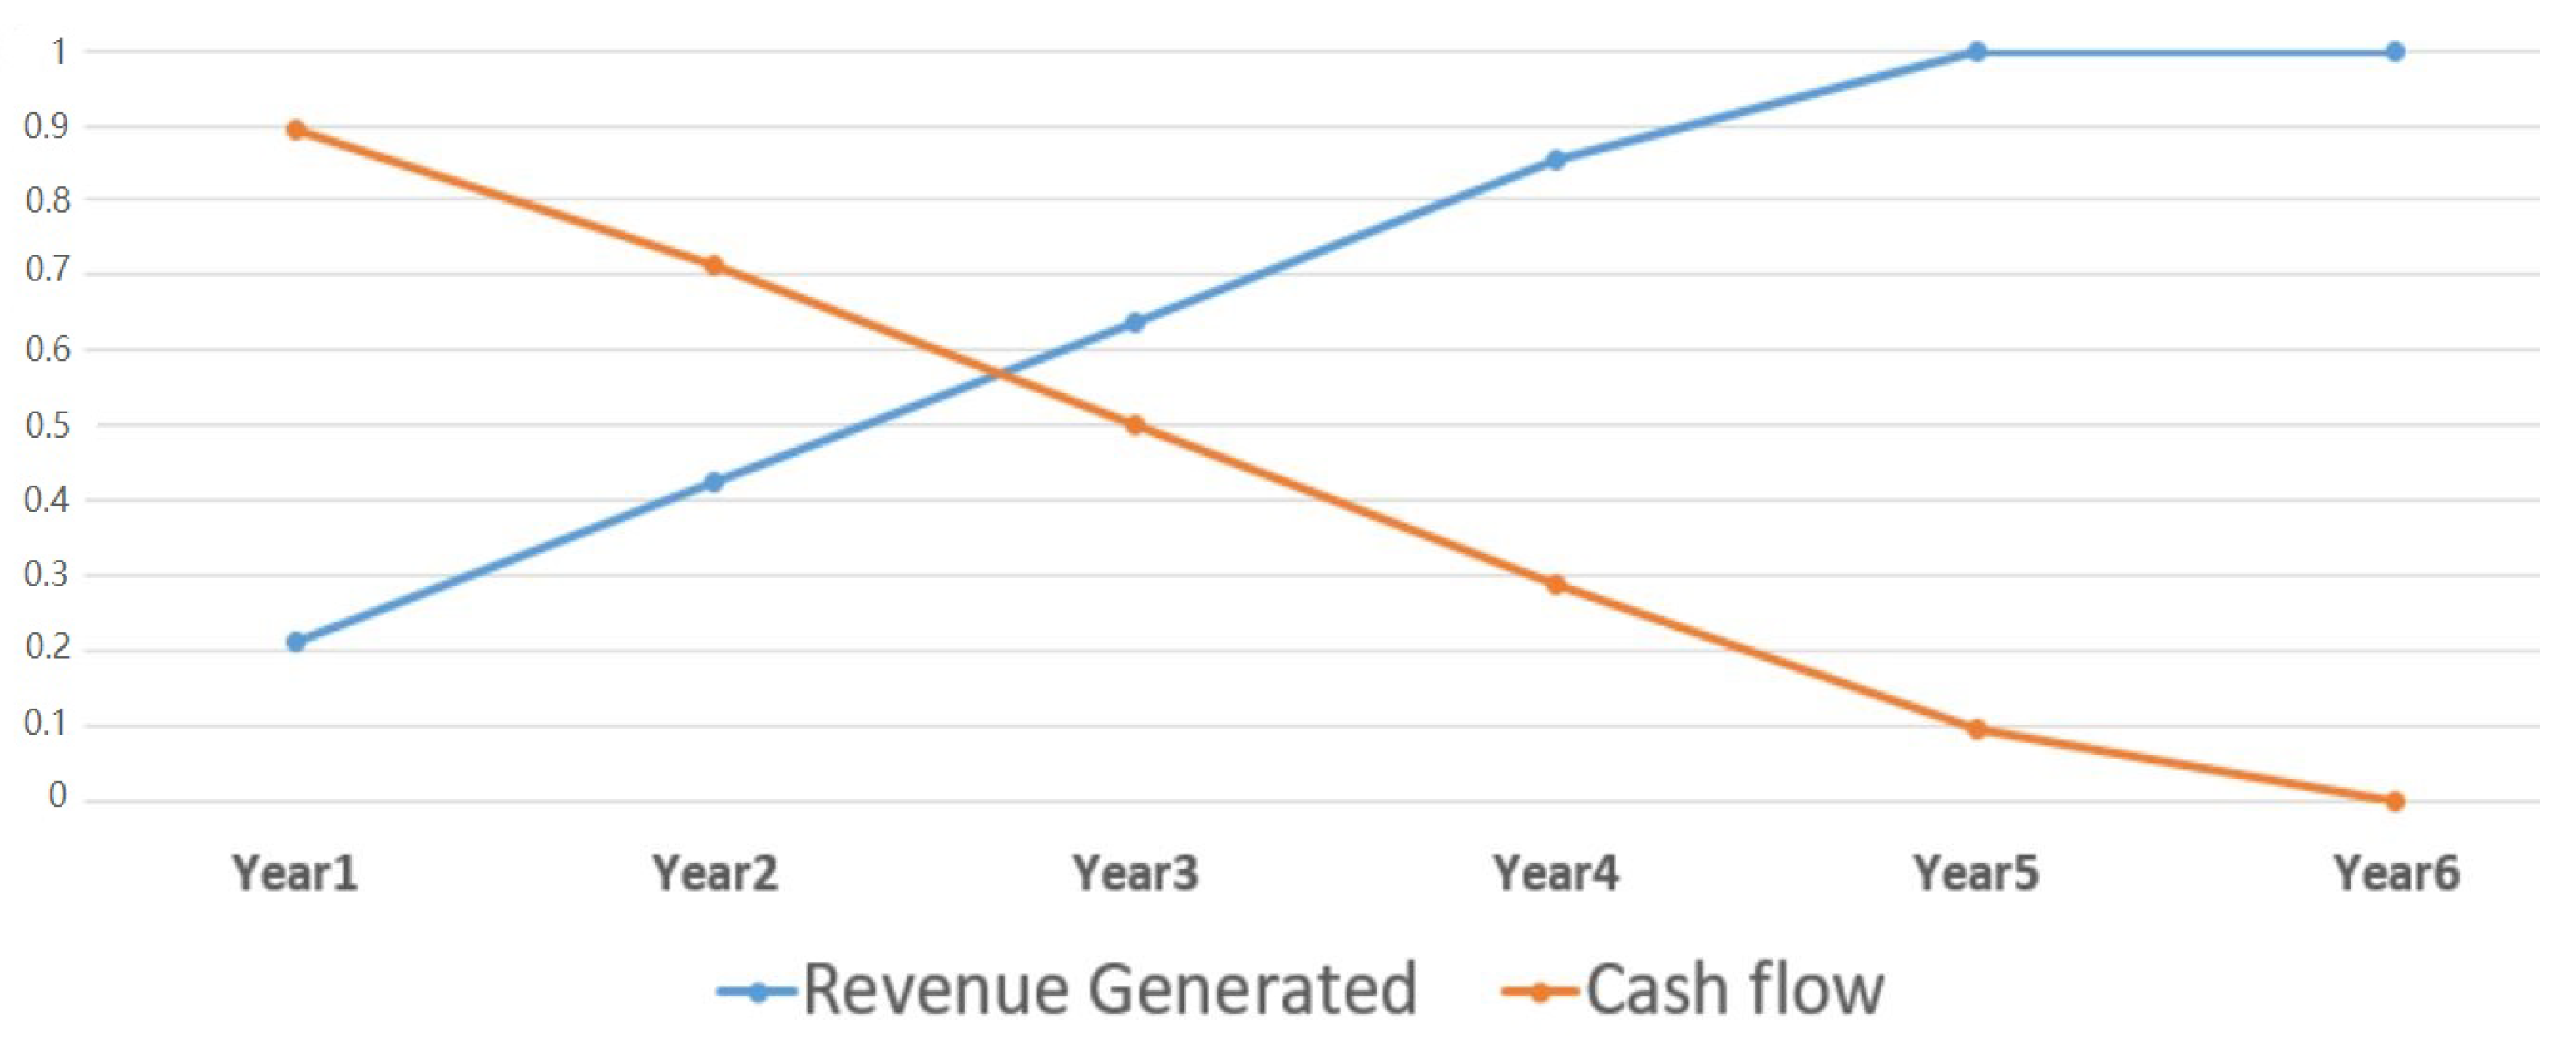
For the same activities, where a cost–benefit analysis (CBA) is evaluated, the results point out six years to reduce the cash flow to zero. Furthermore, the analysis identified that the spending will match the financial return in the fifth year. For illustration, the graph presented in
Figure 18 shows the revenue generated and the cash flow. The information data presented in the graph consider the financial values normalized by the expected return.
The general cost reduction considering the PI and the MU activities is summed up in
Table 2.
Regarding handheld tools, an individual CBA was performed. The results showed a return of investment (RoI) in an average time of 2.5 years. Furthermore, the internal rate of return (IRR) was accounted for 74%.
The application of thermal gadgets on smartphones shows distinct results depending on the occurrence. Two real cases were evaluated: one of them brought 89% of SAIDI and 40% SAIFI impact; the second presented 0.6% of SAIDI and 13% of SAIFI impact. That difference is related to the impact of the avoided outage because of the early problem detection through the thermal image. Nevertheless, the numbers show the great benefits for the utility and the grid consumer.
The benefits of using the drone can be seen from an operational perspective. Considering that its use is related to underground inspection vaults, the drone has the potential to reduce 33% of the man-hour in this type of activity. It occurs because, normally, the safety regulations force at least three people for underground operation if someone has to enter the vault; if not, only two people are needed. Furthermore, to guarantee the safety criteria, many initial steps are mandatory. With the drone, such steps can be eliminated and at least 30 min for each operation are saved. If the vault needs to be drawn out, more than 30 min are saved in the operation with drones. Lastly, since there is no need for an employee to enter into a vault, no personal protective equipment (PPE) will be worn out, and the employee will not get into a risky situation.
With the use of AR, the IRR for remote assistance was rated at 25%. This value accounted for five years of CBA and considered only one company area. In addition, the analysis considered 5% of time reduction with this assistance as conservative analysis. For an AR kit overlay application, the financial return starts with 15% of time reduction.
Analyzing the VR scenarios developed for training, it found an IRR of 57%. The return starts to be positive after the second year of a five-year evaluation. This analysis was evaluated only for one scenario; however, after the first development and the VR kit purchase, the cost spent on the project is minimized.
All the financial and operational results obtained and presented are cases based on Brazilian scenarios. The considerations made relate to information gathered during the initial development of the UF project, and its main contribution is the demonstration of what an NDT© can provide for the power electrical sector. With these data reported, one can scale for more complex cases. Nevertheless, those results do not limit the NDT© benefits and each new application can bring different results.


 and
and 


