Article

Synthesis and Characterization of Gadolinium-Doped Zirconia as a Potential Electrolyte for Solid Oxide Fuel Cells

1
Department of Physics, Mersin University, Mersin 33343, Turkey
2
Department of Chemical and Process Engineering, University of Surrey, Guildford GU2 7XH, UK
3
Department of Nanotechnology and Advanced Materials, Mersin University, Mersin 33343, Turkey
*
Author to whom correspondence should be addressed.
Energies 2022, 15(8), 2826; https://doi.org/10.3390/en15082826
Submission received: 13 March 2022 / Revised: 9 April 2022 / Accepted: 11 April 2022 / Published: 13 April 2022

Abstract

:
Zirconia-based composites with high thermochemical stability and electrochemical activity are the most promising solid electrolytes for manufacturing solid oxide fuel cells (SOFCs). In the present work, nanocrystalline composite powders of gadolinium-doped zirconia (GDZ: Gd2xZr2(1−x)O4−x) with various doping fractions (0.01 ≤ x ≤ 0.16) were synthesized by the Pechini method and applied for the fabrication of several electrolyte pellets to evaluate their physicochemical properties, sinterability, and conductivity. The X-ray diffraction (XRD) patterns and the thermogravimetry/differential thermal analysis (TGA/DTA) of the synthesized powders confirmed the successful formation of nanocrystalline GDZ in the tetragonal phase with complete substitution of gadolinium phase into the zirconia (ZrO2) lattice. The synthesized gadolinium zirconate powders were then shaped into pellet forms using the tape casting method, followed by sintering at 1300 °C (for 2.5 h). The microstructural analysis of the electrolyte pellets showed suitable grain boundary welding at the surface with an acceptable grain growth at the bulk of the T-phase GDZ samples. The impedance measurements indicated that the T-phase GDZ-8 could provide a comparably higher ionic conductivity (with 7.23 × 10⁻² S/cm in the air at 800 °C) than the other dopant fractions. The results of this work can help better understand the characteristics and electrochemical performance of the T-phase gadolinium zirconate as a potential electrolyte for the fabrication of SOFCs.

1. Introduction

Solid oxide fuel cell (SOFC) is one of the most promising electrochemical devices for clean power generation due to its efficient operation, fuel flexibility (ranging from hydrogen to hydrocarbons and biogas), and relatively lower greenhouse gas emissions [1,2]. A SOFC single cell is comprised of three essential individual layers, including an anode, an electrolyte in the middle, and a cathode. As the heart of SOFC, the electrolyte layer should be highly dense to avoid direct contact between the fuel and oxidant, providing high ionic conductivity at the cell operating temperatures. While studies continue to increase SOFC performance and make its operation long-lasting, studies are also carried out to investigate the degradation mechanism of SOFC systems. The current research on SOFCs mainly focuses on finding more durable and cost-effective materials that can provide better electrochemical performance. The commercialization of SOFCs inevitably depends on developing new electrolyte materials offering higher thermochemical stability, mechanical strength, and electrochemical activity [3]. The SOFC stacks must provide a high energy density, show continuous and high performance, not be discharged over time, and have low volume and weight [4]. Gd as a dopant has considerable interest in fields such as electrocatalysis and has been evaluated for its structural stability [5,6]. It has been reported that there has not been a comprehensive study on the doping of gadolinium cation to ZrO2 nanoparticles [7]. Gadolinium oxide (Gd2O3) is one of the most common transition metal oxides used in the structure of solid semiconductors either as the dopant or hosting matrix due to its excellent properties, such as high thermochemical stability and low phonon energy (~600 cm−1) [8]. It is also applied for stabilizing the zirconia-based solid electrolyte due to offering an excellent oxide ion conductivity to the resulting composite (Gd2Zr2O7) [9]. The presence of the Gd3+ cations could help the ZrO2 grains transform into more regular spherical structures and create more oxygen vacancies, resulting in a higher ionic conductivity in the solid electrolyte [7]. Gd3+ also can enhance the electronic conductivity of the resulting solid electrolyte, which is ideal for supercapacitor applications and energy storage systems [10]. The use of a Gd2O3-based dielectric film is quite common in the fabrication of photonic and electronic devices with low current densities leakage [11].
Zirconia-based electroceramics are the most promising electrolyte material for the fabrication of SOFCs. Zirconia (ZrO2) has also been intensely explored for a wide range of other engineering applications such as catalysis, oxygen sensors, electronic devices, etc. [12]. The zirconia-based ceramic composites exhibit high ionic conductivity and sintering properties at elevated temperatures, making them a suitable candidate for the electrolyte fabrication of solid oxide fuel cells [12]. As a polycrystalline solid system, zirconia can adapt three major lattice structures, including monoclinic, tetragonal, and cubic depending on the processing temperature. Zirconia has a stable monoclinic (M-) phase at lower temperatures which is gradually transformed into a metastable tetragonal (T-) phase up to 2370 °C, followed by forming a stable cubic (C-) phase above 2670 °C [13]. The monoclinic lattice structure of zirconia is unsuitable for fabricating SOFC as it does not provide enough ionic conductivity. However, when zirconia is doped with various transition metals cations (especially lanthanide cations), the resulting composite can offer excellent thermochemical stability and ionic conductivity. Such a doping process can also create a stabilized crystalline structure (cubic, fluorite, pyrochlore, apatite, etc.) for the resulting ceramic composite, which is desirable for long-term SOFC operation.
Currently, the best-known material for fabricating SOFC electrolyte is the cubic zirconia doped with 8 mol% Yttria (Y2O3), so-called yttria-stabilized zirconia (YSZ-8). However, this electrolyte material can only achieve a high level of ionic conductivity when the cell operating temperature reaches about 1000 °C. Such a high operating temperature can potentially damage the cell through a gradual thermochemical degradation of the materials and eventually reduce the cell’s mechanical and thermal instability [14]. Therefore, developing new electrolyte materials with better thermochemical stability and improved electrochemical performance is essential. Doping zirconia with various cations such as Ca2+, Mg2+, Sc3+, Y3+, and some other rare earth metal cations such as Yb3+, Gd3+, Nd3+, and Sm3+ result in the formation of stabilized zirconia with fcc cubic structure that offers excellent ionic conductivity, particularly above 1000 °C [15]. Introducing certain amounts of the tetragonal gadolinia (Gd2O3) into the zirconia structure can create a stable gadolinium zirconate with various cubic, tetragonal, and monoclinic phases offering high ionic conductivity and thermal stability [16,17]. Gadolinium-doped zirconia (GDZ: Gd2xZr2(1−x)O4-x) can also be used as a promising alternative top coating material to improve the conductivity and thermochemical stability of YSZ [18,19].
Various methods have been reported for preparing nanostructured GDZ, including the co-precipitation method [20], solid-state reaction [21], ball milling [22], and combustion method [23]. The Pechini method has not been used in Gadolinium Zirconate synthesis yet. As a modified version of the Sol-gel technique, the Pechini method is based on the fact that solid particles suspended in the liquid phase form different phases when water or alcohol-based solvents are used [24]. This method can reduce the number of steps involved in the traditional sol-gel route with a more efficient thermal treatment process, which is more cost-effective. The method is capable of synthesizing various electroceramics with high purity, high homogeneity, and easy control over the processing variables [25,26]. One of the advantages of the Pechini method is the possibility of adding solvents with high boiling temperatures like ethylene glycol to the metal citrate complexes, which helps form more homogeneous powders with fewer agglomerates [25].
This paper has investigated the synthesis and application of nanocrystalline composite powders of gadolinium-doped zirconia (Gd2xZr2(1−x)O4−x) with various doping percentages (1–16 mol%) using the Pechini route. The physicochemical properties of the produced GDZ pellets for use as a solid electrolyte in SOFCs were systematically evaluated through XRD, TGA, and SEM analysis. Also, a series of impedance measurements were performed to evaluate the electrolyte pellets’ ionic conductivity and identify them. The result of this study could help to understand better the impact of doping fraction on the structural and physical properties of the GDZ materials.

2. Materials and Methods

2.1. Materials

ZrCl4 (99.99% pure, Alfa Aesar, Haverhill, MA, USA) and Gd(NO3)3∙6H2O (99.9% pure, Alfa Aesar, Haverhill, MA, USA) were used as starting materials. Citric acid (CA, 99.99%, Alfa Aesar, Haverhill, MA, USA) and Ethylene glycol (EG, 99.99%, Alfa Aesar, Haverhill, MA, USA) were used in the Pechini route. Toluene (99.99%, Alfa Aesar, Haverhill, MA, USA) and ethanol (91.6%, denatured, Alfa Aesar, Haverhill, MA, USA) as solvents, Butvar B-76 (95–99%, Sigma-Aldrich, St. Louis, MI, USA) and ethyl cellulose (48%, Sigma-Aldrich, St. Louis, MI, USA) as a binder, α-terpineol (90%, Sigma-Aldrich, St. Louis, MI, USA) as a dispersant and polyethylene glycol (99%, Sigma-Aldrich, St. Louis, MI, USA) as a plasticizer was used in the tape casting process. Ag wire (0.25 mm diameter, 99.95% purity, Johnson Matthey, London, UK) and Ag folio (0.025 mm thickness, 99.9% purity, Johnson Matthey, London, UK) were used for impedance measurements as wire and current collectors.

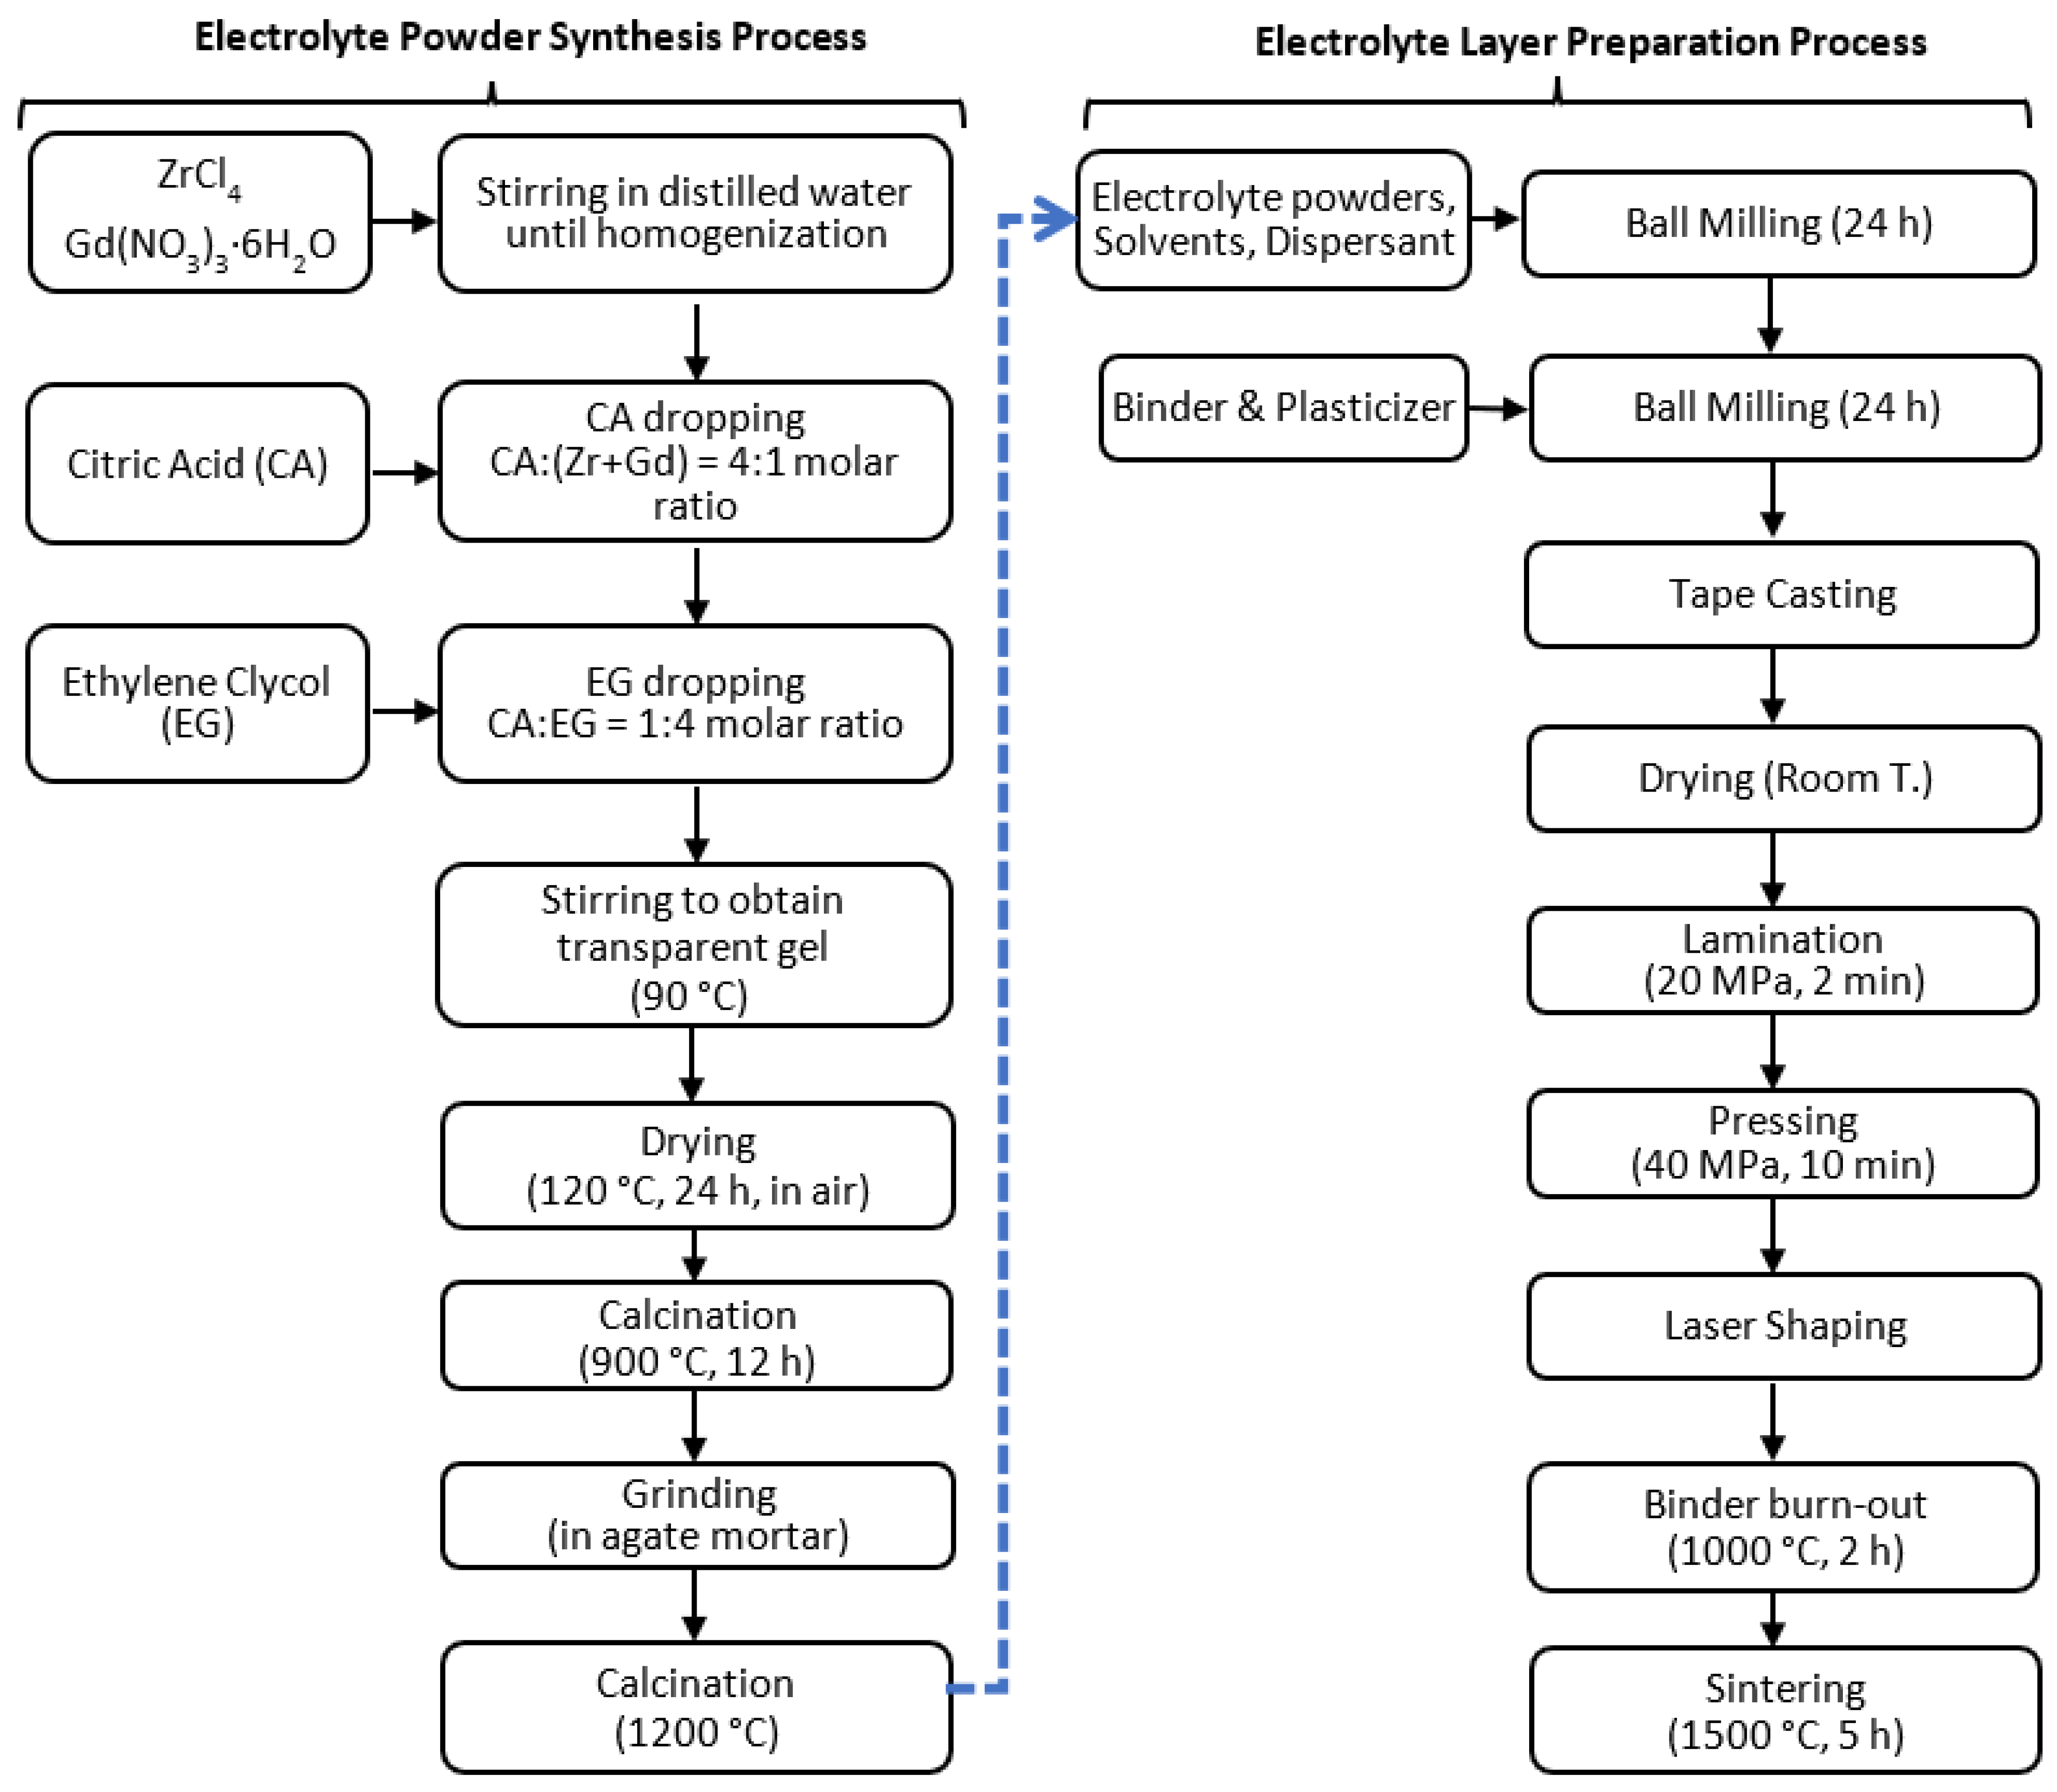
2.2. Electrolyte Powder Synthesis

Gd2xZr2(1−x)O4−x solid composites were studied with different stoichiometric ratios between 1 ≤ x (mol%) ≤ 16. The Pechni method was used to synthesize all the electrolyte powders in this work. For this, the stoichiometric amounts of ZrCl4 and Gd(NO3)3∙6H2O were dissolved in distilled water by stirring, followed by adding the CA solution at a CA:(Zr + Gd) = 4:1 ratio. EG was dripped into the resulting solution with a molar ratio of CA:EG = 1:4. The resulting colourless solution was then heated on a hot plate at 90 °C up until a viscous, transparent gel was formed. The resulting gel was then dried in a convective oven at 120 °C for 24 h followed by calcination in a muffle furnace at 900 °C for 12 h. The resulting metal oxide precursor was then crushed in a pestle and mortar and further calcined at 1200 °C. The electrolyte powders synthesis process is seen in Figure 1.

2.3. Fabrication of the Electrolyte Pellets

The fabrication steps applied for manufacturing the electrolyte pellets have been illustrated in Figure 1. The powders were shaped into several disks using the tape casting method in order to study their microstructure properties and electrical conductivity after sintering. The ceramic slurry used for the tape casting process was prepared by mixing given amounts of the T-phase Gd2xZr2(1−x)O4−x (4 ≤ x (mol%) ≤ 10) powders, solvents, binder, dispersant, and plasticizer additives summarised in Table 1. The electrolyte powder, solvents, and dispersant mixtures were mixed initially using a magnetic stirrer for one hour, followed by re-grounding and homogenizing in the jar mill (MSE Technology, Turkey) using 10 agate balls (10 mm diameter) for 24 h at 125 rpm. Afterwards, the as-prepared slurry was further homogenized using a magnetic stirrer to form a viscous coating mixture. Next, the given amounts of binder and plasticizer were added to the slurry, followed by mixing again using a ball mill for about 24 h to obtain the final electrolyte slip for tape-casting. The quantities of components used in the slurry and their fractions have been summarised in Table 1.
The prepared slurry was then coated on the Mylar® substrate via a laboratory-scale tape caster (MSE Technology, Turkey) with a blade gap of 190 µm and dried in an open-air environment. The thickness of the dried electrolyte layers was measured as 30–35 µm. Thirteen white tapes were laminated to each other with a two-step pressing process. The first stage of the pressing process is the pre-lamination of the tapes with the uniaxial hydraulic press (MSE Technology, Turkey) under 20 MPa for 2 min. In the second step, the pre-laminated layers were pressed to full lamination with an isostatic press (MSE Technology, Turkey) under 40 MPa pressure for 10 min. The laminated tapes were cut by a laser cutter (MSE Technology, Turkey) to obtain in the form of a disc of 65 mm in diameter. The disc-shaped solid electrolytes were calcined at 1000 °C for 2 h to remove the additives. After sintering at 1500 °C for 5 h with a heating rate of 3 °C/min in a high-temperature furnace, dense electrolytes were obtained. The final geometry of solid electrolytes was 400 µm in thickness and 50 mm outer diameter into pellet shape. These pellets were used for microstructural characterization and impedance measurements to quantify their electrical conductivity.

2.4. Characterizations of Solid Electrolytes

The XRD analysis (Rigaku Smartlab, Woodlands, TX, USA) was performed to study the crystal structure of electrolyte materials. The X-ray diffraction patterns were obtained using 0.02 step width with an angular range of 2θ between 7° and 90° and the scanning rate of 21.6746 °/min at room temperature. The X-ray scattered beams were counted using a 1D silicon strip detector (D/teX Ultra 250). The obtained XRD patterns were analysed, and crystal structures were determined on a PC using PDXL2 software in accordance with the DICVOL06 method to compare with the JCPDL database files [27]. The thermal decomposition steps associated with the GDZ powders were studied by a DTA/TGA analyser (Perkin Elmer Diamond, Shelton, CT) in the temperature range of 30–1200 °C under an inert N2 atmosphere passing over the sample placed in a platinum holder and heated with the rate of 10 °C/min. The microstructural properties of GDZ disc-shaped electrolyte pellets were characterized by SEM (Zeiss Supra55, Oberkochen, Germany) under 10 kV accelerating voltage. The SEM micrographs were obtained from both the cross-sectional area and the side surface of the electrolyte pellets. The particle size and microstructural properties of the single-phase GDZ samples were identified by analysing the SEM micrographs.
The impedance measurements with the two-electrode configuration were used to determine the electrical conductivity of the sintered electrolyte pellets. A potentiostat/galvanostat analyser (Parstat 2273, Princeton Applied Research) integrated with PowerSINE software was used to perform the impedance analysis at 50 mV voltage amplitude over the frequency range of 10−1 and 105 Hz. The electrical conductivity of the fabricated electrolyte pellets was measured at the IT-SOFC operating temperature range (i.e., from 600 °C to 800 °C). The operating temperature of the electrolyte pellets was determined by a thermocouple 5 mm away from the sample during the measurements. Silver (Ag) wire and Ag folio were used for the current collector and attached to both sides of electrolyte pellets. The electrolyte pellets’ ionic conductivity was identified using the resistance and dimensions of the samples. The final geometry of disk-shaped solid electrolytes was 400 µm in thickness and 5 cm outer diameter in thick film form. The active surface area for the current collecting was 1 cm2, and the resistance values were obtained from the real axis of the Nyquist impedance plots. The following equation calculated the ionic conductivities of the GDZ pellets:
σ b = 1 R t S
where σb is the bulk conductivity, t is the thickness, S is the active surface area surrounding the sides of the electrolyte pellet with the silver current collector, and R is the bulk resistance of the pellets. The electrical conductivities were calculated from the intercepts of the semicircle on the real axis obtained by the Nyquist plots.

3. Results

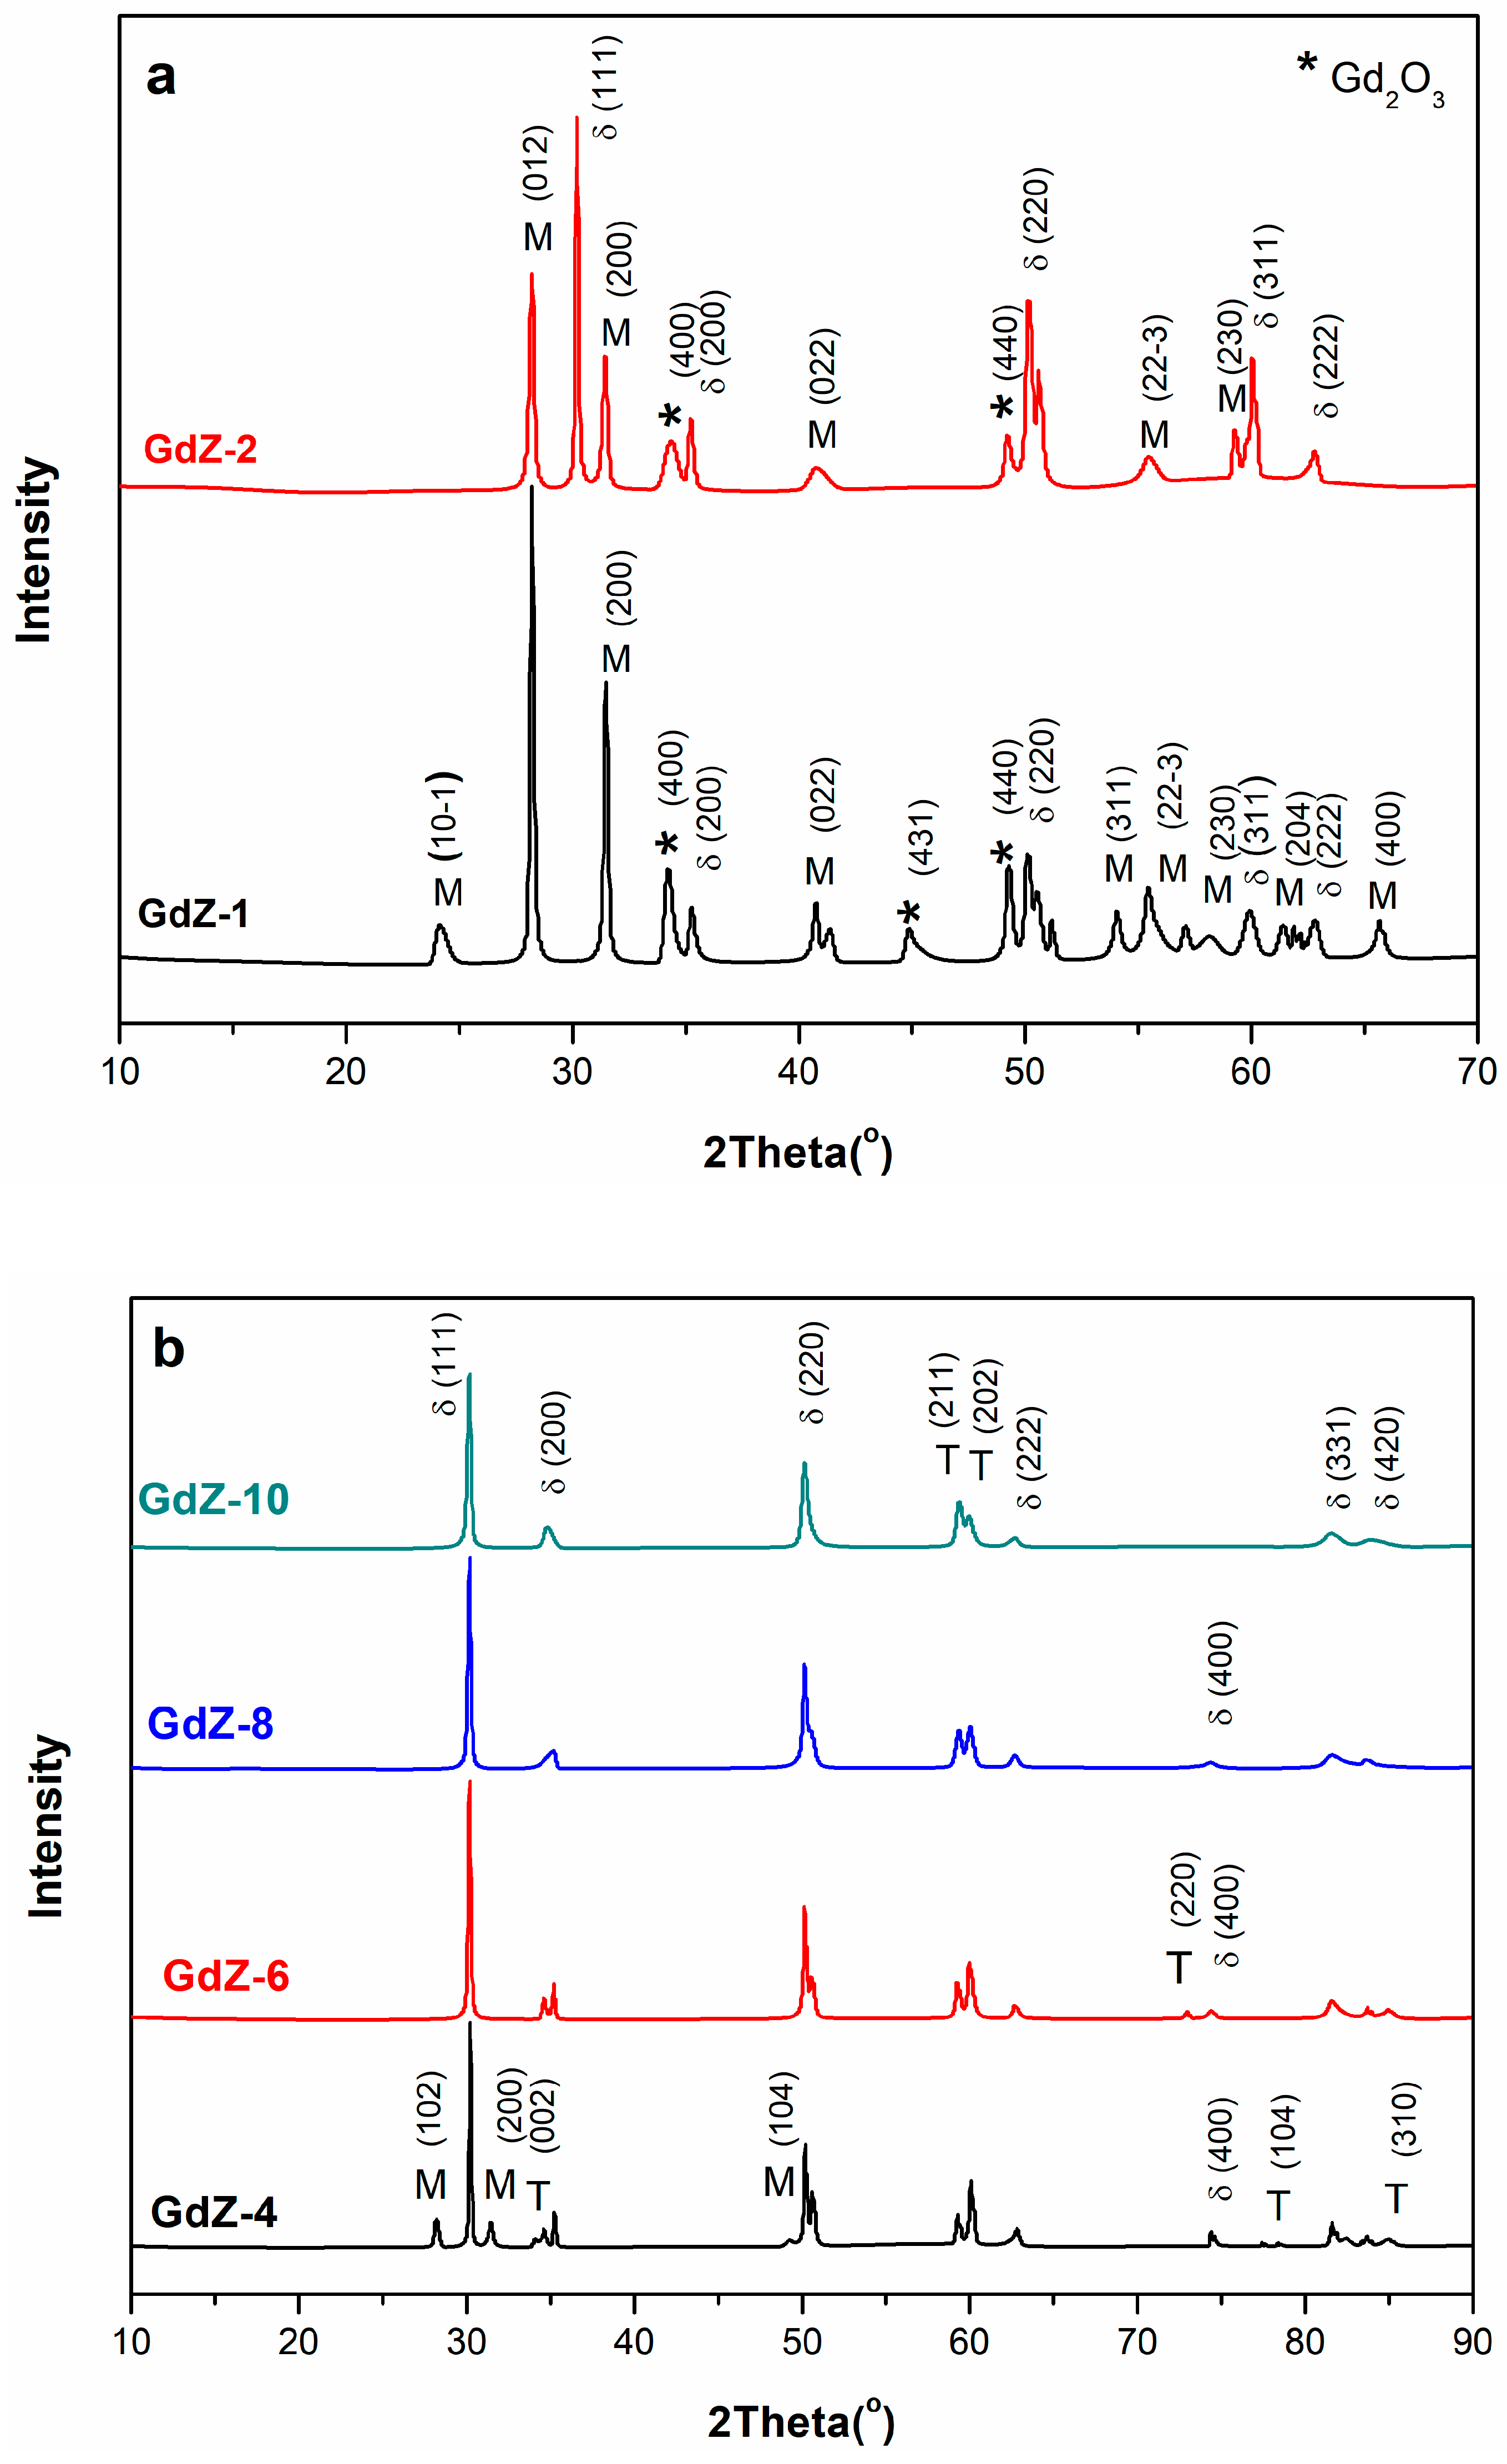
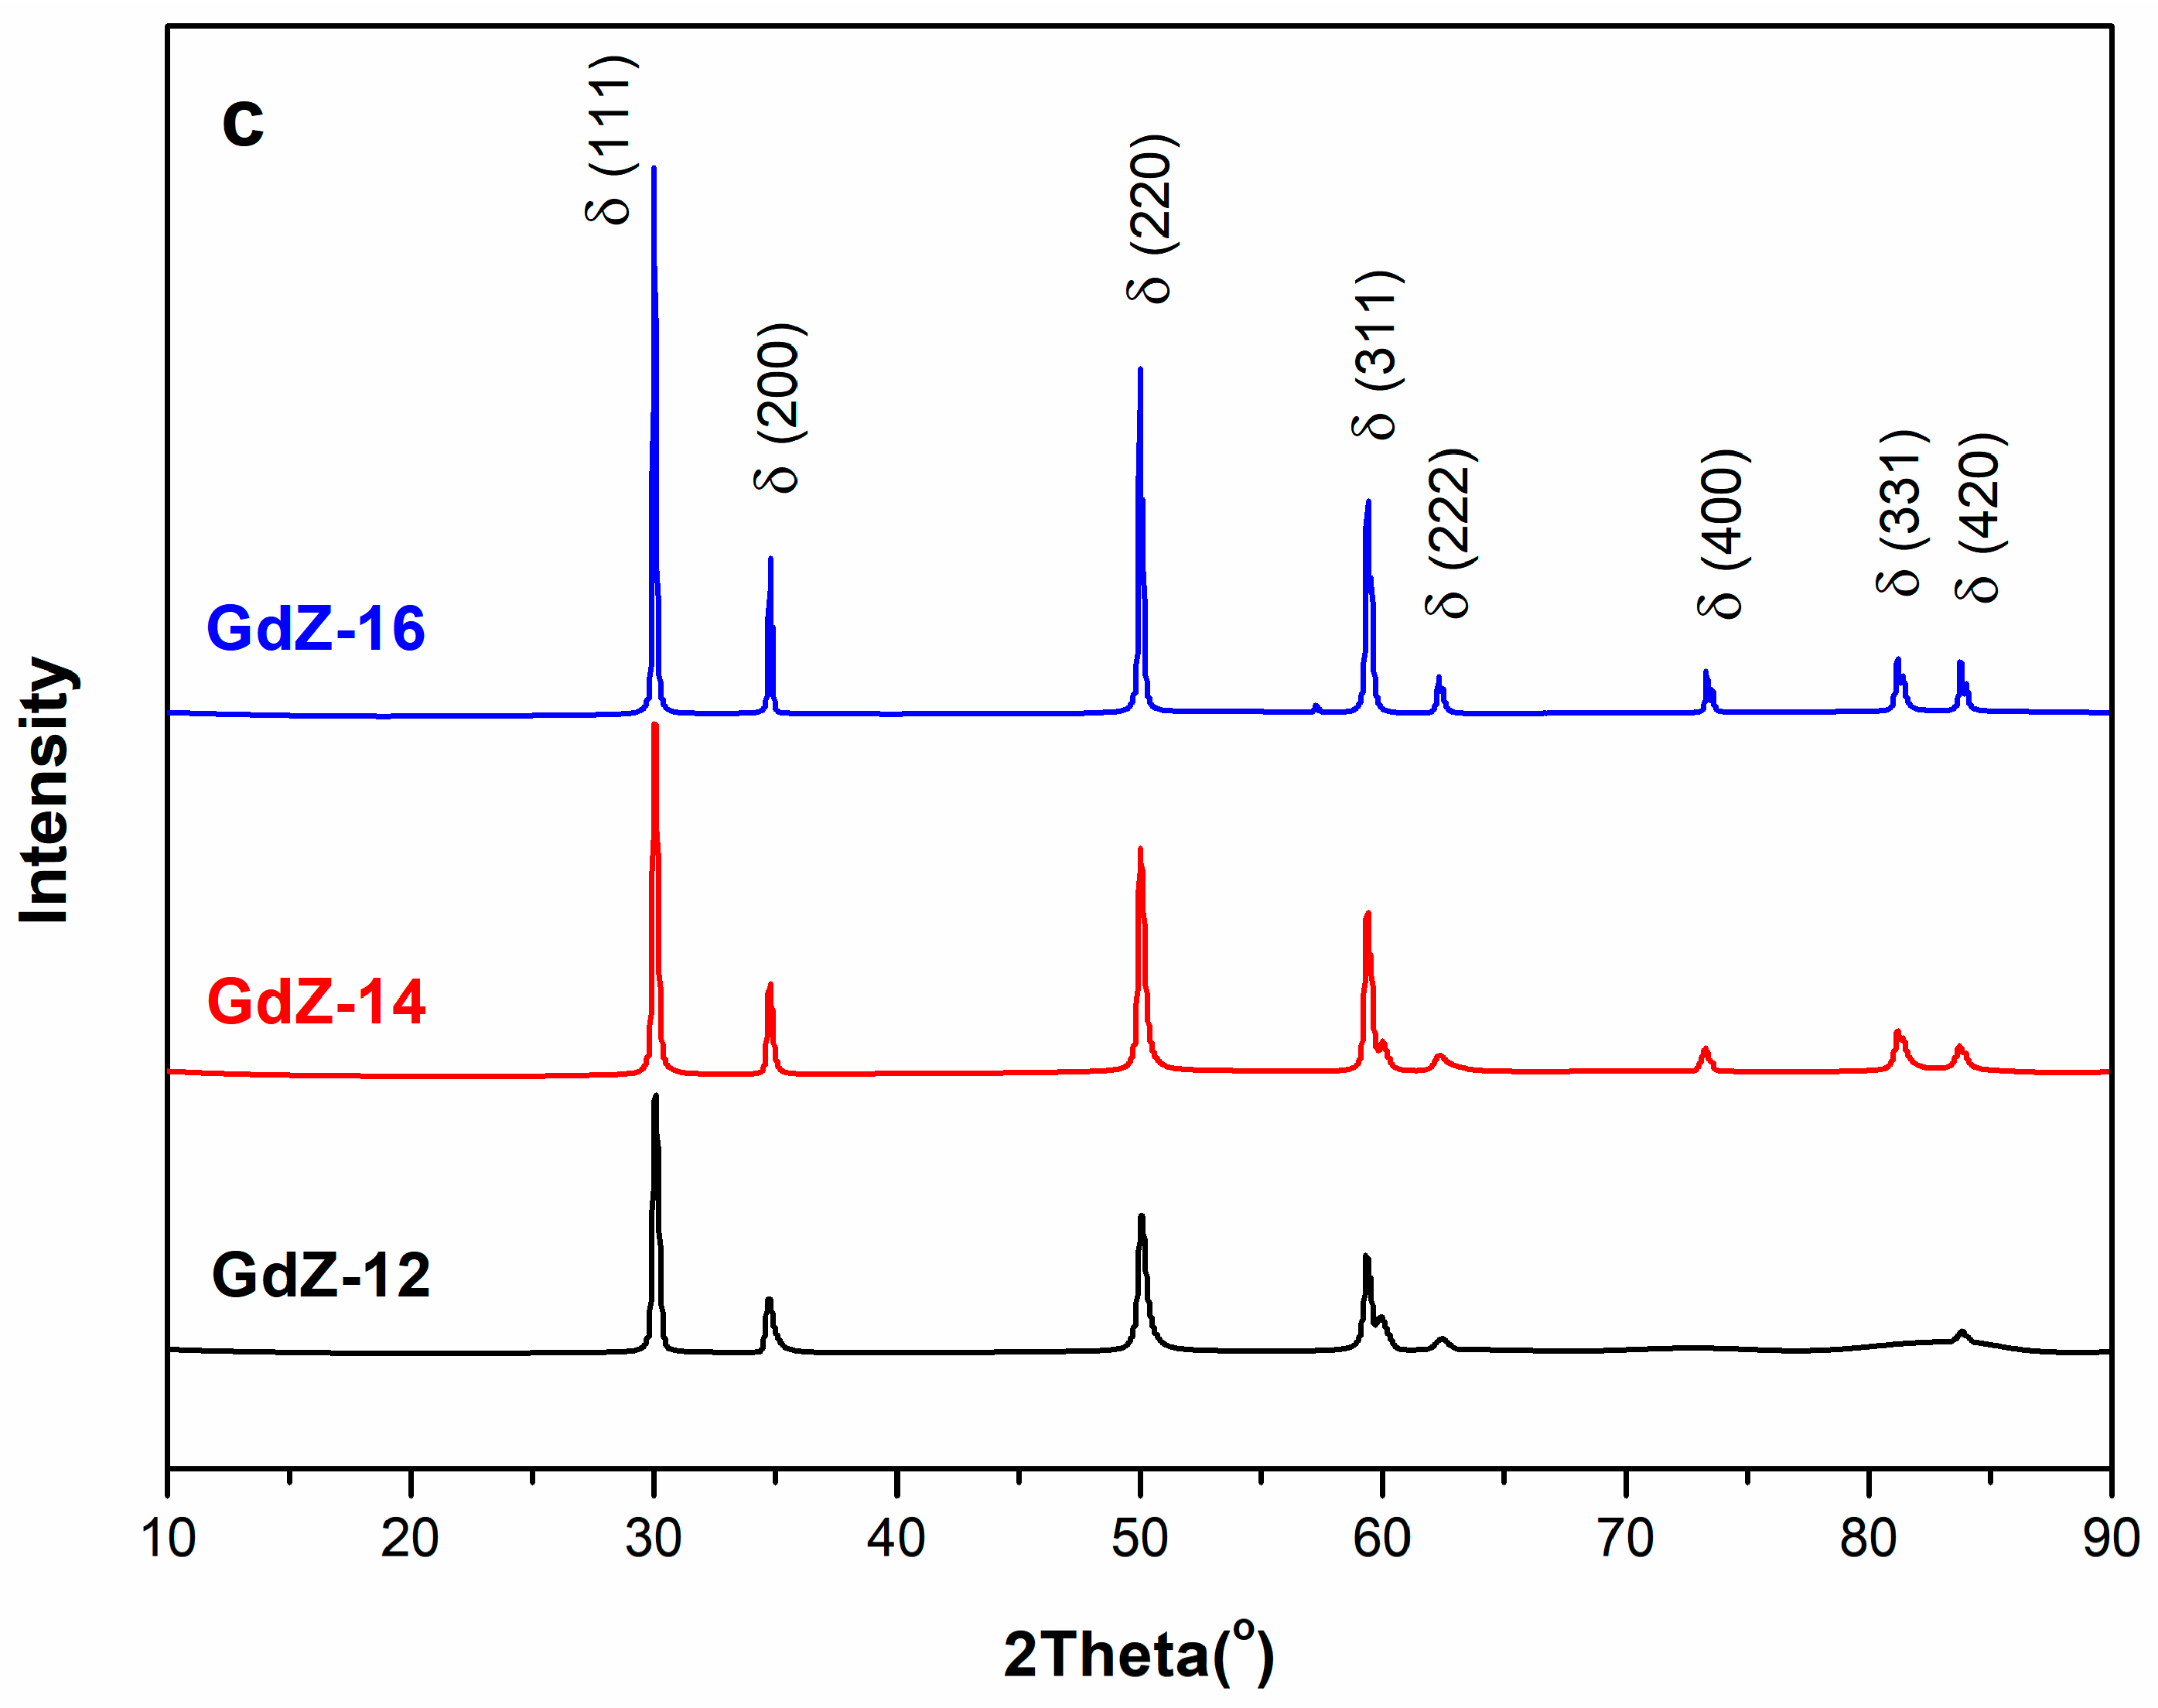
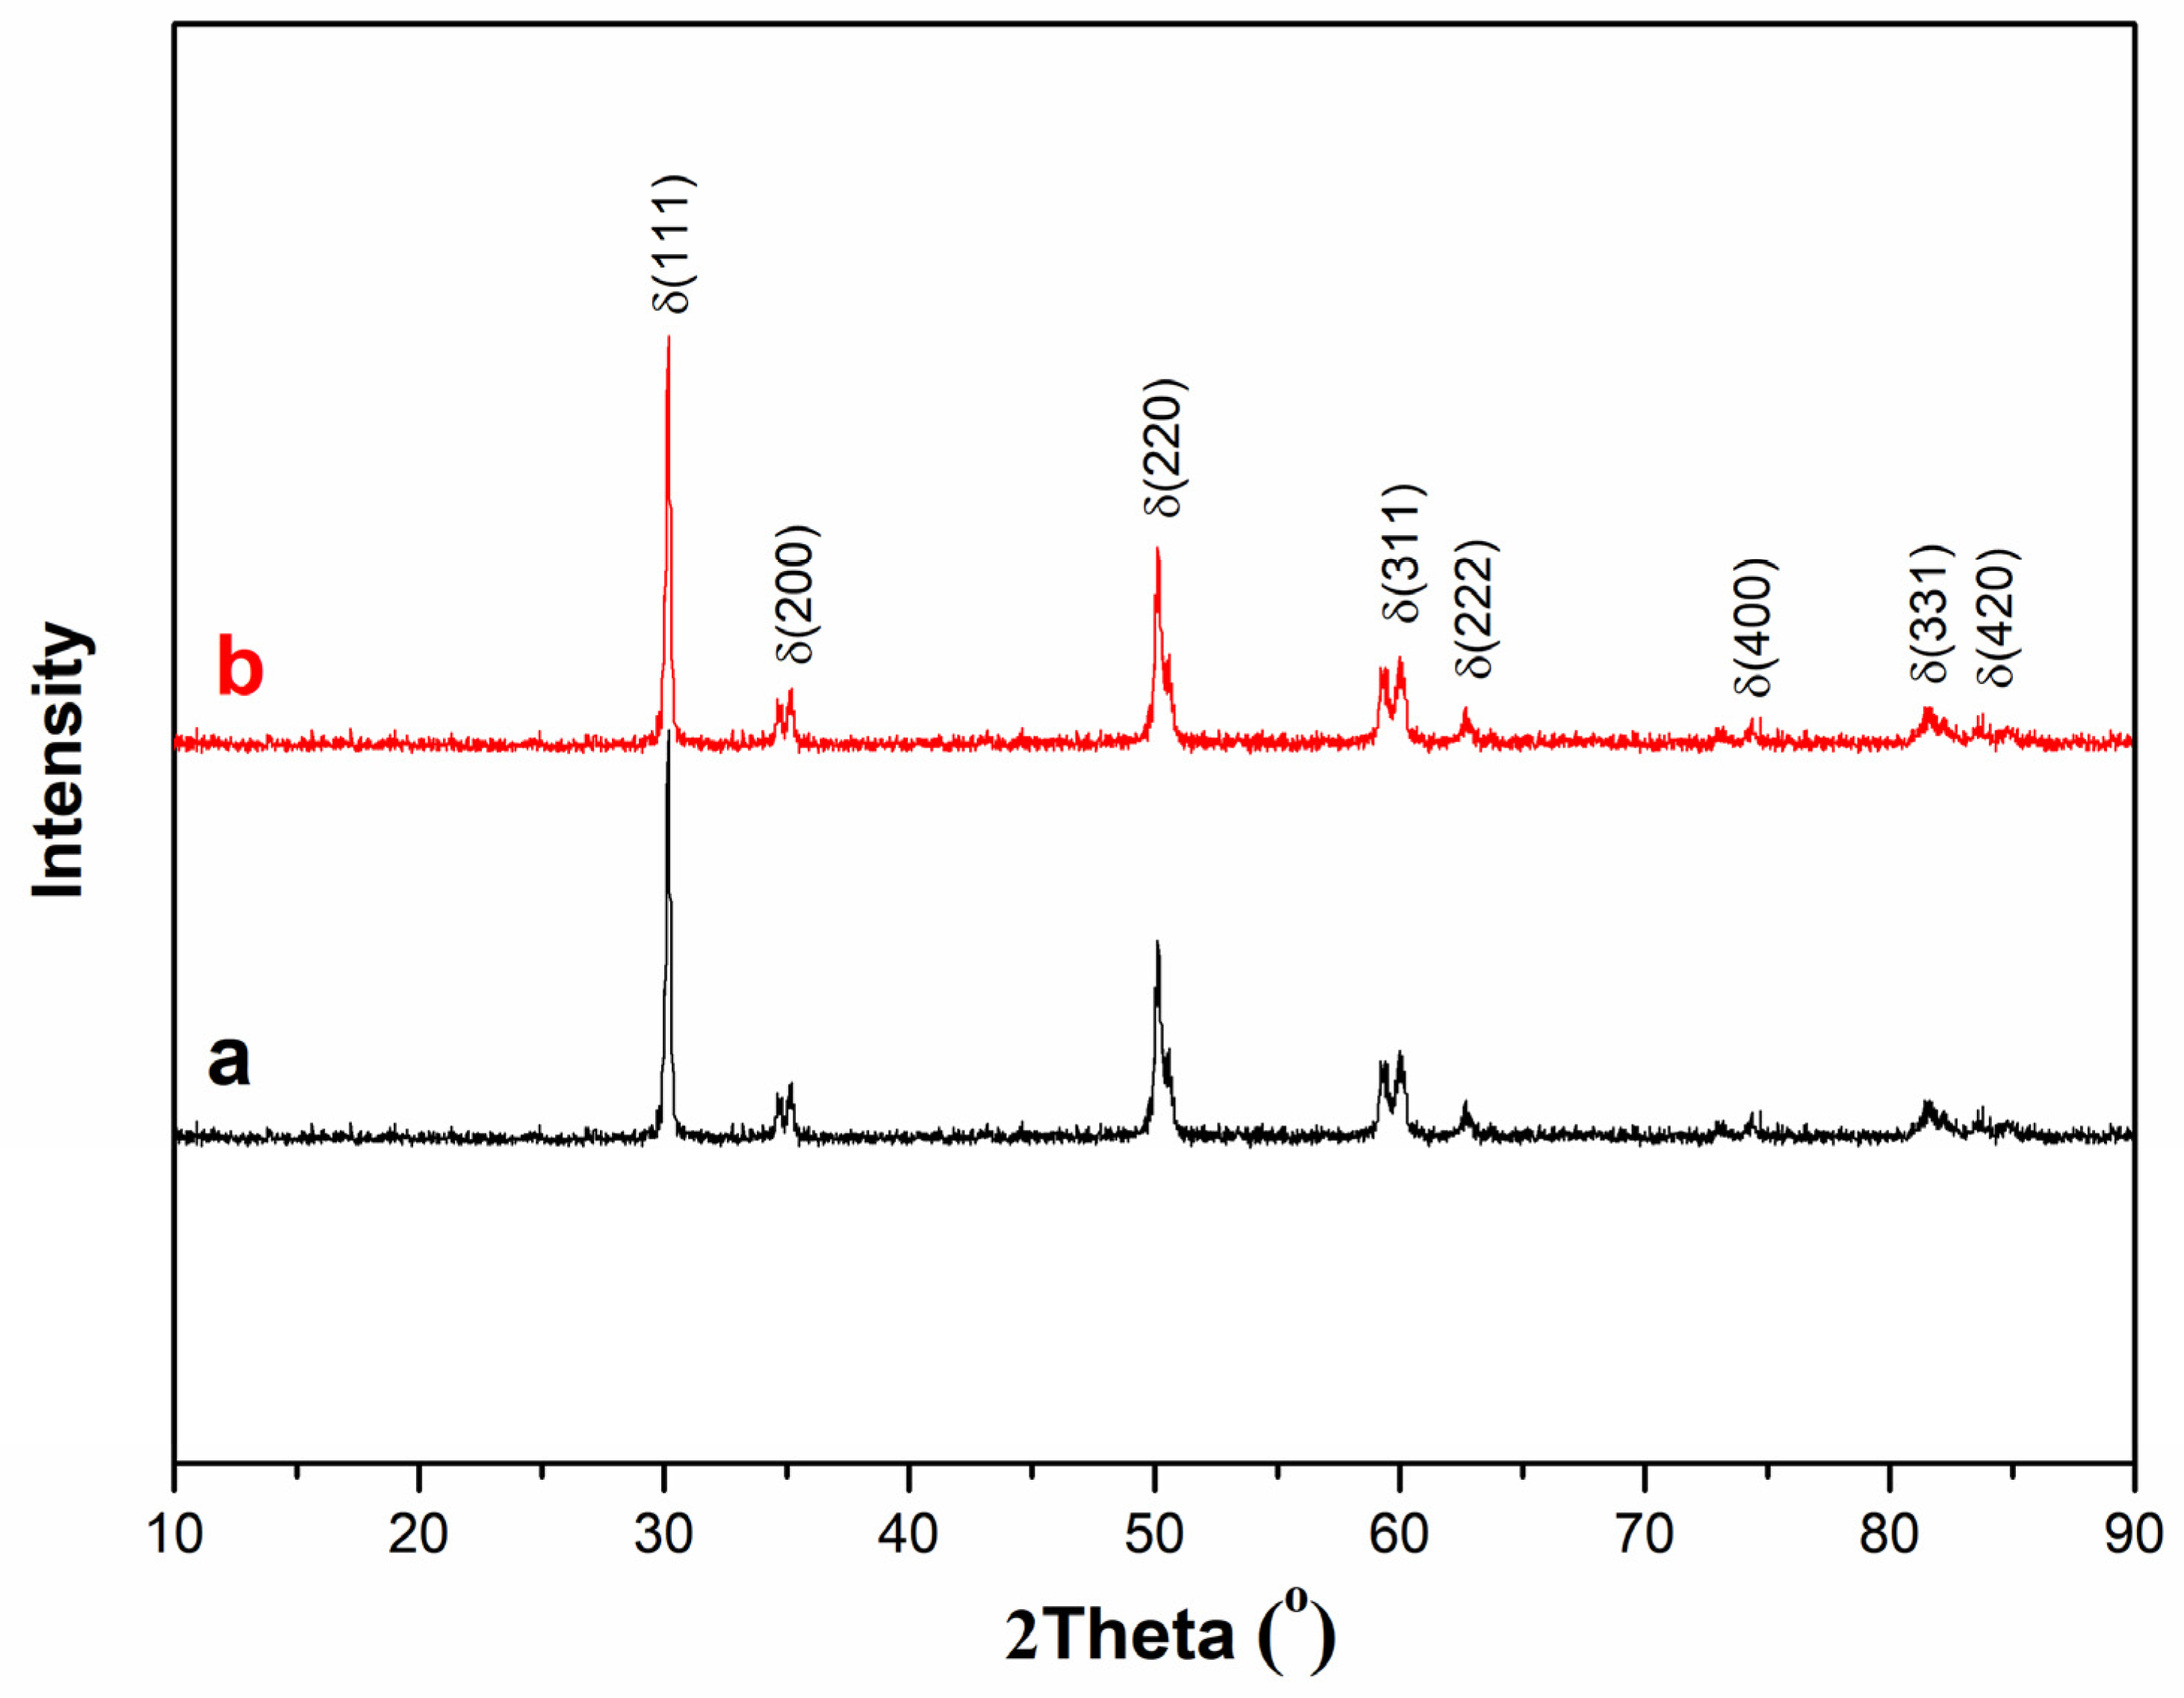
3.1. Crystal Structure Analysis of Powders

Figure 2 shows the XRD profiles of the GDZ powders (doped with 1–16 mol% of gadolinium) in this work. The XRD patterns are compatible with the standard XRD profiles by referring to the standard JCPDS card numbers of (00-049-1642) for C-phase, (01-078-0047) for M-phase, (01-079-1769) for T-phase and (42–1465) for Gd2O3. The crystal structures and lattice parameters obtained from XRD indexing are tabulated in Table 2. The GDZ-1 and GDZ-2 are composed of M-phases. The GDZ-4, GDZ-6, GDZ-8, and GDZ-10 contain only T-phases; the GDZ-12, GDZ-14, and GDZ-16 contain C-phases.
It can be found that the resulting crystalline phase of the synthesized samples is dependent on the gadolinium content used as the dopant. Increasing the Gd3+ cation fraction in the ZrO2 lattice can directly increase the cell parameter in the resulting GDZ composite [28]. The previous studies show that by increasing the lattice parameter a, along with a decrease in the lattice parameter c upon Gd3+ doping, could shift the stabilization of resulting lattice symmetry to be more available in the cubic phase [29]. The presence of the small peaks observed at 28.2° and 31.5° in Figure 2a belongs to the monoclinic phase. Also, the XRD peaks at 50° and 60° in Figure 2c could be attributed to the increase in the dopant fraction. This can retain the distorted cubic phase in those samples with a slight broadening of the XRD peaks, which is consistent with the decrease in cell parameter c for a higher doping ratio. It is reported that the cubic phase ZrO2 stabilized with 8–10 wt.% Gd has the highest ionic conductivity [30]. In addition, analyzing the relevant literature shows that materials with higher conductivity in the tetragonal phase are also frequently reported [30,31].
As seen in Table 2, lattice volumes slightly increase with the increasing dopant rate for the tetragonal phases except for GDZ-8. Changing of volume, so unit cell parameters are in agreement with dopant cation ionic radius. From the XRD profiles, it was noticed that Gd3+ cations had been fully substituted in the crystal lattice of ZrO2. This can create a systematic variation of the crystal lattice in the resulting composites. Effective ionic radii of O2-, Zr4+, and Gd3+ cations are 1.40 Å, 0.72 Å, and 0.938 Å with coordination numbers of 6, respectively [32]. Due to the lower ionic radii of the Zr4+ cations compared to Gd3+ cations, the substitution of Gd2O3 into the ZrO2 lattice causes an increase in the unit cell constant of the resulting composites (see the lattice parameters in Table 2). Estimation of the cell parameters based on the XRD results shows a linear dependence of unit cell parameter a on the mole-fraction of Gd as the dopant.
As the amount of substances increases depending on the amount of Gd2O3 in the sample, crystallinity increases in stable monoclinic and cubic structures (Table 1). However, the crystallite size tends to decrease in the tetragonal structure. Similar to the results of the study of Paula M. et al. [33], when the c/a ratio increases, the c/a value increases with the crystallite size as the amount of matter in monoclinic and cubic structures increases. In the tetragonal structure, while the ZrO2 structure is returning to the ideal cubic structure, the displacement of the oxygen vacancies along the c-axis and the presence of other phases such as those with mixed C + T phases (Figure 2b) can reduce the size of crystallite lattice [33].
The XRD patterns of powder and disc GDZ-8 electrolytes are shown in Figure 3. The XRD profile of the other resulting composite samples was quite similar to the pattern obtained for GDZ-8. As seen in Figure 3, the XRD pattern of the fabricated GDZ-8 pellets is almost identical to that of containing GDZ-8 powder. This can indicate that the synthesized electrolyte powders were not subjected to potential structural degradation during the thermal treatment process used to fabricate the electrolyte layer.

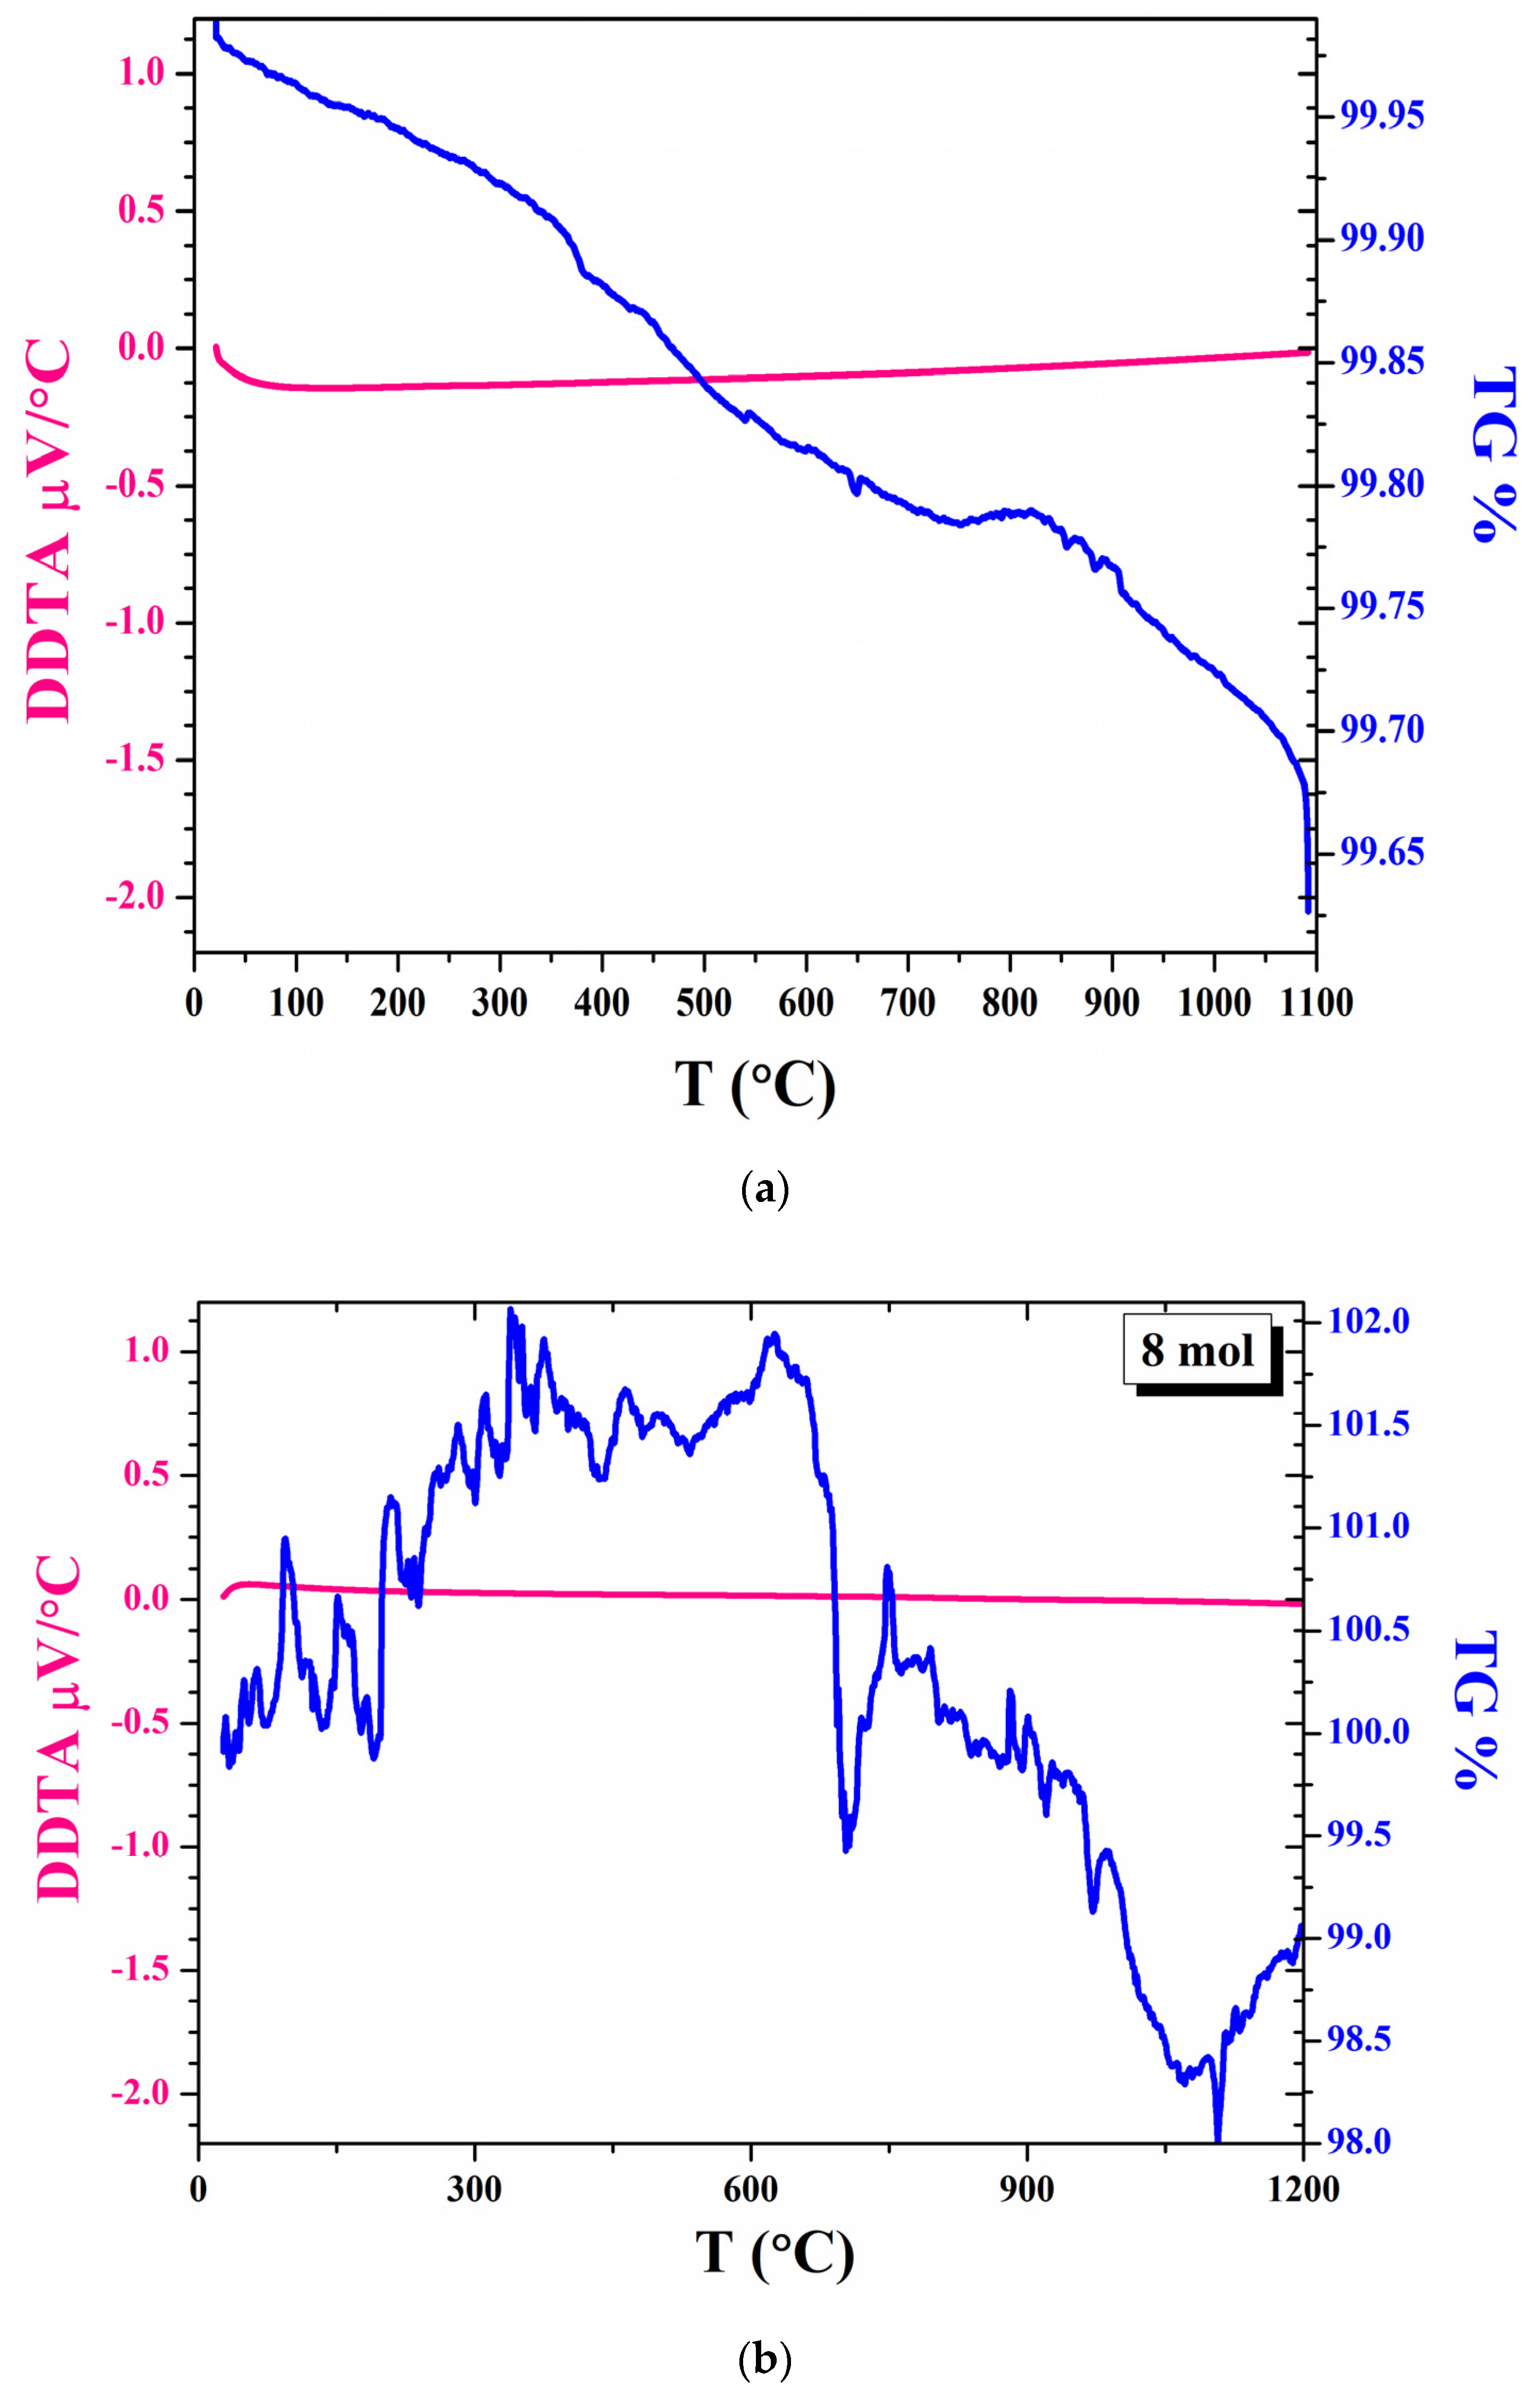
3.2. Thermal Analysis of Powder and Disk Samples

Figure 4a,b show the TGA/DTA profiles of the GDZ-8 sample. It is understood from the TGA curve that the GDZ-8 is stable up to about 1000 °C, and there is no mass loss. No sharp endothermic or exothermic peaks were observed in the DTA plots. This indicates that the solid electrolyte is thermally stable without experiencing a significant change of phase for applications below 1000 °C.
As seen in Figure 4b, the TGA profile of the fabricated sample shows a fluctuating loss-gain behaviour over the whole range of the temperature. Maximally, about 2% mass-gain can be observed around 310 °C and then at 620 °C; that could be due to the formation of metal oxides with a higher oxidation state in the GDZ system. At 600 °C, mass reduction begins and continues up to 1100 °C. The mass loss at this stage is 3.5% and is caused by the decomposition of additives. Also, it can be seen from the stability of DTA signals.

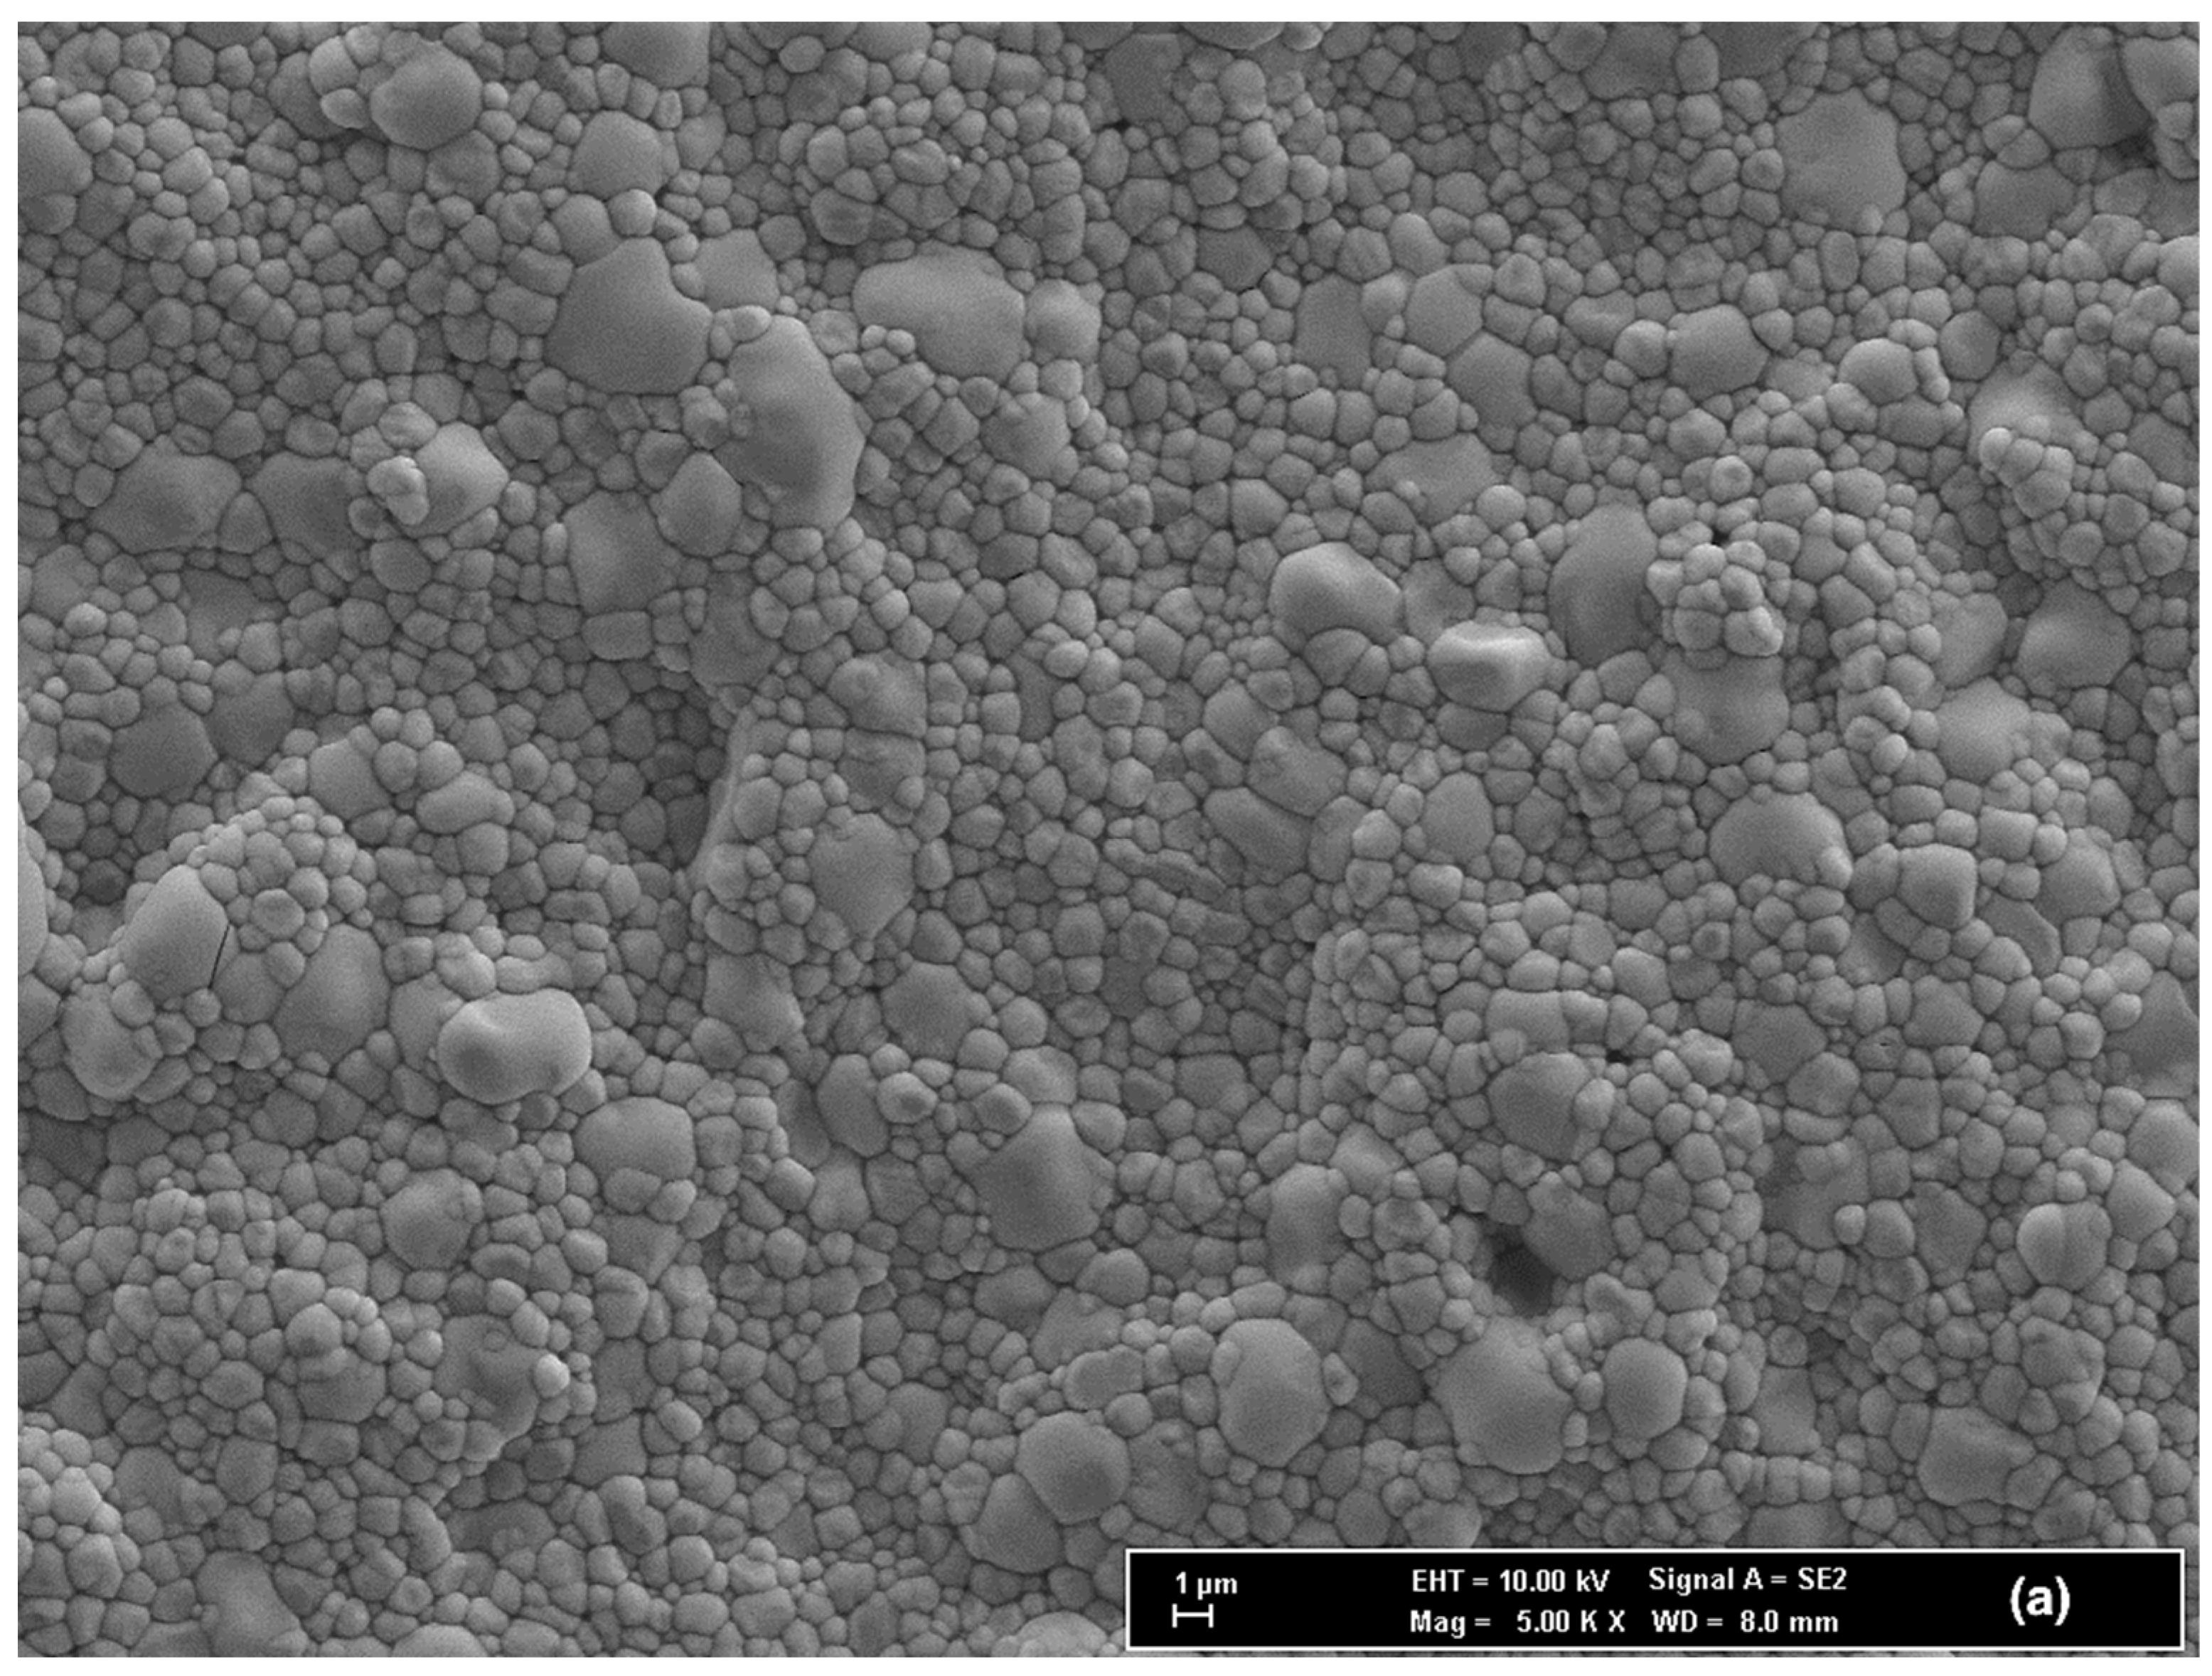
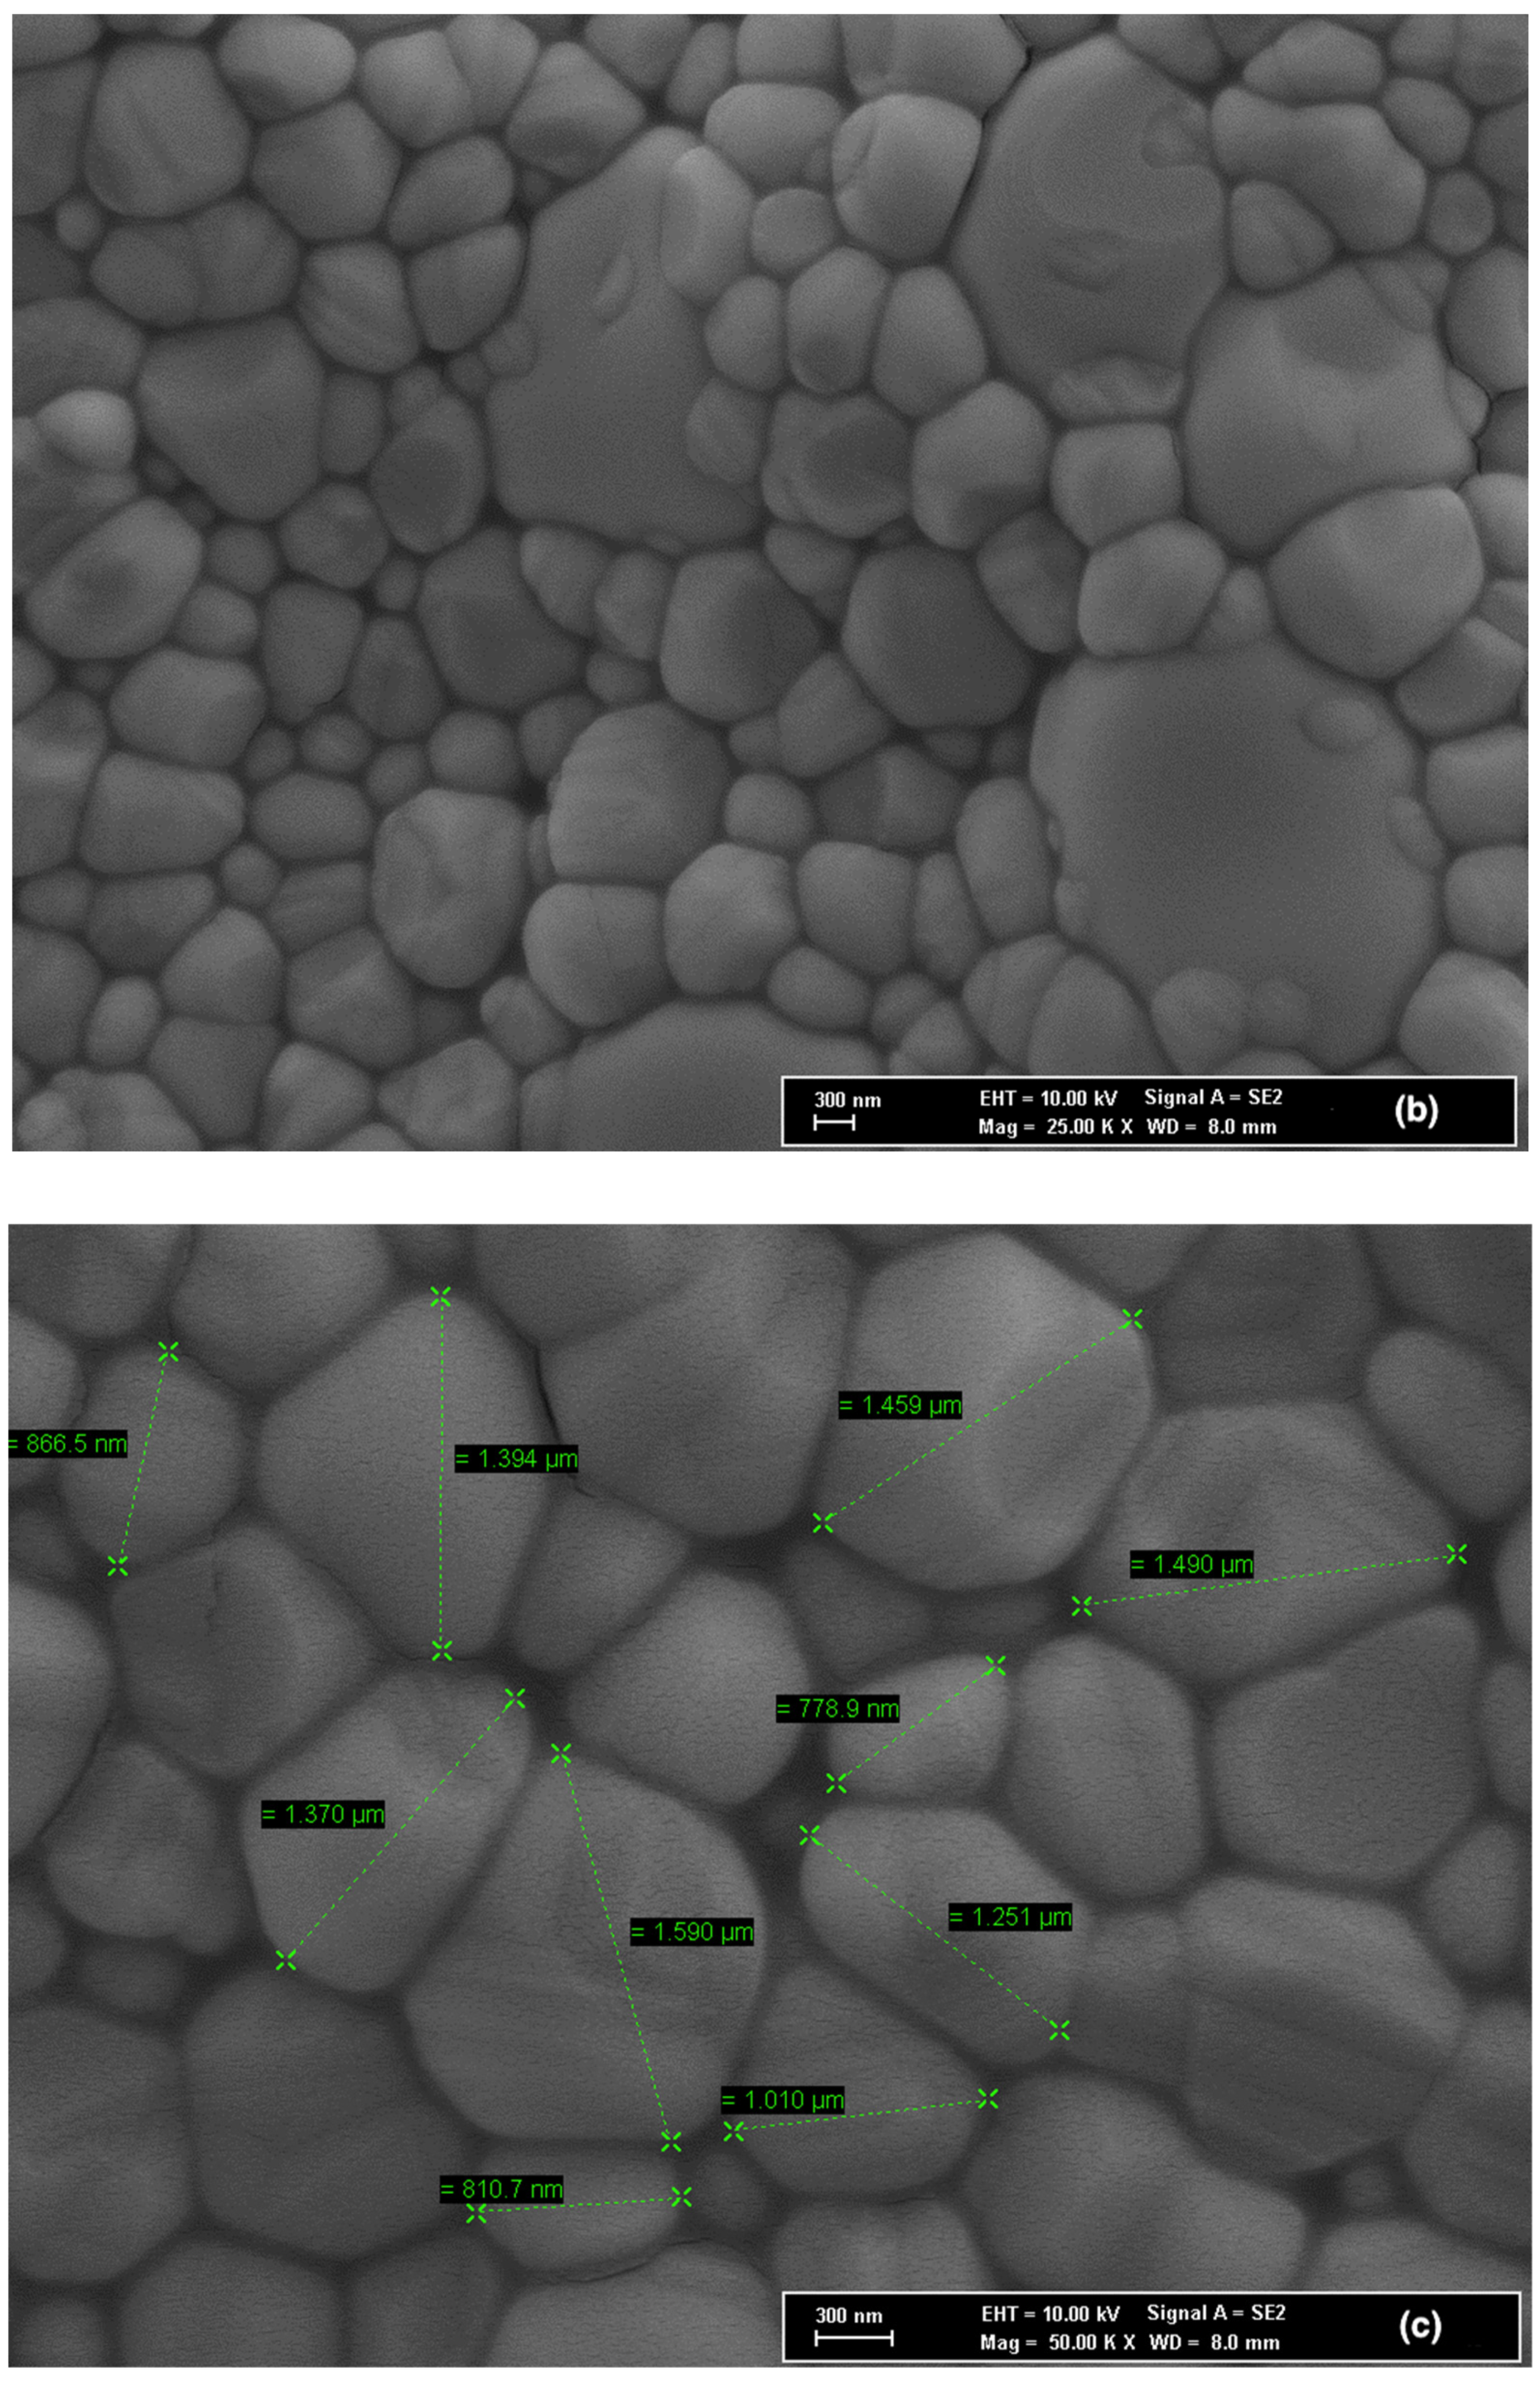
3.3. Microstructure Characterization

Figure 5 shows the micrographs for the electrolyte pellets fabricated using GDZ-8. GDZ-8 showed comparably higher conductivity values and therefore it has been selected for further analysis in this study. Analyzing the SEM micrographs indicated that the SOFC electrolytes fabricated with GDC-8 have great interconnected grains with a homogeniuos size distribution ranging between ~800–1500 nm. The size of grains and the microstructure of the sintered electrolyte directly affect the ionic conductivity of a SOFC. As shown in Figure 5, the grains obtained after sintering are well interconnected which can support a high ionic transfer efficiency [7].

3.4. Conductivity Characterisation

The estimated resistances and ionic conductivity values have been summarised in Table 3. The highest ionic conductivity belonged to GDZ-8 solid electrolyte at 800 °C and 7.3 × 10⁻² S/cm. The ionic conductivity values were increased with increasing temperature for all samples (Table 3). Zirconia-based solid electrolytes are mainly anionic O2− conductive materials, and their ionic conductivities rise with the increasing temperature because of the increase in mobility of ions. These materials have Oxygen defective fluorite structure, and there are O2− anion vacancies ( V ¨ O ) in the sublattice. The conductivity mechanism occurs via interstitial O2− anion migration between these defected lattice points. The greater values of thermal vibration energy of ions at higher temperatures also cause obtaining a higher ionic movement rate with ore interstitial tetrahedral lattice points. At low temperatures, the thermal energy of the anions is not enough for jumping to the nearest neighbour tetrahedral vacancy points. At high temperatures (above ~500 °C), gained thermal energy is enough, and migration can start through the sub-lattice, charge carriers may also assist the jumping process momentarily by either shortening the jumping distances or widening the jumping conduction pathways through the crystal lattice, and the following equation can express:
O l a t t i c e 2 V ¨ O + 2 e + 1 2 O 2
Equation (2) implies that the formations of oxygen vacancies can positively affect electrical conductivity and the concentration of thermally induced O2− vacancies can be increased with increasing temperature. The disordered arrangements ratio of V ¨ O can be defined as a short-range ordering of oxygen vacancies along with some special directions of the fcc unit cell. These disordered arrangements may increase with the increasing temperature. This increased degree with the temperature increment of the disordered structure can also play an important role in exhibiting higher mobility, easier movement of ions, and the increment of conductivity. These results also indicated that the conductivity of the disordered structure is higher than that of the ordered configuration.
The Gd3+ ions occupy the substitutional sites in the ZrO2 host lattice and lead to the release of free-charge carriers, which are owing to the increase of conductivity [34]. Ionic radius of Gd3+ (0.94 Å) are higher than Zr4+ (0.72 Å). Substitution of Gd3+ ions into the zirconia structure causes changes in the ionic conductivity of the resulting solid composite. Thus, the conductivity of the fabricated GDZ poly-crystals increases with the Gd doping rate in this study (from 8 to 10 mol% for the Gd2O3 concentration), and the phase composition changes, as seen in Table 3. This increment of conductivity can be explained by the ionic radius consistency of dopant cation Gd3+ and host cation Zr4+. The mobility of the oxygen ions also depends on lattice distortions, and if the ion radius of the cation is greater than the ion radius of the host lattice, mobility increases. The more the cation radius is adapted to the ion radius of Zr4+, the less the transport path of the anions is disrupted, and the higher is the mobility of the oxygen ions for Gd3+ doped zirconia [35]. For a small deviation in ion radii between dopant and Zr4+, the migration enthalpy is low; therefore, the mobility is high [36]. Therefore, as the differences in the ionic radius of dopant Gd3+ and host Zr4+ cations is relatively small, obtaining a relatively higher conductivity could be expected.

4. Conclusions

Nanocrystalline powders of gadolinium zirconate (Gd2xZr2(1−x)O4-x, 0.01 ≤ x ≤ 0.16) were successfully synthesized by the Pechini method at a lower temperature. The crystalline structure of the resulting electrolyte samples with a dopant fraction of 0.04 ≤ x ≤ 0.10 has a stabilized tetragonal phase. The GDZ electrolyte pellets were successfully manufactured by the tape casting technique. Unit cell parameters of all samples changed with the dopant rate due to dopant and host cation ionic radius differences. The electrical conductivity values are decreased with an increase in the dopant concentration (gadolinium fraction). The impedance measurements showed that the GdZ-8 sample (gadolinium zirconate composite with 8% dopant fraction) provides the maximum electrical conductivity of 7.23 × 10⁻² S/cm at 800 °C, which is in good agreement with the literature. Also, the highest conductivity value obtained for the intermediate-temperature SOFC application belonged to GDZ-10 electrolyte with 5.48 × 10⁻² S/cm at 600 °C.

Author Contributions

Writing—initial draft preparation, analysis, editing, S.Y.; methodology, analysis, S.C.; methodology, analysis, E.Y.; editing, conceptualization, writing, review, supervision, B.A.H. All authors have read and agreed to the published version of the manuscript.

Funding

This research was mutually funded by Mersin University grant number [2016-2-TP3-1957] and the University of Surrey Research Visitors’ fund.

Acknowledgments

The authors are thankful for the financial supports received from Mersin University and the research visit fund by the University of Surrey. Also, they would like to thank to Bora Timurkutluk, Selahattin Celik and Cigdem Timurkutluk (from Clean Energy Research Centre, Turkey) for their supports.

Conflicts of Interest

The authors declare no conflict of interest.

References

  1. Subotić, V.; Napporn, T.W. Nanostructured metal oxides for high-performance solid oxide fuel cells (SOFCs). In Metal Oxide-Based Nanostructured Electrocatalysts for Fuel Cells, Electrolyzers, and Metal-Air Batteries; Napporn, T.W., Holade, Y., Eds.; Elsevier: Amsterdam, The Netherlands, 2021; pp. 235–261. [Google Scholar]
  2. Choolaei, M.; Cai, Q.; Horri, B.A. Green synthesis and characterization of nanocrystalline NiO-GDC powders with low activation energy for solid oxide fuel cells. Ceram. Int. 2021, 47, 32804–32816. [Google Scholar] [CrossRef]
  3. Alenazey, F.; Alyousef, Y.; AlOtaibi, B.; Almutairi, G.; Minakshi, M.; Cheng, C.K.; Vo, D.-N. Degradation Behaviors of Solid Oxide Fuel Cell Stacks in Steady State and Cycling Conditions. Energy Fuels 2020, 34, 14864–14873. [Google Scholar] [CrossRef]
  4. Coralli, A.; Sarruf, B.J.M.; de Miranda, P.E.V.; Luigi, O.; Specchia, S.; Minh, N.Q. Fuel Cells. In Science and Engineering of Hydrogen-Based Energy Technologies; Academic Press: Cambridge, MA, USA, 2019; pp. 39–122. [Google Scholar]
  5. Kumar, V.J.; Karthik, R.; Chen, S.M.; Natarajan, K.; Karuppiah, C.; Yang, C.C.; Muthuraj, V. 3D Flower-Like Gadolinium Molybdate Catalyst for Efficient Detection and Degradation of Organophosphate Pesticide (Fenitrothion). ACS Appl. Mater. Interfaces 2018, 10, 15652–15664. [Google Scholar] [CrossRef] [PubMed]
  6. Silvaa, C.L.S.; Marchetti, S.G.; Junior, A.C.F.; Silva, T.F.; Assaf, J.M.; Rangel, M.C. Effect of Gadolinium on the Catalytic Properties of Iron Oxides for WGSR. Catal. Today 2013, 213, 127–134. [Google Scholar] [CrossRef] [Green Version]
  7. Madhusudhanaa, H.C.; Shobhadevic, S.N.; Nagabhushanad, B.M.; Krishnad, R.H.; Murugendrappae, M.V.; Nagabhushanaf, H. Structural Characterization and Dielectric studies of Gd doped ZrO2 nano crystals Synthesized by Solution combustion method. Mater. Today 2018, 5, 21195–21204. [Google Scholar] [CrossRef]
  8. Kang, T.-K.; Nagasaki, T.; Igawa, N.; Il-Hiun, K.; Ohno, H. Electrical Properties of Cubic, Stabilized, Single ZrO2-Gd203 Crystals. Ceram. Soc. 1992, 75, 2297–2299. [Google Scholar] [CrossRef]
  9. Zinkevich, M.; Wang, C.; Morales, F.M.; Ruhle, M.; Aldinger, F. Phase equilibria in the ZrO2–GdO1.5 system at 1400–1700 °C. J. Alloys Compd. 2005, 398, 261–268. [Google Scholar] [CrossRef]
  10. Sharma, P.; Sundaram, M.M.; Singh, D.; Ahuja, R. Highly Energetic and Stable Gadolinium/Bismuth Molybdate with a Fast-Reactive Species, Redox Mechanism of Aqueous Electrolyte. ACS Appl. Energy Mater. 2020, 3, 12385–12399. [Google Scholar] [CrossRef]
  11. Hong, M.; Kwo, J.; Kortan, A.R.; Mannaerts, J.P.; Sergent, A.M. Epitaxial Cubic Gadolinium Oxide as a Dielectric for Gallium Arsenide Passivation. Science 1999, 283, 1897–1900. [Google Scholar] [CrossRef]
  12. Piconi, C.; Burger, W.; Richter, H.G.; Cittadini, A.; Maccauro, G.; Covacci, V.; Bruzzese, N.; Ricci, G.A.; Marmo, E. Y-TZP ceramics for artificial joint replacements. Biomaterials 1998, 19, 1489–1494. [Google Scholar] [CrossRef]
  13. Piconi, C.; Maccauro, G. Zirconia as a ceramic biomaterial. Biomaterials 1999, 20, 1–25. [Google Scholar] [CrossRef]
  14. Vostakola, M.F.; Horri, B.A. Progress in Material Development for Low-Temperature Solid Oxide Fuel Cells: A Review. Energies 2020, 14, 1280. [Google Scholar] [CrossRef]
  15. Qian, J.; Hou, J.; Tao, Z.; Liu, W. Fabrication of (Sm, Ce)O2−δ interlayer for yttria-stabilized zirconia-based intermediate temperature solid oxide fuel cells. J. Alloys Compd. 2015, 631, 255–260. [Google Scholar] [CrossRef]
  16. Ghatee, M.; Salihi, H. Electrical and mechanical properties of 25 wt% tetragonal/cubic zirconia based composite thin films prepared by combination of aqueous tape casting and net shape methods. J. Electroceramics 2015, 35, 98–105. [Google Scholar] [CrossRef]
  17. Yildiz, E.; Yilmaz, S.; Turkoglu, O. The production and characterization of ytterbium-stabilized zirconia films for SOFC applications. Int. J. Appl. Ceram. Technol. 2016, 13, 100–107. [Google Scholar] [CrossRef]
  18. Bastidas, D.M. High temperature corrosion of metallic interconnects in solid oxide fuel cells. Rev. Metal. 2006, 42, 425–443. [Google Scholar] [CrossRef]
  19. Karaoglanli, A.C.; Doleker, K.M.; Ozgurluk, Y. Interface failure behavior of yttria stabilized zirconia (YSZ), La2Zr2O7, Gd2Zr2O7, YSZ/La2Zr2O7 and YSZ/Gd2Zr2O7 thermal barrier coatings (TBCs) in thermal cyclic exposure. Mater. Charact. 2020, 159, 110072. [Google Scholar] [CrossRef]
  20. Lashmi, P.G.; Majithia, S.; Shwetha, V.; Balaji, N.; Aruna, S.T. Improved hot corrosion resistance of plasma sprayed YSZ/Gd2Zr2O7 thermal barrier coating over single layer YSZ. Mater. Charact. 2019, 147, 199–206. [Google Scholar] [CrossRef]
  21. Liu, Z.-G.; Ouyang, J.-H.; Zhou, Y.; Xia, X.-L. Structure and thermal conductivity of Gd2(TixZr1−x)2O7 ceramics. Mater. Lett. 2008, 62, 4455–4457. [Google Scholar] [CrossRef]
  22. Díaz-Guillén, J.A.; Díaz-Guillén, M.R.; Padmasree, K.P.; Fuentes, A.F.; Santamaría, J.; León, C. High ionic conductivity in the pyrochlore-type Gd2−yLayZr2O7 solid solution (0 ≤ y ≤ 1). Solid State Ion. 2008, 179, 2160–2164. [Google Scholar] [CrossRef]
  23. Irshad, M.; Ain, Q.u.; Siraj, K.; Raza, R.; Tabish, A.N.; Rafique, M.; Idrees, R.; Khan, F.; Majeed, S.; Ahsan, M. Evaluation of BaZr0.8X0.2 (X = Y, Gd, Sm) proton conducting electrolytes sintered at low temperature for IT-SOFC synthesized by cost effective combustion method. J. Alloys Compd. 2020, 815, 152389. [Google Scholar] [CrossRef]
  24. Pechini, M.M. Method of Preparing Lead and Alkaline Earth Titanates and Niobates and Coating Method Using the Same to Form a Capacitor. U.S. Patent No. 3,330,697, 11 July 1967. [Google Scholar]
  25. Danks, A.E.; Hall, S.R.; Schnepp, Z. The evolution of ‘sol–gel’ chemistry as a technique for materials synthesis. Mater. Horiz. 2016, 3, 91–112. [Google Scholar] [CrossRef] [Green Version]
  26. Winck, L.B.; Ferreira, J.L.d.; Martinez, J.M.G.; Araujo, J.A.; Rodrigues, A.C.M.; da Silva, C.R.M. Synthesis, sintering and characterization of ceria-based solid electrolytes codoped with samaria and gadolinium using the Pechini method. Ceram. Int. 2017, 43, 16408–16415. [Google Scholar] [CrossRef]
  27. Boultif, A.; Louër, D. Powder pattern indexing with the dichotomy method. J. Appl. Crystallogr. 2004, 37, 724–731. [Google Scholar] [CrossRef]
  28. Matović, B.; Bošković, S.; Živković, L.; Vlajić, M.D.; Krstić, V.D. Lattice Parameters of Gd-Doped Ceria Electrolytes. Mater. Sci. Forum 2005, 494, 175–180. [Google Scholar] [CrossRef]
  29. Basu, S.; Varma, S.; Shirsat, A.N.; Wani, B.N.; Bharadwaj, S.R.; Chakrabarti, A.; Jha, S.N.; Bhattacharyya, D. Extended X-ray absorption fine structure study of Gd doped ZrO2 systems. J. Appl. Phys. 2013, 113, 043508. [Google Scholar] [CrossRef]
  30. Dutta, S.; Bhattacharya, S.; Agrawal, D.C. Electrical properties of ZrO2-Gd2O3 ceramics. Mater. Sci. Eng. B Solid-State Mater. Adv. Technol. 2003, 100, 191–198. [Google Scholar] [CrossRef]
  31. Wang, W.; Li, C.; Li, J.; Fan, J.; Zhou, X. Effect of gadolinium doping on phase transformation and microstructure of Gd2O3-Y2O3-ZrO2 composite coatings prepared by electrophoretic deposition. J. Rare Earths 2013, 31, 289–295. [Google Scholar] [CrossRef]
  32. Shannon, R.D. Revised effective ionic radii and systematic studies of interatomic distances in halides and chalcogenides. Acta Crystallogr. Sect. A 1976, 32, 751–767. [Google Scholar] [CrossRef]
  33. Abdala, P.M.; Fantini, M.C.; Craievich, A.F.; Lamas, D.G. Crystallite size-dependent phases in nanocrystalline ZrO2-Sc2O3. Phys. Chem. Chem. Phys. 2010, 12, 2822–2829. [Google Scholar] [CrossRef]
  34. del Zotto, L.; Ferrario, A.M.; Hatunoglu, A.; Dell’Era, A.; McPhail, S.; Bocci, E. Experimental Procedures & First Results of an Innovative Solid Oxide Fuel Cell Test Rig: Parametric Analysis and Stability Test. Energies 2021, 14, 2038. [Google Scholar] [CrossRef]
  35. Sanson, A.; Gondolini, A. Solid Oxide Fuel Cells. In Encyclopedia of Materials: Technical Ceramics and Glasses; Elsevier: Amsterdam, The Netherlands, 2021; pp. 49–58. [Google Scholar]
  36. Peters, C. Grain-Size Effects in Nanoscaled Electrolyte and Cathode Thin Films for Solid Oxide Fuel Cells (SOFC); KIT Scientific Publishing: Karlsruhe, Germany, 2009. [Google Scholar]
Figure 1. The step-wise procedure for the electrolyte powder synthesis and electrolyte layer preparation via tape casting process.
Energies 15 02826 g001
Figure 2. The XRD patterns of GDZ systems for (a) x = 1 and 2 mol% monoclinic (M), (b) x = 4, 6, 8, 10 mol% tetragonal (T) and (c) x = 12, 14, 16 mol% cubic (C) phases samples.
Energies 15 02826 g002aEnergies 15 02826 g002b
Figure 3. XRD patterns of GDZ-8 samples for the (a) powder and (b) pellet samples.
Energies 15 02826 g003
Figure 4. TGA/DTA diagram for GDZ-8 in the air; (a) powder calcined at 1200 °C for 12 h; (b) pellet sintered at 1500 °C.
Energies 15 02826 g004
Figure 5. SEM surface micrographs of GDZ-8 electrolyte sample at (a) 5 KX, (b) 25 KX and (c) 50 KX magnification.
Energies 15 02826 g005aEnergies 15 02826 g005b
Table 1. Additive ratios of tape casting slurry.
Slurry ContentsElectrolyte
(4.5 g)
DispersantFish Oil0.05 g
BinderButvar B-760.5 g
PlasticiserPEG1 mL
SolventEthanol5 mL
Table 2. Observed phases, lattice parameters, c and a ratio, lattice volumes and crystal sizes of Gd2xZr2(1−x)O4−x (1 ≤ x (mol%) ≤ 16) powders calcined at 1200 °C for 12 h.
x
(mol%)
SamplesPhasesLattice Parameters (Å)c/aLattice Volume (Å3)Crystal Size (nm)
abc
1GDZ-1M5.15075.20285.31561.032-22.3273
2GDZ-2M5.15235.21285.32931.034-23.9475
4GDZ-4T3.60355.18741.44067.3638.8600
6GDZ-6T3.60625.18831.43967.4731.1278
8GDZ-8T3.59575.18501.44267.0321.0943
10GDZ-10T3.62115.16721.42767.7532.9000
12GDZ-12C5.14971-20.2114
14GDZ-14C5.12801-24.2144
16GDZ-16C5.12801-60.0344
Table 3. Conductivity values at different ambient temperatures of GDZ pellets in the air atmosphere.
Temperature
(°C)
σb (10−2 S/cm)
GDZ-4GDZ-6GDZ-8GDZ-10
6004.835.195.265.48
6505.355.515.895.61
7005.875.656.095.94
7506.336.126.276.46
8007.196.237.236.49
Publisher’s Note: MDPI stays neutral with regard to jurisdictional claims in published maps and institutional affiliations.

