Article

Metallic Particle Motion and Breakdown at AC Voltages in CO2/O2 and SF6

Hitachi Energy Research, 5401 Baden, Switzerland
*
Author to whom correspondence should be addressed.
Energies 2022, 15(8), 2804; https://doi.org/10.3390/en15082804
Submission received: 2 March 2022 / Revised: 6 April 2022 / Accepted: 8 April 2022 / Published: 12 April 2022

Abstract

:
This study deals with gaseous insulation contaminated by free moving particles. Two gases were investigated: SF6 (0.45 MPa) and a CO2/O2 gas mixture (0.75 MPa). Video recordings were used to track a free particle moving between a plate and a Rogowski electrode for validation of a 1D particle motion model. The effect of fixed and free particles (4 or 8 mm, Ø 0.9 mm) on the breakdown voltage and the mean time between breakdowns was determined in a concentric set of electrodes. The value of the breakdown voltage for a free particle was between those of a particle fixed to the enclosure and the central electrode. The particle motion in the concentric case could not be observed in the experimental set-up and was therefore simulated using a 1D model. For the 4 mm free particle, the breakdown seemed to be initiated in the inter-electrode gap in CO2 and at the crossing in SF6, while for the 8 mm particle, breakdown occurred at lift-off in both gases. A parameter k describing the width of the time to breakdown distribution was introduced. A low value of k was associated with the breakdown from the particles at the electrodes, while k was larger than 10 when the breakdown was decided during particle flight.

1. Introduction

Gaseous insulation is utilized in many high voltage (HV) applications, for example in gas-insulated switchgear (GIS) and circuit breakers (CB) [1,2,3,4,5,6]. For compact insulation compressed gas in the pressure range of 0.13–1 MPa is used. Today, most applications use SF6, which has excellent dielectric and interruption properties, but unfortunately is a potent greenhouse gas (e.g., [7,8]). Therefore, the search for alternative insulation gases has significantly increased during the last decade. The most promising gas in HV switchgear applications for replacing SF6 is CO2, which is typically used in mixtures with additives in low concentrations (O2, perfluoronitriles) [8,9,10,11].
A key issue in the reliable operation of gas insulated high voltage systems is the avoidance of insulation defects, such as free moving metallic particles, in manufacturing, commissioning, and operation [12,13,14]. Such particles can often be detected by partial discharge (PD) measuring systems. However, avoidance cannot always be ensured, and particles might be present during operation, potentially leading to a significant decrease in insulation performance. For CO2 mixtures little information is available to date on the sensitivity to free particles, e.g., [15,16,17,18,19,20]. Information on partial discharges in CO2 with the addition of perfluoronitriles is emerging, e.g., [21].
The present paper deals with free moving particles in CO2/O2 (90%/10% molar concentration). It is important to understand how particles move in such a gas mixture and how they affect the insulation performance at gas pressures utilized in typical applications. We performed tests at a pressure of 0.75 MPa, which is a typical pressure used in CO2 based switchgear [8]. In addition, experiments in SF6 at 0.45 MPa, which is a typical pressure for SF6 switchgear, were performed for comparison.
The experiments were done using AC voltage with two different test set-ups. The first one (set-up 1) had a close to uniform electric field (a curved electrode vs. a Rogowski electrode) and the second one (set-up 2) had a weakly non-uniform field (concentric spherical electrodes) similar to a typical GIS field configuration. In set-up 1 the particle movement could be tracked by visual inspection through a window. This set-up was already used previously [14]. The closed configuration in set-up 2 allowed testing with a single particle over an extended time of up to hours without losing the particle and to determine the stochastic scatter of breakdown fields. In this set-up no window was used since particles would easily stick to a window, which would limit testing time. Thus, optical observation was not possible in this case. For an insight into the particle height excursion in set-up 2, we performed simulations as presented in [14] using a state-of-the-art model, like those presented in [22,23], and validated with the measurements of set-up 1. Additionally, in set-up 2 breakdown tests were done with particles fixed either on the inner or outer electrode. This allowed the comparison of breakdown field values for the moving particle to those of a fixed particle (protrusion), which is important to judge the criticality of free moving particles in CO2/O2.
The paper is organized as follows. Section 2 presents the experimental methods. Section 3 introduces the analysis procedures and details of the particle motion model, which complements the measurements. Section 4 presents the validation of the simulation model with the measurements of set-up 1 and the breakdown voltages and fields measured in set-up 2. In addition, simulations for the experiment in test set-up 2 are shown to get an insight into the particle motion. Section 5 discusses the results and compares them to other literature reports. Short conclusions are given in Section 6.

2. Experimental Methods

In this study, a two-stage transformer was used as an AC power source. A 1.0 MΩ resistor was placed in series with the test object to limit the current at breakdown. In this way, the voltage recovered within one cycle after breakdown. Two test objects with different electrode arrangements were used. Set-up 1 allows for optical observation but cannot be used for breakdown experiments since particles are quickly lost. This experiment is used for validation of the simulation model and to learn about the influence of using several particles simultaneously. Set-up 2 did not allow for optical investigation, but allowed long voltage application times and thus, the possibility to do breakdown experiments.

2.1. Set-Up 1: Curved Electrode vs. Rogowski Shaped Electrode

The first test set-up, composed of a curved (bottom) and a Rogowski shaped electrode (top) was placed in an enclosure with a window and used to observe the trajectory of free moving particles. The gap between the electrodes was 30 mm. The electrode configuration and electric field distribution was simulated (Figure 1b) by a capacitive electric field solver (ACE version 5.4) in axisymmetric coordinates. The voltage reduced electric field strength along the axis of symmetry is shown in Figure 1c.
For the tests, the enclosure was filled with a 0.75 MPa CO2/O2 mixture (90%/10% molar concentration) and a 4 mm copper particle with a 0.9 mm diameter. The voltage was manually ramped up to a predefined value above the lift-off voltage and the particle motion was recorded with a high-speed camera (Phantom V711, frame time interval: 1000 ms, exposure time: 850 ms). The vertical component of the particle movement was determined from the video frames by particle tracking.
Breakdown voltage determination with set-up 1 could not be done as the particle was lost before a statistically sufficient number of breakdown events could be observed. Performing tests with several particles (10 particles) was found to be not optimal: it was observed that the particles interact, which led to a lower breakdown voltage due to discharges between several particles (Figure 2). Therefore, all breakdown tests reported in this study were performed with set-up 2 using only a single particle.

2.2. Set-Up 2: Concentric Spherical Electrodes

A concentric arrangement of spherical electrodes was used for the breakdown experiments (Figure 3). The diameter of the central electrode was 100 mm, and the diameter of the outer electrode was 160 mm. The voltage reduced electric field distribution is shown in Figure 3b. Along the axis of symmetry, the electric field strength was 21 1/m at the bottom of the outer sphere electrode and 52 1/m at the inner sphere, see Figure 3c. In contrast to set-up 1, where the particle was rapidly lost, in this closed arrangement the particle is confined, which allowed observation of a statistically relevant number of breakdowns. Openings at the top of the test object allowed gas exchange. The assembled test object was placed in a tight compartment that could be pressurized and filled with either 0.45 MPa SF6 or 0.75 MPa CO2/O2 (90%/10% molar concentration). For the tests, a metallic particle (Cu, diameter 0.9 mm, length 4 mm or 8 mm) was introduced in the gas gap either as a free particle or attached to one of the electrodes. In the latter case, a piece of wire (Cu, diameter 0.9 mm) was cut to twice the desired length, bent into an L-shape, and fixed to the electrode by adhesive tape. A constant pre-defined AC voltage was applied to the central electrode. Measurements were performed for different voltages and the voltage was applied for a duration sufficiently long to observe 20–100 breakdowns. The time between successive breakdowns was recorded.

3. Analysis Procedures and Modelling

3.1. Analysis of Particle Motion: 1D Model

The particle motion model used to describe the particle trajectory was detailed in [14] and is of 1D type. Implementation was done in Matlab R2018b. The model considers the electric, gravitational, and drag forces acting on a particle with mass m. The equation of vertical motion x(t) in an electric field E(t) parallel to gravity is determined by the various forces acting on the particle
m x ¨ = q ( t ) E ( t ) m g F D F e W
with q(t), g, FD and FeW, the electrostatic charge on the particle, the gravitational acceleration of 9.81 m/s2, the fluid dynamic drag force, and the electric wind force, respectively. The electric wind force FeW is produced by corona discharges during flight. As discussed in [14] the electric wind force and loss of particle charge during flight can be neglected in the model for short particles. Hence, the particle charge in our model remains constant during a bounce and changes its value only at the electrode touch. Initial conditions at electrode contact time t n are x ( t n ) = 0 and x ˙ ( t n ) = R · x ˙ f with the rebound coefficient R and x ˙ f the impact velocity at the end of the previous bounce, as explained in detail in [14]. R is assumed to be 0.5 with a random variation of ΔR = 0.2 in the model, which agrees with our own measurements and literature data, e.g., [19]. The flow dynamic drag force is F D = 0.5 C D D 2 x ˙ 2 with the drag coefficient C D = 0.2 and the particle diameter D. The charge transferred to the particle at impact time tn is calculated from q n = γ π ε 0 L 2 E ( t n ) with the particle length L and a dimensionless capacitance factor γ determined by the particle geometry. For vertically standing wire particles on the electrode γ = [ ln ( 4 L / D ) 1 ] 1 is used. For further details of the model please refer to [14].
The lift-off field E*, the field at which the electrostatic force acting on the particle balances the particle weight, is
E * = g · ρ · D 2 4 · ε · γ · L
With the mass density of the particle r and the permittivity of vacuum εo.
The described model will be used to predict the particle motion in experiments of set-up 1 and set-up 2. The visual observation in set-up 1 allows us to validate the model and is shown in Section 4.2.

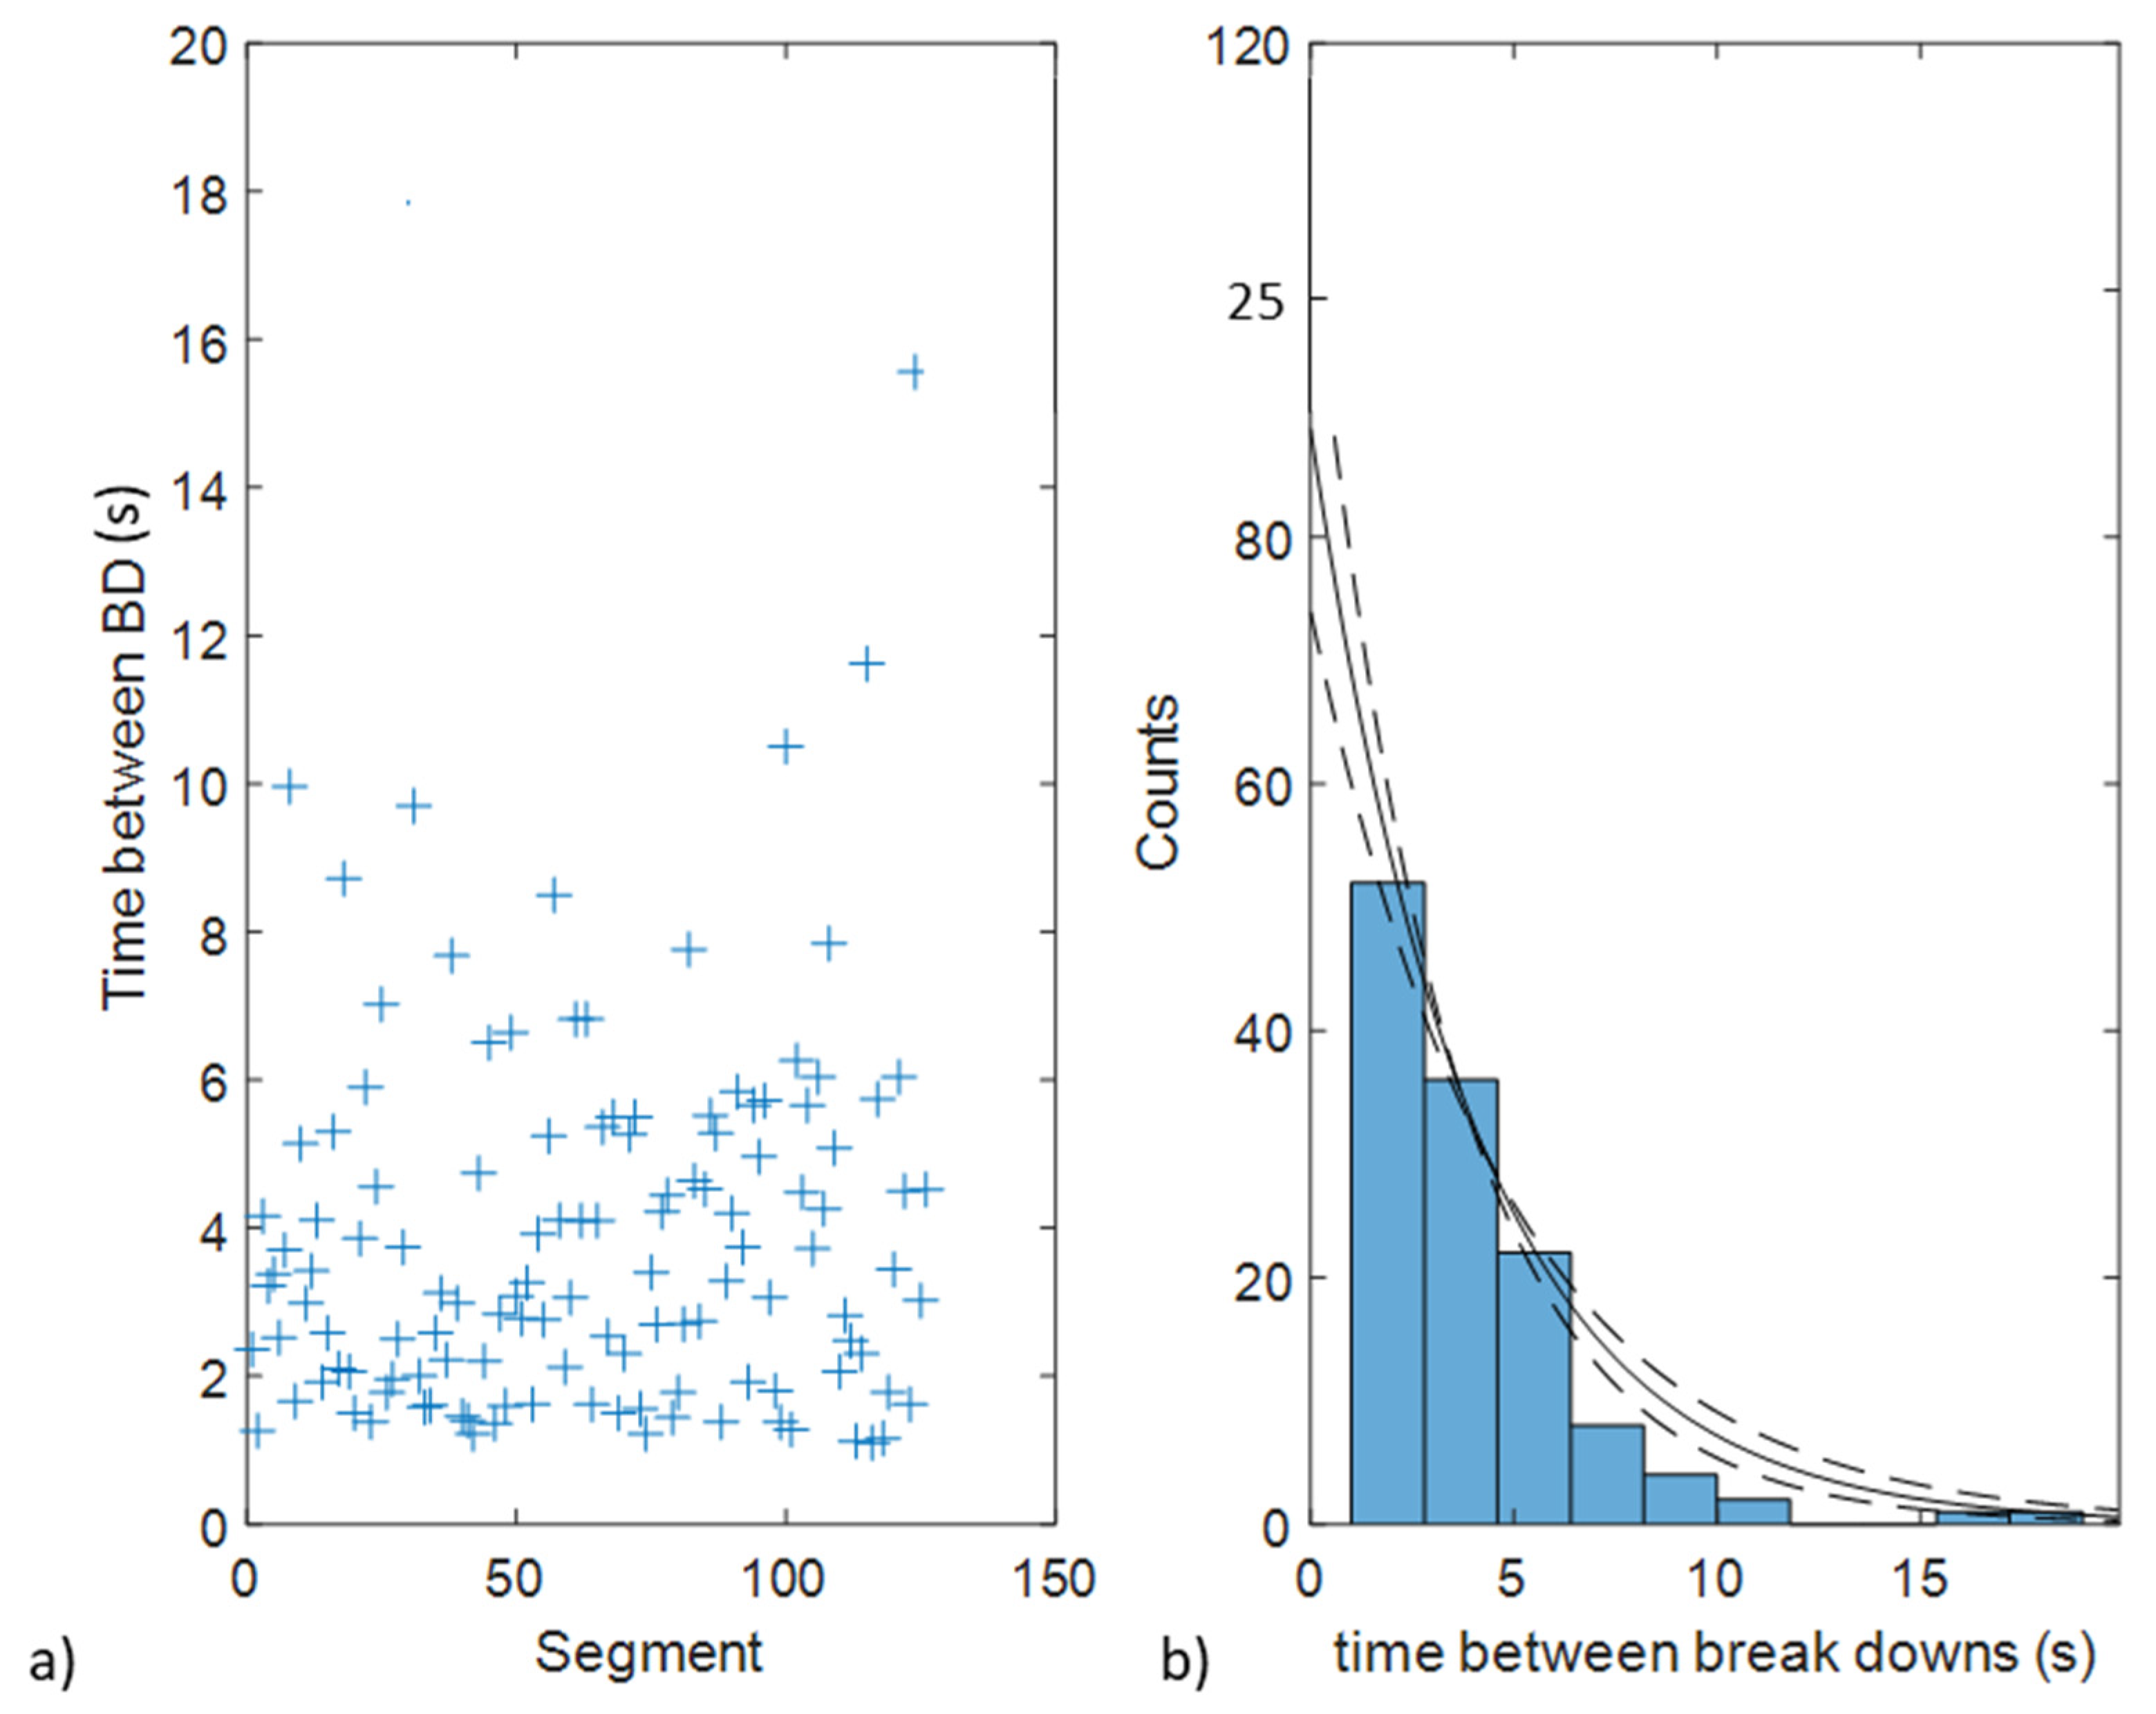
3.2. Analysis of Breakdown Experiments

Figure 4 shows an example of results from a breakdown test series with the concentric electrode test object, set-up 2. The time between breakdowns is plotted in chronological order, see Figure 4a. Figure 4b shows the distribution of time between breakdowns, for which an exponential decay was observed.
This distribution can be fitted by an exponential function
F(t) = exp(−t/m)
with m the mean time between breakdowns and can be interpreted in a way that short time intervals between breakdowns occur more frequently than longer time intervals. It was observed that the mean time between breakdowns depends (in the measured voltage range) exponentially on the applied voltage (U), see Figure 5.
The following equation can be used to fit this data
m ( U ) = 100   ·   exp [ U U 100 s k ]     in   [ s ]  
where U100s is the peak voltage for which the mean time between breakdowns is 100 s and −1/k the slope of the curve in a semi-logarithmic plot. The choice of 100 s as a reference point is arbitrary. In other literature, the breakdown voltage U50, which denotes a 50% breakdown probability, is usually used. This value is typically obtained from measurements performed in a different manner as in this study, i.e., usually U50 is obtained from successive measurements, during which the voltage is increased at a constant rate until breakdown occurs [5,6]. In our study, tests at constant voltage were performed. For sufficiently long voltage application times the mean time between breakdowns can be determined. For moving particles this is a more realistic test method, which allows one to deduce the 50% breakdown probability voltage more generally and for arbitrary voltage application times. The mean breakdown voltage U50 for a given voltage rise can be related to the U100s value as derived in the Appendix A.

4. Results

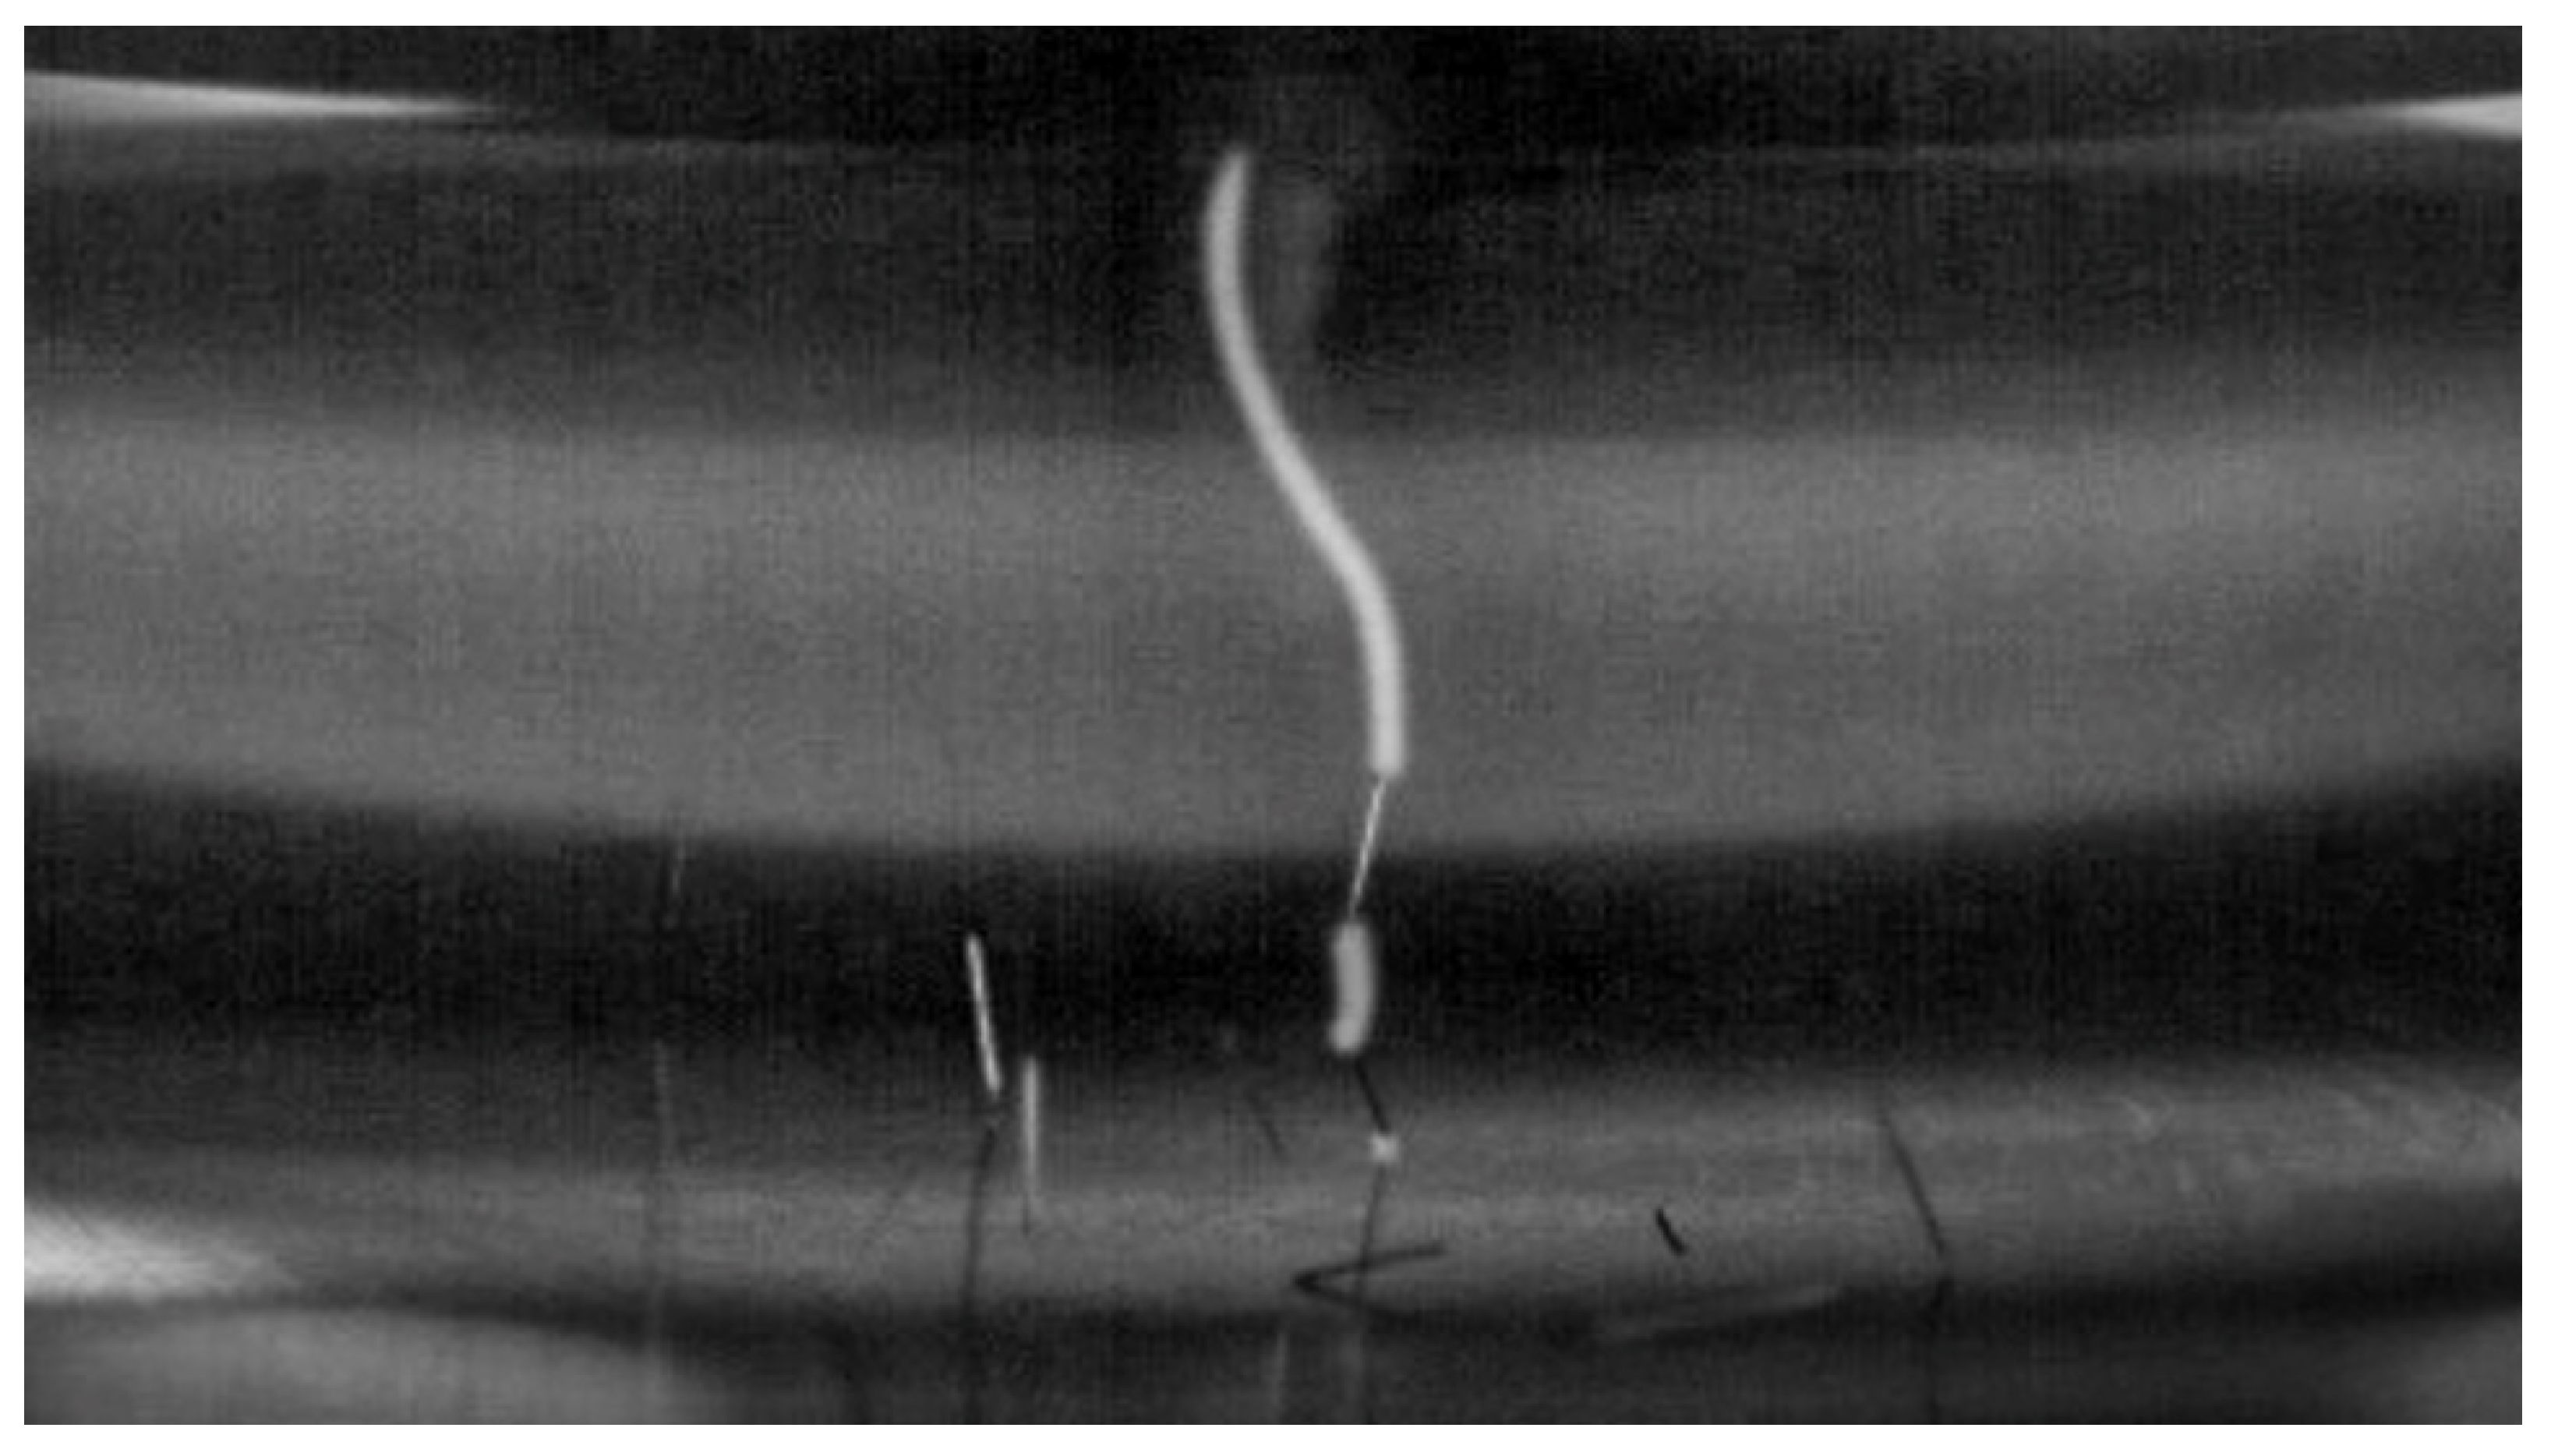
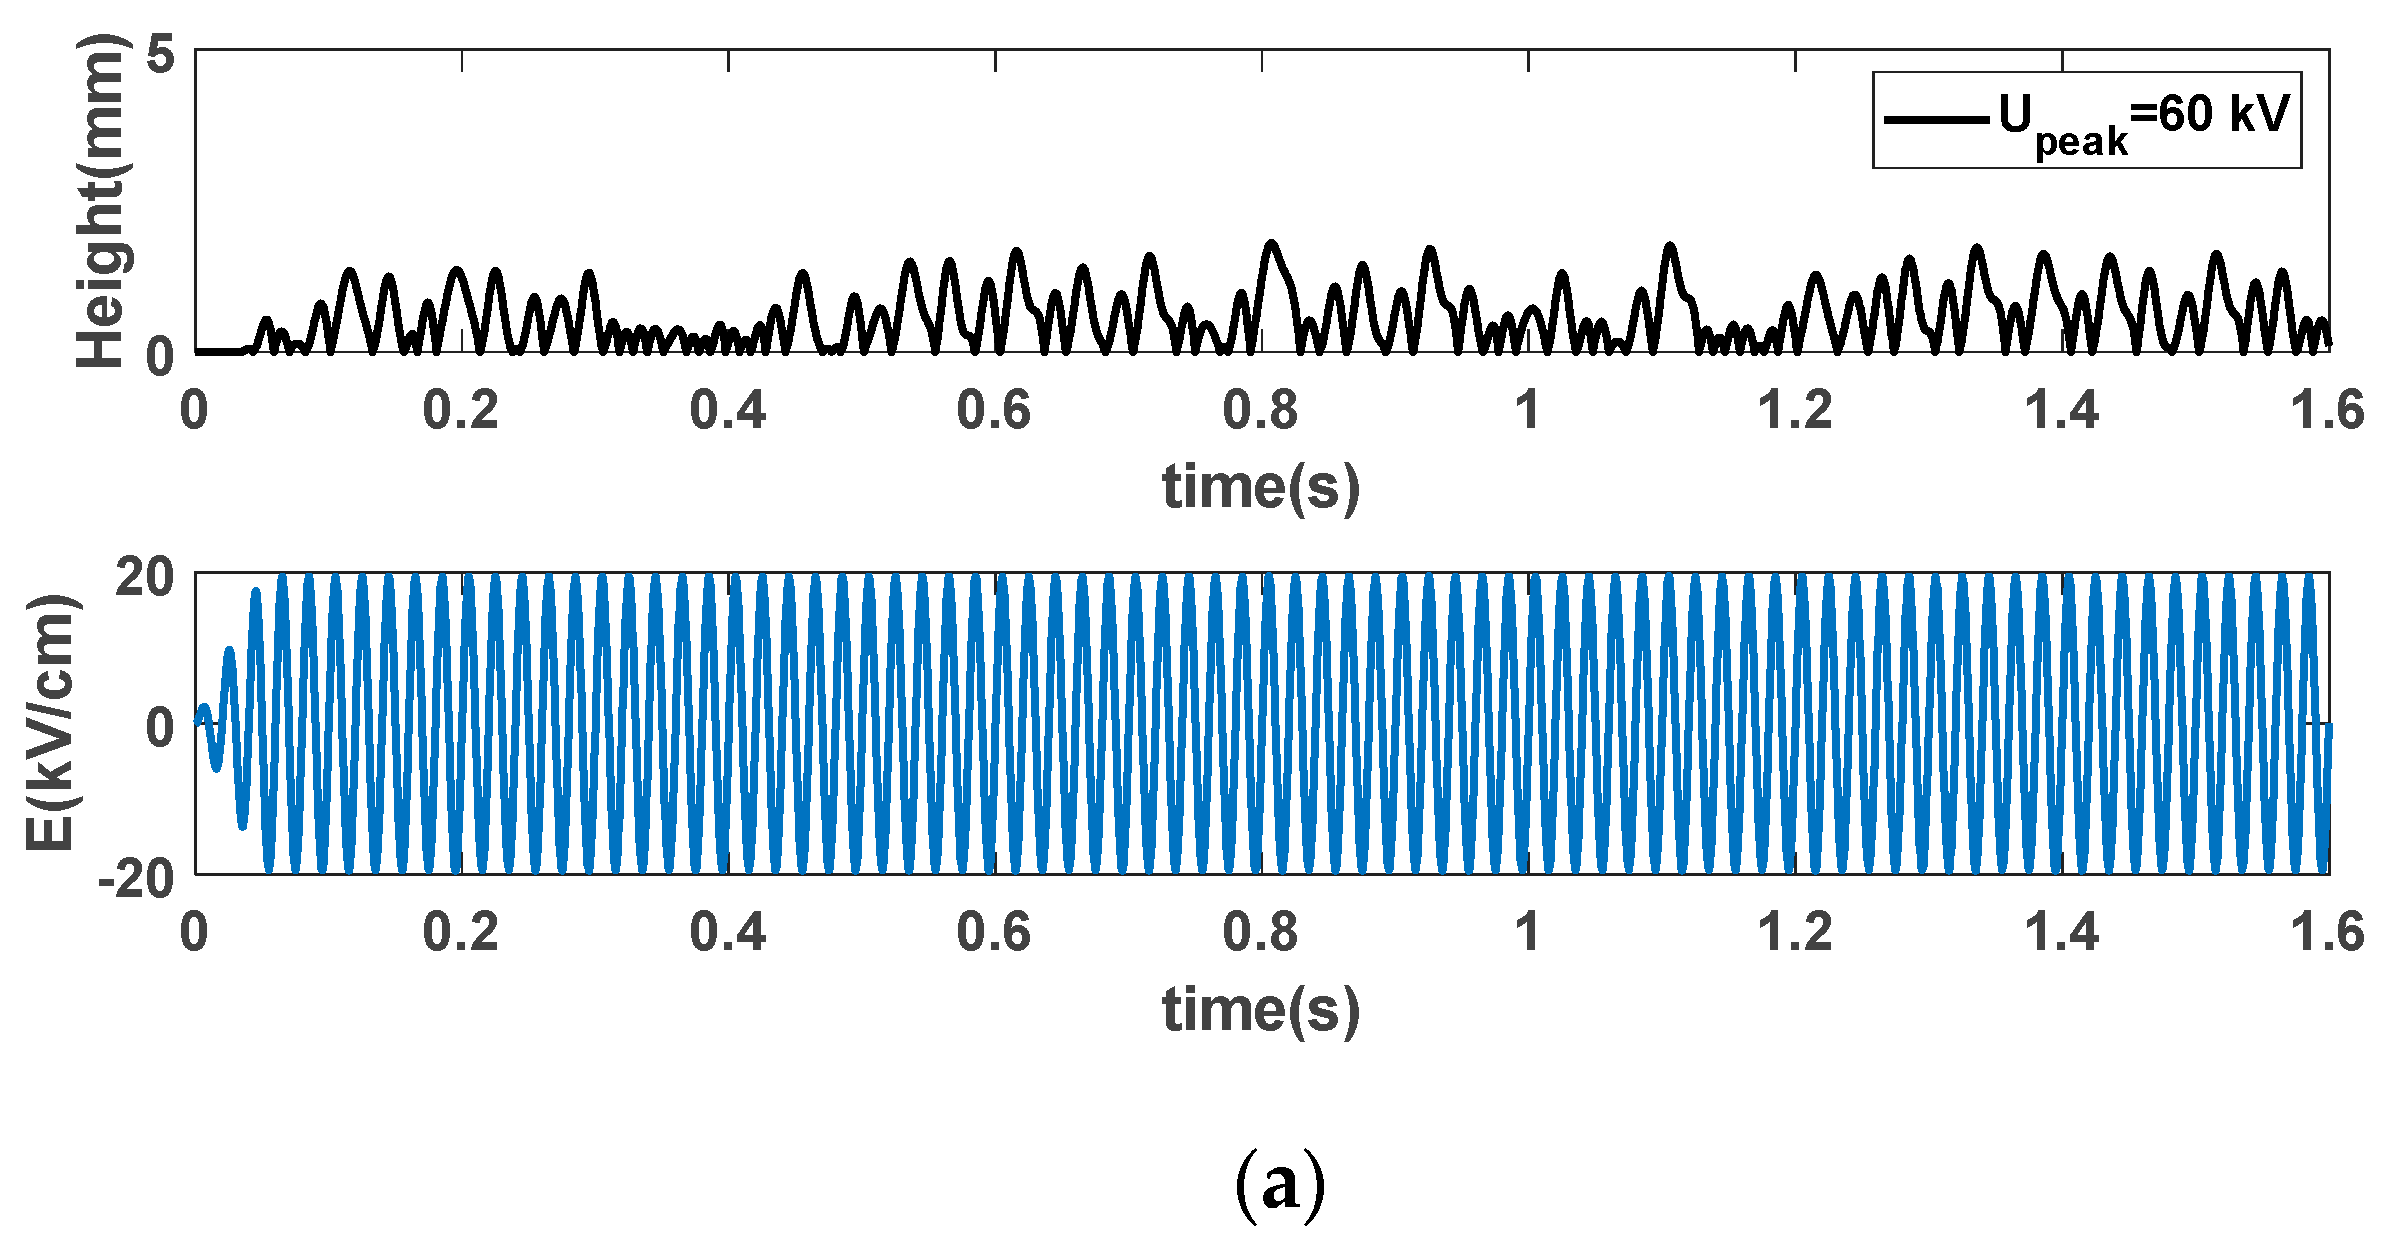
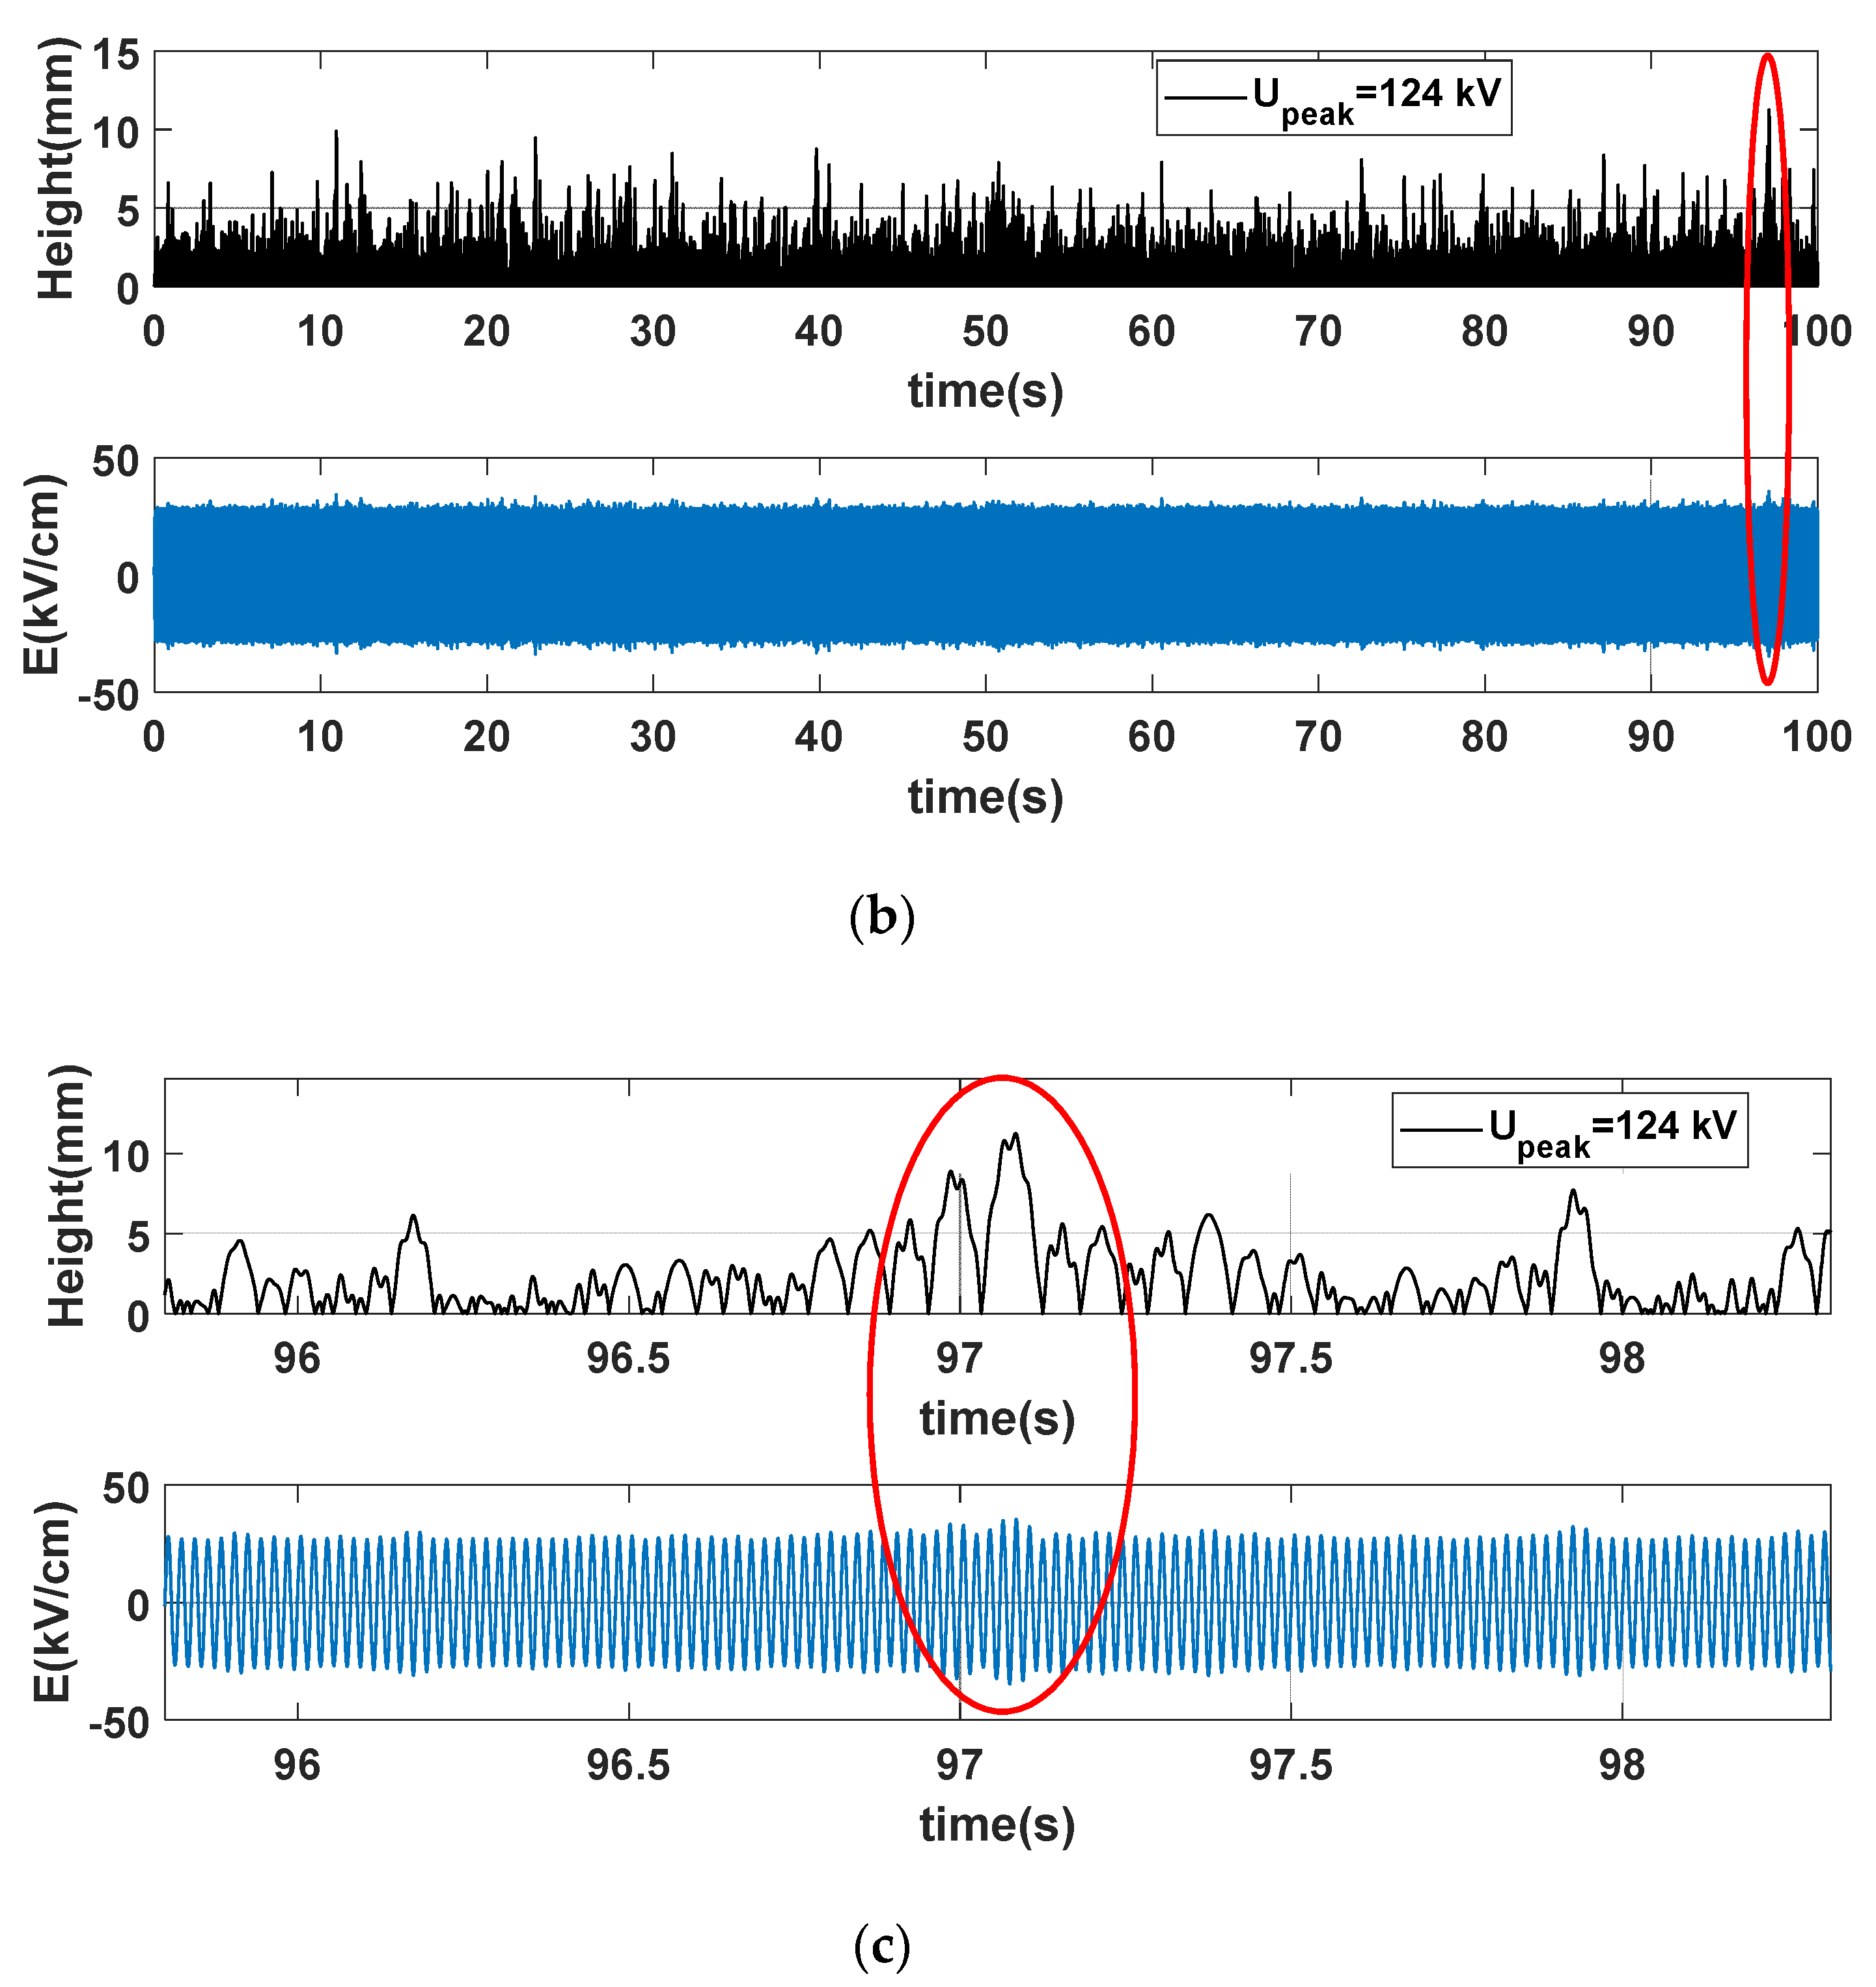
4.1. Results from Optical Observations with Set-Up 1

A series of measurements with a single particle placed on the curved electrode were performed to determine the movement of a 4 mm particle at 0.75 MPa CO2/O2. Using particle tracking methods the trajectories of the particle over time were determined. Examples of the measured trajectory amplitude in the vertical direction vs. time are shown in Figure 6 for three different applied voltages. In the Figures the well-known oscillations of the particle trajectory with the 50 Hz power frequency can be seen, e.g., [14,15], showing the sensitivity of the particle tracking method. With an applied voltage of 60 kV, the particles showed a significant movement height of up to 2 to 4 mm, typically. This voltage was already above the lift-off voltage, which was experimentally observed at around 50 kV. From (2) a lift-off field of about 10 kV/cm was predicted for this case, which results in a voltage of about 32 kV, using the voltage reduced field of 32 1/m at the curved bottom electrode. Discrepancies are assumed to be due to the simplifications of the model and the delay of lift-off in the experiments, e.g., due to the fact that particles have to stand up before lift-off, which requires higher fields [24]. Other influencing factors were surface layers of the particle and electrode and details of particle shape. At 100 kV the particle reached about 10 mm height and at 145 kV the particles nearly crossed the gap and reached 25 mm height, typically. In the next subsection, these observations will be compared to the simulation results for these three voltages, which will serve as validation of the 1D motion model.

4.2. Model Predictions for Set-Up 1

Examples of simulated particle movement at 60, 100, and 145 kV are shown in Figure 7 (top plots). The lower plots in Figure 7 give the electric field strengths at the particle location. For an applied voltage of 60 kV, vertical trajectory heights were about 2 mm, which agrees with the uncertainties with measured heights shown in Figure 6. Similar to the measurements there are only small 50 Hz oscillations visible in the simulations, which is explained by the short time between electrode bounces. Also, at 100 kV (Figure 7b) and 145 kV (Figure 7c), a good agreement with the measured heights is seen. The 50 Hz oscillations on the vertical trajectories were more pronounced in the simulations compared to the measurements (Figure 6), which can probably be explained by the sensitivity of the particle tracking method or by the neglection of a particle in flight charge losses in the model. The peak of the electric field strengths at the particle location in Figure 7 shows only little variation, which is explained by the modest electric field variation in the gap, see Figure 1b. The good agreement of the simulations with the measurements for set-up 1 suggests that the simulations are sufficiently precise to predict particle movements in set-up 2.

4.3. Breakdown Measurements in Set-Up 2

Different breakdown test series were performed with a single freely moving particle in set-up 2. Both the gas and the particle length were varied in the tests. Table 1 shows for each test series the values of U100s, the peak voltage for which the mean time between breakdown is 100 s, and k, the inverse slope of the dependence of mean time between breakdown with applied voltage peak.
Repetition of the test with a 4 mm particle in CO2/O2 shows the good reproducibility of the tests. The U100s value for an 8 mm long particle was lower than for a 4 mm particle, by 44% and 58% for CO2/O2 and SF6, respectively. SF6 at 0.45 MPa showed higher breakdown voltages compared to CO2/O2 at 0.75 MPa: about 28% and 69% higher for 4 mm and 8 mm particles, respectively. The values for k were higher for the two test series with 4 mm particles in CO2/O2 than for the other test series.
Breakdown voltages were experimentally determined not only for a freely moving particle but also for particles attached to the inner or outer electrode, i.e., protrusions at the electrode. The resulting breakdown voltages with a 4 mm particle and CO2/O2 at 0.75 MPa are given in Figure 8. Breakdown occurs at a higher voltage when the particle was attached to the enclosure compared to the situation when it was attached to the inner electrode, see Figure 8 left. Breakdown fields for particles at the enclosure and the inner electrode can be deduced from the U100s to be 35 kV/cm and 49 kV/cm, respectively. For this estimate the background field at the center of the particle was used, which is in voltage reduced units 23 1/m and 48 1/m at the enclosure and inner electrode, respectively. Thus, the different breakdown voltages can be partially explained by the different background fields at the particle location.
For the free particle, the U100s value was in between those of the fixed particles. The k value was significantly larger showing that the decrease of the mean time between breakdown with applied voltage was lower for a free particle compared to a fixed particle. This is shown in Figure 9, where the measurements and fitted curves (using Equation (4)) are plotted.

4.4. Model Predictions for Set-Up 2

As discussed above, in set-up 2 optical observation was not possible. Simulations, similar to those shown in Section 4.2, were performed to gain insight into the particle movement. The simulated particle movements for CO2/O2 at 0.75 MPa with the 4 mm particle at U100s are shown in Figure 10. The maximum particle excursion strongly depends on the simulated duration of voltage application time. Over a short time period (1.6 s), see Figure 10a, the height of particle movement was predicted to be only about 4 mm at maximum. This was different if the voltage application time was 100 s, see Figure 10b. Still, most heights were well below 10 mm, however, in one instance after about 97 s a height of about 11 mm can be seen (marked by the red ellipse in Figure 10b,c. The high amplitude seems to be produced by reflections in resonance with the applied electric field, leading to increasing height over several bounces, until the system runs out of resonance and the amplitude decreases. From the simulations, it can be seen that high particle elevations are rare events. Therefore, the time of voltage application will have a significant influence on the breakdown voltage. The longer the time of voltage application the higher will be the probability of high particle elevations, which might eventually lead to breakdown. Thus, breakdown will only occur with sufficient voltage application time, which is, on the other hand, a function of the applied voltage. This is reflected in a larger value of k for the freely moving particle, see Figure 8 and Figure 9. The maximum height and corresponding electric field strength deduced from the simulation can be compared to the observations from the experiments with particles fixed to the electrodes. In the simulation shown in Figure 10c, the maximum electric field strength at the center of the moving particle is about 35 kV/cm. This field value is the same as experimentally determined for breakdown at the particle fixed to the enclosure. Note that at an applied voltage of 124 kV the electric field at the inner electrode would be about 60 kV/cm, which is much higher than the measured value for the particle fixed to the inner electrode (49 kV/cm). This indicates that gap crossing is not needed for breakdown at the applied voltage peak of 124 kV. If the breakdown would happen at the inner electrode a significantly lower breakdown voltage should be seen in the experiments. Thus, breakdown with the freely moving particle is likely decided by the inter-electrode gap and not at the electrodes. If the elevation of the particle in the gap is sufficient, breakdown can occur.
In order to generate a set of theoretical values for comparison to the experimental data (Figure 9), simulations were done at various voltages for a duration of 2000 s. The number of possible breakdown events, defined by reaching or exceeding the breakdown field of 35 kV/cm at the particle location, was counted. Dividing 2000 s by the number of breakdowns events gives the mean time between breakdowns. This result is shown by the dashed line in Figure 9. The simulated dependency shows a similar mean time between breakdowns as in the experiments. However, the slope is slightly different. For voltages below 120 kV, no breakdown event could be obtained within the simulation time of 2000 s. Longer times could not be simulated due to Matlab memory limitations.
For the other test series, the simulations were run only at the respective experimental U100s value. For the 8 mm particle in CO2/O2 at 0.75 MPa simulations (not shown) were done at U100s = 55 kV. Only small elevations of 1 mm were seen. This suggests that breakdown occurs at lift-off of the particle, i.e., when the particle is standing on the enclosure and sufficiently high voltage is applied. This interpretation is supported by the low value of k in the tests (Table 1) which agrees with those for particles attached to the electrodes (Figure 8). The background electric field strength for the particle standing on the enclosure at 55 kV applied is estimated to be 13 kV/cm, using a voltage reduced field strength of 23 1/m at the center of the particle (Figure 3b). This value is quite uncertain due to the strong field decay over the length of the particle and is probably a lower limit estimate.
Simulation results for SF6 (not shown) were not substantially different compared to CO2/O2 for the same conditions (particle length, diameter, and voltage) i.e., similar particle elevations were observed at the same applied voltages. For the 4 mm particle (U100s = 159 kV), gap crossing was seen over a 100 s simulation time. The electric background field strength at the inner electrode was 76 kV/cm in this case. This indicates that with SF6 the breakdown is decided at gap crossing in set-up 2, i.e., breakdown occurs if the particle reaches the high field electrode and sufficiently high voltage is applied. In this case, the breakdown mechanism would be as for a fixed particle at the inner electrode. The low k value supports this interpretation. For the 8 mm particle in SF6 (U100s = 93 kV) only elevations below 10 mm were seen in the simulations. So, for this long particle, crossing is not needed and a small elevation of the particle in the gap leads to breakdown. Such small elevations occur frequently above lift-off, which could explain the low k value, i.e., the particle behaves like a protrusion. Using the background electric field strength at the enclosure the breakdown field can be estimated to be 21 kV/cm as a lower limit at U100s.

5. Discussion

The experimental investigations supported by the simulations with a 1D model have shown consistent results. In set-up 1, using a close to uniform background field with optical observation, the measured vertical particle trajectories were well described by the simulations using a standard setting for the rebound coefficient R from the literature [19], i.e., without any adjustable parameters. The good agreement gives the confidence to use the model also for set-up 2, where optical access was not possible. In this set-up breakdown experiments were done using CO2/O2 at 0.75 MPa and SF6 at 0.45 MPa with 4 mm and 8 mm particle lengths. For comparison of the results from this study with data from literature obtained with different geometries, one should consider breakdown fields, listed in Table 2, instead of breakdown voltages. Breakdown fields were, as can be expected, higher for SF6 and for shorter particles (e.g., [8,15,19,25]).
Breakdown in SF6 at protrusions and freely moving particles is discussed in [24,26]. Experiments were conducted with a co-axial electrode arrangement (75 mm and 250 mm inner and outer diameter, respectively) with a gap of 89 mm, aluminum particles length of 6.4 mm, and diameter of 0.43 mm were used, see [26]. The measurements were performed by ramping up the voltage (60 Hz) with a rate of 2.3 kV/s. A weak pressure dependence of the breakdown voltage was seen for the free moving particles up to 1.8 MPa. Pronounced corona stabilization effects were seen with the particle fixed to the inner electrode, leading to significantly increased breakdown voltage compared to the free particle. The effect of micro-discharges for free particles was discussed as a possible reason for lower breakdown voltages with the free particle. These micro-discharges might bridge the gap between particle and electrode when the particle approaches the electrode, which leads effectively to an elongation of the particle and corresponding lowering of breakdown voltage. Note that the particle shape will play an important role in the micro-discharges. It was assumed that breakdown with the free particle happened at gap crossing, i.e., at the inner electrode. With such an assumption one can deduce the breakdown field at 0.45 MPa SF6 for the free moving and fixed particle (6.4 mm length and 0.43 mm diameter) to 53 kV/cm and 83 kV/cm, respectively. This is in a similar range as the value deduced for the free particle from our experiments at gap crossing (Table 2), confirming the interpretation that the breakdown decision in our experiments with SF6 and a 4 mm particle occurs at the inner electrode at a sufficiently high applied voltage. Note that the effect of corona stabilization that was seen in [26] might be less for the particles in our investigation due to their shorter length (4 mm) and larger diameter (0.9 mm). This might explain why in our experiments the free particle shows a higher breakdown voltage than the fixed particle at the inner electrode. For the 8 mm particle in SF6, the particle bridges a significant part of the gap, as mentioned before. In this case, micro-discharges, leading to the connection of the particle with the inner electrode, might be more important than for the 4 mm particle. This might explain the low breakdown field for this case.
For breakdown at free moving particles in CO2, less literature information is available compared to SF6. Ref. [19] investigated the particle movement and breakdown under AC voltage in CO2, N2, dry air, and SF6 in a co-axial electrode arrangement with 125/330 mm inner/outer diameter using a 3 mm Al wire of 0.2 mm diameter and 0.55 MPa. Ten particles were placed into the enclosure. In the same fields jump heights were higher in CO2 compared to SF6, and gap crossing fields were lower for CO2 by about 20%. The investigation also observed a linear dependence between the breakdown voltage and time in the semilogarithmic representation. The ratio between crossing and breakdown voltage was about 2.6 in SF6 and 1.45 in CO2, i.e., in SF6 breakdown occurs at higher voltages in relation to crossing compared to CO2. From the given breakdown voltages (60 s) a breakdown field at the inner conductor of 72 kV/cm and 32 kV/cm can be deduced for SF6 and CO2, respectively. This is very similar to our breakdown field estimates with a 4 mm particle, which were 76 kV/cm and 35 kV/cm in SF6 and CO2, respectively, see Table 2. As was shown in [19]; the breakdown voltage dependence on gas pressure is low for this particle length, which might allow one to approximately neglect the pressure differences for this comparison. Ref. [15] compared the breakdown voltages for fixed and moving particles in CO2. For a fixed Al particle in a coaxial arrangement of 90 mm and 340 mm inner and outer electrode diameters, respectively, and particle length and diameter of 10 mm and 0.25 mm, respectively, a breakdown field of 37 kV/cm at the inner electrode can be deduced for CO2 at 0.5 MPa, which is similar to the CO2 value from [19], but lower than our value of 49 kV/cm with a 4 mm particle and 0.75 MPa CO2 at the inner electrode. This seems reasonable due to the larger particle length and differences in field non-uniformity. For the free particle, no breakdown occurred in [15] when the particle was standing on the enclosure at fields up to about 9 kV/cm (test voltage limit). Such fields are lower than our lower limit breakdown field estimates for the 8 mm particle in CO2 (>13 kV/cm). In [27] the AC breakdown in a uniform field was determined for a 3 mm needle with a 100 mm tip radius in a 13 mm gap using CO2 at various pressures. At 0.75 MPa a breakdown field strength of about 35 kV/cm can be deduced, which agrees with the breakdown field of the 4 mm particle attached to the enclosure in set-up 2 of our investigation. Note that the needle used in [27] was slightly shorter, but had also a smaller diameter than our particles. This might compensate, leading to similar breakdown fields.
Important conclusions can be drawn from the analysis of the k values, which describes the dependence of mean time between breakdowns on the applied voltage. For SF6 with 4 mm and 8 mm and CO2 with 8 mm particle lengths, these values agree with those of fixed particles (Table 1). As shown in the Appendix A the parameter k can be associated with the standard deviation s of the cumulative breakdown probability distribution. Thus, a small value of k of a few kV corresponds to steep distribution as it is known for breakdown at protrusions [25,28,29,30]. A large value of k is an indication that statistical processes are different from those of protrusions, leading to a larger width of the probability distribution, see also [25] for a more detailed discussion of the influence of various processes on the breakdown fields and the distribution widths. Based on the results of the present investigation we possibly can explain this, at least partially, by the stochastic movement of the free particles. Or, in other words, in case the stochastic movement is decisive for the breakdown decision it will reflect in a larger value of k. This is the case for the 4 mm particle in CO2 with set-up 2, where the particle needs to move into a high field region in the inter-electrode gap. The simulation could roughly reproduce the mean time between breakdowns for the 4 mm particle in CO2. Not only the stochastic position of the particle will be important for this, but also other processes like the charge on the particle (influencing the field distribution at the tips of the floating particle), the orientation of the particle, and space charge distributions in the gas, etc. For SF6 and 4 mm particles, breakdown is expected to occur when the particle reaches the high field electrode, and a sufficiently high voltage is applied. As far as gap crossing occurs at voltages below those needed for breakdown the particle behaves like a protrusion on the electrode with well-defined potential and correspondingly lower width of the cumulative breakdown probability distribution. Thus, the experimentally determined values for k possibly allow one to draw conclusions on the stochastic processes of breakdown at free particles in GIS.

6. Conclusions

The movement and breakdown of free moving Cu particles under AC voltage was investigated in CO2/O2 and SF6 at 0.75 MPa and 0.45 MPa, respectively. Particle lengths were 4 mm and 8 mm, and the diameter was 0.9 mm. In a first set-up with close to uniform electric field the movement of the 4 mm particle in CO2/O2 at 0.75 MPa was optically observed, which allowed the validation of the simple 1D model described previously [14]. In a second set-up with concentric spheres, which was not optically accessible, the breakdown voltage was determined for the particles under investigation for both gases. The particle movements were simulated for this set-up and the location of particles at breakdown were deduced from the simulations. For the 4 mm particle in CO2/O2, it resulted that breakdown was likely decided in the inter-electrode gap when the particle elevation is sufficient for breakdown at the given applied voltage. To confirm this hypothesis further, breakdown tests were done with the particle fixed to the inner or outer electrode. The breakdown voltage of the free particle was in between those for breakdown at the outer or inner electrode, i.e., a particle attached to the inner electrode was more critical than the freely moving particle in the investigated set-up with CO2/O2 at 0.75 MPa. For SF6 and 4 mm particles the breakdown was likely decided when the particle reaches the opposite electrode in the concentric sphere set-up. This can be explained by the higher breakdown voltage of SF6 compared to CO2/O2, which allows the particle to cross the gap before the field is sufficiently high for breakdown. The 8 mm particle breakdown was decided in both gases when the particle stands and hops on the enclosure electrode. The deduced breakdown fields agree reasonably with literature values, taking into consideration the different experimental conditions, since pressure, particle length, and diameter were not the same as in our investigation. The interpretation of the breakdown locations is supported by an analysis of the dependence of time between breakdowns on the applied voltage, described by the parameter k. As shown in the paper, the characteristic value of k corresponds to the standard deviation of the cumulative breakdown probability distribution. These values were determined in the different experiments and can be linked to the mean time between breakdowns at a given voltage. Low values can be associated with breakdown from the particles at the electrodes, i.e., when free particles behave like a protrusion on the electrode. High values for k occur when the breakdown is decided during particle flight. Then the variations in particle position, orientation, and charging state can lead to a large stochastic scatter of breakdown voltages. The simulations indicate that this scatter is partially produced by rare high elevations of the particle. This can lead to low breakdown voltages for long voltage application times.

Author Contributions

Conceptualization, L.D., M.S. and J.C.; methodology, J.C., D.O. and M.S.; formal analysis, M.S. and J.C.; investigation, J.C. and D.O.; writing—original draft preparation, L.D. and M.S.; writing—review and editing, L.D. and M.S.; project administration, L.D. All authors have read and agreed to the published version of the manuscript.

Funding

This research received no external funding.

Conflicts of Interest

The authors declare no conflict of interest.

Appendix A

In this appendix, the mathematical derivation that permits one to relate results obtained with the test method used in this study (constant voltage test) to voltage ramp tests is presented. Based on Equation (4), the mean breakdown frequency is
f(U) = 0.01 exp ((UU100s)/k).
Assuming a constant ramp rate of the voltage dU/dt, the probability that there is no breakdown (hold) in a short time interval Δt (≪1/f) is given by (1 − f(Ut) and the probability that there is no breakdown in the time from 0 (start of ramp) to the time t is given by
P h o l d ( t ) = i = 1 N = t / Δ t ( 1 f ( U ( i   Δ t ) ) · Δ t ) .
A closed analytic expression for Phold is obtained by turning the expression into a differential equation
P h o l d ( t + Δ t ) = P h o l d ( t ) · ( 1 f ( U ( t + Δ t ) ) · Δ t ) .
Rearranging gives
P h o l d ( t + Δ t ) P h o l d ( t ) Δ t = P h o l d ( t ) · f ( U ( t + Δ t ) ) .
For Δt→0 one obtains the differential equation
d P h o l d ( t ) d t = P h o l d ( t ) · f ( U ( t ) ) = P h o l d ( t ) ·   0.01   Hz   · exp ( t · d U d t U 100 s k ) .  
The solution is
P h o l d = exp [ A · ( exp ( U k ) 1 ) ] ,
with the constant A = 0.01·k/(dU/dt)·exp(−U100s/k). The cumulative breakdown probability distribution is PBD = 1 − Phold. If exp(Uk) ≫ 1, which is well justified for most breakdown experiments, the probability distribution has the form of a Gumbel (minimum) distribution
P ( x ) = 1 exp [ exp ( x μ σ ) ] ,
with the parameters μ = U100sk·log(k/(dU/dt·100s)) and σ = k. This derivation shows that distribution width s is equal to the parameter k and the 50% breakdown probability voltage obtained by the ramp method relates to the parameters used in this study by the following equation
U 50 = U 100 s + k · [ ln ( ln ( 2 ) ) ln ( k d U / d t · 100 s ) ] .

References

  1. Ryan, H.M.; Jones, G.R. SF6 Switchgear; Peter Pelegrinus Ltd.: London, UK, 1989. [Google Scholar]
  2. Arora, R.; Mosch, W. High Voltage and Electrical Insulation Engineering; Wiley-IEEE Press: Piscataway, NJ, USA, 2011. [Google Scholar]
  3. IEC 62271-1 Ed. 1.0 2007-10; International Standard: High-Voltage Switchgear and Controlgear; Part 1: Common Specifications. IEC: Geneva, Switzerland, 2007.
  4. IEEE C37.06-2009.09.11; AC High-Voltage Circuit Breakers Rated on a Symmetrical Current Basis-Preferred Ratings and Related Required Capabilities for Voltages above 1000 V. IEEE: New York, NY, USA, 2009.
  5. Mosch, W.; Hauschild, W. Hochspannungsisolierungen mit Schwefelhexafluorid; VEB Verlag Technik: Berlin, Germany, 1979. [Google Scholar]
  6. Kuechler, A. High Voltage Engineering: Fundamentals-Technology-Applications; Springer: Heidelberg, Germany, 2017. [Google Scholar] [CrossRef]
  7. United Nations Framework Convention on Climate Change. 2014. Available online: https://unfccc.int/ghg_data/items/3825.php (accessed on 4 April 2018).
  8. Seeger, M.; Smeets, R.; Yan, J.; Ito, H.; Claessens, M.; Dullni, E.; Franck, C.M.; Gentils, F.; Hartmann, W.; Kieffel, Y.; et al. Recent development and interrupting performance with SF6 alternative gases. Electra 2017, 291, 26–29. [Google Scholar]
  9. Tian, S.; Zhang, X.; Cressault, Y.; Hu, J.; Wang, B.; Xiao, S.; Li, Y.; Kabbaj, N. Research status of replacement gases for in power industry. AIP Adv. 2020, 10, 050702. [Google Scholar] [CrossRef]
  10. Li, X.; Zhao, H.; Murphy, A.B. SF6-alternative gases for application in gas-insulated switchgear. J. Phys. D 2018, 51, 153001. [Google Scholar] [CrossRef]
  11. Rabie, M.; Franck, C.M. Assessment of eco-friendly gases for electrical insulation to replace the most potent industrial greenhouse Gas SF6. Environ. Sci. Technol. 2018, 52, 369–380. [Google Scholar] [CrossRef] [PubMed] [Green Version]
  12. CIGRE. Study Committee D1, Technical Brochure 226, WG D1.11. Knowledge Rules for Partial Discharge Diagnosis in Service. 2003. Available online: https://e-cigre.org/publication/ELT_207_8-knowledge-rules-for-partial-discharge-diagnosis-in-service (accessed on 2 March 2022).
  13. CIGRE. Study Committee D1. Technical Brochure 525, WG D1.03. Risk Assessments on Defects in GIS based on PD Diagnostics. 2013. Available online: https://www.researchgate.net/publication/260421756_Risk_Assessment_on_Defects_in_GIS_Based_on_PD_Diagnostics (accessed on 2 March 2022).
  14. Niemeyer, L.; Seeger, M. Universal features of particle motion in ac electric fields. J. Phys. D 2015, 48, 435501. [Google Scholar] [CrossRef]
  15. Onomoto, M.; Nishimura, T.; Teshima, T.; Ohtsuka, S.; Matsumoto, S.; Tsuru, S.; Tanimura, A.; Hikita, M. Study on metallic particle motion and partial discharge characteristics in a GIS tank filled with CO2 and SF6. IEEJ Trans. Fund. Mater. 2005, 125, 71–76. [Google Scholar] [CrossRef]
  16. Wiener, J.; Hinrichsen, V.; Wacker, D.R.; Groll, F.; Juhre, K. Investigation of free-moving particles under AC electric field in different insulating gas mixtures. IEEE Trans. Dielectr. Electr. Insul. 2020, 28, 672–680. [Google Scholar] [CrossRef]
  17. Widger, P.; Carr, D.; Reid, A.; Hills, M.; Stone, C.; Haddad, A. Partial Discharge measurements in a high voltage gas insulated transmission line insulated with CO2. Energies 2020, 13, 2891. [Google Scholar] [CrossRef]
  18. Yoshida, T.; Inami, K.; Shimizu, Y.; Hama, H.; Ueta, G.; Wada, J.; Okabe, S. Sparkover and partial discharge properties initiated by mobile metallic particles at ac voltages in N2, CO2, dry air and SF6. In Proceedings of the 21st International Conference on Gas Discharges and their Applications, Nagoya, Japan, 11–16 September 2016. [Google Scholar]
  19. Yoshida, T.; Ka, S.; Shimizu, Y.; Inami, K.; Hama, H.; Ueta, G.; Wada, J.; Okabe, S. Metallic particle motion and its sparkover property at AC voltages in N2, CO2, dry air and SF6. In Proceedings of the 9th International Workshop on High Voltage Engineering, Okinawa, Japan, 7–8 November 2014. [Google Scholar]
  20. Pirker, A.; Schichler, U. Partial discharges of defects in different insulating gases: N2, CO2, Dry air and SF6. In Proceedings of the 12th International Conference on the Properties and Applications of Dielectric Materia (ICPADM), Xi’an, China, 20–24 March 2018. [Google Scholar]
  21. Wang, G.; Kim, W.-H.; Kil, G.-S.; Kim, S.-W.; Jung, J.-R. Green gas for a grid as an eco-friendly alternative insulation gas to SF6: From the perspective of partial discharge under AC. Appl. Sci. 2019, 9, 651. [Google Scholar] [CrossRef] [Green Version]
  22. Natsume, D.; Inami, K.; Hama, H.; Oda, S.; Yoshimura, M.; Miyamoto, T.; Hanaoka, R.; Fukami, T. Development of numerical computation model for revolving metal particles behavior in GIS and its evaluation. Electr. Eng. Jpn. 2005, 153, 228–238. [Google Scholar] [CrossRef]
  23. Holmberg, M. Motion of Metallic Particles in Gas Insulated Systems. Ph.D. Thesis, Chalmers Technical University, Göteburg, Sweden, 1997. [Google Scholar]
  24. Wootton, R.E. Investigation of High-Voltage Particle-Initiated Breakdown in Gas-Insulated Systems; Final Report EPRI-EL-1007; Westinghouse Research and Development Center: Pittsburgh, PA, USA, 1979. [Google Scholar] [CrossRef]
  25. Feet, O.C.; Seeger, M.; Over, O.; Niayesh, K.; Mauseth, F. Breakdown at multiple protrusions in SF6 and CO2. Energies 2020, 13, 4449. [Google Scholar] [CrossRef]
  26. Cookson, A.H.; Farish, O.; Sommerman, M.L. Effect of conducting particles on AC corona and breakdown in compressed SF6. IEEE Trans. Power Appar. Syst. 1972, 91, 1329–1338. [Google Scholar] [CrossRef]
  27. Nechmi, H.E.; El Amine Slama, M.; Haddad, M.; Wilson, G. AC volume breakdown and surface flashover of a 4%NovecTM 4710/96% CO2 gas mixture compared to CO2 in highly nonhomogeneous field. Energies 2020, 13, 1710. [Google Scholar] [CrossRef] [Green Version]
  28. Seeger, M.; Avaheden, J.; Pancheshnyi, S.; Votteler, T. Streamer parameters and breakdown in CO2. J. Phys. D 2017, 50, 1–15. [Google Scholar] [CrossRef]
  29. Seeger, M.; Niemeyer, L.; Bujotzek, M. Partial discharges and breakdown at protrusions in uniform background fields in SF6. J. Phys. D 2008, 41, 185204. [Google Scholar] [CrossRef]
  30. Okabe, S.; Goshima, H.; Tanimura, A.; Tsuru, S.; Yaegashi, Y.; Fujie, E.; Okubo, H. Fundamental insulation characteristic of high-pressure CO2 gas under actual equipment conditions. IEEE Trans. Dielectr. Electr. Insul. 2007, 14, 83–90. [Google Scholar] [CrossRef]
Figure 1. (a) Photograph of test set-up 1. High voltage and ground electrodes are indicated by HV and GND respectively. (b) Numerical simulation of the electric field distribution in set-up 1, the curved electrode vs. Rogowski electrode configuration with 30 mm gap. (c) Electric field strength decay along the axis of symmetry, indicated by the red arrow in (b).
Energies 15 02804 g001
Figure 2. Picture of a breakdown in set-up 1 with 10 particles (0.75 MPa CO2/O2). Three particles were involved in the breakdown.
Energies 15 02804 g002
Figure 3. (a) Photograph of the electrodes of set-up 2. (b) Numerical simulation of the electric field distribution in set-up 2, the concentric electrode configuration with a 30 mm gap. (c) Electric field strength decay along the axis of symmetry indicated by the red arrow in (b).
Energies 15 02804 g003aEnergies 15 02804 g003b
Figure 4. (a) Time interval between successive breakdowns (BD) observed at 100 kVpeak for a 4 mm free particle in the concentric sphere electrode arrangement filled with 0.75 MPa CO2/O2, and (b) histogram of the time between breakdowns fitted with an exponential distribution function.
Energies 15 02804 g004
Figure 5. Mean time between breakdown as a function of the applied voltage peak for a 4 mm free particle in the concentric sphere electrode arrangement filled with 0.75 MPa CO2/O2. U100s is the peak voltage for which the mean time between breakdowns is 100 s. The bars indicate the 95% confidence intervals.
Energies 15 02804 g005
Figure 6. Vertical particle trajectories for a particle with 4 mm length and 0.9 mm diameter in 0.75 MPa CO2/O2, determined from video images for 60, 100, and 145 kVpeak applied voltage. The noise results from uncertainties of the particle tracking procedure at small amplitudes. The uncertainty of the determined heights was estimated to be about 2 mm.
Energies 15 02804 g006
Figure 7. Simulated movements for a 4 mm particle in set-up 1 filled with CO2/O2 at 0.75 MPa. Applied voltage 60 (a), 100 (b), and 145 kVpeak (c). Particle vertical movement (top plots) and electric field strength at the center of the particle location (bottom plots). In the simulations the voltage was ramped up to the maximum voltage within 50 ms.
Energies 15 02804 g007aEnergies 15 02804 g007b
Figure 8. U100s (a) and k (b) values for the tests in CO2 at 0.75 MPa, with the 4 mm particle either free, or attached to the inner electrode or the enclosure in set-up 2.
Energies 15 02804 g008
Figure 9. Mean time between breakdown in set-up 2 as a function of the applied voltage for a 4 mm particle in CO2/O2 at 0.75 MPa, attached to the enclosure, to the inner electrode, or freely moving. The error bars indicate the 95% confidence interval. The solid lines give fits to the data (4). The dashed line is from simulations (see Section 4.4).
Energies 15 02804 g009
Figure 10. Simulated particle movements in CO2/O2 at 0.75 MPa with a 4 mm particle length and 0.9 mm diameter in set-up 2 at applied voltage peak of 124 kV, top plots. (a) Simulations over 1.6 s voltage application time. (b) Simulations over 100 s voltage application time. Details of the event at around 97 s are shown in (c). In the simulations the voltage was ramped up to the maximum voltage within 50 ms. The lower plots show the electric field strength at the center of the particle location.
Energies 15 02804 g010aEnergies 15 02804 g010b
Table 1. U100s and k values for the tests with a single free particle in set-up 2.
GasParticle Length (mm)U100s (kV)k (kV)
CO2/O2, 0.75 MPa412418
CO2/O2, 0.75 MPa412413
CO2/O2, 0.75 MPa8554
SF6, 0.45 MPa41592
SF6, 0.45 MPa8935
Table 2. Breakdown field values for the tests with a single free particle in set-up 2.
GasParticle Length (mm)Particle LocationBreakdown Field * (kV/cm)
CO2/O2, 0.75 MPa4free35
CO2/O2, 0.75 MPa4enclosure35
CO2/O2, 0.75 MPa4inner electrode49
CO2/O2, 0.75 MPa8free13
SF6, 0.45 MPa4free76
SF6, 0.45 MPa8free21
* For the free particles, the field at the center of the particle for the maximal elevation observed in the simulations.
Publisher’s Note: MDPI stays neutral with regard to jurisdictional claims in published maps and institutional affiliations.

