1. Introduction
The smart grid industry is expected to be worth roughly USD 162.4 billion by the horizon of 2030, according to Precedence Research, with a CAGR of 18.2% from 2021 to 2030. This huge growth in this industry requires the training of highly qualified technical professionals in the smart grid field. The smart grid components are a hybridization between multi transversal disciplines, for example electrical, energy, automation, Internet of Things, networking, optimization, and machine learning engineering, for which the technical expert must be polyvalent and must be trained in the new ways of hybrid skills.
Universities and engineering institutes are racing to deliver high-quality smart grid technical engineers to solve energy problems, and for powerful management in a currently high state of energy demand, the struggle is to select the best software to use, in order to give technical courses and simulations. This software is very limited, for which the student can see one or two components but can never hybridize these skills and apply them in a real case study, such as a hardware application with a high-cost and low-limited functionality. Professors, instructors, and laboratory technicians find difficulties selecting the best fitting equipment that is modular, easy to maintain, and has multiple features.
Therefore, it is mandatory to find a solution which is frugally innovated, has the same or better functionalities, a simple design, and a low-cost budget, knowing that from USD 50.5 billion in 2016, the global market for educational hardware and software has grown to USD 110.9 billion in 2022 and will be USD 121.3 billion in 2025, according to BCC Research.
As a result of recent breakthroughs in Information and Communication Technologies (ICTs), a digital transition is underway. This is having a beneficial influence on every element of the technological world, allowing for connectedness and ubiquity that were previously unimaginable. As a result, the line between the real and digital worlds ais becoming increasingly blurred. New trends are emerging because of these advancements, including the Internet of Things (IoT), cyber-physical systems (CPSs), Big Data, cloud computing, Industry 4.0, and smart grids (SGs). Engineering efforts are heavily focused on methods to achieve a more dependable and efficient distribution system [
1]; and because of these efforts, smart grid research now provides a variety of working areas for integrating contemporary technology into existing infrastructure [
2].
The goal of this paper is to design an initial prototype of the smart grid educational test bench, using model-based system engineering for complex systems, in order to define the technical requirements of the system, the principal users, and the stakeholders of the test bench. The MBSE study helps to better design the system and better control the scope or the goal of the system.
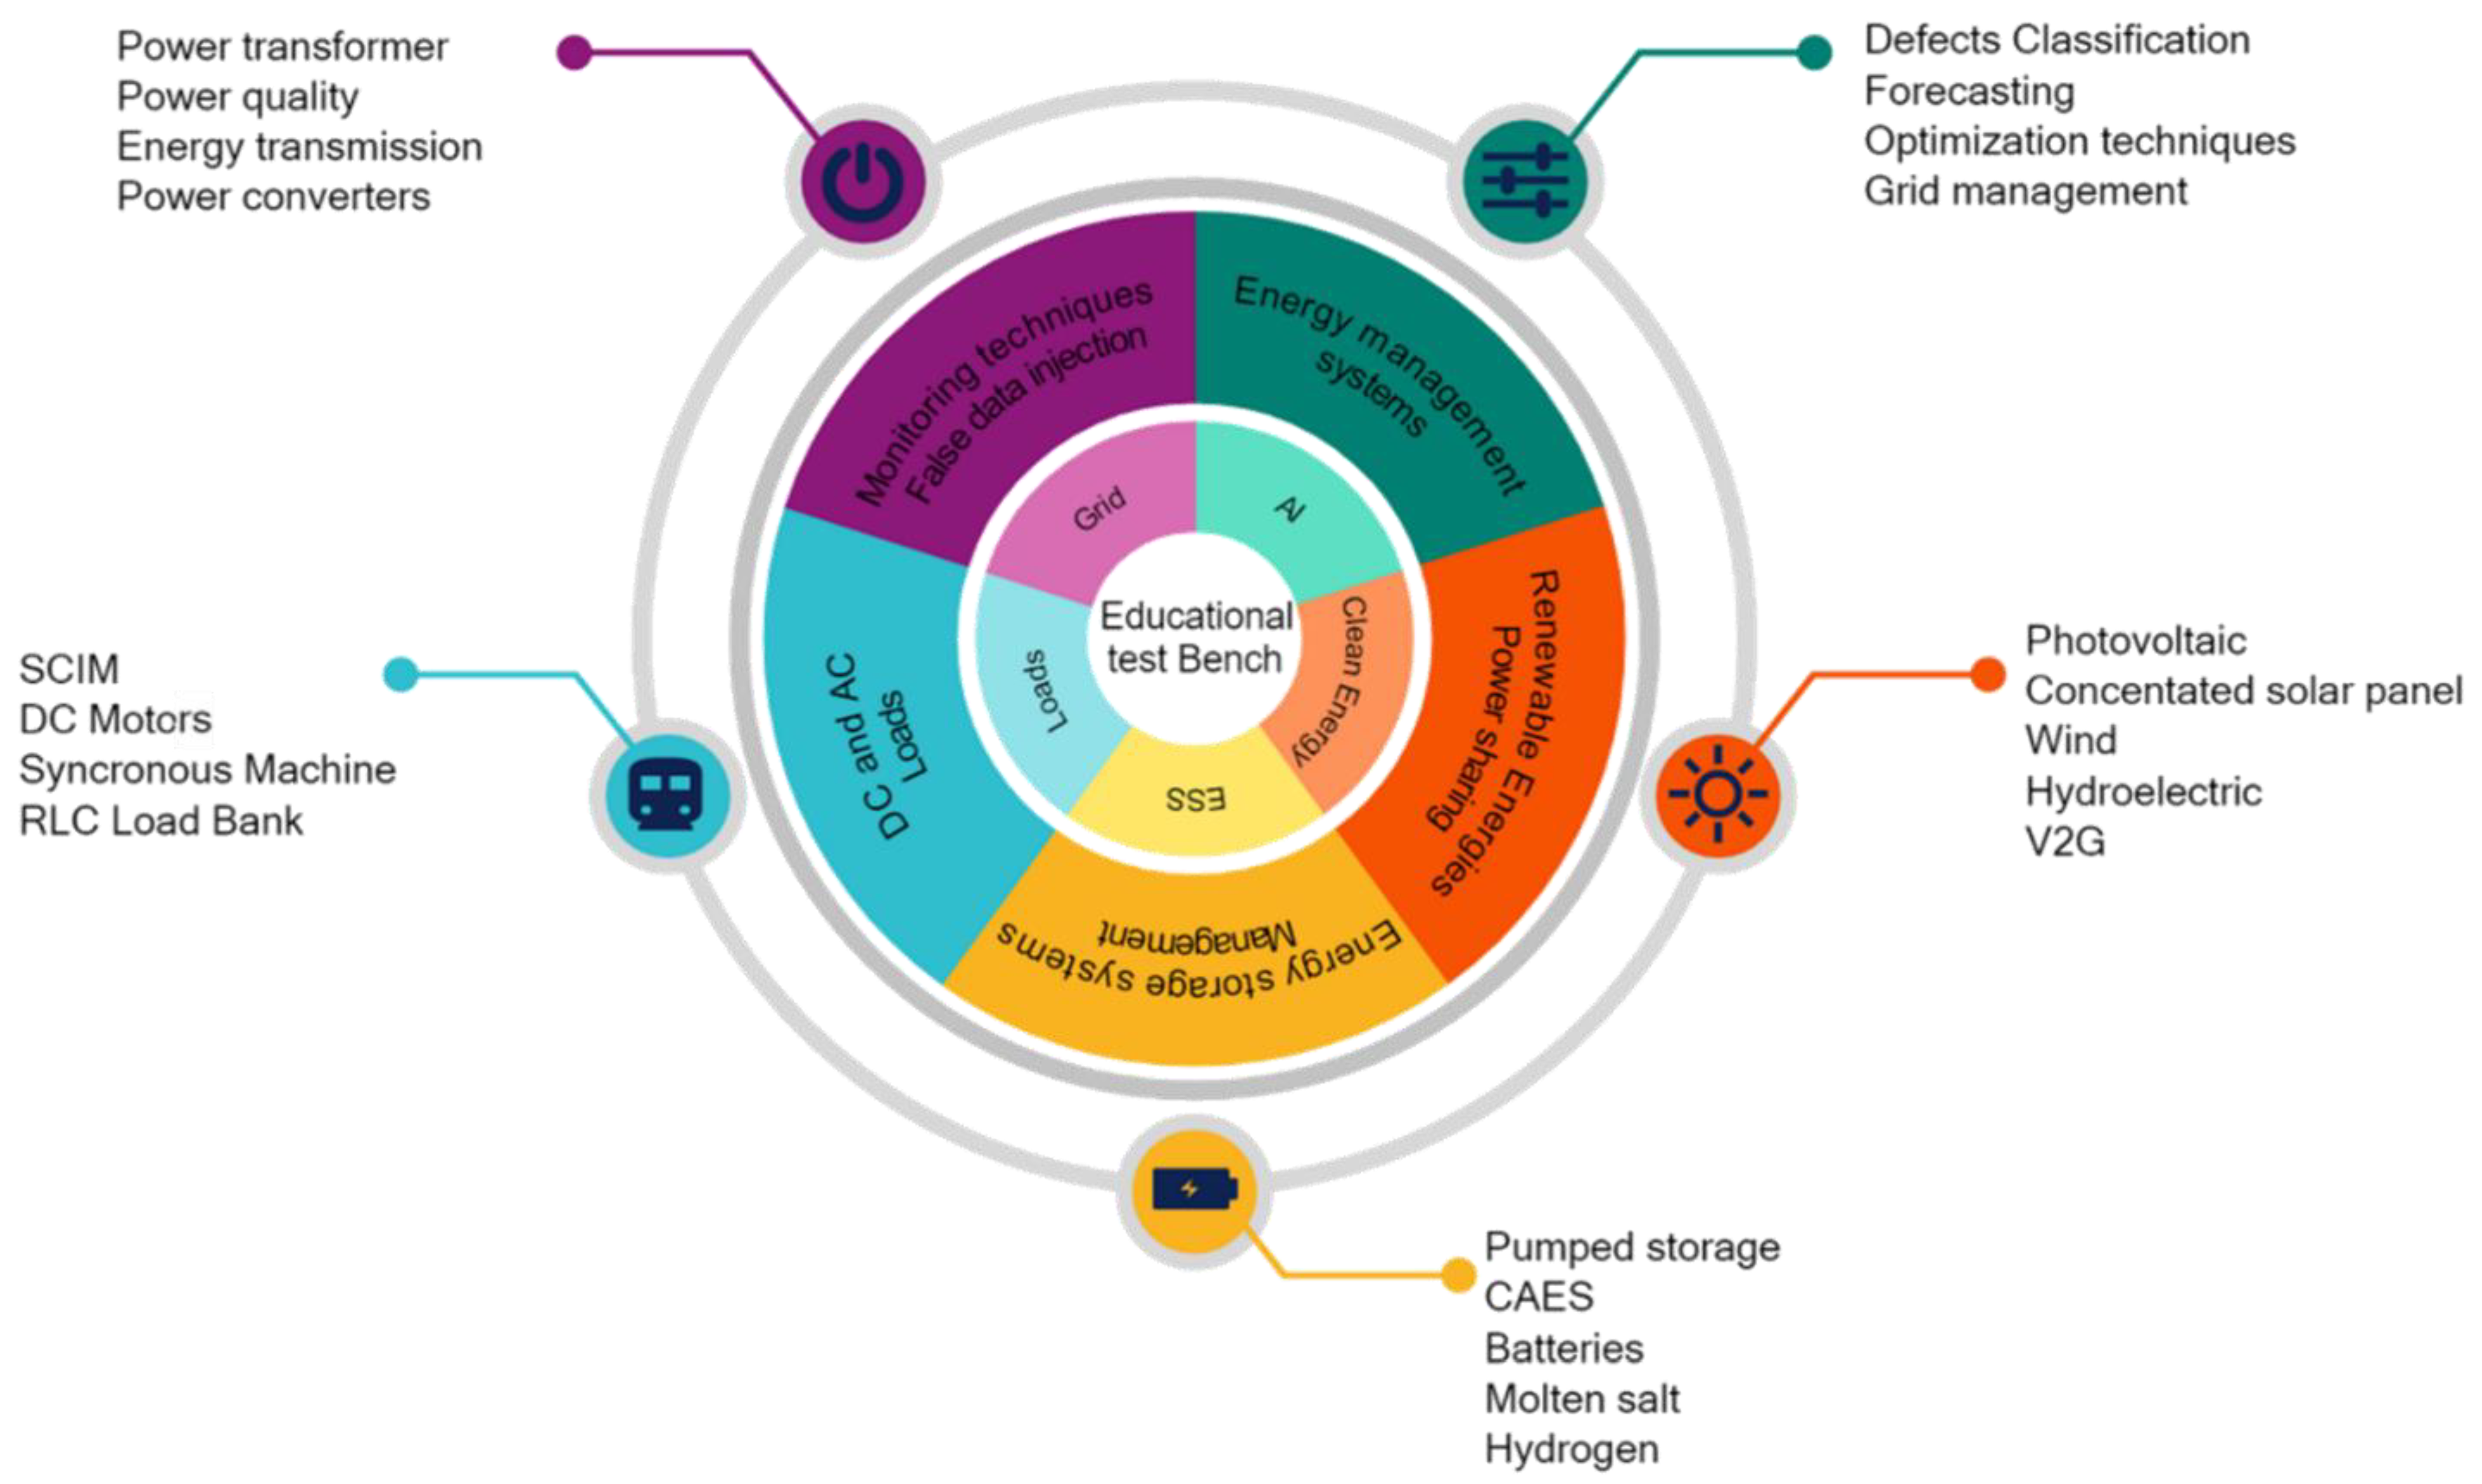
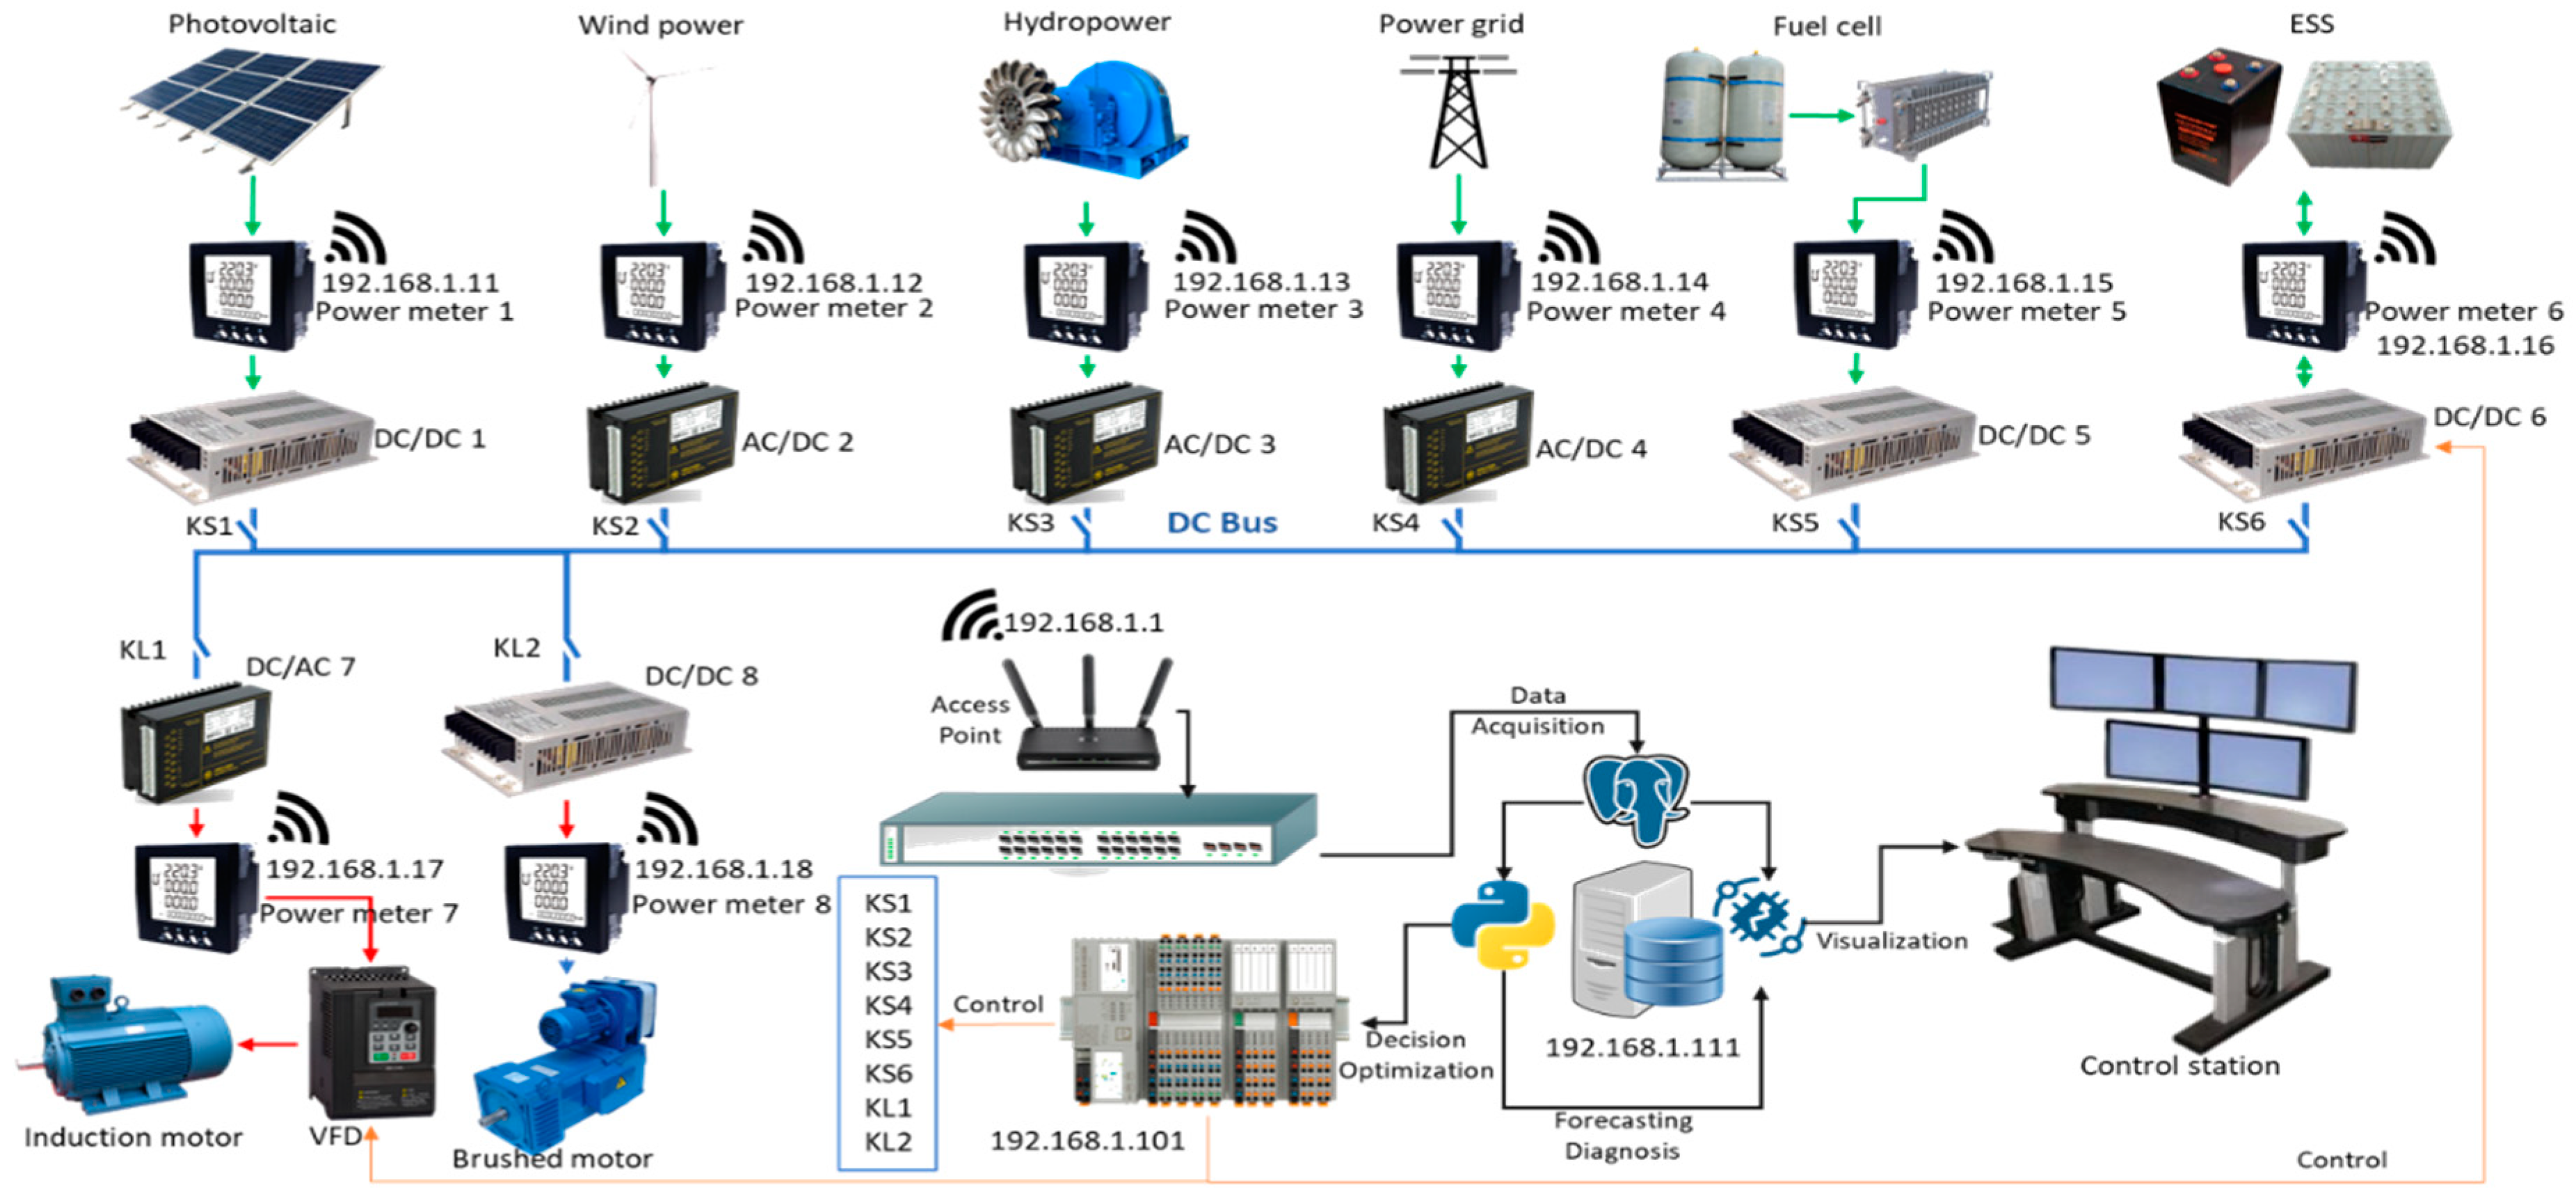
The idea, as elucidated in
Figure 1, is to develop an educational test bench where the students can learn about the multiple renewable sources such as photovoltaic power, concentrated solar power, wind power, hydroelectric power plants, and the integration of vehicle-to-grid methods, to study the behavior of each energy on the grid. The test bench introduces different types of energy storage systems, such as pumped storage, compressed air energy storage, batteries, molten salt, and hydrogen.
The test bench offers case studies on different electrical loads, such as squirrel-cage induction motors, direct current motors, synchronous machines, and RLC load banks, to learn the characteristics of each load and its impact on the grid. The consumed, produced, or stored energy will be inputs for energy management systems for which the student can build intelligent algorithms to optimize the energy consumption, detecting defected components and forecasting energy production and consumption. In other case studies, the user can learn the different monitoring techniques for power quality, the state of converters, etc., as well as the false data injection to test cybersecurity in the smart grid.
The goal of this article is to show how to design an open-source smart grid test bench for educational purposes, with multiple features which are newly used in smart grids as solutions to manage energy in a smart way, increasing the efficiency, availability, and grid reliability. According to the state-of-the-art research given in this article, these features focus on the use of monitoring systems for energy production, transmission, and consumption, using multiple automation equipment and frameworks, sensors, smart meters, and SCADA systems, in order to gather or collect different data, visualize them, and store them in a database. These data will be used for machine learning algorithms that can predict the consumption and the production, classifying defects of different grid components, and optimizing the energy. Introduction of the model-based system engineering (MBSE) approach to collect the gather requirements will be presented in this article, in order to make the design and the selection of the components clear and easy to apply. General simulations will be presented in this paper, focusing on how the test bench features will be functioning with some user stories.
2. The State of the Art
Smart grids are the next generation of power grids that emerged as the digital transformation applied to the energy industry. They are defined as a modern electric power grid infrastructure for improved efficiency, reliability, and safety, with a smooth integration of renewable and distributed energy sources through automated and distributed controls, modern communication, and sensing technologies [
1]. This enhancing process is coherent with the goals of Advanced Distribution Automation (ADA), and the continuous evolution of the research will enable the building of optimal grids of the future. Such challenges have been clearly defined in research and standardization as well: in grid equipment monitoring, fault location, isolation [
2] and restoration [
3], inclusion of renew-able energy, electric vehicles, grid reconfiguration [
4], adaptive protections, volt and var control, metering, event recording, and communications infrastructure are some of the examples of research priorities. The attempt to improve reliability and power quality involves several applications on the smart grid, which requires an important set of protection devices to monitor and control multiple relaying functions. This context has always been a priority in power engineering education [
5,
6], and numerous advances are widely recognized in the last years of modeling [
7], simulation [
8], and laboratory platforms [
9,
10]. In consequence, the teaching approaches of power engineering and protective relaying control have turned into a constant innovative evolution; certainly, the role of digital modeling and simulation is encouraging all the teaching efforts to form a new generation of students who are well prepared for the smart grid challenges, applications, and research [
11].
Because of the unavailability of an inexpensive and changeable hardware platforms, a majority of power electronics control education and training is simulation-based. The introduction of hardware-in-the-loop (HIL) simulation has made it simpler to produce simulation findings that are similar to those obtained in real tests. Hardware-in-the-loop simulation systems, on the other hand, continue to be expensive. While computer simulations do mimic the behavior of actual systems to some extent, they cannot adequately model or study numerous practical difficulties. Physical experiments should be an integral element of training for next-generation power electronics engineers and leaders, since they are the greatest approach for representing the dynamics and features of real applications. Two significant difficulties must be addressed in order for this to happen: the availability of adequate hardware platforms and the reduction of software development load. After multiple revisions, it normally takes a trained individual several months to set up an experimental system. In addition, various topologies often necessitate distinction of new hardware designs. When it comes to software coding, it is usually someone else’s job; it is tough for a hardware engineer to create codes. A beginner’s understanding of the programming platform and the target machine might take months or even years. Furthermore, debugging code might take a long time. This is especially true in the control community, due to the emphasis on creating control algorithms and, in comparison, the rarity of some certain skills [
12].
Another significant issue to address is the financial commitment required to install the SGs on a big scale. To operate properly, these facilities require not only the management of energy generation and consumption equipment, but also a multitude of sensors, actuators, and controllers [
13]. These gadgets come with not just purchase prices, but also configuration and connecting charges. Two approaches are gaining traction and can be used to address these difficulties. On the one hand, dealing with such diversity is difficult. The Open Platform Communications (OPC) protocol is a communication interface for the industry. It provides a platform for control and automation applications to facilitate interoperability and heterogeneity [
14].
In terms of open-source hardware, the Raspberry Pi, BeagleBone, Phidget, Intel Edison, and Arduino boards are examples. Arduino, a low-cost, single-board microcontroller, is the most obvious example. In terms of R&D and academic activities, Arduino has become a strong instrument for developing various applications in the domains of data acquisition, automation, and engineering in general [
15]. Consequently, it has no sense orchestrating SGs/SMGs without integrating both devices in SCADA systems used in current industrial practice [
13]. Therefore, PLC and Arduino must converge within an interoperable approach, under industrial supervisory systems [
13].
In [
12], The SYNDEM Smart Grid Research and Educational Kit, a reconfigurable, open-source, multifunctional power electronic converter with the ability to directly download codes from Matlab/Simulink, is introduced with the goal of assisting researchers, graduate students, and engineers in moving from simulations to experiments for various power electronic-based systems. This eliminates two significant obstacles faced by the control community in conducting experiments for power and energy systems: a lack of suitable hardware platforms and the burden of software code. As a result, after finishing simulations, experimental results may be obtained fast. The kit is anticipated to exploit the control community’s capabilities in designing control algorithms while minimizing efforts in constructing hardware systems and programming the algorithms, resulting in a considerable increase in research and learning efficiency and productivity. The kit may be used for both lab bench and stand-alone research tasks. While the kit is designed for power and energy-related applications, it can also be used for other purposes. It can be applied to the research and education of other control systems as well, because of its versatile interfaces and computational power.
The use of machine learning classification algorithms to detect different defects of components is a smart feature in the new micro grids, for example, the classification of power transformers and the health monitoring represented in [
16].
In [
11], the authors presented an implemented real-time platform, which properly works for educational purposes of relaying control for smart grid applications. This platform is the initial test bench based on a hardware–software integration with DSSim-PC; As an interesting improvement, a co-simulation of distribution system models from DSSim-PC interacts with real IEDs and protection devices. This characteristic brings a potential hardware in the loop feature, which is suitable to develop Advanced Distribution Automation solutions applied to smart grids.
The work realized by [
17] focuses on a methodology for developing a new remote renewable energy laboratory idea for educational purposes. This laboratory’s renewable energy system is a hybrid power system (HPS) with three energy sources. An HPS is made up of two or more energy source systems, energy storage systems, power conditioning equipment, and controllers in general. The suggested system combines wind, solar, and biodiesel energy, as well as a storage battery, a power conditioning system, and a coupling unit. This can assist not just to support research on various energy sources, but also to raise awareness among students about the necessity of clean energy. This research proposes a real-world renewable energy laboratory at the University of Quebec in Rimouski, which is now under development. The laboratory contains three renewable energy source systems: wind turbines, solar panels, and a biodiesel generator. A battery bank is used for energy storage.
The authors in [
13] have demonstrated a system that uses the open communication protocol OPC to integrate open-source electronics hardware (Arduino) and software (Arduino OPC server) with proprietary hardware (PLC) and Supervisory Control and Data Acquisition software (SCADA). The open-source device oversees data collecting and sensing. The proposal outlines the initial steps toward combining the adaptable Arduino platform with the well-known capabilities of SCADA [
18] systems and PLCs used in real-world applications. There are currently no publications that discuss such an approach.
Hydrogen energy systems have the potential to be part of a clean, dependable, cost-effective, safe, and long-term portfolio of smart energy solutions. The fact that hydrogen may be generated from a multitude of sources, including fossil fuels, nuclear power, biomass, and renewable energy, is a significant benefit. Hydrogen, on the other hand, has characteristics that are significantly different from those of traditional chemicals and fuels like methane, propane, and gasoline. Among hydrogen’s distinguishing qualities are its extremely broad flammability limits in air, low ignition energy, and low density, which results in significant buoyancy. Hydrogen has no odor or flavor, and its flame is nearly imperceptible in daylight. As a result, safety precautions that apply to traditional chemicals and fuels typically do not apply to hydrogen. The work shared in [
19,
20,
21] are advantageous references focusing on H2 integration in SG and solutions with hydrogen options, along with hydrogen safety training for laboratory researchers and technical personnel.
In [
22], the aim was to bring the laboratory experience in the validation of energy management strategies for smart grids, which incorporates renewable energy and hybrid energy storage based on hydrogen and batteries. This knowledge might be useful in the construction and scaling-up of future plants. The achievement of a series of actions aimed at optimizing the operation of smart grids yielded key conclusions. The first stage was to set up an experimental platform and a one-of-a-kind laboratory environment that allowed for the testing of a wide range of controllers. After that, it was required to describe all of the equipment in order to understand their operating curves and characteristics, in order to create realistic models that allowed for accurate testing of the controllers prior to their implementation in the real plant. The next stage was to create a collection of models that could accurately reproduce the real system in order to simulate and improve energy management systems at the University of Seville. The study covers from most basic operation modes to recent advances in optimal control strategies. The benchmarking of experimental results has pointed out that MPC is able to optimize the smart grid operation economically while respecting equipment constraints, which is expected to contribute to a higher equipment lifetime and reduced operational costs. In [
23], the authors have presented the influence of demand response actions on the electricity cost for residential houses, which is a key element in the test bench for which the users can test and simulate different demand responses to see the influence on the electricity cost.
In [
24,
25], the smart, autonomous electrical grid’s energy management problem is represented as a multi-objective model with the goal of optimizing dependability while reducing both the operation cost and the variance between demand and the system’s target energy consumption. The hybrid storage system is utilized in this model to control the unpredictability of renewable energy sources. Furthermore, the participation of responsive customers is modeled utilizing demand-side management tactics, in which the demand is shifted from peak hours to off-peak hours, and plug-in electric vehicles are employed to satisfy the demand locally. The proposed model is solved using the shuffled frog leaping algorithm (SFLA) approach, through which the non-dominated solutions are obtained. Then, the fuzzy and the weighted sum methods are used to select the best solution.
The use of machine learning to forecast the energy consumption is a mandatory feature in smart grid application, especially in industrial case studies, as elucidated in [
26], in which the author applies the Fast Forest Quantile Regression to predict the energy demand with the key performance indicator of production. Authors in [
27] described the potential of predictive control to minimize the electricity cost in heat pumping. The designed test bench users can test these algorithms in a laboratory scale and see their performances.
Authors in manuscript [
28] showed a cost-effective controller for a hybrid, renewable energy system that included solar panels and a storage system that included fuel cells, supercapacitors, and batteries. This book considers a thorough model and control architecture for the presenting system. The hybrid renewable energy system [
29] is well-represented using numerical derivations. Three test scenarios are used to evaluate the system’s performance on the Matlab/Simulink platform’s jobsite. The authors compare the LWMCSO technique, which is a combination of the Levy Whale Optimization Algorithm (LWOA) and the Modified Crow Search Optimizer (MCSO), to existing methods such as the Adaptive Fractional Fuzzy Slide Model Control (AFFSMC), the Salp Swarm Optimization Algorithm (SSOA), and the Ant Lion Optimization (ALO) technique. The effectiveness of the presented technique offers advantages, such as for balanced and unbalanced load conditions, the proposed system can work well along with the increase in the stored energy by using different storage devices.
As an extension of the smart grid test bench, it is very important to think about how to simulate or emulate smart cities components. For example, when integrating energy harvesting in roads using piezoelectric polymers [
30], the idea is to integrate different smart cities features in the test bench. The co-simulations can be presented as a digital twin of the micro-grid or the hybrid power system, where the user can test a scenario offline and see the result in the simulation, and then apply it in the test bench using the framework presented in [
31], using edge cloud for online courses and remote laboratories.
Smart grid simulation is an important feature for users to see and to test critical multiple scenarios. Many researchers have been using Matlab, Python, C++, and programming to simulate the demand response, optimization, and control techniques. The main challenge is to combine and co-simulate the grid components from different software using the Mosaik platform introduced in 2011 and in [
32], which is open source and easy to use to test management algorithms, as presented in [
33]. Other researchers in [
34] have used this open-source software to co-simulate cyber-physical energy systems for planning and executing energy management systems. In [
35], the authors simulated the transient stability of a grid integrating multiple wind power plants using the Mosaik framework. The use of this open-source software for educational purposes and integrating it in the proposed test bench will give students and researchers the opportunity to test numerous scenarios and case studies.
3. Design Approach of the Proposed System
The key aims of the proposed educational training test bench include improving theoretical learning on different components of the smart grid and its functioning principles, as well as learning the actual energy managements technique, the control techniques, the predictive maintenance algorithms, and the diagnostic and prognostic techniques [
36] using artificial intelligence, in order to engage students’ attention to the difficulties covered in those courses and expose them to the development of the smart grid’s energy management systems. Additionally, the aims include augmenting conceptual doctrines and revealing and enhancing students’, developers’, and researchers’ interest in the research. Among the effects of the project are development of new teaching materials with enhanced quality that concentrate on the newest developments in the field.
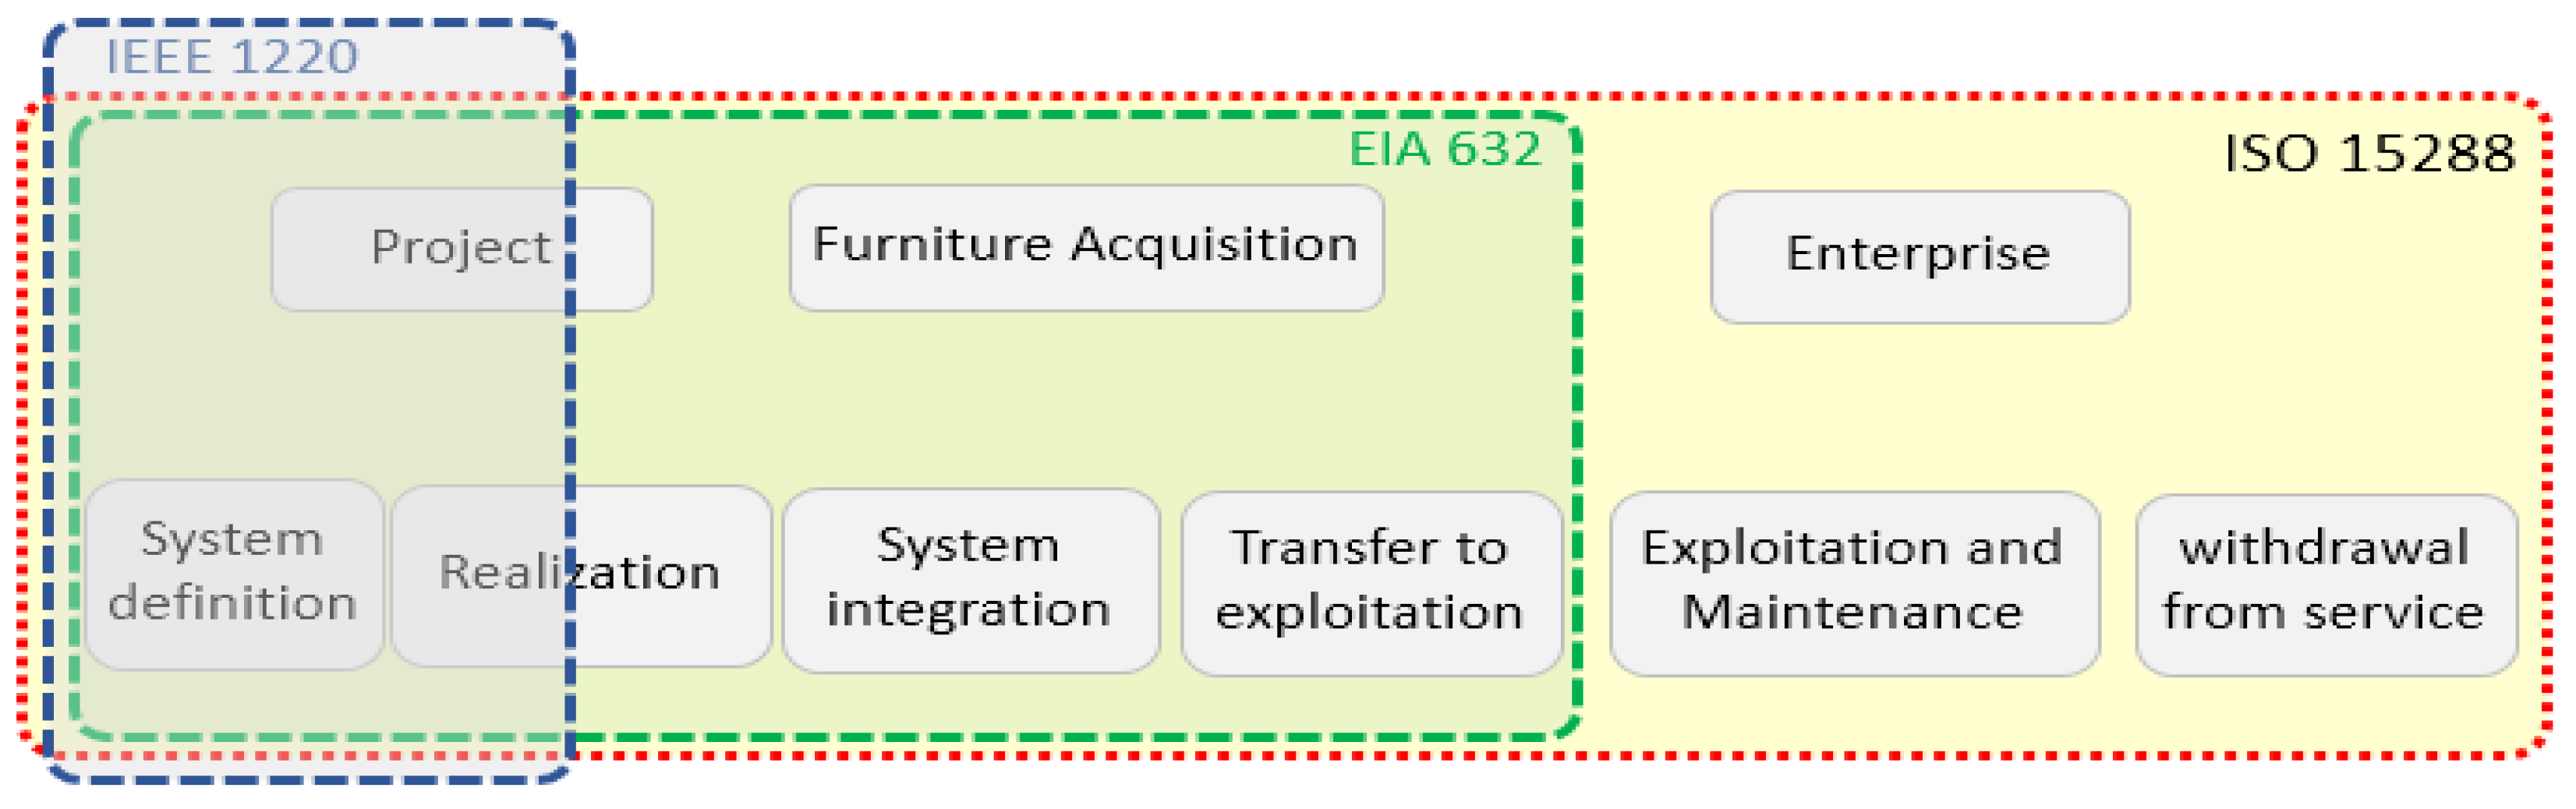
Furthermore, accurate power flows tests and energy management algorithm simulations for smart grids facilitate a hands-on, intuitive, and interactive experience. In fact, the smart grid architecture is often viewed as a complicated system, as it is an innovative, high-tech, and revolutionary product, for which there is a necessity to use modern design methods for such a system, such as systems engineering (SE). Systems engineering is a multidisciplinary and composite method to ensure that designed systems are implemented, used, and retired effectively. It is referenced by ISO 12588, EIA-632, and IEEE 1220 [
37], as elucidated in
Figure 2, which depicts the boundaries of these guidelines, which classify processes regardless of the application sector of systems engineering
In this section, we present the design of the system using a Model-Based System Engineering Approach (MBSE), which is based on CESAM as the main framework, and is supplemented with the MBSE grid structure and SysML as the modeling language. In the following, the major features of this utilized approach, including the SE, MBSE methodology, and the basis for architectural design framework included in this work, are explained. Then, the design of the investigated system utilizing the above-mentioned MBSE framework and SysML modeling language is presented.
3.1. Definitions about the MBSE Methodology
A system may be defined as a combination of interconnected and interacting elements that follow a set of rules. At the same time, the whole group is interacting with its surroundings in order to form a unified whole [
38].
A complex system is one whose behavior is difficult to describe, owing to dependencies, competitions, relationships, or other sorts of interactions between its pieces, or between a system and its surroundings. High nonlinearity, development, random organization, adaptability, and interaction processes are some of the features that emerge from such links in complex systems. In numerous circumstances, it is more useful to depict a system as a network, with nodes representing components and connections representing their interactions.
Model-based systems engineering (MBSE) is a structured technique for supporting the creation of complex systems’ requirements, design, analysis, verification, and affirmation. MBSE places models initially at core of system design, as opposed to document-centric engineering [
37].
In a digital-modeling context, MBSE offers benefits that document-based systems engineering does not. MBSE in a digital-modeling environment provides advantages that document-based systems engineering cannot provide. Numerous papers are produced by various writers in a document-based method to record the system’s design through diverse stakeholder perspectives, such as system behavior, software, hardware, safety, security, or other disciplines. A single source of truth for the system is produced using a digital-modeling method, in which discipline-specific views of the system are developed using the same components [
39].
In general, MBSE is joined with several concepts: models, systems thinking, systems engineering, processes, tools, and frameworks. A model is a simplified depiction of something, such as a mathematical, graphical, or physical representation, which abstracts reality to remove some of its complexities. A system must be modelled with less detail so that its structure and behavior can be seen, and its complexity can be managed. To put it another way, models must adequately reflect the system, and the system must validate the models [
40,
41]. In the next section, we build the requirement architecture of the studied system following the MBSE grid framework [
39,
42], and the CESAM systems architecting methodology [
43]. It is an architecture and modeling framework developed by CESAMES™, which complies with INCOSE standards [
44].
3.2. MBSE Design of the Proposed System
This research uses an MBSE grid and a CESAM method to illustrate the idea and requirements of the smart grid’s test bench for educational purposes. The research project model was built using the CAMEO tool, and is based on SysML. The first and most important phase in the system development process is understanding the demands of the stakeholders and establishing the system perimeter [
45]. This work’s goal is to arrive at the end of this phase. It entails gathering the necessary data to ensure that the studied system’s objectives are met. This step’s key phases may be summed as follows:
3.2.1. Identifying the Expectations of the Stakeholders
Individuals and entities involved are likely to provide a source of requirements.
Table 1 divides stakeholders and their needs into operational, functional, performance, and constraint categories.
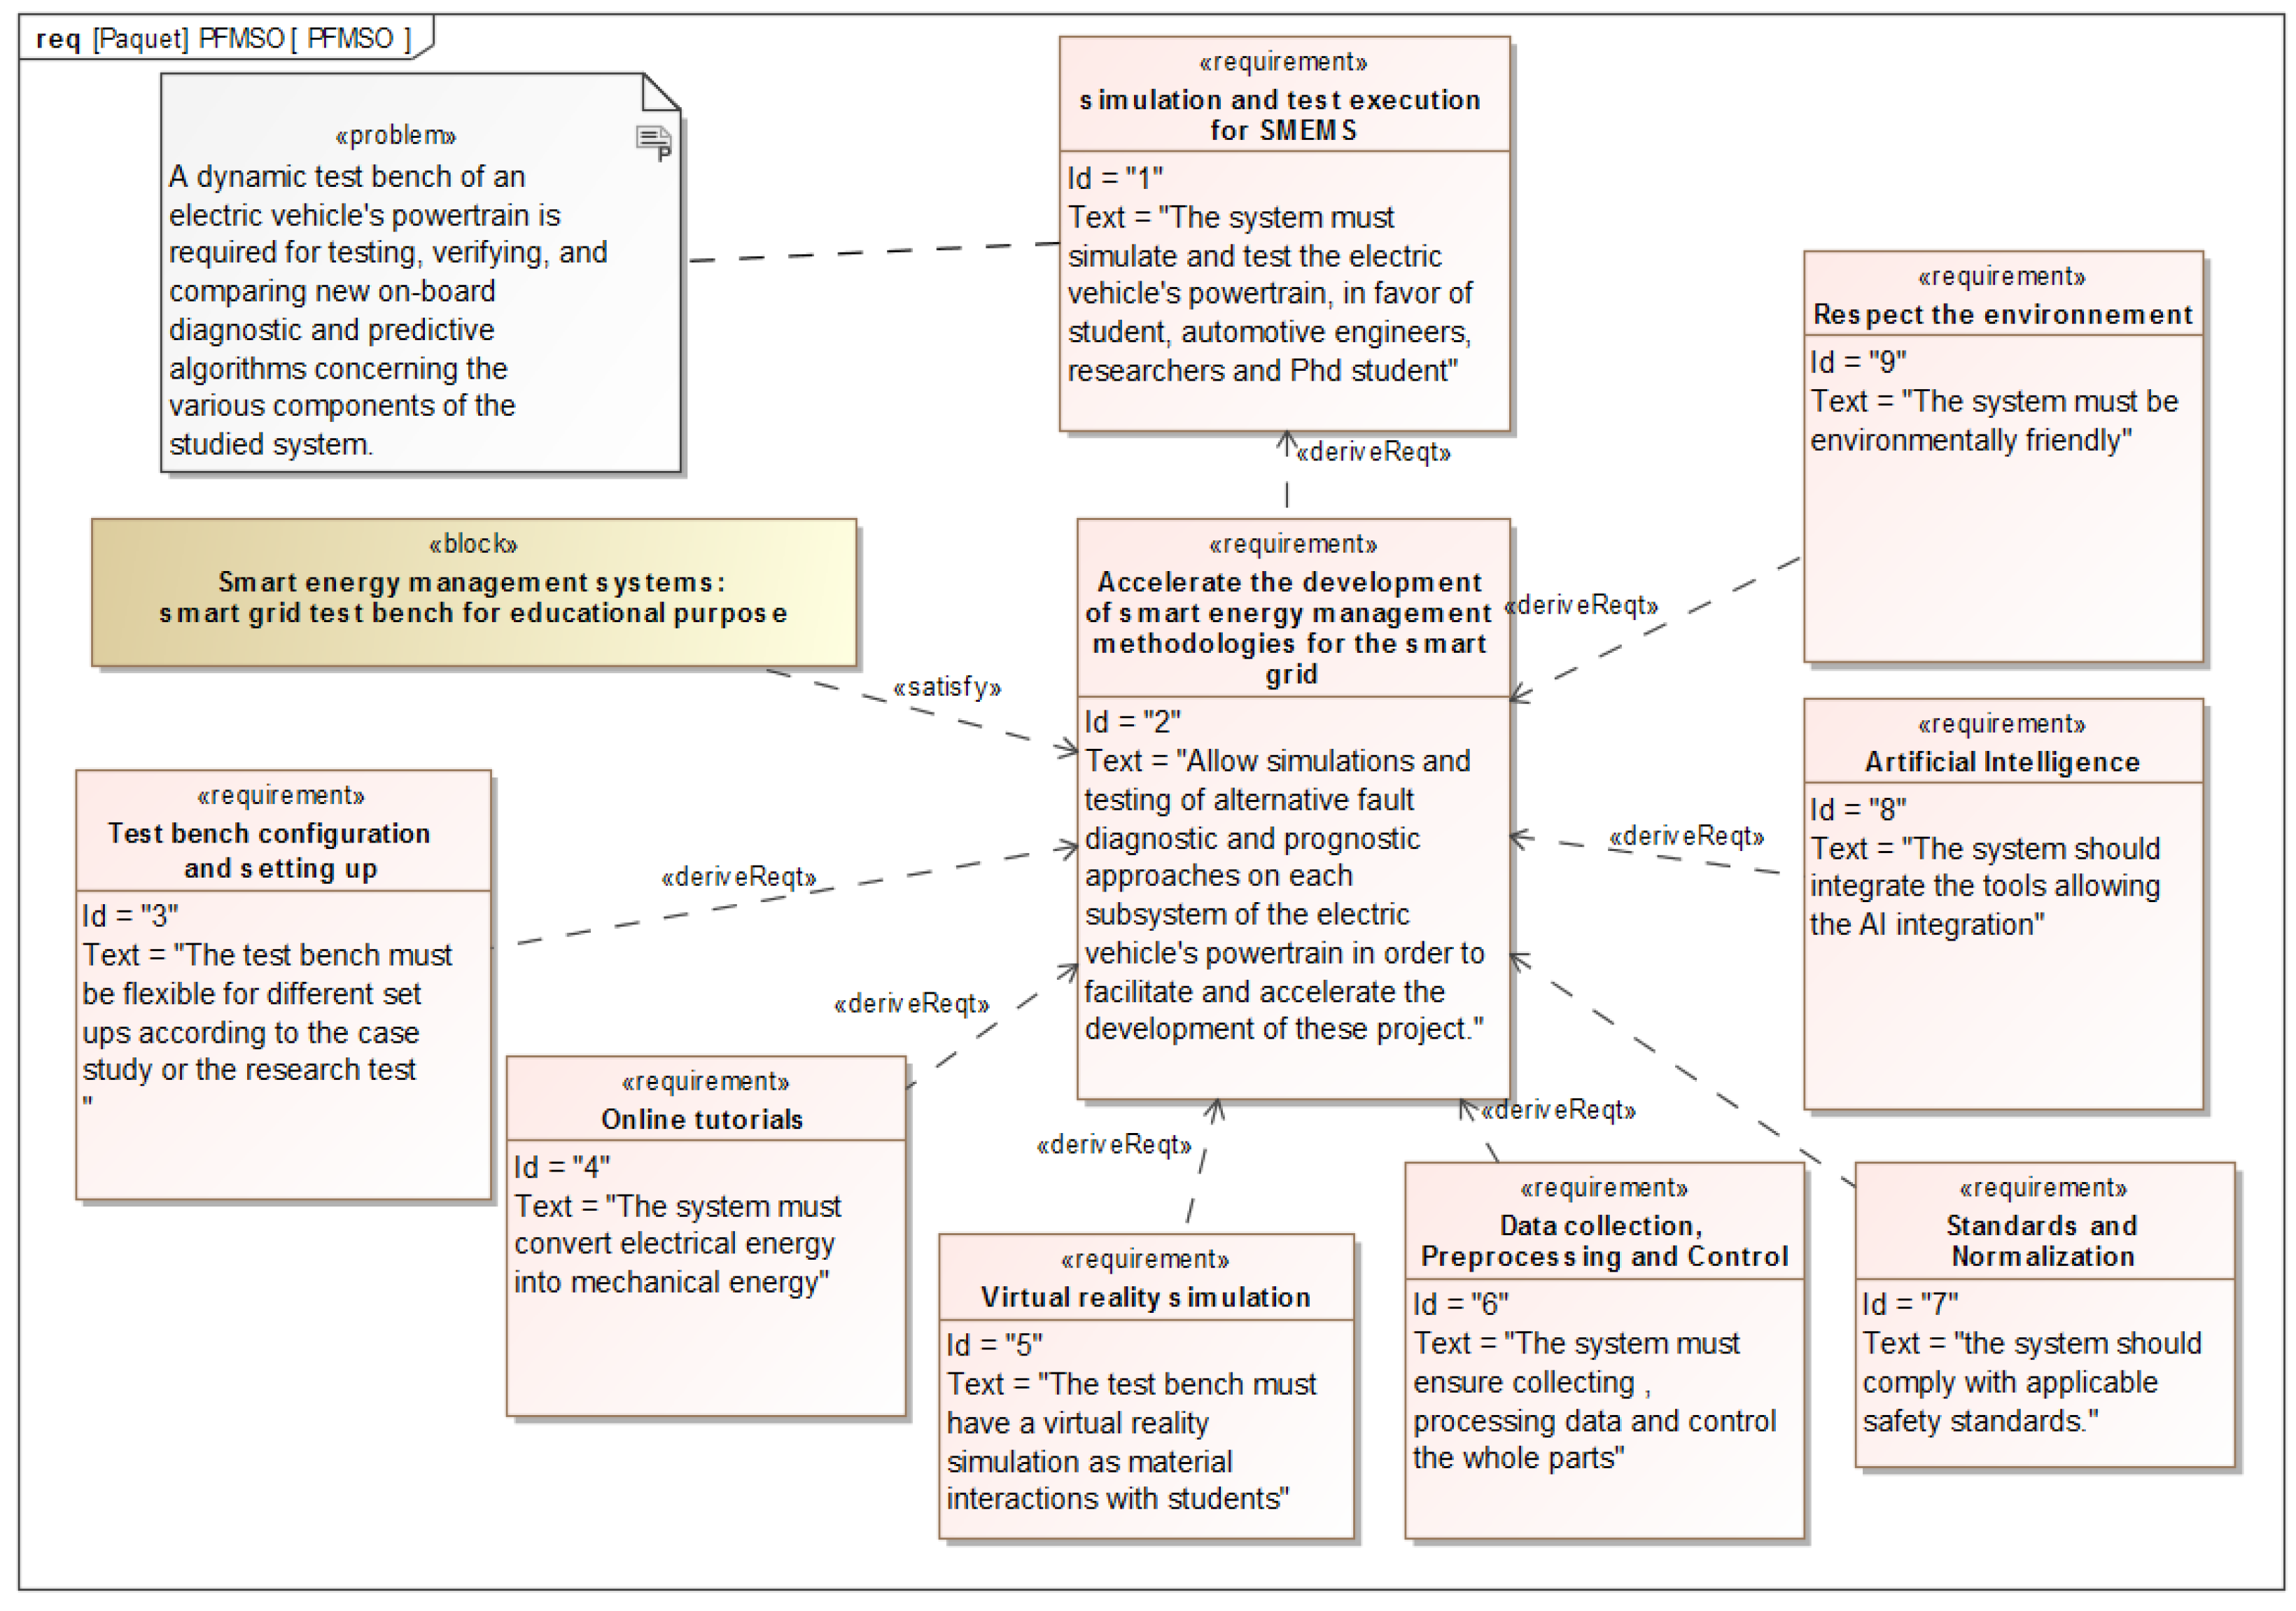
Figure 3 illustrates the major needs diagram, which depicts the stakeholders’ overall expectations from the studied system.
3.2.2. Creating the PFMSO Diagram
The PFMSO diagram of the analyzed system is elucidated in
Figure 3. We define a block to represent the system and requirements to specify the mission and the purpose. The system and the mission are linked by a bond of satisfaction; rather, the mission and the purpose are linked by a link of derivation or association. An association with stereotypes such as "missions" is performed to clarify. If required, the mission can be improved by establishing sub-mission criteria, providing them an identity, and associating them with a stereotype to explain.
3.2.3. Determining the Studied System’s Interfaces with the Different Outside Stakeholders
One of the primary purposes of this research is to investigate the longevity of the examined system and then illustrate its near surroundings and boundaries.
Figure 3 illustrates the major needs diagram, which depicts the stakeholders’ overall expectations from the studied system. The whole lifespan of the studied system is presented, followed by its immediate surroundings and boundaries.
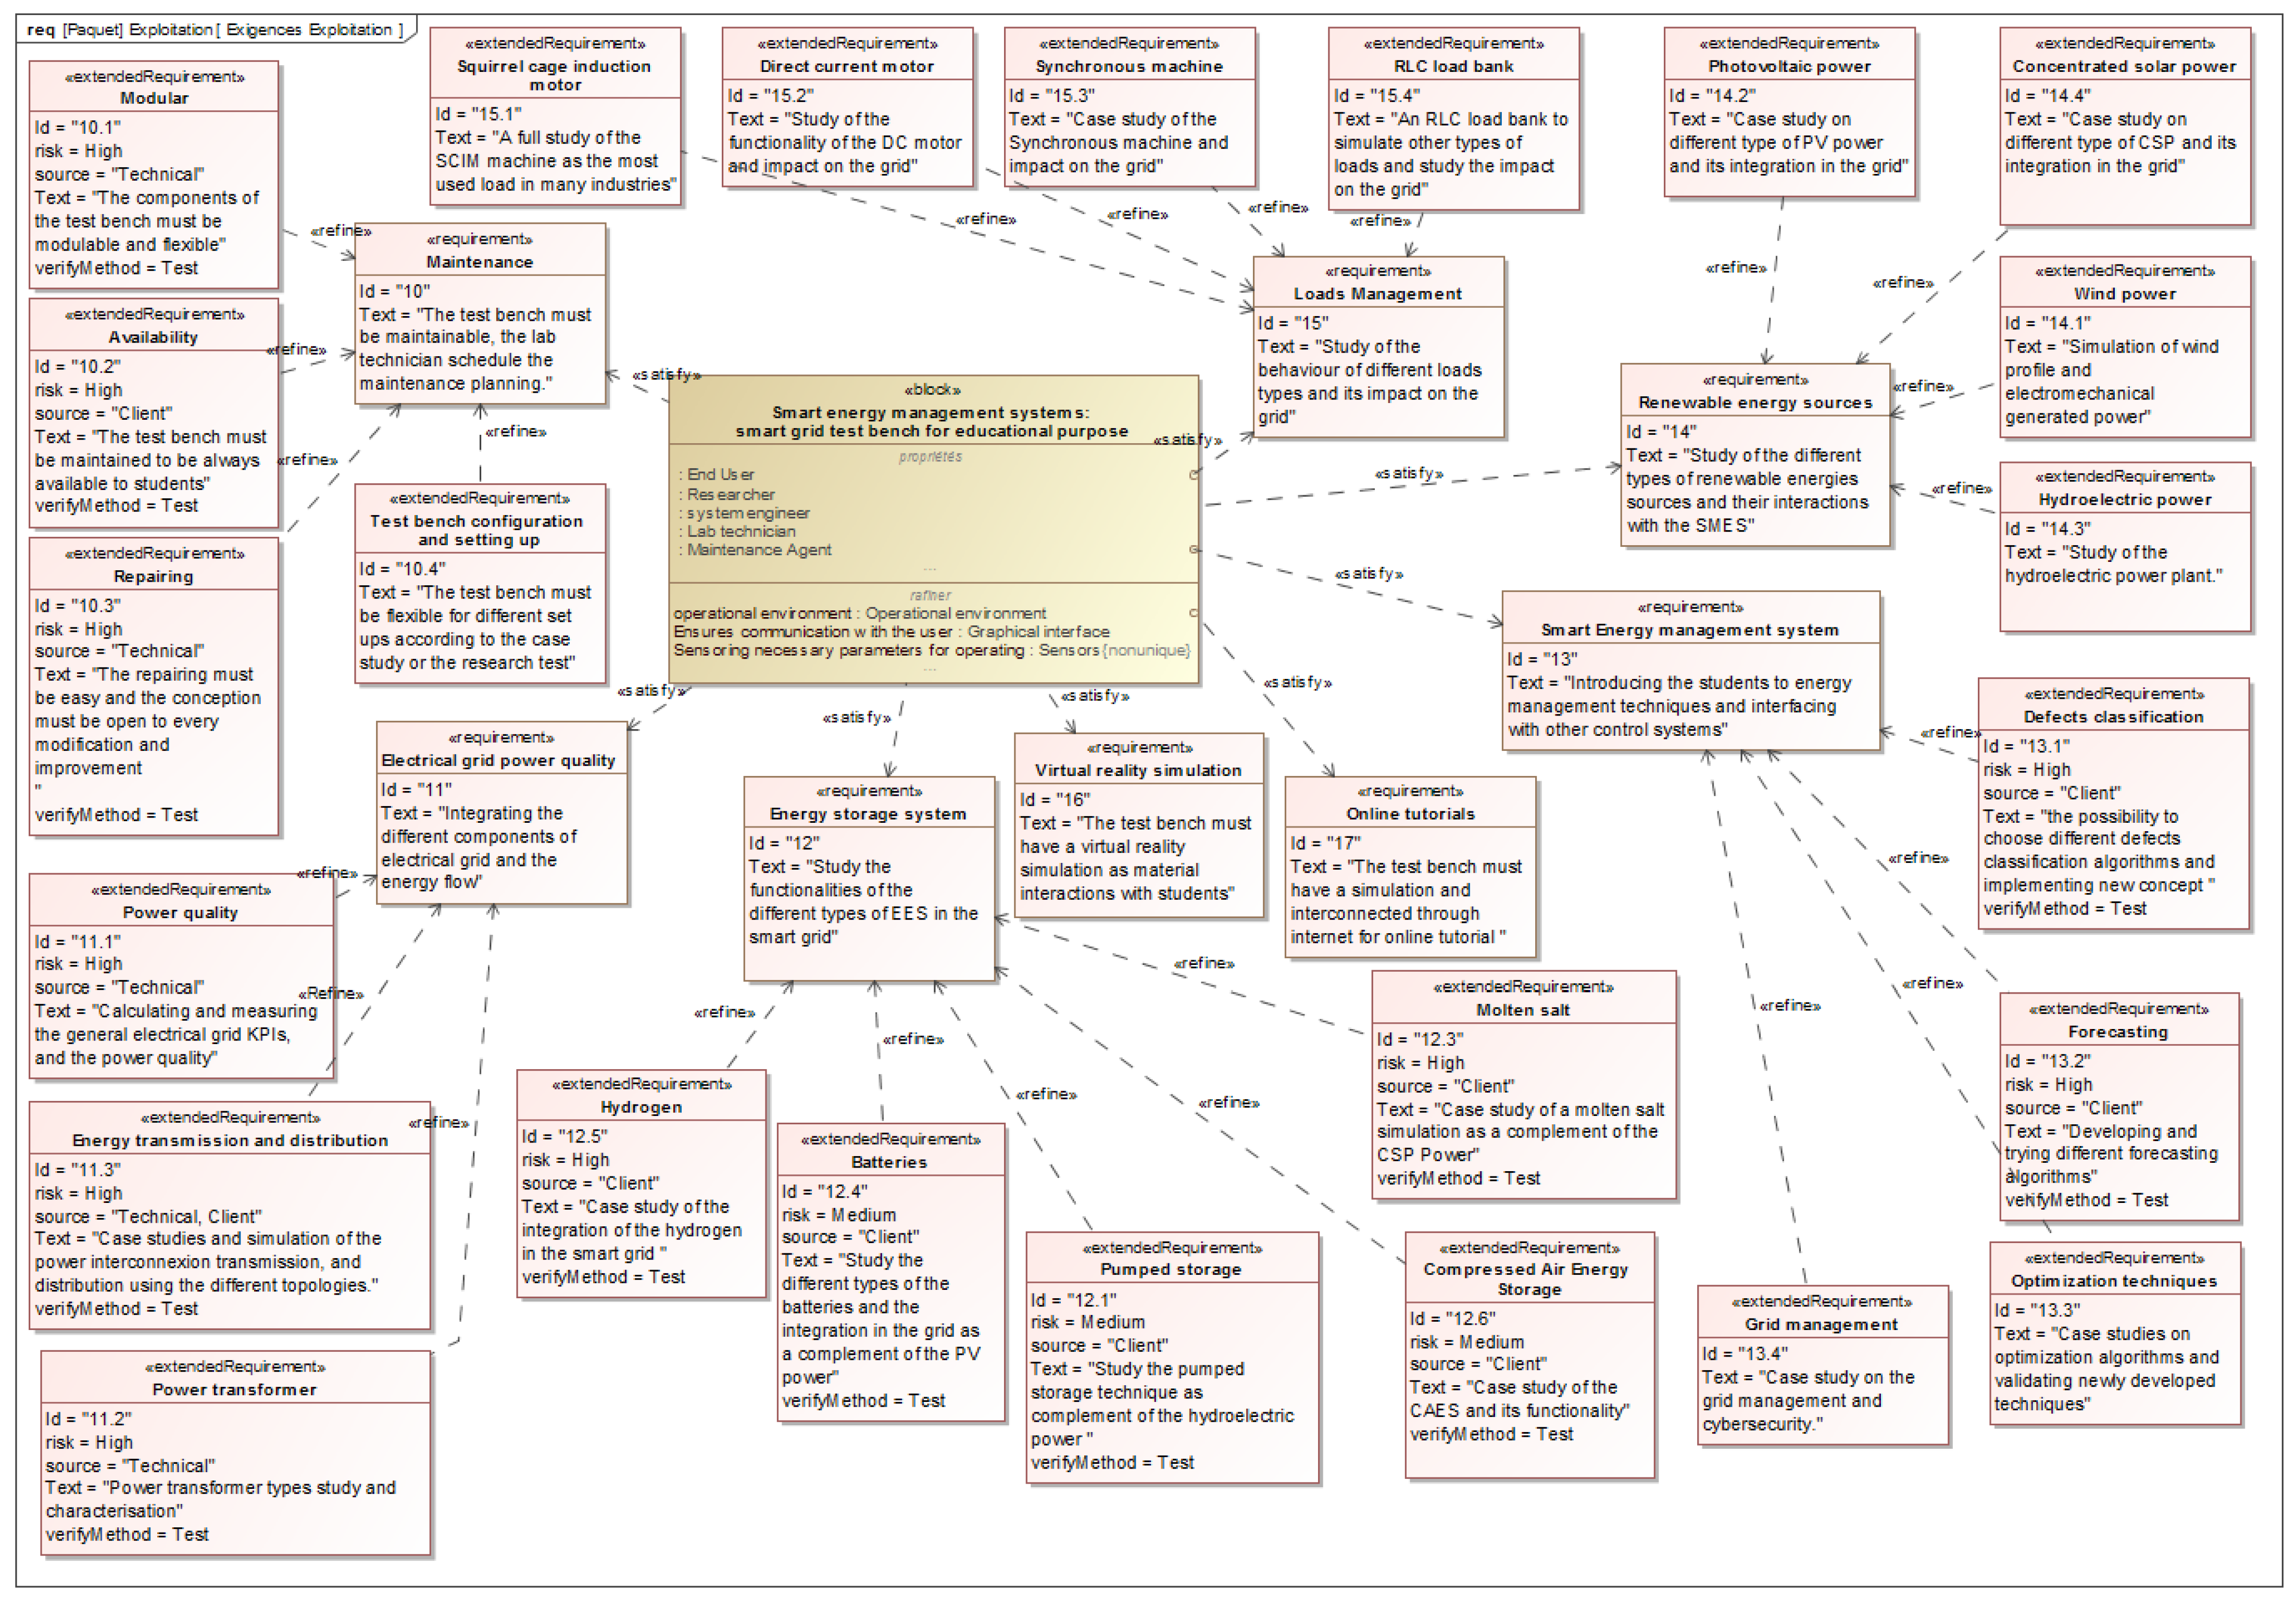
Figure 4 elucidates the detailed requirements of the test bench.
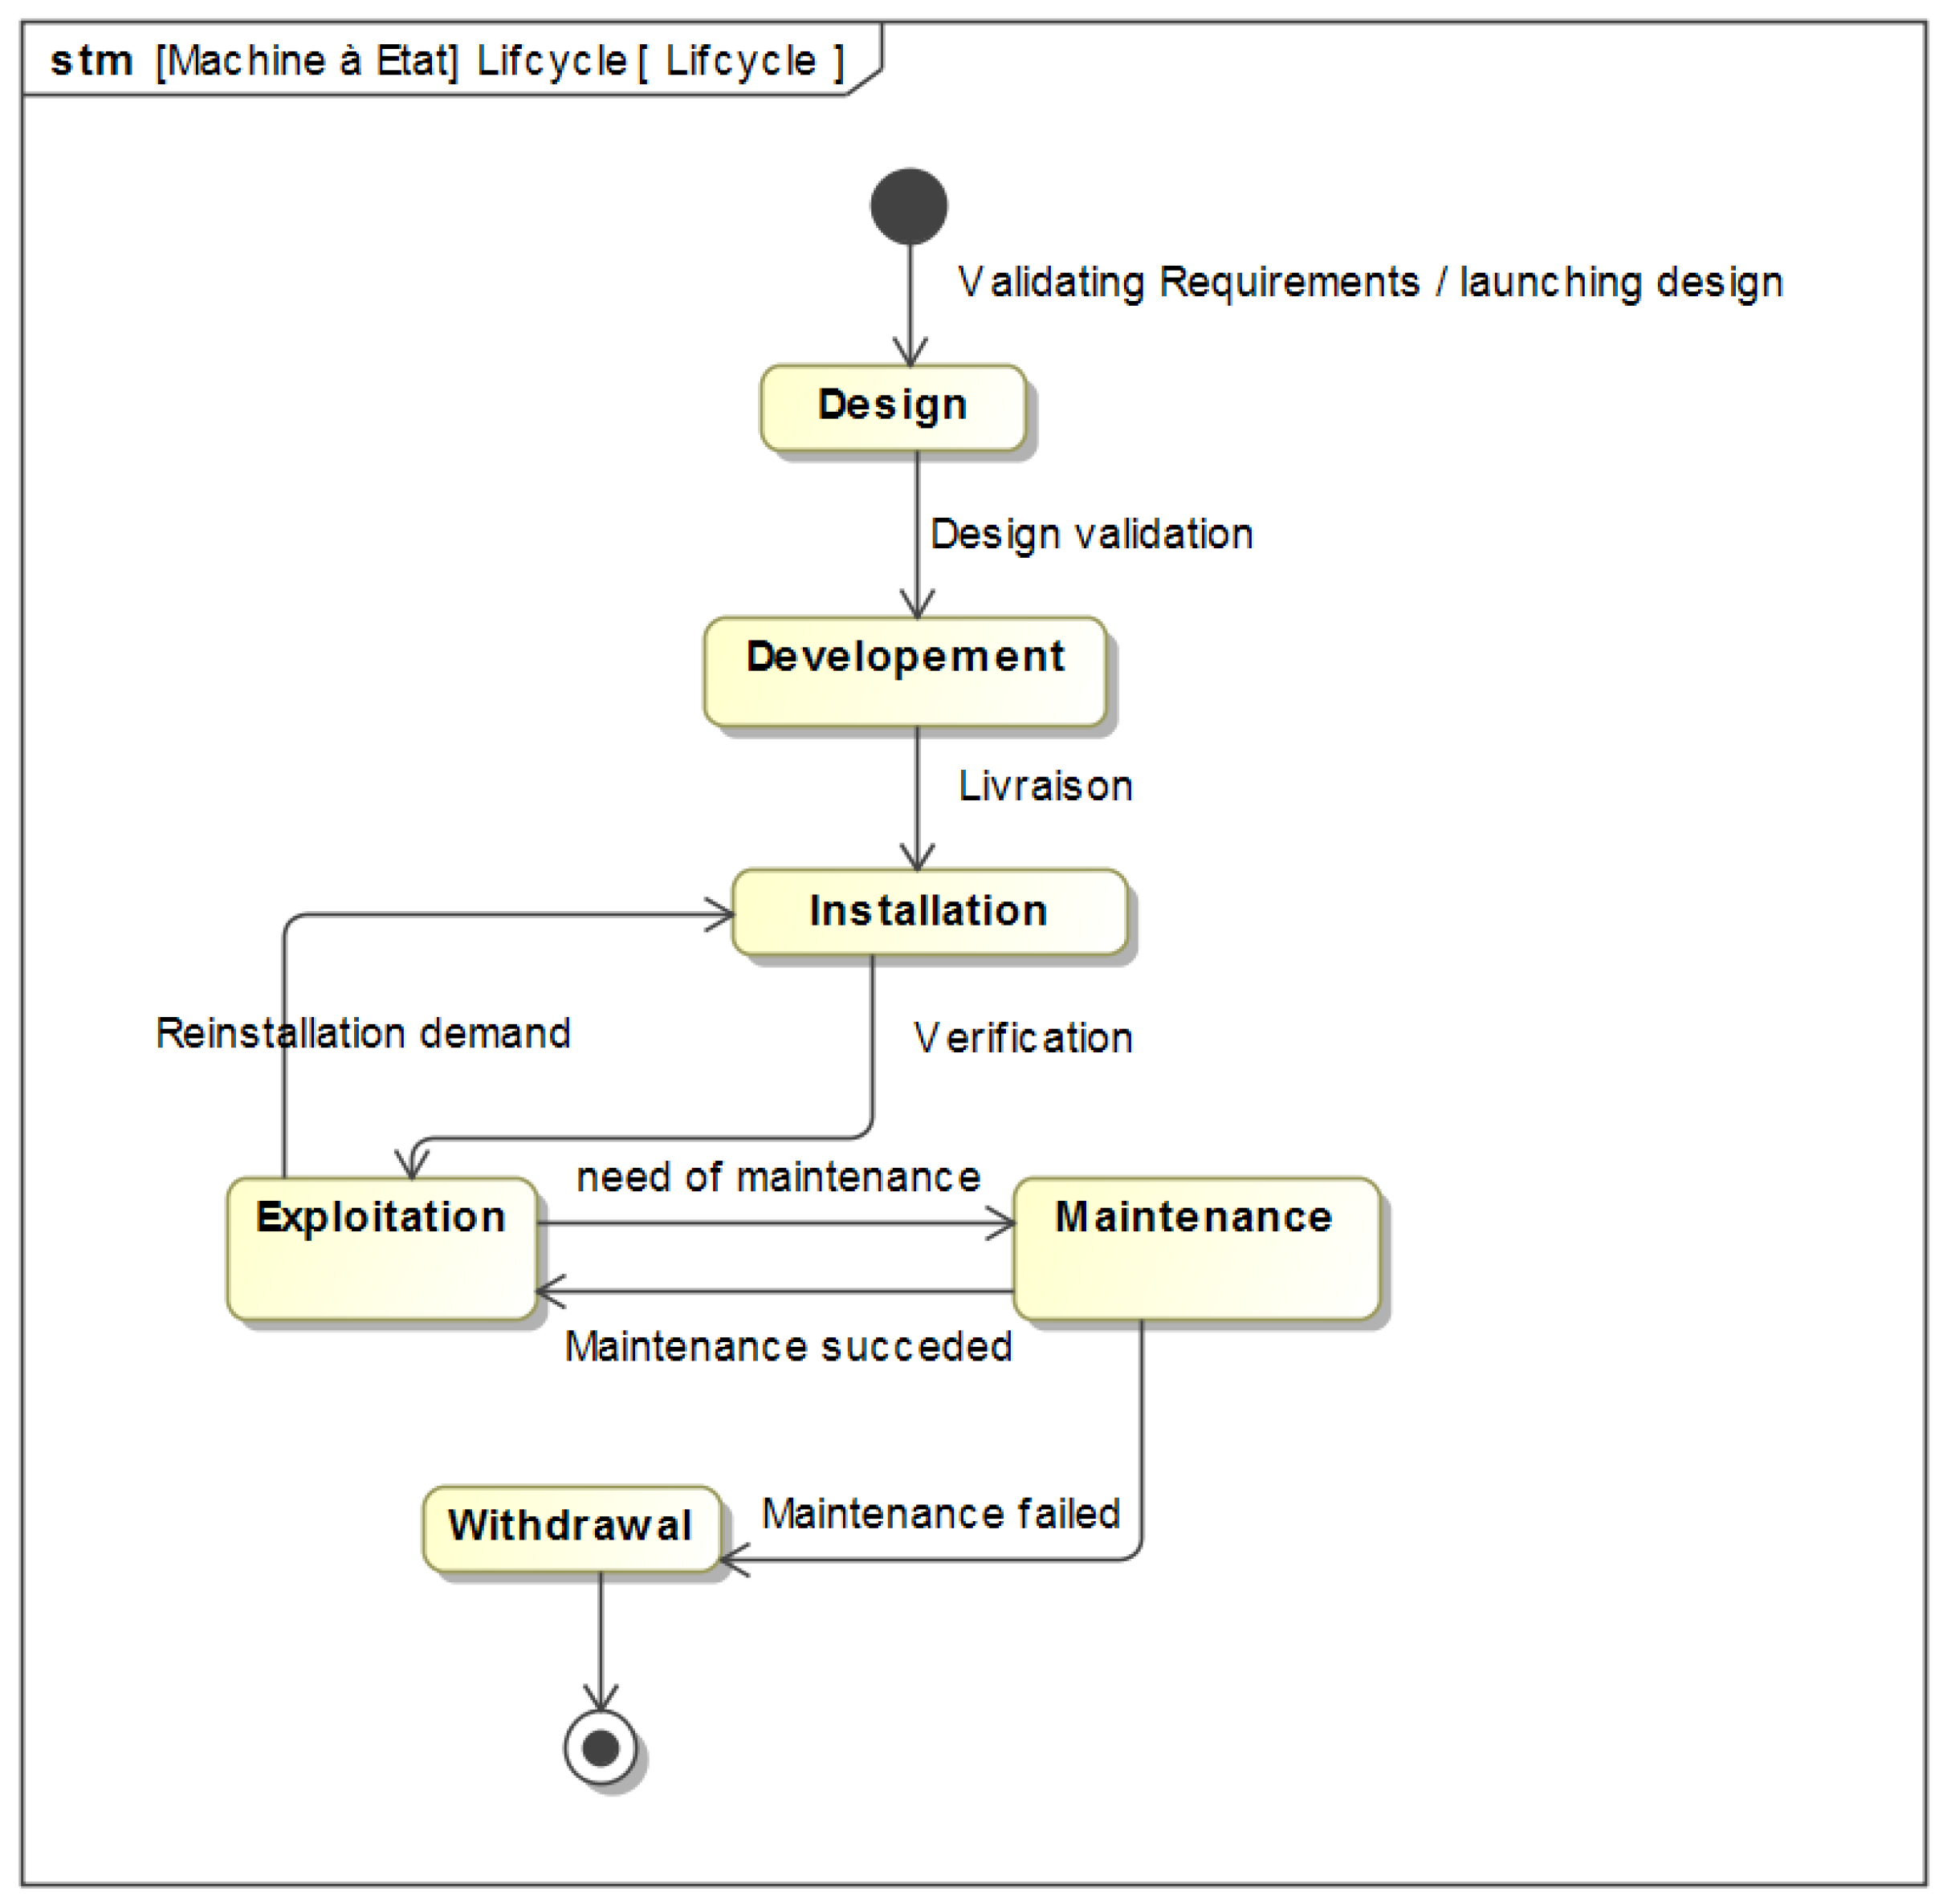
Table 1 displays the phases of the system’s lifespan, as well as the roles and implications of each stakeholder, whereas
Figure 5 depicts the lifecycle of the smart grid’s test bench.
Table 2 lists the principal stakeholders and their participation in each phase in the lifecycle of the test bench.
3.2.4. Defining Operational Use Scenarios
The operational use cases define the services that the system should provide to each of its end users. This step may appear self-evident, but it helps to explain stakeholders’ intentions and, as a consequence, describes demands much more precisely.
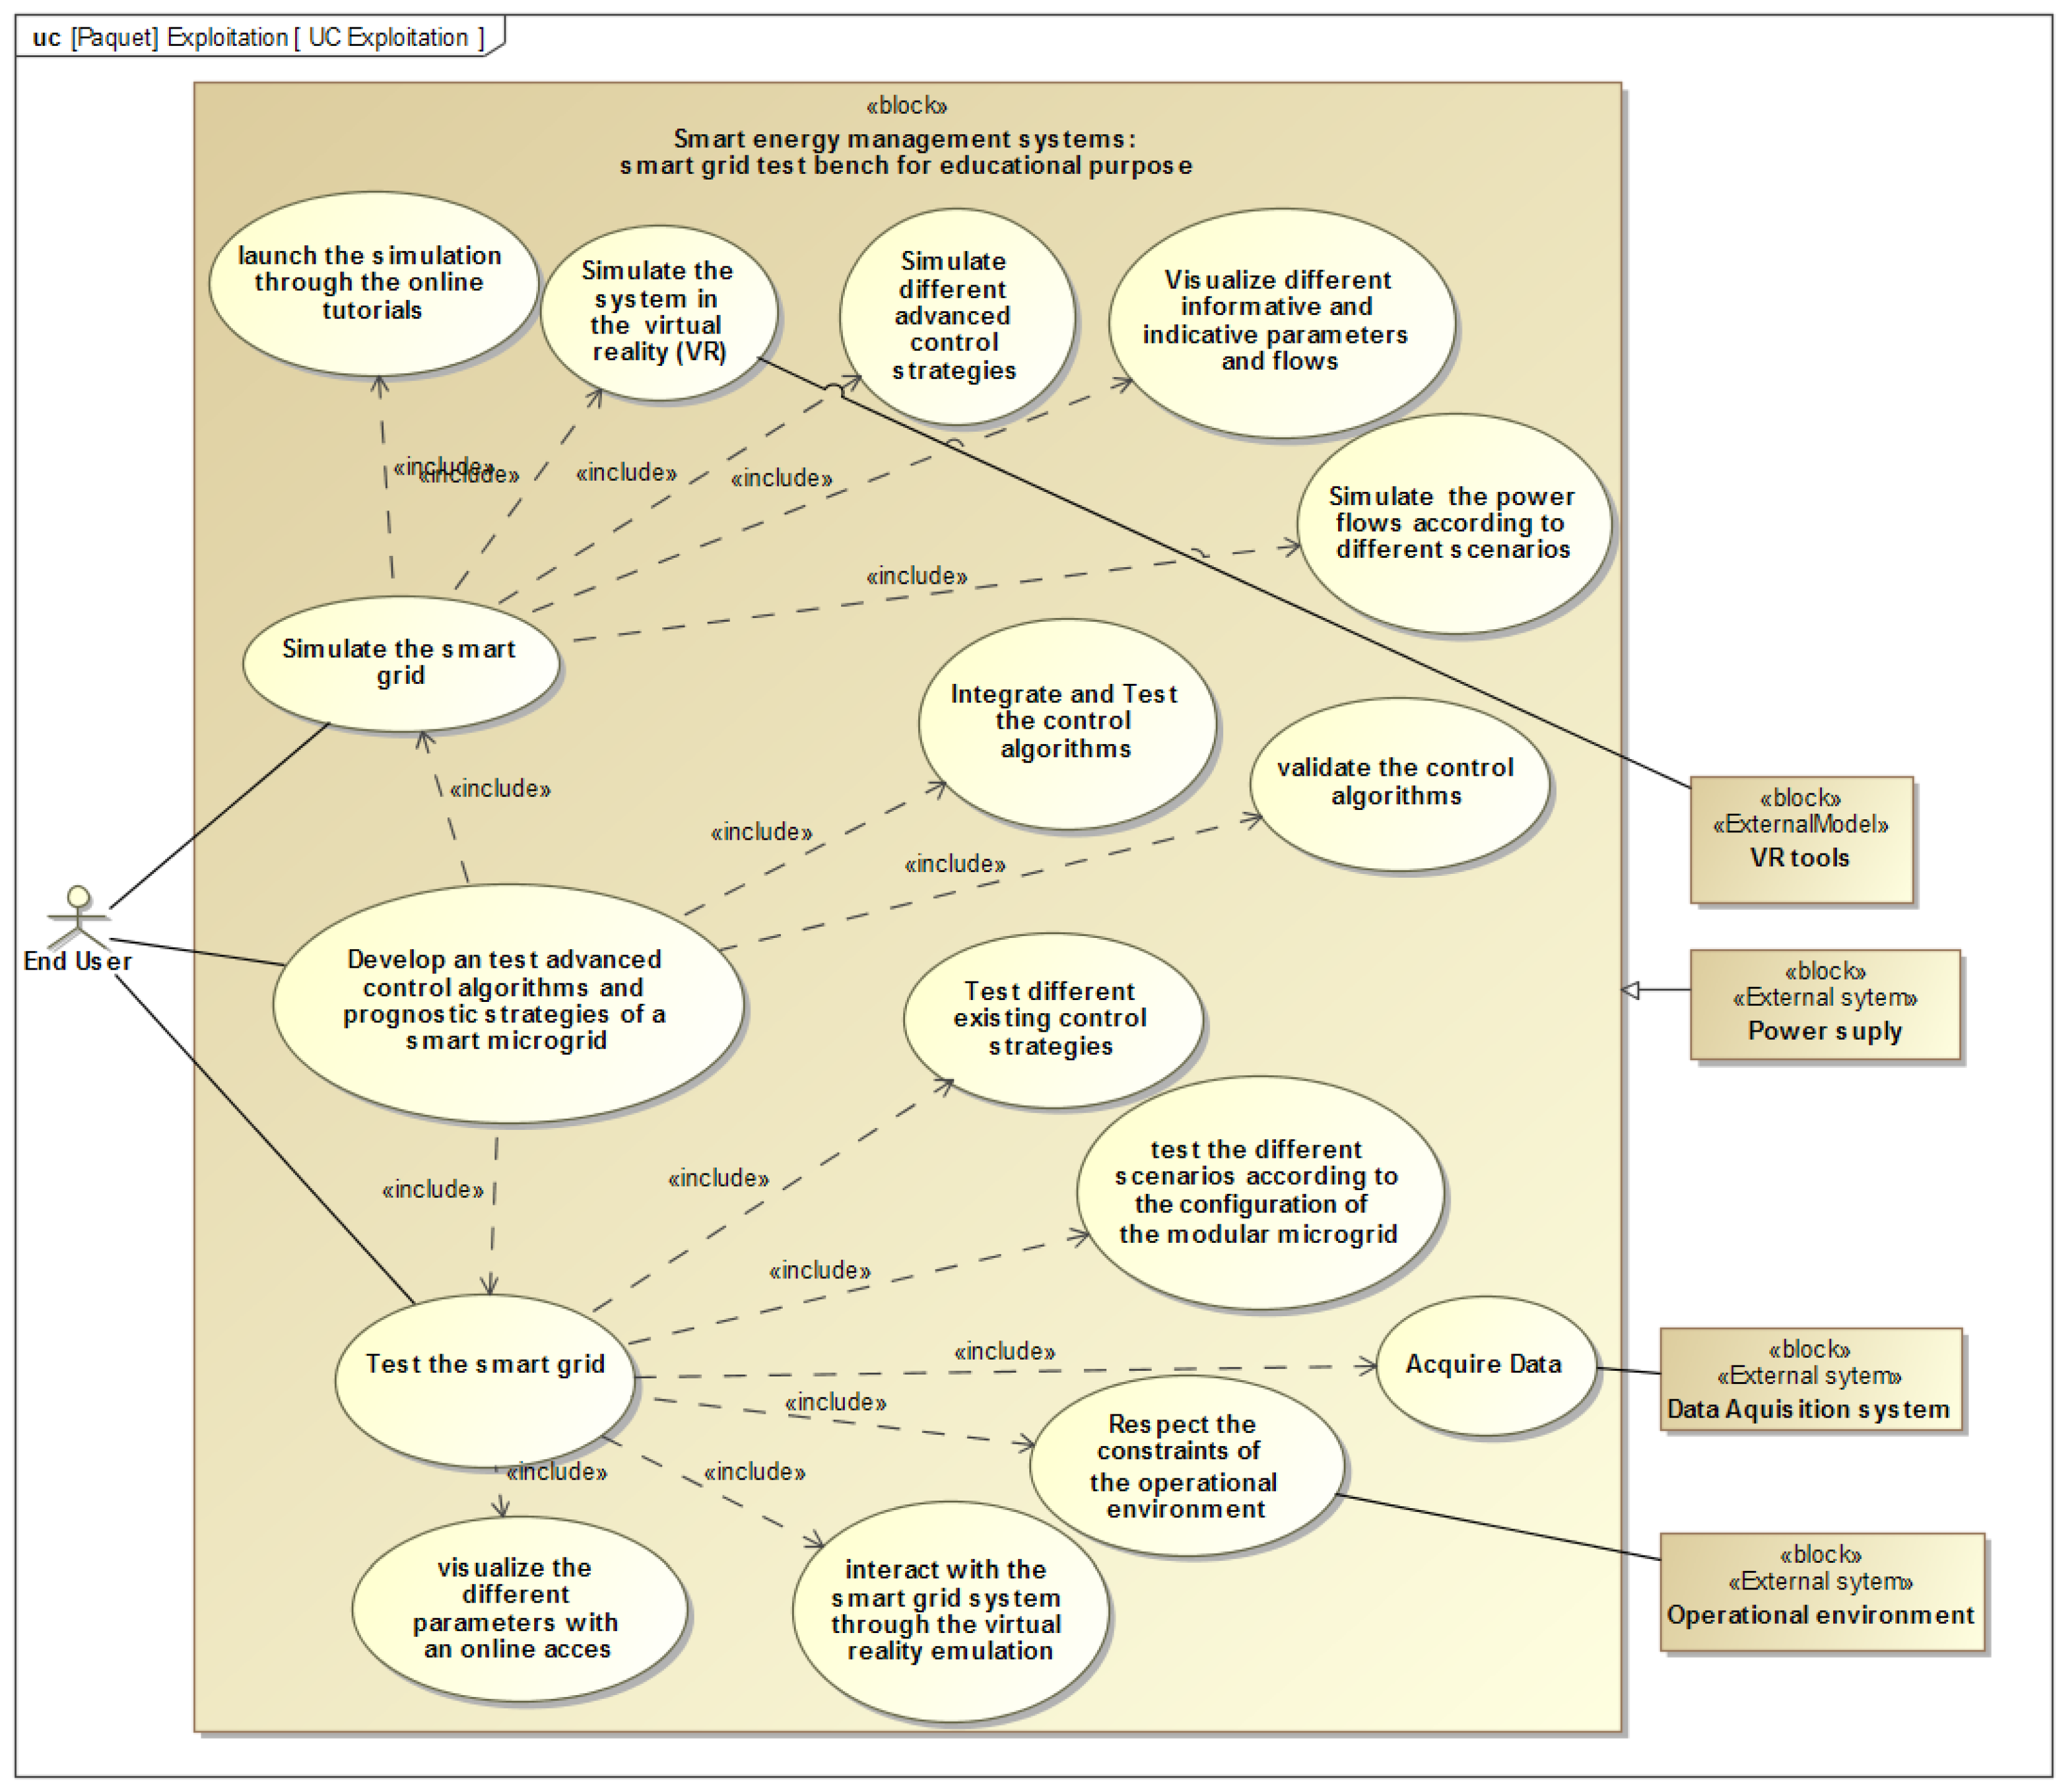
Figure 6 depicts an example of an operating phase use case in which the studied system must provide the three aforementioned services to end users:
Dynamic simulation of the micro grid.
Experimenting with smart energy management algorithms applied on smart grids.
Testing and validation of the newly designed control techniques on various sections of the smart grid’s test bench.
Remotely and virtually interacting with the system for learning, executing, and parametrizing the system’s performance indicators.
4. Design, Simulation, and Case Studies of the Educational Test Bench
In this section, the design of different components of the test bench will be described, such as selecting the right equipment of sources and loads. Simulations of the behavior of these components, using Matlab R2020a, will be presented to study the coherence with the hybrid power flow, integrating some case studies on how the user can use each component.
4.1. Power Flow Design
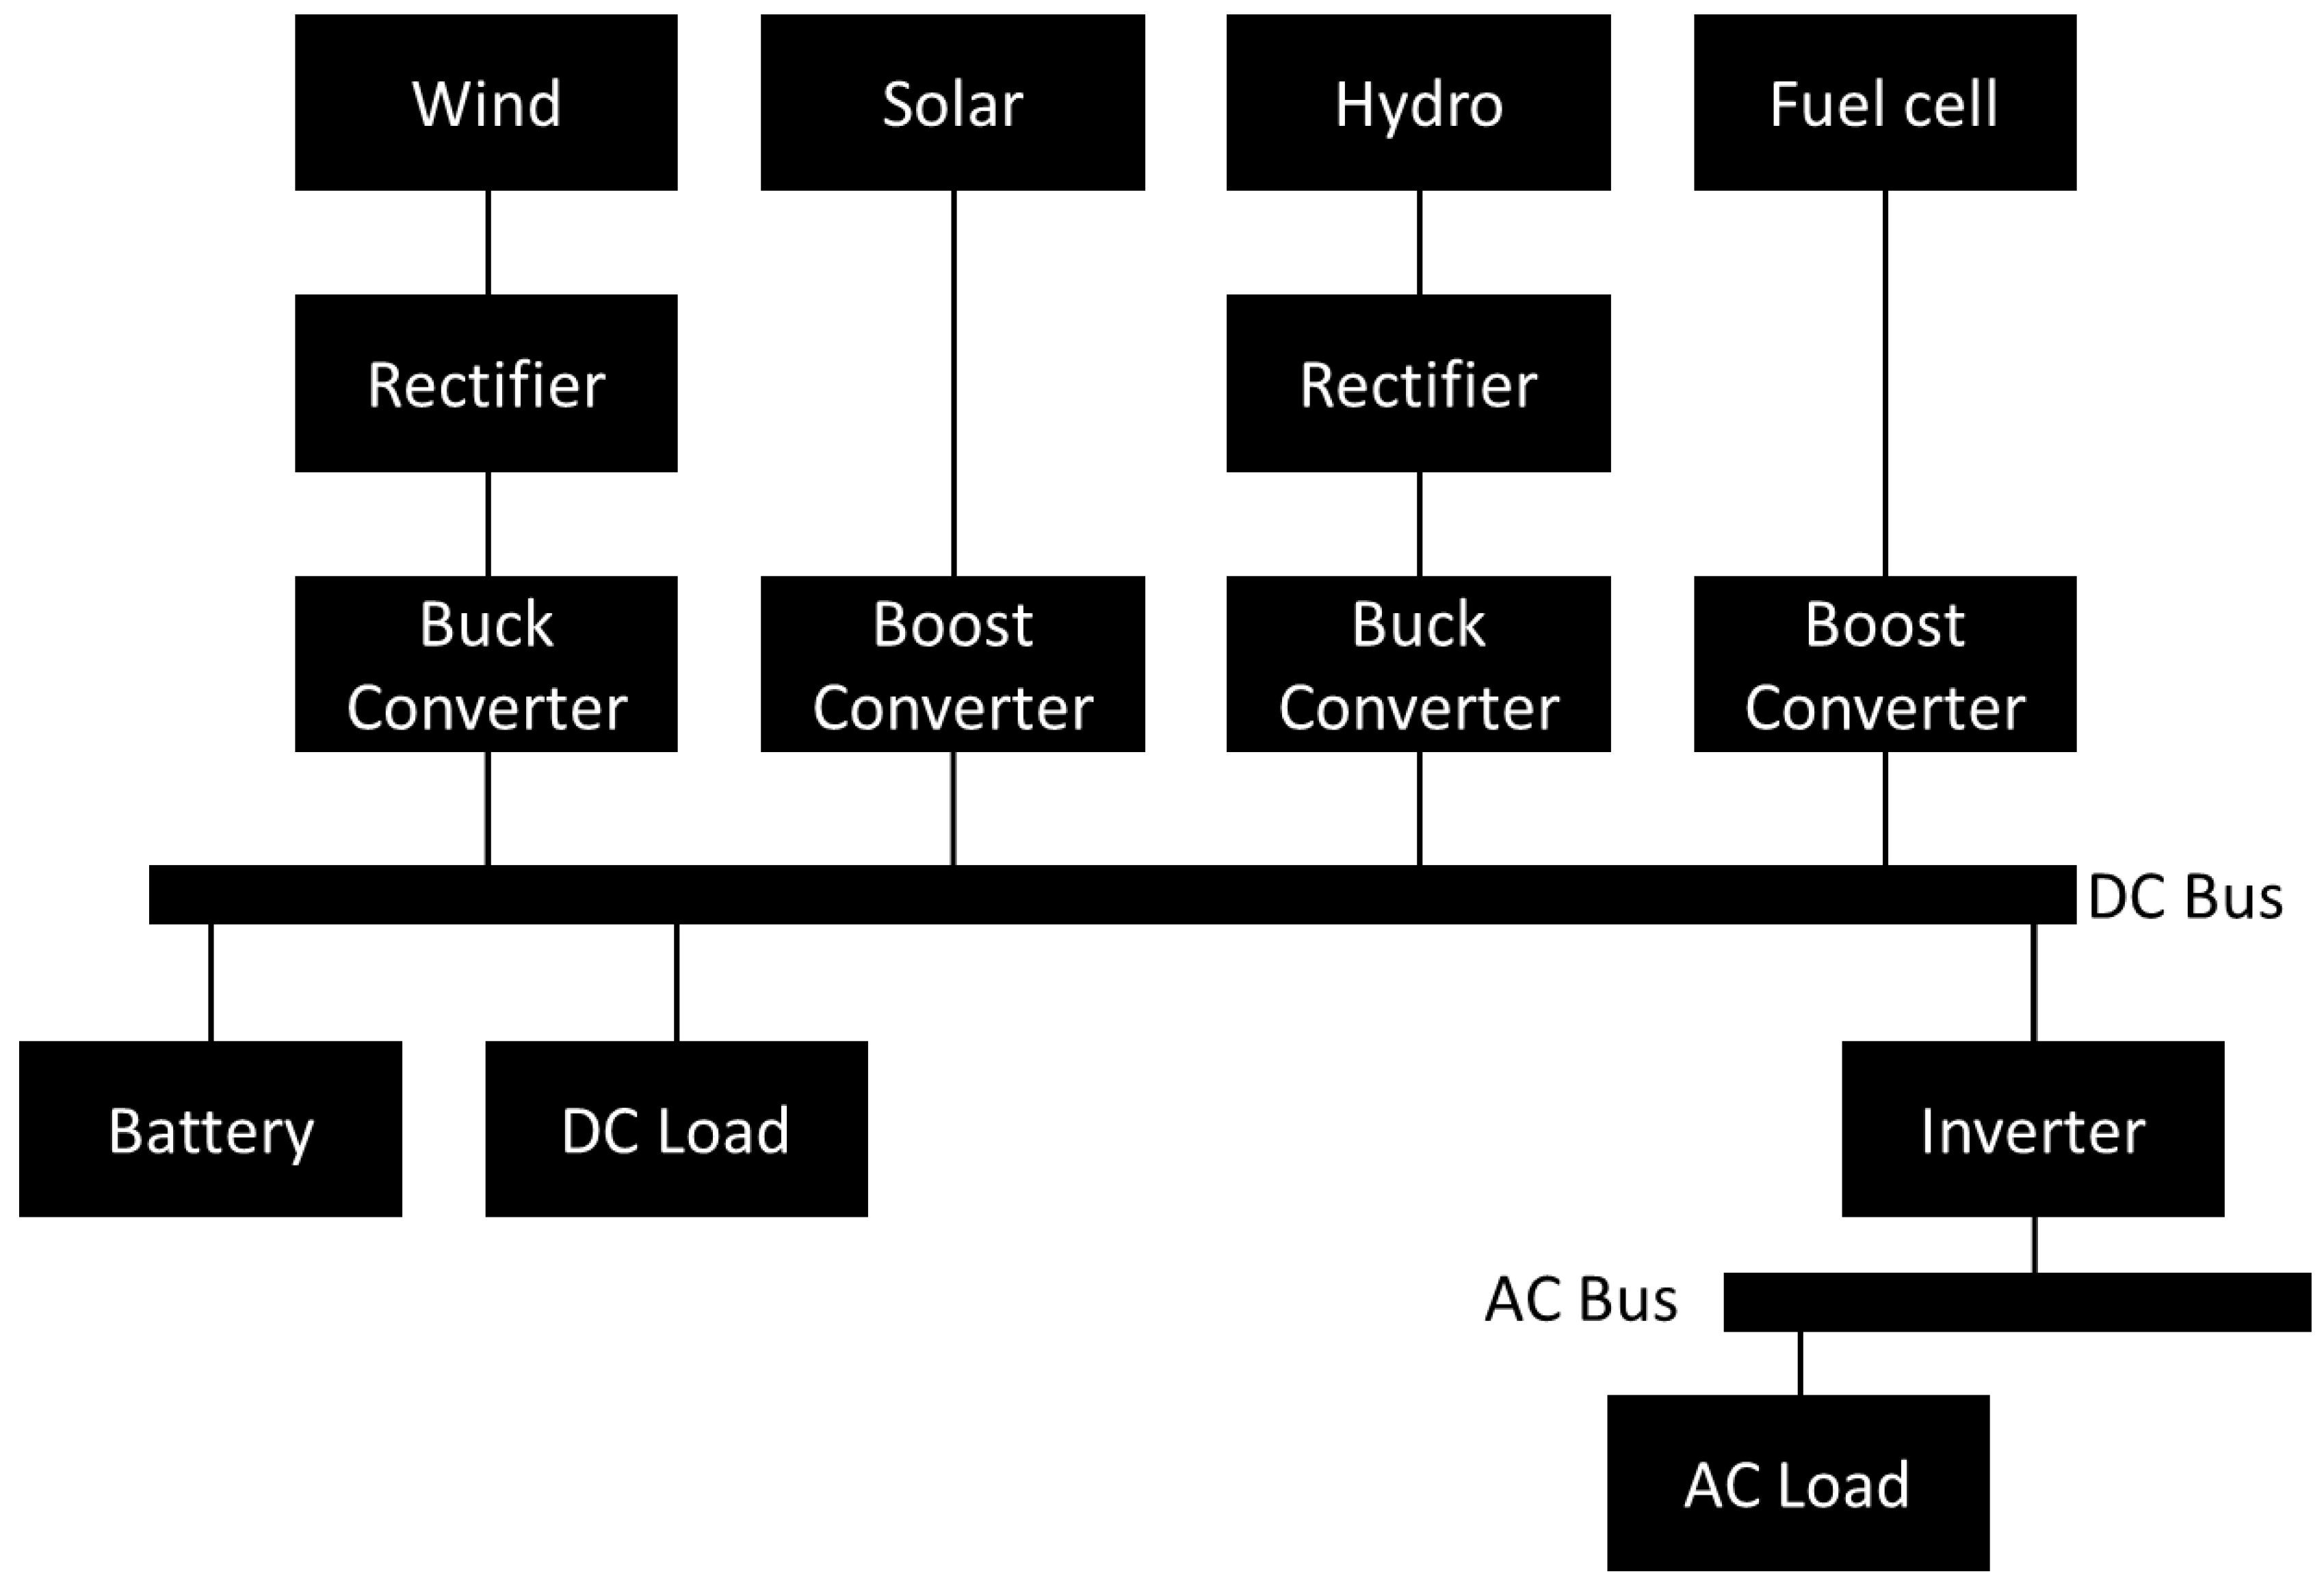
In this educational test bench, we are proposing two types of loads, a direct t current motor of 500 W and a squirrel cage induction motor of 1.1 kW. The wind and hydropower emulator can generate up to 1000 watts. In addition, 600 watts can be generated for the photovoltaic solar panels and 120 watts can be generated for the fuel cells, as elucidated in
Table 3.
The energy will be transmitted using a DC bus, using two rectifiers and two buck converters, in order to integrate the hydropower and wind power emulators. Two boost converters are used for the energy storage systems battery and fuel cells, and an inverter is used for the AC load.
To design the required battery, we initially calculate the energy consumption of the loads, taking into consideration 8 h of autonomy.
We assume that the efficiency of the battery is 90% to calculate the energy that should be stored, E
Bat, considering the aging of the battery and other temperature components which reduce the efficiency of the battery, and in order to add more storage for other usage.
We will use the 48 V batteries, so we calculate the total capacity, C
BatWe choose for this application a 48 V battery with a capacity of 300 Ah, and a GTK lithium ion 48 V, 300 Ah Li ion battery. The user can use a supercapacitor in order to emulate the energy management in electric vehicles [
46] and test the different control algorithms.
Figure 7 describes the power flow in the test bench, in which the different energy sources are connected to the DC bus to inject the power produced via power converters and the loads directly connected to the DC bus. In the case of the DC motor, the user can always use a DC/DC converter for control, and the AC loads are connected via the AC bus created by the selected inverter. In this test bench, the user can test the aging of the battery using different estimation algorithms, and by replacing the battery [
47] or estimating the total capacity using artificial intelligence algorithms, such as the sunflower algorithm in [
48].
4.2. Photovoltaic
4.2.1. Design
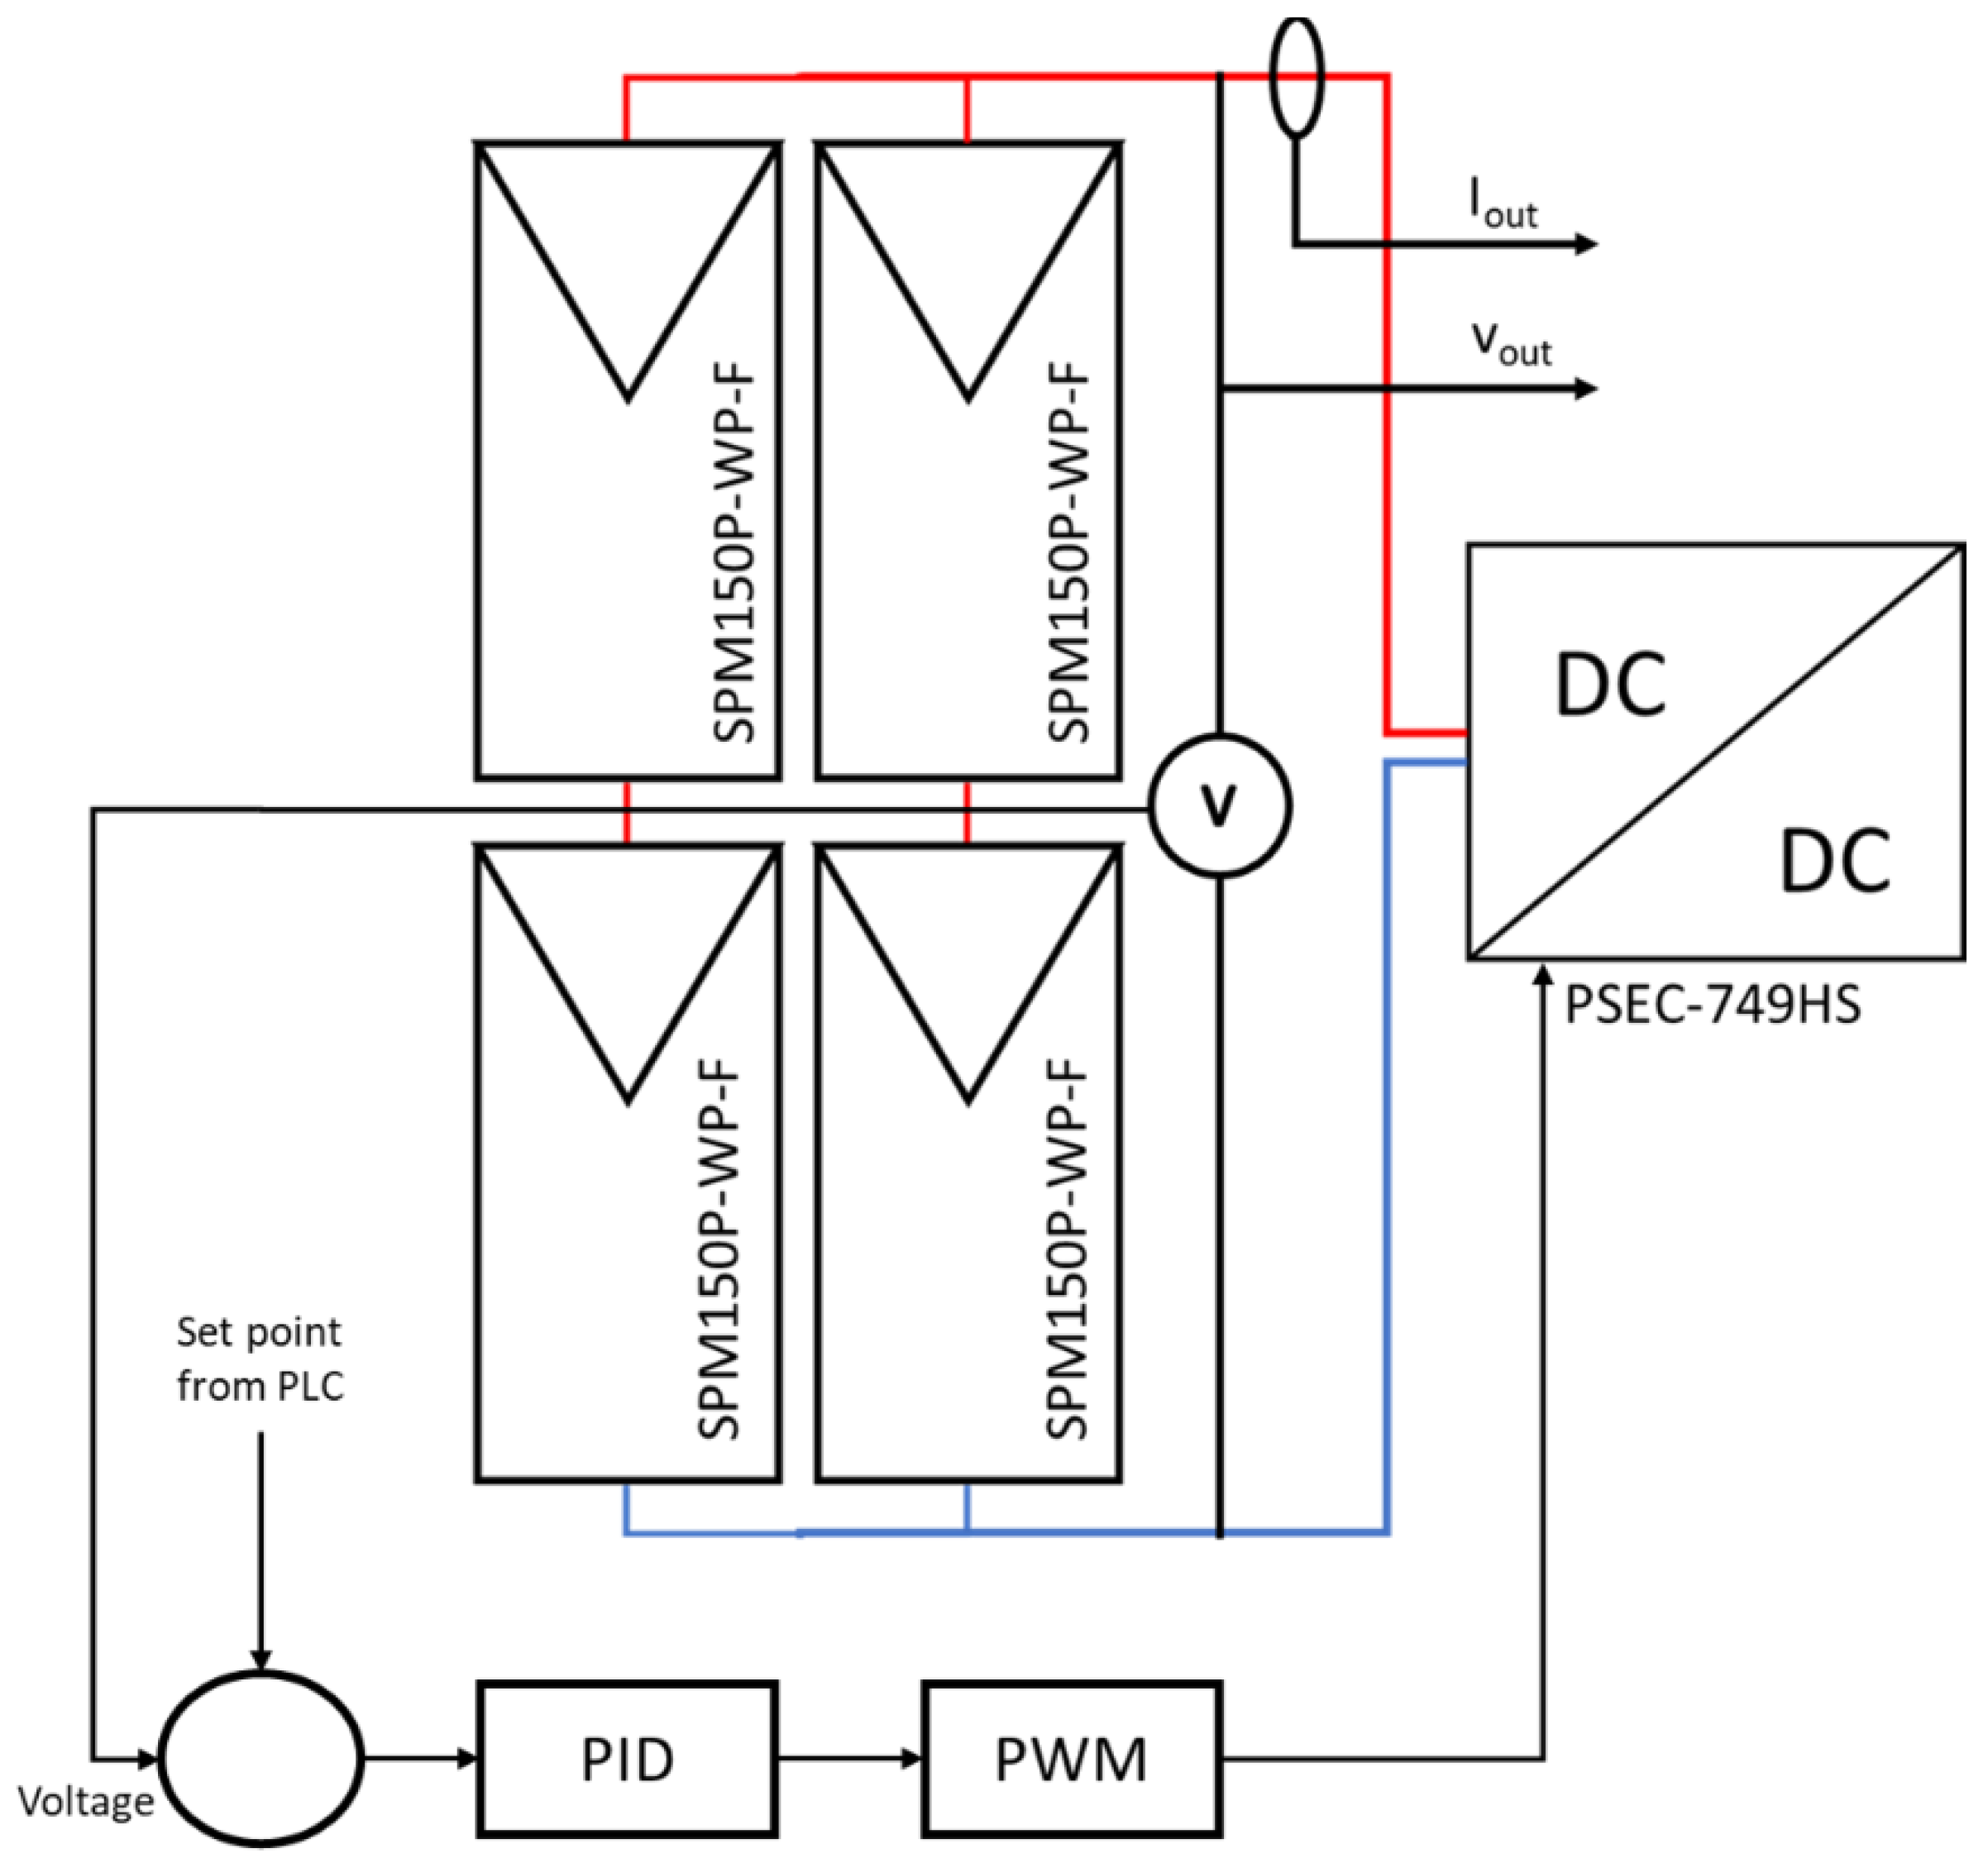
In this part, we design the solar photovoltaic energy generation. We have mentioned that the solar panel power is up to 600 W; the best optimal choice is four photovoltaic panels of 150 watts of each type; the voltage shall be 34, 8 V and the current is 4, 3 A. The output of the PV string is connected to a DC/DC converter, PSEC-749HS, to inject the power received to the DC bus, for which the output voltage shall be 48 VDC, as represented in
Figure 8. The converter is controlled using the PID and PWM in order to track the maximum power point of the PV [
49]. The set point can be changed using the PLC controller and can be connected to a control algorithm in the server using C++, Python, or other languages. Taking into consideration the voltage reference [
50], the user can also test the fuzzy logic control for MPPT [
51], and compare the different tracking algorithms as a case study scenario. The test bench user will be able to see the produced current and voltage of the whole photovoltaic string.
Table 4 elucidates the different characteristics of the selected PV module.
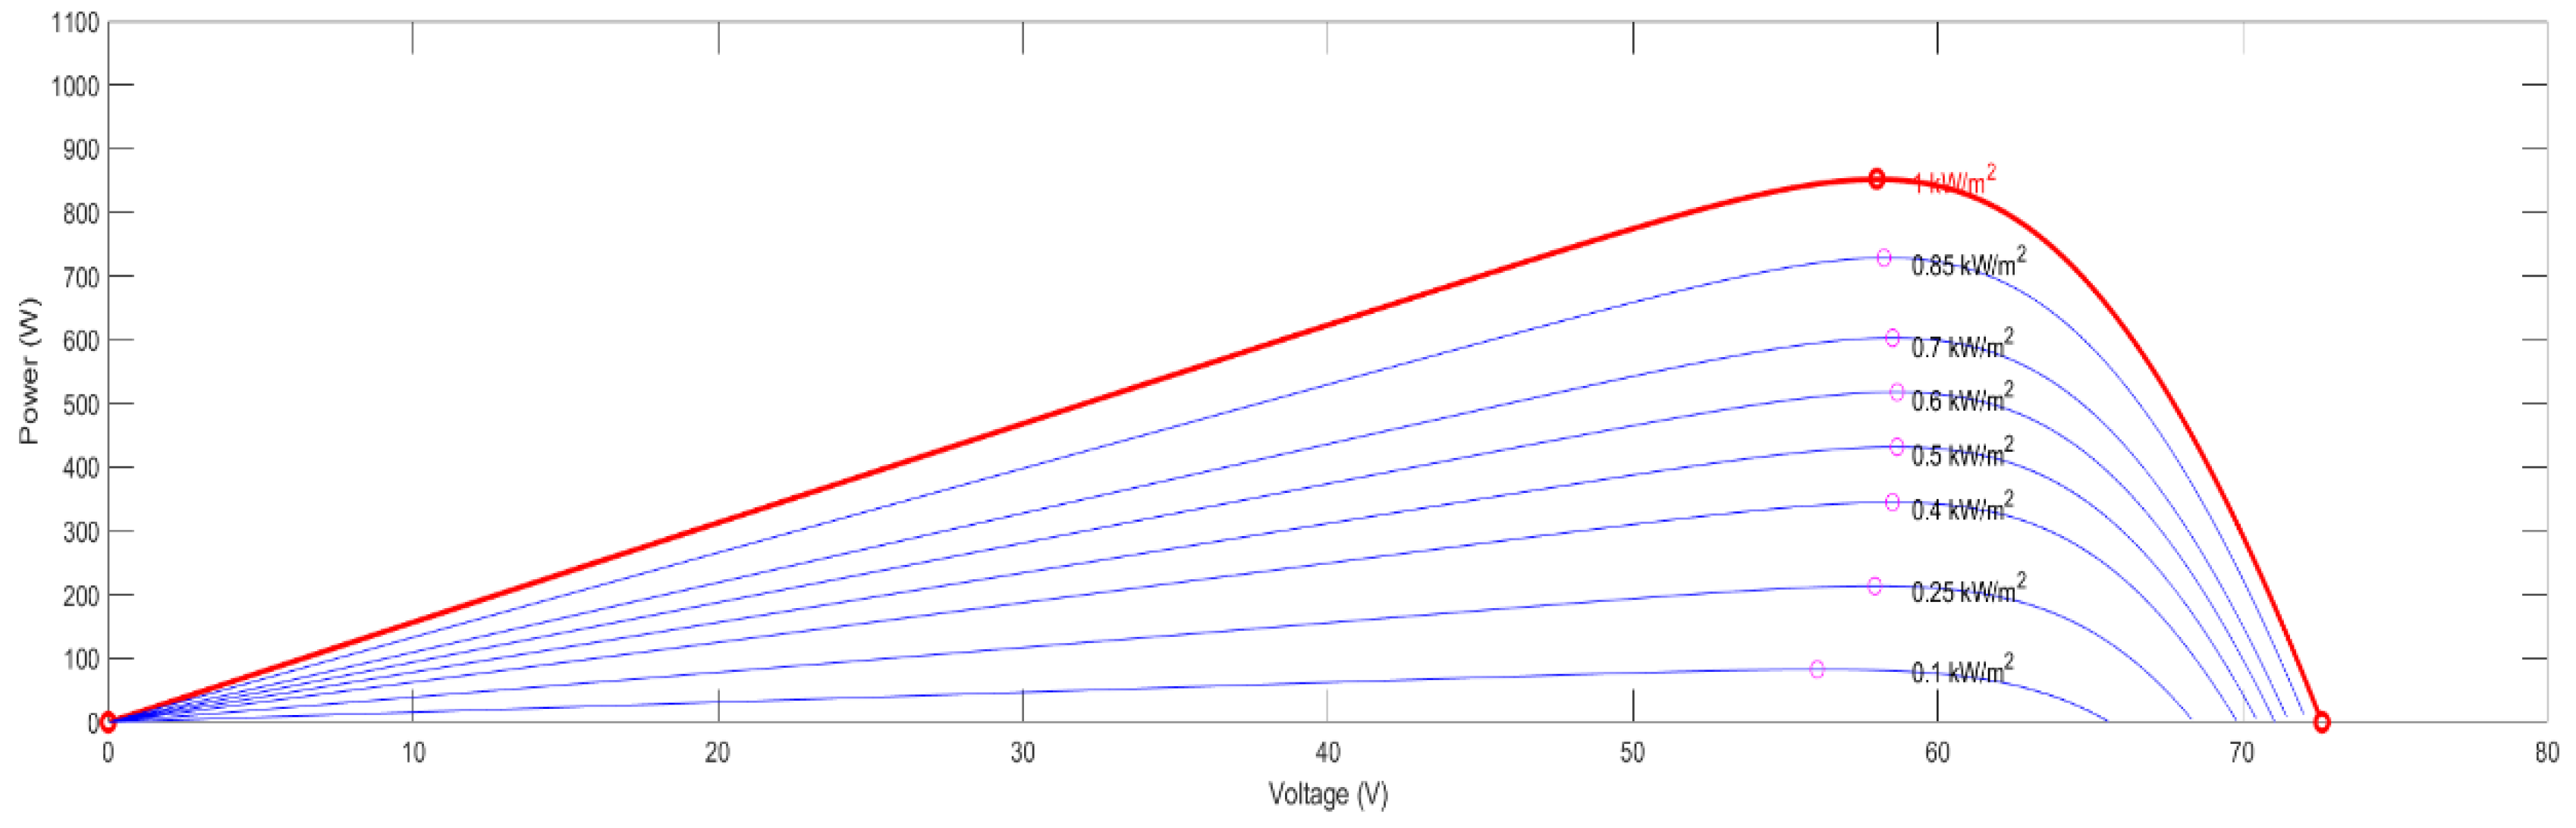
4.2.2. Simulation
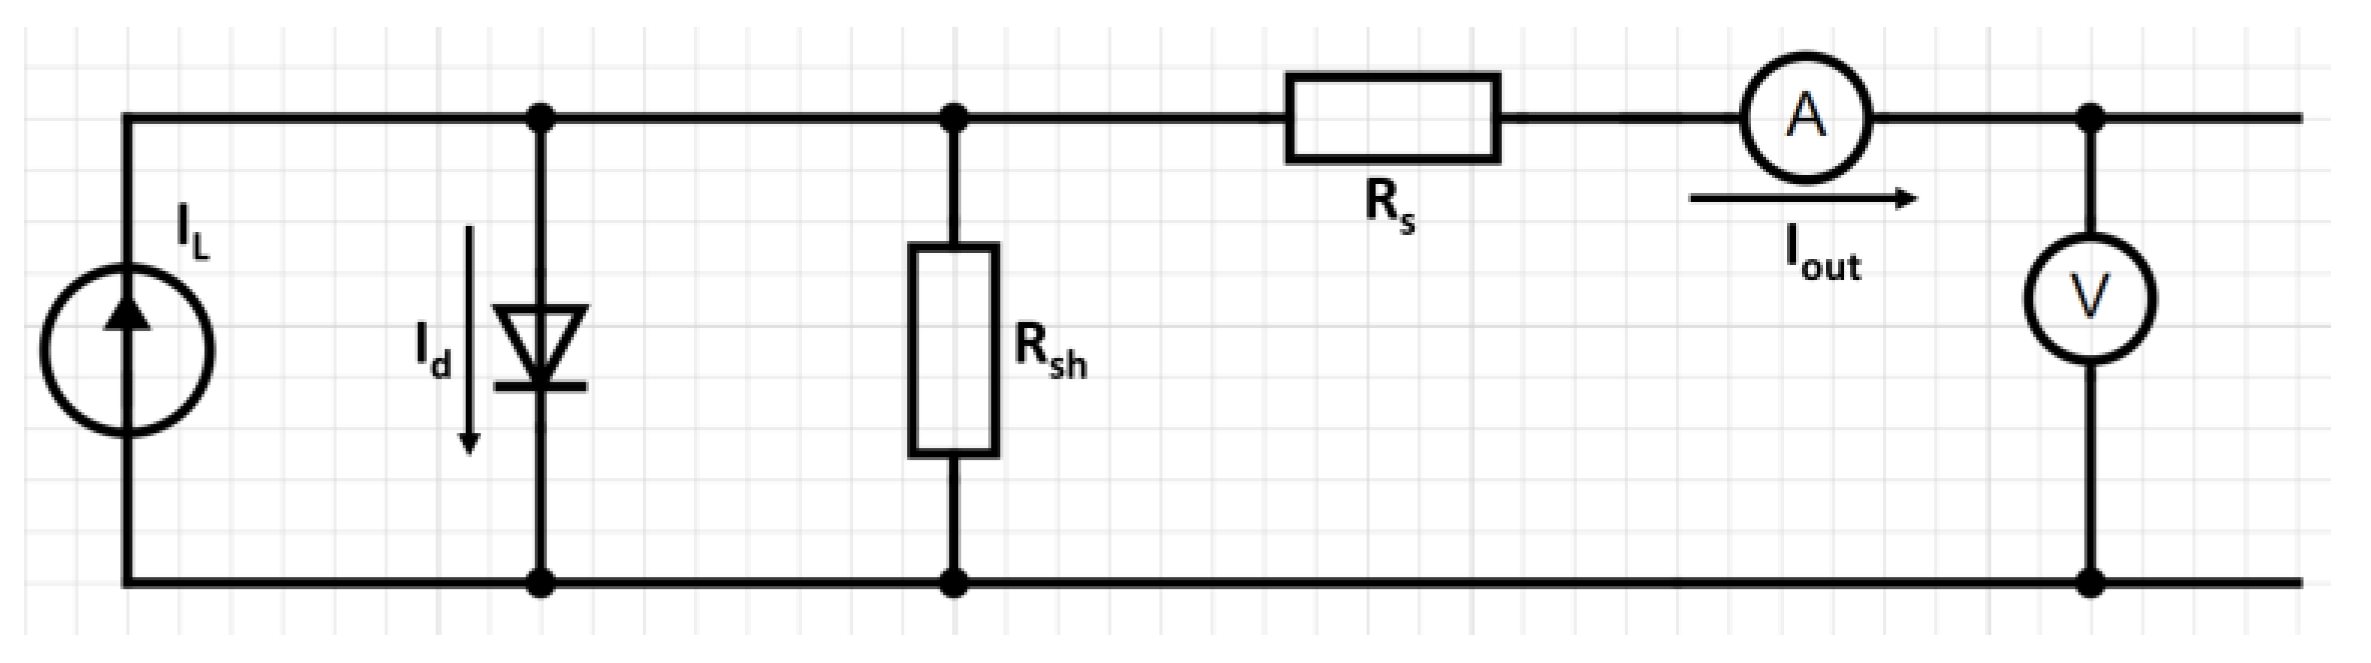
In the simulation, the user of the test bench can always run simulations from a software to compare with the device under testing. The model uses the diode I–V characteristics for each module using Equations (9) and (10), where
Id (A) and
Vd (V) are the diode current and voltage,
I0 (A) is the diode saturation current,
nI is the diode ideality factor, which is a number close to 1.0; the
k Boltzman constant = 1.3806 × 10
−23 J.K
−1; the q electron charge = 1.6022 × 10
−19 C;
T is the cell temperature (K);
Ncell is the number of cells connected in a series in a module.
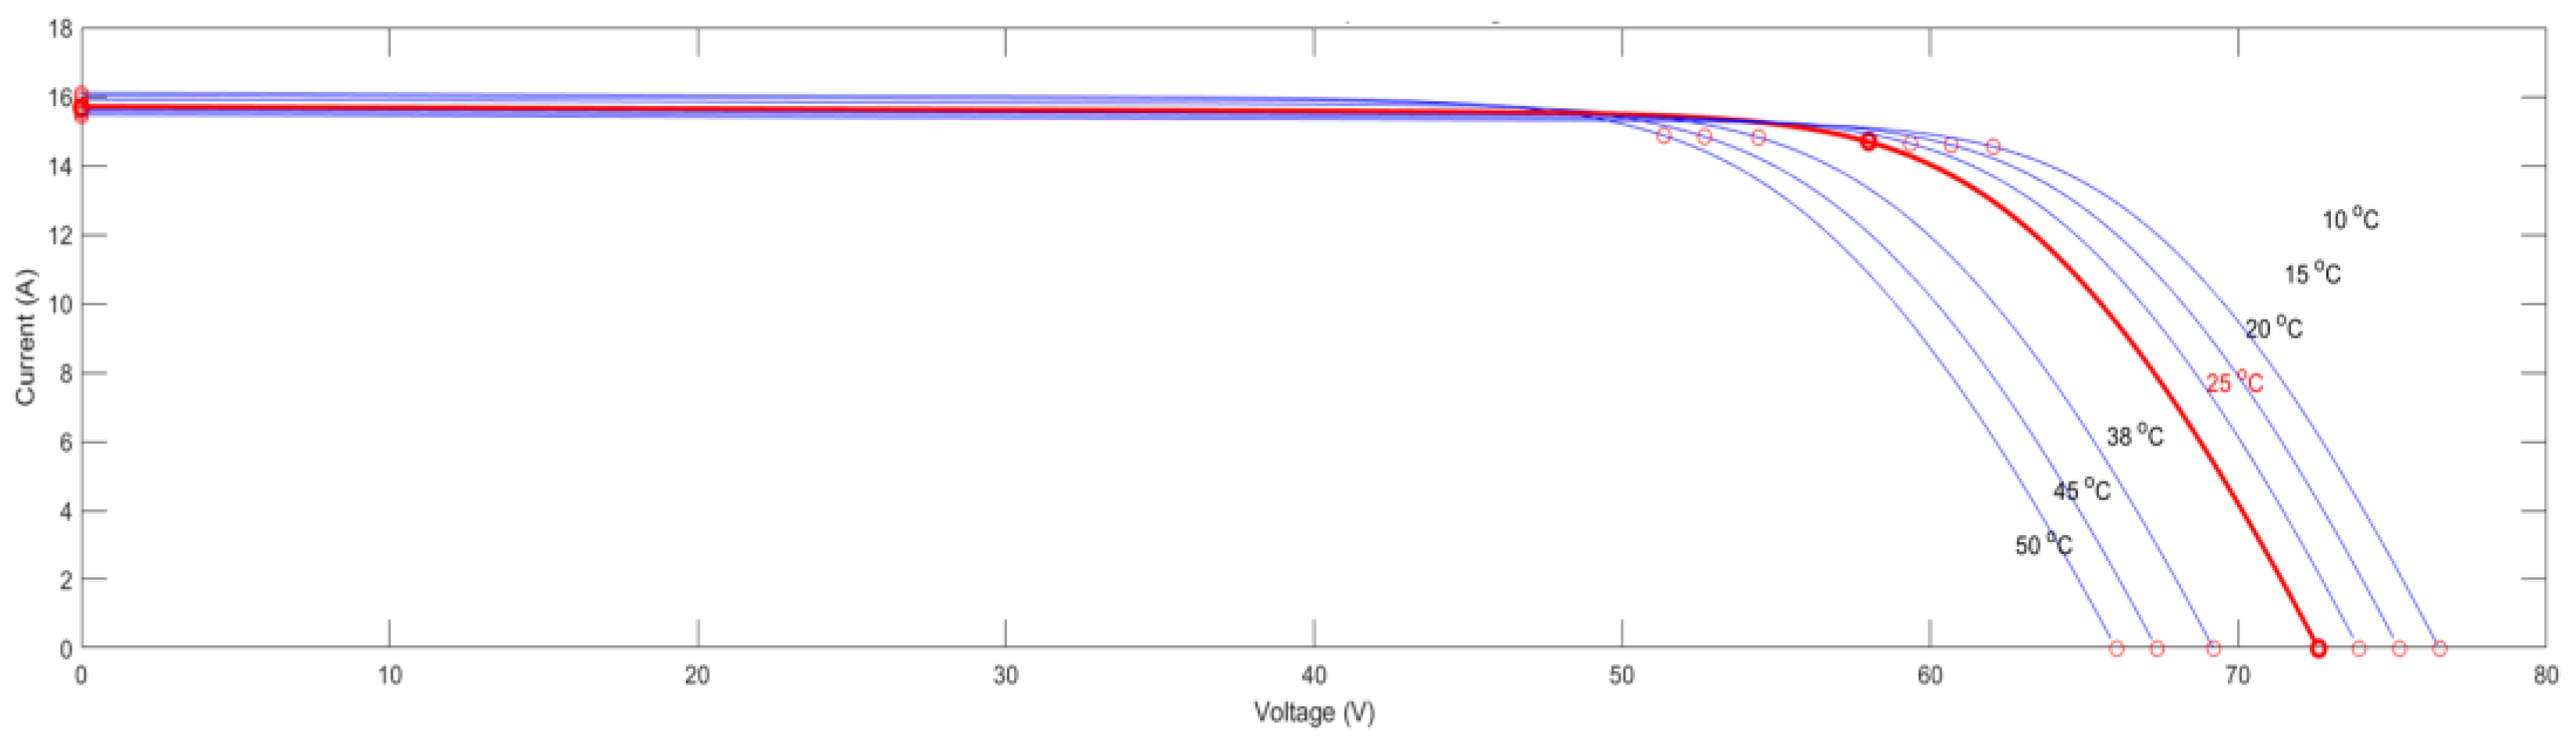
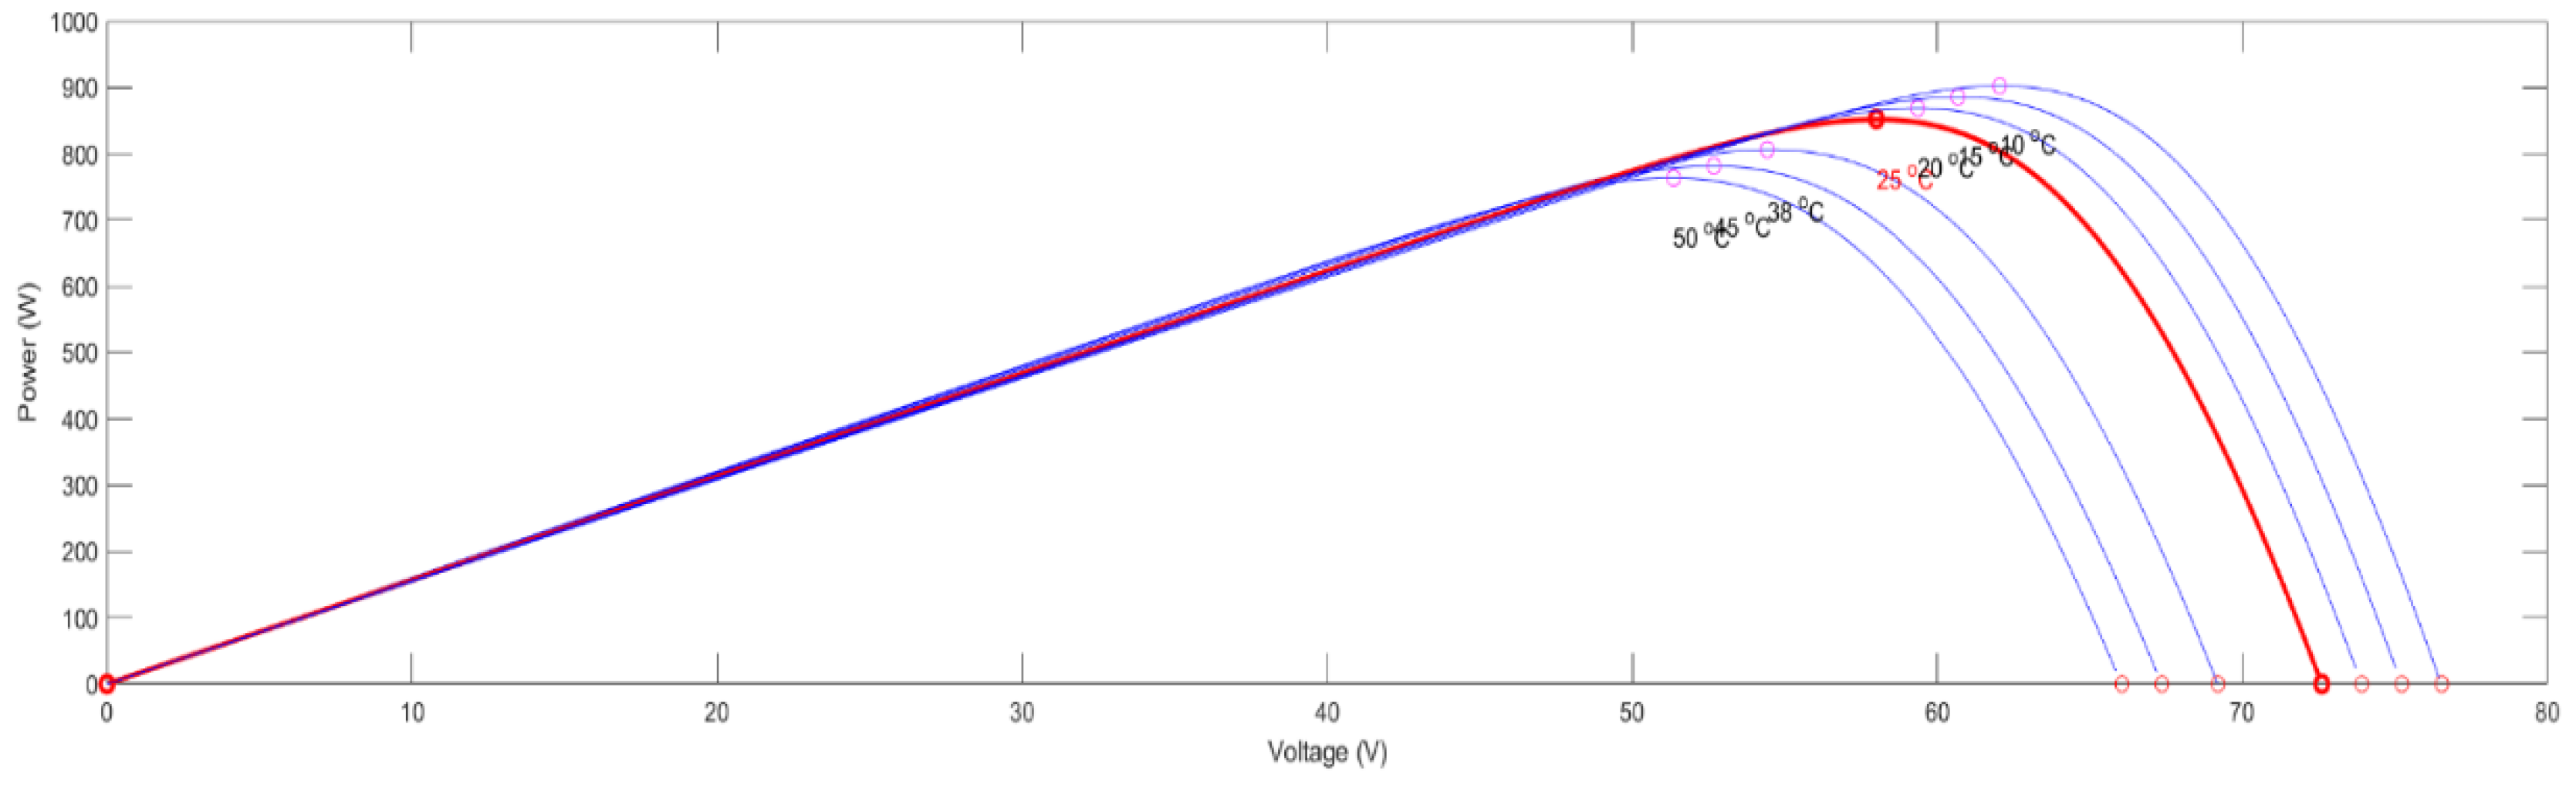
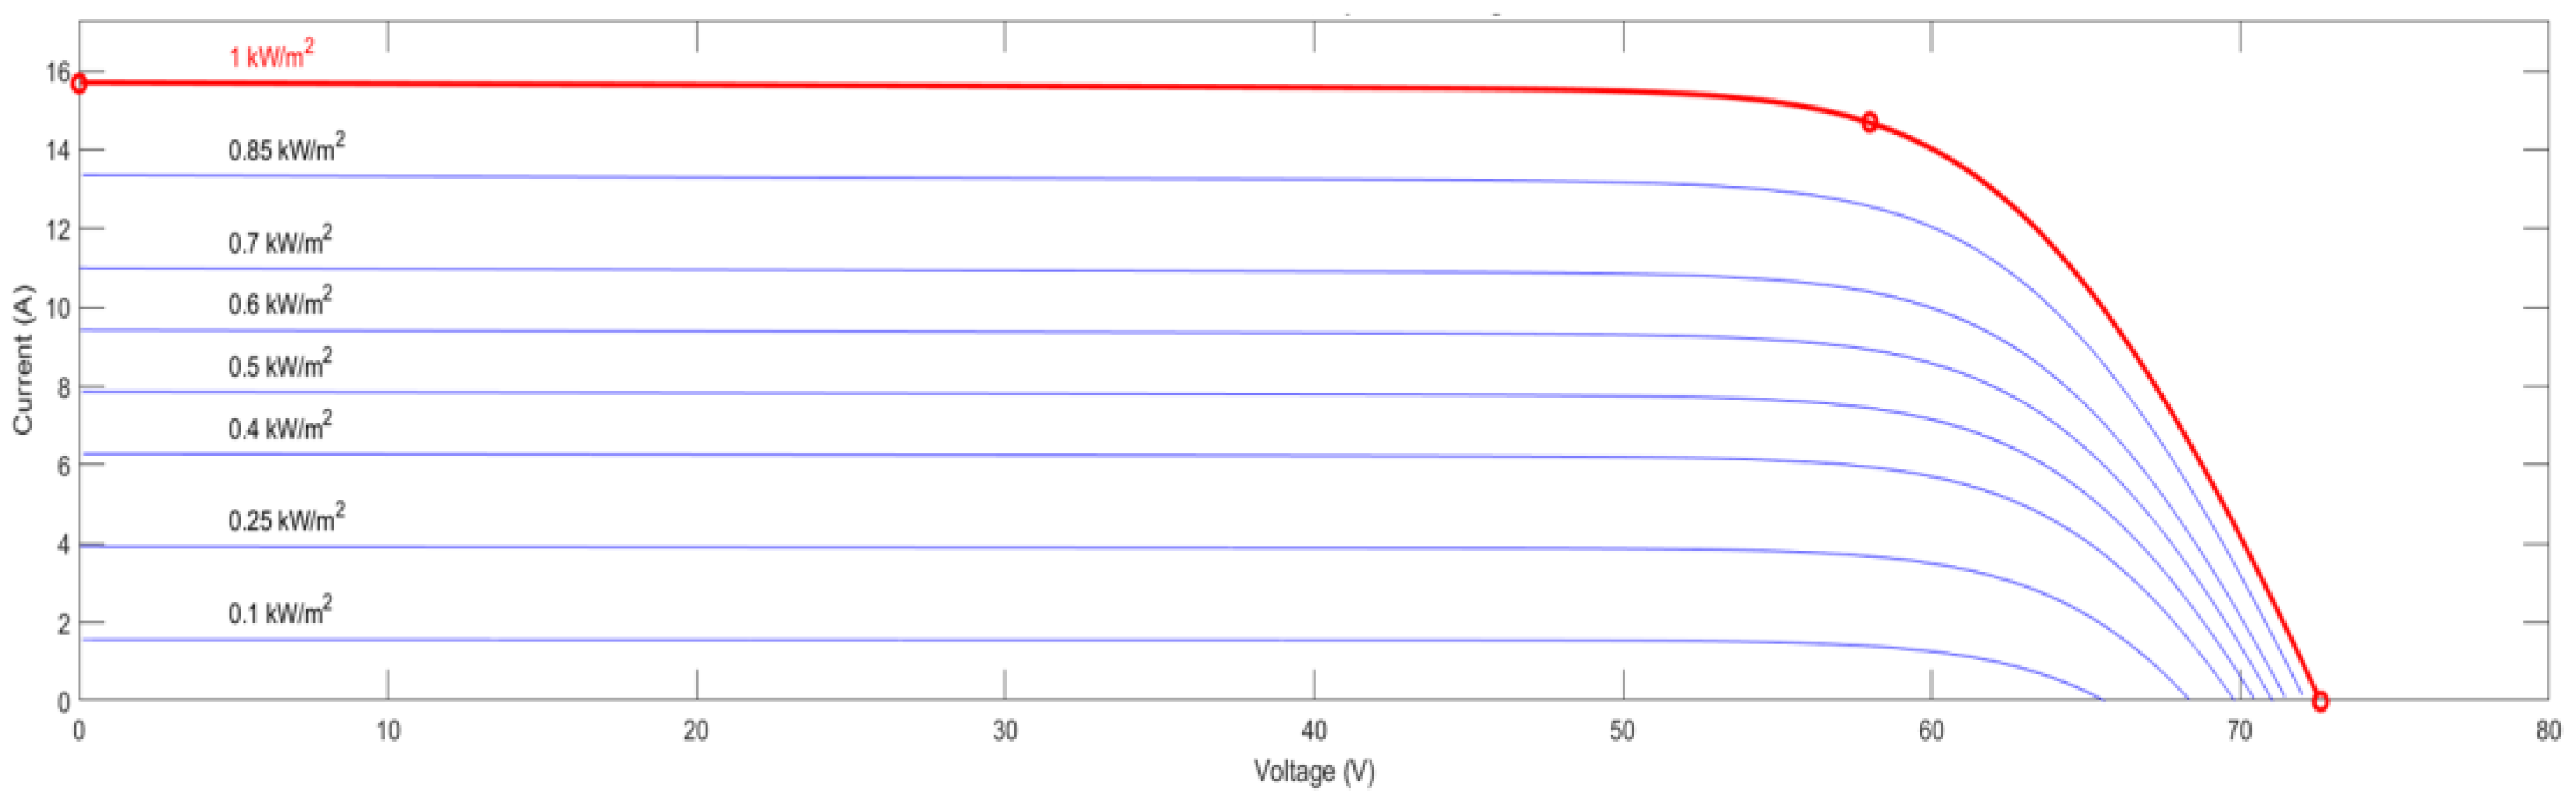
Figure 9 represents the equivalent model of the photovoltaic cell, which is used to simulate the selected photovoltaic panels in results elucidated in
Figure 10,
Figure 11,
Figure 12 and
Figure 13, in which the power characteristics are represented in different temperatures and irradiance, illustrating the efficiency of the PV system and the coherence with the designed hybrid energy system.
4.3. Wind Power
4.3.1. Design
As mentioned in the power flow design, the wind power is estimated to have a maximum of 1 kW. In order to increase the case studies in this test bench and scenarios, two wind turbines of 500 W each were chosen.
The goal behind choosing two wind power systems is for the diagnostic feature of the testbench; for example, the user can set a defect in a system and compare it with the healthy one, then training the clustering algorithm based on the data acquired by sensors and labelling them, as well as studying multi-source injection in the power system.
Therefore, the chosen wind turbine is ATO -WT-500M2 with the ATO-WTCMPPT-500 controller, in which the output voltage is 48 V AC and the nominal current is 6 A. The output of the system is connected to an AC/DC converter type HVI 3K5-3U4, in order to inject the produced energy into the DC bus.
Table 5 represents the different characteristics of the selected wind turbine, where it is illustrated that the system is very efficient and coherent with designed hybrid energy.
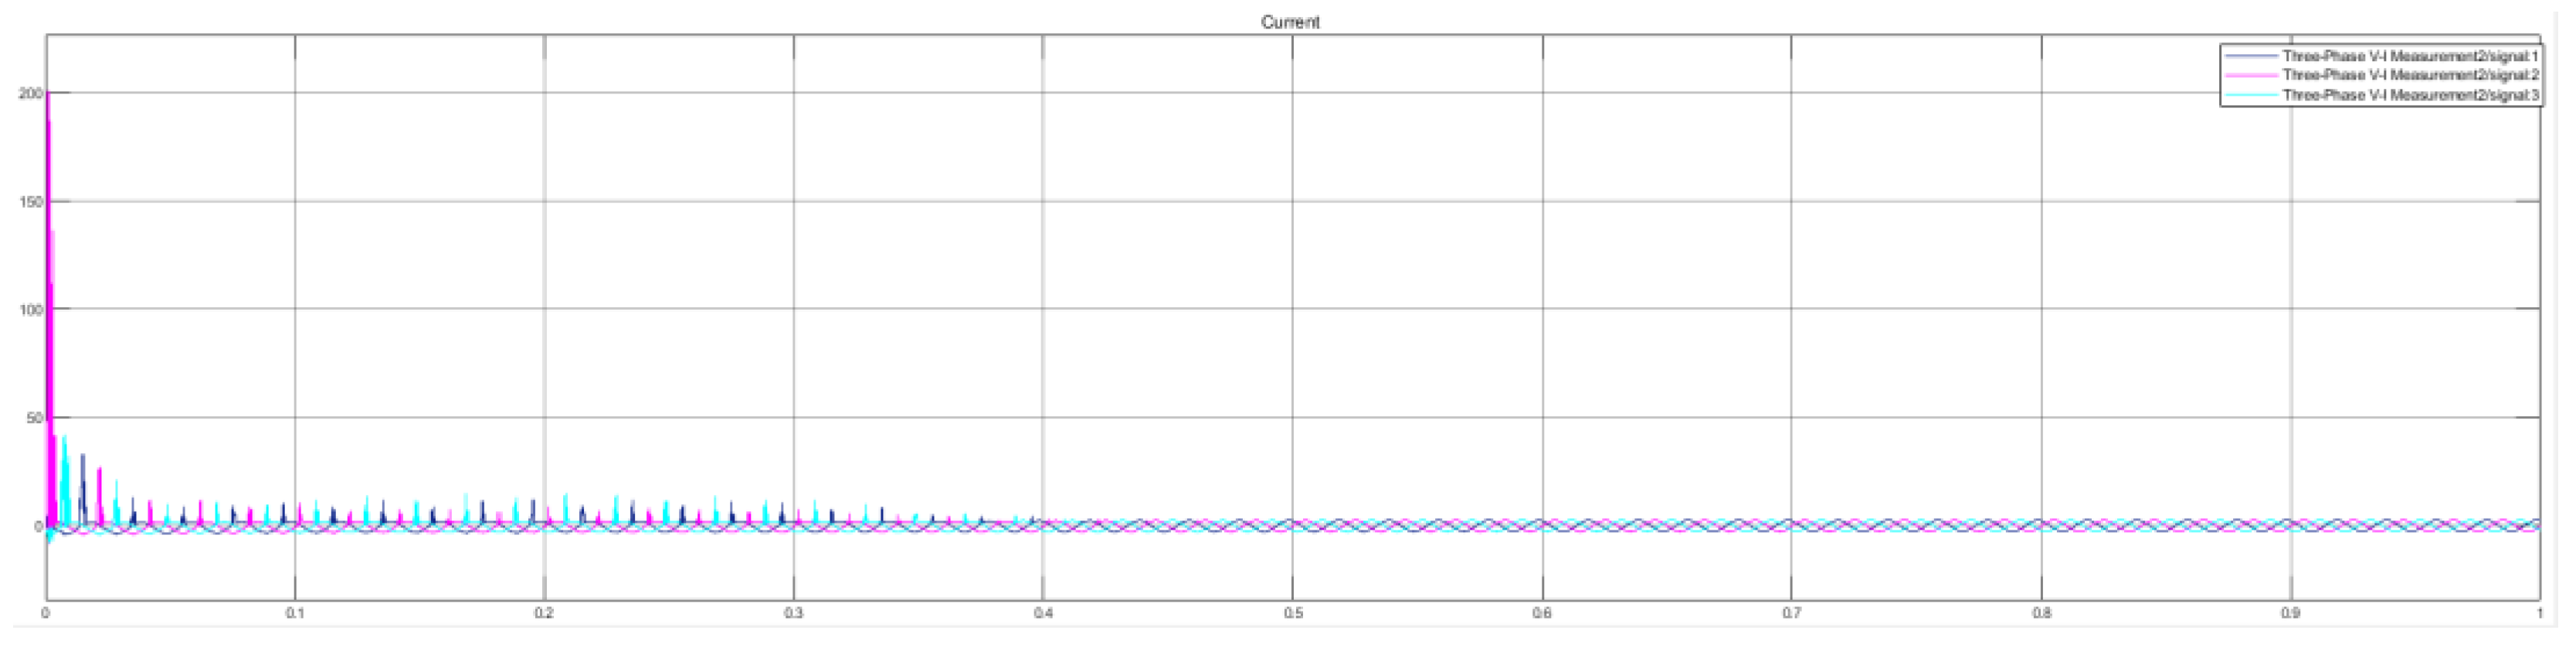
4.3.2. Simulation
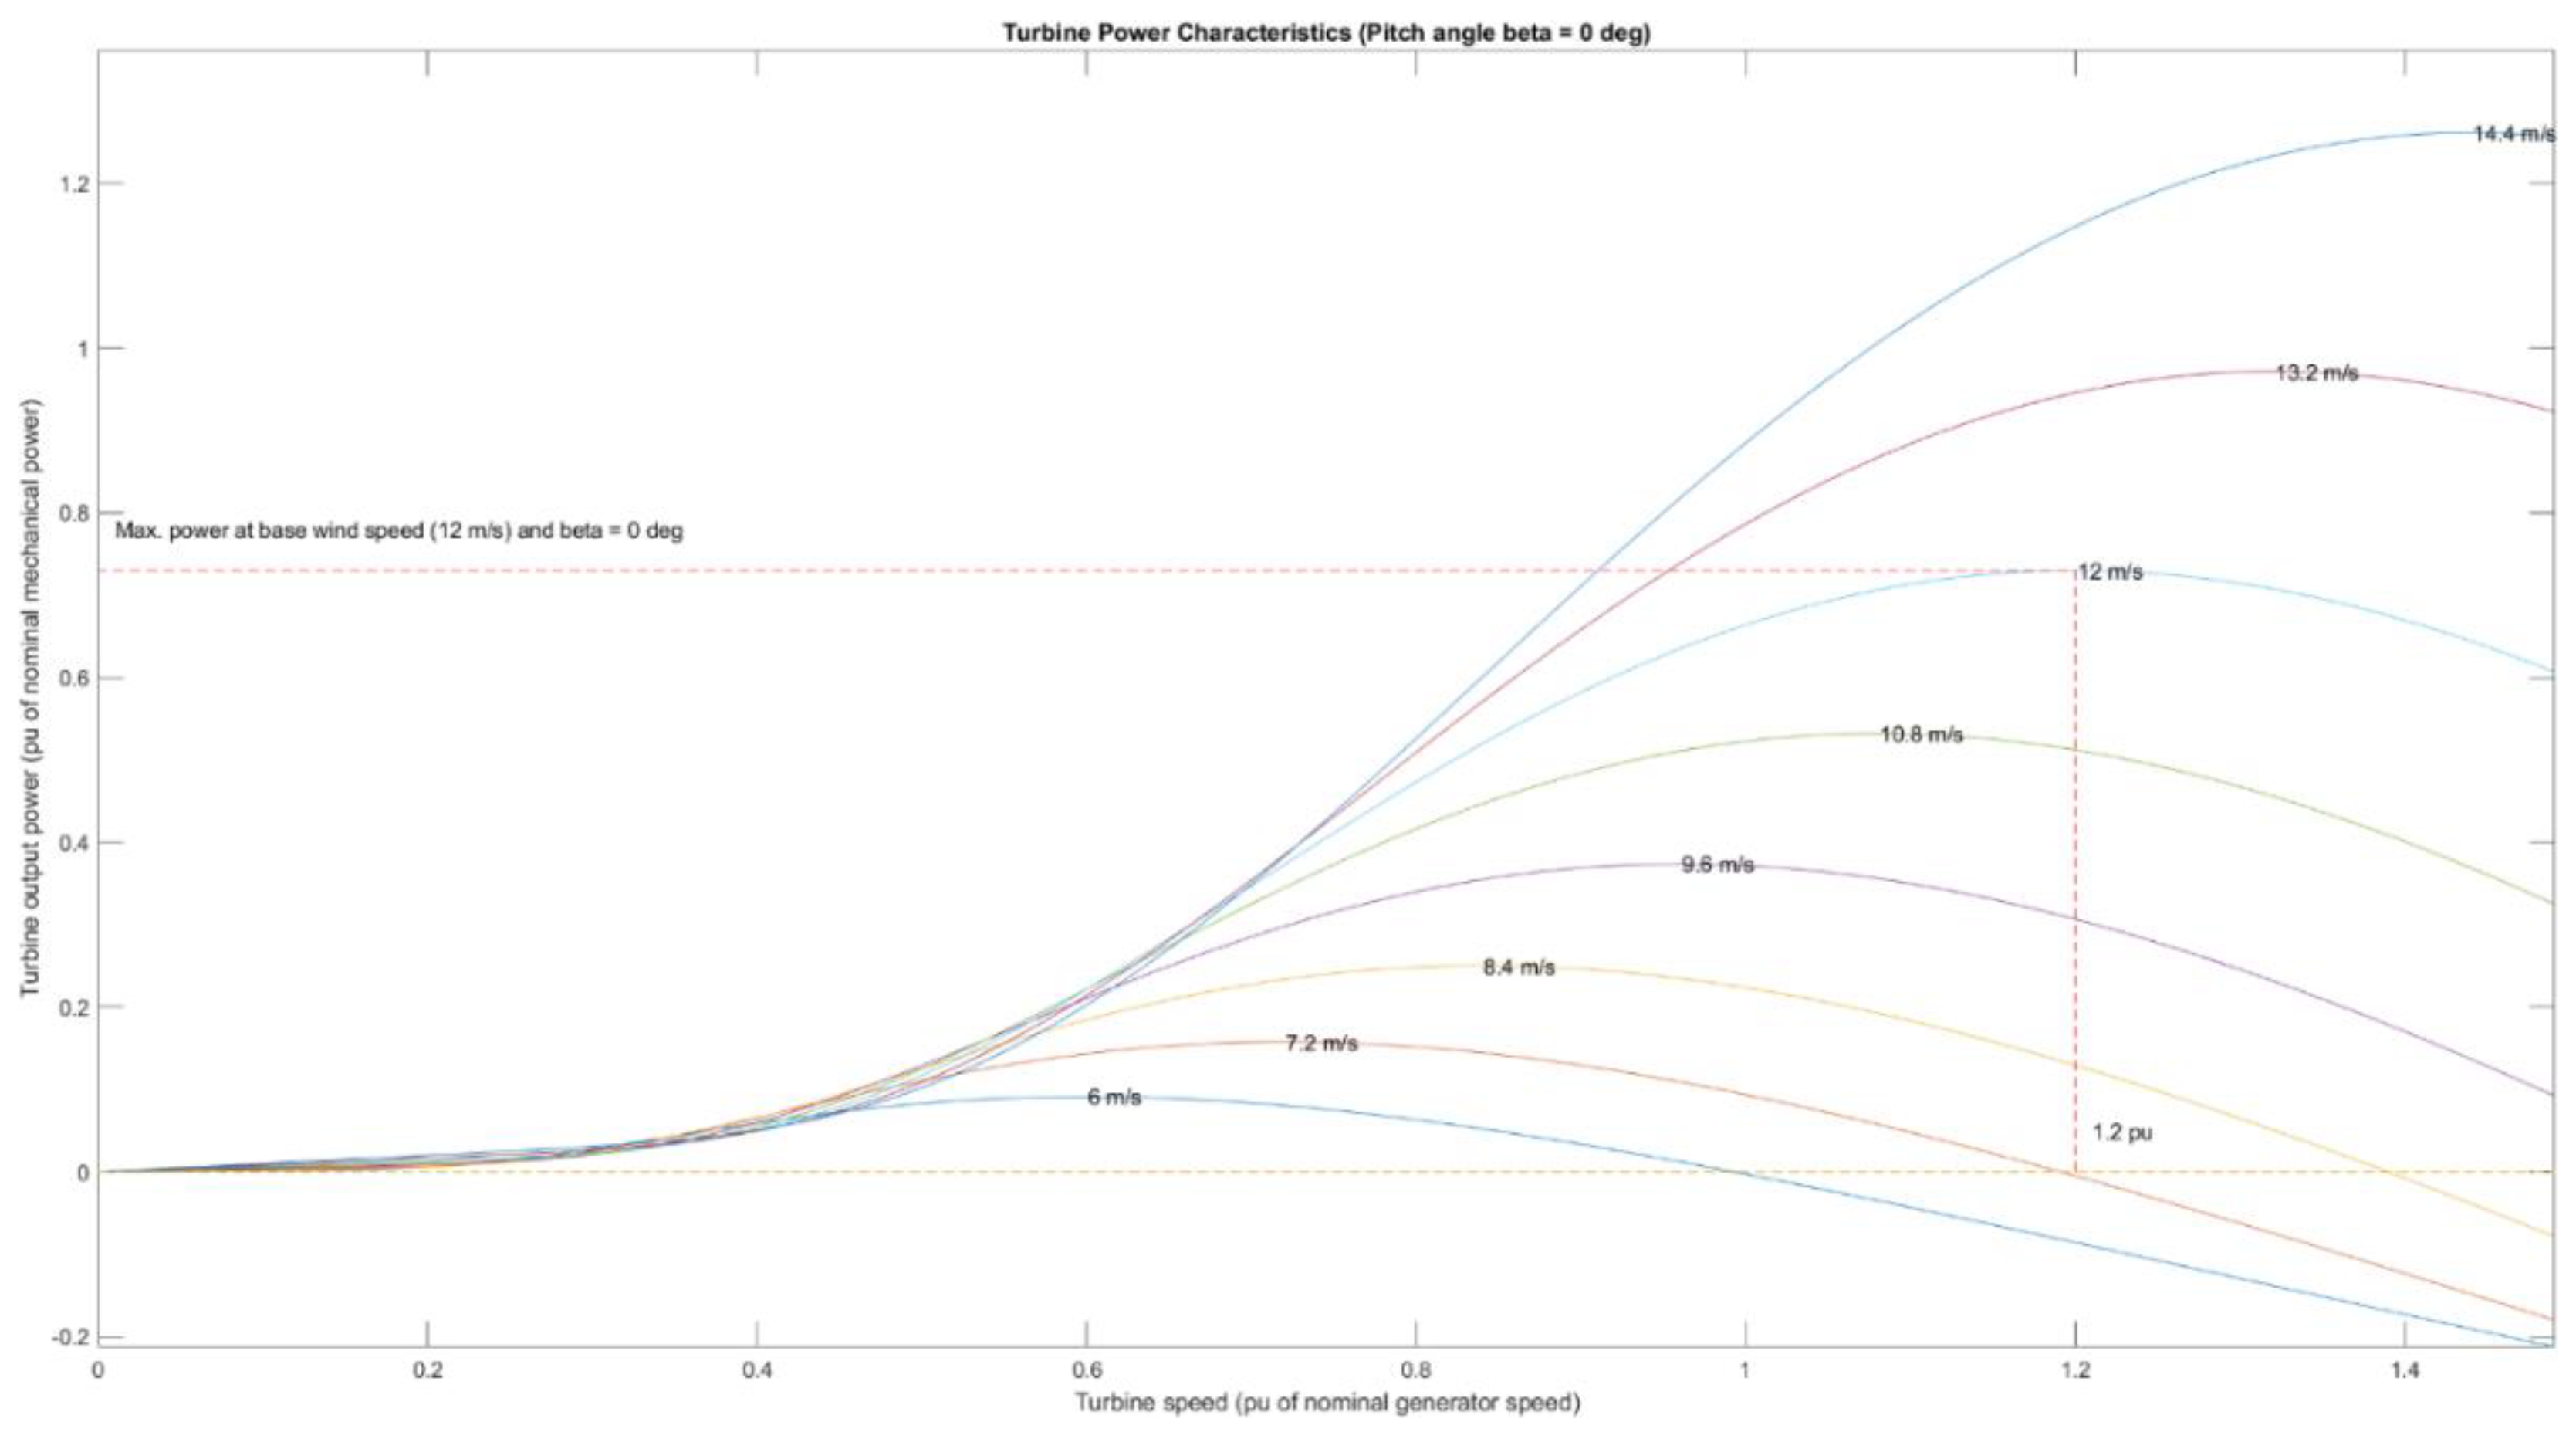
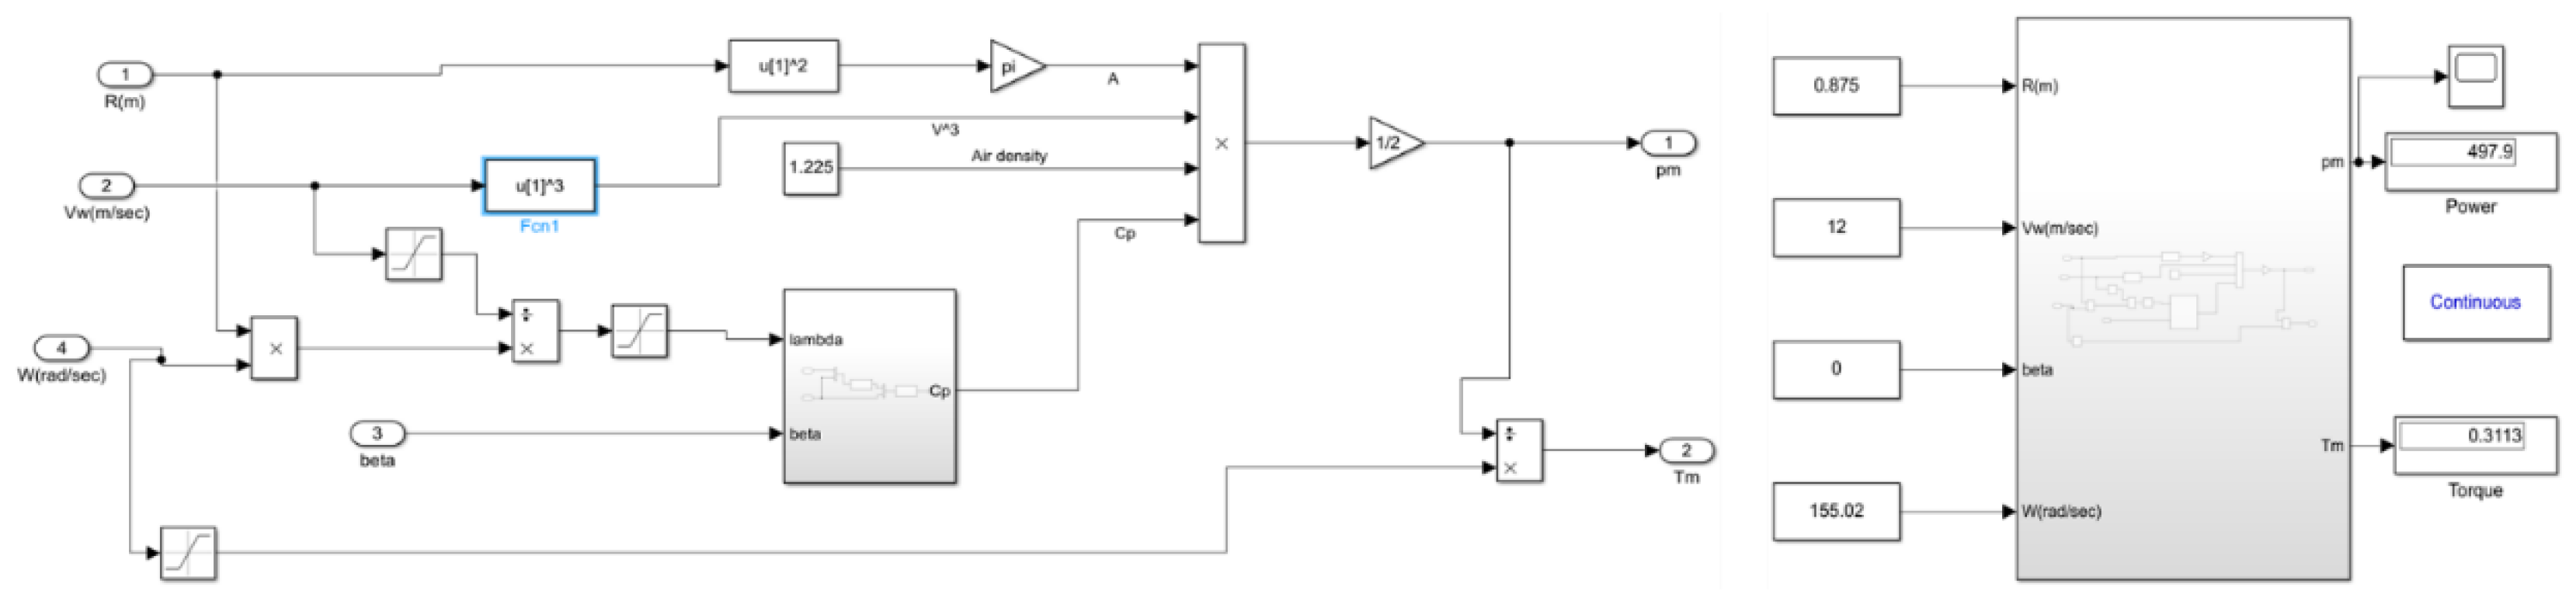
The modeling of the wind power system includes 500 W, so in order to simulate the wind power system, we must calculate the performance coefficient of the wind turbine, Cp(λ,β).
The output power of the turbine is as mentioned in Equation (11), where
Pm = 500 W; ρ is the air density 1225 (kg/m²); A is the area swept (m²);
Vw is the speed of wind (m/s); λ is the tip speed ratio; β is the blade pitch angle (deg), as elucidated in
Figure 14.
The chosen wind turbine in our design has a rayon of R = 0.875. The average wind speed shall be 12 m/s, based on Equation (11), and the calculated performance coefficient is
Cp(λ,β) = 0.171855. Based on 12, 13, and 14, we can estimate that Wr is 155.02 rad/s. The model in Matlab Simulink in
Figure 15 elucidates that the calculated Wr and the chosen wind turbine can deliver up to 500 W.
Figure 16 and
Figure 17 show the simulation of the voltage and current output. The simulation in Matlab represents the Equations (11)–(14), to make the design simple if the user wants to add other wind turbines. The user of the test bench can test the optimal control to increase the efficiency of the wind energy using optimization management algorithms [
52].
4.4. Hydropower
The goal of this part is to select the right hydroelectric turbine, as mentioned in the power flow, where the maximum power is 1 kW. In order to increase the number of scenarios for the diagnostic feature, it is better to use two hydroelectric turbines of 500 W, based on the same idea of the wind power system. The selected type of the hydro generator is HYYKJ-US, which is a permanent magnet generator. The output is 110 V AC, with a maximum current of 4 A, which will be connected to an AC/DC converter type HVI 3K5-3U4, so that the power is injected into the DC bus in 48 VDC.
Table 6 sums up the characteristics of the hydroelectric turbine.
It is necessary to design a prototype of a hydroelectric power station, in order to help students and researchers to see all the components of the power plant. At this point, the right generator is selected, and at the implementation phase, other requirements of safety and water pumping for pumped energy storage will be added and considered.
In future work, a design of the pumping system and the pumped storage can illustrate the hydroelectric power plants in a laboratory scale, which will help students and the users of the test bench to see the different components of this type of power plant. The instrumentation, power sharing, and data management shall still be the same to respect the modularity feature of the designed system, therefore making it easy to implement.
4.5. Fuel Cells
4.5.1. Design
In order to select the right fuel cell to diversify the power sources in this educational test bench, it is better to use low-power fuel cells, because they are very cheap and easy to maintain. For this application, two fuel cells of 60 W, type G-HFCS-60W, are selected; their output voltage is 13 VDC and they have a current of 4.6 A. It is mandatory to use a DC/DC converter to inject the power in the DC bus. In this case, there was use of PSEC-749HS, which can deliver the 48 VDC.
Table 7 elucidates the characteristics of the selected fuel cells.
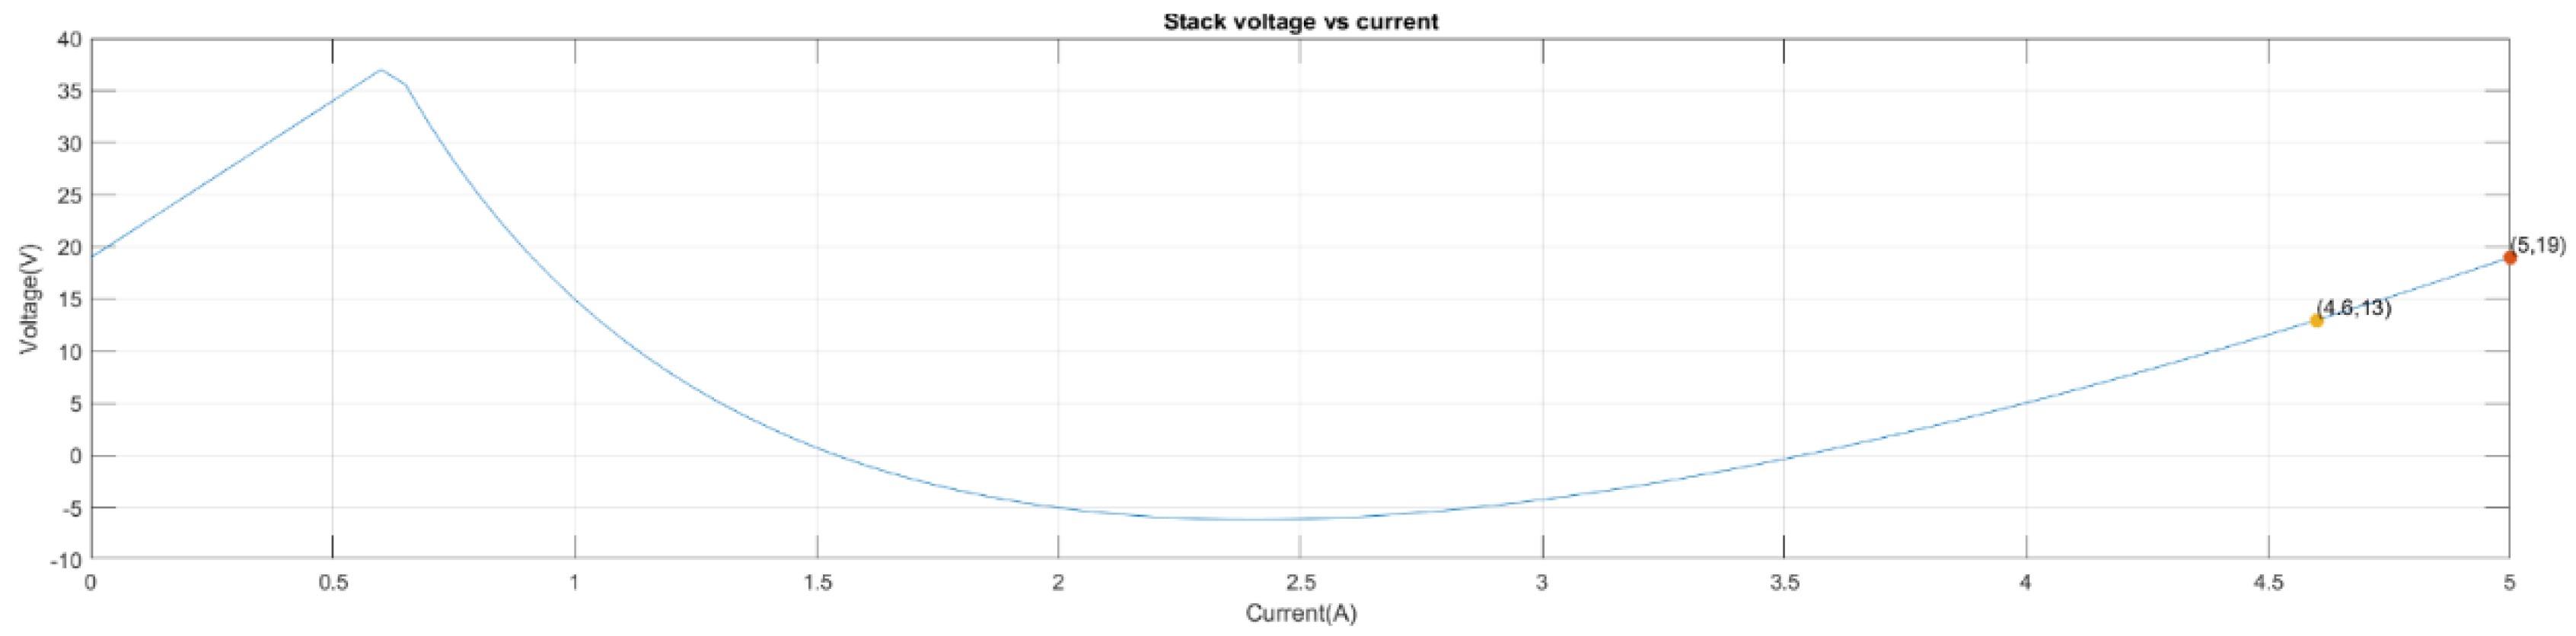
4.5.2. Simulation
The simulation of the designed fuel cell uses the model on Matlab Simulink, which is the simplified model of fuel cell stack operating at nominal conditions of temperature and pressure. The parameters used in this model are the equivalent circuit, and can be modified based on the polarization curve obtained from the manufacturer datasheet. We have entered the specific characteristics of the cell, and the model has elucidated that the current can achieve 4, 6 A at 13 V, as
Figure 18 and
Figure 19 show. As mentioned, the power delivered by each cell is set to 60 W. The model calculates the nominal power, which is 59.8 W.
4.6. Sensors and Data Acquisition
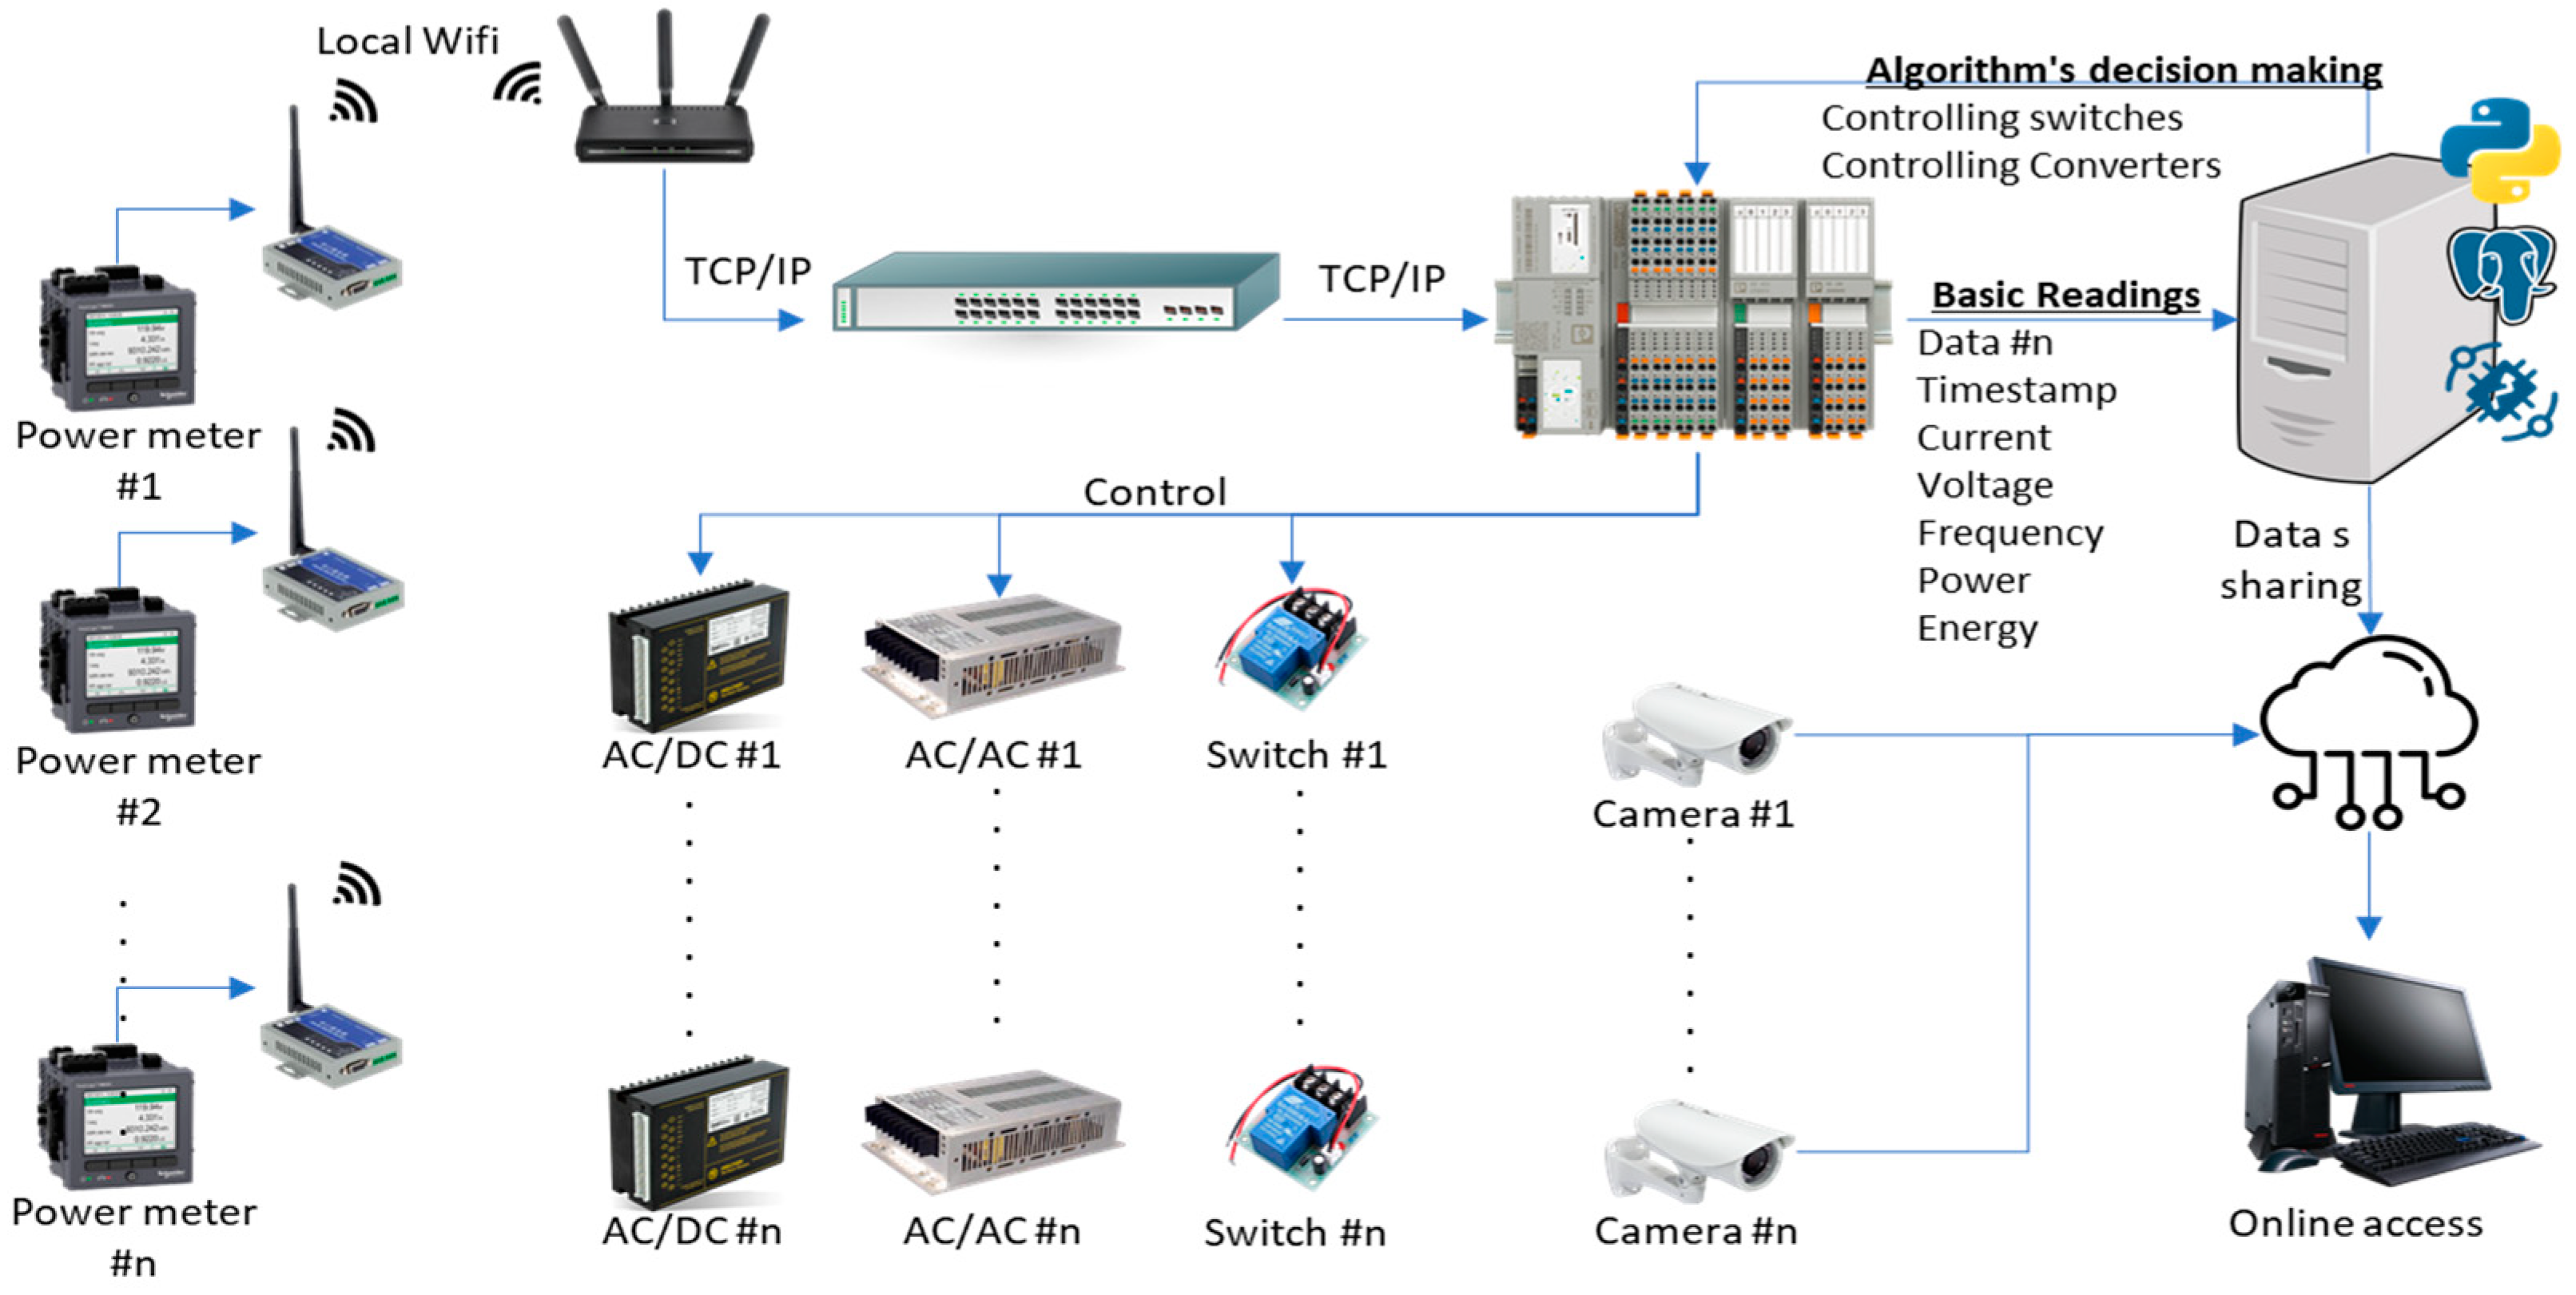
The goal in this section is to design and select the right sensors, which will be the main component or feature of this test bench. In smart grids, the data management is the key element that enables optimization, prediction, and control; therefore, to collect basic energy readings such as current, voltage, and power, the best optimal choice is the PAC2100 smart meter which, as described in the characteristics in
Table 8, has Wi-Fi communication sharing data over the Modbus protocol, so it can get easily connected with any type of Programmable Logic Controller (PLC). These data shared on Modbus protocol can be retrieved using multiple-connection RTU RS485, or by adding a Wi-Fi TCP/IP gateway, or over ethernet. The user of the test bench can select the preferable way for the communication, which will increase the number of case studies of the proposed system, networking, and data acquisition between energy meters in smart grids. Other sensors can be added to the test bench, for example temperature and irradiance for the photovoltaic system, the speed of wind turbine or hydro turbine, and temperature sensors for the ESS and fuel cells. The users may also add vibration sensors or moisture, etc. Due to the modularity of the test bench, all the sensors can be directly connected and configured to the system if the data acquisition simply has a Modbus interface over TCP/IP, using the same access point which is connected directly to the switch of the server.
In order to manage the energy distribution, the test bench has eight switches. Conversely, the user can add more switches for further advanced control, or add new sources or loads respecting the DC bus injection requirements discussed in the previous sections. These switches are controlled by a Phoenix Contact PLC type, PLCNext. The selection of this PLC was based on the multiple programming methods where the user can program it using C++, Python, or classical automation programming such as LADDER or Functional Bloc Diagrams, which make it very simple to interact with the developed forecasting and diagnosis algorithms in the database.
Therefore, the user of the test bench can also use it for automation control case studies, mainly programming, wiring, controlling, and developing SCADA system views. The developed SCADA view is connected to a PostgreSQL database. Thingsboard platform shall be used for visualization of the energy distribution, and the state of each test bench’s components, as elucidated in
Figure 20.
4.7. Design Result
In addition to the selected equipment, power sources systems, and the control systems, the user can use two types of loads, which can be replaced easily. Or, more loads can be added, respecting the requirements of the DC bus. For the DC load, a DC brushed motor of 500 W operating under a voltage of 48 V can directly connected to the DC bus or by using the DC/DC converter type PVTC1015-48-48. The motor reference is ATO-80WDM02420.
For the AC load, it is better to use the squirrel cage induction motor of 1100 W operating under a three-phase 380 V AC, with a nominal current of 5 A, type ATO-Y2-90S-4, which is connected to the DC bus using the AC/DC converter CTP6K. The use of these two types of motors will increase the case studies of the test bench, where the user can emulate the characteristics of the motors for electromechanical educational purposes.
Table 9 represents a summary of the all the test bench components.
5. Artificial Intelligence
The use of artificial intelligence in grid and power management has become an important feature; it enables energy demand response forecasting, optimizes power shedding, and classifies power grid defects. As presented in this section, the test bench gives the opportunity to the users to see how the data are being collected from different sensors and power meters, then transferred and stored in a local database. The goal is to make it easy to modify the database architecture while using different prediction, classification, and optimization techniques in different programming languages.
5.1. Data Management
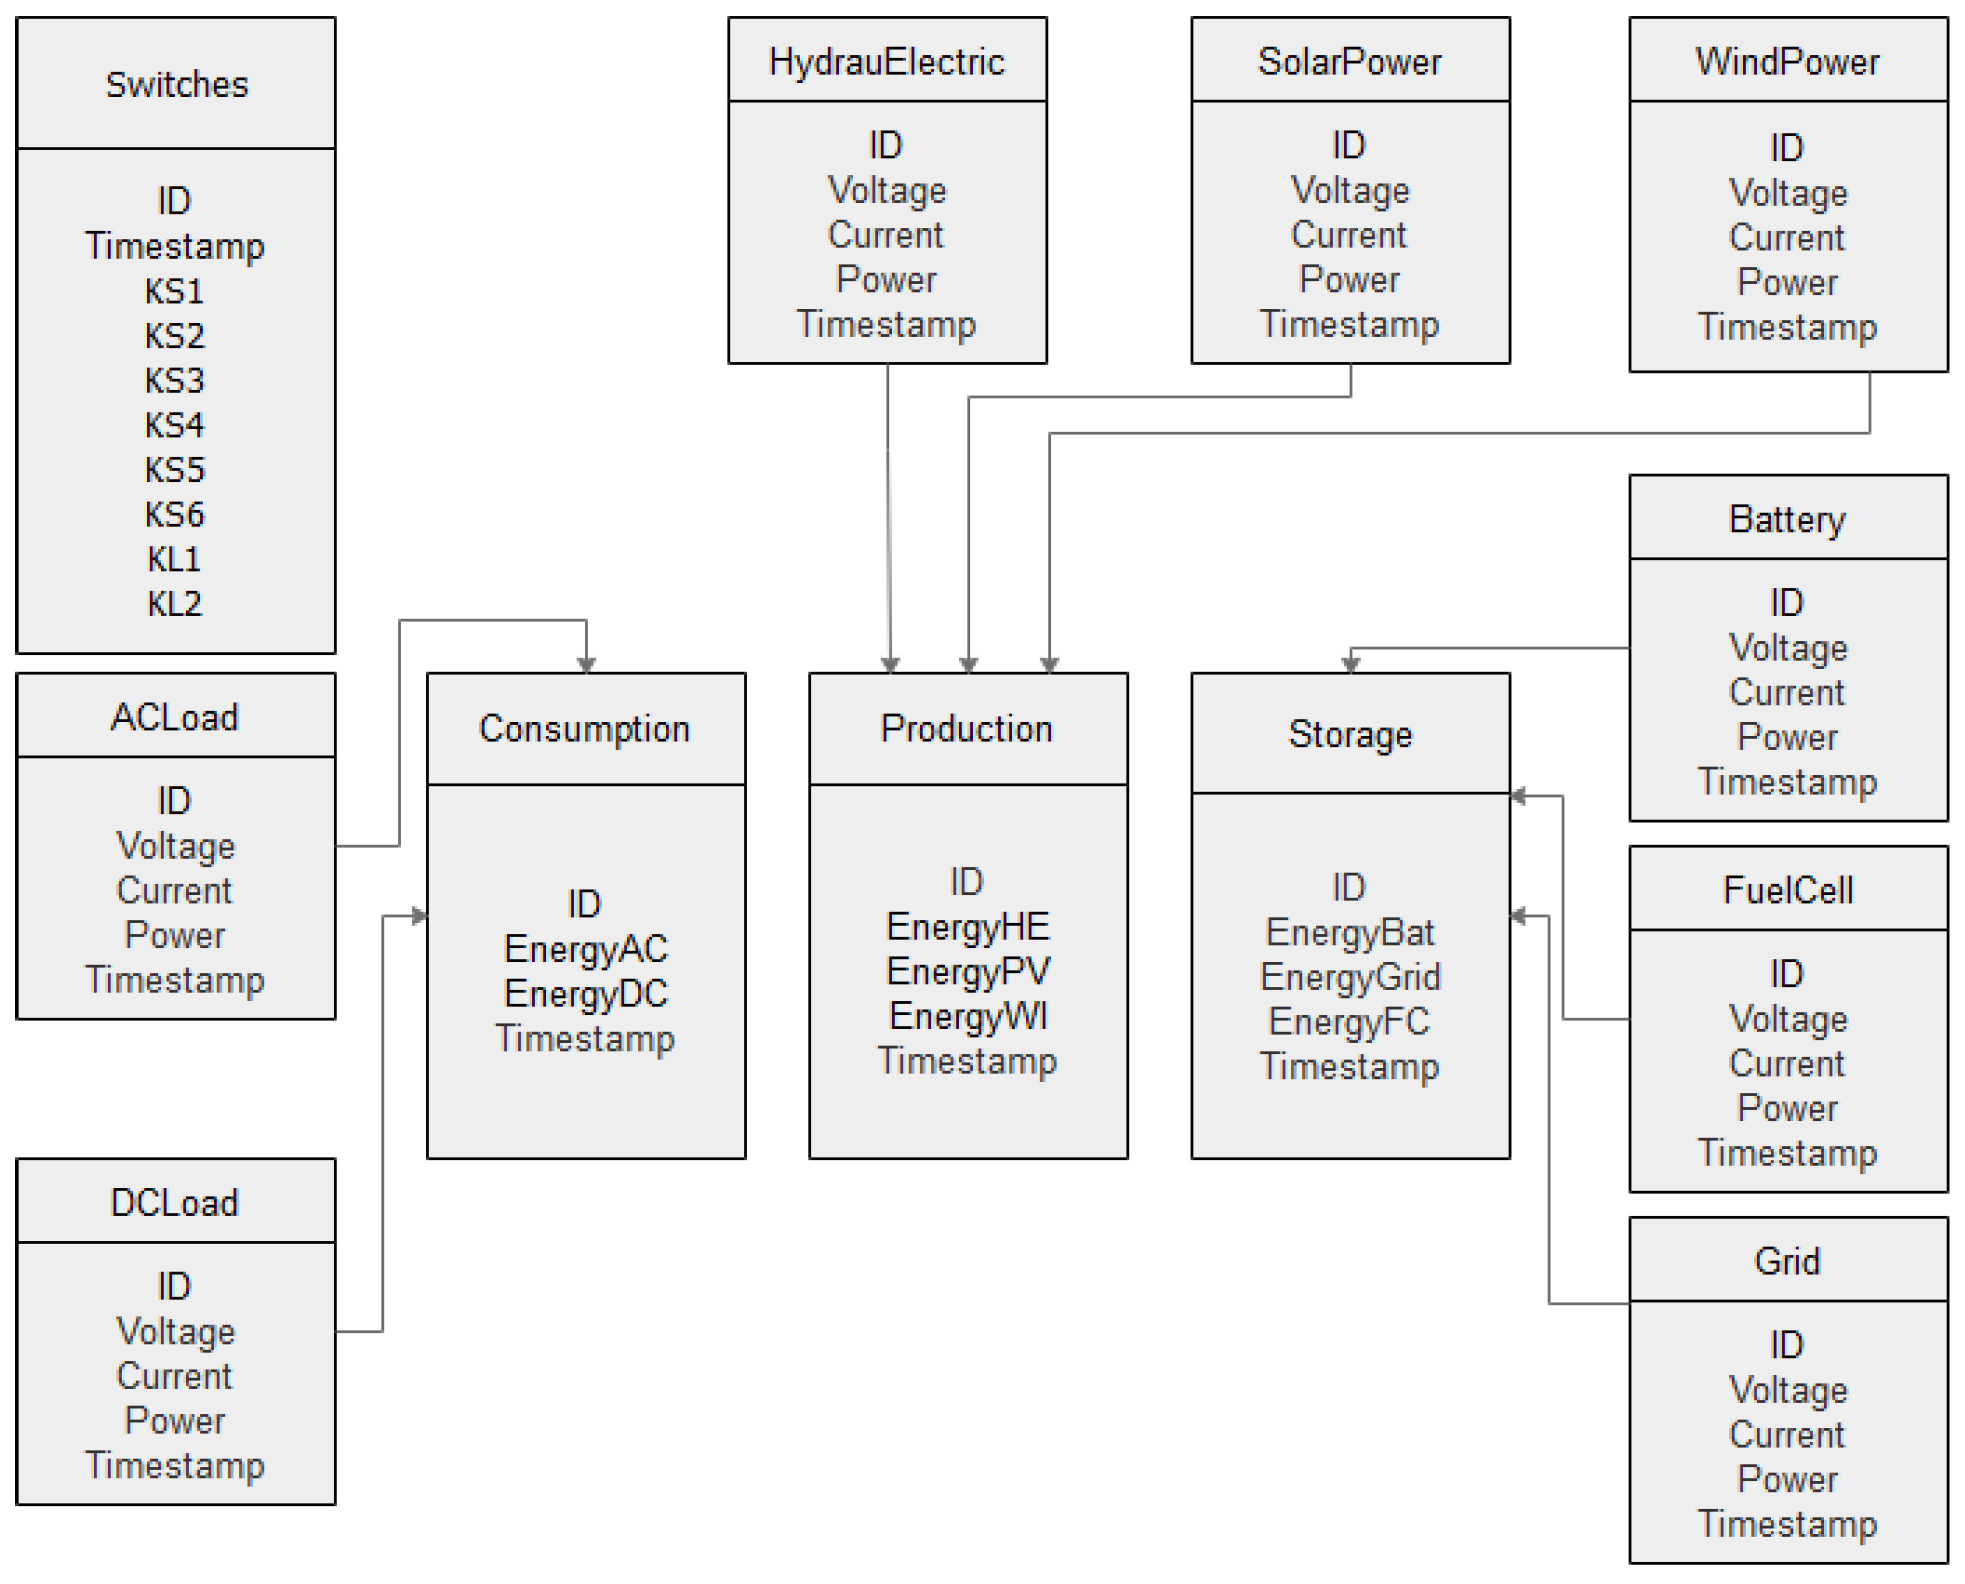
The user of the test bench will be able to create multiple energy production, storage and consumption scenarios, and, as discussed in the previous section, the power meters are connected to the database server in order to preserve the architecture simply and openly. The model presented in
Figure 21 represents the different tables, where all basic readings from the power meters are stored; mainly the voltage, current, and power values are timestamped. Each table feeds the consumption, production, and storage tables in order to facilitate the integration of machine learning algorithms for energy demand forecasting, diagnostics, and optimization. The table within the PostgreSQL database with ID "switches” stores the state of each switch with a timestamp so the users can take into consideration the developed optimization models. The PLC was inserted directly into the switch table using OPC UA.
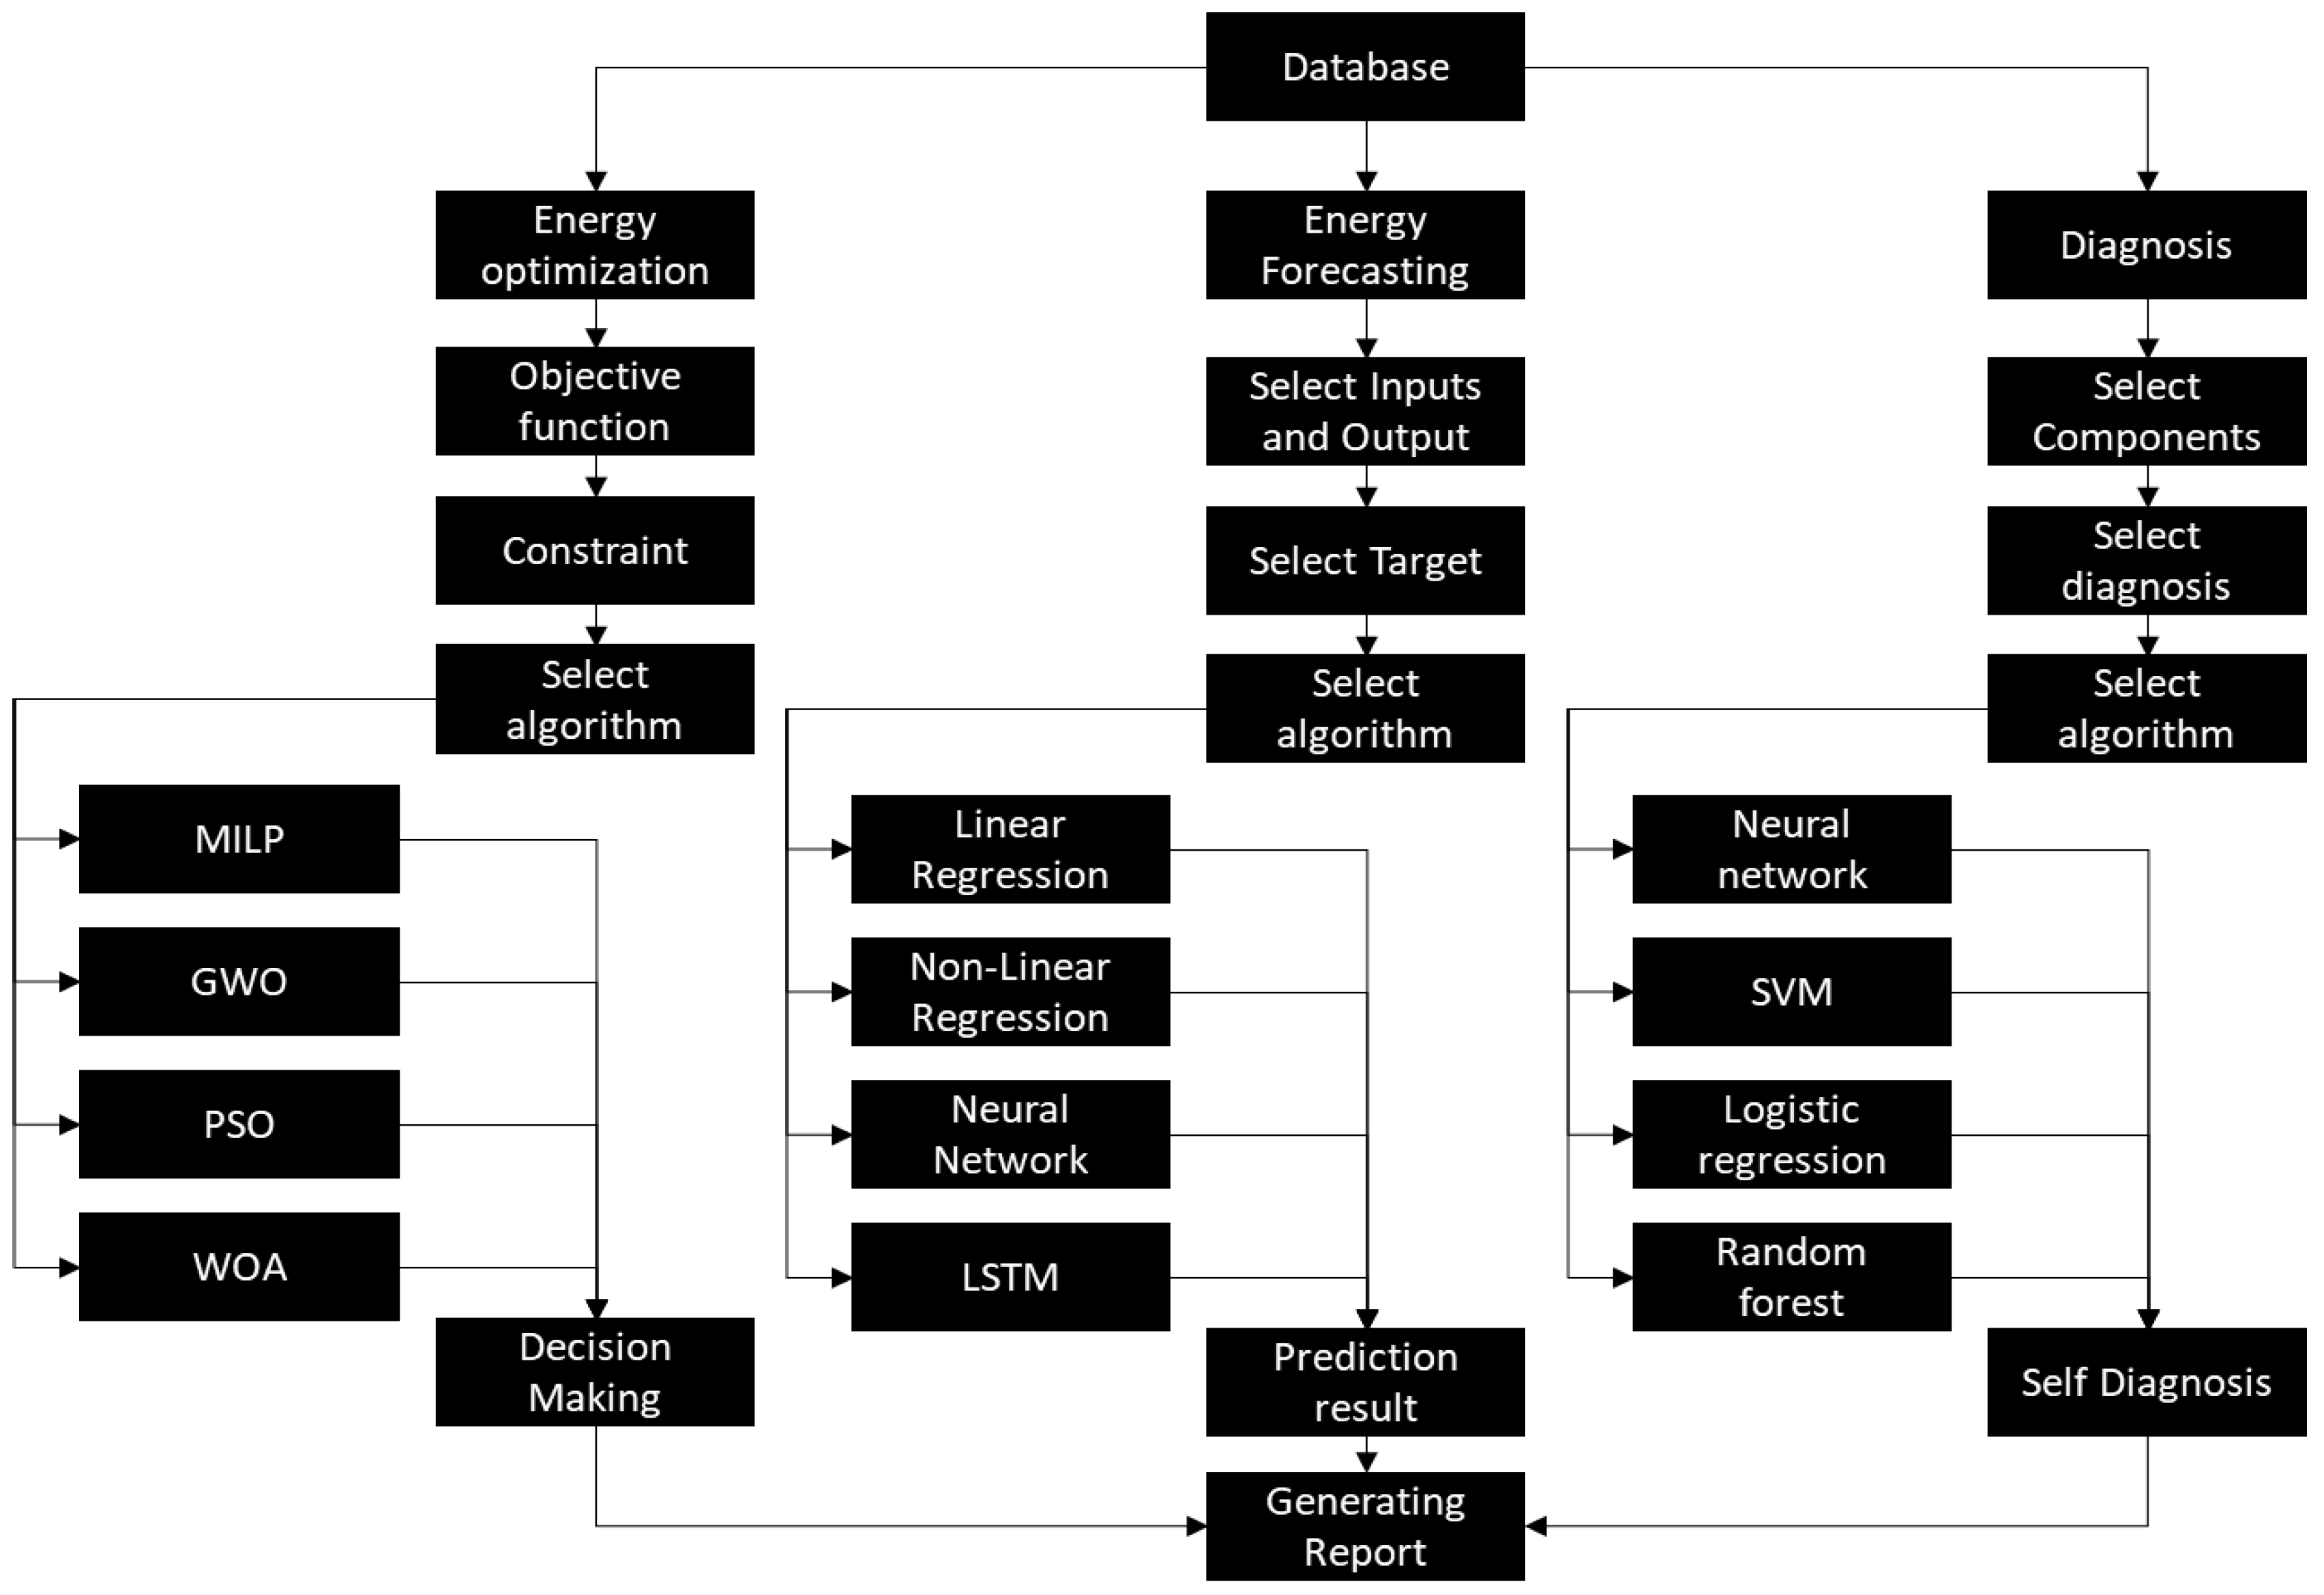
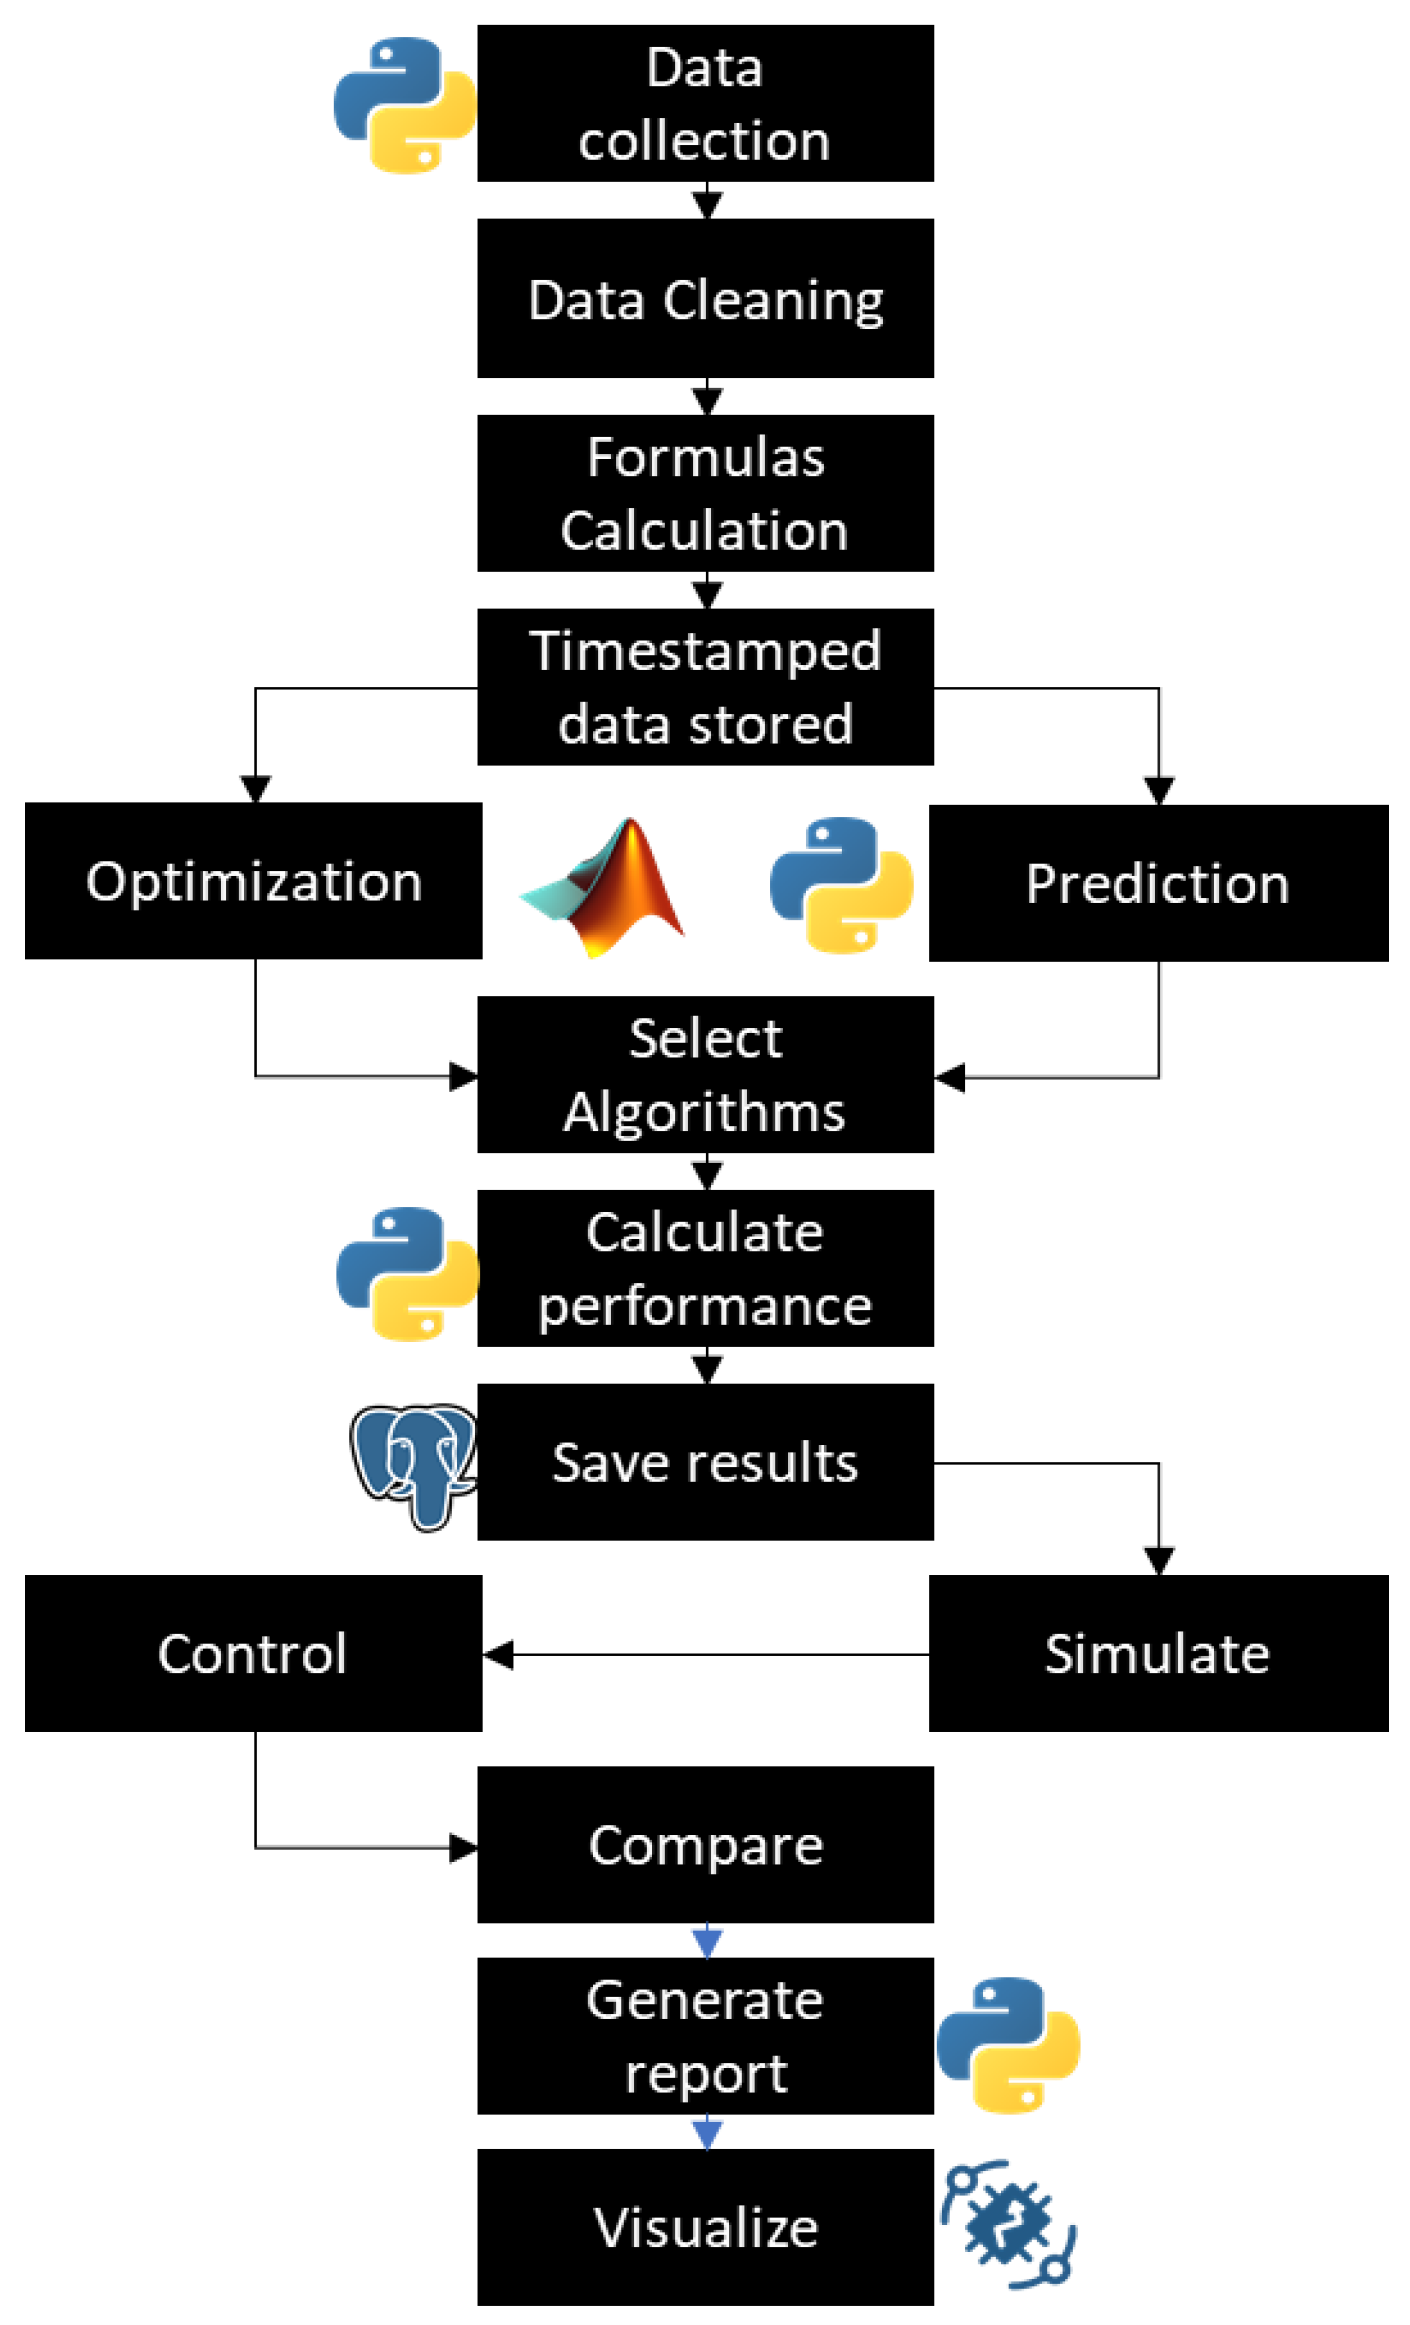
In each scenario completed, the user can retrieve the data from the database and then choose the goal of the case study, which can be an optimization model or energy forecasting or diagnosis. In each case, the user selects the inputs and outputs and then the targets, and with the help of the pre-developed algorithms instructions in the server, the user can compare the prediction and self-diagnosis results of different algorithms and generate reports for offline testing, as represented in
Figure 22. For the online prediction graphs of energy consumption, production and storage can be directly applied and visualized using the preinstalled SCADA system or on the Thingsboard platform.
For the energy optimization case study, the user can select the pre-developed optimization algorithm and study the objective function with constraints, then inject the solution in the server; the decision-making system will control the switches using the PLC.
5.2. Energy Forecasting
The energy forecasting features are some of the key elements in smart grid and energy management systems, by which the energy production and consumption is predicted in order to use them to optimize the energy flow and make the decision easy. The test bench offers this feature for students so they can learn the different methodologies and implement their own. In each scenario, a dataset is created, and the user selects which algorithm to be used: Linear or Non-Linear Regression, Neural Network Regression, or Recurrent Neural Network, and in this case, the Long Short-Term Memory (LSTM). The use of these algorithms is easy due to the immense number of Python libraries and the big community, where the student can inquire and share their findings because of the open source of this test bench, which will make it easy to improve.
The result of the energy forecasting algorithms can be saved as a report or can be used in online dataand visualized in the main dashboard on Thingsboard or on the SCADA system.
5.3. Autodiagnostic
In smart grids, the diagnostic feature is very important, by which the smart system can detect the failures of each connected equipment: mainly power sources and secondly bay feeders and the distribution bus, then other electrical loads. The goal is to detect and classify the different defects of each component.
In this test bench, the user can create defects and collect the data, then compare them with the healthy condition in previous case studies using different pre-developed algorithms. For example, for the Support Vector Machine, Logistic Regression, Random Forest, and Neural Network, the main defects that can be created are:
Photovoltaic: Delamination, cell part isolation, or cracks. In order to do so, it is very easy to replace the photovoltaic module, then compare between each state using the recorded data.
DC and AC motors show defects and anomalous consumption using only voltage and current data and comparing it with the actual load, or detecting voltage sag and swell. For further diagnostics, the use of extra sensors such as vibration and temperature sensors can be very useful to label the mechanical defects and study their impacts on the DC bus or on the energy flow. The same goes for hydroelectric and wind turbine generators.
The user can also detect false data injection. A module can be developed using OPC UA, by which the data acquired will be encrypted, so the goal is to detect where the attacker operates on which power sensor. To simulate the cyber-attacks in the smart grid, the user can learn how to find the defect and to secure the designed system.
5.4. Optimization
The goal of the test bench is to introduce students, mainly electrical, energy, and automation engineering students, to the importance of using optimization algorithms in power management, power shedding, and energy flow efficiency in smart grids.
The users can implement their own algorithm, writing their objective function and constraints, or using the pre-established example using well-known algorithms such as mixed integer linear programming, the gray wolf optimizer, the whale optimizer algorithm, or the particle swarm algorithm, in order to minimize the price of the energy consumption. The most used algorithm is the genetic algorithm in the hybrid power system case studies, as presented in [
53]. The goal is to test other algorithms and calculate their efficiency.
In each case study scenario, the user can set up the price of each energy source, and change the timeframe in seconds, minutes, or hours. The goal is to minimize the cost of the energy consumption and maximize the energy availability. The user can also use the predicted dataset as an input to find the optimal set of switches in time for giving load planning, and for each set of switches, the energy flow can be simulated and visualized, then injected into the server in order to schedule the control of switches, as elucidated in
Figure 23.
The user can select a time frame (
j) in seconds, minutes, or hours, then retrieve the dataset from the database in order to calculate the energy demand of the load of each timeframe,
EjL, in (15), which is the sum of the energy consumption of loads (
nl number of loads) which can be forecasted in previous case studies or can be planned by the user or in real time manipulations. Then, calculate the energy produced from the different sources,
EjR in (16), which is the sum of each renewable system (
ns number of sources).
The user shall set the prices (
Pri) of the different type of energy source and load in the test bench in the selected time frame, then compute the cost of energy in each time frame, in Equation (17). The calculated cost integrates the state of switches (
Si) in each time frame.
The goal is to minimize the cost of the energy consumption while increasing the use of renewable resources for efficient and greener energy flow. The user must add numerous constraints or conditions of the switching, for example taking in consideration the state of charge of the battery, the fuel cell state, the price of energy, etc. The user is free to add one or more constraints and also change the objective function, in order to find the optimal set of switches in a time frame.
6. Grid Co-Simulation Framework
For researchers, PhD students, and instructors, the use of co-simulation is a mandatory feature of the test bench, by which the user can simulate other sources and loads in parallel or can simulate another case study scenarios previously done using the acquired datasets, then co-simulate multiple scenarios and models in parallel and manage a large-scale grid simulation.
On the other hand, numerous researchers have simulation in different software such as Matlab, ETAP, and EMTP for power shedding or energy optimization in the grid. The test bench can directly communicate with different software and programming interfaces using the Mosaik platform, using TCP sockets. The user should be able to run the simulation in multiple environments: physical, which is the testbench, and in Python optimization energy, forecasting, and other software using the OPC communication.
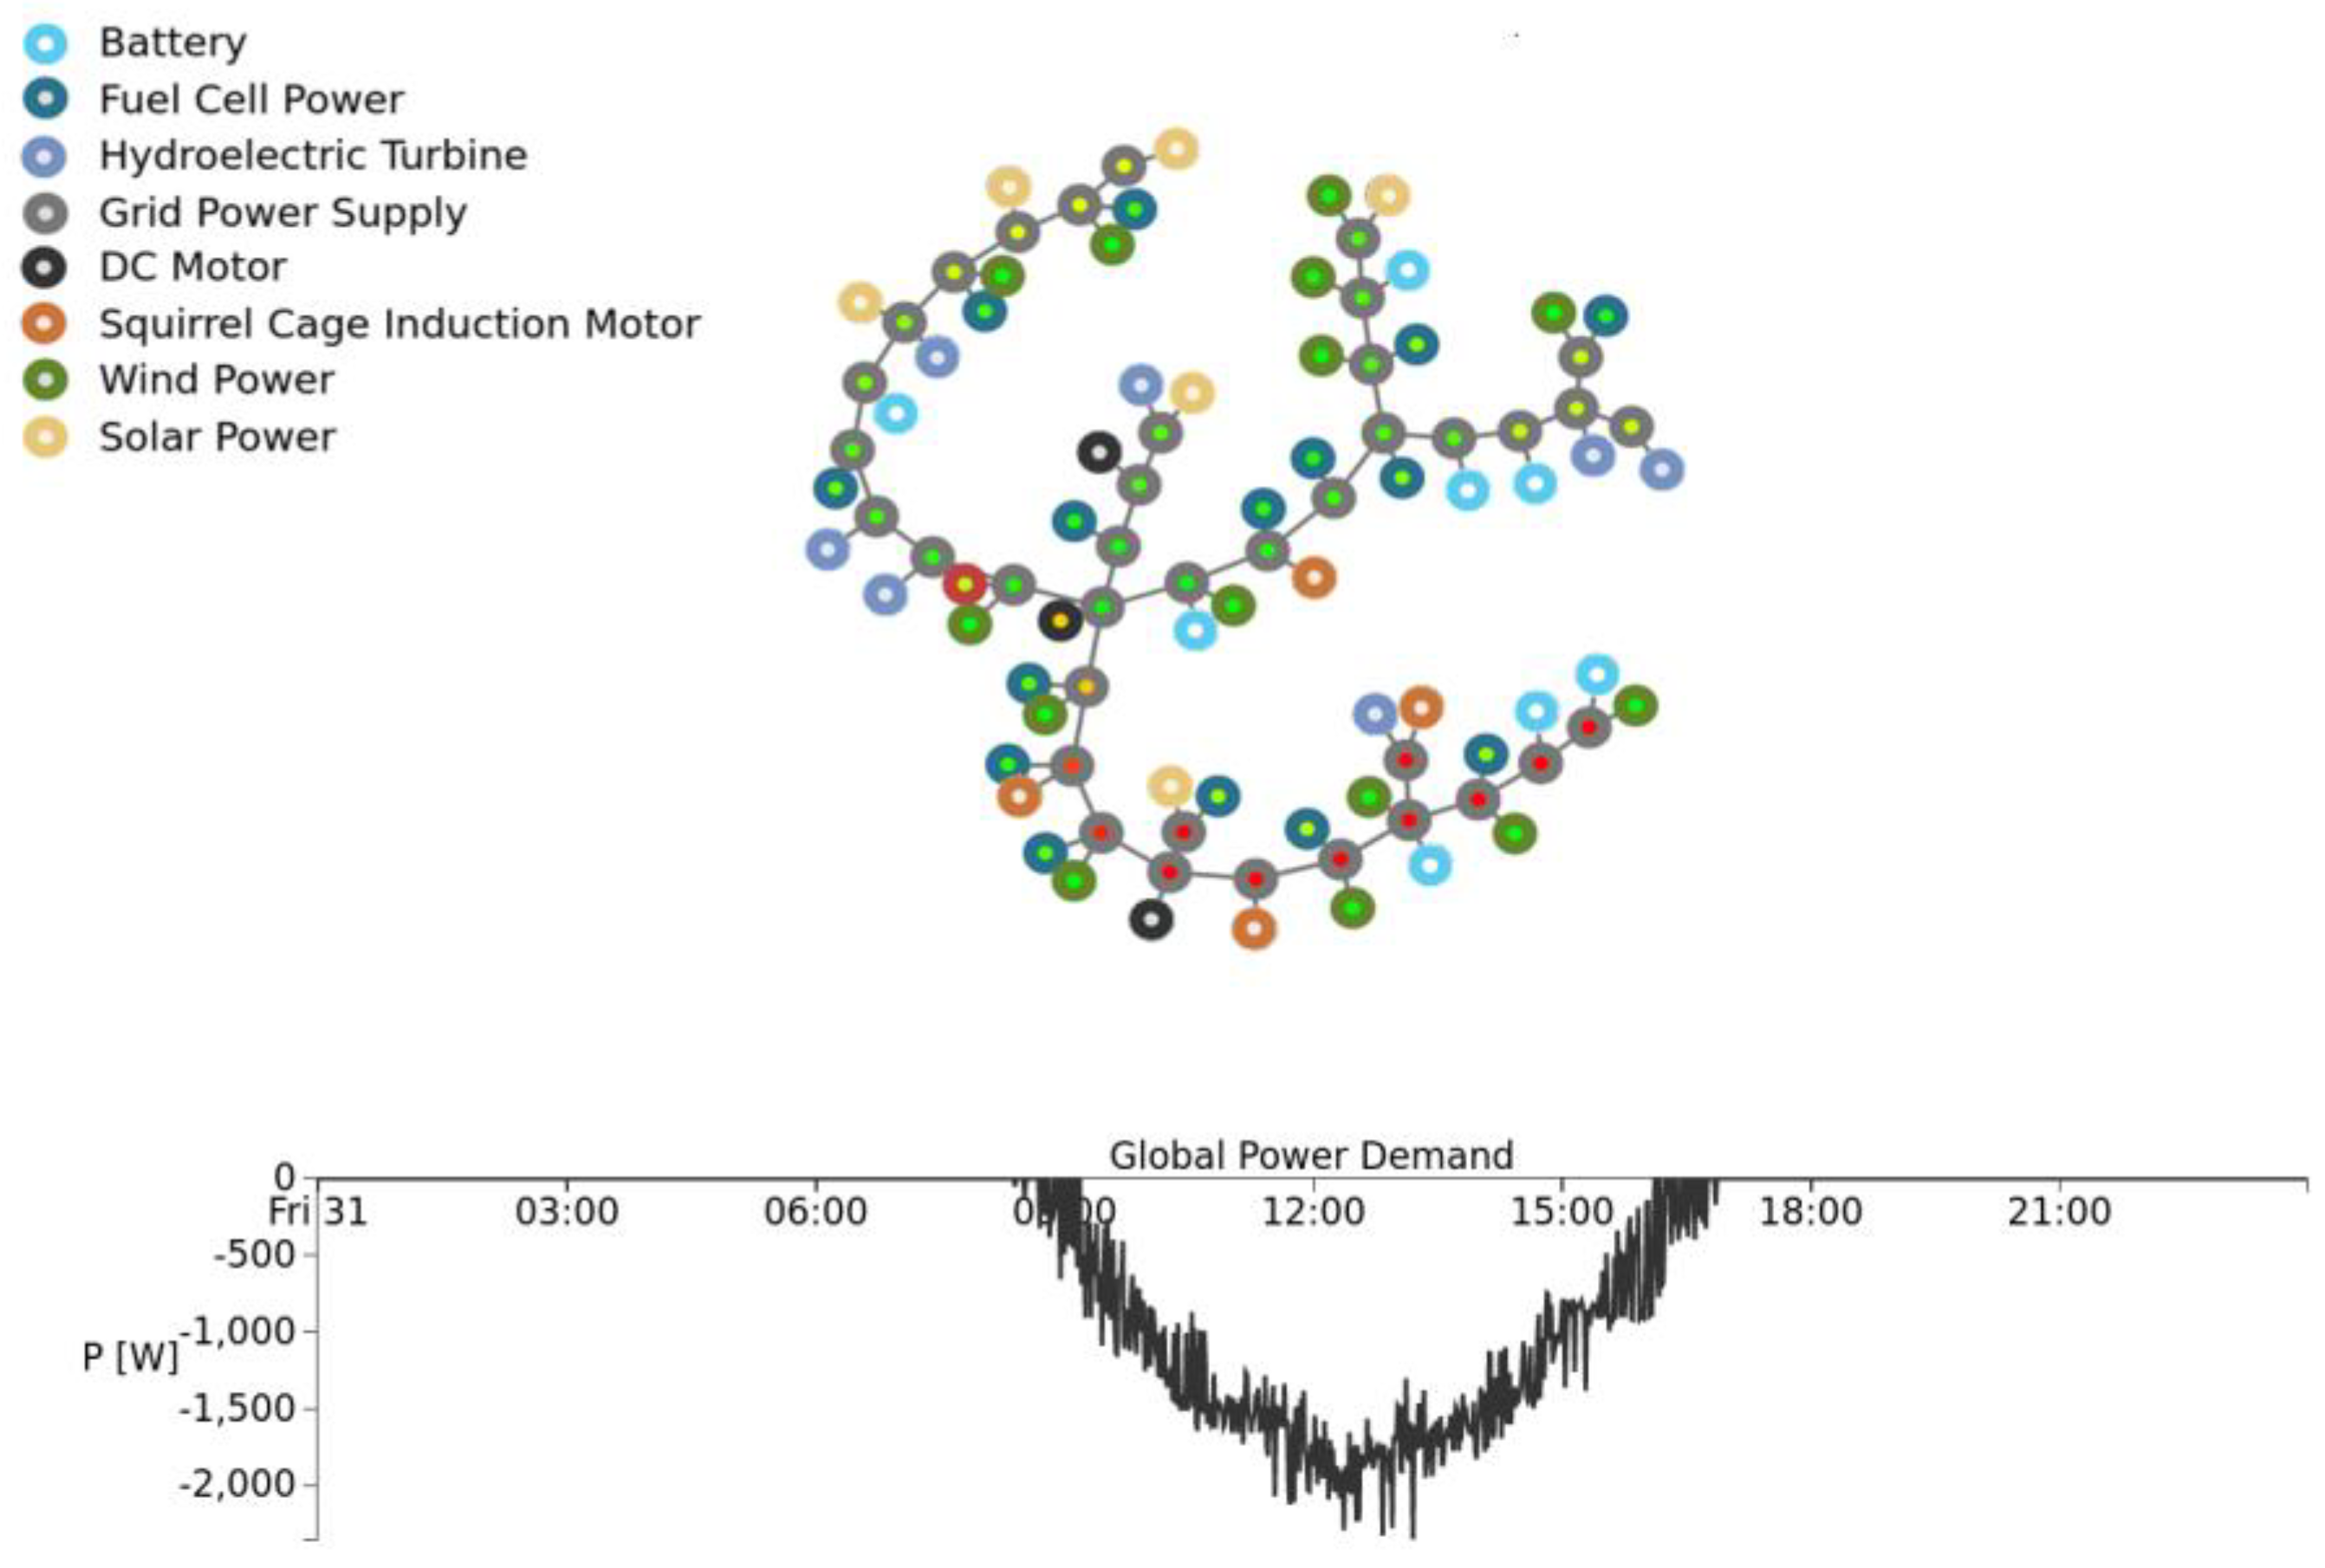
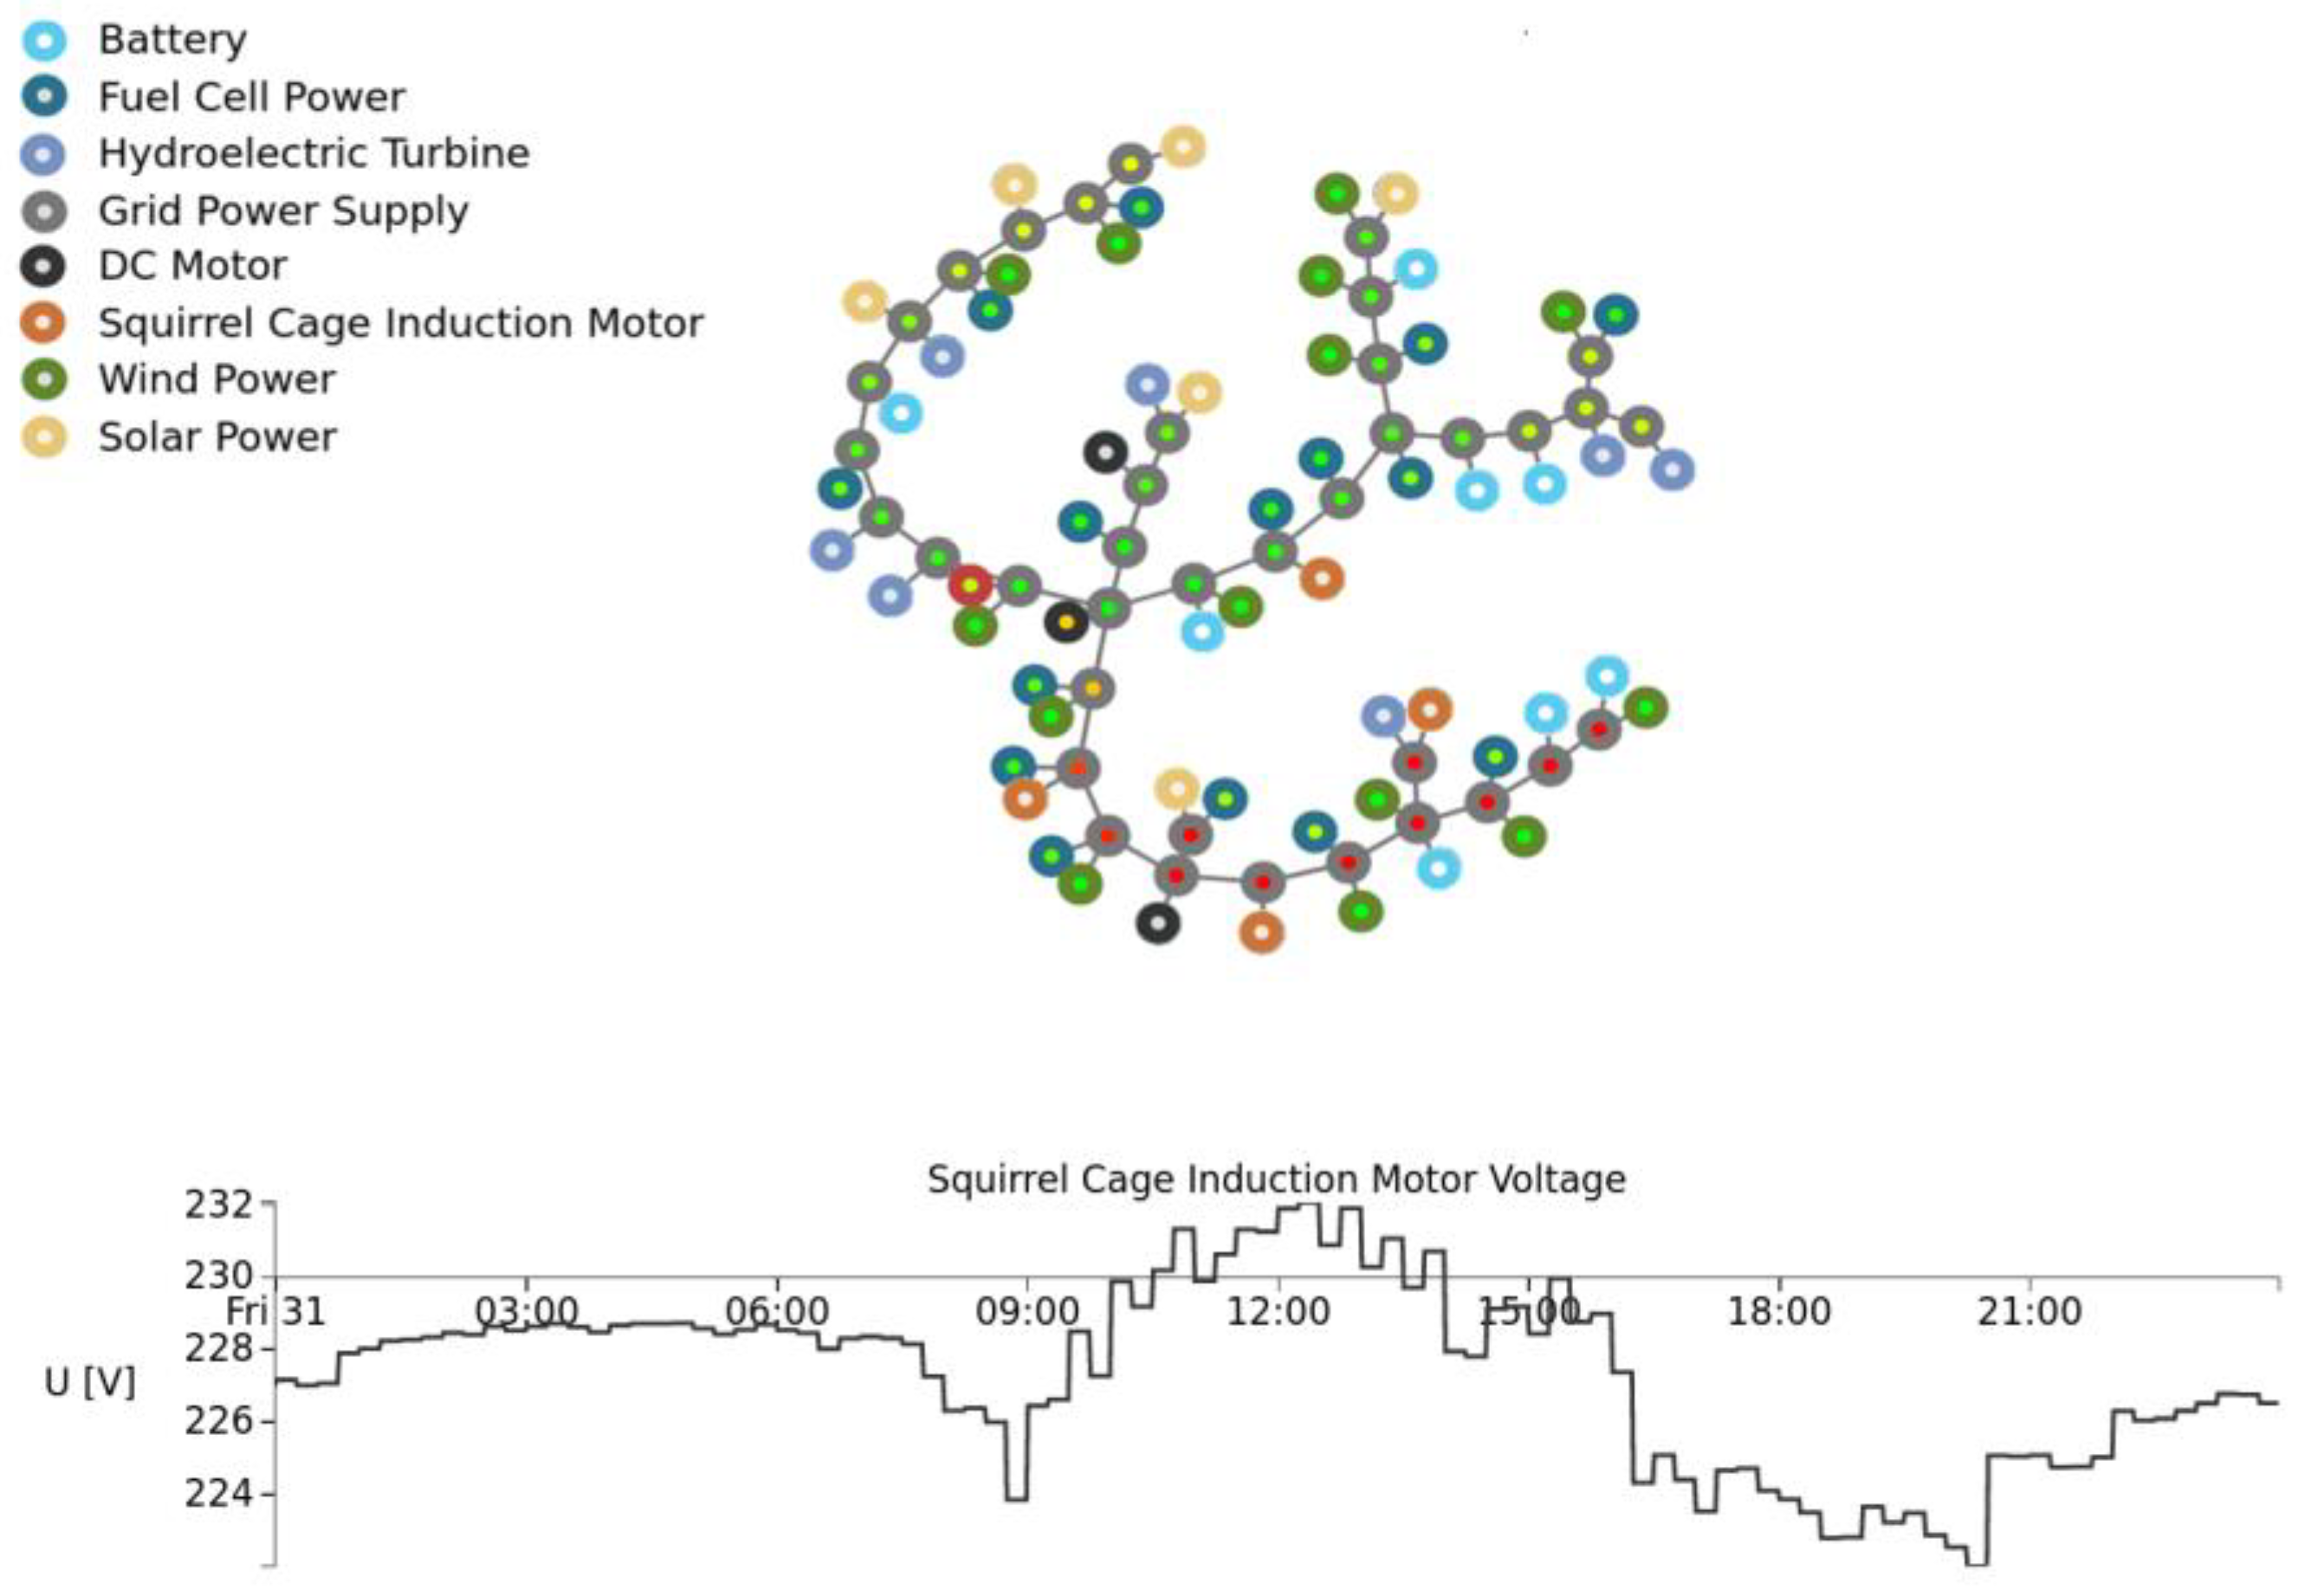
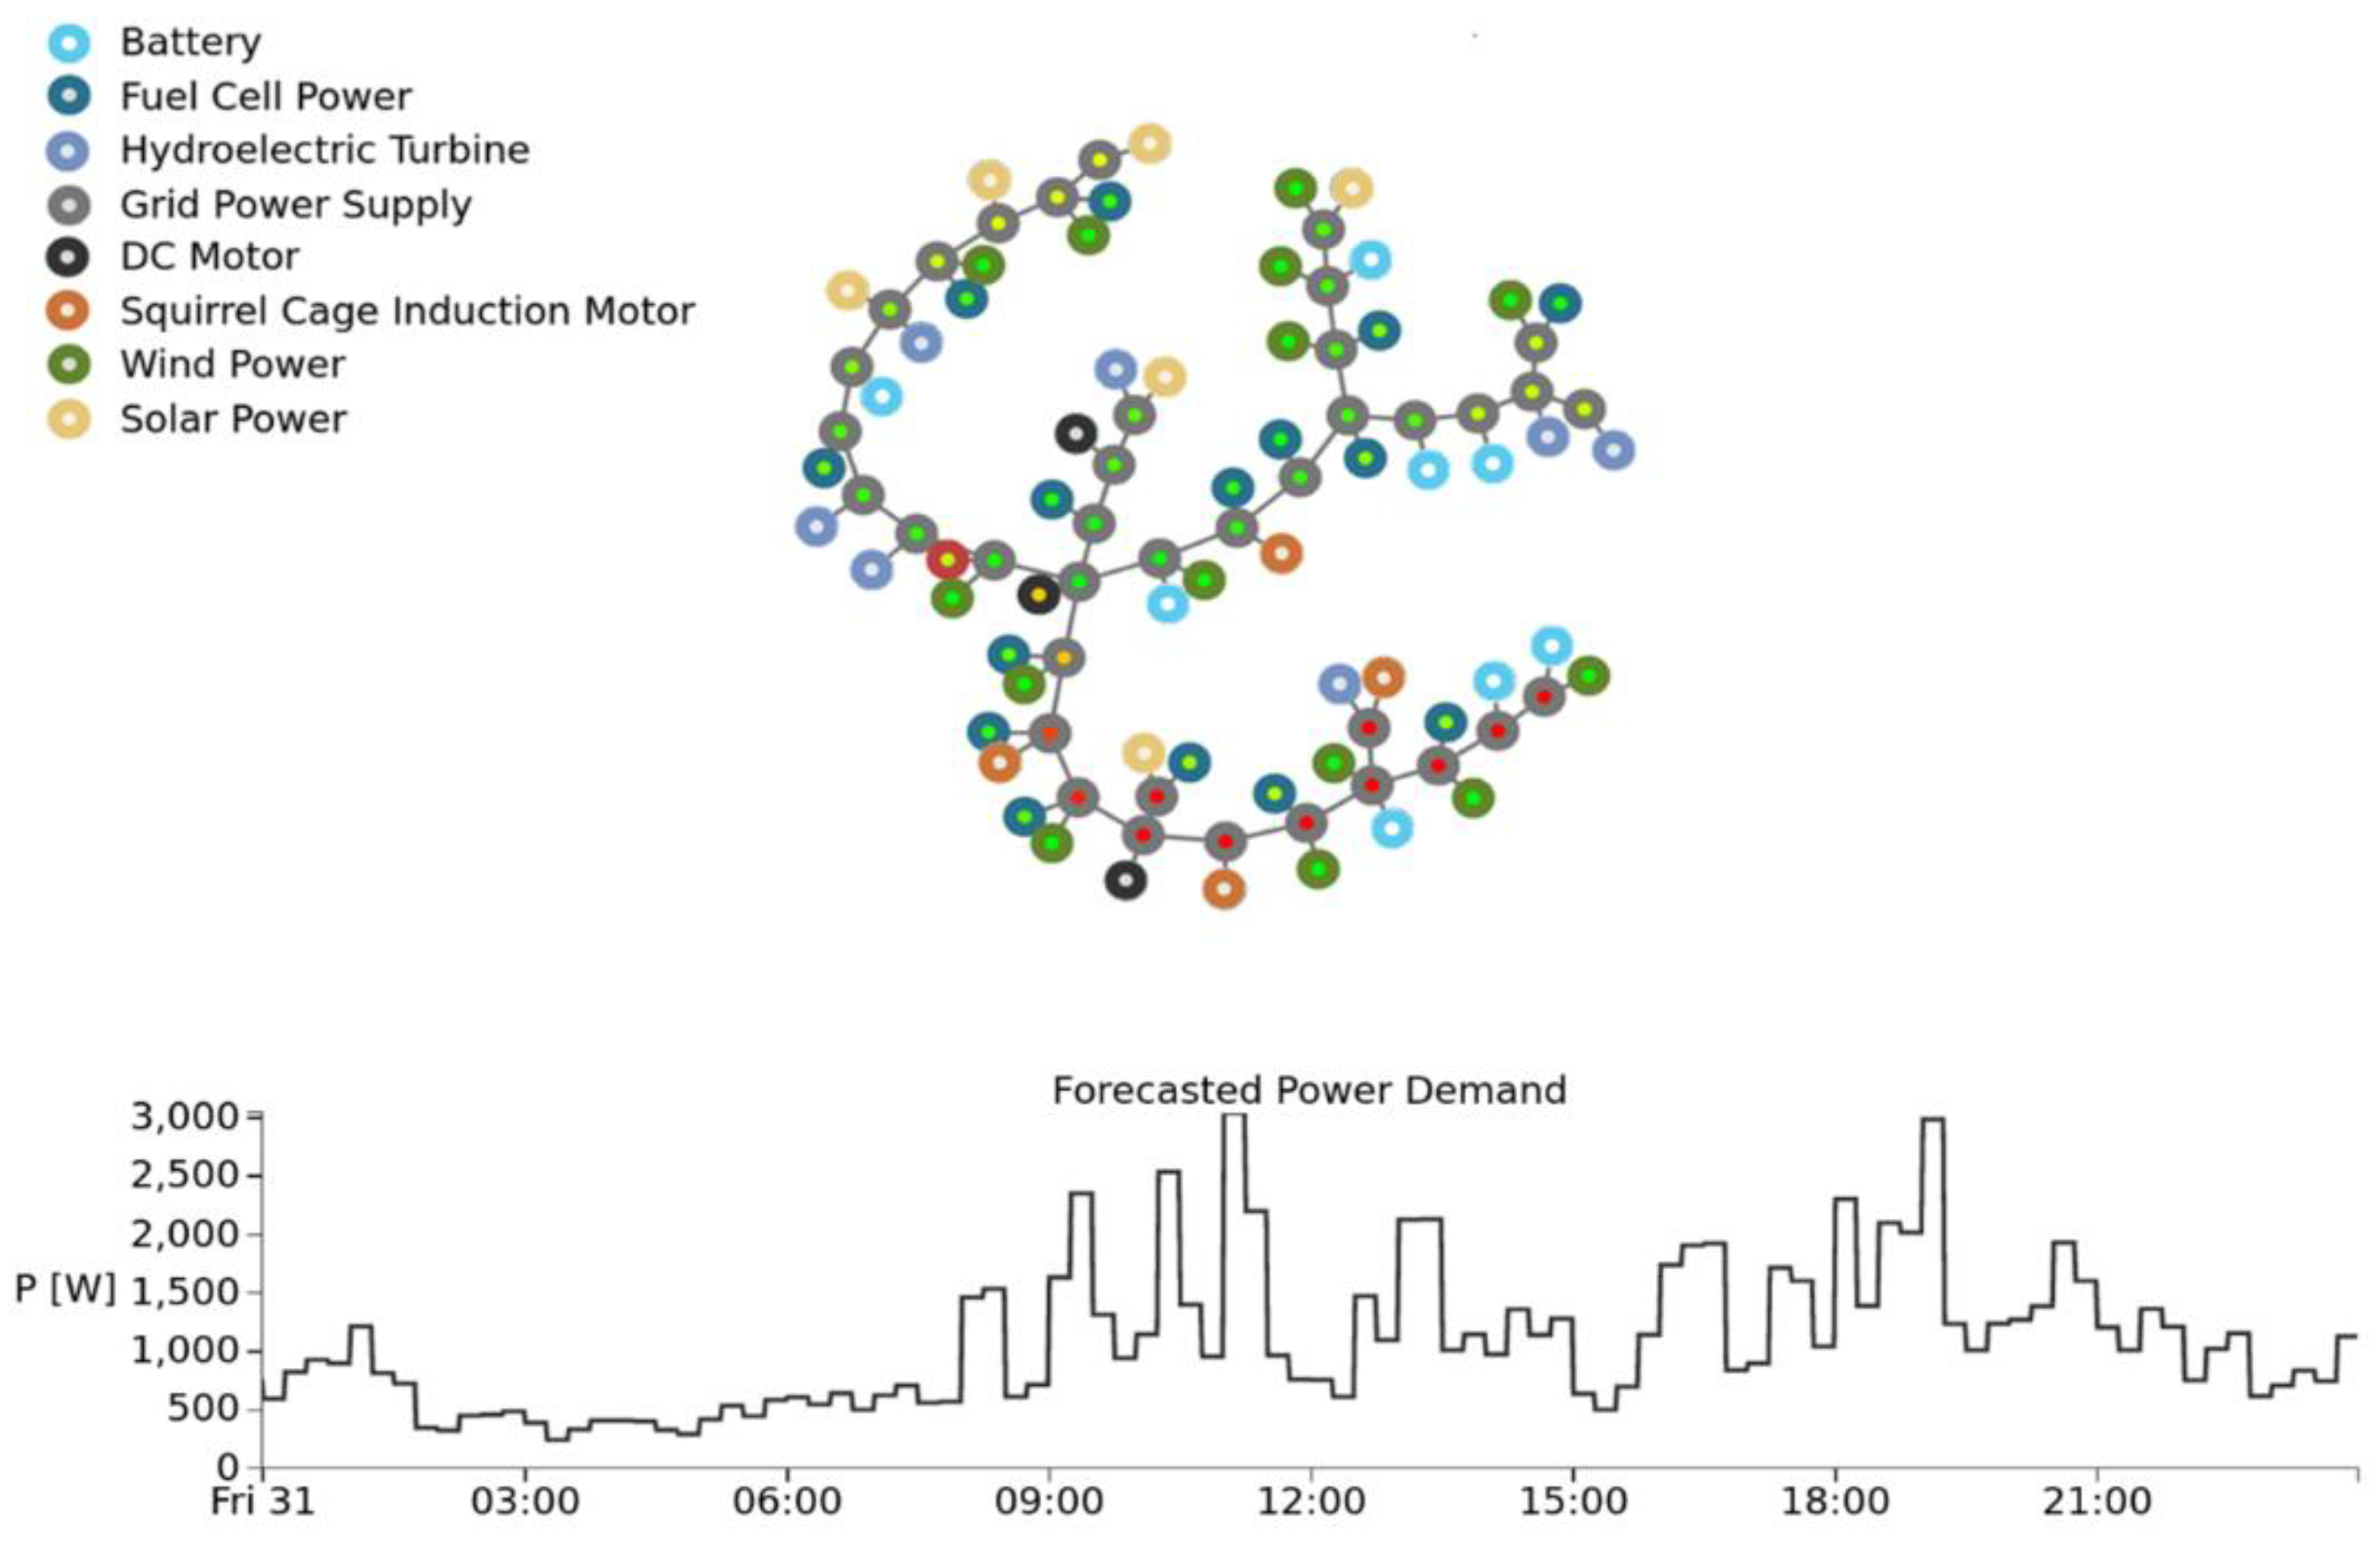
The result of the simulation of the developed algorithms can be saved into a database, to be co-simulated with real datasets from the test bench, for example, the voltage root main square value of the squirrel cage induction motor, represented in
Figure 24, or the global energy demand of different installed loads in the test bench, as elucidated in
Figure 25.
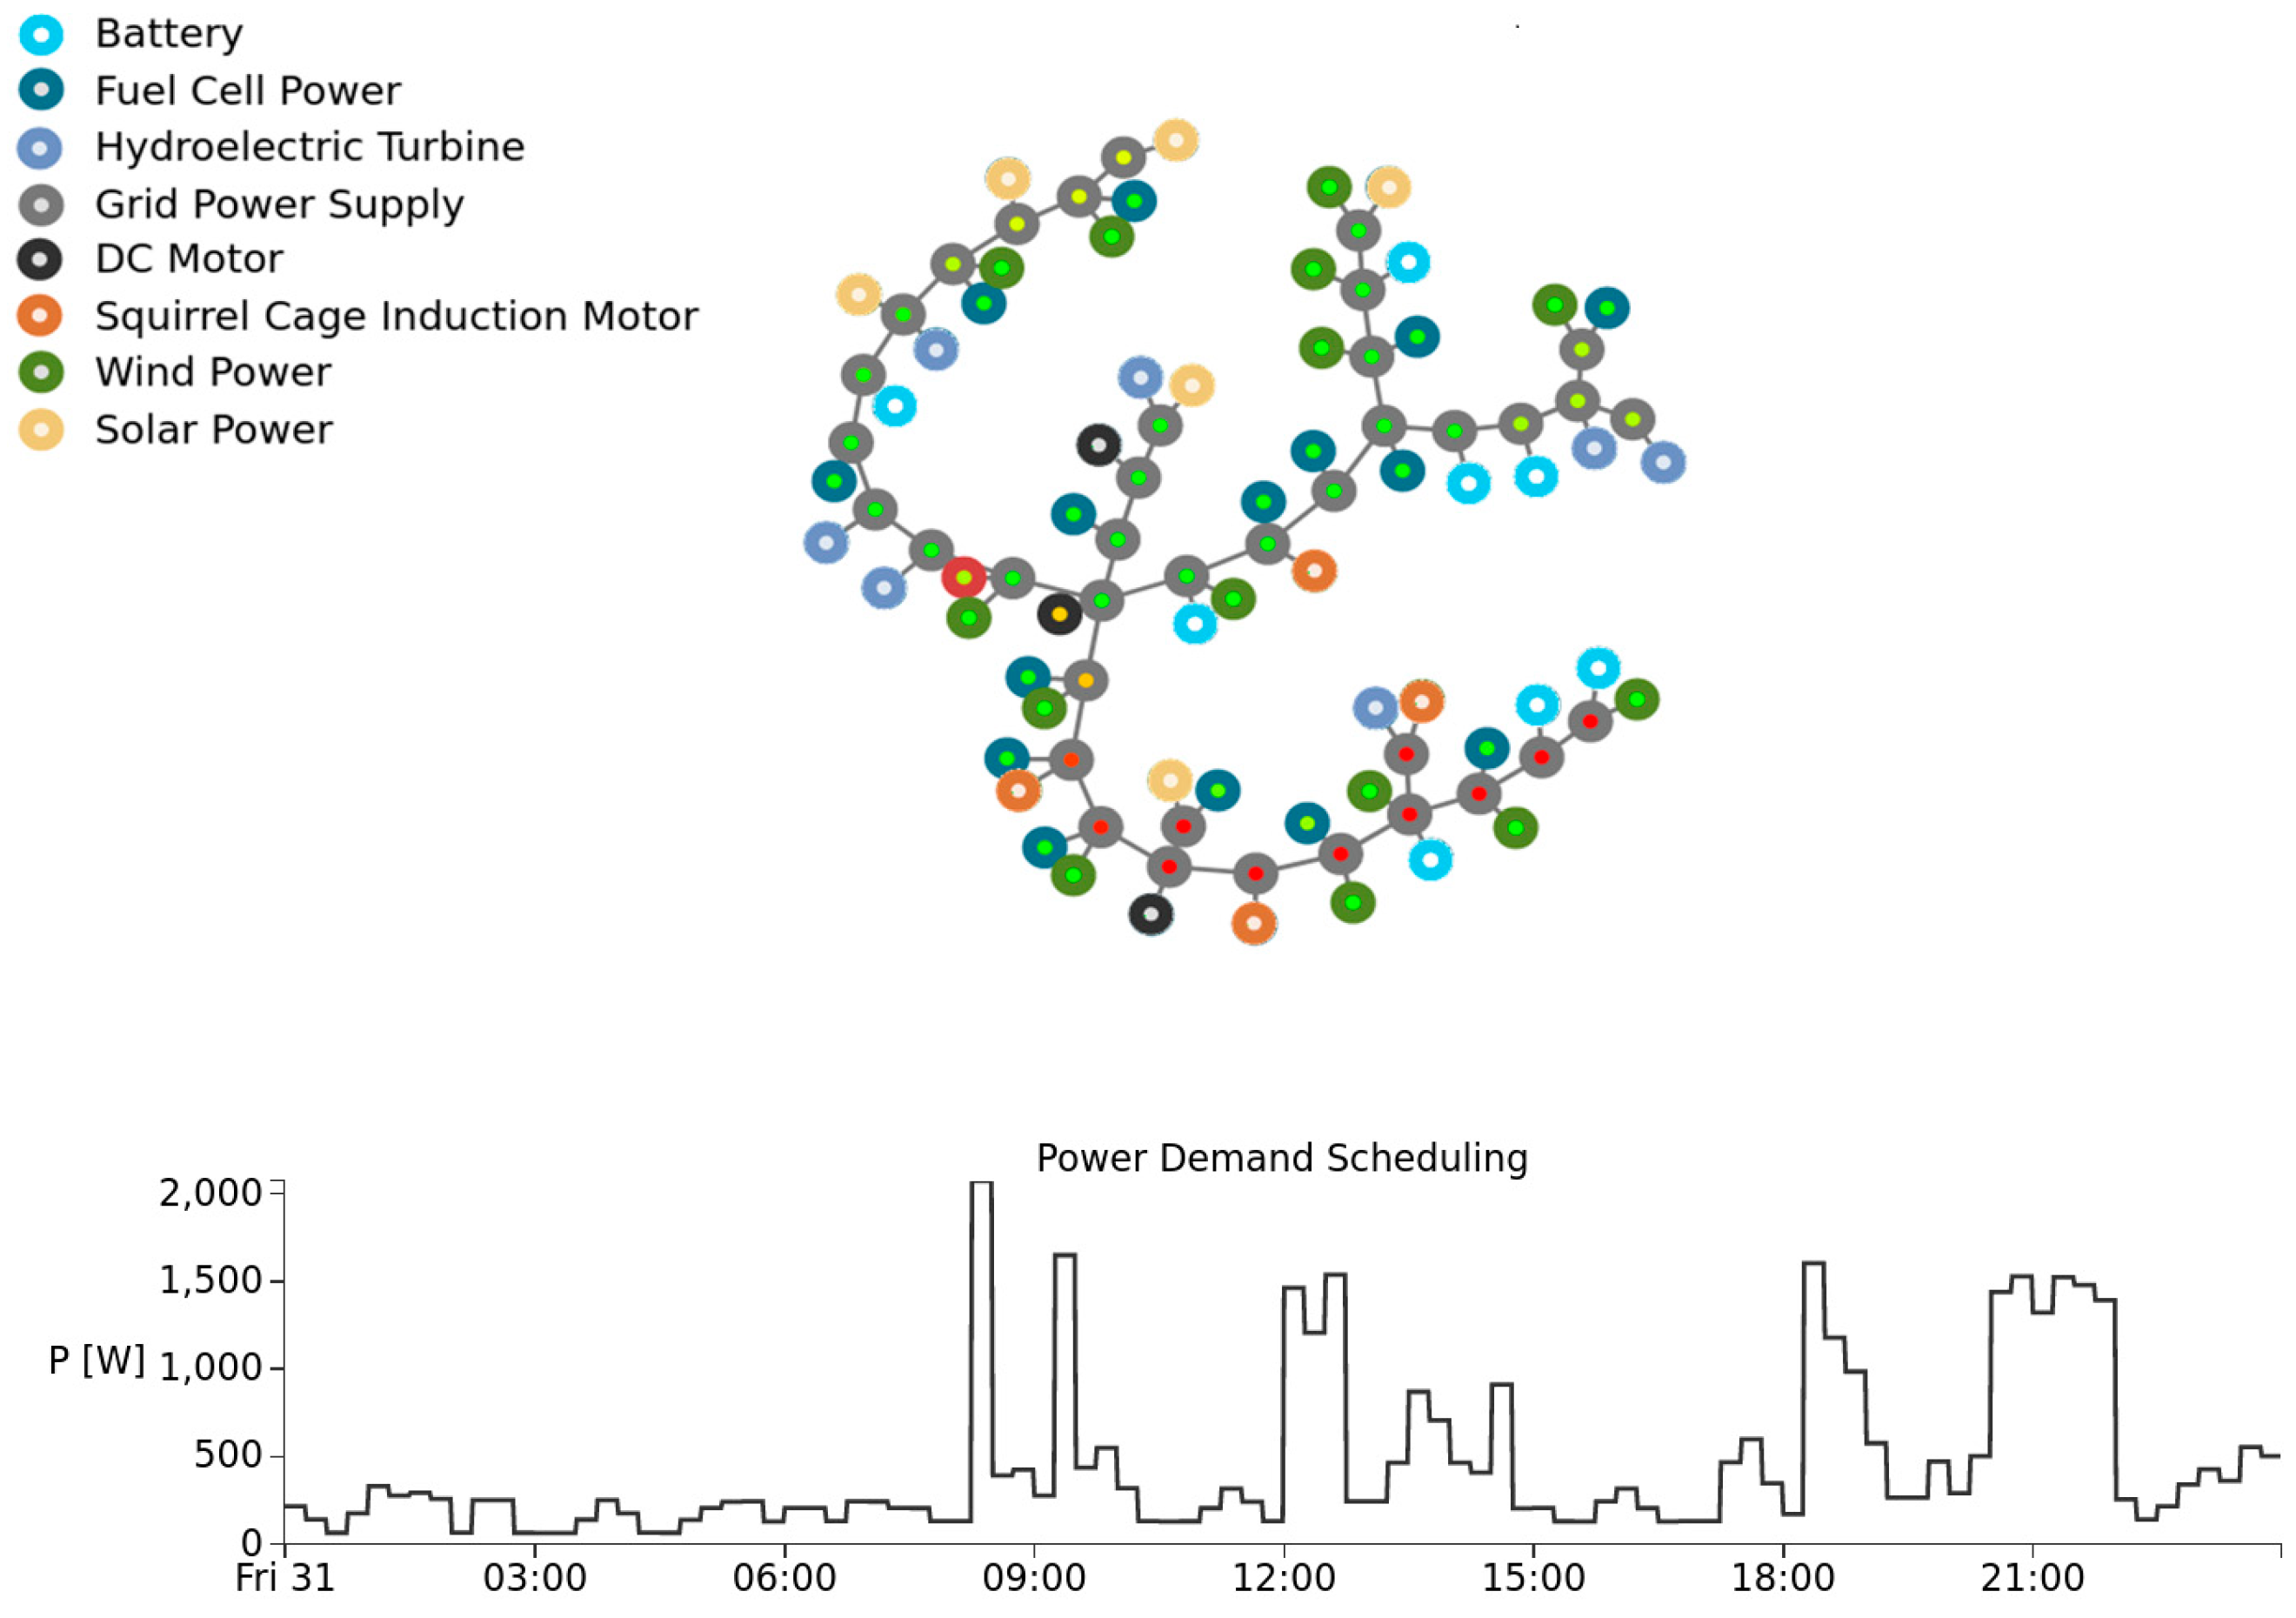
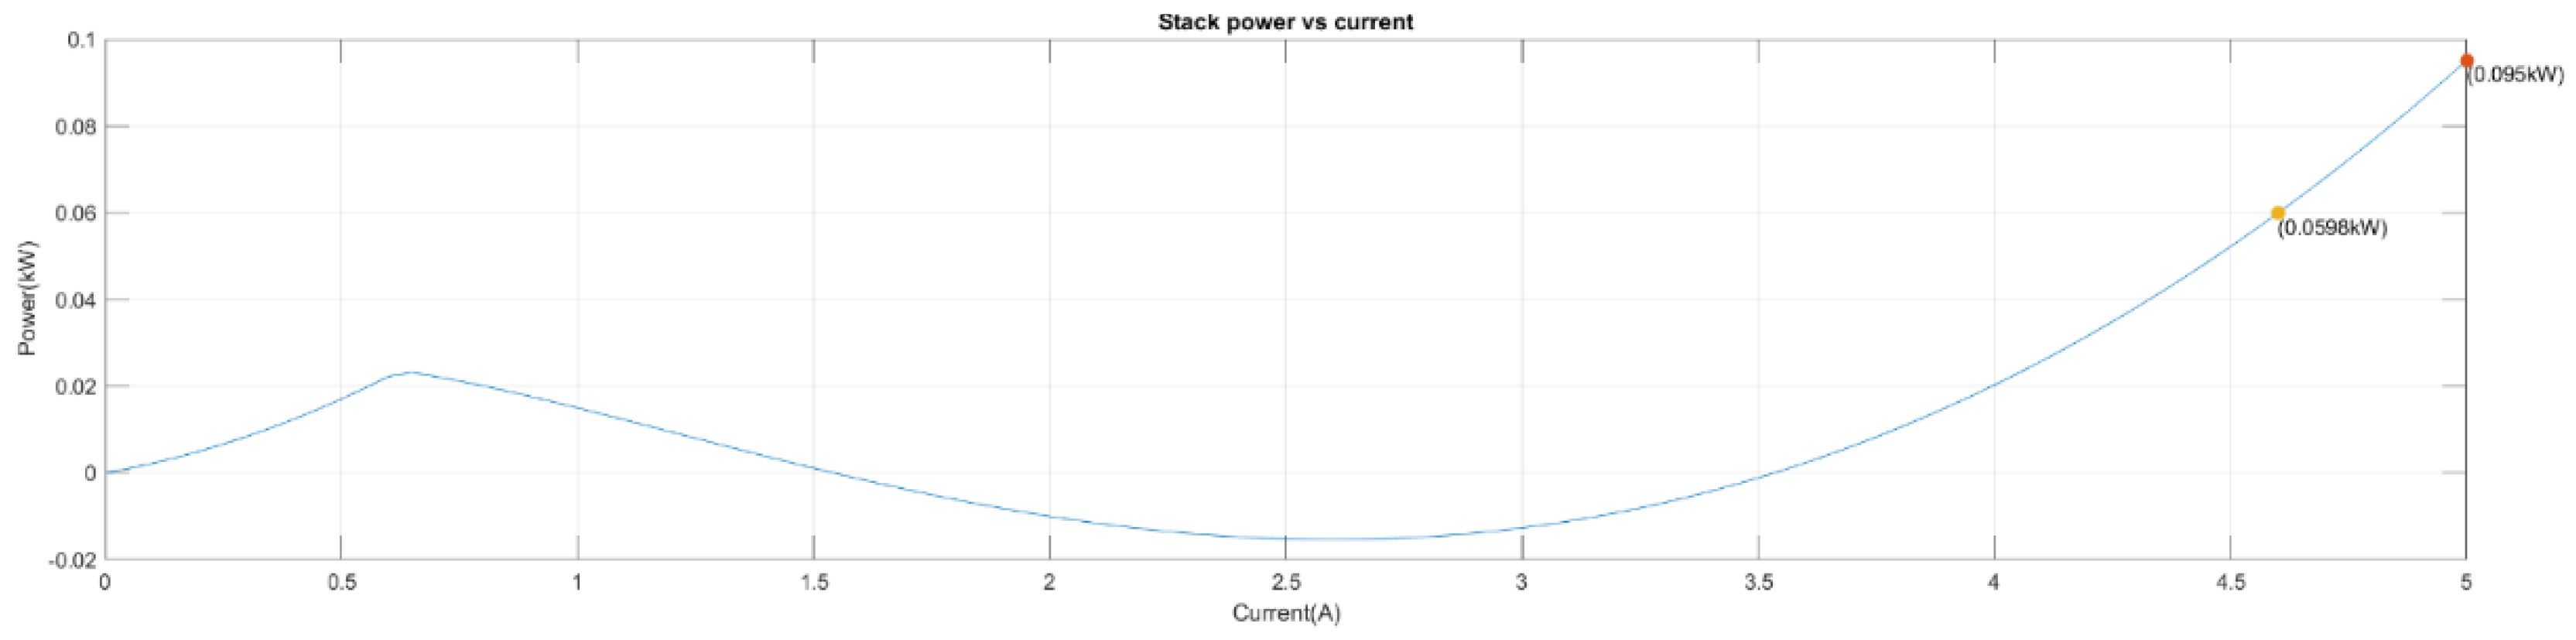
The result of the optimization algorithms for each node, or grid test bench components, can be seen and co-simulated in the same timeframe of different simulations to see the impact and the behavior of the optimization algorithms and measure their performance, in order to schedule loads and sources, as elucidated in
Figure 26.
Conversely,
Figure 27 elucidates the result of the developed forecasting algorithms, where the user can see the predicted value for a certain scenario in a specific time frame. The result is run iteratively, respecting the time frame, and co-simulated with other simulations in other software environments, or physically and directly connected to the real-time data of the installed power meters.
7. Modularity and Extension of the Test Bench and E-Learning
One of the most important features in the educational test bench is the modularity, by which the users can test and study each element or each test bench module by part. This will make it easy to use and easy to maintain. Each defected module cannot affect the other, so the availability will be increased. As discussed in the previous section, each part is designed following the DC bus requirements. They are instrumented and connected to the server, therefore the whole process, from energy injection in the bus to the monitoring and control, can be seen as a standalone system, which will make it easy to add new power sources and can be instrumented in the same way.
In order to add another extension of the test bench, after designing and selecting the power element, load, source, or storage system, it is mandatory to add power meters with the same reference, or to add better power meters with high precision there are compatibility problems. For example, when there is not the same protocol, it is necessary to use a bridge for the communication. The extension of the test bench can also be within a high range; for example, when implementing a new photovoltaic system, the users can use LoRa module Wi-Fi for the network extension, as elucidated in
Figure 28.
In the server point of view optimization, forecasting, diagnostics, data management, and visualization, there will be only added tables where the user can create, delete, truncate, or insert into easily, using the SQL queries, which is an open-source software and hardware. The
Figure 28 elucidates how to connect multiple power meters with the PLCNext PLC, PostgreSQL server, and the Thingsboard platform for visualization. Another functionality of the test bench is the control; in this part, the PLCNext can control the power converters and variable frequency drives that have been added with the loads, mainly DC motors and induction machines.
The server can be connected to a cloud where all data are shared using the Thingsboard platform. The user can give online classes using cameras on each component, and students or developers can retrieve data and develop their control program, then inject them into the server to be run in the hardware. Then, they can visualize their result and generate reports. This will boost the integrity of the modules and the E-learning courses in smart grids, but it is mandatory for the instructor to be at the laboratory for the scenario’s setups.
8. Conclusions and Future Work
This article proposes the design methodology of a frugally innovated test bench of smart grids for educational purposes. This developed concept can be implemented with a very low cost compared with the existing educational laboratory equipment, and it is easy to install in every university or school. This design offers to students and researchers numerous types of case studies on multiple disciplines, for example, for renewable energies, the user can study the concepts of a hydroelectric plant, wind power plant, and photovoltaic power plant, and can add more power sources and study their behavior. Through smart grid components, for example, power grid instrumentation and power meters integrations, the users can learn the different optimization techniques used for power shedding and energy flow efficiency, and they can also learn how to use machine learning algorithms for energy forecasting or defect classification in the grid.
Due to the open-source feature of the test bench, it can be used not only for smart grids case studies, but also for automation and SCADA using the PLCNext, which can be programmed in different languages, developing interfaces, and views using SCADA. Using networking and communication, the user can propose the different communication protocols to measure the latency and to test the effectiveness of the protocol bridges. The test bench offers to instructors and students a way to test false data injection algorithms testing for cybersecurity case studies, which represent a critical element in the smart grids.
The software of the test bench is also open-source and has a big active community, which is based on simple Python libraries, open visualization platforms for learning the IoT, and web development case studies. Then, there is the use of multiple co-simulations using Mosaik, which is a powerful, very futuristic tool which allows the integration of multiple software simulations, which is very helpful when it comes to optimization, forecasting, and grid visualization.
In future work, the test bench shall be implemented, and technical notes will be shared. With the installation difficulties, this test bench uses the DC Bus, and other features must be added. For example, when injecting power in a three-phase AC bus and then simulating the energy transmission, these features require a higher and more complex design. Therefore, it is better to start simple and preserve simplicity for learners and instructors; then it can be improved and improved by the users and the communities of Mosaik, Thingsboard, PLCNext, and electrical, energy, automation, and mathematicians engineers using the concept of the collective intelligence, which has a powerful tool. The laboratories must be encouraged to design an open-source test bench over buying a test bench with limited functionality that requires a lot of tutorials with a very high cost.


