Article

Development of a Predicting Model for Calculating the Geometry and the Characteristic Curves of Pumps Running as Turbines in Both Operating Modes

Department of Mechanical, Energy and Management Engineering, University of Calabria, Via Ponte P. Bucci Cubo 44/C, 87036 Rende, Italy
*
Author to whom correspondence should be addressed.
Energies 2022, 15(7), 2669; https://doi.org/10.3390/en15072669
Submission received: 28 February 2022 / Revised: 24 March 2022 / Accepted: 31 March 2022 / Published: 6 April 2022
(This article belongs to the Topic Artificial Intelligence and Sustainable Energy Systems)

Abstract

:
This article is part of a scientific research project dedicated to the study of plants generating electricity from hydraulic sources by exploiting the technology of inverted flow centrifugal pumps, also known as PAT. The main purpose is to provide a contribution to the methodologies already existing in the literature, creating a one-dimensional model capable of predicting the characteristic curves of the machine, in both operating modes, without knowing its geometry. The first part of the work is therefore focused on the description of the fluid dynamic model, capable of determining the losses in the various sections of the machine, using different calculation approaches. The development of this model was carried out using a set of six centrifugal pumps, measured at the DIMEG Department of the University of Calabria and at the University of Trento. For this range of pumps, the characteristic curves were therefore obtained, both in pump and turbine operation. The second part of this work focuses on the description of the geometric model, useful as generally few data are provided in the manufacturer’s catalog, which is necessary for the correct installation of the machine. The geometric model can determine, using these parameters and through good design techniques and statistical diagrams, the entire geometry of the machine. This model refers to a pump prototype, having a simplified geometry, for which the characteristic curves of the PAT are obtained in pump operation. These curves are compared with those present in the manufacturer’s catalog, and if they show too high deviations, it is possible to act on some geometric parameters, chosen based on a sensitivity analysis. Once satisfactory results have been obtained, it is possible to obtain the characteristic curves also in turbine operation. This procedure has been finally applied to another PAT, taken as an example.

Graphical Abstract

1. Introduction

Over the years, world energy consumption has drastically increased, with different trends in various countries based on the degree of wealth and development and the availability of raw materials and resources. Consequently, as regards the water sector, the idea of using inverted flow pumps, also known as PAT [1,2], has begun to make its way into the market. The first researchers who realized the actual potential in exploiting a pump used as a turbine were Thoma and Kittredge [3]. They began experimenting in laboratories on this technology around the 1930s. There are also traces of the use of this technology in the 1970s; however, it failed to play an important role as energy was cheap and there was still no sensitivity towards recycling and saving. It was therefore more convenient to buy energy directly from the grid, and few tended to invest in new plants to produce a small number of kilowatt-hours. However, in the 1980s, some factors prompted a re-evaluation of the use of this technology, favoring its development and its establishment on the market, including the following:
-
The inability of the distribution networks to reach rural settlements. The latter were therefore forced to produce energy independently, also using inverted flow pumps.
-
The use of power electronics: the adjustment of the machine using inverters makes it possible to obtain acceptable efficiencies for a range of different flow rates (previously the adjustments were manual and only hydraulic).
PATs are mainly used as pressure-reducing valves (PRVs) [4,5] or in the pico/micro-hydroelectric sector [6]. Regarding the first application, the typical examples are aqueducts: water distribution systems that must always be under pressure. The pressure must remain within certain values: a minimum value, necessary to reach the highest altitudes, but at the same time a maximum value that must not be exceeded, as losses increase and cause problems of operability. It is therefore necessary to adjust the pressure, as the excess energy would be lost, for this reason, it is preferable to use an inverted flow pump. The pico-hydroelectric sector, on the other hand, is mainly linked to self-production. Even small water sources, commonly neglected for economic reasons, are therefore exploited. The aim is to satisfy one’s energy needs, without selling the energy or feeding it into the power grid. It is therefore a question of withdrawing as little as possible from the watercourse, which is then released, reducing the impact on the resource. PAT can also be used by harnessing tidal energy [7], i.e., harvesting its height range in natural bays and estuaries or in artificial barrages, or extracting the kinetic energy from the tidal currents across natural and artificial channels [8]. The main feature of PAT pumps is represented by their reversibility, as it is possible, by reversing the direction of the fluid path inside the machine, to produce energy. They are generally marketed as monobloc electric pumps [9,10] in which the motor is of the asynchronous type. It can play two opposite roles: motor in direct operation and electric generator in reverse operation.
The main advantages of the use of PAT technology are represented by the following:
-
Lower costs compared to a normal hydraulic turbine, especially for small units, below 50 kW;
-
Simplicity of installation and maintenance;
-
The wide range of models available on the market.
On the other hand, since pumps are not designed to operate as a turbine, they have the following disadvantages:
-
The absence of guide vanes, which excludes the possibility of making hydraulic adjustments;
-
The lower efficiency compared to a well-designed hydraulic turbine, especially in the off-design conditions;
-
The lack of information about the characteristic curves for the turbine, as the manufacturer of the machine supplies only those for the pump.
PATs can therefore be used as a replacement for traditionally employed turbines (Francis, Kaplan, Pelton) and turbines discussed in other articles [11,12]. However, it is necessary to make sure that the PAT operation is well adapted to the characteristics of the system where the PAT will be installed. It is necessary to establish, knowing the characteristic curves of operation of a pump, the characteristic curves of the machine that operates as a turbine. The aim of the present paper is to develop a combined procedure for assessing both the geometry (which is not given by manufacturers) and the fluid dynamic performances of a generic PAT. For this purpose, many fluid dynamics models calculating losses, head, and efficiencies by changing the flow rate of the machine were calibrated on a sample of six PATs. Then, a geometrical model capable of reconstructing a prototypal geometry, by a rough sizing of the PAT, was developed, involving charts, maps, good design rules, statistical correlations, and so on. Compared to the past approaches, in this work, the possibility of refining the calculus of geometrical parameters of the geometry model is given. The deviation between the curves given by the manufacturer’s catalog and the ones foreseen in the pump operation can be reduced or annulled by changing one or more geometrical parameters, calculated by the model. A sensitivity analysis was conducted for this purpose, in such a way as to understand which parameters to act on. The objective of this research is therefore to provide a flexible tool, which allows calculating the performance of any PAT, in both modes of operation, starting from little information available from the catalog provided by the manufacturer. This would make it possible for anyone who decides to approach this technology to facilitate the choice of the PAT that guarantees the best efficiency according to the energy resources available. As already mentioned, only the behavior of the machine when operating as a pump is known, but not the behavior of the machine when operating as a turbine.

State of the Art

In the literature, there are different approaches in the study of PAT that can be grouped as follows:
  • Simple statistical correlations that aim to establish a connection between the point of better efficiency (BEP) in pump operation and that in turbine operation. In more detail, from the examination of the position of the BEP points in the pump and turbine operation, of machines for which these are known, laws are derived which can then be used to predict the location of the BEP of a new machine. For example, Child [13], Sharma [14], Alatorre [15], and Stepanoff [16] combine the best head ratio and the best flow ratio with respect to the total efficiency of the pump; Hancock [17] correlates these reports to the total efficiency of the turbine; Schmield [18] relates these relationships to the hydraulic efficiency of the pump; and Grover [19] and Hergt [20] relate these ratios to the characteristic speed of the turbine.
  • The PAT performance prediction method using specific speed, where flow rate and head are expressed as a function of specific speed [21]. Different expressions of specific speeds are used, which are gradually refined and improved to ensure better accuracy of the results. Some examples are as follows: Derakshan applied the dimensionless specific speed to obtain different relations, valid for centrifugal pumps with specific speed ns < 60 [22]; Nautiyal proposed an additional parameter through which it is possible to obtain the trend of the prevalence and the flow rate [23]; Singh proposed a correlation based on experimentation performed on a sample of 13 pumps and subsequently applied it to the pump under examination, thus obtaining the relationship between the specific speed in turbine operation and that in pump operation [24]; Tan, by testing the hydraulic performance of centrifugal pumps, used both in direct and reverse operation, obtained different linear relationships between the pump and turbine parameters [25]; Stefanizzi established a relationship between specific speed under pump and turbine mode, based on data obtained from the performance of 27 pumps, and subsequently it used to predict the performance of 11 new PATs [26].
  • Empirical correlations: Derakshan’s [27] methodology proposes head–flow and power–flow polynomial curves, interpolated on the available PAT sample. These polynomials are dimensionless based on the values of the flow rate, head, and power of the PAT at the BEP and can be used in a universal way for predicting the curves of head, power, and efficiency versus flow rate for any machine.
  • One-dimensional model: Venturini [28] developed a prediction model based on the physics of the machine and consisting in the use of loss coefficients and specific parameters, through an optimization procedure, which is applied to the machine operating as a pump and subsequently as a turbine.
  • Numerical analysis and CFD, for axial flow centrifugal pumps, which allow reconstructing, through a structured step-by-step methodology, the characteristic curve in pump mode, and subsequently in turbine mode, and predicting the behavior of the fluid inside the turbomachinery [29].
  • For commercial centrifugal radial flow pumps, through computer numerical simulations, a methodology has been developed that makes it possible to predict the characteristic curves, in both operating modes, with errors of less than 10% compared to the mathematical model [30]. The operating conditions of the site are then obtained, providing a methodology that allows the choice of the most suitable turbomachine to obtain electricity in those areas that do not have access to it, exploiting small hydroelectric resources.
All the proposed models can be improved because it is very difficult to foresee the performance curves of any PAT, given the very wide range of machines present on the market. For some PATs, these models provided acceptable results; for others, they did not. The PATs show phenomena of instability in the associated fluid, generating S-curves or cavitation phenomena and making the performance lower than a traditional Kaplan, Francis, or Pelton turbine. These instabilities are linked to the geometric configuration of the machine and to the deviation of the parameters calculated from the design values or measured in the laboratory. Given their use and their high energy consumption, it is therefore essential that their performance be optimized, and different models or design methodologies have been developed in this regard. Recent literature shows that in-depth studies have been carried out concerning the impact that the geometric parameters have on the performance of PAT, studies of a theoretical, numerical, and experimental nature [31]. A model has recently been developed those acts on the shape of the impellers of centrifugal compressors, given its influence on the overall performance of the machine [32]. It references genetic algorithms (GA) and a 3D simulation, which act on certain parameters such as the angle of the blades at the leading and trailing edges and the point where the splitter blades are connected. A new and performing design has therefore been obtained, which contributes to the research and development of compressors, without altering the technical characteristics of the fluid, to be able to replace low-consumption engines with ecological and economical fuel. A further solution, to optimize the PAT performances, refers to a numerical model which can determine the most advantageous geometric structure of the water cut [33]. Its finite thickness interferes with the flow at the entrance to the duct, generating swirling phenomena and deviations of the flow lines. Different stretching and cutting water thickness values at variable inclination are then analyzed using CFD simulations to identify the geometric features that have the greatest impact on machine performance. In recent literature, there is also a discussion that refers to PATs with low specific speed values in pico-hydropower plants [34]. This research was carried out by referring to regenerative pump models, given the characteristics that mark them in terms of stability and constructive simplicity. The approach used is both theoretical, referring to the momentum exchange theory, and through a 3D numerical simulation, to study the behaviour and performance of the machine in turbine operation. It is evident that PATs are the object of study for many researchers, as this technology is still under development and improvement. There are numerous contributions and optimizations that have been made in recent years, with different approaches and innovative ideas, both with a purely theoretical treatment and through a subsequent experimental verification.

2. Materials and Methods

The fluid dynamic models in both pump and turbine operation are shown separately, highlighting the various steps necessary to obtain the characteristic curves of the machine. These models are tuned on a sample of 6 centrifugal pumps, having specific speed changing in the range 9.05 ÷ 43.48. On these pumps, the measurements of the geometric parameters and the experimental tests on the test bench were carried out, as the flow rate varied, both in direct and reverse operation.

2.1. Fluid Dynamic Model

As already mentioned in the introduction, the proposed fluid dynamic models can predict the performance of the PATs, both in pump and turbine operation. The model provides head, efficiency, and loss variations versus flow rates changes. Figure 1 shows a flow chart summarizing the main steps of the development.
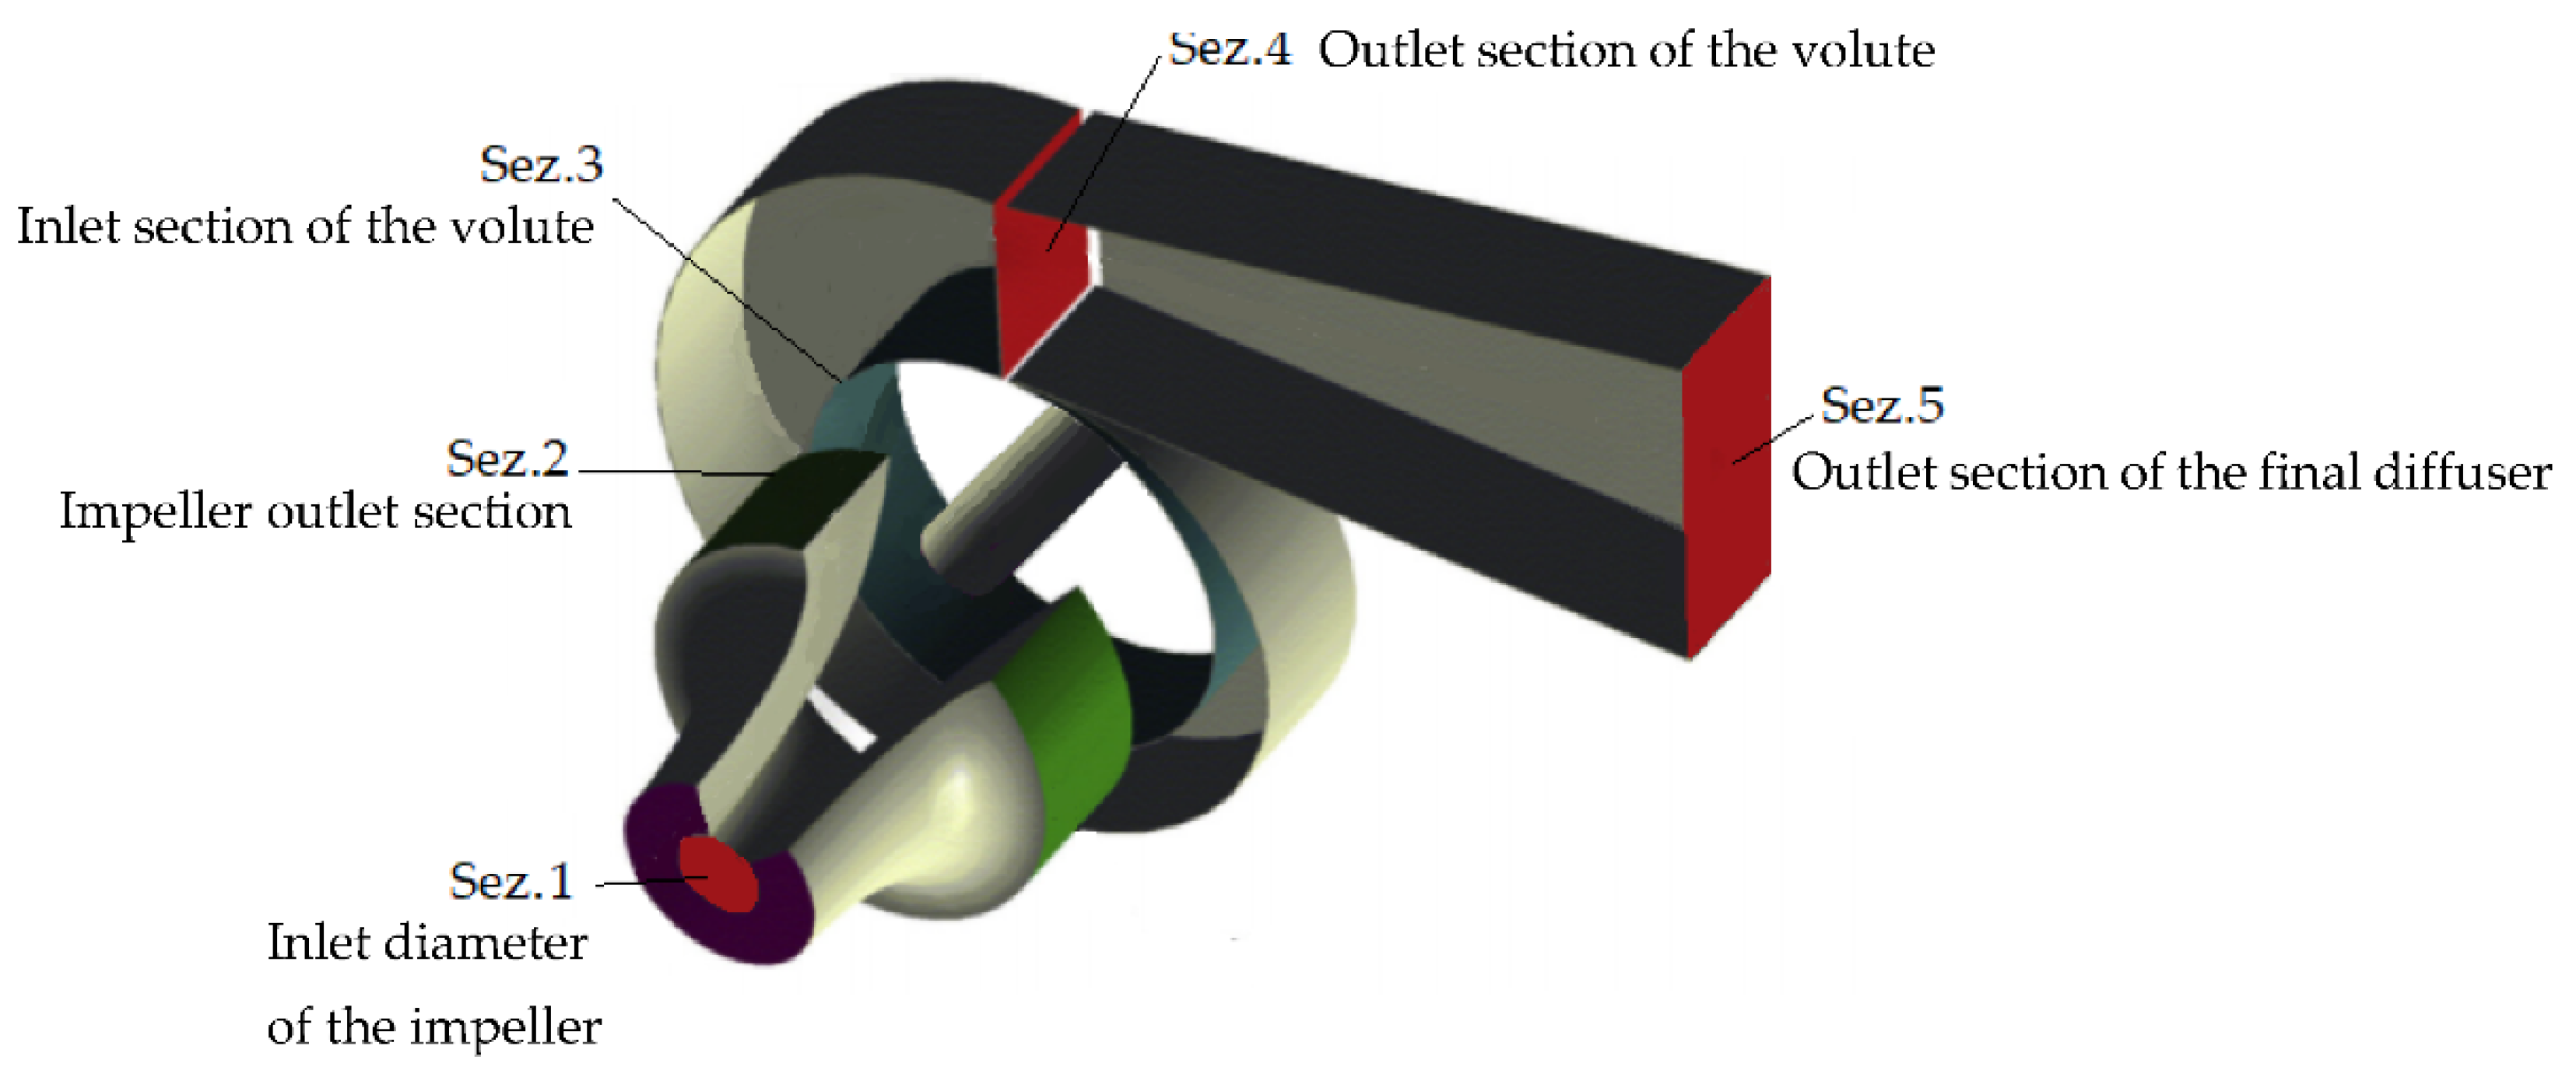
The evaluation of the losses inside a hydraulic machine cannot ignore the knowledge of its geometry, as it is indispensable for doing the calculations. It is convenient to adopt a prototype of a centrifugal pump, already described in another article [35], with characteristics common to most of the pumps available. Figure 2 shows a schematic representation of it, highlighting the passage sections and the symbols used to identify them.
Regarding the main components that make up the machine, the simplifications adopted are as follows:
Aspiration (Section 0): A conical axial section was adopted, and the hypothesis was also assumed that the inlet diameter d0 coincides with the blade tip diameter d1p of the inlet section of the impeller.
Impeller (Sections 1–2): As regards the inlet section, a truncated conical surface was considered, having upper and lower base diameters d1m and d1p and laterally delimited by the width of the blades. As a representative diameter [36], the one in correspondence with the average current line has been adopted, which divides the section into two equal parts.
Volute (Sections 3–4): Given the complexity of its geometry, some simplifications have been adopted regarding the section and its evolution. A volute with a square terminal section is assumed, with sides b and hv. The height of the volute varies linearly along the peripheral direction, until hv is reached. It is also assumed that the terminal section has a normal along the tangential direction.
Final diffuser (Section 5): It is assumed that the dimensions vary linearly moving from the inlet to the outlet section according to a reflection equal to the tangent of an angle αd, set equal to 3.5 degrees.
In the next sections, pump and turbine operations are separately analyzed.

2.1.1. Pump Operation

The fluid dynamic model relating to pump operation is shown, referring to the procedure described in Figure 1.

Velocity Triangles

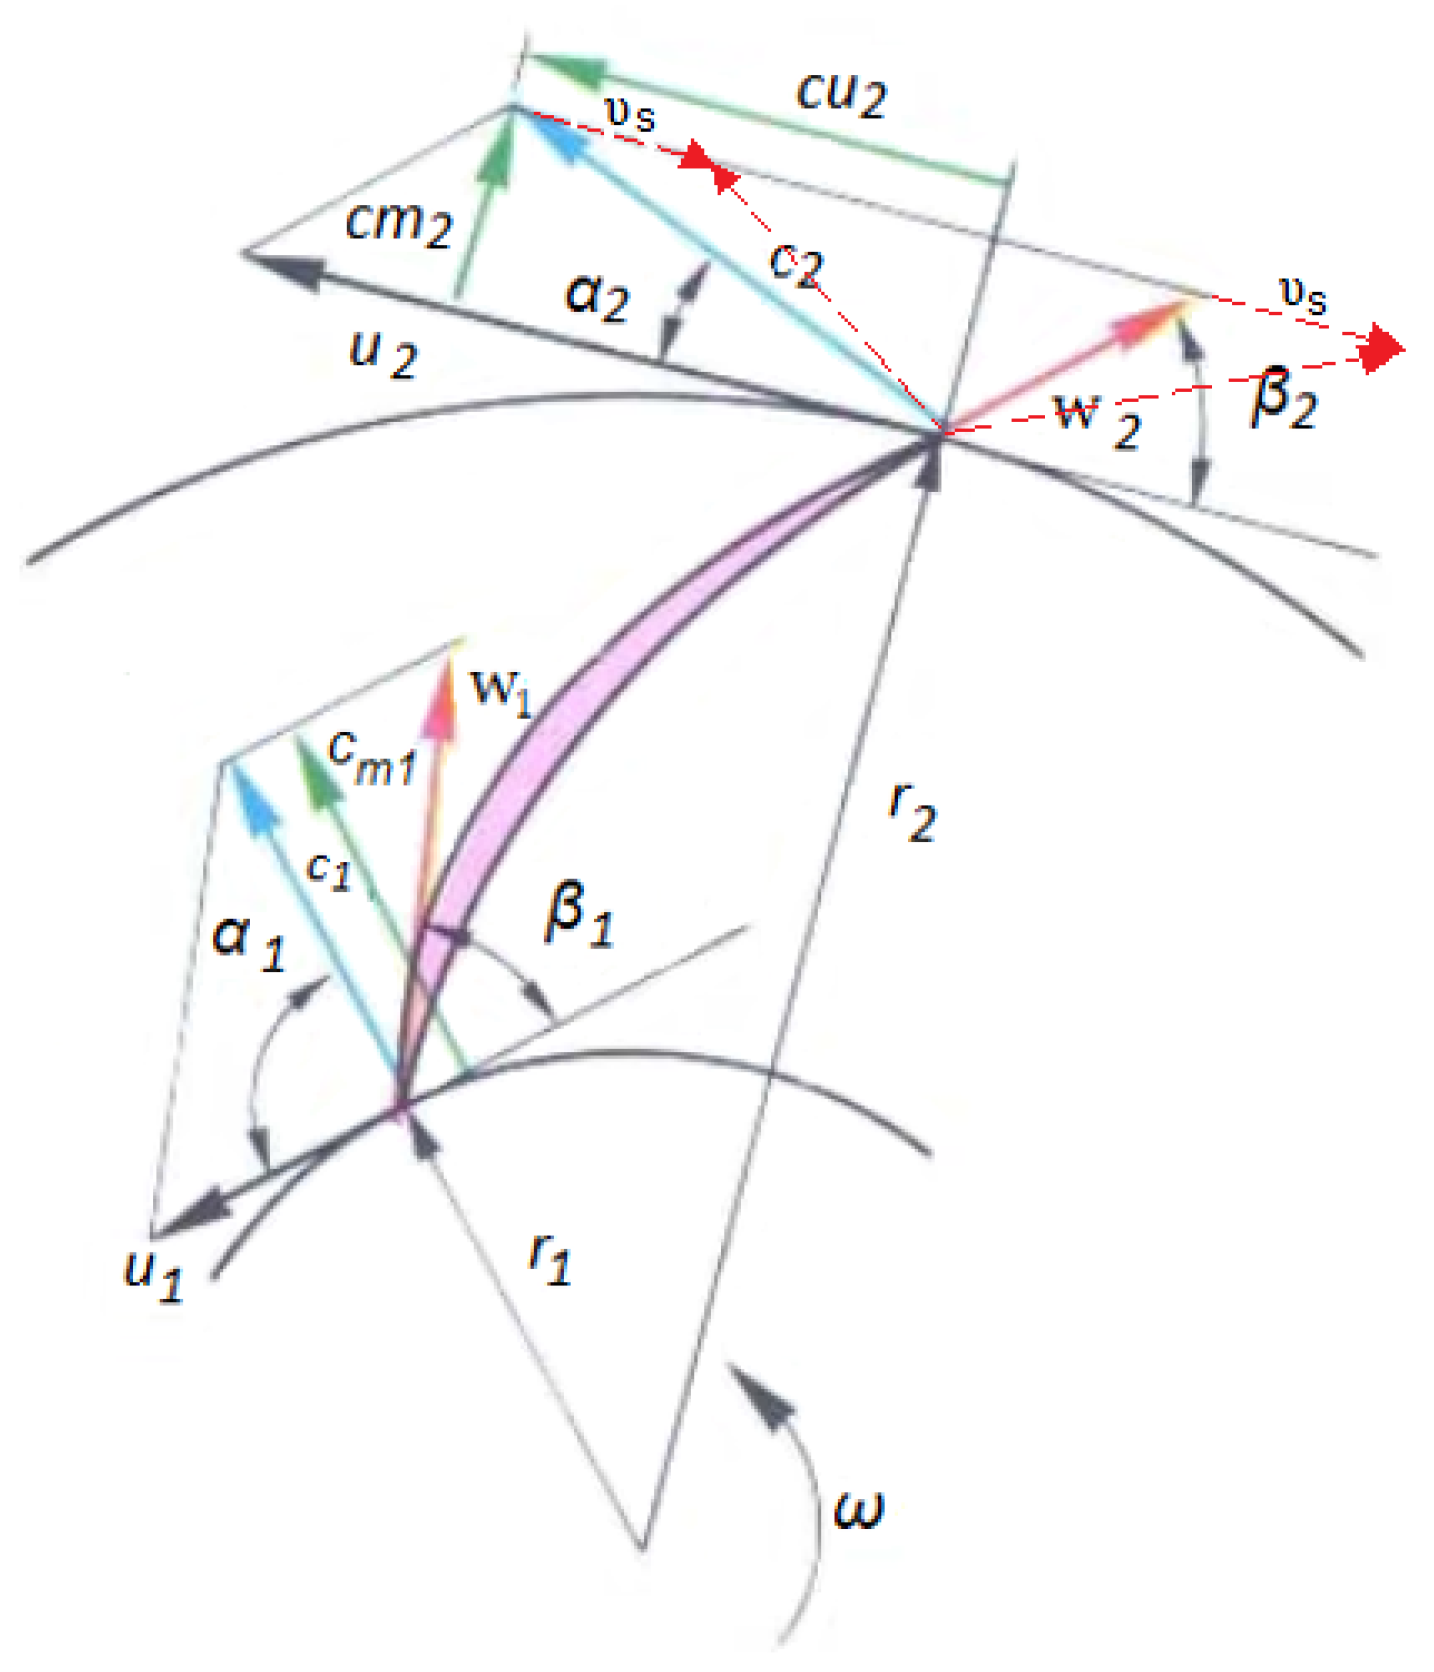
To evaluate the hydraulic losses, the model calculates the flow speed in the various sections of the machine. Initially, this calculus is done at the inlet and outlet of the impeller, given the direct influence on the theoretical head (Eulerian work) estimation. The hypothesis made for the inlet section is that the fluid reaches the impeller in a direction perpendicular to the passage area, therefore with an angle α1 equal to 90°. The tangential component of the absolute inlet speed is therefore equal to zero (cu1 = 0), as can be seen from the velocity triangles represented in Figure 3.
A smaller tangential component of the absolute speed (cu2) is obtained, and thus a lower theoretical head is obtained compared to that determined in the one-dimensional design. It represents an inability of the impeller of the machine, having a finite number of blades, to transfer all energy to the fluid. To account for this loss of performance, the slip speed (Figure 4), vs, has been calculated:
v s = ( 1 h 0 ) · u 2
The tangential component of the absolute velocity, corrected with the slip, is obtained from the following expression:
c u 2 = c u 2 v s
In Equation (1), h0 represents the slip factor.
Many correlations were proposed for assessing the h0 parameter:
-
Stodola [37,38] assumes that the motion of the fluid at the exit of the impeller is the sum of a main flow, which is guided by the blades, and of a vortex, having a rotation speed equal in modulus but in the opposite direction to that of the impeller. The diameter to which this vortex refers corresponds to the minimum passage section at the exit of the impeller.
-
Stanitz [39,40], after a series of experimental tests, highlighted how the speed of slip, υs, was independent of the angle β2p and not affected by the compressibility effects but was a function exclusively of the number of blades, z.
-
Busemann [39,40] considered radial impellers having thick blades in an infinitesimal logarithmic spiral, which transforms into a rectilinear array made of infinite foil profile planes of infinitesimal thickness. Furthermore, he assumed that the upstream machine elements downstream of the rotor are sufficiently distant to have no effect on the behavior of the fluid in the mobile blade.
-
Qiu, Mallikarachchi, and Anderson [41,42], who analyzed the various computation models of the slip factor present in the literature, realized their application limits. Based on this analysis procedure, they obtained a unitary formulation of the slip coefficient, which considers both the geometry of the impeller and the flow conditions. This model was derived from the studies of Eckardt [43], who believed that the rotation speed of the vortex was not equal to the rotation speed of the impeller but depended on the blade load, that is, the difference in relative speed between the face under pressure and that in the blade depression.
-
Other possible correlations are those obtained from Balje [44] and Yadav and Misra [45].
-
Wiesner carried out an in-depth study on the correlations that existed in the literature in that year (1967) to verify which was the most reliable and which provided results as close as possible to those obtained experimentally. From this study, he found that Busemann’s correlation [39,40] is the most reliable if applied to pumps with centrifugal impellers.
Stodola’s formula, however, proved to be the best option as it provided results more consistent with the characteristic curves of the machines supplied by the manufacturers. By following Stodola’s formula,
h 0 = 1 π z sin ( β 2 p )
For some models, the slip phenomenon was considered also at the impeller inlet: the inlet is not axial and a value of the angle α1 different from 90° has been obtained. Considering the slip phenomena, calculated, also in this case, using Stodola’s formula (Equation (3)), the tangential component of the absolute velocity becomes cu1 and the theoretical head is calculated as follows:
H t h = 1 g   ( u 2 c u 2 u 1 c u 1 )
This solution has led to an improvement in the results achieved, allowing the head curve obtained from the model to be brought closer to that provided by the catalog.

Hydraulic Losses

The model evaluates the hydraulic losses by referring to the individual components and are classified into friction losses (Table 1) and dynamic losses (Table 2).
In evaluating these losses, the value of the friction coefficient was obtained using the Colebrook–White formula [36], in transition and turbulent conditions. The speed w which appears in the expression of the losses in the impeller (Equation (5)) represents the average value of the relative speeds calculated between the inlet section and the outlet section of the impeller. The choice to use this expression is the result of an in-depth experimental analysis. Regarding the friction losses inside the volute, the approach recommended by Worster was followed [46]. It is hypothesized that the velocities inside the volute have a purely tangential direction and that a free vortex velocity distribution exists in the volute. The analysis is carried out by dividing the component into 18 sectors and evaluating the friction losses in each of them. The purpose is to analyze the volute considering the variations in both dimensions and speeds. It was considered more correct to evaluate these losses by referring to the average speed inside the sections rather than to that at the outer edge of the volute in the exit section. This last approach would have led to a trend of decreasing friction losses as the flow rate increased. Table 2 shows the dynamic losses obtained for the related machine components.
The shape of the final diffuser was assumed as that of a diverging duct with a gradual widening of the section. The value of parameter c is obtained from the following equation, as a function of the input (b) and output (b5) sections of the component and its length (Ld):
c = b 5 b 2   L d
In addition to the losses in Table 2, another loss is detected, due to the vortex, which arises above all at low flow rates. The model, being one-dimensional, is unable to consider bidimensional phenomena such as vorticity. This observation was confirmed by the experimental investigations carried out by Van der Braembussche [48]. For overcoming this critical issue, some expressions based on experimental observations were proposed.
For Q < Qbep,
h d i f f = c u 3 2 c u 3 b e p 2 2 g
For Q > Qbep,
h d i f f = 0
Once the theoretical head and hydraulic losses have been evaluated, it is possible to obtain the real head by calculating the difference between the theoretical head and the hydraulic losses.
H m = H t h l o s s e s

2.1.2. Turbine Operation

The path of the fluid is inverted with respect to direct operation: the entry coincides with the final diffuser of the machine and is identified by Section 4, while the discharge is identified by Section 1. The speeds are then calculated starting from the inlet section of the machine.

Velocity Triangles

To evaluate the losses, it was first necessary to calculate the velocities in the various sections of the machine:
-
Inlet: For the calculation of the velocities, reference is made to their average value.
-
Volute: For this component, a free vortex distribution is hypothesized, and this assumption is confirmed in the experimental analyses carried out by some researchers.
-
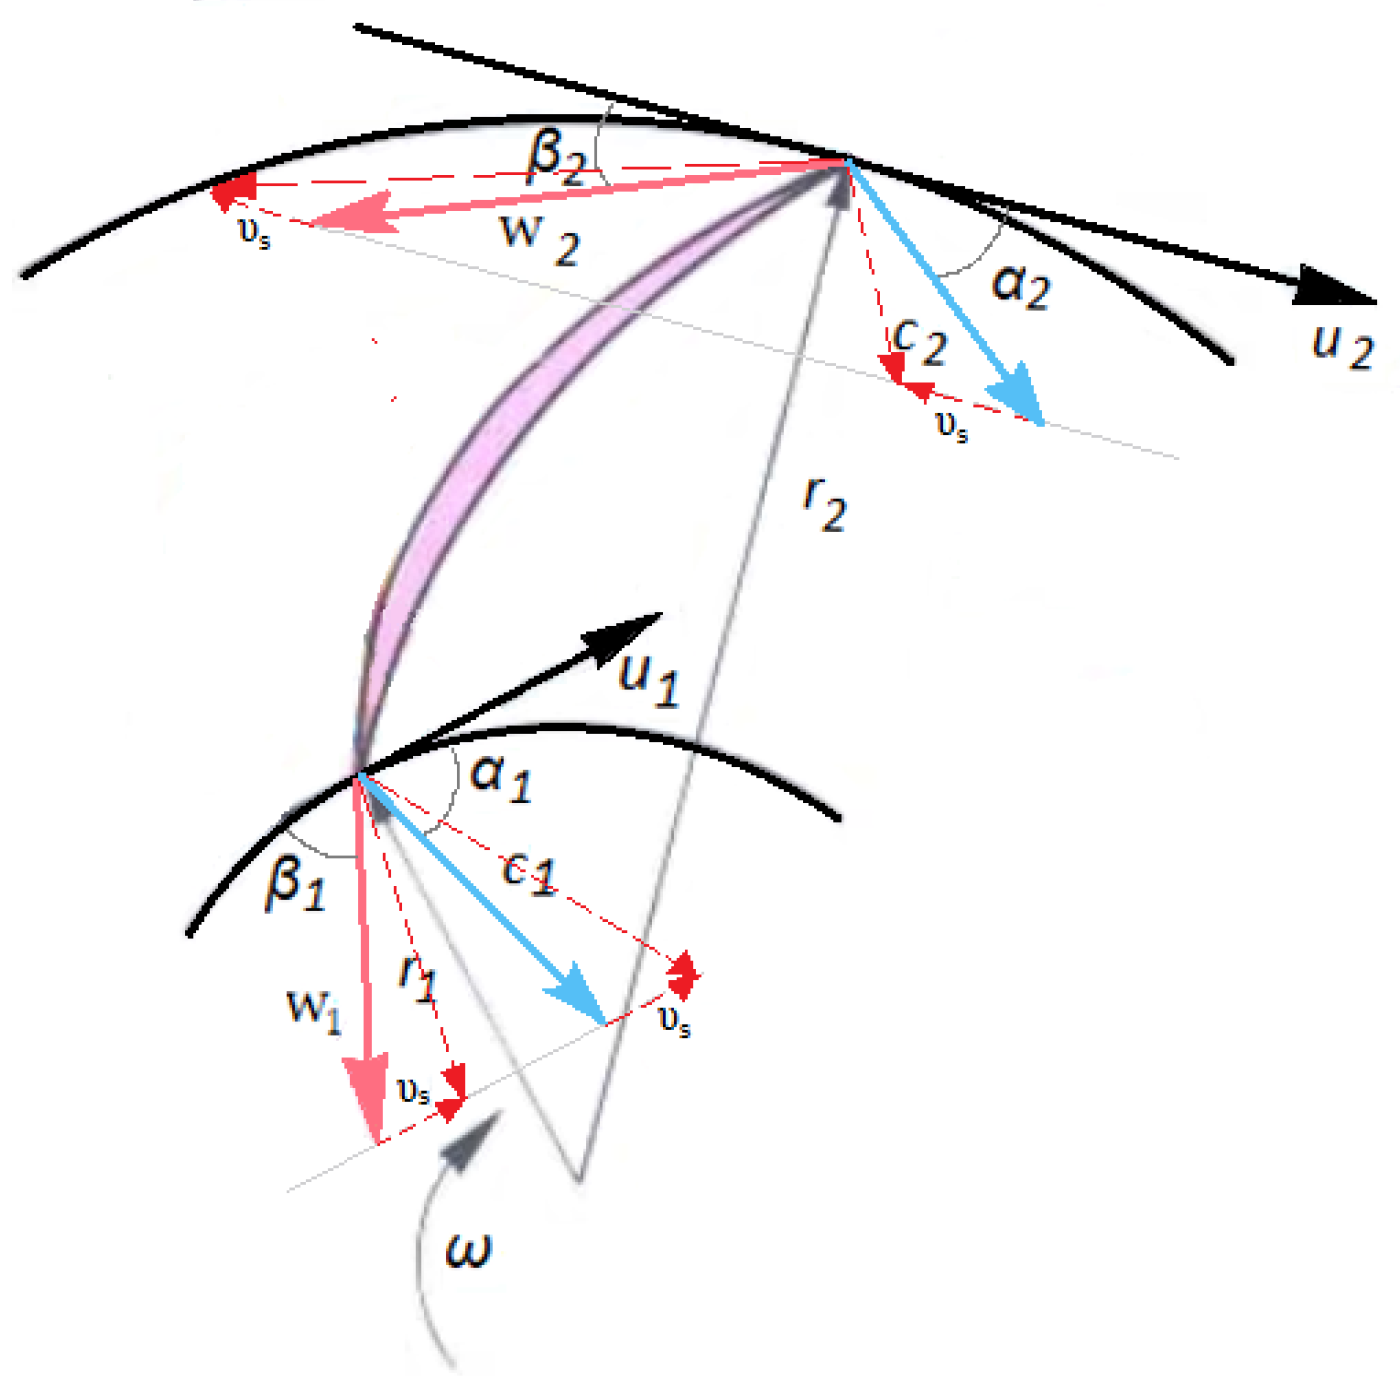
Impeller inlet/outlet (Figure 4): In both sections, the corrections related to the two-dimensional phenomena of slip were considered. The use of the slip factor in the turbine input has been confirmed in various studies [49,50].
Concerning the phenomena of slip in turbine operation, the following correlations have been used:
For ns < 10, Stodola’s formula was used (Equation (3)).
For ns > 10, the Stanitz formula [39,40] was used, expressed as follows:
h 0 = 1 0.315   ( 2 π z sin 1 ( c m 2 u 2 ) )
This criterion is part of the tuning of the model by comparing the theoretical and experimental results.
For the same reason, for ns < 10, the tangential component of the absolute speed, cu2, is calculated by assuming the inlet angle α2 as Worster suggests [46,51] and is used in other models [52]:
α 2 = tan 1 [ b 2 π b 2   ln ( 1 + 2 b d 2 ) ]
Then,
c u 2 = c m 2 tan ( α 2 )
For ns > 10, cu2 is calculated by assuming a free vortex distribution of velocities in the area between Section 3 and Section 2, i.e., between the volute and the impeller inlet. The expression used is as follows:
c u 2 = c u 3   d 3 d 2

Hydraulic Losses

For the evaluation of hydraulic losses, also in this case, a distinction is made between friction losses and dynamic losses (Table 4). For the former, the formulas adopted are the same as those for direct operation (Table 1). The only difference lies in the evaluation of the speed w which appears in the friction losses in the impeller, since in this case the slip also occurs in the inlet section, changing the value of the tangential component of the relative speed.
In the expression of the diffuser losses, following the flow direction of the fluid in turbine operation, this component is a converging duct. In the losses in the diffuser, ξ d is obtained as a function of the ratio between the final section volute width and the final section diffuser width, taken from [53] and reported in Table 5:
The determination of the losses was carried out with reference to the recommendations of Idel’cick [54]. At this point, the engine head is calculated as the sum of the Eulerian work and the previously exposed hydraulic losses:
H m = H t h + l o s s e s
Even in turbine operation, the actual flow rate differs from that of the plant by an amount equal to the leakage of liquid from the clearances present between the impeller and the casing. The parameter that takes this phenomenon into account, that is, the volumetric efficiency, is determined as follows:
η v = Q Q s Q

2.2. Geometric Model

The knowledge of the geometry of the machine is fundamental for developing the model [36,37]. However, pump manufacturers provide only the geometrical parameters strictly necessary for the correct installation of the machine. This problem was faced with the preparation of a geometric model, capable of obtaining the missing values. It uses few geometric parameters that can be easily deduced from the catalog and, by exploiting the best design practices provided by the technical–scientific literature and based on statistical graphs derived from the measured machines, calculates the other geometrical parameters. The object of this geometric model is the determination of all those geometric parameters necessary for the evaluation of the losses.
The design criterion is inspired by what is present in [37] and requires knowledge of the following parameters:
-
Flow rate and head relative to the best efficiency conditions (Q, Hm);
-
Rotational speed at which the machine must work (n);
-
Head at the shut-off (Hmo);
-
Absorbed power at the point of best efficiency (Pe);
-
Height of the machine (h2);
-
External diameter of the impeller (d2).
Knowing these parameters, it is possible to size the components listed below.

2.2.1. Calculation of the Shaft Diameter

This parameter was obtained by carrying out a simplification. Since the machines under examination are generally subjected to low stresses, only the torsion to which the shaft is subjected was taken into consideration [37]. Considering τa, the maximum allowable tension of the material of which the shaft is composed, and Pe, the maximum power that is reached at the axis of the machine, the shaft diameter was obtained as follows:
d s h f = ( 16 P e ω π τ a ) 1 3
Since it is not always possible to know the value of the admissible voltage for each pump under analysis whose constituent material is known, the value obtained to which reference will be made in the maximum calculations was an average value equal to 7.56 Mpa [37].

2.2.2. Sizing of the Inlet Section

For this section, the parameters determined are as follows:
-
The blade tip diameter, d1p, is obtained through an interpolation function, of order two, which correlates the blade tip diameter with the specific speed, that is
d 1 p d 2 = 0.00003 n s 2 + 0.0106 n s + 0.1219
-
The internal diameter of impeller inlet d1m is assumed with design criteria, considering that the shaft must be housed in the impeller hub. It is determined as follows:
d 1 m = k d s h f
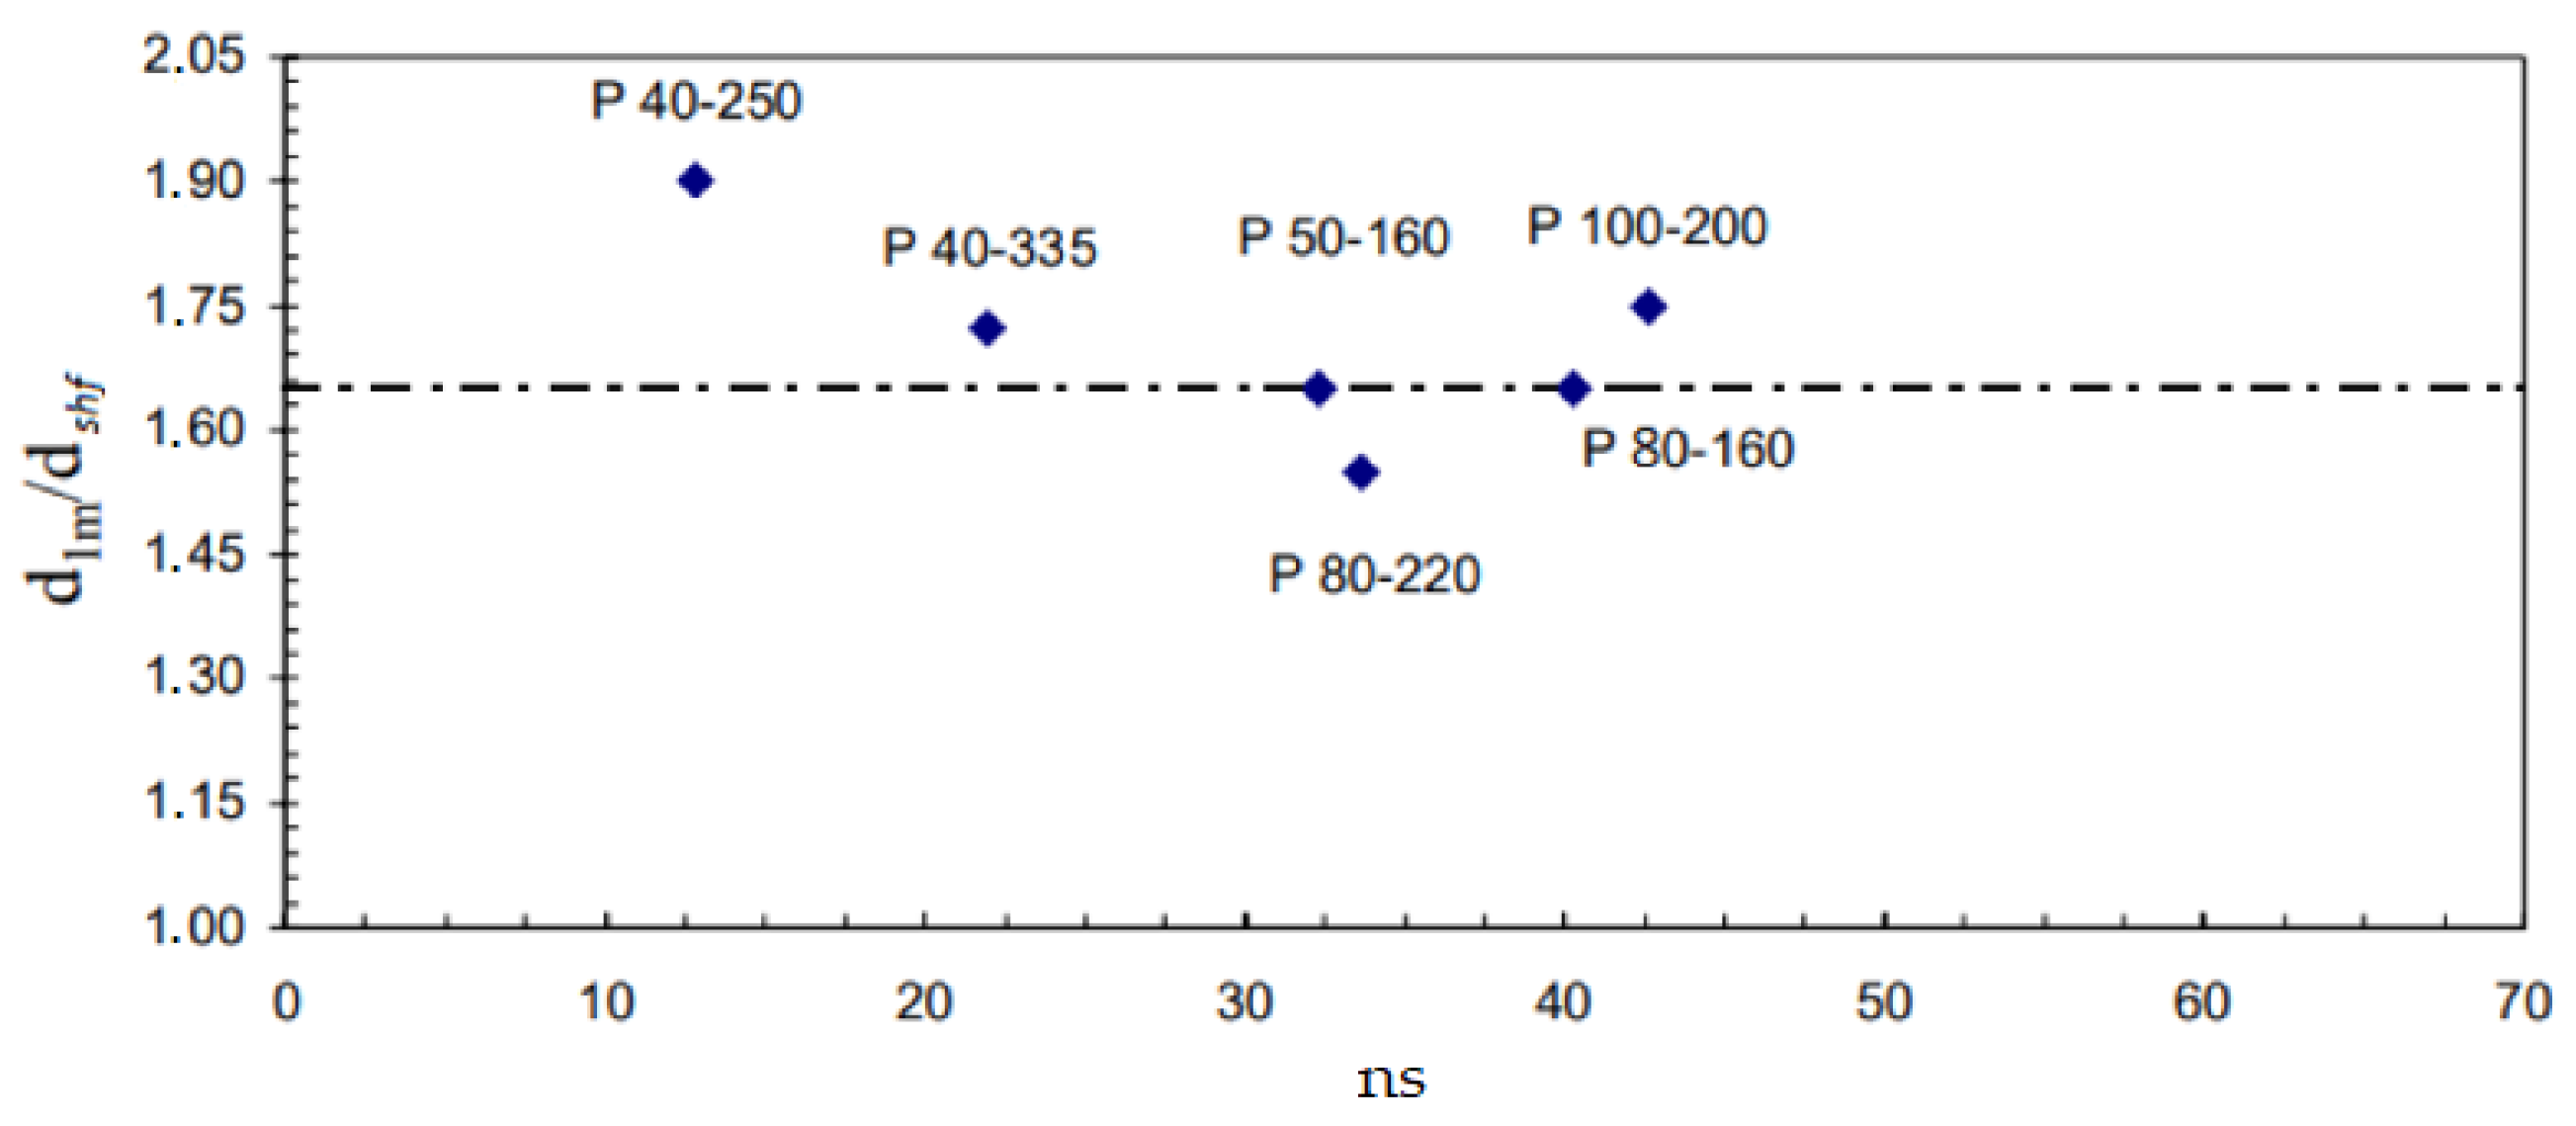
The coefficient k, based on the measurements obtained on the range of pumps available (Figure 5), is set equal to 1.65.
-
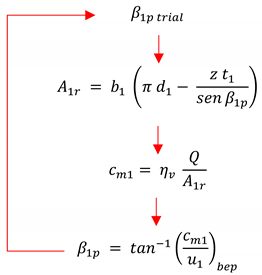
The inlet angle of the relative velocity vector, β1p, was obtained by imposing that, in correspondence with the design conditions, the geometric angle is equal to the real angle. This evaluation of the angle of entry is aimed at minimizing, under design conditions, the losses due to shocks. For a correct evaluation of the meridian speed, both the volumetric efficiency ηv and the real transit area must be considered. The real transit area considers the overall dimension factor of the blades which in turn depends on the angle β1p. It is clear that there is a need to resort to a recursive procedure for the evaluation of β1p.
Energies 15 02669 i001
-
The width of the inlet blade, b1: Indicating with θ the inclination of the blade edge with respect to the radial direction, the length of the incoming blade was obtained as follows:
b 1 = d 1 p d 1 m 2   1 cos ( θ )
An average value of the angle θ was obtained from a series of measurements carried out on the pump subjects of this analysis, and it is equal to 40°.

2.2.3. Determination of the Geometry of the Seals

For the determination of the spokes of the seals, the hypothesis of linear dependence between the diameters of the seals and the blade tip diameter was assumed. This hypothesis is satisfactorily verified for the front seal while exhibiting less feedback when applied to the rear seal. Given the modest influence of these parameters on the evaluation of volumetric returns, the approximation was considered acceptable. The relations used to evaluate the diameters of the seals as a function of the inlet blade tip diameter are as follows:
d f = 1.3031   d 1 p
d b = 1.3138   d 1 p

2.2.4. Determination of the Number of Blades and the Angle β2p

The number of blades and the angle β2p were evaluated by following the procedure described by Lobnanoff [37], using the statistical diagram shown in Figure 6. The use of the diagram presupposes the knowledge of the specific speed of the machine and of the ratio between the vacuum head Hmo and the head at BEP, Hm, available in any case from the catalog. Figure 6 shows the points relating to the range of pumps under examination. The values of the parameters chosen are obtained as a function of the curve that comes closest to these points. Being a statistical diagram, obtained from many tests carried out on different models of machines, in some cases it may provide accurate results, in other cases it may not. For this reason, since the number of blades is a simple value to find, it is obviously preferable to use the known value.

2.2.5. Calculation of the Blade width at the Outlet

The height b2 of the unloading blades was obtained after defining the value of flow or flow coefficient, ϕ. The value of this coefficient is chosen from a statistic diagram whose use presupposes the knowledge of the specific speed and of the number of blades z. The height of the blade is obtained through the expression
b 2 = Q ( π d 2 z t 2 sin ( β 2 p ) )
The thickness of the blades, t2, was assumed to be 4 mm.

2.2.6. Sizing of the Volute

The diameter of the water cutter (d3) is obtained considering that it must be slightly higher (about 5%) than the external diameter of the impeller. This is necessary to avoid interference due to machine vibrations. The following dimensioning criterion [38] is adopted:
d 3 = 1.05   d 2       n s [ 10 20 ]
d 3 = 1.06   d 2       n s [ 20 30 ]
d 3 = 1.07   d 2       n s [ 30 50 ]
d 3 = 1.09       d 2 n s [ 50 75 ]
The geometry relating to the exit section of the volute (A4) is obtained through the value of the average speed in the volute. It is expressed as a function of a parameter Kv, obtained from a statistical diagram as the specific speed varies.
The procedure used is as follows:
K v = v v o l u t e 2 g H m
A 4 = Q K v 2 g H m
b = h v = A 4
A square geometry was assumed for the exit section of the volute (A4).

2.2.7. Sizing of the Final Diffuser

It has been assumed that the length of the final diffuser, Ld, can be assumed to be equal to the difference between the height h2 (distance between the axis of the pump and the discharge flange) and the radius r2. It was therefore possible to dimension the output section of the final diffuser using the following expressions:
b 5 = h 5 = 2   L d   tan ( α d ) + b
A 5 = b 5 h v
The half-opening angle of the diffuser αd is set equal to 3.5 degrees in such a way as to ensure that fluid vein detachment does not occur.

2.2.8. Impeller–Case Distance sd

The impeller–case distance was evaluated following an analysis carried out on the geometric characteristics of the pumps under examination. An average value of 9 mm was established. Although there are undeniable differences between this value and the real one, the influence of the parameter on the evaluation of quantities of interest, and in particular the friction efficiency on the disc, is reduced to such an extent that the approximation was deemed acceptable.

2.3. Measurement of Geometric Parameters

To verify the accuracy of the geometric model, it was necessary to measure, for each pump subject of this analysis, the following geometric parameters:
-
External diameter (d1);
-
Eye diameter of the impeller (d2);
-
External blade width (b1);
-
Blade width at the eye of the impeller (b2);
-
Outflow angle relative to the external diameter (β1);
-
Outflow angle relative to the eye of the impeller (β2).
The measurement of some of the parameters listed above such as the diameters and the height of the blades did not present difficulties. To perform such measurements, a vernier caliper was used (0–1000 mm range, 0.15 mm accuracy). The evaluation of the angles β1 and β2 was carried out adopting the following methodology:
-
To calculate the exit angle β2 (angle relative to the high-pressure area), it was verified that the profile of the impeller blades in the radial plane was approximated by a logarithmic spiral, using a probe mounted in the spindle of the milling machine to reconstruct its shape. The equation of the logarithmic spiral in polar coordinates r, θ (where r is the generic radius of the profile in a radial plane and θ is the angle that this radius forms with the axis of the machine always in the radial plane) is as follows:
r = a   e m θ
Having a series of pairs of values of r, θ it is possible to evaluate by interpolation the unknown values a and m of Equation (47). To obtain the values r and θ, the various measured impellers were mounted on a divider disc of the type used for milling machines. This disc allowed the rotation of the impeller installed on it exactly by the desired angle, with great precision.
-
To determine the angle β1, it is required that in correspondence with the design conditions (BEP point) there is a correspondence between the geometric angle and the flow angle.

3. Results

The analysis was carried out on five Ksb pumps (P40-335, P80-220, P40-250, P50-160, P100-200) and a Caprari pump (P80-160), which cover a specific speed range from 9.05 to 43.48. These pumps were measured at the DIMEG Department of the University of Calabria, except for the P100-200, which was instead measured at the University of Trento. They are centrifugal pumps with a conical axial inlet and perpendicular discharge, a volute with a square end section, and a height that varies linearly along the peripheral direction. The final diffuser consists of a diverging truncated cone. The following paragraphs show the results of both the geometric and fluid dynamic models.

3.1. Results of the Fluid Dynamics Model

The following Figure 7, Figure 8, Figure 9, Figure 10, Figure 11 and Figure 12A,B show the characteristic curves obtained from the fluid dynamic model for the range of pumps under examination, both in turbine and pump operation. In this case, the geometric parameters of the pumps are known, as they have been measured, and therefore the model processes these values according to the machine prototype described above. These curves are compared with those measured experimentally to highlight the deviation and an error band of 5%.
As can be seen in the Figure 7, Figure 8, Figure 9, Figure 10, Figure 11 and Figure 12A,B, in turbine operation, the PATs are able to provide satisfactory performances under nominal operating conditions. To the right of the BEP point, the efficiency drops slowly, and this represents an advantage of the PATs, because it allows working with good efficiency in a wide range of flow rates. Nevertheless, there are no very high efficiencies, if compared to traditional machines, such as small Francis and Pelton turbines. The main cause is linked to the fact that the PATs are not designed to work as a turbine, and for this reason they are not optimized. In addition, there are instability phenomena that occur inside the machine when it operates outside the design conditions. This instability can occur as follows:
-
Oscillations of the rotation speed;
-
Instability in the torque applied to the motor shaft;
-
Instability in the head from the turbine or in the flow rate processed;
-
Cavitation due to the presence of low suction pressures;
-
Water hammer, which stresses both the piping system and the mechanical parts of the PAT.
There are therefore strong fluctuations in the torque that is transmitted to the machine shaft which, in the transition from pump to turbine operation, requires long synchronization times of the machine with the generator. The PAT is therefore not able to adapt to the variations of the energy required by the network. These fluctuations can also occur during turbine operation, during synchronization with the generator at the frequency of the electrical network in the starting or braking phase, and for low flow rates or when the load applied to the shaft is zero, as the hydraulic energy is entirely dissipated by the friction in the bearings and the impeller does not accelerate. Regarding pump operation, centrifugal pumps are operating machines and, to obtain high efficiencies, they are designed to minimize losses. The best pump efficiencies are obtained for machines with high specific speeds. The shape of the impeller is less critical and allows a more regular fluid passage; there are no abrupt changes in shape or strong bends. However, high specific speed pumps process high flow rates but low heads. For low specific speed values, these machines are designed exclusively to provide high heads at the flow rate, at the expense of efficiency. To obtain high heads, the impeller assumes a ‘pan’ conformation; it is very flattened, and the fluid threads have strong curves, producing high pressure drops and therefore low performances. For example, the 40-335 pump has low efficiency because it only produces head. It must therefore centrifuge, and it is necessary to increase its diameter, flattening its shape.

3.2. Results of the Geometric Model

This paragraph shows the comparison between the geometric values determined by the model previously described and the actual geometry of the machines measured in the laboratory (Table 6). Furthermore, the difference between the two corresponding values is highlighted to be able to observe the reliability of the procedure used. Since this is a study based on statistical graphs, it is foreseeable that this difference will be minimal for some values, while it will be substantial for others, depending on the actual geometry of the machine, which adapts to the model itself. It is the designer’s task to establish, and then evaluate, whether to accept this obtained gap, obviously depending on the sensitivity that the parameter itself has towards the result. This procedure was the basis for the verification of the model and its refinement. The curves that have been obtained from the entire module, which includes the fluid dynamic and geometric model obtained for the machine models under examination, have reported tolerable results for the purpose that had been set.
As previously specified, we notice significant differences for some values. These differences, however, are relative and calculated as a function of the specific measured value. This analysis was carried out on a sufficiently large number of models, in such a way as to allow their improvement. Obviously, this research, being still ongoing, has the potential to provide even better results.

4. Sensitivity Analysis

The proposed model provides more accurate results when using the measured geometry of the machine. The influence of the single geometric parameters on the model results was analyzed to carry out a sensitivity analysis. The geometric parameters to which the model is most sensitive have been identified and are as follows:
-
Hub diameter d1m;
-
Width of the blades entering the impeller b1;
-
Suction diameter d0;
-
Width and height of the volute hv, b;
-
Impeller exit angle β2;
-
Height of the blades exiting the impeller b2.
A sensitivity analysis was carried out for each of these parameters in correspondence to percentage variations ±∆/2% and ±∆%. For both pump and turbine operation, the following parameters are determined:
-
QP/T meas: flow rate to BEP measured on the bench;
-
QP/T calc: flow rate to the BEP calculated by the model;
-
HP/T meas: head at BEP measured on the bench;
-
HP/T calc: head at BEP calculated by the model.
The percentage error is then evaluated as follows:
( Q , H ) P / T m e a s ( Q , H ) P / T c a l c ( Q , H ) P / T m e a s
Table 7 summarizes the influence of the geometric parameters considered on the values of flow rate and head at the BEP, in direct (QP, HP) and inverse (QT, HT) operation. The stars (*) indicate a greater or lesser degree of sensitivity in proportion to their number.
For example, (*) means that the model is not very sensitive to this parameter, for (****) the model is very sensitive to this parameter.
As can be seen from Table 7, in determining the head at BEP in turbine operation (HT), the most critical parameters for what is necessary to have a value as accurate as possible are the diameter of the hub (d1m), the height of the inlet blades (b1), the suction diameter (d0), and the dimensions of the volute (hv, b). Regarding, instead, the determination of the flow rate at the BEP for the turbine operation (QT), the influence of the height of the inlet blades b1 is always negligible. As an example, Table 8, Table 9 and Table 10 show the results relating to parameters b and hv, to which the model is most sensitive, for three representative pump models: P40-335, P40-250, and P80-220. During the analysis, the range of variation of each parameter is between ±20%, except for three parameters which showed a higher sensitivity (diameter of hub and suction band diameter of ±10%, width of the volute band of ±5%).

5. Procedure for Predicting the Performance of a Generic Pump

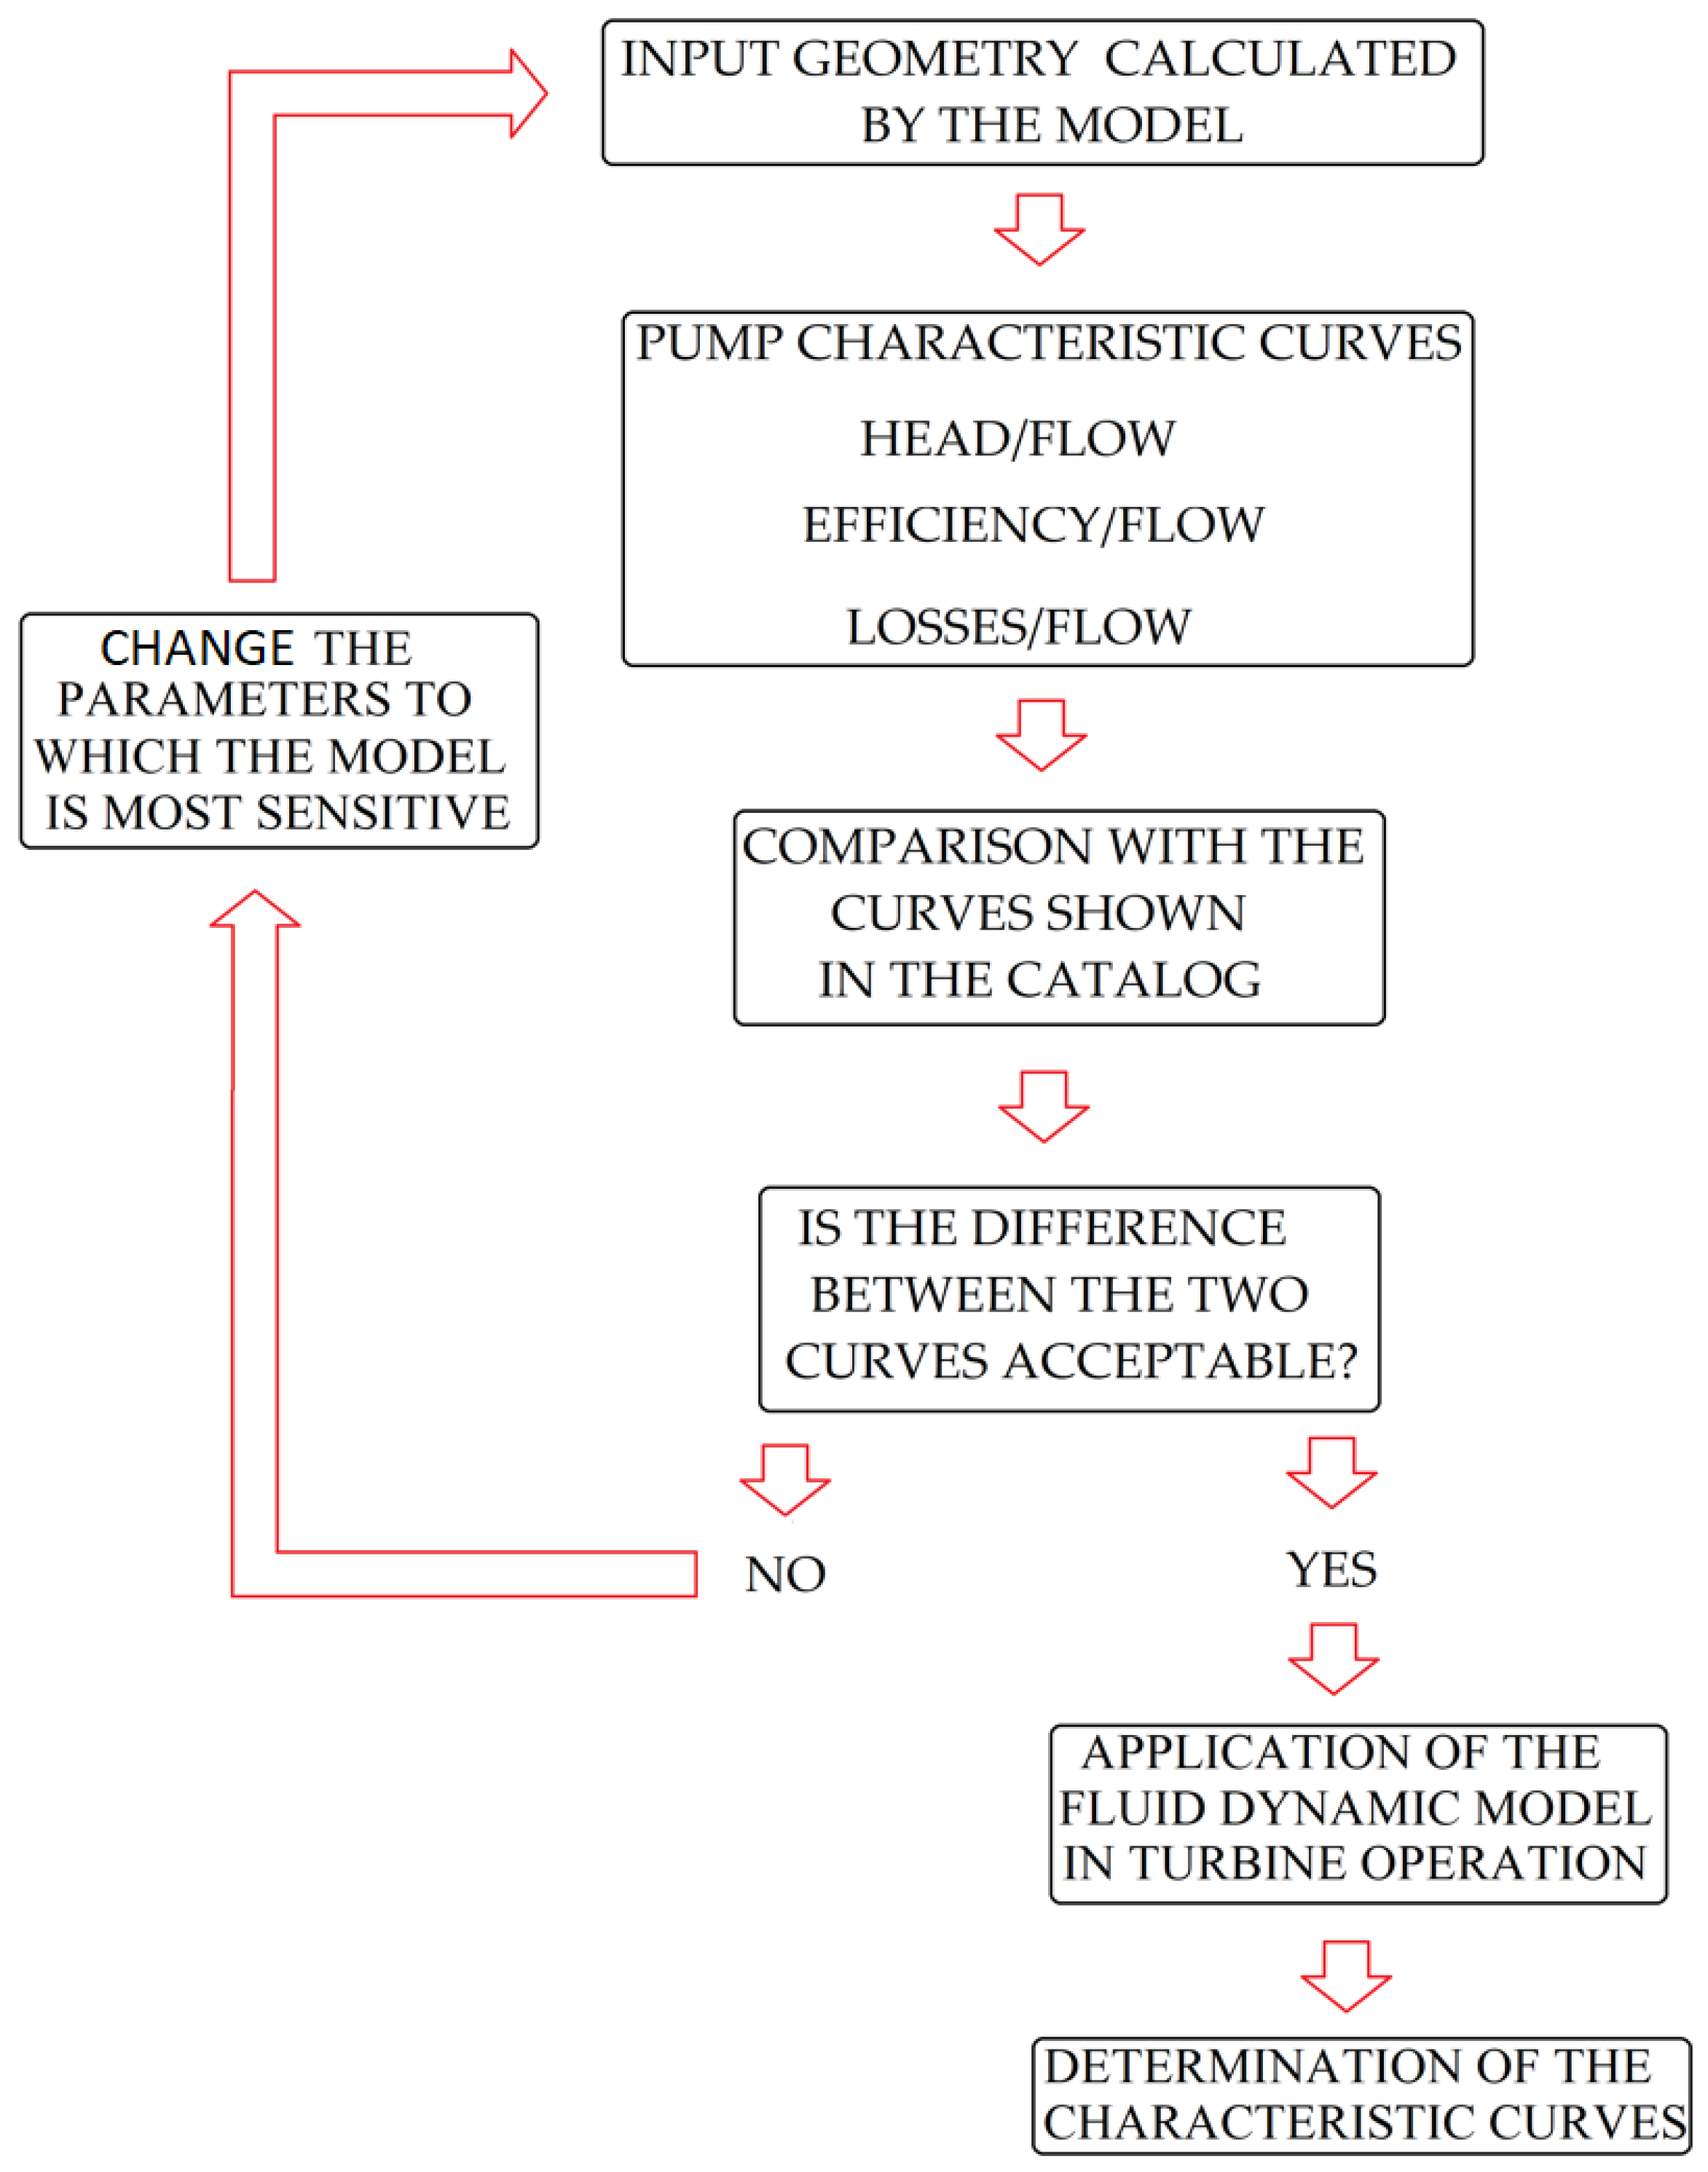
This paragraph describes the global procedure for calculating the performance of a generic PAT, which uses both the pump/turbine fluid dynamic model and the geometric model. In the first phase, the geometry of the machine is built, as described in Section 3, starting from the data Q, H, Hmo, h2, d2, and n acquired from the catalog. The fluid dynamic model is then applied to calculate the performance of the machine in pump operation, and comparisons are made with the curves available in the catalog. At this point, two situations could occur: the first is that the two curves are very close, and the second is that the two curves do not coincide. In the second case, it is necessary to act on the geometric parameters calculated by the model, starting from those to which the model itself is most sensitive. The manual insertion of these parameters into the model which calculates the geometry (Section 3) is possible. When, after several attempts, the curves concur, the model can be applied in turbine operation. The procedure is shown in Figure 13.
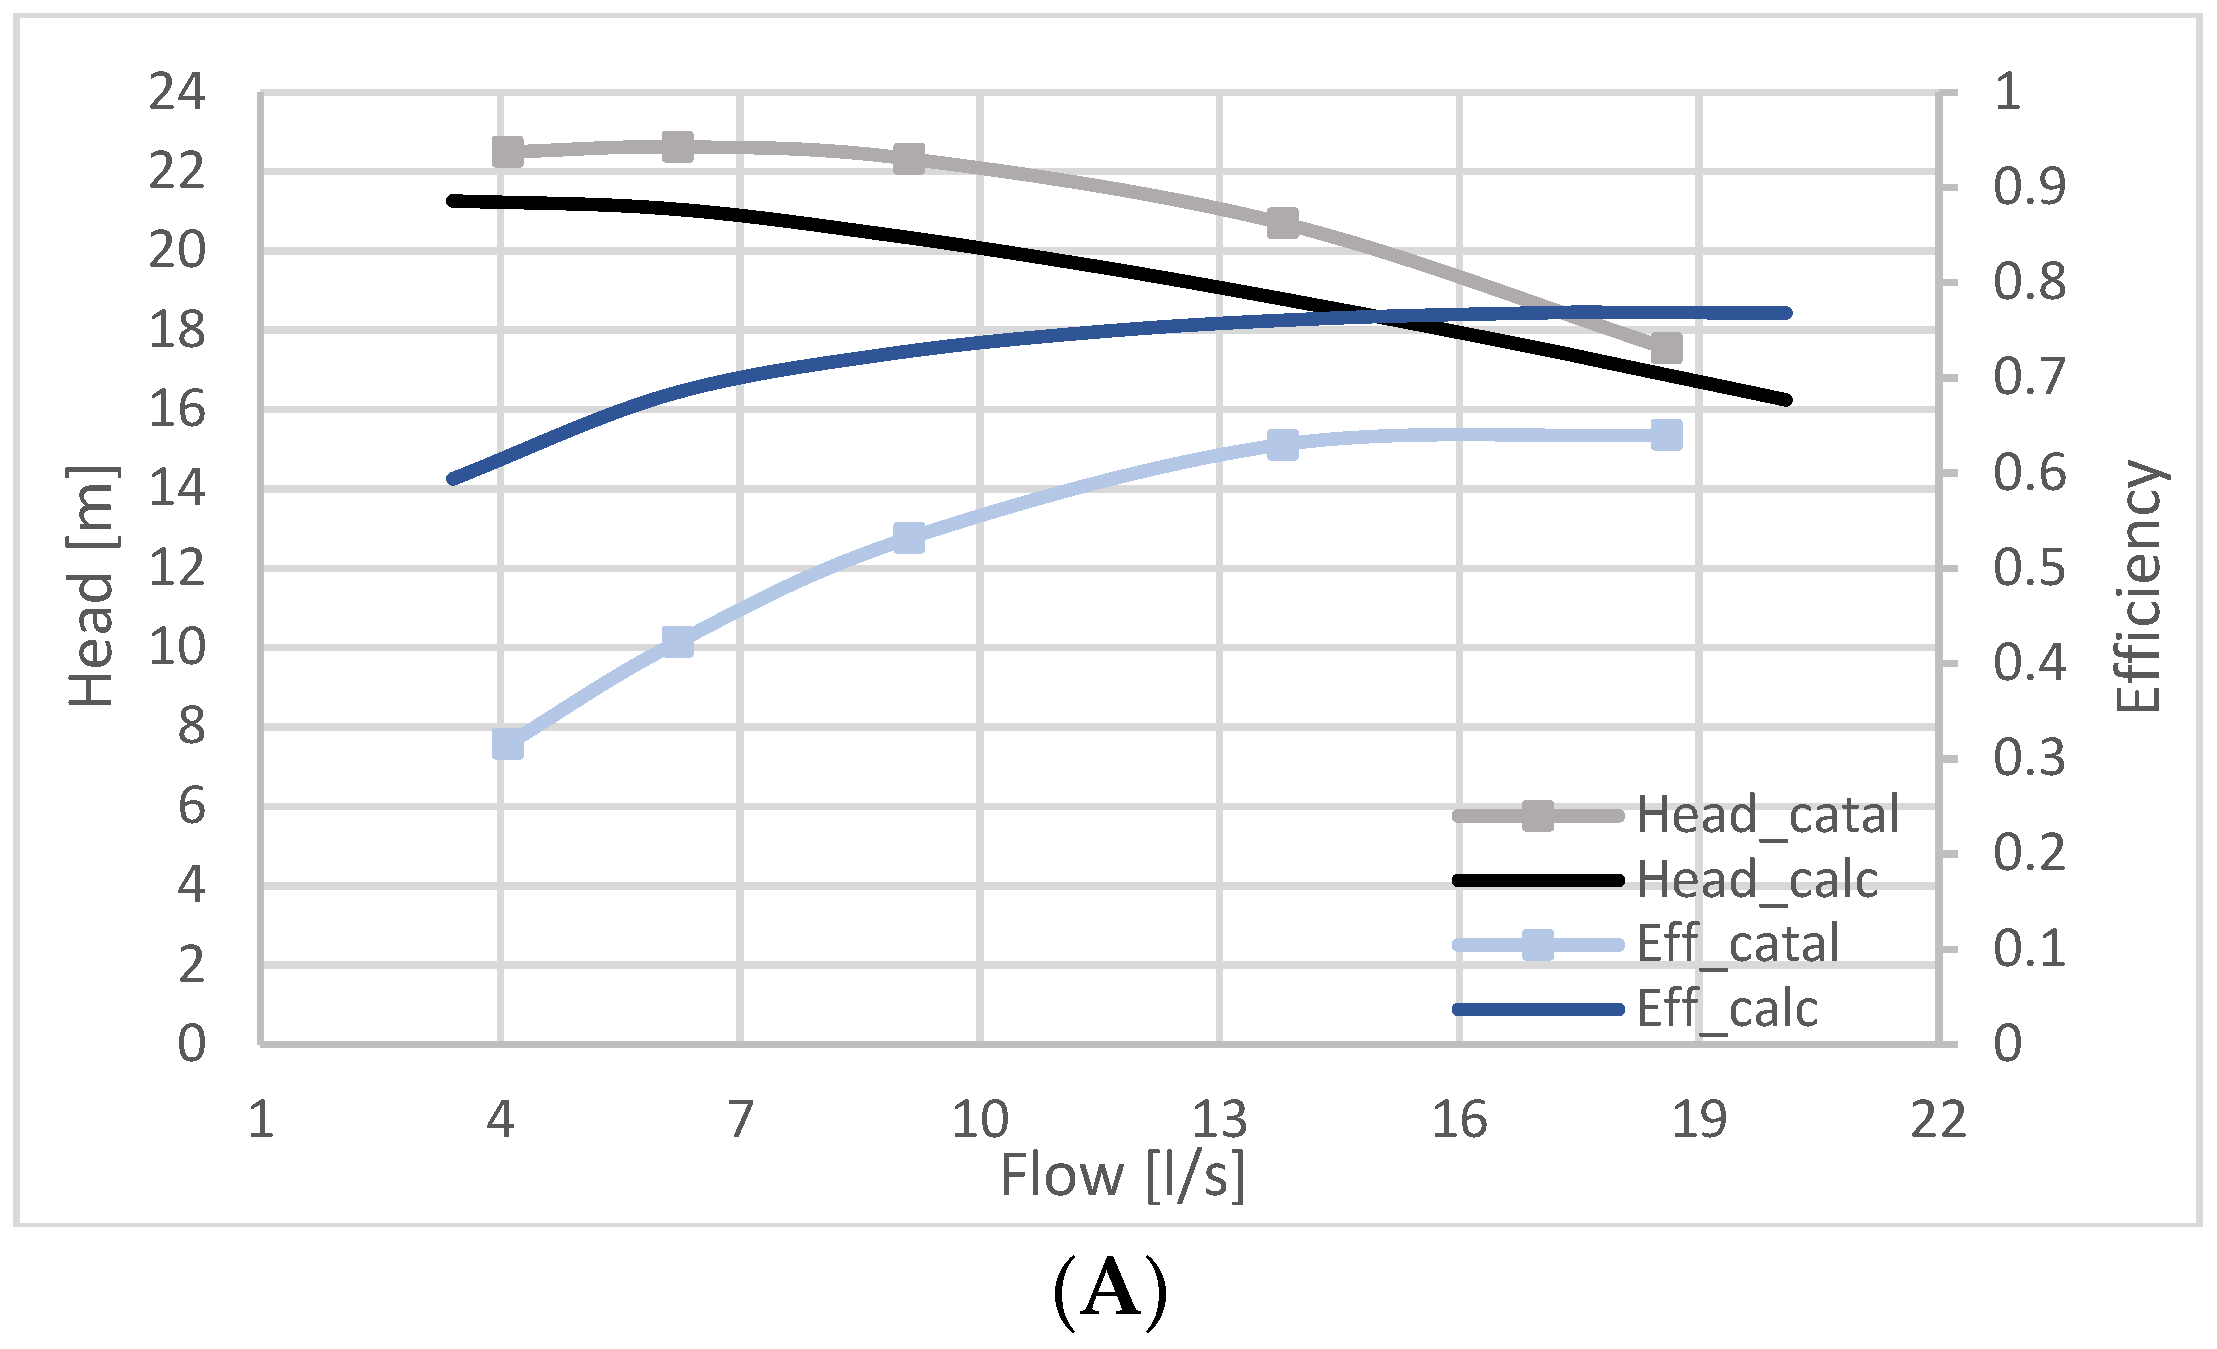
To better illustrate what has just been described, an example carried out on the Caprari pump P65-250 is reported. This pump was supplied by the DIMEG Department of the University of Calabria, together with the five pumps previously described. The geometric model, first of all, calculates its geometry. Then, using these parameters, the fluid dynamic model derives the head and efficiency curve as a function of the flow rate, in pump operation, which will then be compared with the pump curve provided in the catalog (see Figure 14A).
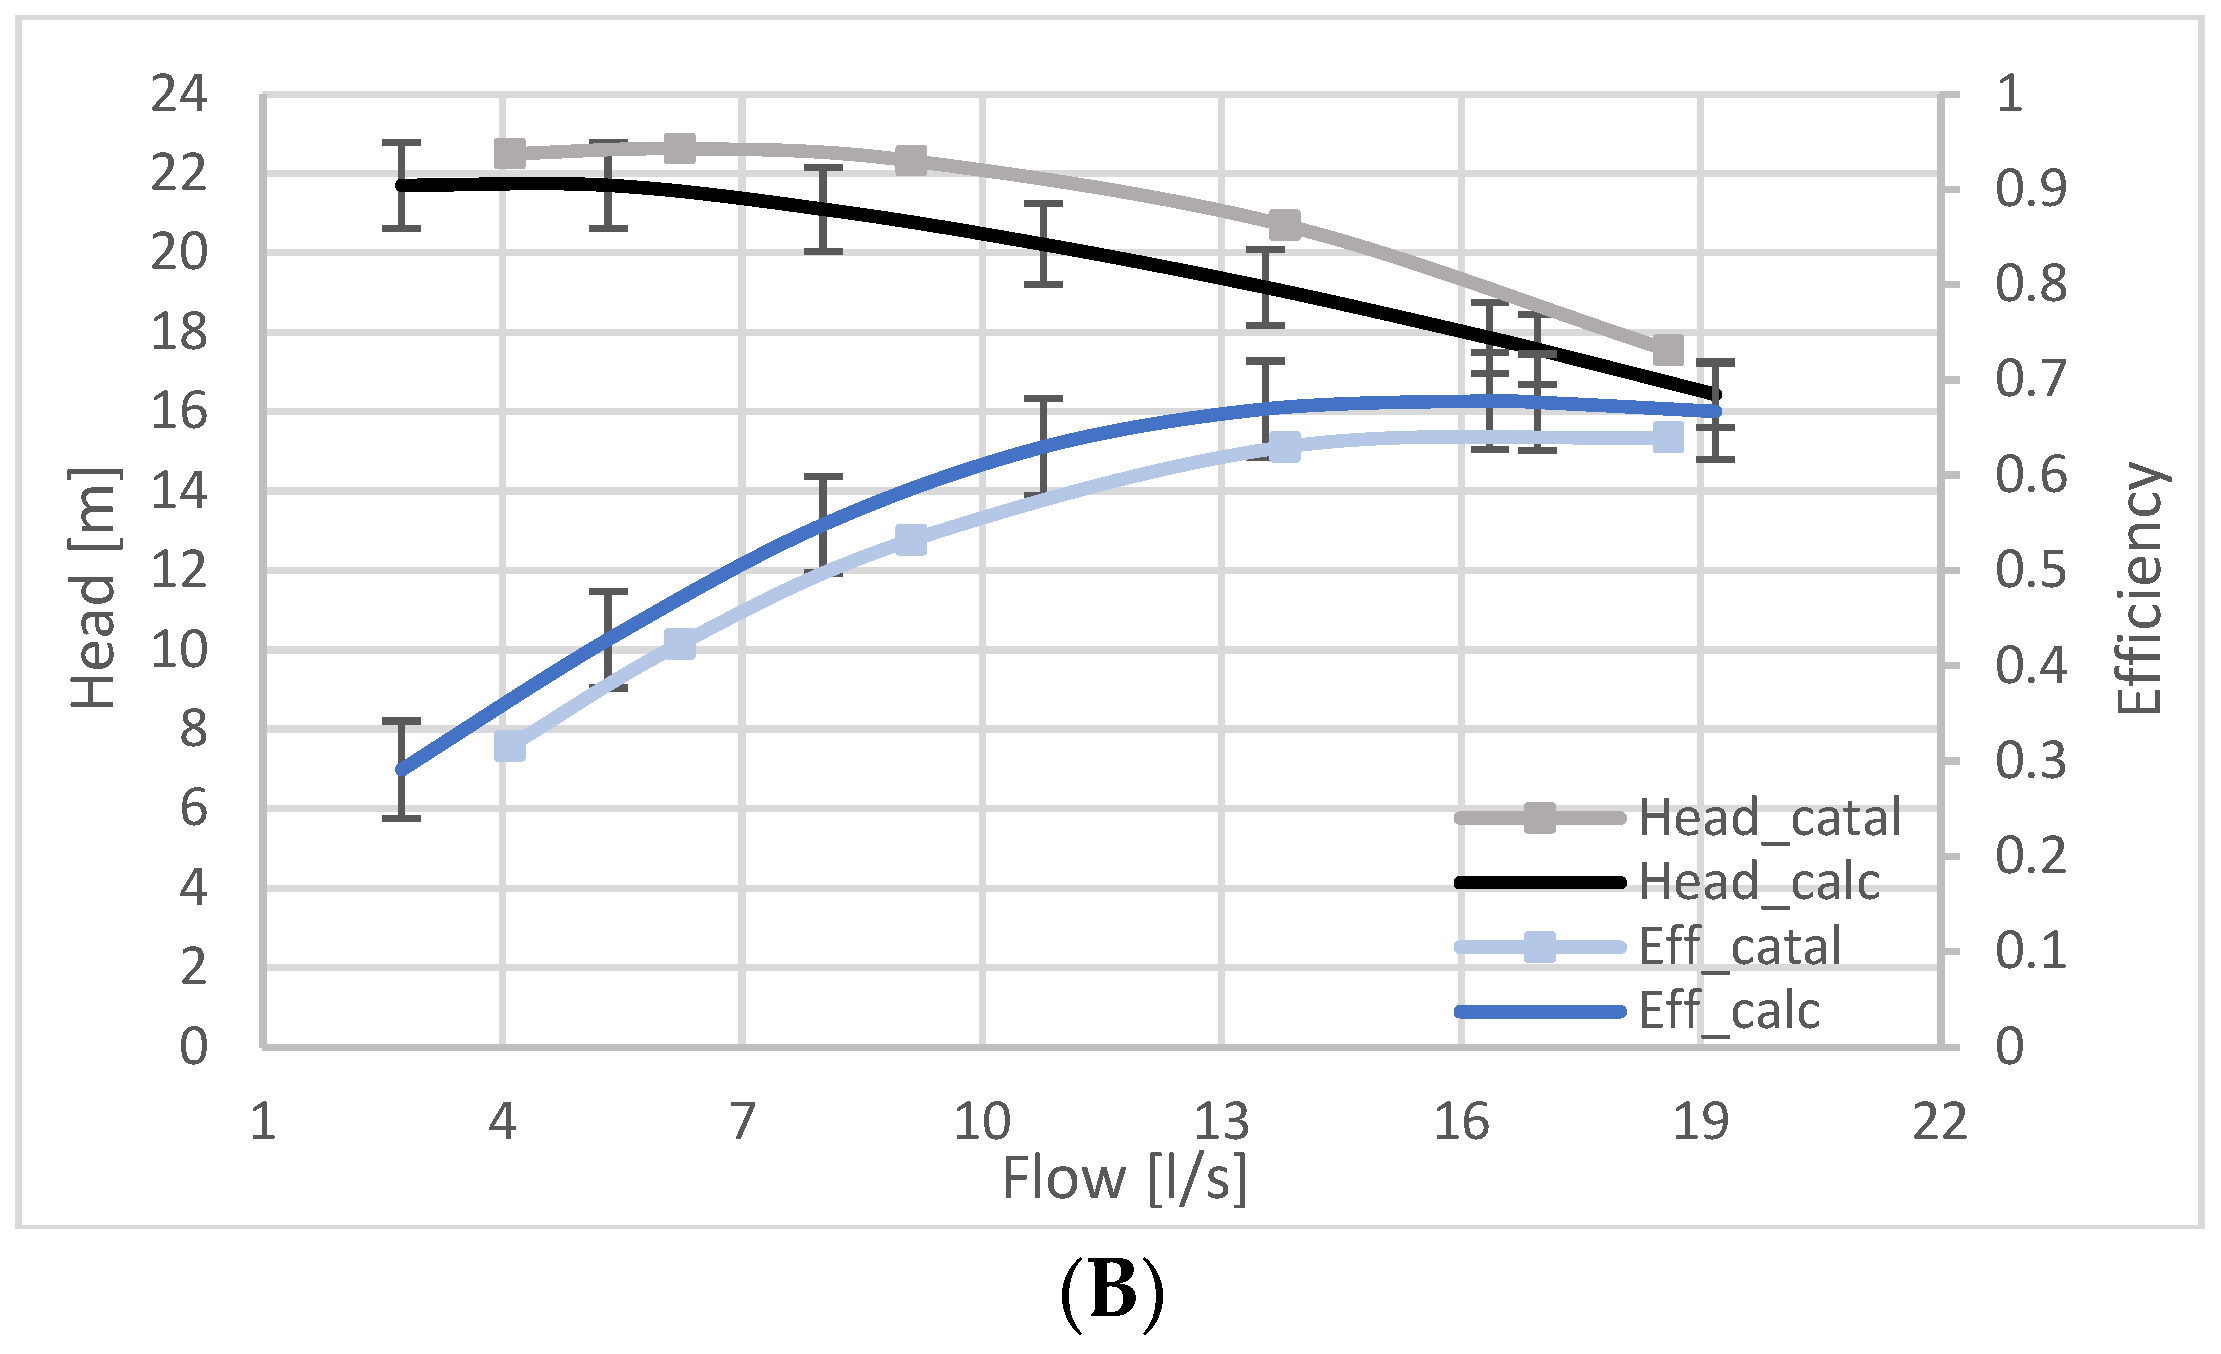
As can be seen from Figure 14A, the real head obtained from the model was too low if compared with the head reported in the catalog, as it is positioned below this curve. The geometric model provided a value of the number of blades equal to 5. However, having the real value of this parameter (z = 6) available, it was possible to replace it. The change of this parameter has modified the losses linked to the slip phenomenon, calculated using the Stodola formula [37,38], which depends on the value of the number of blades. To improve the characteristic curve, it was decided to act on the value of the width of the exit section of the volute (b), reducing it, to then obtain, using the geometric model, the corresponding value of the width of the final diffuser (b5). By decreasing the value of this parameter, the fluid passage section is reduced (A4), causing an increase in speed inside the volute (c4). The b-value initially obtained by the model was 0.048 m, and b5 was equal to 0.064 m. Finally, as can be seen from the total efficiency curve calculated by the model, the efficiency is too high for low flow rates. This is linked to the assumptions imposed a priori and to having initially considered the volumetric efficiency, for any flow rate value, equal to its value at the BEP, set equal to 0.95. However, it was possible to improve the results by acting on the amplitude value of the seal, cl, through which the liquid leaks occur, which is therefore linked to the volumetric losses. By increasing the value of this parameter, the total efficiency curve is considerably lowered. After applying the changes illustrated above, the curves changed as shown in Figure 14B.
At this point, having obtained the conformity of the results for pump operation, it was possible to observe the behavior of the machine in turbine operation. Figure 15A,B shows the curves obtained from the model before and after the modifications to the geometric parameters analyzed. These curves, obtained from the fluid dynamic model relating to turbine operation, are compared, for simplification purposes, with the data obtained experimentally on the PAT. However, this method works even in the absence of experimental data.

6. Conclusions

The work carried out is part of a theoretical–experimental research context on centrifugal pumps used as turbines (PATs). Their convenience lies mainly in the lower costs incurred compared to a turbine with the same power and in the wide range of models available on the market. However, this advantage cannot be grasped if it is not possible to know the actual behavior of the machine when it is used as a turbine once a specific need has been recognized. The objective of this research is the development of a prediction model capable of obtaining the head–flow rate and efficiency–flow rate curves of the PAT, both in pump and turbine operation. The effort was the development of a series of fluid dynamic models that involve the pressure drops in the various components of the machine, as well as the slip phenomena at the inlet and outlet of the impeller. Furthermore, a geometric model was created for the reconstruction of the geometry of the machine, based on good design techniques, statistical data, and maps of good functioning, available in the literature. This analysis was necessary as the geometry is not provided by the manufacturer’s catalog. These models were calibrated based on measurements made on the DIMEG hydraulic test bench on a sample of six machines, tested in both operating modes, whose geometric parameters were measured. The machines measured were six centrifugal pumps, namely five Ksb pumps (P40-335, P80-220, P40-250, P50-160, P100-200) and a Caprari pump (P80-160), which have a specific speed range from 9.05 to 43.48. For these pumps, the head flow rate and flow rate efficiency curves have been obtained in both operating modes. Generally, these curves, if compared with those obtained experimentally in the DIMEG test bench, show a good reliability, because they fall into error bands equal to +/−5%. To the right of the BEP, the efficiency curves are flat, which represents an advantage for those who use this technology, as the machine maintains good performance over a wide range of flow rates. Subsequently, a procedure was set up which envisages the use of the previously mentioned models, useful for calculating the performance curves of the machine both in pump and turbine operation, as well as for the reconstruction of the geometry. In the first phase, based on a few data available from the manufacturer’s catalog, the model reconstructs the prototype geometry of the machine and calculates the performance curves of the machine in pump operation. If these curves match those present in the catalog, the geometry calculated by the geometric model is correct; otherwise, it is necessary to change some geometric parameters so that the predicted curves and those in the catalog coincide. For this purpose, a sensitivity analysis comes to the aid of the user, the purpose of which is to identify the parameters to which the model is most sensitive. The sensitivity analysis showed that the geometric parameters to which the model is most sensitive, in turbine operation, are the diameter of the hub (d1m), the height of the inlet blades (b1), the suction diameter (d0), and the dimensions of the volute (hv, b). Finally, once the appropriate parameters have been changed and the compliance of the performance curves with the catalog data has been obtained, it is possible to obtain the curves in turbine operation, which will certainly be reliable, given the adherence of the curves in pump operation. In conclusion, the article presented a flexible and interactive forecasting tool, with 95% reliability, which allows choosing the most suitable PAT model to exploit the available water resources. A simple model of general application was presented, useful for those who decide to rely on PAT technology.

Author Contributions

Conceptualization, S.B.; Data curation, S.B. and V.P.; Formal analysis, V.P. and M.A.; Investigation, S.B. and V.P.; Methodology, S.B.; Project administration, M.A.; Software, V.P.; Validation, V.P.; Writing–original draft, V.P.; Writing–review & editing, S.B. All authors have read and agreed to the published version of the manuscript.

Funding

This research received no external funding.

Institutional Review Board Statement

Not applicable.

Informed Consent Statement

Not applicable.

Conflicts of Interest

The authors declare no conflict of interest.

Nomenclature

Symbols
Ageneric area
Ab,fback/front leakage passage area
Aθmjinlet area of the jth volute sector
A1, 2passage area at different points of the impeller
A1r, 2rreal passage area at different points of impeller
A3diffusion region passage area
A4volute final section area
A5final diffuser inlet passage area
b1, 2width at different points of impeller
b3vaneless diffuser width
b4final section volute width
b5final section diffuser width
c1, 2, 3, 4absolute fluid velocities at different points of PAT
cm1, m2, m3meridional velocities at different points of PAT
cu1, u2, u3, u4peripheral velocities at different points of PAT
clradial clearance of the seal
dgeneric diameter
doimpeller eye diameter
d1, d2, d3diameter at different points of PAT
deqequivalent hydraulic diameter
dshfshaft diameter
dfdiameter of the front seal
dbdiameter of the rear seal
Eff_measmeasured efficiency
Eff_catalcatalog efficiency
Eff_calccalculated efficiency
h4, 5heights at different points of the final diffuser
hvvolute throat section height
Hhead
Hehead at BEP of the pump
Hmreal head
Head_measmeasured real head
Head_catalcatalog real head
Head_calccalculated real head
Hmohead at the shut-off
Hththeoretical head (Euler’s head)
HBEPhead at BEP of the PAT
Kvvolute velocity coefficient
Lddiffuser length
nrotational speed
nscharacteristic speed
sdclearance between the impeller and the case
Ppower
Pemaximum pump power
Qflow rate
Qeflow rate at BEP of the pump
Qsleakage flow
QBEPflow rate at BEP of the PAT
R4final section volute radius
t1, 2vane thickness
u1, 2peripheral velocities at different points of impeller
wu1, u2peripheral components of relative velocity
wm1, m2meridional components of relative velocity
waverage relative velocity
znumber of blades
Greek letters
α2absolute flow angle in the vaneless diffuser
αdfinal diffuser opening angle
βinclination of relative flow to peripheral direction
β1f, 2frelative flow direction
β1p, 2pblades angles at different points of impeller
ΔScl lateral surface area
ΔSinn increment of inner wall surface
ΔScp increment of peripheral volute surface
zdynamic loss coefficient
ηefficiency
ηcalccalculated efficiency
ηHhydraulic efficiency
ηDdisc efficiency
ηvvolumetric efficiency
ηtottotal efficiency
ηmeasmeasured efficiency
θinclination of blade to radial direction
λfriction coefficient
λjfriction coefficient of a segment of volute
μleakage flow coefficient
υkinematic viscosity
ξ1, 2vanes blockage factor
ξdlocalized drag coefficient
ρdensity of water
τatorsional stress
ϕcapacity coefficient
ωangular velocity

References

  1. Williams, A.A. Pumps as Turbines a User’s Guide; Intermediate Technology Publications: Bradford, UK, 1995. [Google Scholar] [CrossRef]
  2. Barbarelli, S.; Amelio, M.; Florio, G. Experimental activity at test rig validating correlations to select pumps running as turbines in microhydro plants. Energy Convers. Manag. 2017, 149, 781–797. [Google Scholar] [CrossRef]
  3. Thoma, D.; Kittredge, C. Centrifugal pumps operated under abnormal conditions. J. Power Sources 1931, 73, 881–884. [Google Scholar]
  4. Patelis, M.; Kanakoudis, V.; Gonelas, K. Pressure management and energy recovery capabilities using Pats. Procedia Eng. 2016, 162, 503–510. [Google Scholar] [CrossRef]
  5. Lima, G.M.; Luvizotto, E., Jr.; Brentan, B.M. Selection of Pumps as Turbines Substituting Pressure Reducing Valves. Procedia Eng. 2017, 186, 676–683. [Google Scholar] [CrossRef]
  6. Barbarelli, S.; Amelio, M.; Florio, G.; Scornaienchi, N.M. Procedure Selecting Pumps Running as Turbines in Micro Hydro Plants. Procedia Eng. 2017, 126, 549–556. [Google Scholar] [CrossRef]
  7. Barbarelli, S.; Nastasi, B. Tides and Tidal Currents—Guidelines for Site and Energy Resource Assessment. Energies 2021, 14, 6123. [Google Scholar] [CrossRef]
  8. Barbarelli, S.; Florio, G.; Amelio, M.; Scornaienchi, N.M. Preliminary performance assessment of a novel onshore system recovering energy from tidal currents. Appl. Energy 2018, 224, 717–730. [Google Scholar] [CrossRef]
  9. Agarwal, T. Review of pump as turbine (PAT) for micro-hydropower. Int. J. Emerg. Technol. Adv. Eng. 2012, 2, 163–169. [Google Scholar]
  10. Williams, A.A. Pumps as turbines for low-cost micro hydro power. Renew. Energy 1996, 9, 1227–1234. [Google Scholar] [CrossRef]
  11. Barbarelli, S.; Florio, G.; Scornaienchi, N.M. Developing of a Small Power Turbine Recovering Energy from low Enthalpy Steams or Waste Gases: Design, Building and Experimental Measurements. Therm. Sci. Eng. Prog. 2018, 6, 346–354. [Google Scholar] [CrossRef]
  12. Barbarelli, S.; Florio, G.; Zupone, G.L.; Scornaienchi, N.M. First techno-economic evaluation of array configuration of self-balancing tidal kinetic turbines. Renew. Energy 2018, 129, 183–200. [Google Scholar] [CrossRef]
  13. Childs, S.M. Convert pumps to turbines and recover HP. Hydrocarb. Process. Pet. Refin. 1962, 41, 173–174. [Google Scholar]
  14. Sharma, K.R. Small Hydroelectric Project-Use of Centrifugal Pumps as Turbines; Kirloskar Electric Co.: Bangalore, India, 1985. [Google Scholar]
  15. Alatorre-Frenk, C.; Thomas, T.H. The pumps as Turbine’s approach to small hydropower. In Proceedings of the World congress on Renewable energy, Reading, UK, 23–28 September 1990. [Google Scholar]
  16. Stepanoff, A.J. Centrifugal and Axial Flow Pumps; John Wiley: New York, NY, USA, 1957; p. 276. [Google Scholar]
  17. Hancock, J.W. Centrifugal pumps or water turbine. Pipeline News 1963, 6, 25–27. [Google Scholar]
  18. Schmield, E. Serien-Kreiselpumpen im Turbinenbetrieb; Pumpentagung: Karlsruhe, Germany, 1988. [Google Scholar]
  19. Grover, K.M. Conversion of Pump to Turbines; GSA Inter Corp.: Katonah, NY, USA, 1980. [Google Scholar]
  20. Lewinsky-Kesslitz, H.P. Pumpen als Turbinen fur Kleinkraftwerke. Wasserwirtschaft 1987, 77, 531–537. [Google Scholar]
  21. Liu, M.; Tan, L.; Cao, S. Performance Prediction and Geometry Optimization for Application of Pump as Turbine: A Review. Front. Energy Res. 2022, 9, 818118. [Google Scholar] [CrossRef]
  22. Derakhshan, S.; Nourbakhsh, A. Experimental Study of Characteristic Curves of Centrifugal Pumps Working as Turbines in Different Specific Speeds. Exp. Therm. Fluid Sci. 2008, 32, 800–807. [Google Scholar] [CrossRef]
  23. Nautiyal, H.; Kumar, A.; Yadav, S. Experimental Investigation of Centrifugal Pump Working as Turbine for Small Hydropower Systems. Energy Sci. Technol. 2011, 1, 79–86. [Google Scholar]
  24. Singh, P.; Nestmann, F. Internal Hydraulic Analysis of Impeller Rounding in Centrifugal Pumps as Turbines. Exp. Therm. Fluid Sci. 2011, 35, 121–134. [Google Scholar] [CrossRef]
  25. Tan, X.; Engeda, A. Performance of Centrifugal Pumps Running in Reverse as Turbine: Part Ⅱ-Systematic Specific Speed and Specific Diameter Based Performance Prediction. Rev. Energy 2016, 99, 188–197. [Google Scholar] [CrossRef]
  26. Stefanizzi, M.; Torresi, M.; Fortunato, B.; Camporeale, S.M. Experimental Investigation and Performance Prediction Modeling of a Single Stage Centrifugal Pump Operating as Turbine. Energy Procedia 2017, 126, 589–596. [Google Scholar] [CrossRef]
  27. Derakhshan, S.; Kasaeian, N. Optimization, Numerical, and Experimental Study of a Propeller Pump as Turbine. ASME J. Energy Resour. Technol. 2011, 136, 012005. [Google Scholar] [CrossRef]
  28. Venturini, M.; Manservigi, L.; Alvisi, S.; Simani, S. Development of a physics-based model to predict the performance of pumps as turbines. Appl. Energy 2018, 231, 343–354. [Google Scholar] [CrossRef]
  29. Penagos-Vásquez, D.; Graciano-Uribe, J.; Torres, E. Characterization of a Commercial Axial Flow PAT Through a Structured Methodology Step-by-Step. CFD Lett. 2022, 14, 1–19. [Google Scholar] [CrossRef]
  30. Vásquez, D.P.; Uribe, J.G.; García, S.V.; del Rio, J.S. Characteristic Curve Prediction of a Commercial Centrifugal Pump Operating as a Turbine Through Numerical Simulations. J. Adv. Res. Fluid Mech. Therm. Sci. 2021, 83, 153–169. [Google Scholar] [CrossRef]
  31. Graciano-Uribe, J.; Sierra, J.; Torres-López, E. Instabilities and Influence of Geometric Parameters on the Efficiency of a Pump Operated as a Turbine for Micro Hydro Power Generation: A Review. J. Sustain. Dev. Energy Water Environ. Syst. 2021, 9, 1–23. [Google Scholar] [CrossRef]
  32. Omidi, M.; Liu, S.J.; Mohtaram, S.; Lu, H.T.; Zhang, H.C. Improving Centrifugal Compressor Performance by Optimizing the Design of Impellers Using Genetic Algorithm and Computational Fluid Dynamics Methods. Sustainability 2019, 11, 5409. [Google Scholar] [CrossRef] [Green Version]
  33. Morabito, A.; Vagnoni, E.; Di Matteo, M.; Hendrick, P. Numerical investigation on the volute cutwater for pumps running in turbine mode. Renew. Energy 2021, 175, 807–824. [Google Scholar] [CrossRef]
  34. Nejadali, J. Analysis and evaluation of the performance and utilization of regenerative flow pump as turbine (PAT) in Pico-hydropower plants. Energy Sustain. Dev. 2021, 64, 103–117. [Google Scholar] [CrossRef]
  35. Barbarelli, S.; Amelio, M.; Florio, G. Predictive model estimating the performances of centrifugal pumps used as turbines. Energy 2016, 107, 103–121. [Google Scholar] [CrossRef]
  36. Neumann, B. The Interaction between Geometry and Performance of a Centrifugal Pump; Mechanical Engineering Publications: London, UK, 1991. [Google Scholar]
  37. Lobnanoff, V.S. Centrifugal Pumps–Design and Applications, 2nd ed.; Gulf Publishing Company: Houston, TX, USA, 1992. [Google Scholar]
  38. Stodola, A. Steam and Gas Turbines; McGraw-Hill: New York, NY, USA, 1945. [Google Scholar]
  39. Japikse, D.; Marscher, W.D.; Furst, R.B. Centrifugal Pump Design and Performance; Concepts ETI: Wilder, VT, USA, 1997. [Google Scholar]
  40. Micheli, D.; Pinamonti, P. La valutazione del fattore di scorrimento nel dimensionamento di ventilatori centrifughi a pale rovesce. In 42° Congresso Nazionale ATI; CLEUP Editore: Padova PD, Italy, 1987; Volume 2, p. III-13. [Google Scholar]
  41. De Bellis, V. Simulazione Monodimensionale Stazionaria e non Stazionaria di Turbocompressori per la Sovralimentazione di MCI. Napoli, 30 November 2011. Available online: http://www.fedoa.unina.it/id/eprint/8894 (accessed on 22 September 2021).
  42. Qiu, X.; Mallikarachchi, C.; Anderson, M. A new slip factor model for axial and radial impellers. In Turbo Expo: Power for Land, Sea, and Air; ASME: Montreal, Canada, 2007; Volume 47950, pp. 957–966. [Google Scholar]
  43. Eckardt, D. Flow Field Analysis of Radial and Backswept Centrifugal Compressor Impellers, Part 1: Flow Measurement using a Laser Velocimeter. In Proceedings of the Twenty-fifth Annual International Gas Turbine Conference and Exhibit and Twenty-second Annual Fluids Engineering Conference, New Orleans, LA, USA, 9–13 March 1980; (A80-36101 14-34). American Society of Mechanical Engineers: New York, NY, USA, 1979; pp. 77–86. [Google Scholar]
  44. Balje, O. Turbomachines; John Wiley & Sons: New York, NY, USA, 1981. [Google Scholar]
  45. Cristian, F. Sviluppo di una Metodologia di Progettazione Integrata per il Dimensionamento di Macchine Operatrici a Flusso Centrifugo; Università degli studi di Ferrara: Ferrara, Italy, 2012. [Google Scholar]
  46. Worster, R.C. The Effects of Skin Friction and Roughness on the Losses in Centrifugal Pump Volutes. BHRA Fluid Engineering Centre, Publication No. RR-557; Cranfield: Bedford, UK, 1957. [Google Scholar]
  47. Perdite di Carico Nelle Condotte. Available online: https://www.edutecnica.it/macchine/carico/carico.htm (accessed on 15 December 2021).
  48. Van den Braembussche, R.A. Flow in Radial Turbomachines; Lecture Series 1996−01; Von Karman Institute for Fluid Dynamics: Rhode Saint Genèse, Belgium, 1996. [Google Scholar]
  49. Rohlik, H.E. Radial Inflow Turbines. NASA SP 1975, 290, 279–306. [Google Scholar]
  50. Whitfield, A.; Baines, N.C. Design of Radial Turbomachines; Longman Scientific & Technical, Ltd.: Harlow, UK, 1990. [Google Scholar]
  51. Worster, R.C. The flow in volutes and its effect on centrifugal pump performance. Proc. ImechE 1957, 177–843. [Google Scholar] [CrossRef]
  52. Amelio, M.; Barbarelli, S.; Schinello, D. Review of Methods Used for Selecting Pumps as Turbines (PATs) and Predicting their Characteristic Curves. Energies 2020, 13, 6341. [Google Scholar] [CrossRef]
  53. Fanizzi, L. Scienza & Inquinamento: Le Perdite di Carico nei Circuiti Idraulici. ECOACQUE. 2014. Available online: http://www.ecoacque.it/phocadownload/le%20perdite%20di%20carico%20nei%20circuiti%20idraulici.pdf (accessed on 15 December 2021).
  54. Idel’cick, E. Memento des Pertes de Charge; Eyrolles Edition: Paris, France, 1986. [Google Scholar]
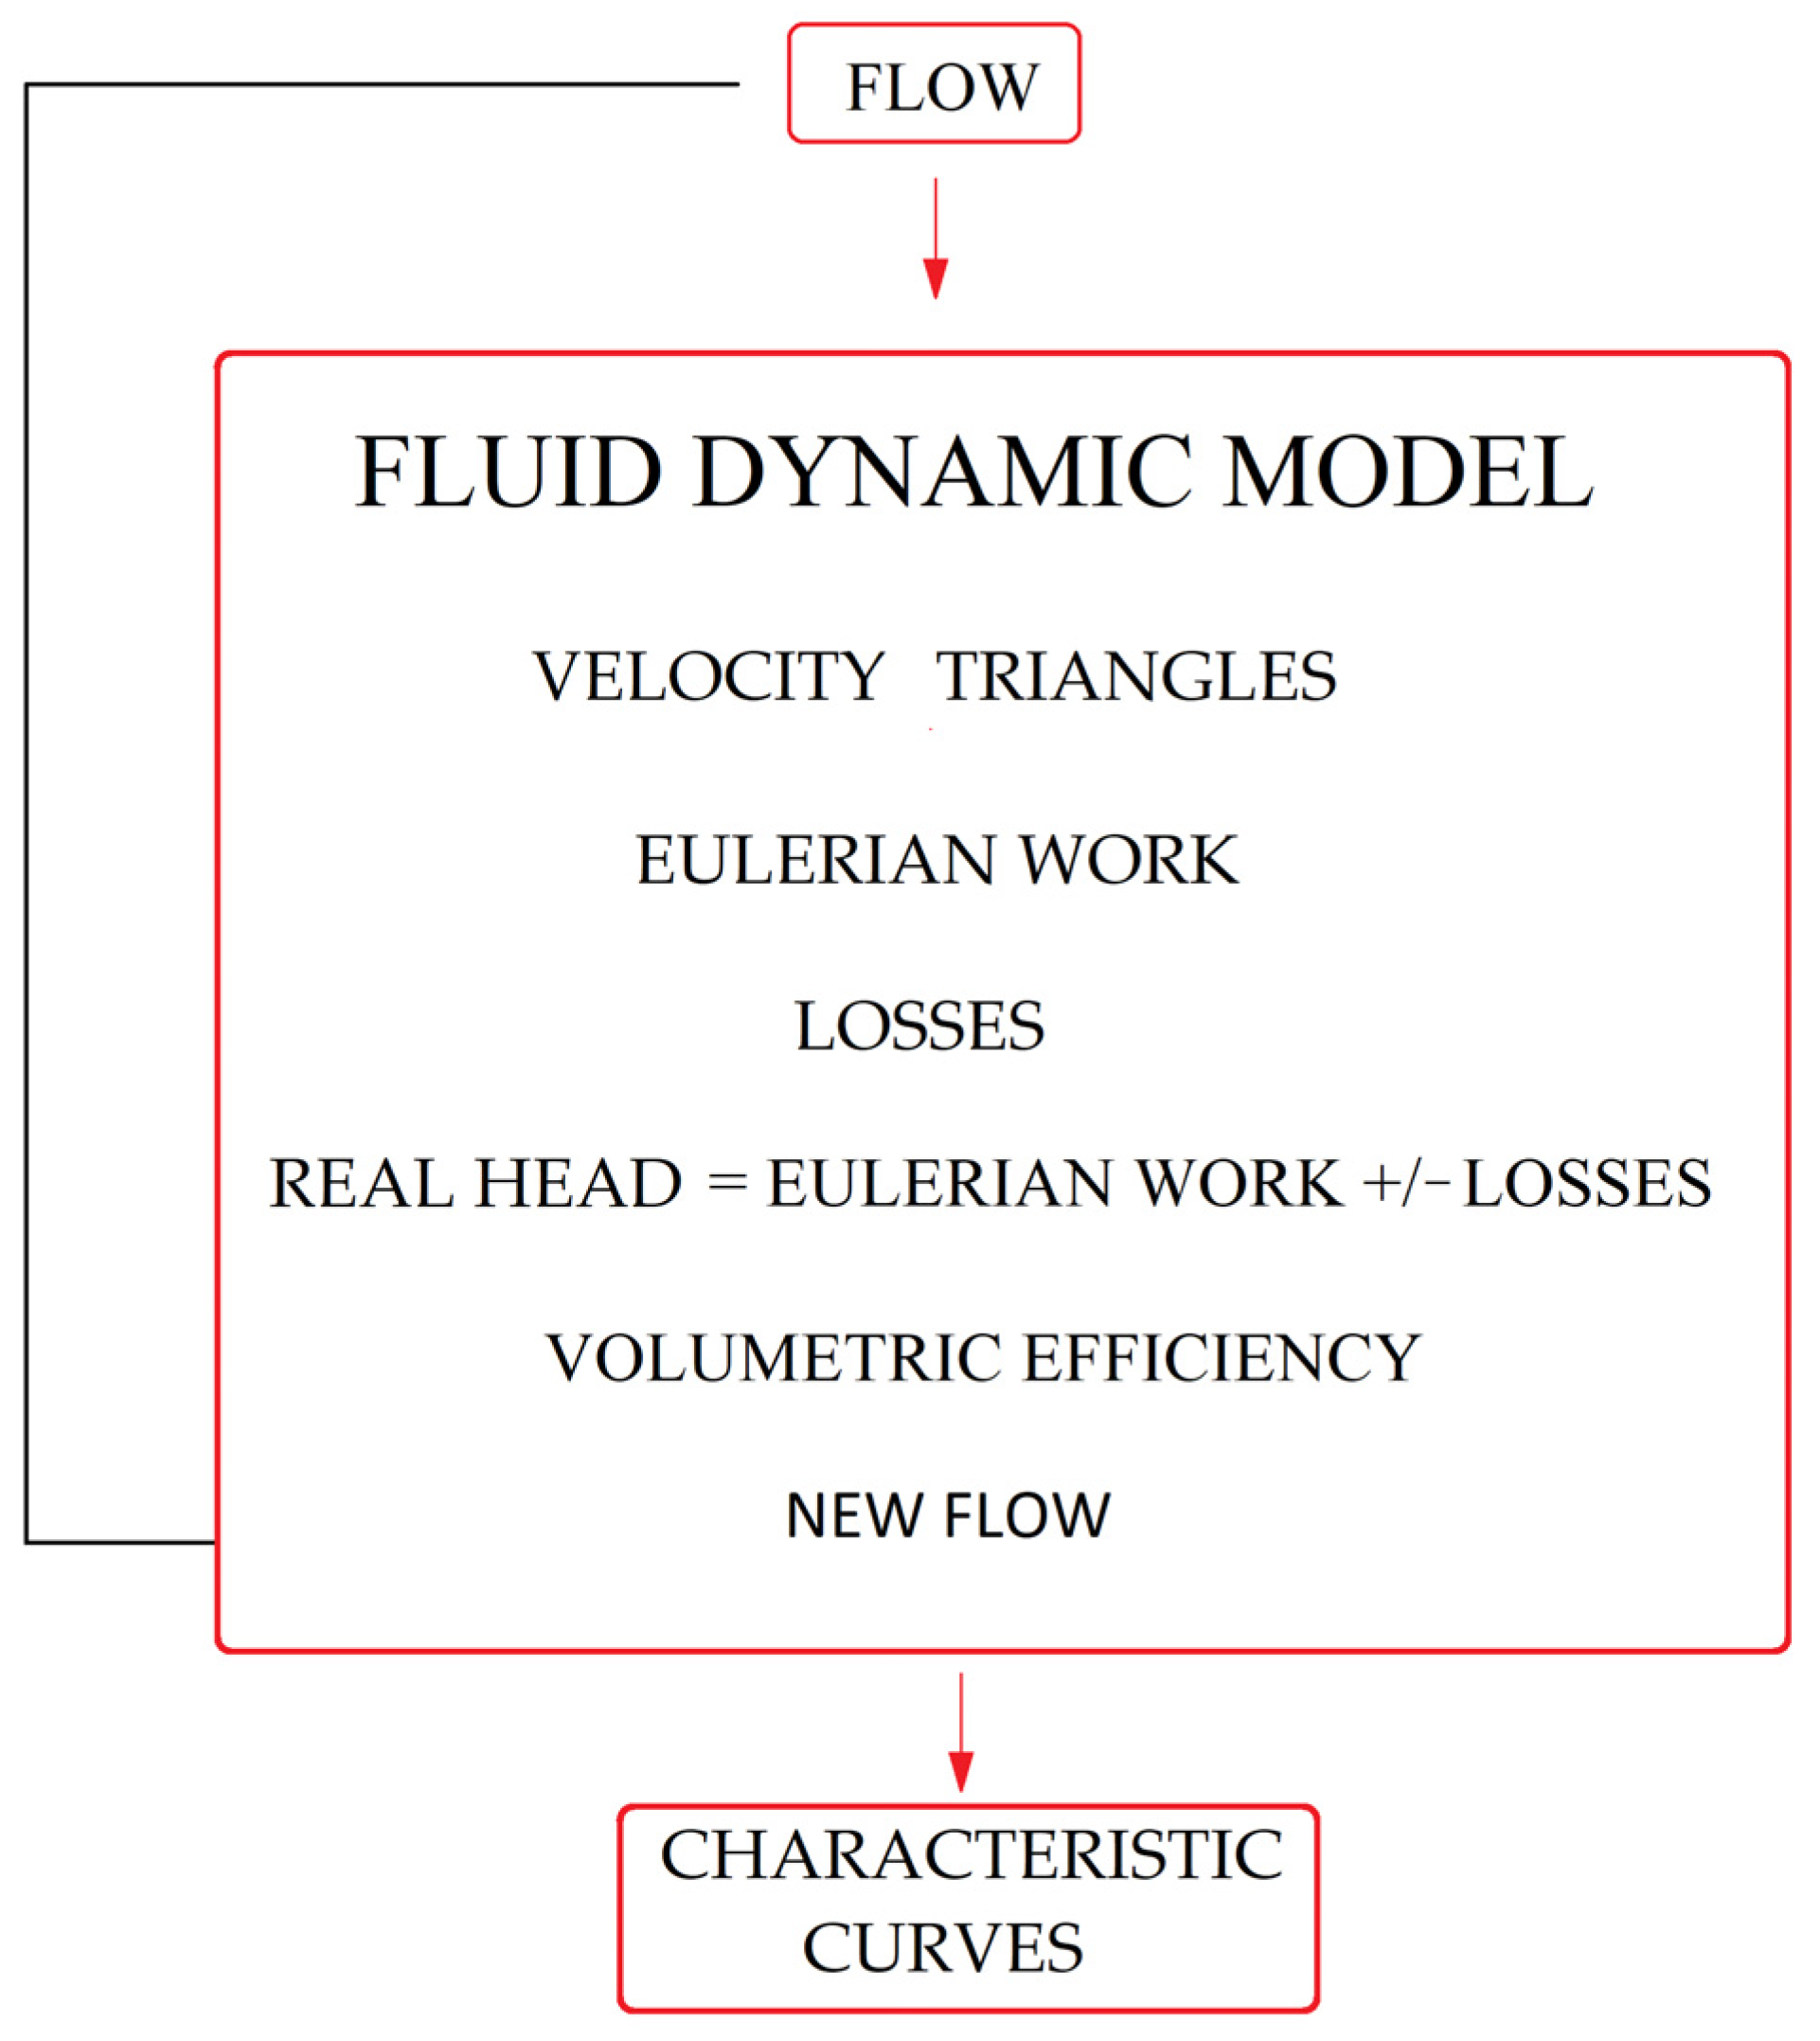
Figure 1. Flow chart summarizing the main steps of the development.
Energies 15 02669 g001
Figure 2. Reference geometry.
Energies 15 02669 g002
Figure 3. Velocity triangles at the inlet and outlet of the impeller in pump operation under design conditions (BEP) with slip deviation.
Energies 15 02669 g003
Figure 4. Impeller input–output speed triangles in turbine operation with slip deviation.
Energies 15 02669 g004
Figure 5. Statistical distribution of the ratio d1m/dshf.
Energies 15 02669 g005
Figure 6. Statistical diagram for the determination of z and β2p.
Energies 15 02669 g006
Figure 7. (left) Head and efficiency for the PAT 40-335 (ns = 9.05) in pump operation. (right) Head and efficiency for the PAT 40-335 (nst = 5.52) in turbine operation.
Energies 15 02669 g007
Figure 8. (left) Head and efficiency for the PAT 80-220 (ns = 32.69) in pump operation. (right) Head and efficiency for the PAT 80-220 (nst = 26.91) in turbine operation.
Energies 15 02669 g008
Figure 9. (left) Head and efficiency for the PAT 40-250 (ns = 12.78) in pump operation. (right) Head and efficiency for the PAT 40-250 (nst = 8.81) in turbine operation.
Energies 15 02669 g009
Figure 10. (left) Head and efficiency for the PAT 50-160 (ns = 31.01) in pump operation. (right) Head and efficiency for the PAT 50-160 (nst = 26.03) in turbine operation.
Energies 15 02669 g010
Figure 11. (left) Head and efficiency for the PAT 80-160 (ns = 40.24) in pump operation. (right) Head and efficiency for the PAT 80-160 (nst = 32.94) in turbine operation.
Energies 15 02669 g011
Figure 12. (left) Head and efficiency for the PAT 100-200 (nst = 43.48) in pump operation. (right) Head and efficiency for the PAT 100-200 (nst = 35.91) in turbine operation.
Energies 15 02669 g012
Figure 13. Global procedure for determining the performance curves.
Energies 15 02669 g013
Figure 14. (A) Head and efficiency for the PAT 65-250 (ns = 22.75) in pump operation. (B) Head and efficiency for the PAT 65-250 (ns = 22.75) in pump operation with z = 6, b = 0.038 m, b5 = 0.054 m, and cl = 3.5 × 10⁻⁴ m.
Energies 15 02669 g014aEnergies 15 02669 g014b
Figure 15. (left) Head and efficiency for the PAT 65-250 (nst = 15.83) in turbine operation. (right) Head and efficiency for the PAT 65-250 with z = 6 in b = 0.038, b5 = 0.054 m, and cl = 3.5 × 10⁻⁴ m.
Energies 15 02669 g015
Table 1. Friction losses in pump operation.
Impeller
h f g = λ w 2 2 g ( l d e q )
Vaneless diffuser
h f c = λ 2 g 1 D h 3 c 3 2 s e n ( α 2 ) d 3 d 2 ( d 3 d 2 2 )
Volute
h f v = j = 1 18 λ j c _ 4 2 2 g ( Δ S c l + Δ S i n n + Δ S c p ) j A θ m j Q j Q
Final diffuser
h f d = λ 8 s e n ( α d ) [ 1 ( A 4 A 5 ) 2 ] c _ 4 2 2 g
Table 2. Dynamic losses in pump operation.
Inlet
h i n l e t = 0.25 ( Q π d 0 2 4 ) 2 1 2 g
ImpellerShock losses
h s h o c k = [ w 1 s e n ( i ) ] 2 2 g
Wake losses
h d g = ( ξ 2 1 ) 2 c m 2 2 2 g
Vaneless diffuserInstantaneous expansion losses
h d c = c m 2 2 2 g ( 1 A 2 r A 3 ) 2
VoluteMixing losses
h d v = c m 3 2 2 g
Final diffuserDiffusion losses 1
h d d = ξ d c 4 2 2 g
1 ξ d represents the localized resistance coefficient, and its value was obtained as a function of the ratio c, reported in Table 3, and taken from [47].
Table 3. Localized resistance coefficient as a function of the parameter c.
0.025 c 0.075 ξ d = 0.14
0.075 < c 0.15 ξ d = 0.20
0.15 < c 0.25 ξ d = 0.47
0.25 < c 0.35 ξ d = 0.76
0.35 < c 0.45 ξ d = 0.95
0.45 < c 0.75 ξ d = 1.05
0.75 < c 0.90 ξ d = 1.10
Table 4. Dynamic losses in turbine operation.
DiffuserInlet losses
h d d = ξ d c 4 2 2 g
ImpellerInlet losses
h i n l e t = 0.5 ( 1 d 2 b 2 d 3 b 3 )   c m 3 2 2 g
Shock losses 1
h s h o c k = [ w 2 s e n ( i ) ] 2 2 g
Instantaneous expansion losses
h d g = ( ξ 1 1 ) 2 c m 1 2 2 g
VoluteDiffusion losses
h d i f f = c u 3 2 c u 3 b e p 2 2 g
Outlet 2
h i n l e t = 0.25 ( Q π d 0 2 4 ) 2 1 2 g + c u 1 2 2 g
1 The shock losses are computed considering the incidence angle i of the fluid at the runner entry. 2 The additional term cu12/2g has been added to exhaust losses to consider the dissipative vortex generated by the presence of the tangential component cu1.
Table 5. Localized resistance coefficient as a function of the ratio b5/b.
1.25 b 5 b 1.75 ξ d = 0.12
1.75 < b 5 b 3 ξ d = 0.30
3 < b 5 b 5 ξ d = 0.40
Table 6. Geometric parameters measured and calculated by the model.
Pumps
40-33540-25080-22050-16080-160100-200
MeasCalcMeasCalcMeasCalcMeasCalcMeasCalcMeasCalc
d0 (mm)72.582.46565.611595.677.173.412087.5143114
d1m (mm)49.940.237.7435.95045.43429.642355051
d1 (mm)60.961.351.3750.85770.55051.58161.26282.4
df (mm)84.75107.384.7585.5134.75124.589.7595.6135114159.75148.4
d3 (mm)338251.2282273230234.3185186.2185187.3224234.3
db (mm)139.7108.299.7686.2150125.59096.4135114.9150149.6
b1 (mm)7.227.58.8911.55032.73228.66234.36141.1
b2 (mm)1016.187.32521.21616.52521.132.528.7
b3 (mm)1628.2814.742.537.22628.835376150.3
b (mm)262424274966674287475593.6
β1p (°)20.4943.8338.5851.917.5342.7526.3641.3823.7432038.97
β2p (°)2423202328.2627262623.7262627
t1 (mm)444424444444
t2 (mm)444424445444
b5 (mm)4064.28952.680895089.9846389114.5
cl (mm)0.1250.1250.250.1250.150.1250.250.1250.250.1250.550.25
sd (mm)791799921999159
Ld (mm)97131.598959017010293137136.591170
Table 7. Sensitivity to geometric parameters.
QPHPQTHT
d1m * *** *** ***
b1 * * ** ****
d0 ** *** **** ****
hv, b **** *** *** ****
b2 ** *** * *
b2 ** **** ** **
Table 8. Sensitivity analysis for pump 40-335.
hv, b
(m)
Δ%
Variation
hv, b
(m)
Qp
meas
Qp
calc
E%Hp
meas
Hp
calc
E%QT
meas
QT
calc
E%HT
meas
HT
calc
E%
0.024−5.0%0.0232625.13.6%3529.9014.7%49.345.97.0%99.5109.0−9.5%
0.024−2.5%0.0232626.00.0%3530.3013.5%49.347.34.0%99.5105.1−5.6%
0.0240.0%0.0242626.00.0%3531.1011.1%49.348.81.1%99.5101.5−2.0%
0.0242.5%0.0252627.2−4.6%3531.2010.9%49.350.2−1.8%99.598.21.4%
0.0245.0%0.0252628.3−9.0%3531.3010.6%49.351.7−4.8%99.595.04.5%
Table 9. Sensitivity analysis for pump 40-250.
hv, b
(m)
Δ%
Variation
hv, b
(m)
Qp
meas
Qp
calc
E%Hp
meas
Hp
calc
E%QT
meas
QT
calc
E%HT
meas
HT
calc
E%
0.027−5.0%0.0262525.00.0%2019.903.8%38.337.61.8%43.749.0−12.2%
0.027−2.5%0.0262525.00.0%2019.701.7%38.338.7−1.0%43.747.3−8.4%
0.0270.0%0.0272525.00.0%2020.000.0%38.339.8−3.7%43.745.9−5.0%
0.0272.5%0.0282525.4−1.6%2020.20−0.8%38.341.2−7.4%43.744.9−2.9%
0.0275.0%0.0282526.4−5.7%2020.10−0.4%38.342.3−10.2%43.743.60.1%
Table 10. Sensitivity analysis for pump 80-220.
hv, b
(m)
Δ%
Variation
hv, b
(m)
Qp
meas
Qp
calc
E%Hp
meas
Hp
calc
E%QT
meas
QT
calc
E%HT
meas
HT
calc
E%
0.066−5.0%0.063100100.00.0%14.414.280.8%123117.684.3%20.020.7−3.3%
0.066−2.5%0.064100100.00.0%14.414.350.3%123120.661.9%20.020.2−1.1%
0.0660.0%0.066100100.00.0%14.414.41−0.1%123122.640.3%20.019.61.9%
0.0662.5%0.068100100.00.0%14.414.46−0.4%123124.63−1.3%20.019.14.6%
0.0665.0%0.069100100.00.0%14.414.51−0.8%123126.61−2.9%20.018.67.2%
Publisher’s Note: MDPI stays neutral with regard to jurisdictional claims in published maps and institutional affiliations.