
Structural Behavior of Massive Reinforced Concrete Structures Exposed to Thermomechanical Loads


Abstract
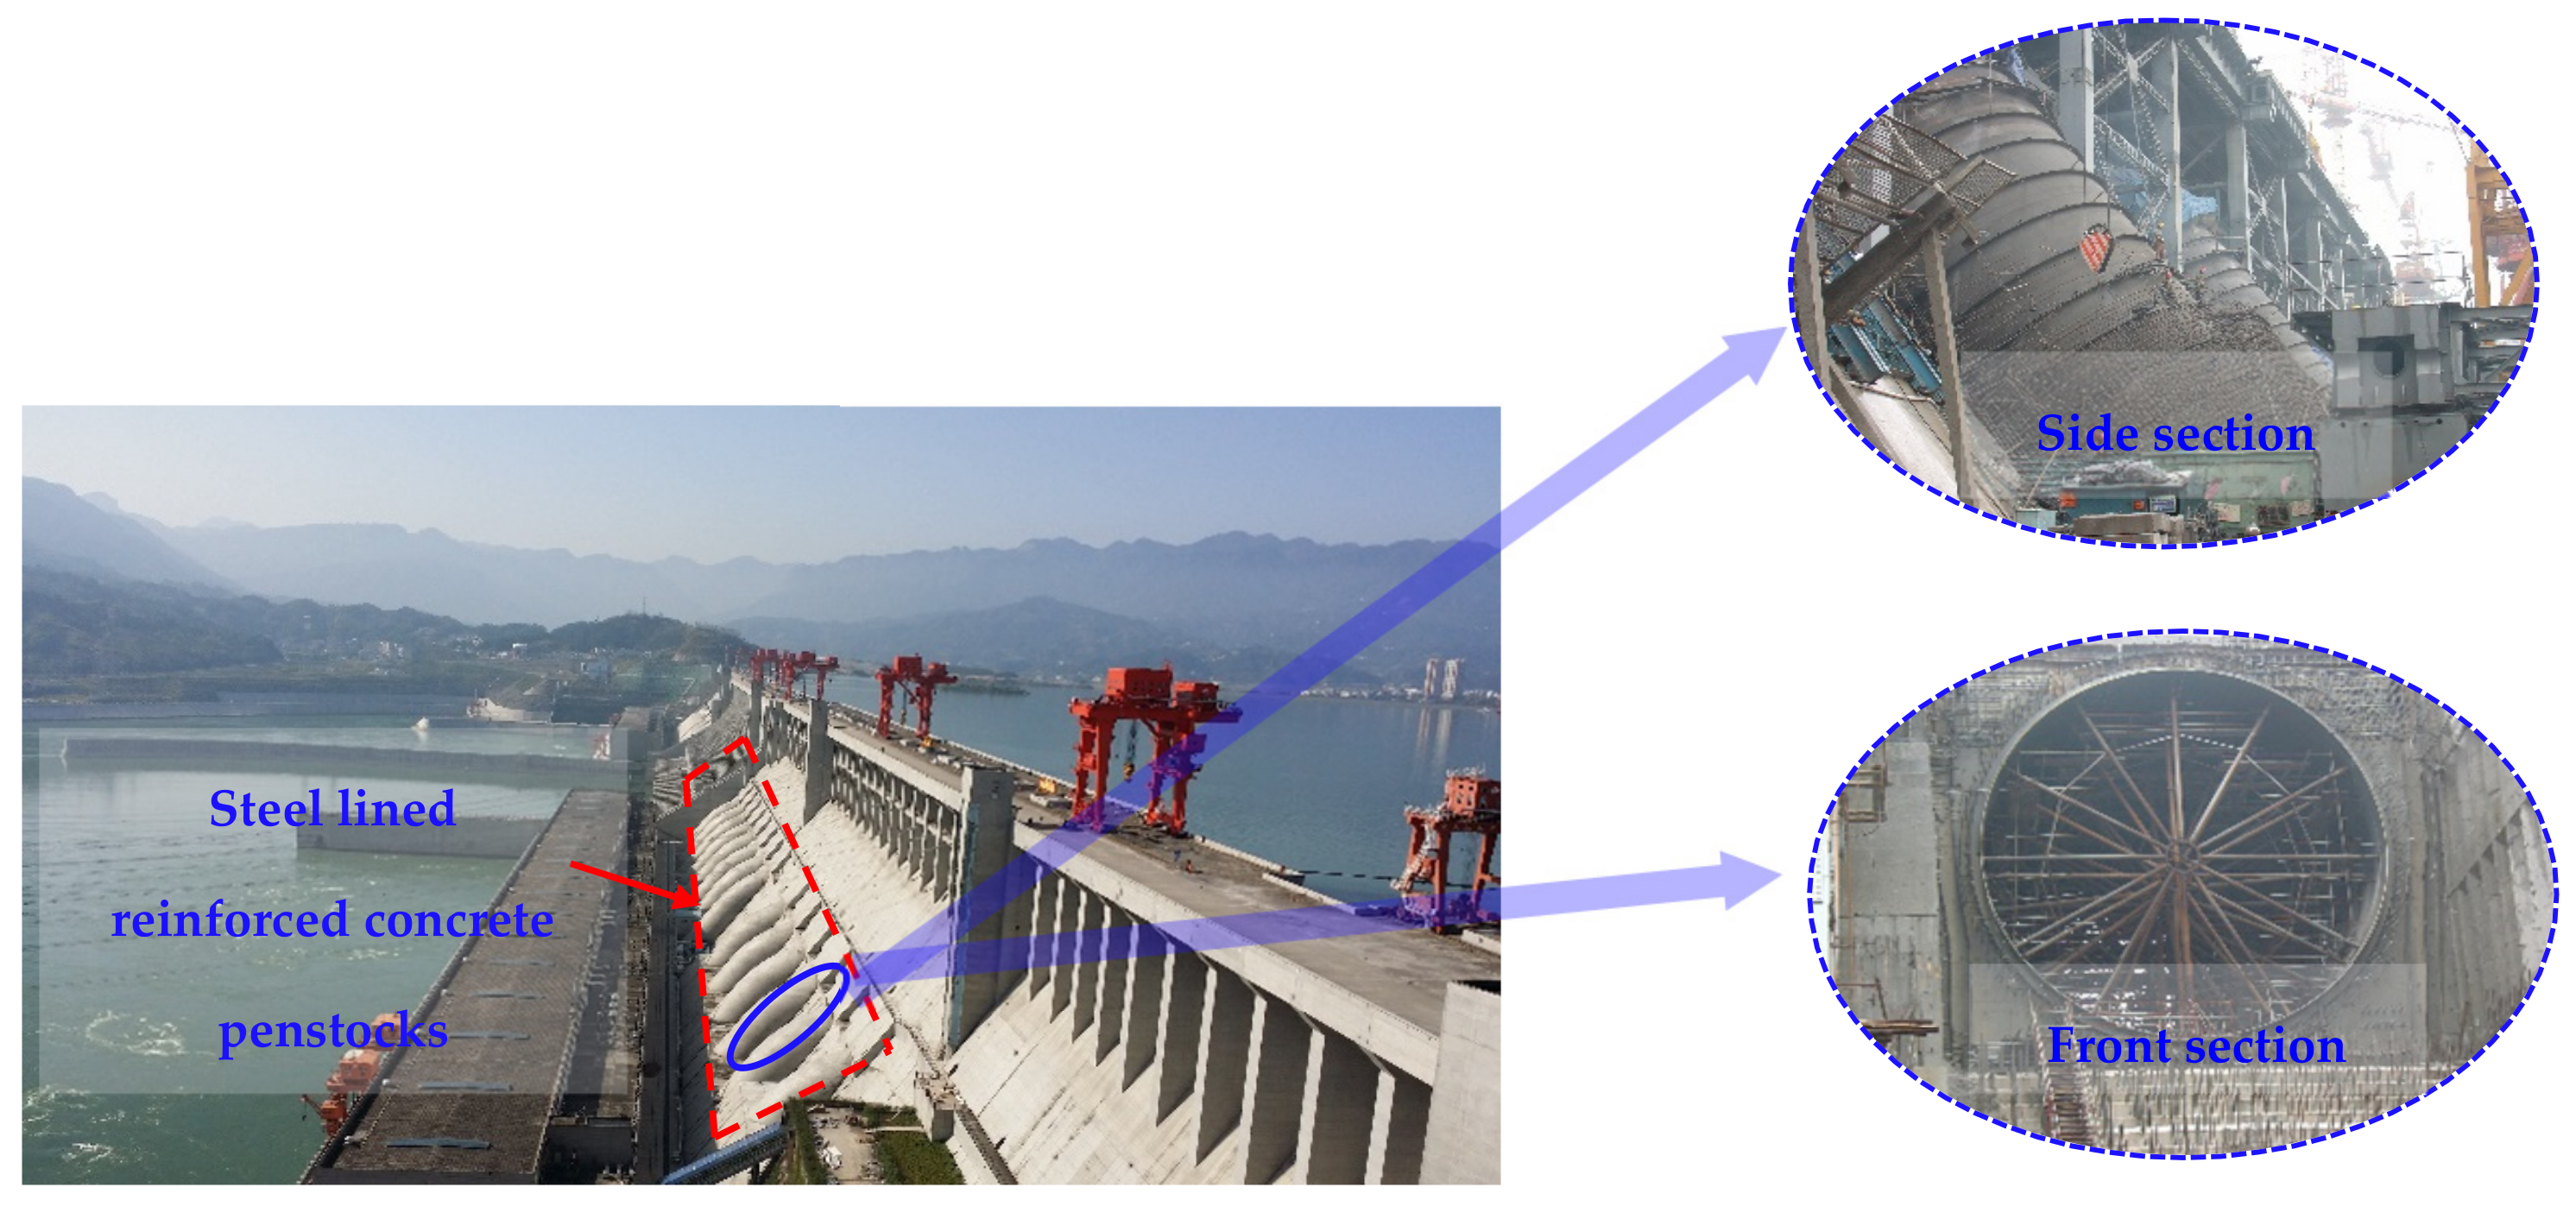
:1. Introduction
2. Model Experiment Using a 1:2 Large-Scale Prototype
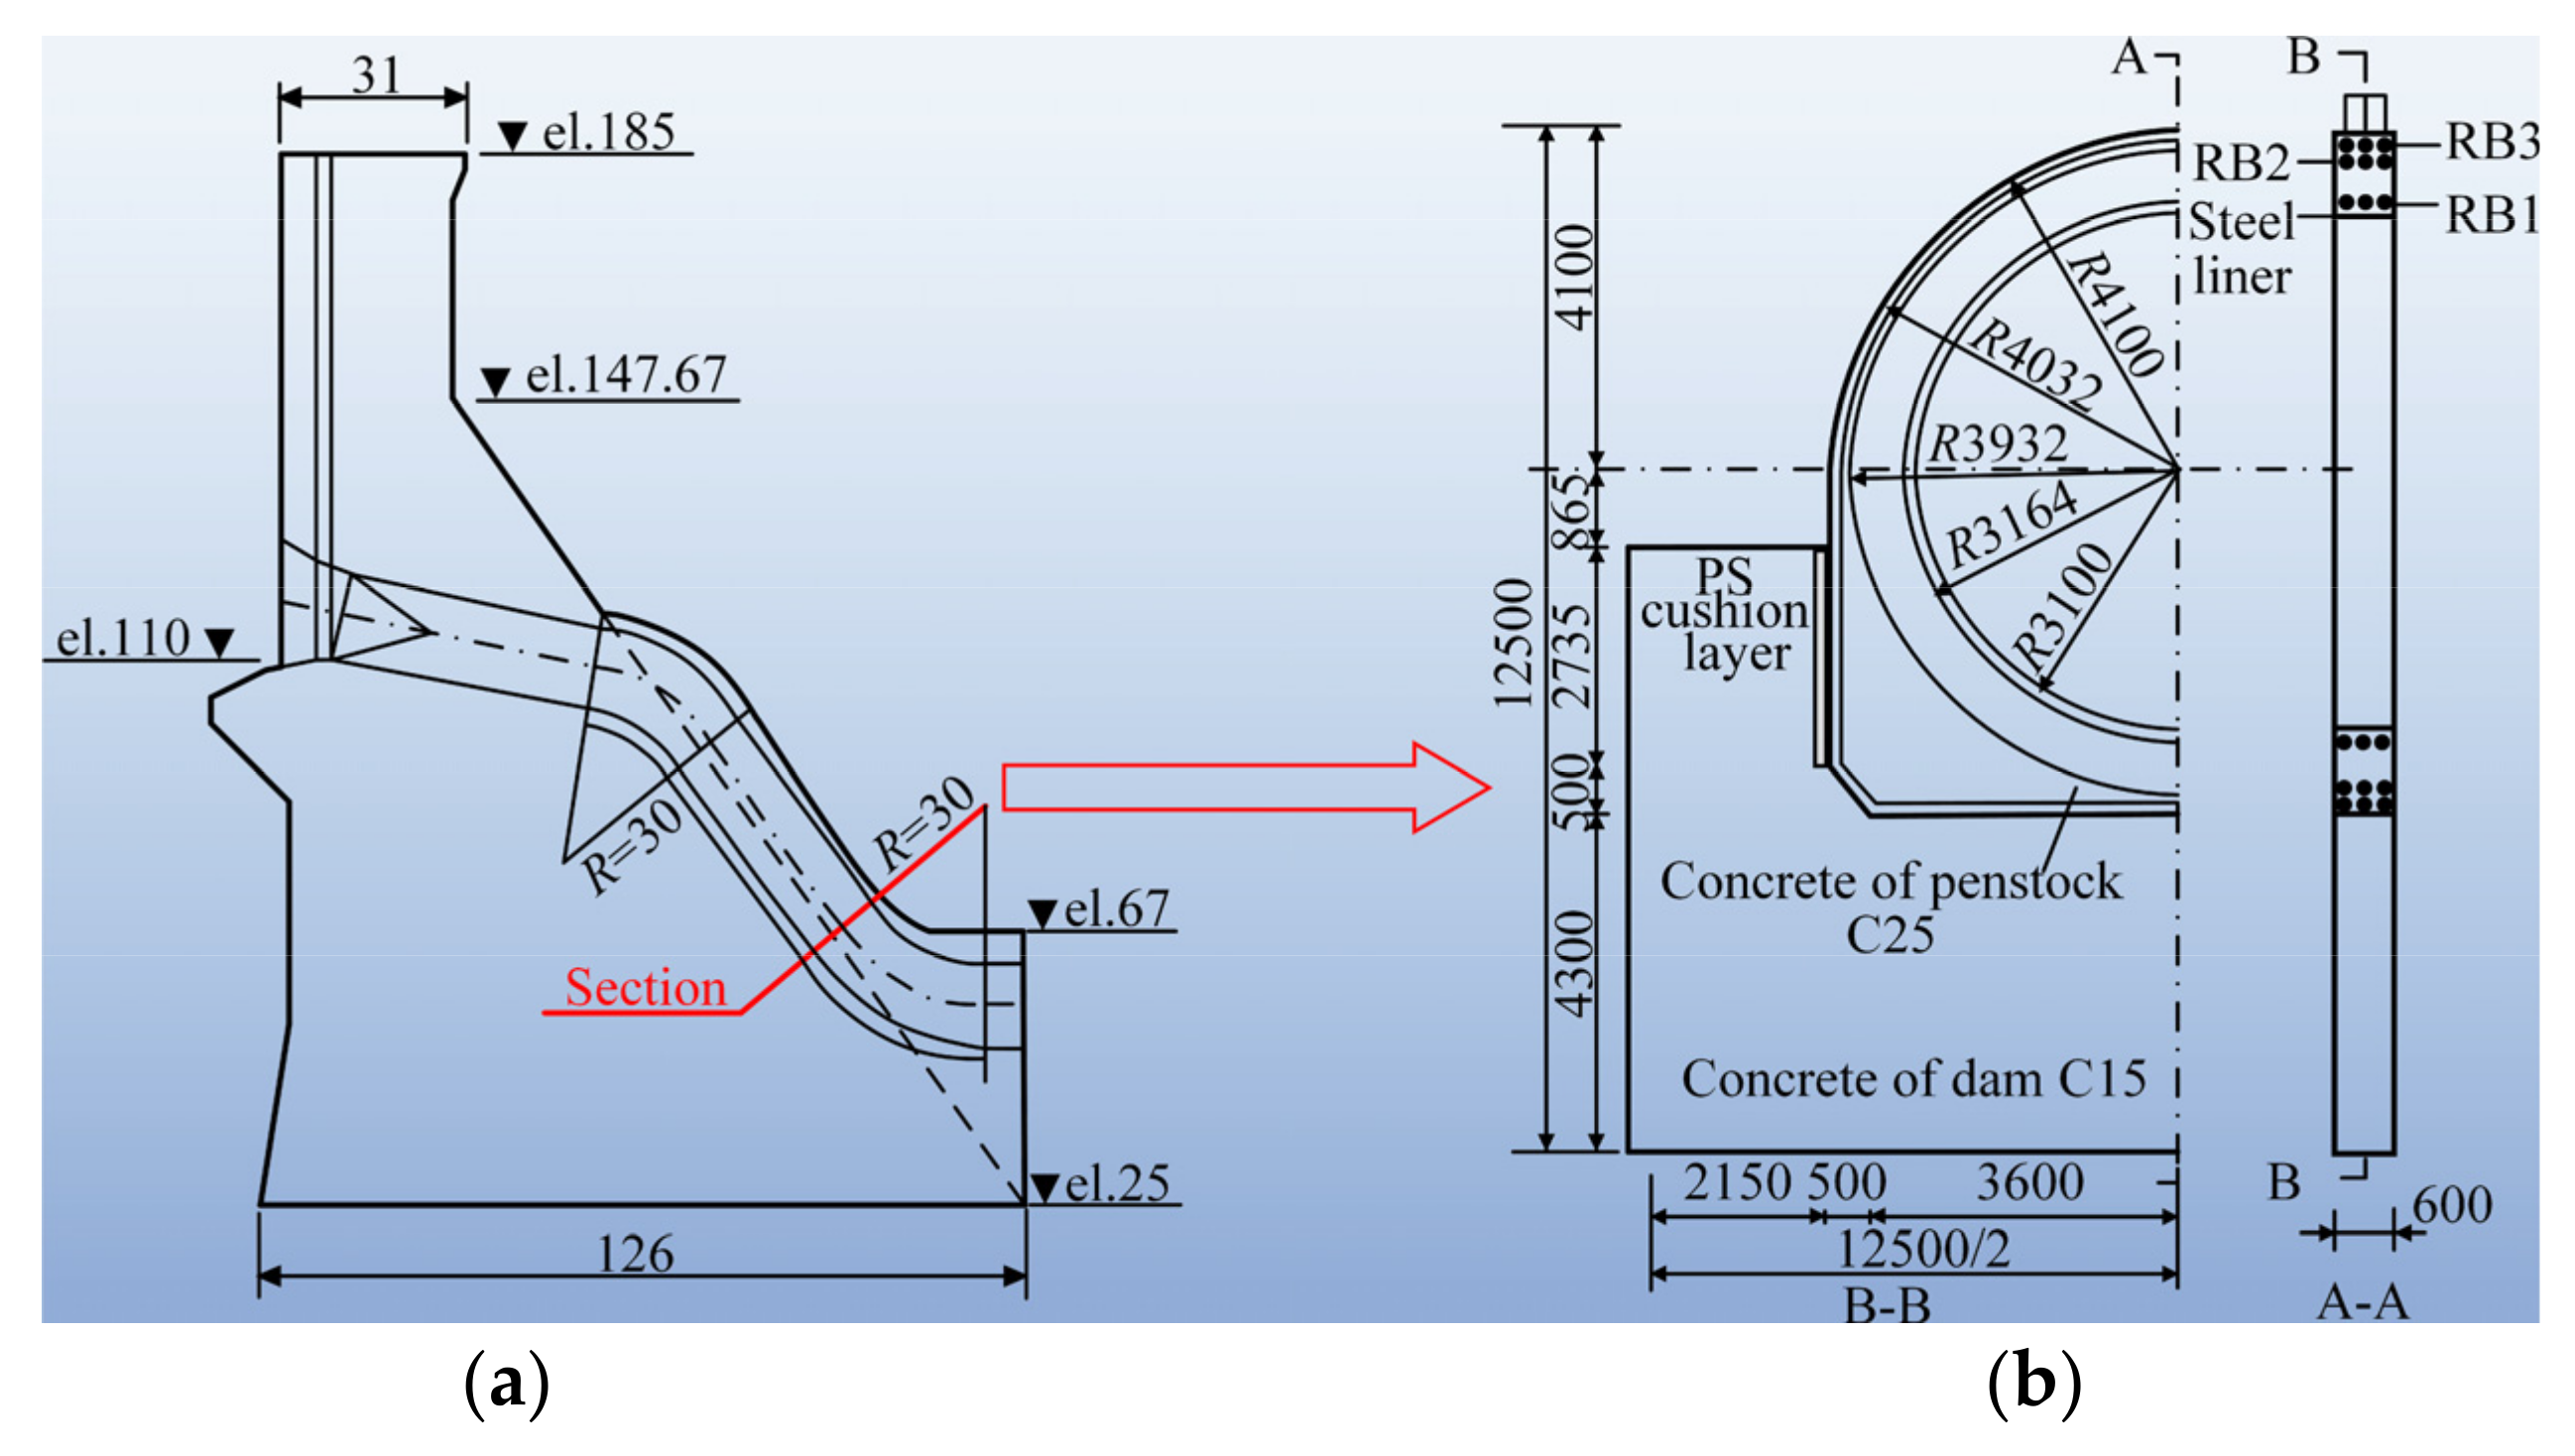
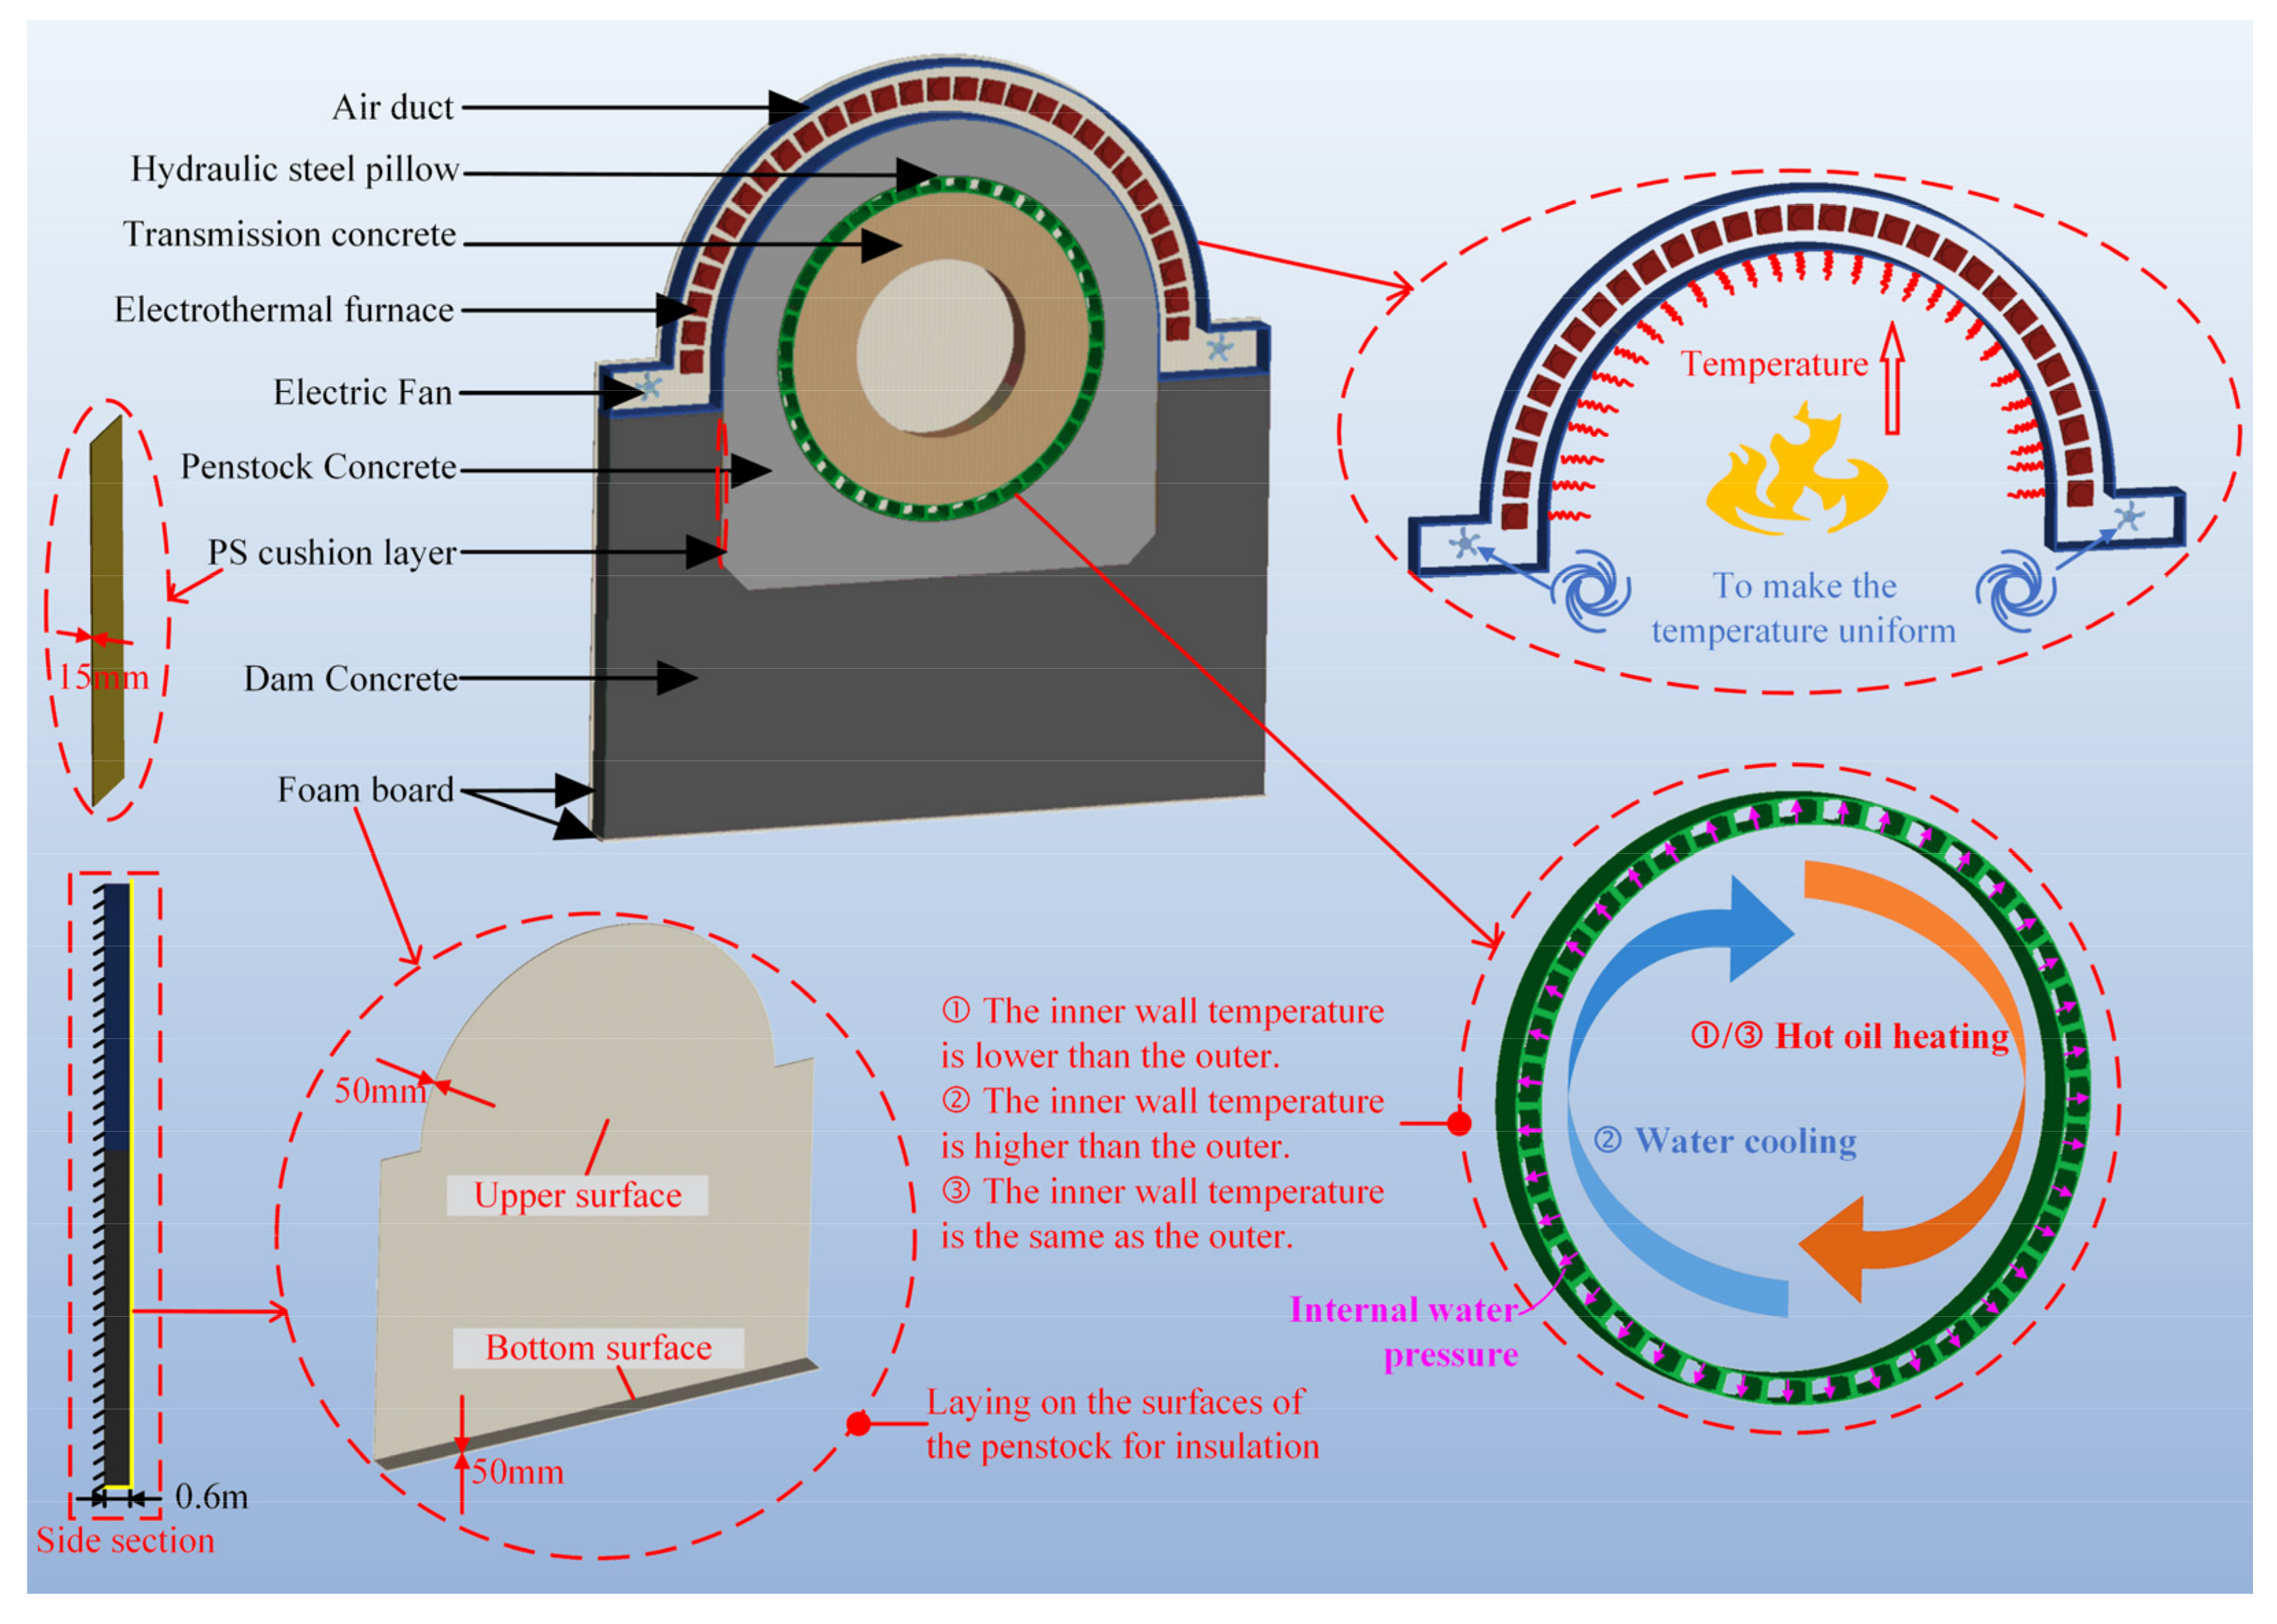
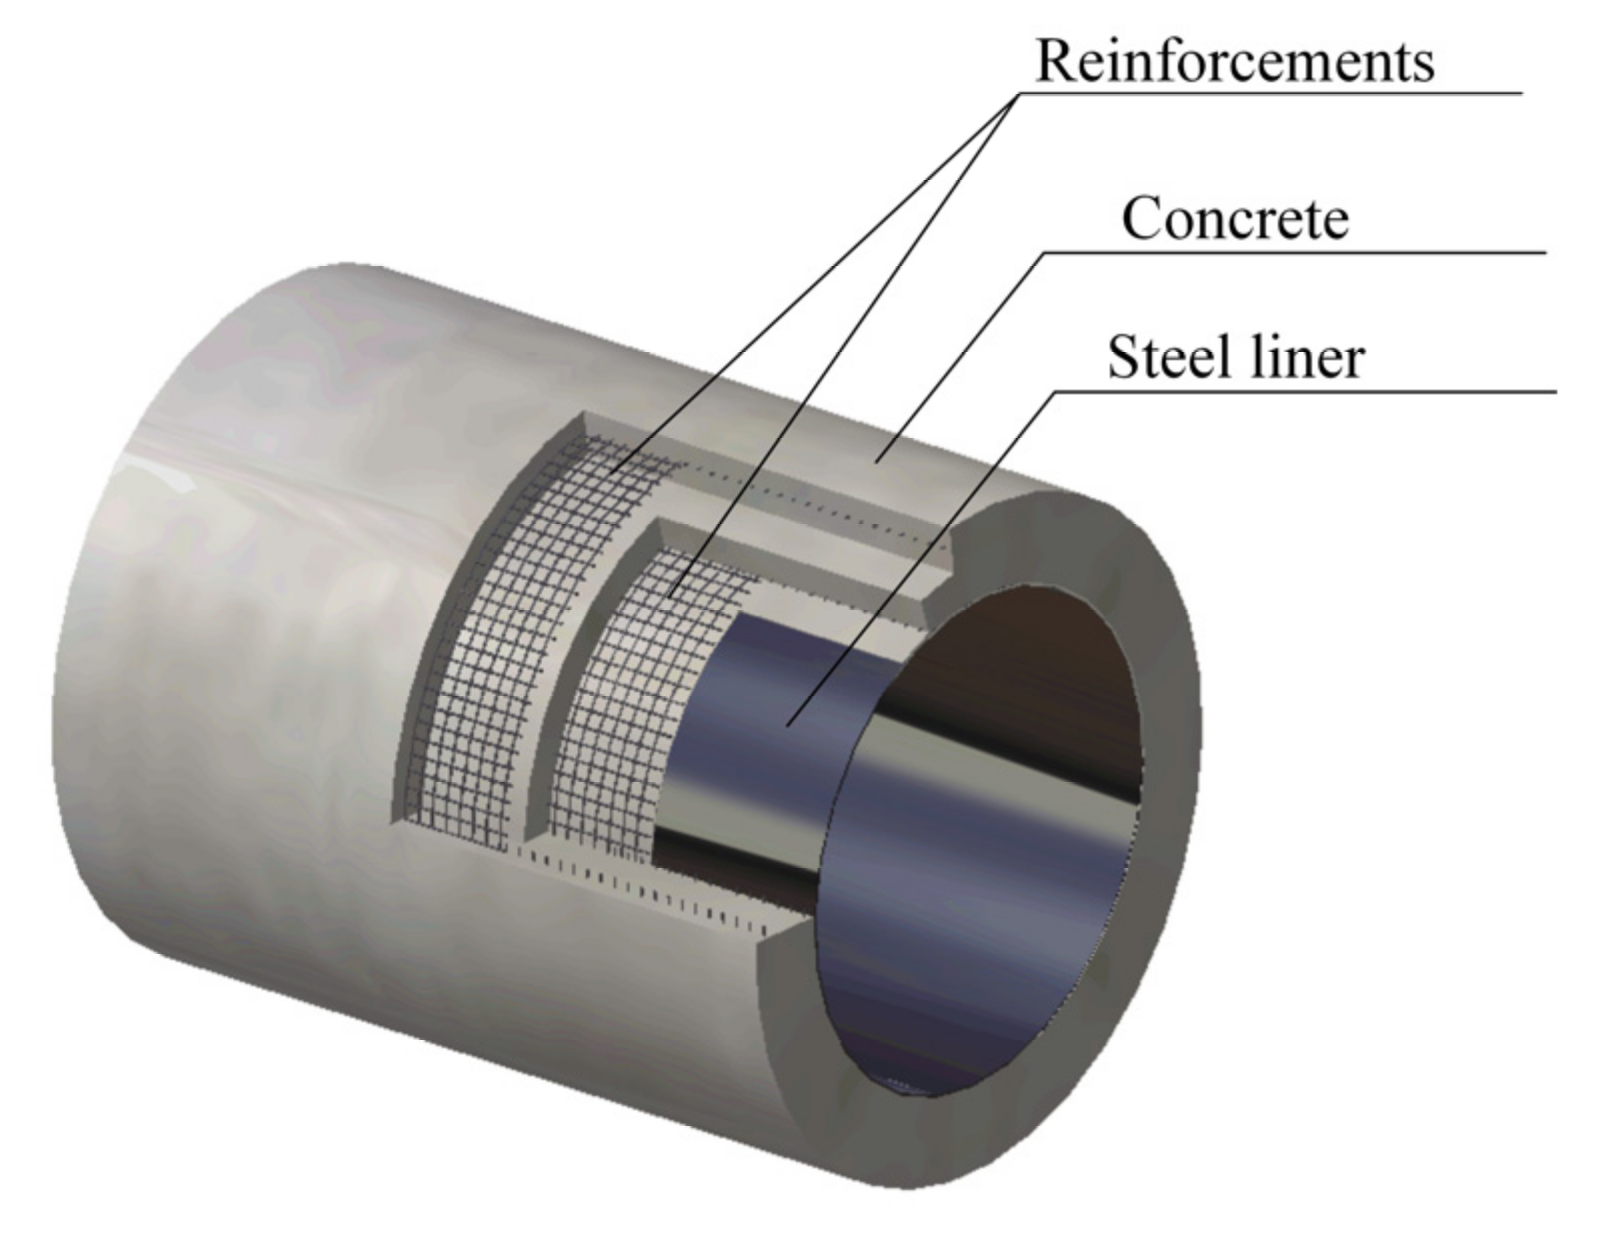
2.1. Description of Specimen
2.2. Material Properties of the Model
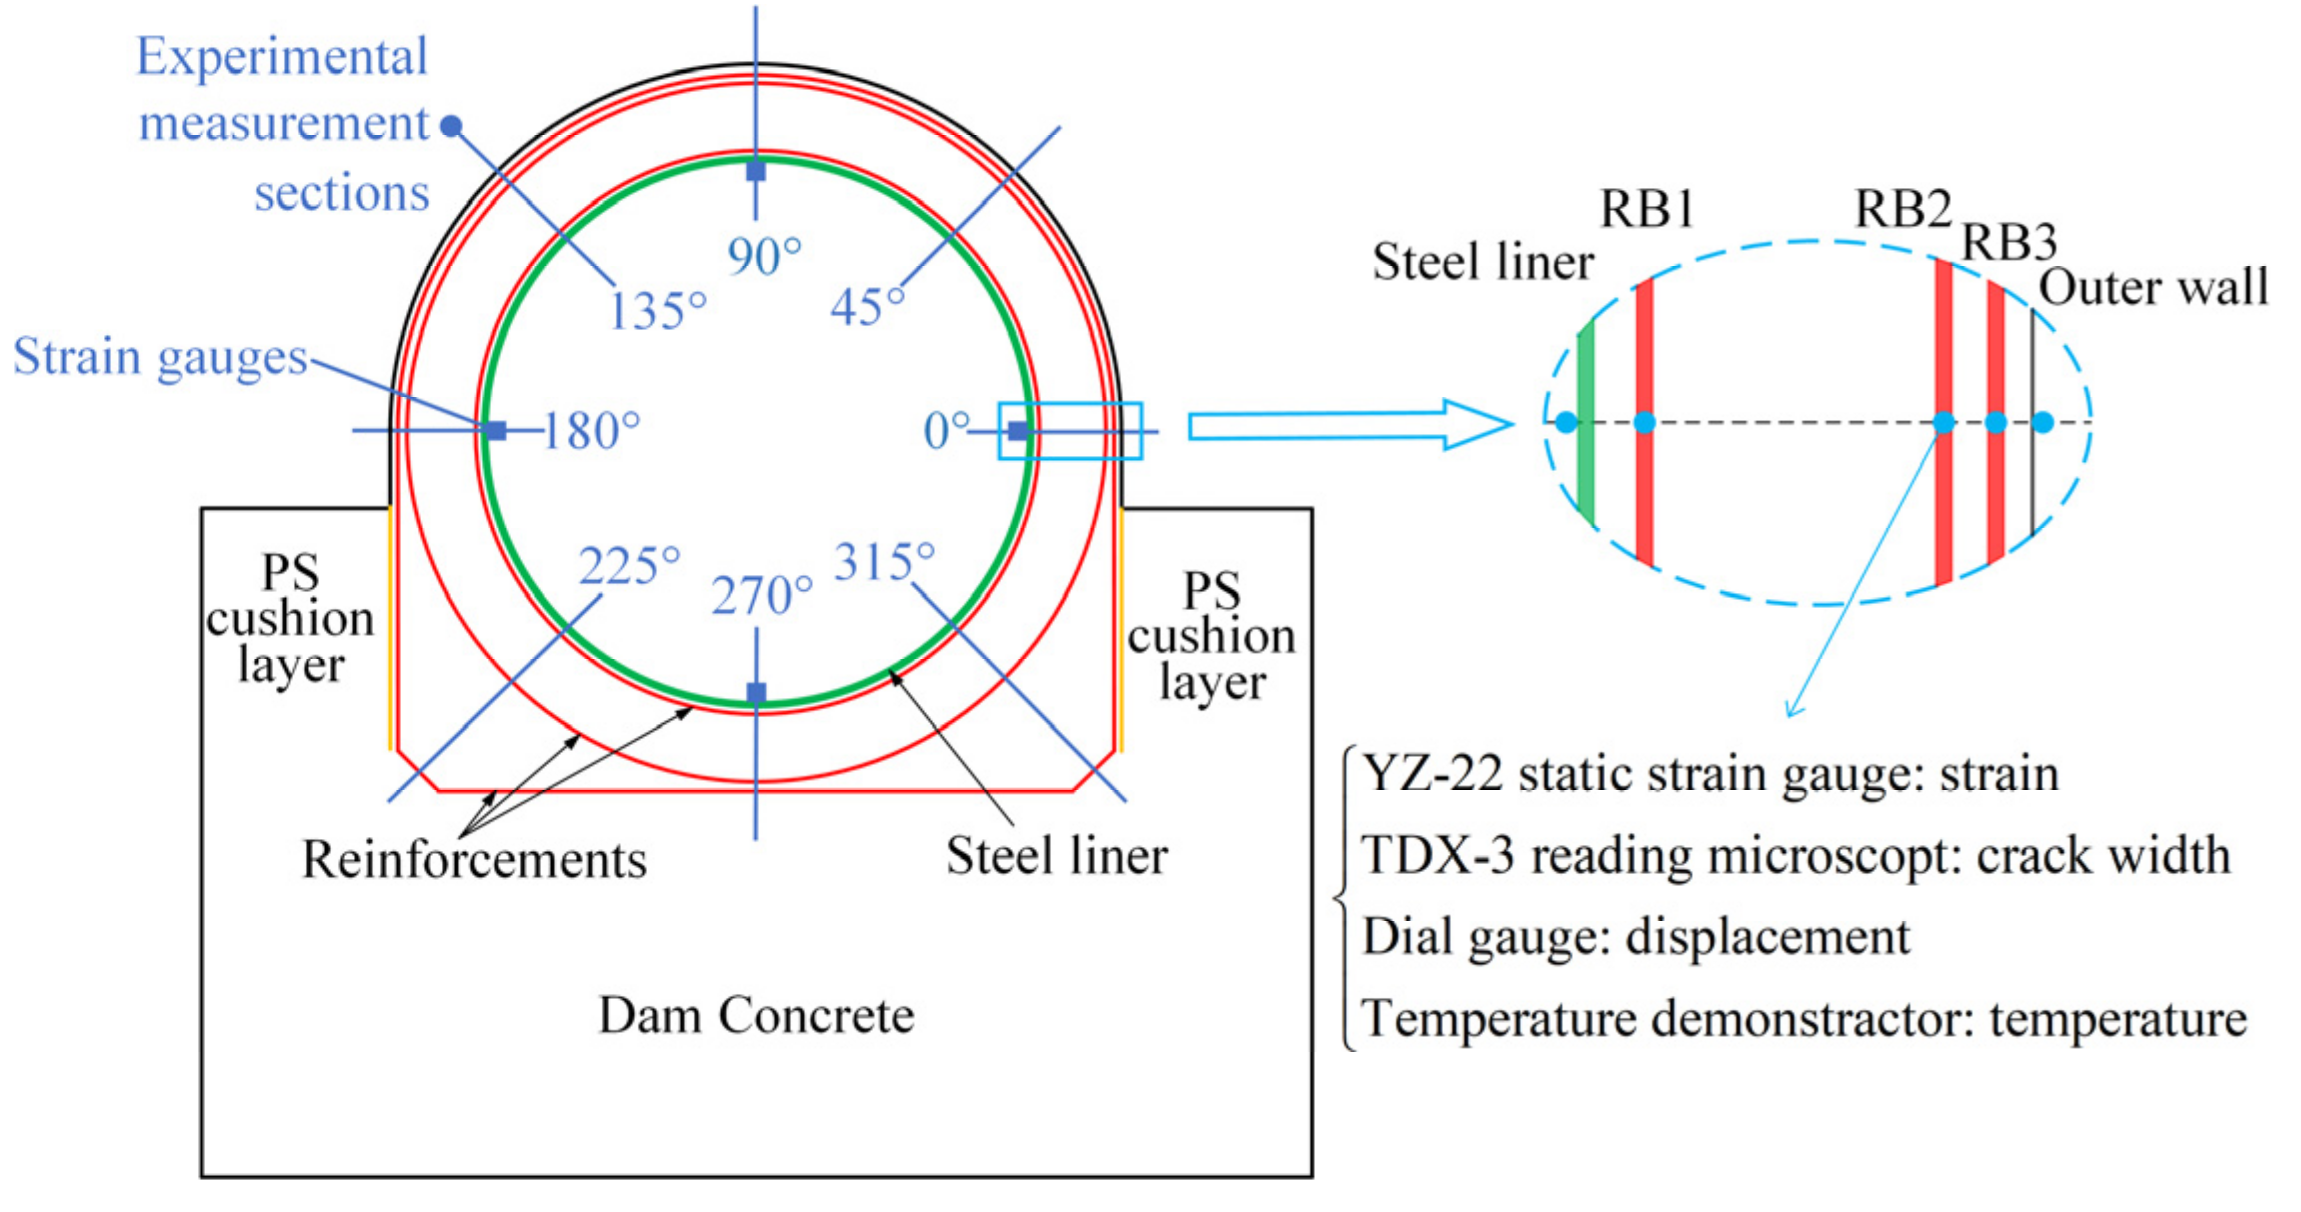
2.3. Measuring Points Arrangement and Instruments
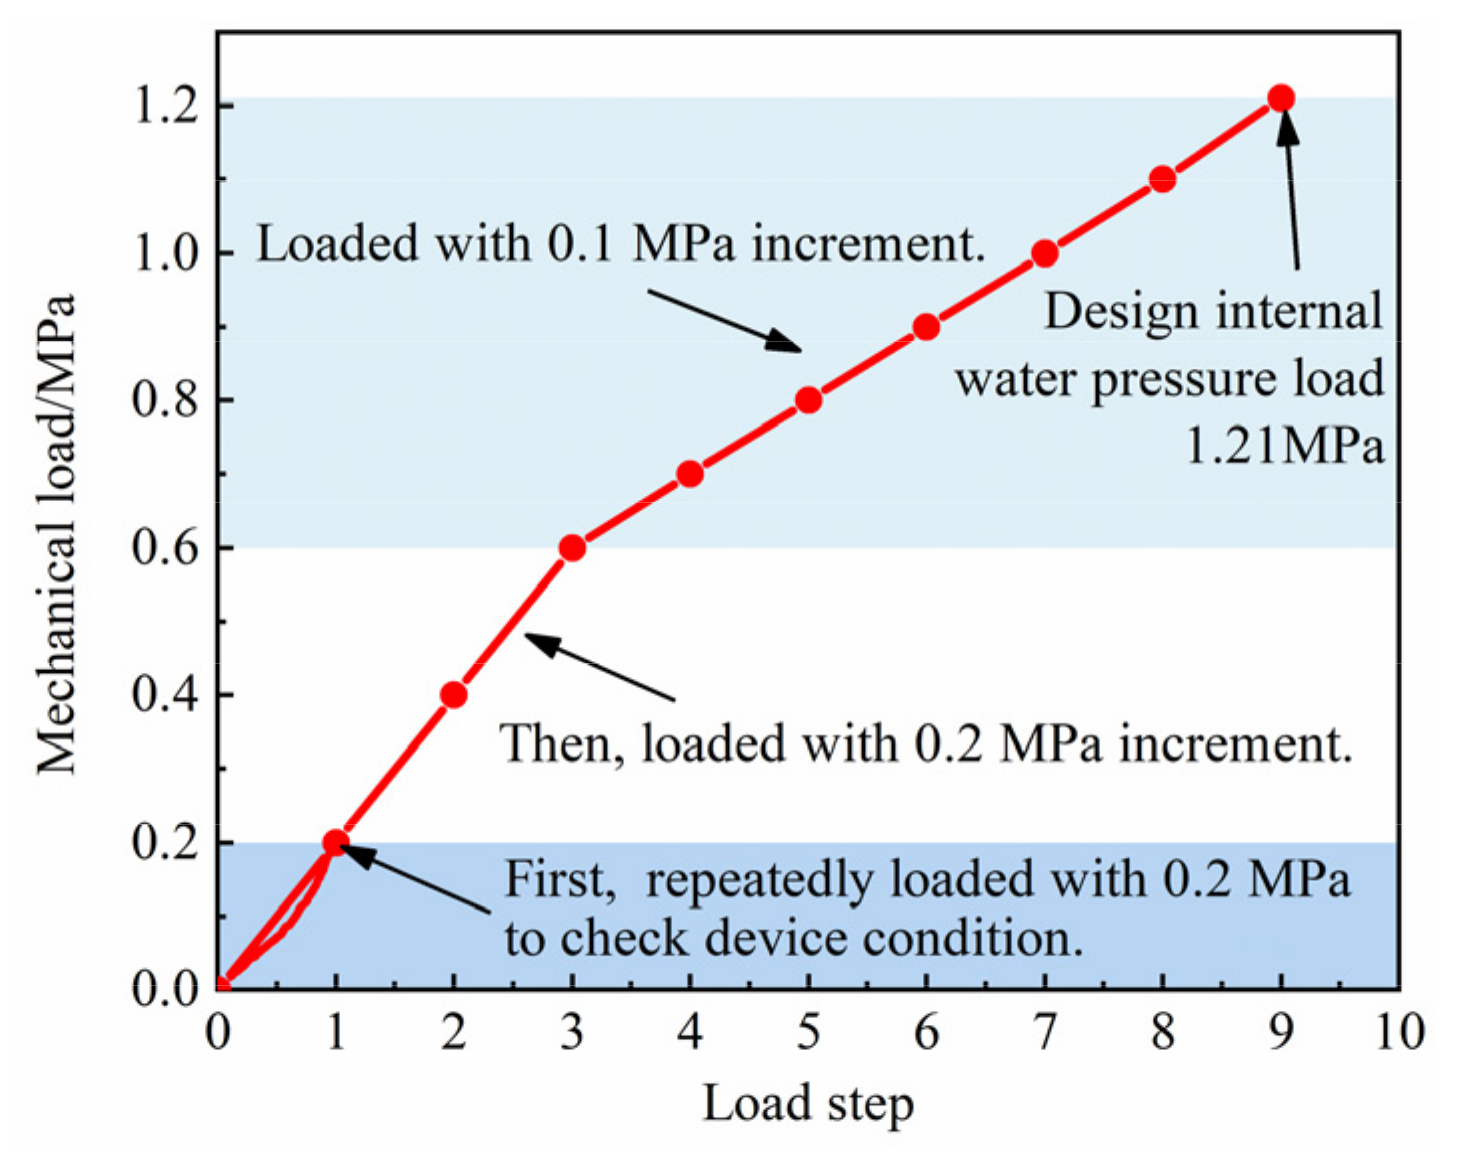
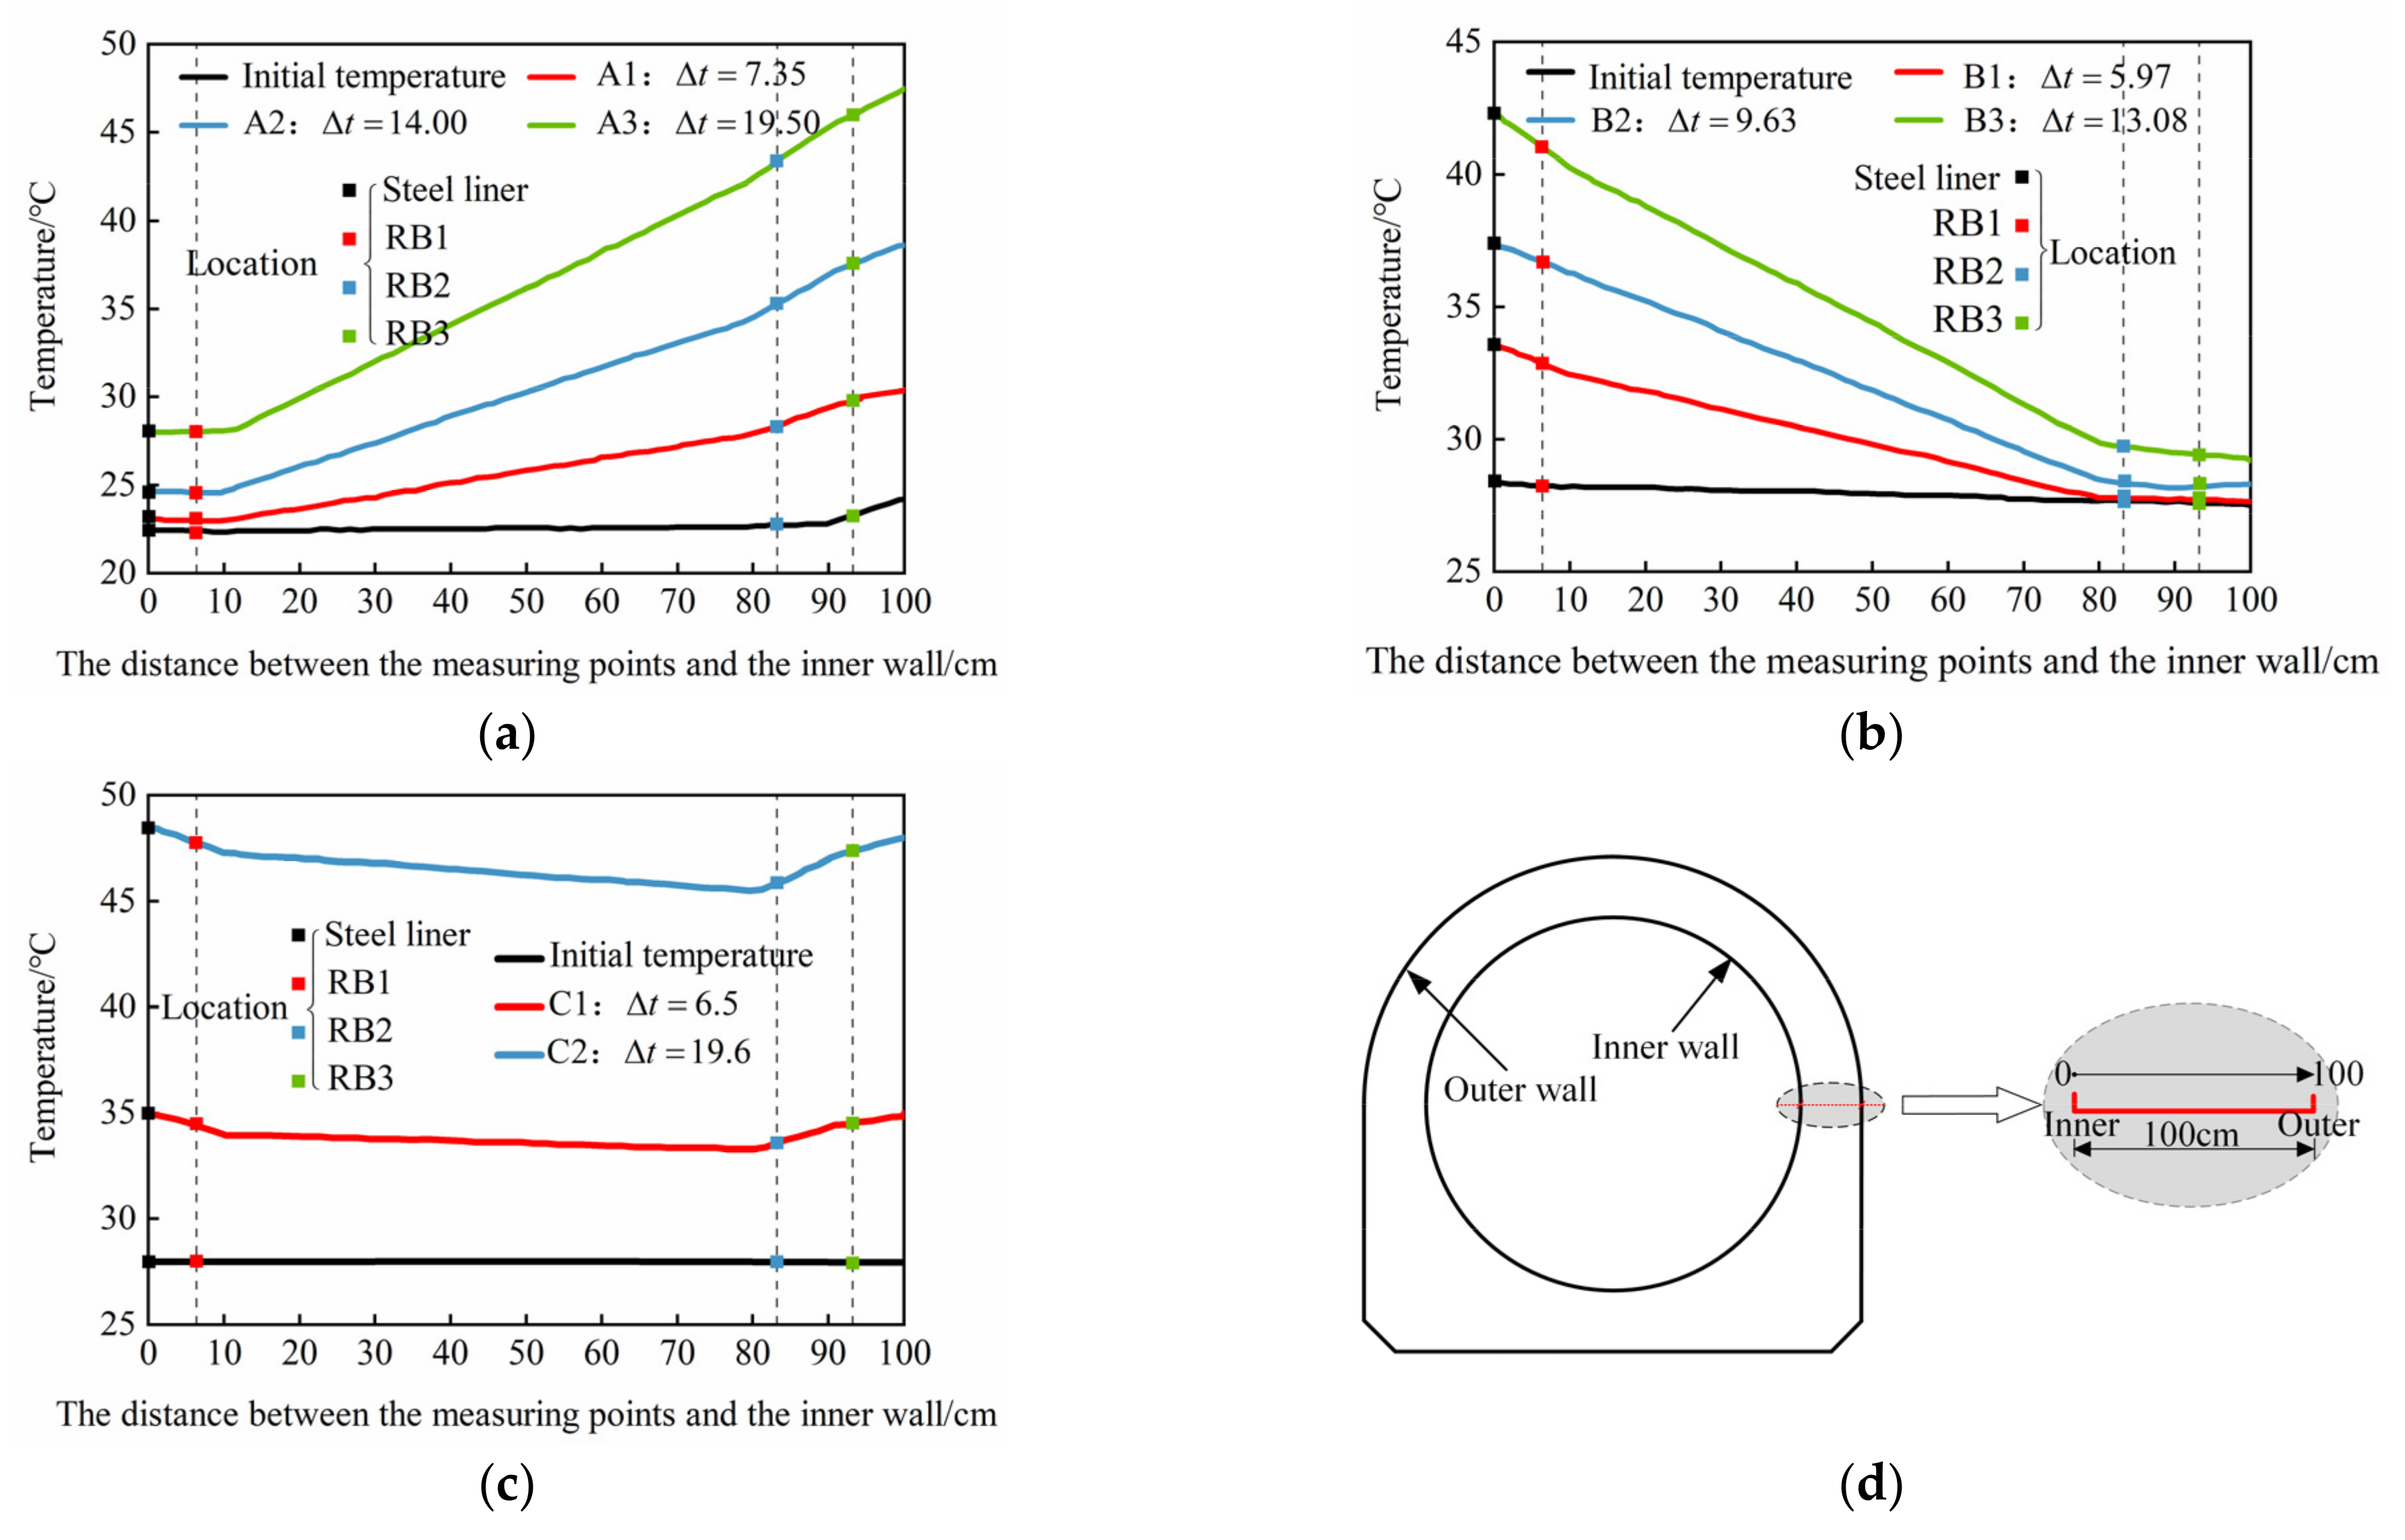
2.4. Loading and Heating Test
2.5. Experimental Results
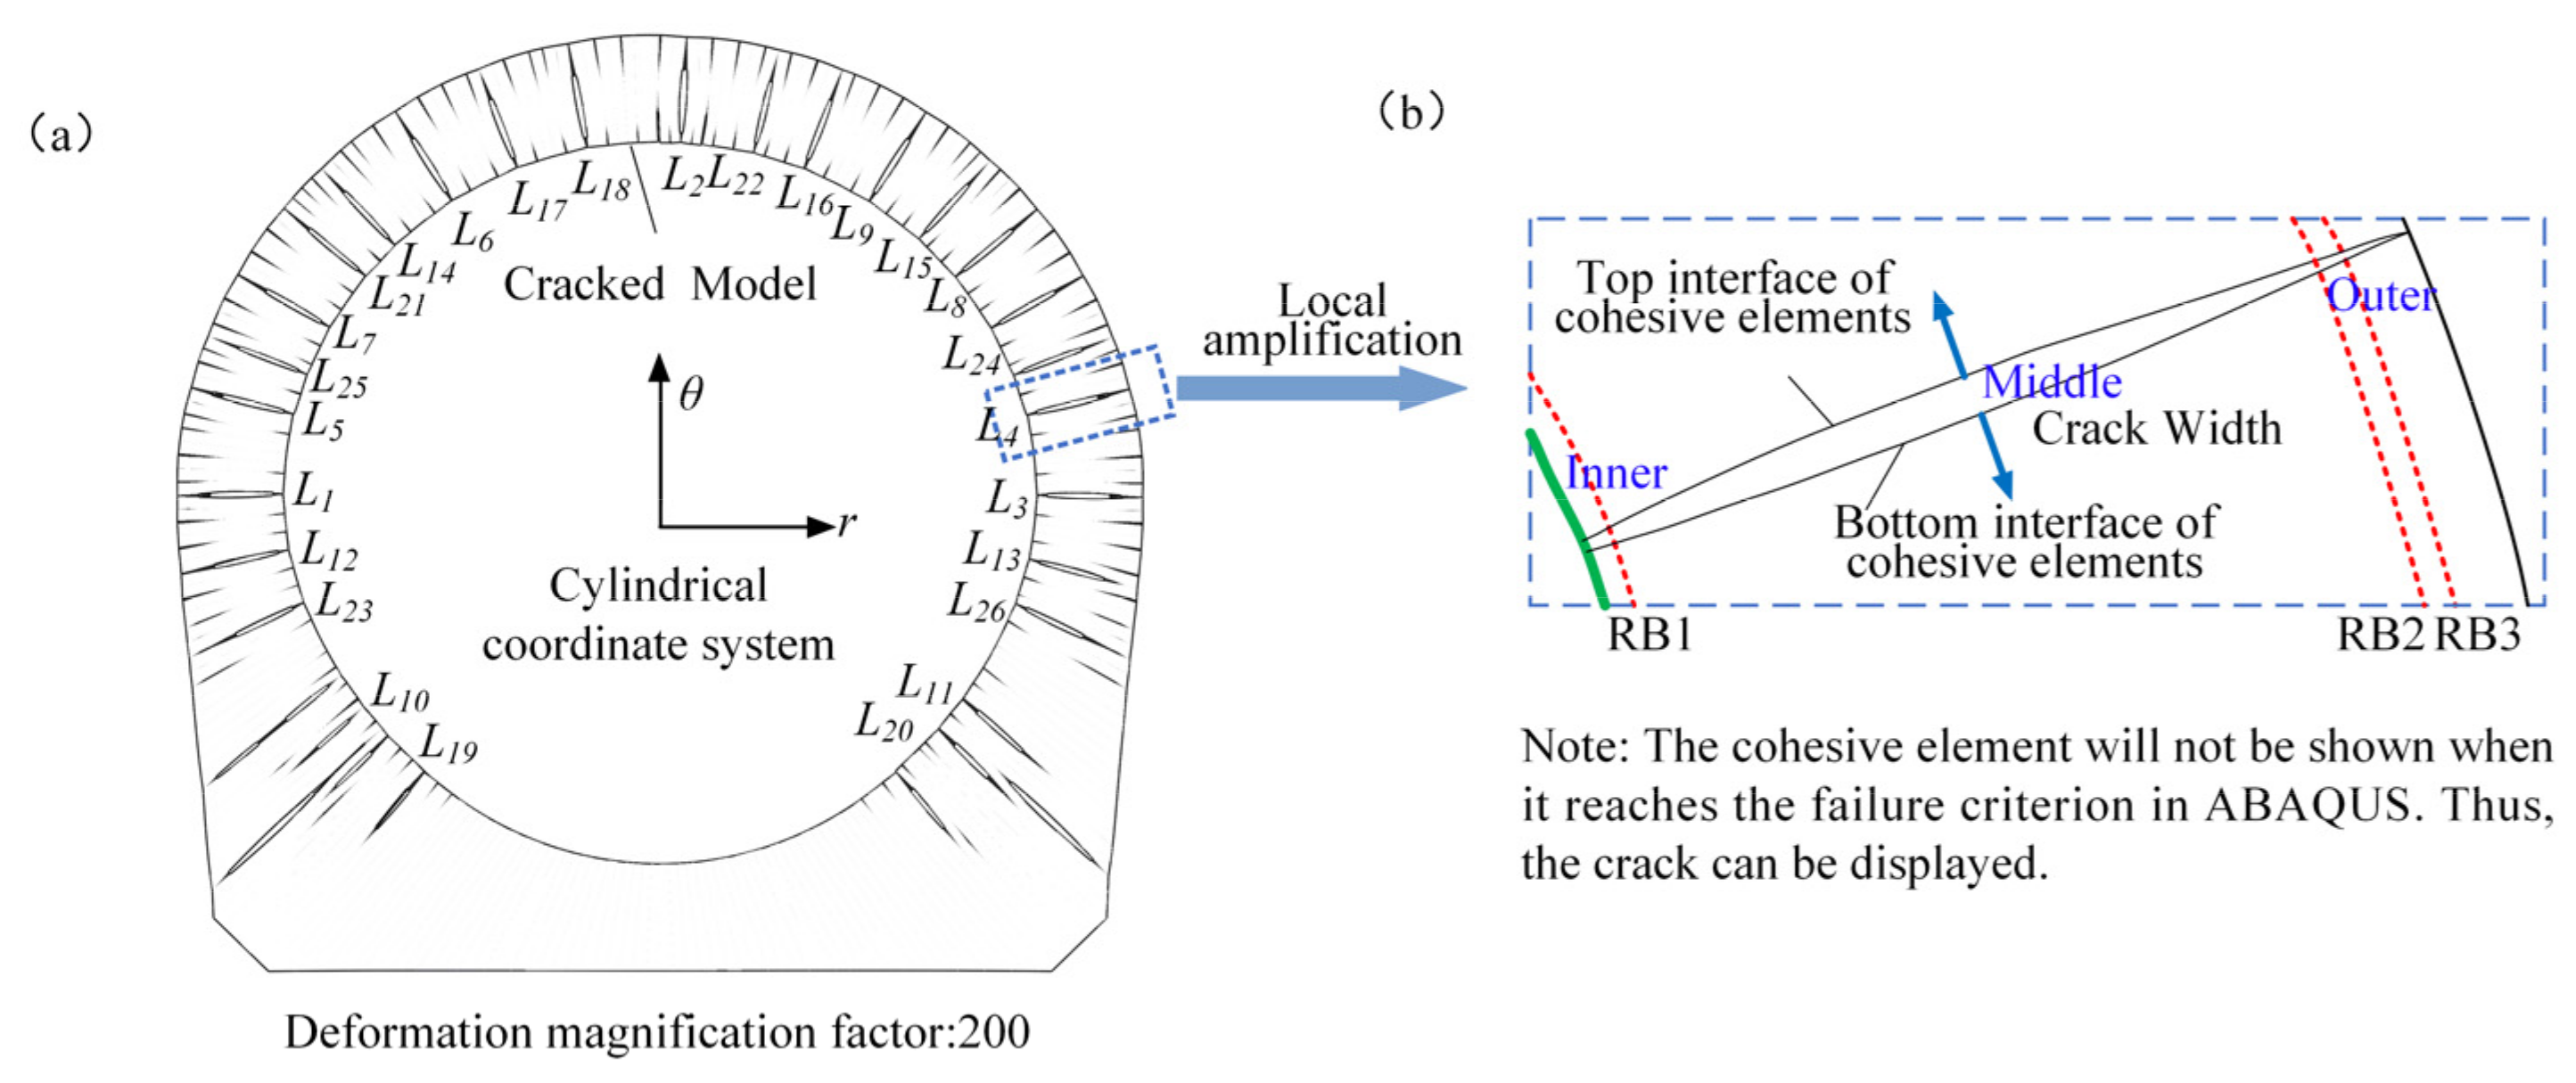
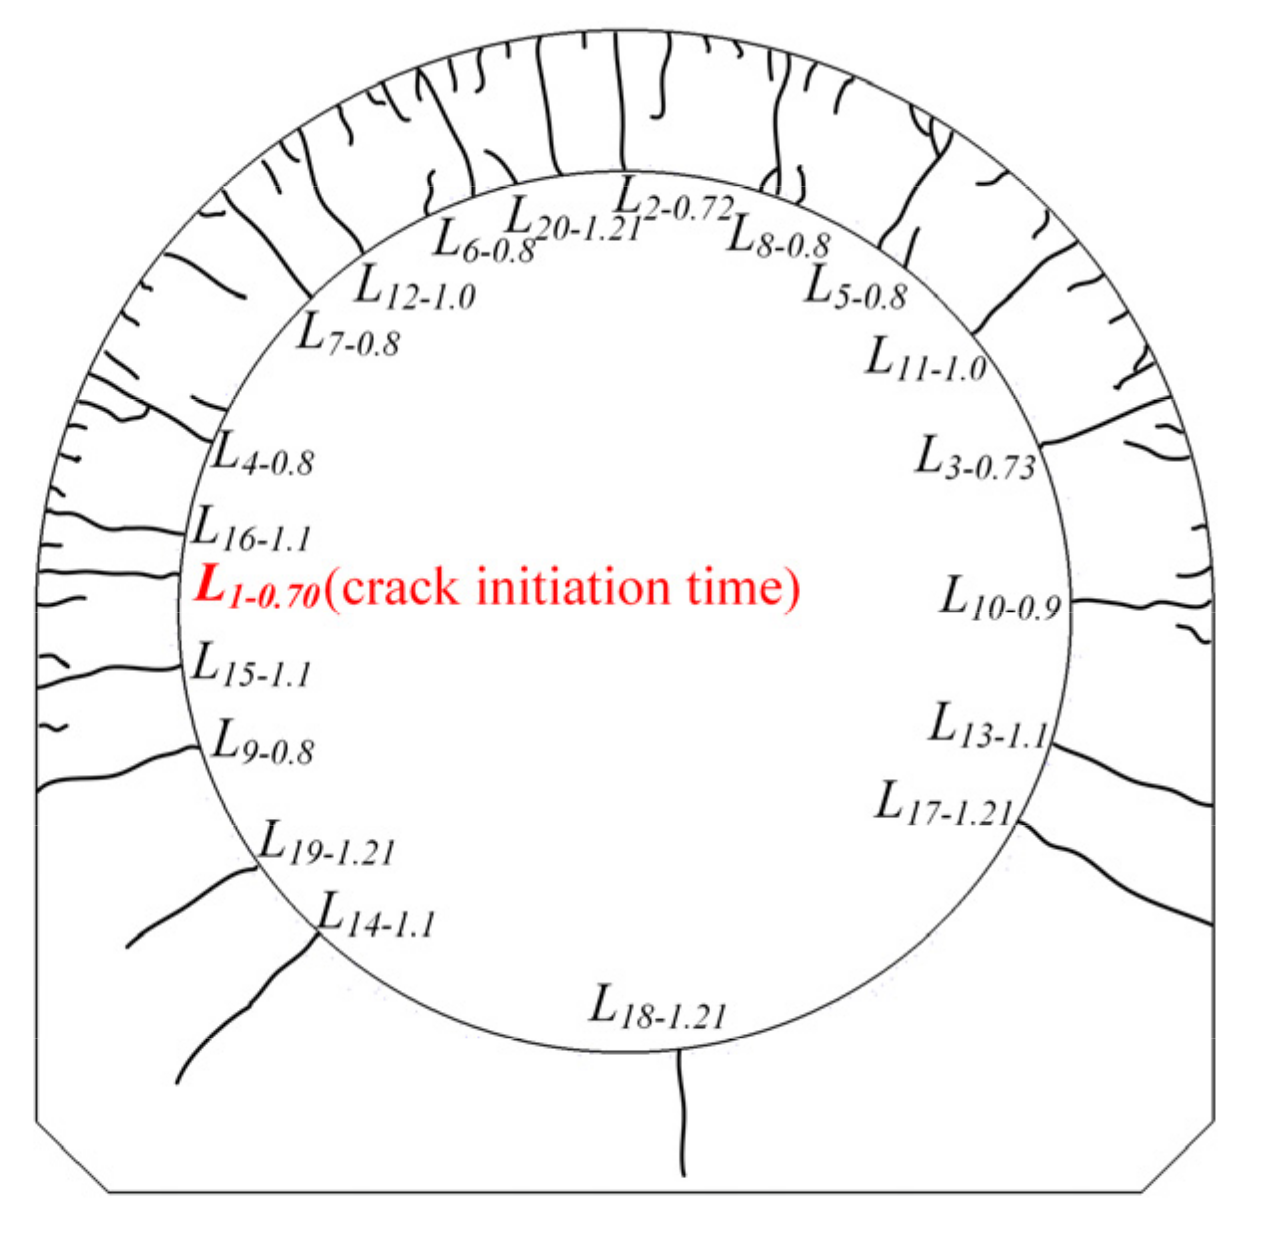
2.5.1. Crack Initiation and Propagation
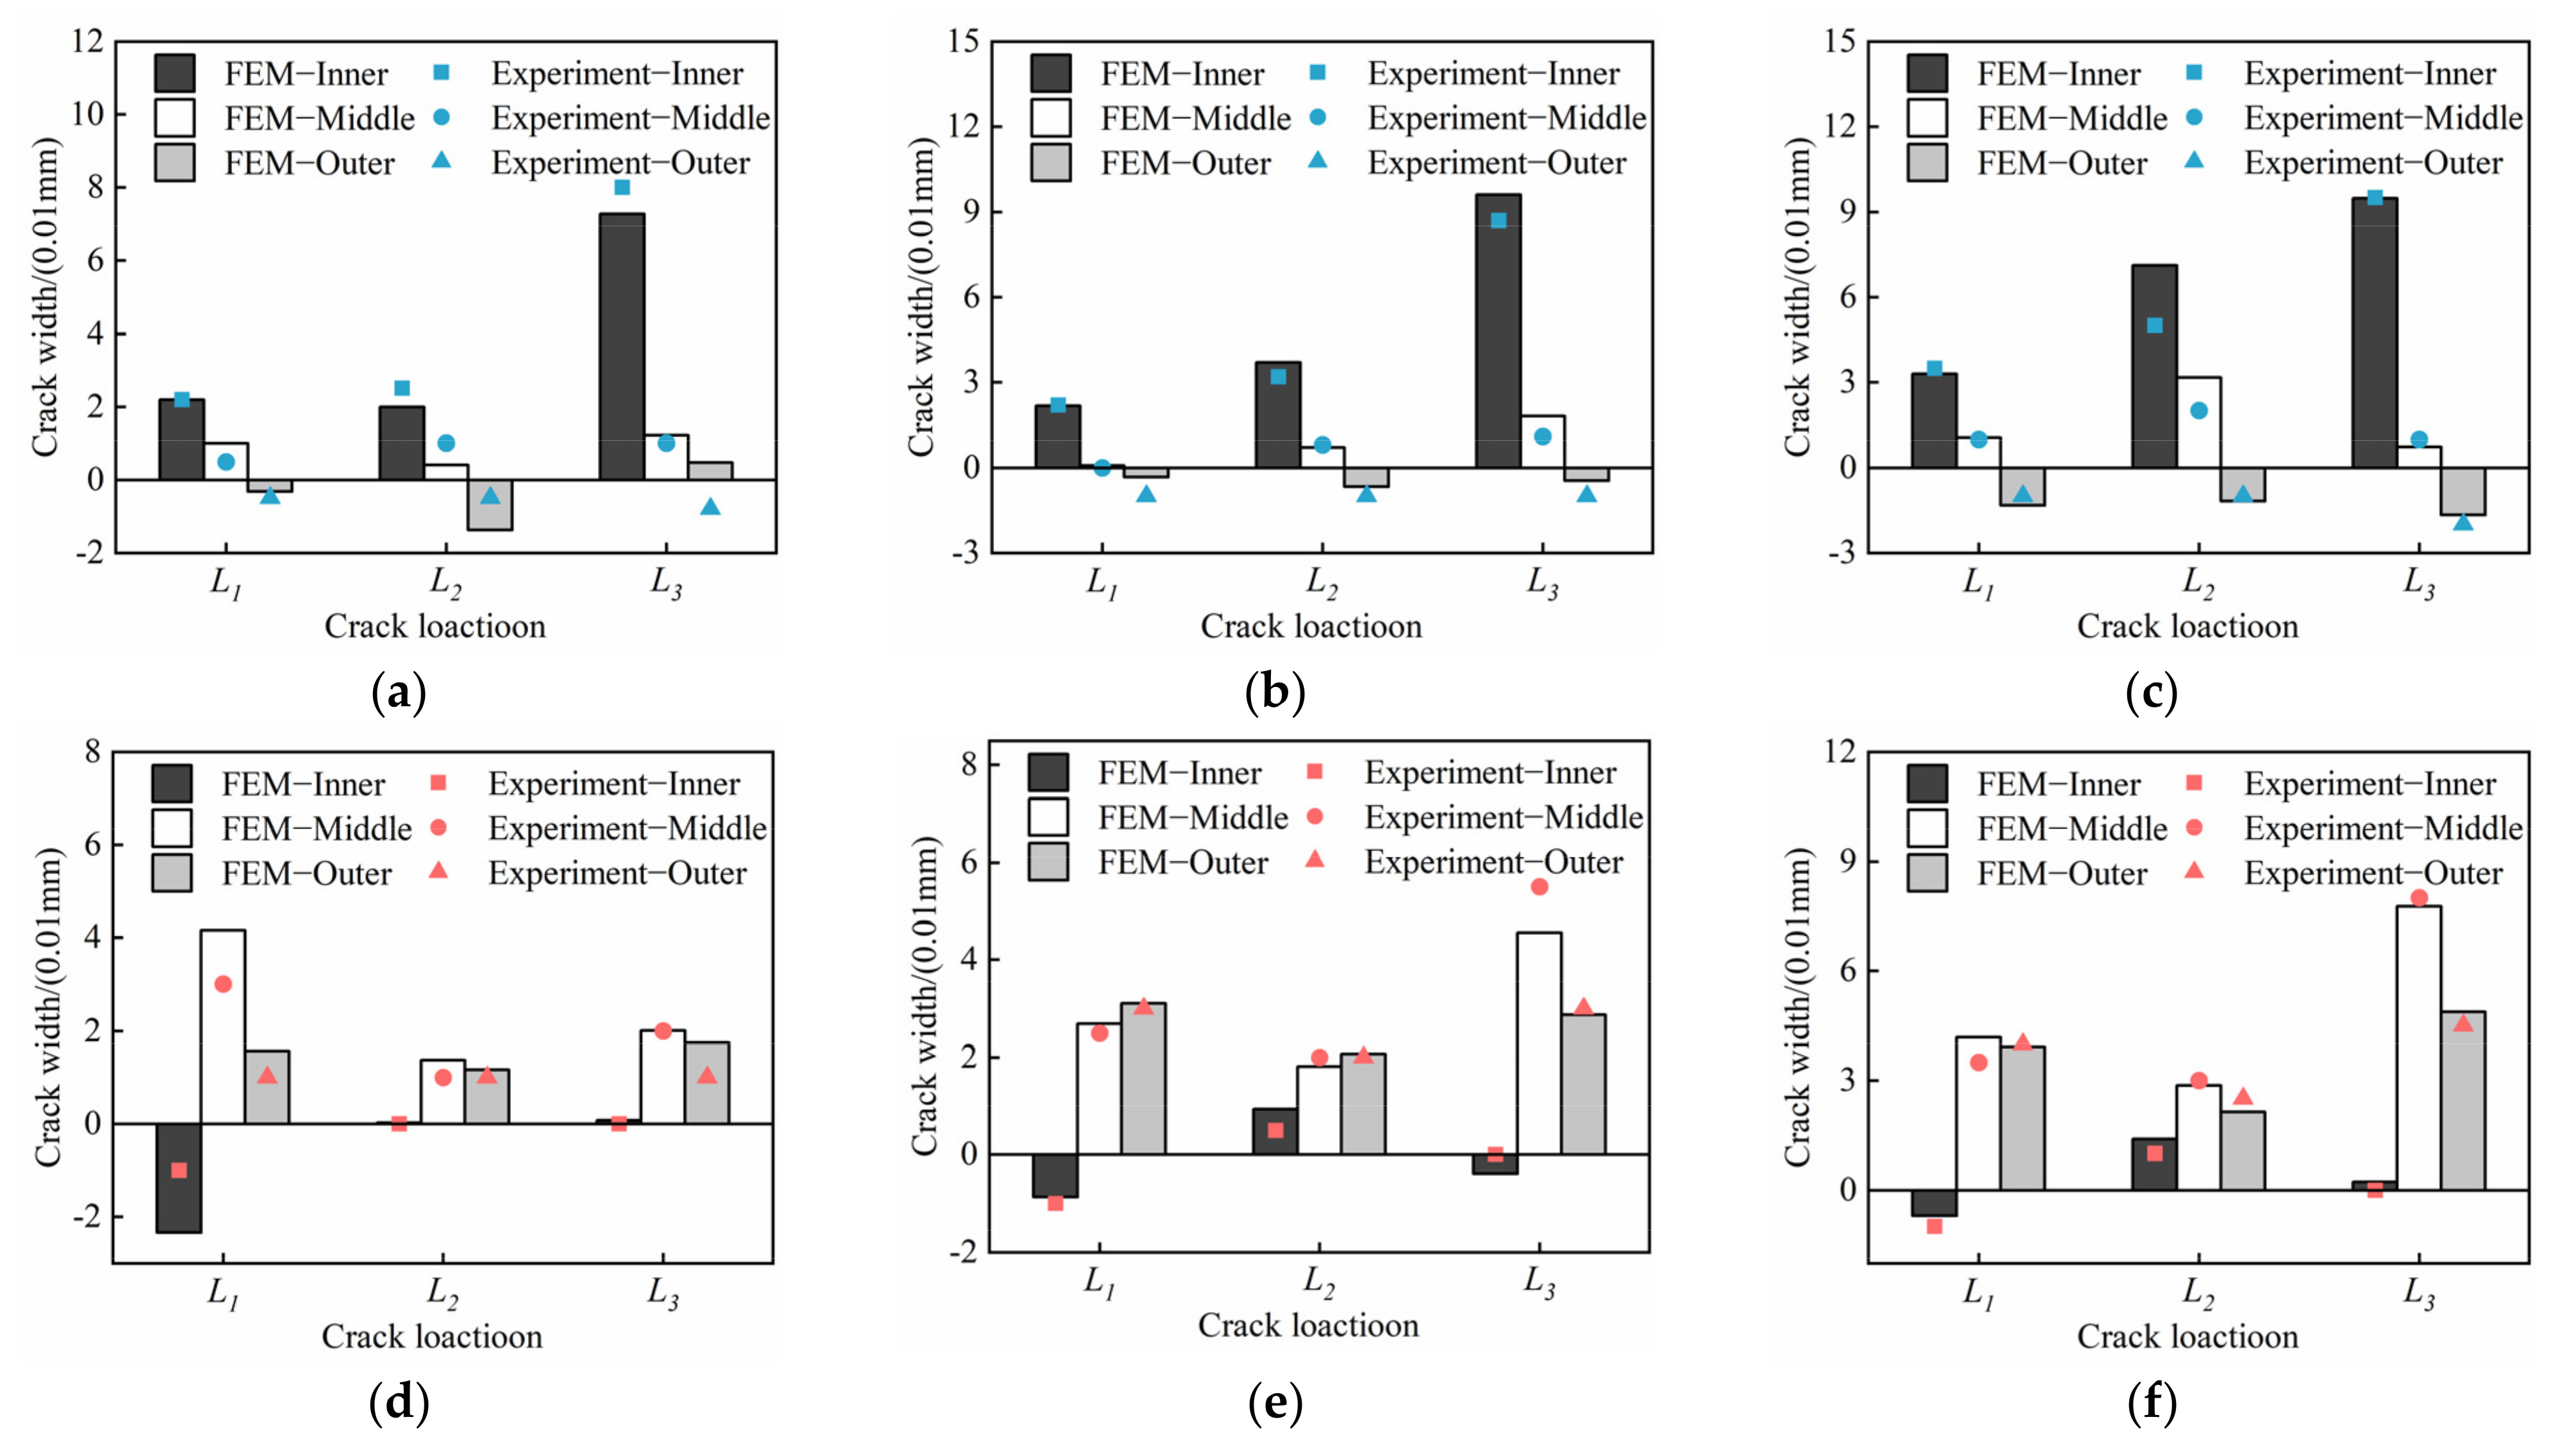
2.5.2. Crack Width
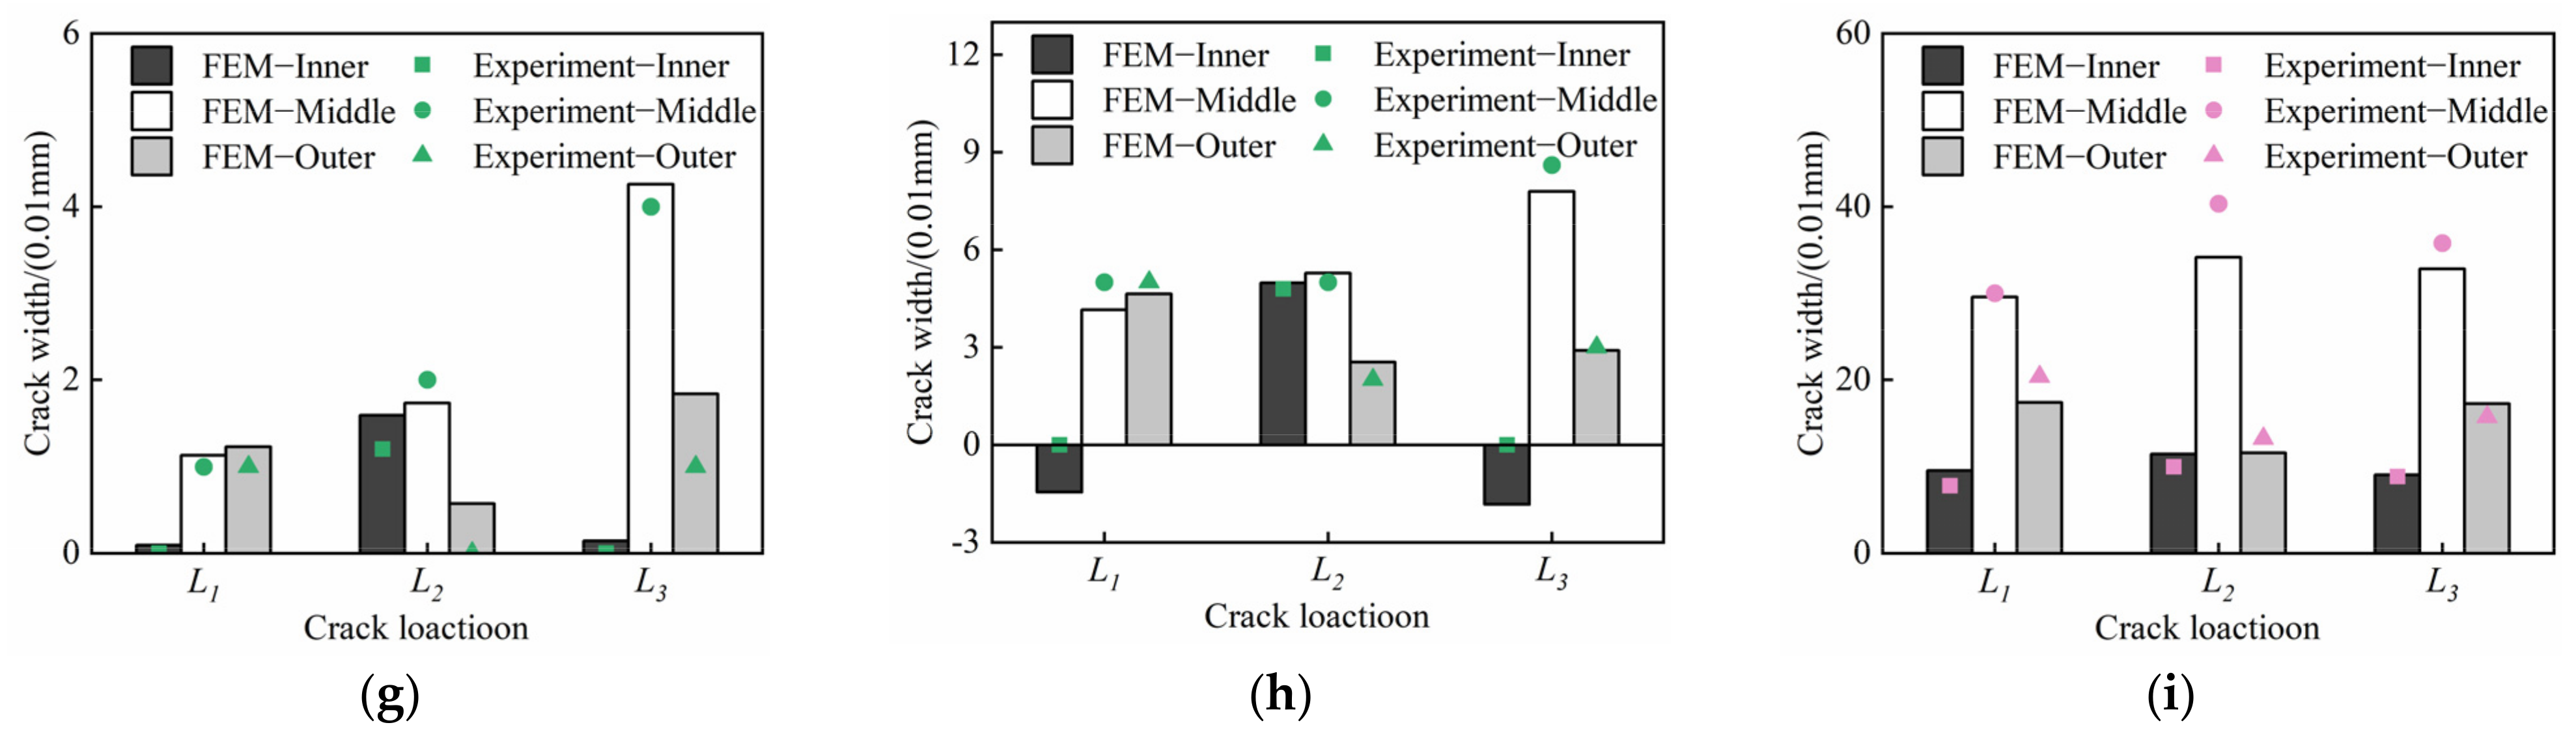
2.5.3. Steel Stress
3. Finite Element Modeling
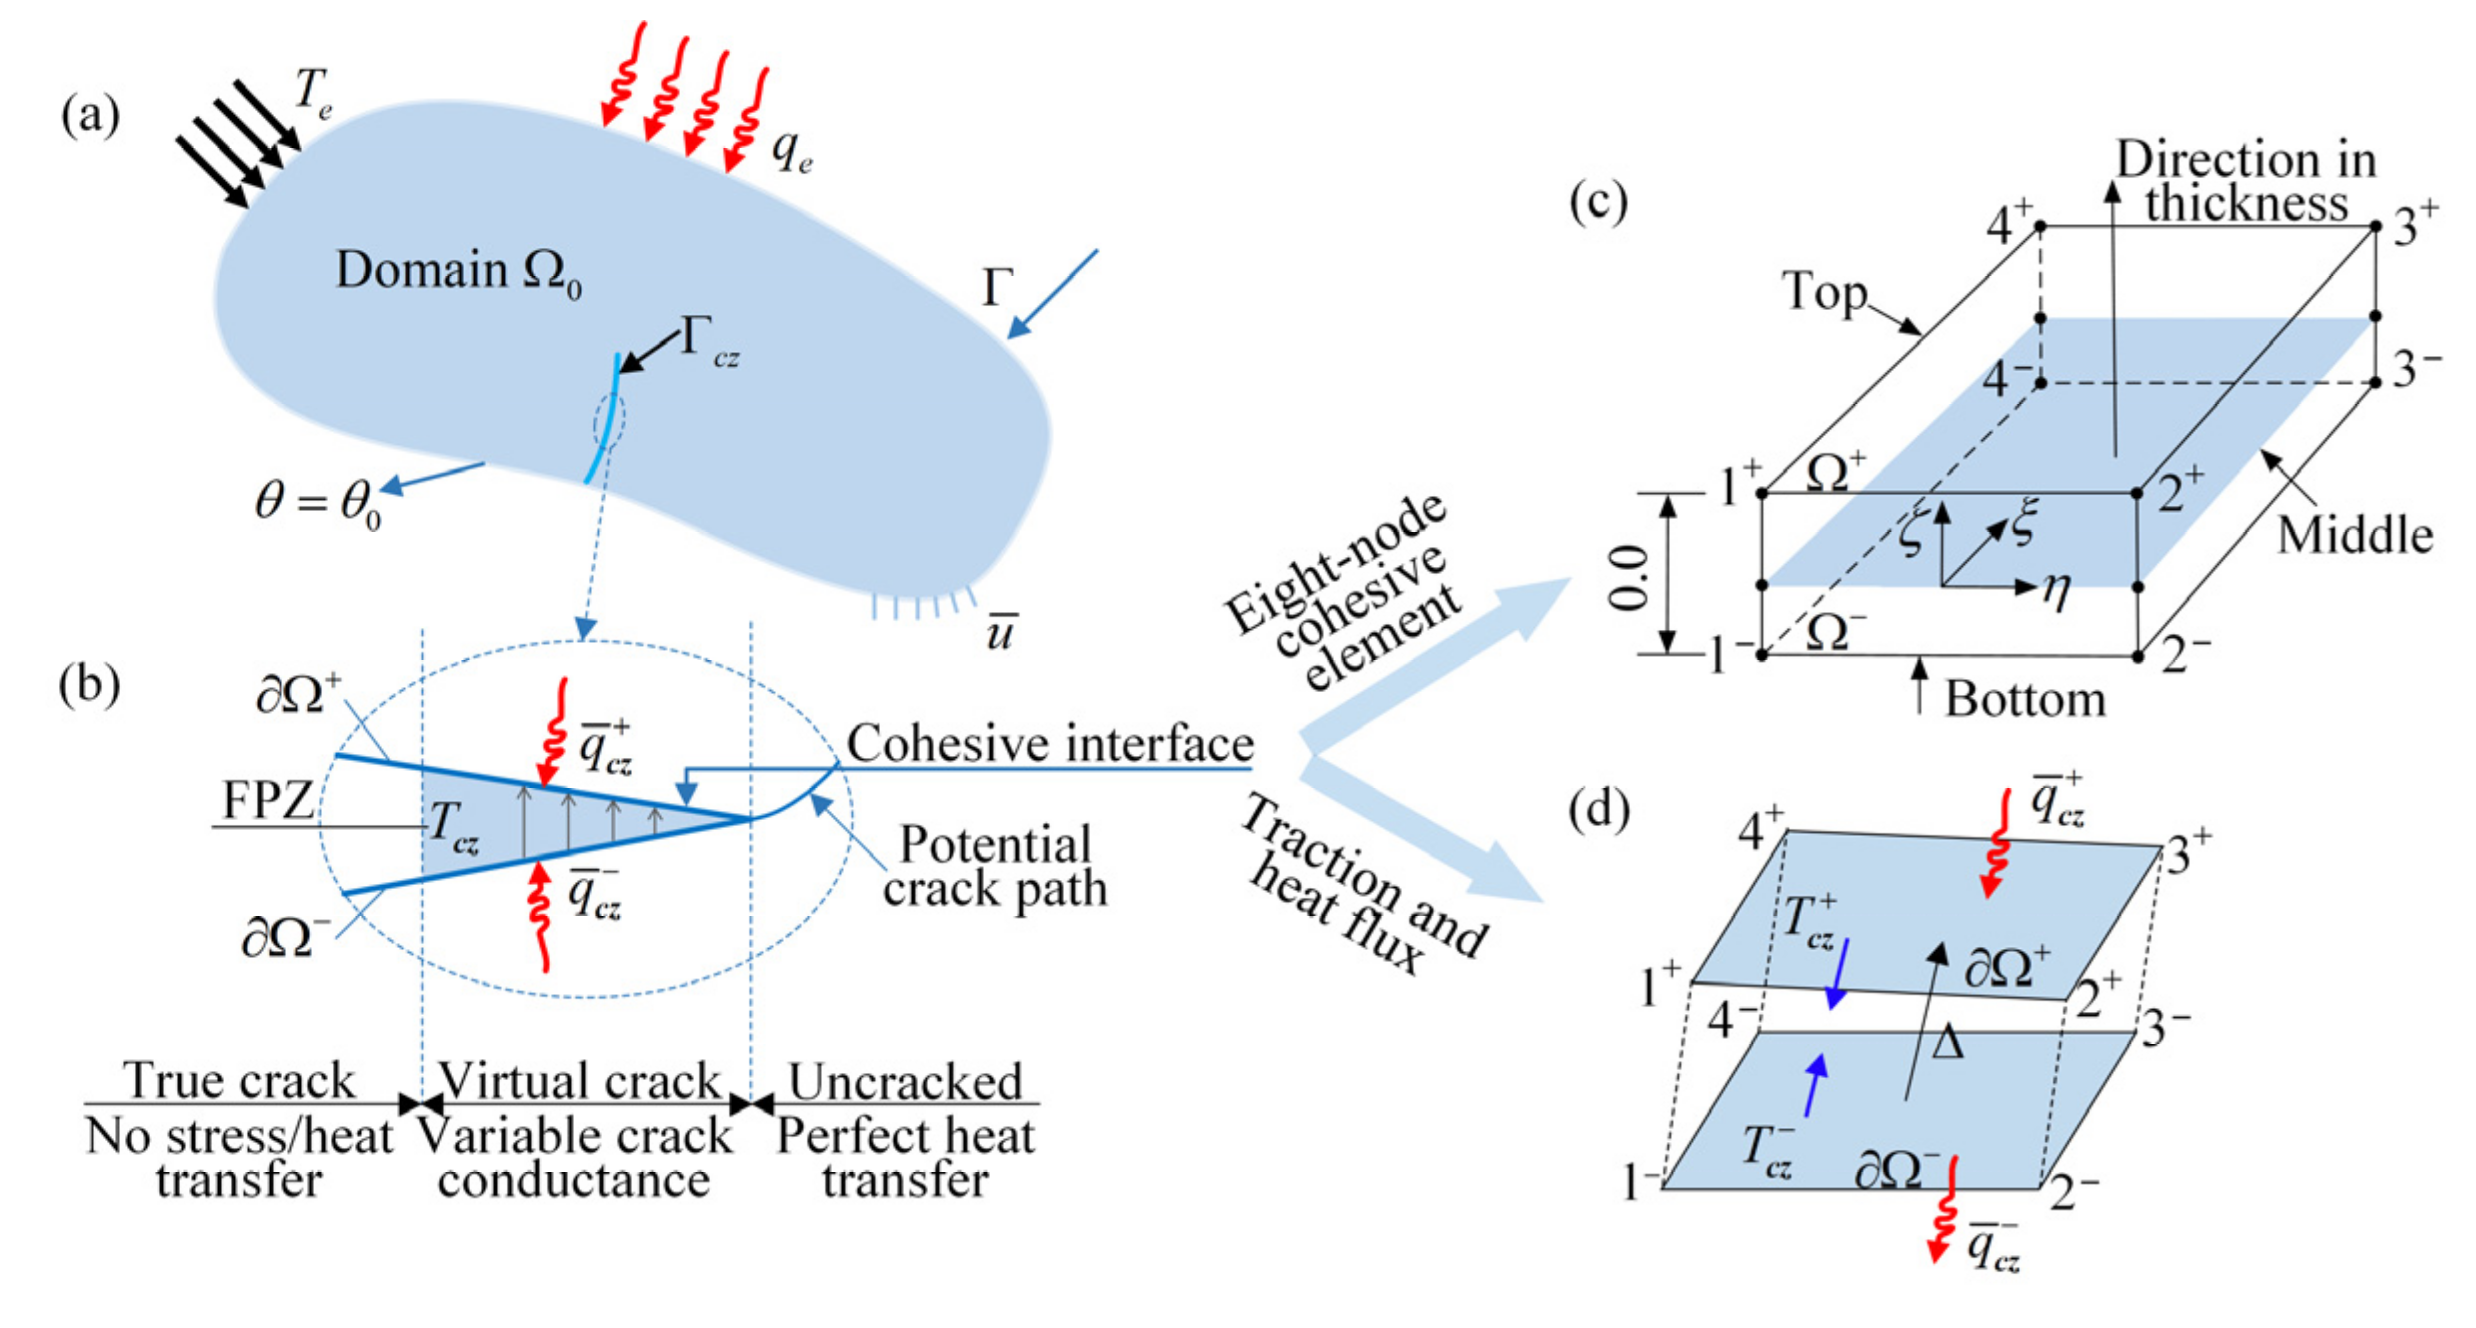
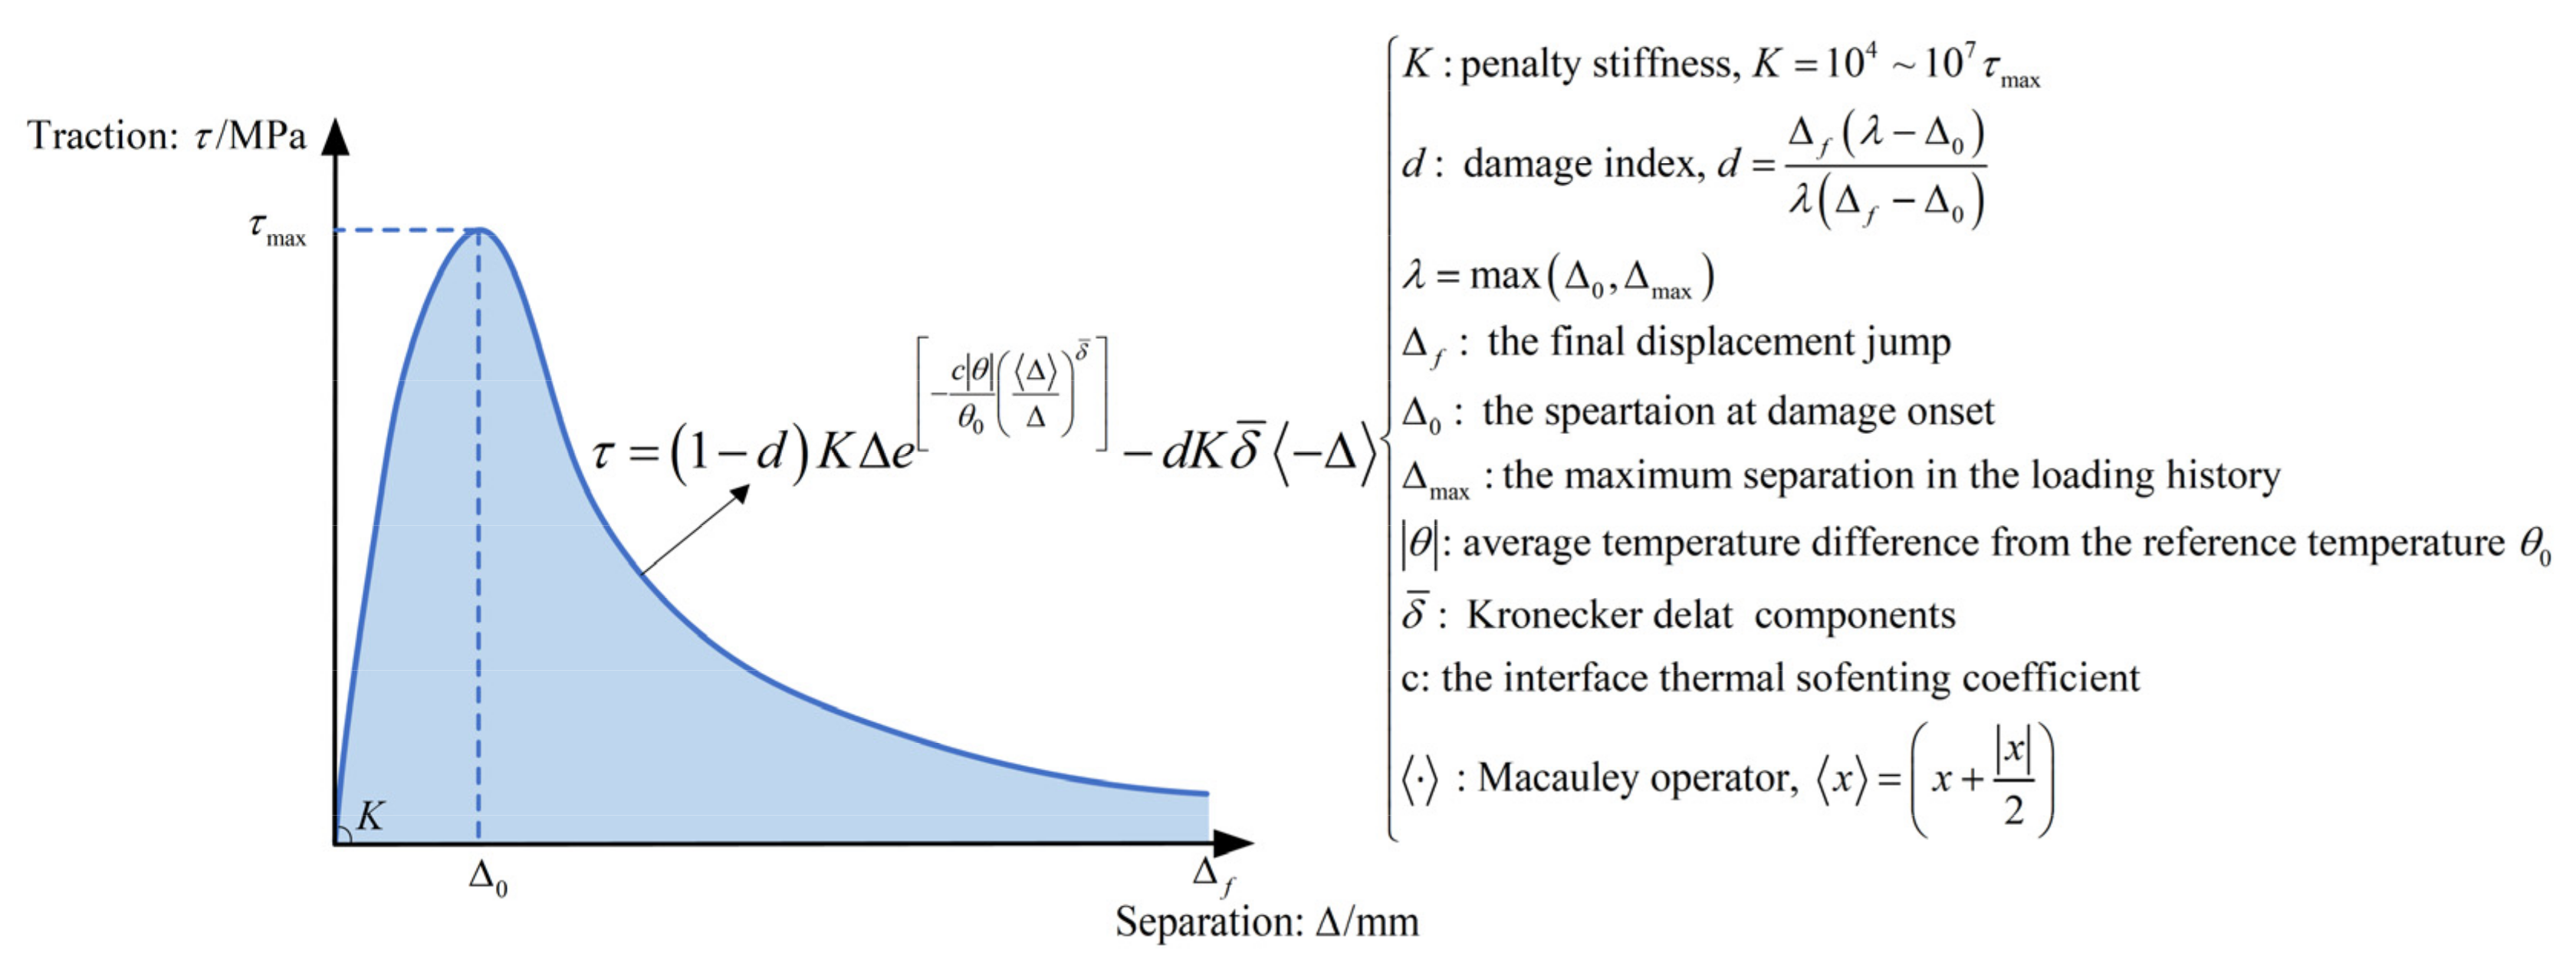
3.1. Thermomechanical Cohesive Zone Model
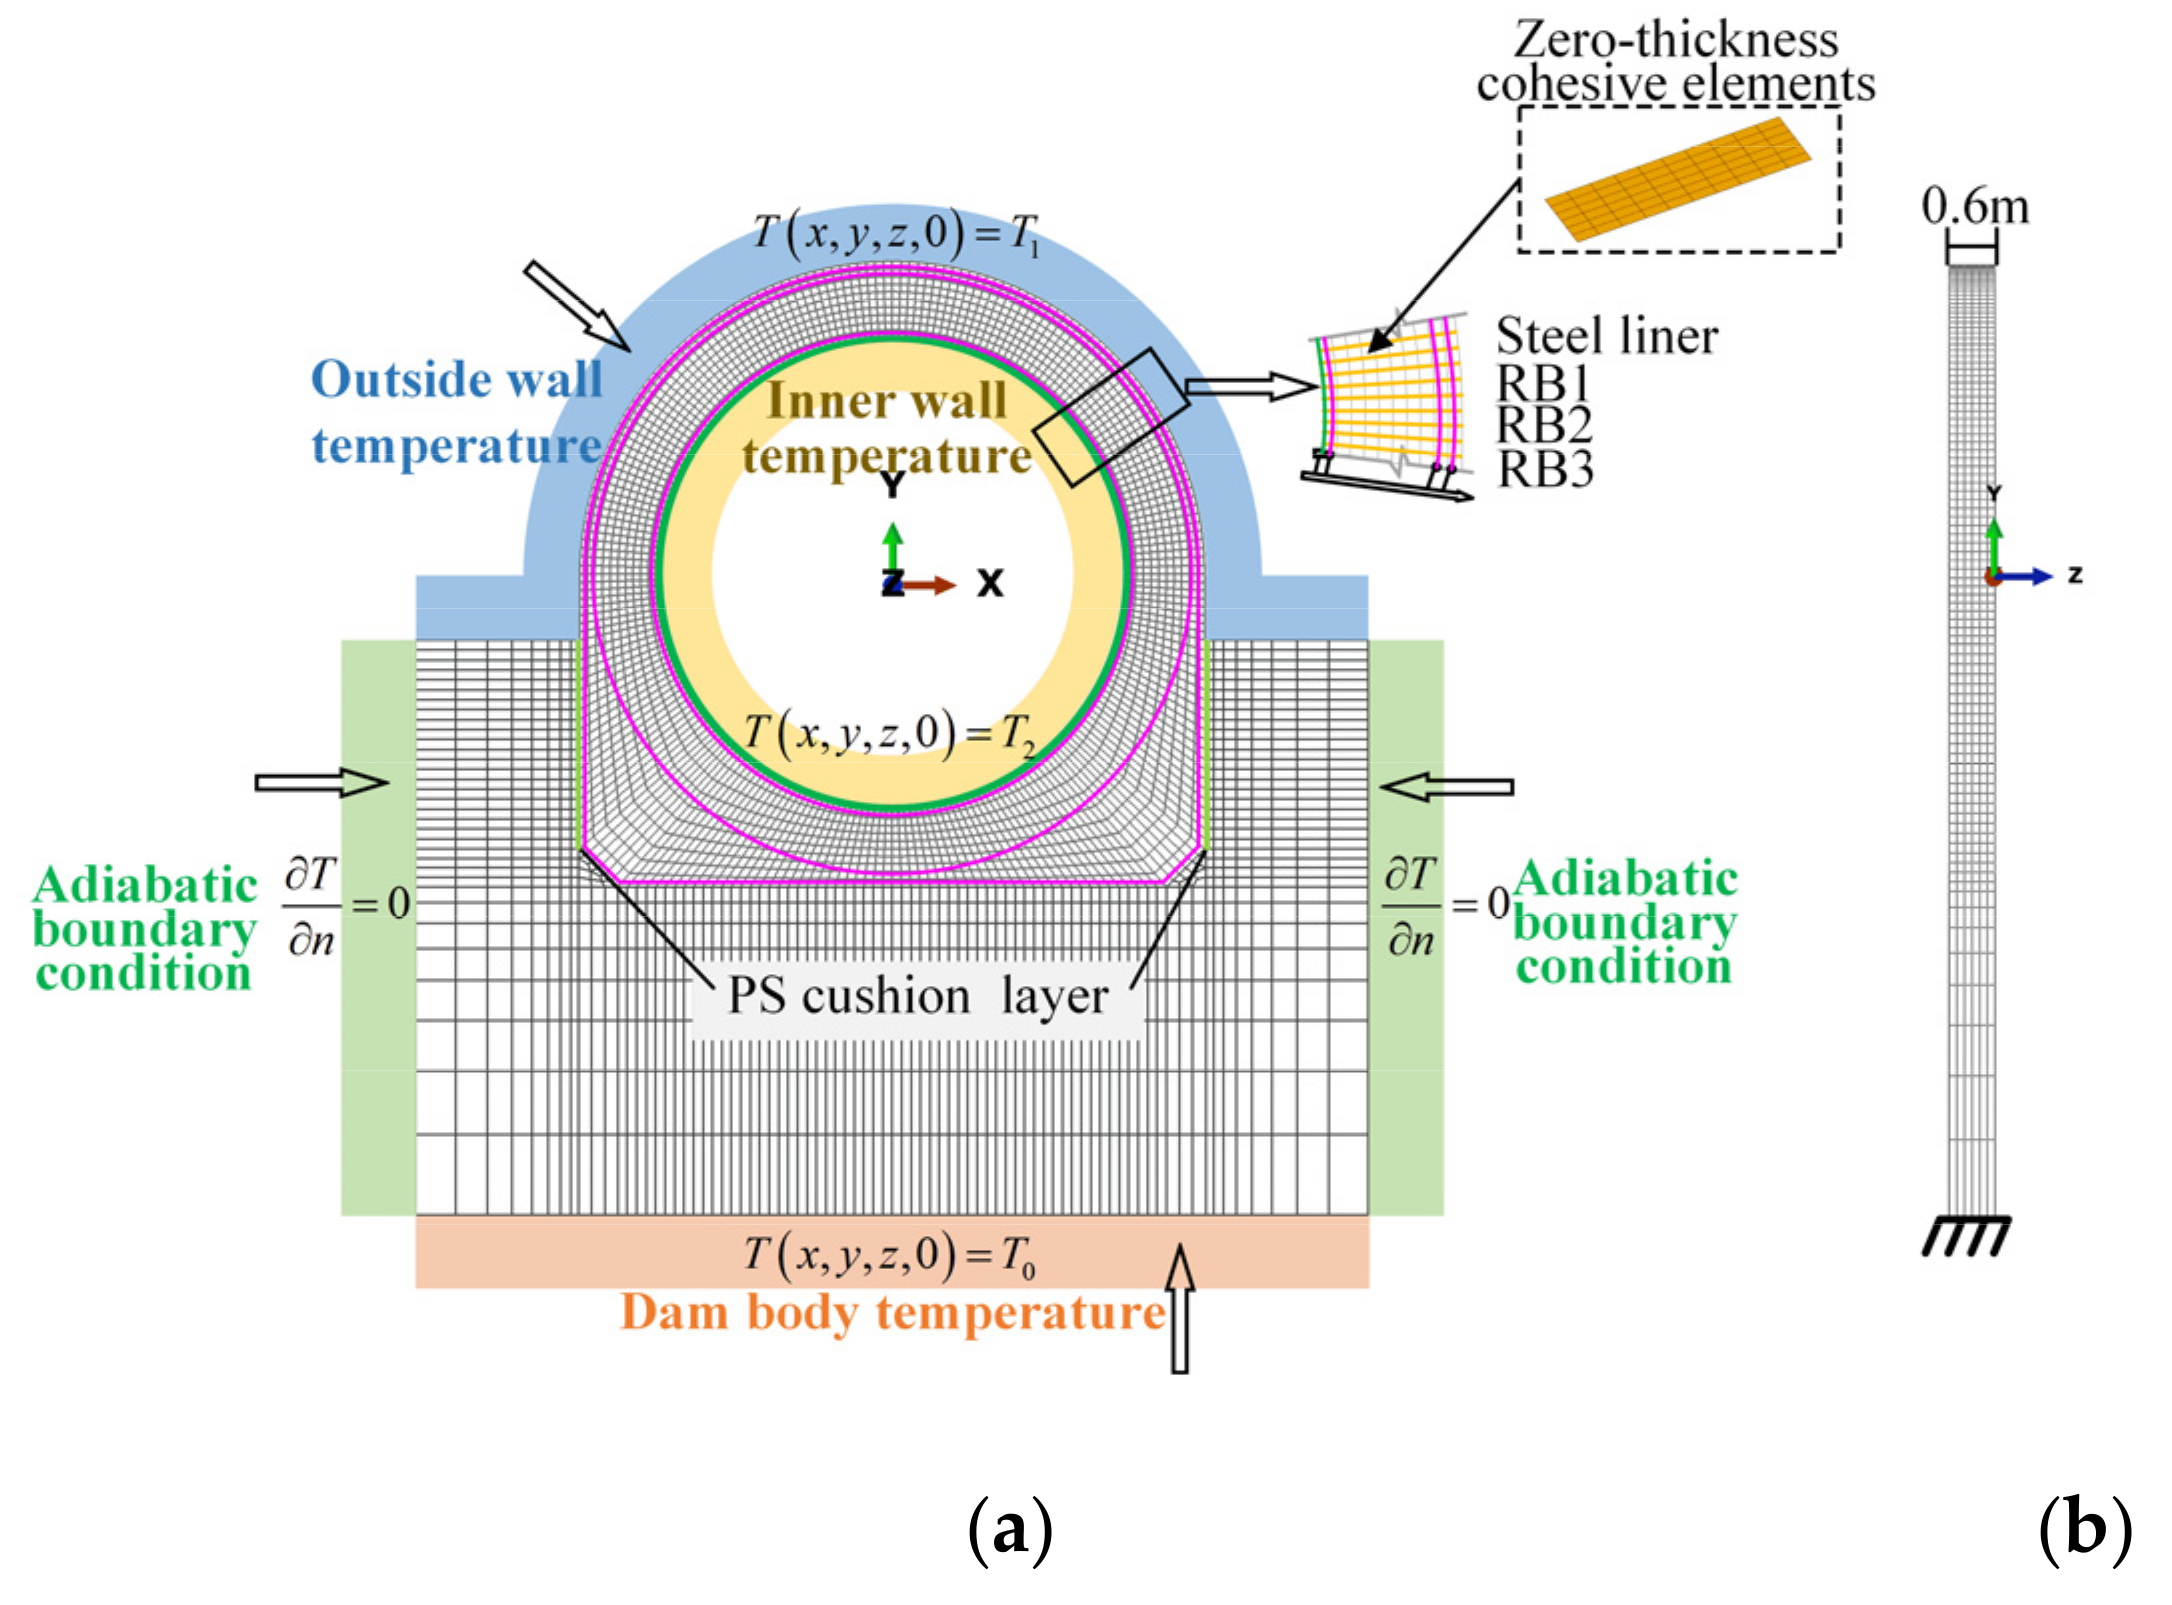
3.2. Finite Element Model
3.3. Structural Behavior
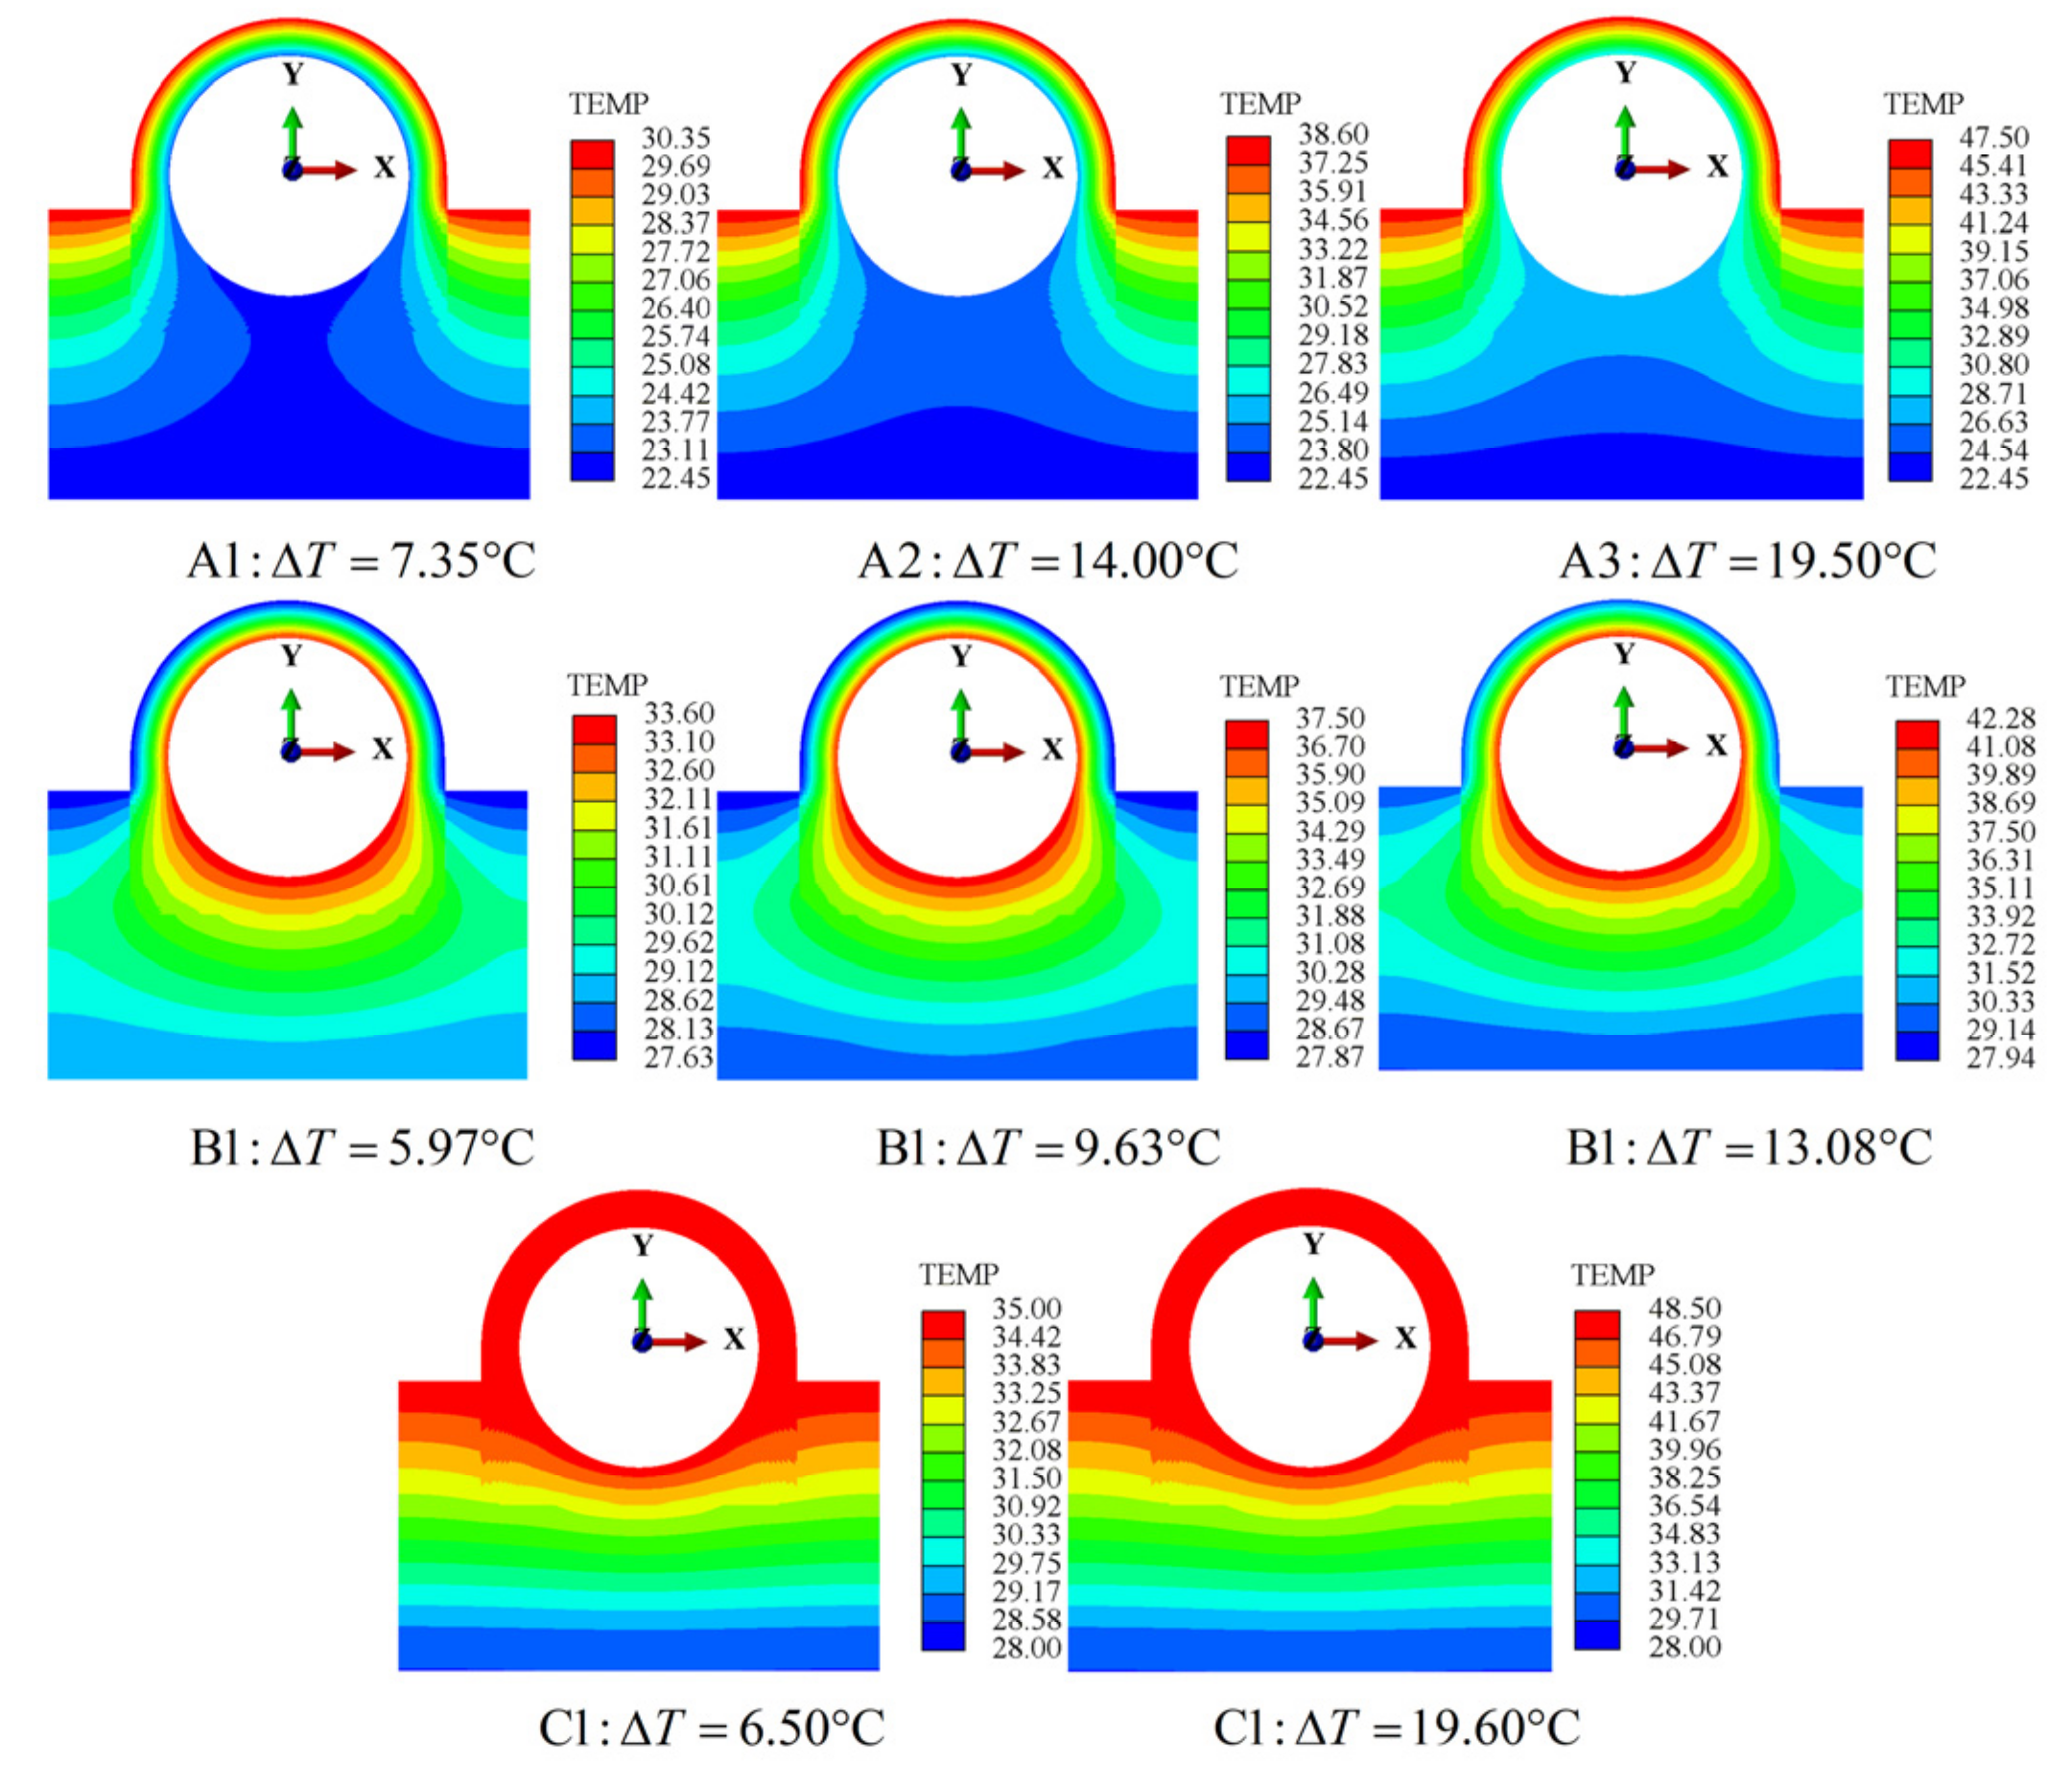
3.3.1. Thermal Crack Width
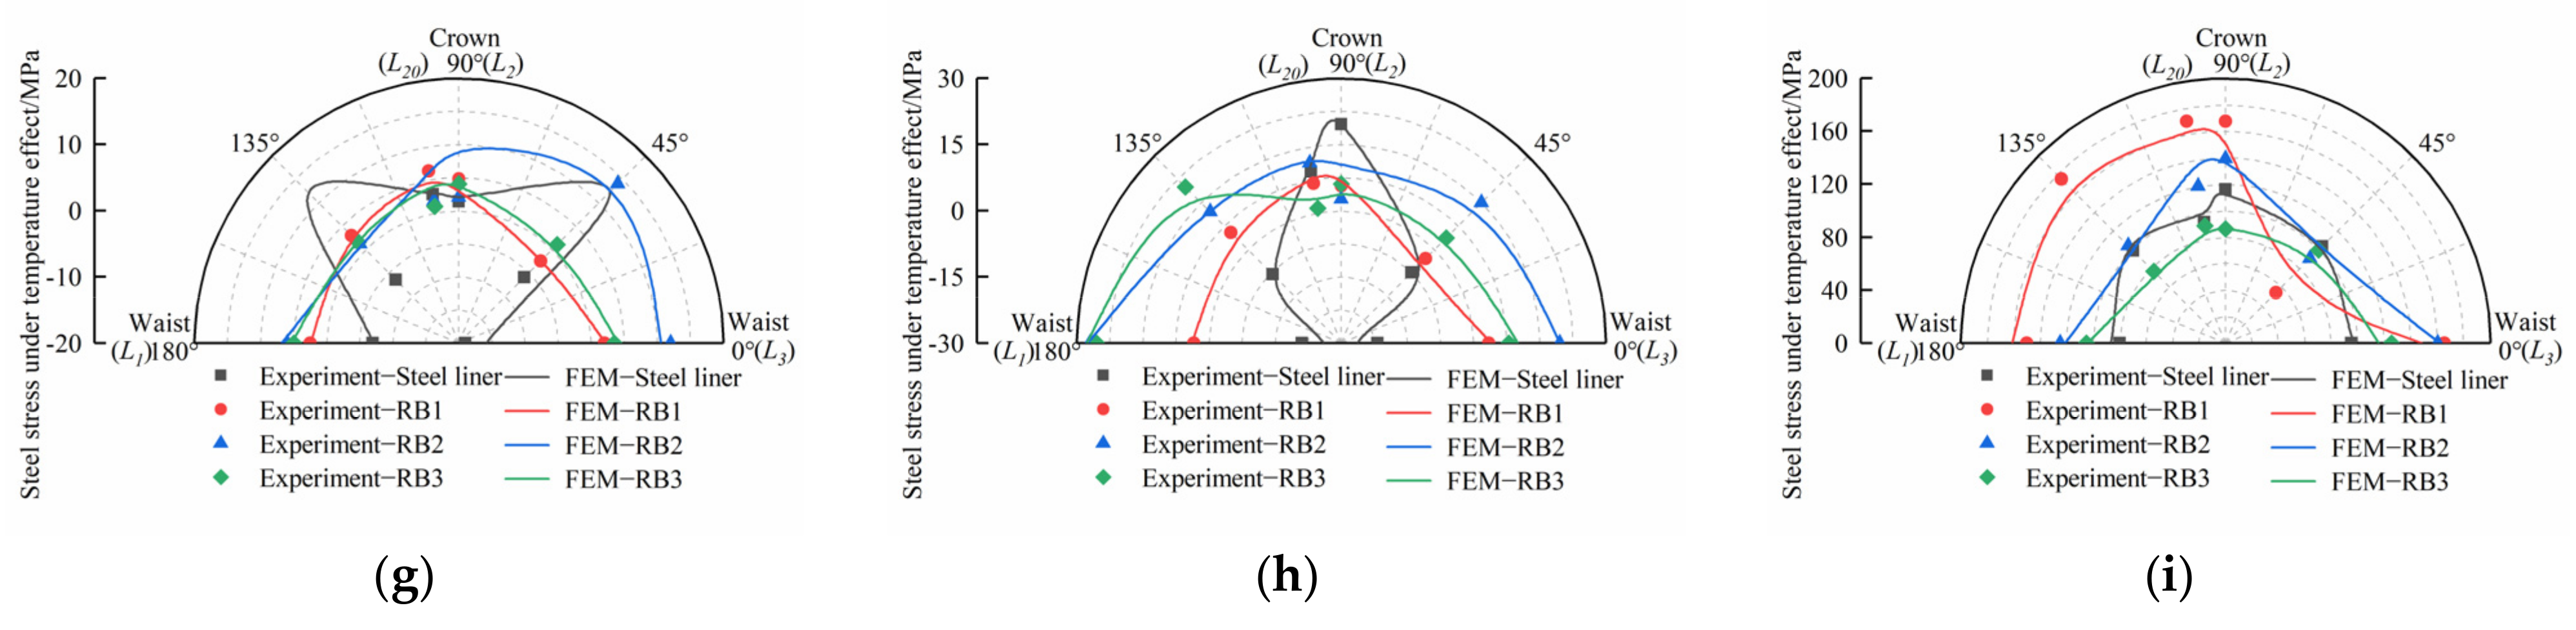
3.3.2. Thermal Stress of Steel
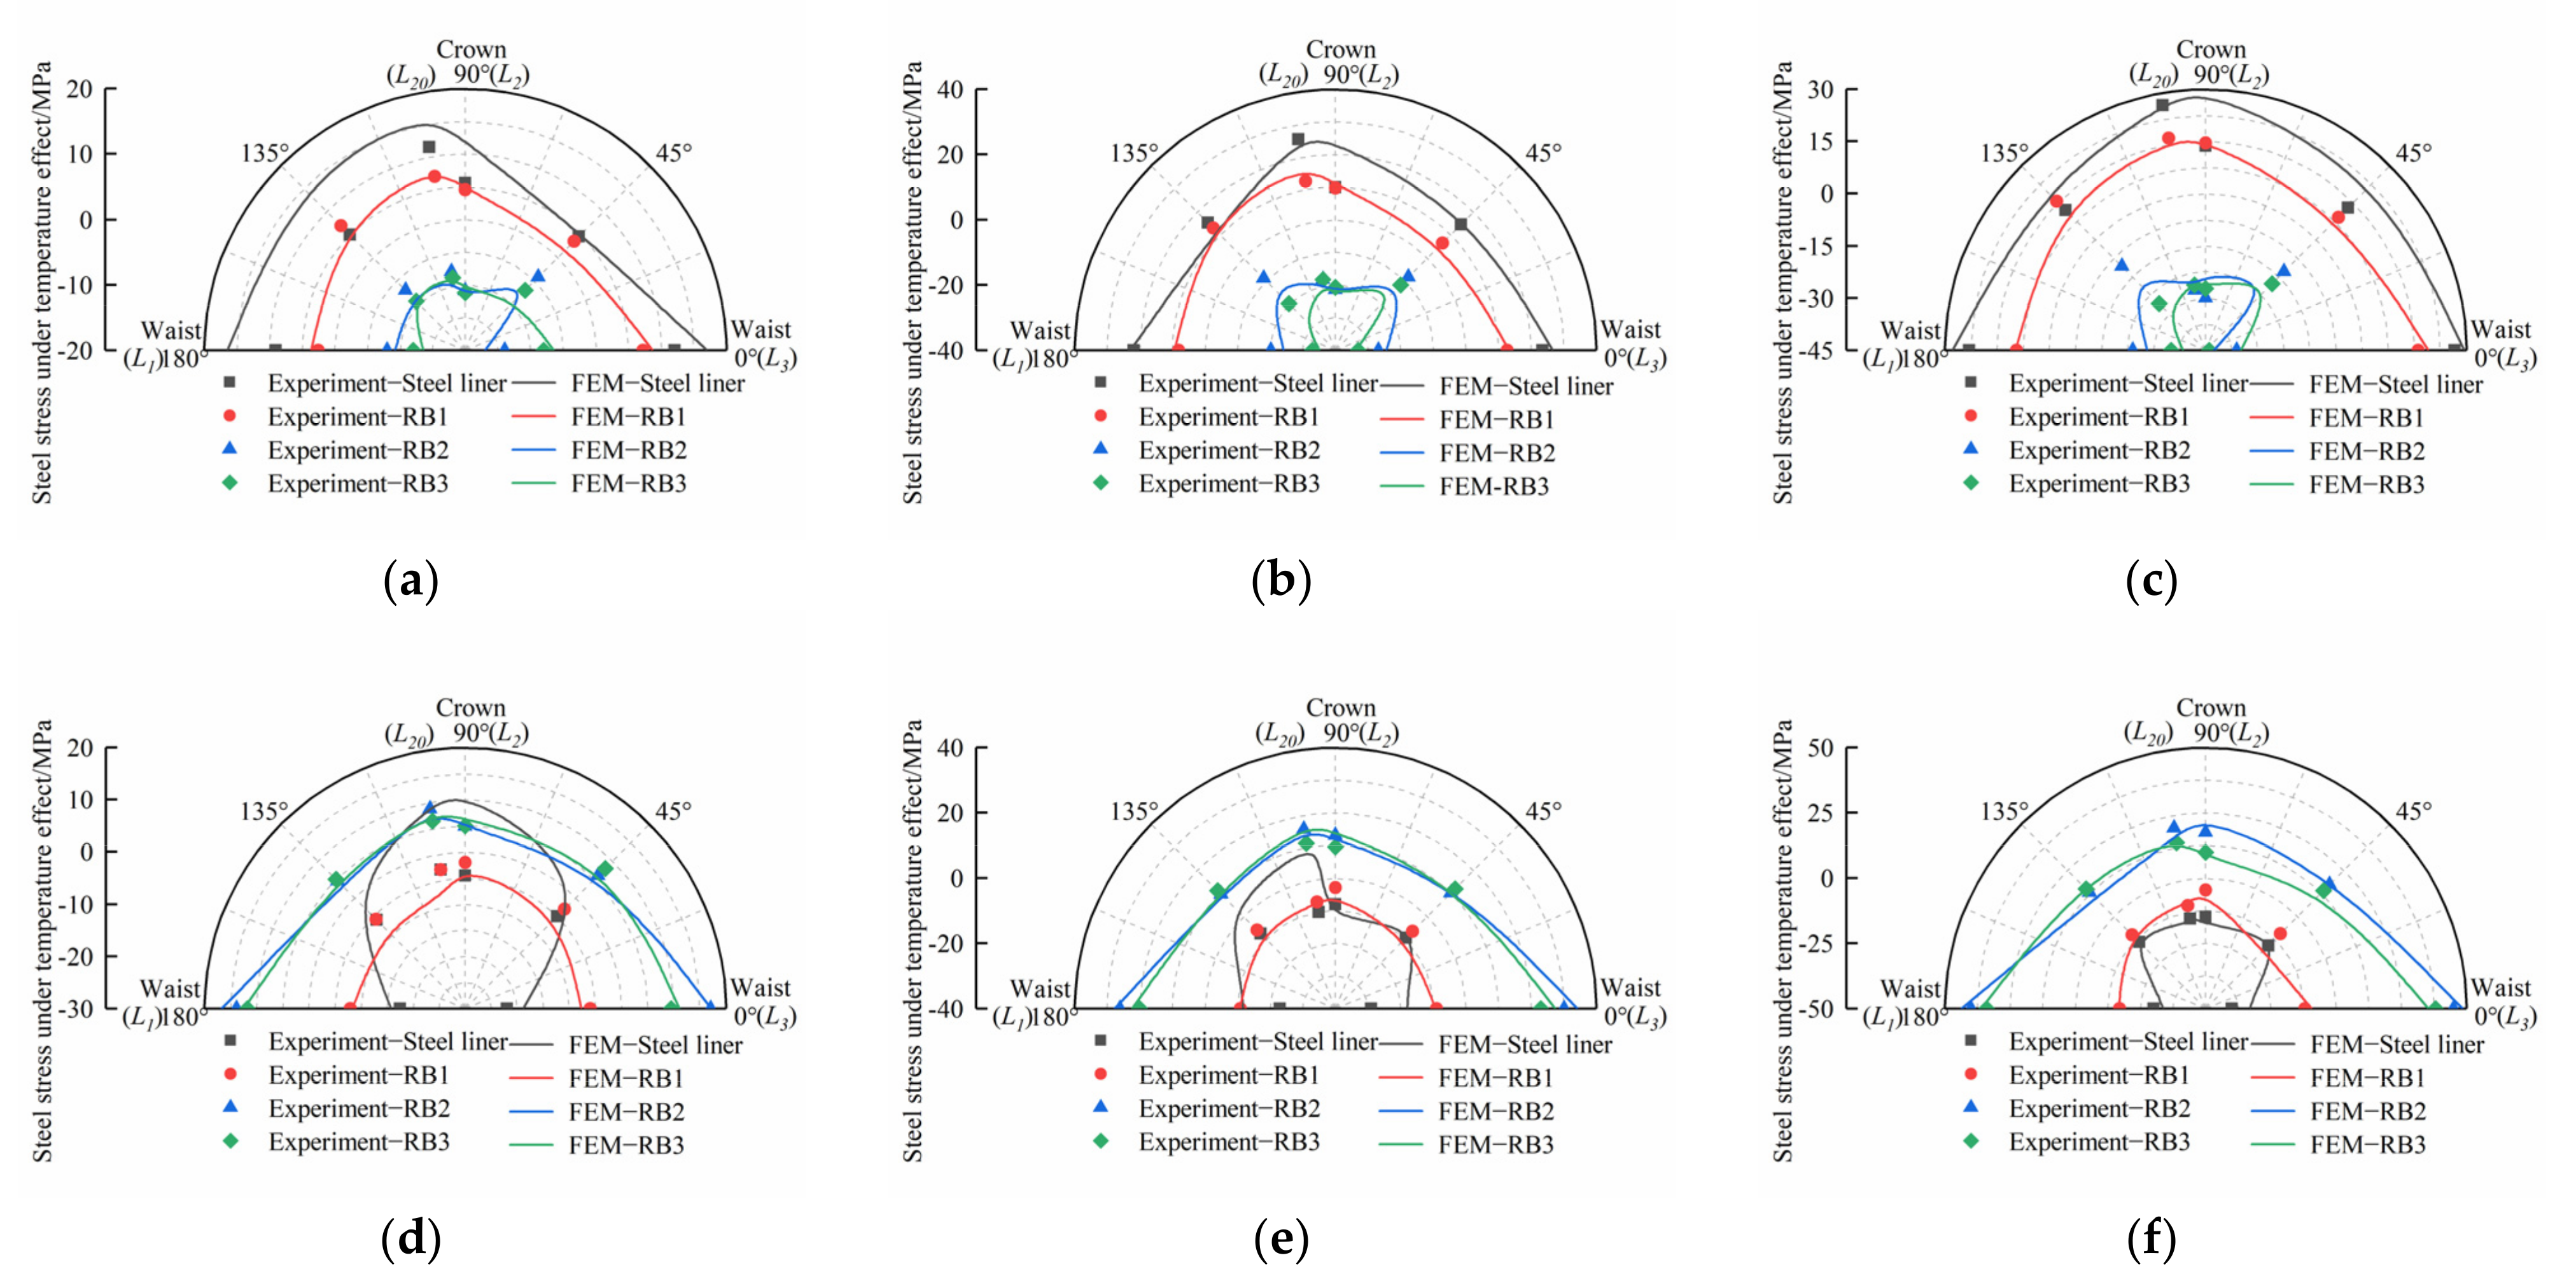
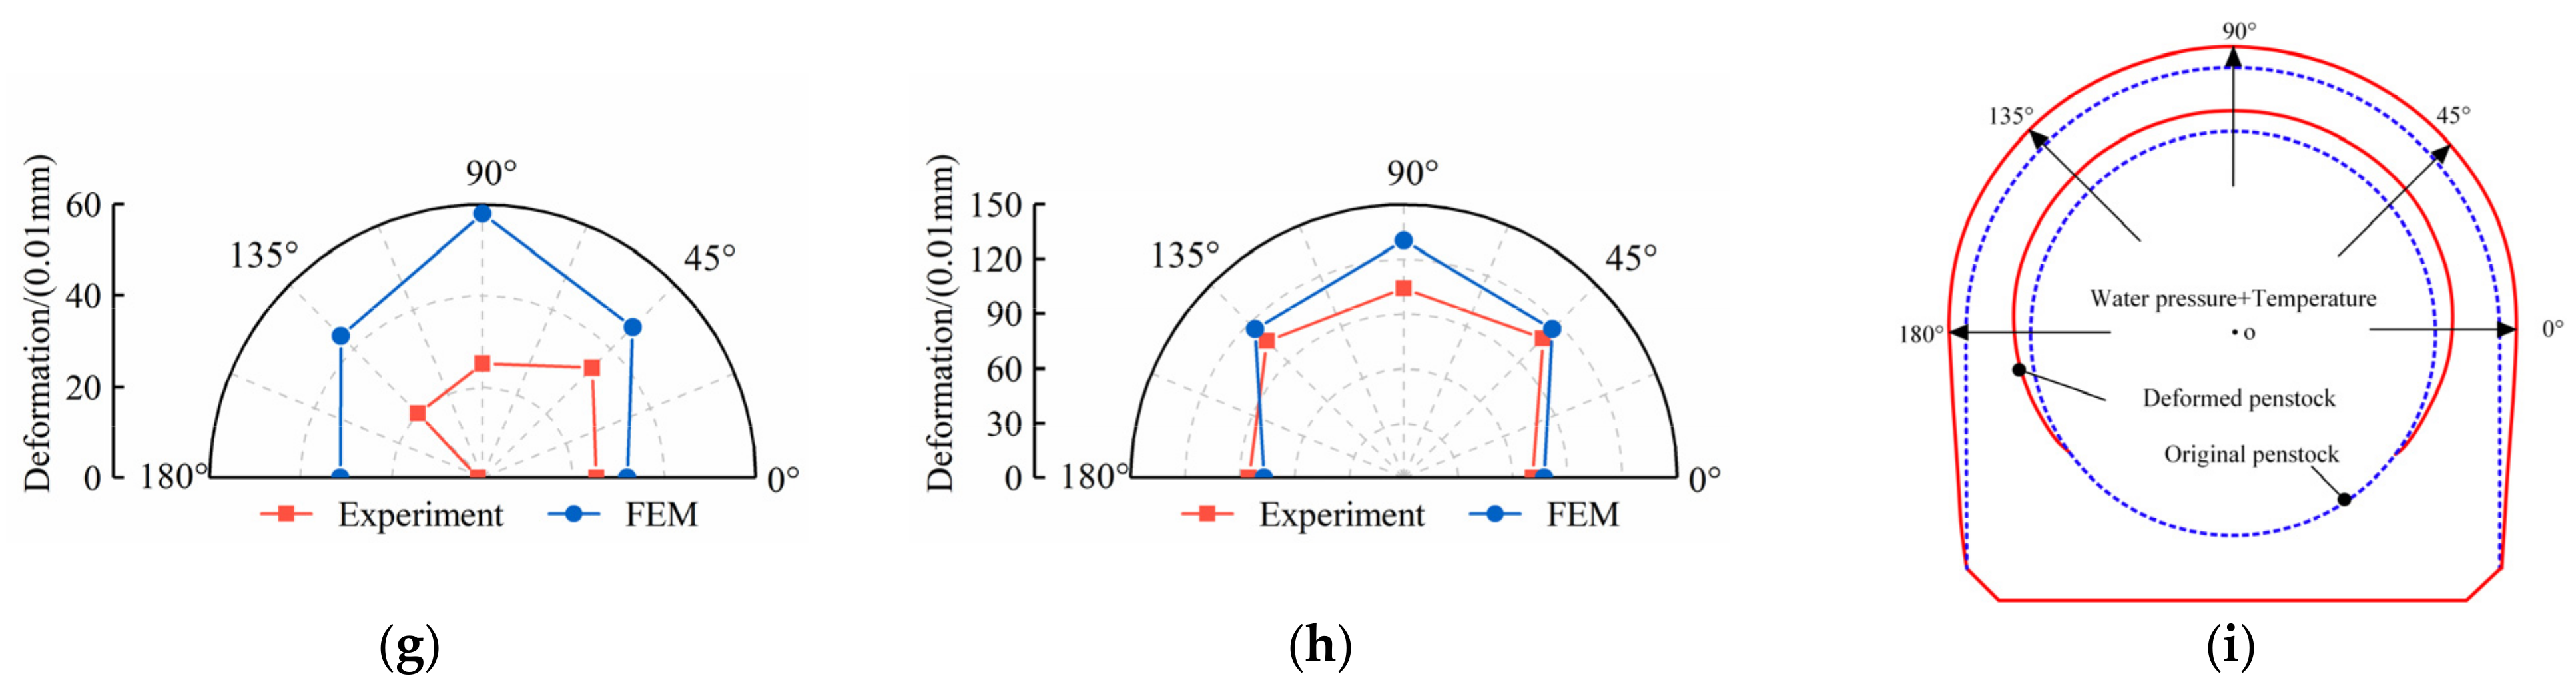
3.3.3. Thermal Radial Displacement
4. Conclusions
Author Contributions
Funding
Institutional Review Board Statement
Informed Consent Statement
Data Availability Statement
Acknowledgments
Conflicts of Interest
References
- Guo, H.; Huang, L.; Song, W.; Wang, X.; Wang, H.; Zhao, X. Evaluation of the Summer Overheating Phenomenon in Reinforced Concrete and Cross Laminated Timber Residential Buildings in the Cold and Severe Cold Regions of China. Energies 2020, 13, 6035. [Google Scholar] [CrossRef]
- Ma, Z.; Shi, C.Z.; Wu, H.G. Numerical Cracking Analysis of Steel-Lined Reinforced Concrete Penstock Based on Cohesive Crack Model. Structures 2021, 34, 4694–4703. [Google Scholar] [CrossRef]
- Su, K.; Yang, Z.J.; Zhang, W.; Wu, H.L.; Zhang, Q.L.; Wu, H.G. Bearing Mechanism of Composite Structure with Reinforced Concrete and Steel Liner: An Application in Penstock. Eng. Struct. 2017, 141, 344–355. [Google Scholar] [CrossRef]
- Wu, H.; Ma, Z.; Shi, C. Overview of Research and Engineering Application of Steel-Lined Reinforced Concrete Penstocks Laid on Downstream Dam Surfaces. Shuili Fadian Xuebao/J. Hydroelectr. Eng. 2020, 39, 1–12. [Google Scholar] [CrossRef]
- El-Leathy, A.; Jeter, S.; Al-Ansary, H.; Abdel-Khalik, S.; Roop, J.; Golob, M.; Danish, S.; Alrished, A.; Djajadiwinata, E.; Al-Suhaibani, Z. Thermal Performance Evaluation of Two Thermal Energy Storage Tank Design Concepts for Use with a Solid Particle Receiver-Based Solar Power Tower. Energies 2014, 7, 8201–8216. [Google Scholar] [CrossRef] [Green Version]
- Gakhova, L.N. Temperature-Induced Stresses in Reinforced Concrete Structures. IOP Conf. Ser. Earth Environ. Sci. 2018, 134, 012021. [Google Scholar] [CrossRef]
- Zhe, D. Methematical Model for the Opening and Closing of the Cracks on the Wall of Steel Lined Reinfocred Concrete Penstocks Due to Thermal Load. J. Hydraul. Eng. 1996, 11, 1–5+13. [Google Scholar]
- Çavdar, A. A Study on the Effects of High Temperature on Mechanical Properties of Fiber Reinforced Cementitious Composites. Compos. Part B Eng. 2012, 43, 2452–2463. [Google Scholar] [CrossRef]
- Abdul-Rahman, M.; Al-Attar, A.A.; Hamada, H.M.; Tayeh, B. Microstructure and Structural Analysis of Polypropylene Fibre Reinforced Reactive Powder Concrete Beams Exposed to Elevated Temperature. J. Build. Eng. 2020, 29, 101167. [Google Scholar] [CrossRef]
- El-Tayeb, E.H.; El-Metwally, S.E.; Askar, H.S.; Yousef, A.M. Thermal Analysis of Reinforced Concrete Beams and Frames. HBRC J. 2017, 13, 8–24. [Google Scholar] [CrossRef] [Green Version]
- Huang, K.F.; Liu, X. La Effects of Temperature Variations on Safety of Reinforced Concrete Structures during Construction. J. Shanghai Jiaotong Univ. 2014, 19, 139–145. [Google Scholar] [CrossRef]
- Yang, P.; Shi, C.; Wu, H.; Liu, F.; Liu, T. Study on Temperature Effect and Thermal Insulation of Dam-Embedded Steel Penstock Encircled by Cushion Layer during Operation Period in Cold Region. Sichuan Daxue Xuebao/J. Sichuan Univ. 2016, 48, 47–54. [Google Scholar] [CrossRef]
- Shi, C.; Wu, H. Damage and Bearing Characteristics of Steel Lined Reinforced Concrete Penstock on Downstream Face of Dam in Hydropower Station. Tianjin Daxue Xuebao/J. Tianjin Univ. Sci. Technol. 2014, 47, 1081–1087. [Google Scholar] [CrossRef]
- Fu, J.Z. Research on the Structure and Crack Width of the Steel-Lined Reinforced Concrete Penstock Laid on Downstream Dam Surfaces; China Water & Power Press: Beijing, China, 2007. [Google Scholar]
- Segurado, J.; LLorca, J. A New Three-Dimensional Interface Finite Element to Simulate Fracture in Composites. Int. J. Solids Struct. 2004, 41, 2977–2993. [Google Scholar] [CrossRef]
- Elices, M.; Guinea, G.V.; Gómez, J.; Planas, J. The Cohesive Zone Model: Advantages, Limitations and Challenges. Eng. Fract. Mech. 2001, 69, 137–163. [Google Scholar] [CrossRef]
- Heidari-Rarani, M.; Ghasemi, A.R. Appropriate Shape of Cohesive Zone Model for Delamination Propagation in ENF Specimens with R-Curve Effects. Theor. Appl. Fract. Mech. 2017, 90, 174–181. [Google Scholar] [CrossRef]
- Edalat Behbahani, A.; Barros, J.A.O.; Ventura-Gouveia, A. Plastic-Damage Smeared Crack Model to Simulate the Behaviour of Structures Made by Cement Based Materials. Int. J. Solids Struct. 2015, 73–74, 20–40. [Google Scholar] [CrossRef] [Green Version]
- Dias-da-Costa, D.; Cervenka, V.; Graça-e-Costa, R. Model Uncertainty in Discrete and Smeared Crack Prediction in RC Beams under Flexural Loads. Eng. Fract. Mech. 2018, 199, 532–543. [Google Scholar] [CrossRef]
- Estay, D.A.; Chiang, L.E. Discrete Crack Model for Simulating Rock Comminution Processes with the Discrete Element Method. Int. J. Rock Mech. Min. Sci. 2013, 60, 125–133. [Google Scholar] [CrossRef]
- Lu, X.; Guo, X.M.; Tan, V.B.C.; Tay, T.E. From Diffuse Damage to Discrete Crack: A Coupled Failure Model for Multi-Stage Progressive Damage of Composites. Comput. Methods Appl. Mech. Eng. 2021, 379, 113760. [Google Scholar] [CrossRef]
- Hattiangadi, A.; Siegmund, T. A Thermomechanical Cohesive Zone Model for Bridged Delamination Cracks. J. Mech. Phys. Solids 2004, 52, 533–566. [Google Scholar] [CrossRef]
- Fleischhauer, R.; Qinami, A.; Hickmann, R.; Diestel, O.; Götze, T.; Cherif, C.; Heinrich, G.; Kaliske, M. A Thermomechanical Interface Description and Its Application to Yarn Pullout Tests. Int. J. Solids Struct. 2015, 69–70, 531–543. [Google Scholar] [CrossRef]
- Jiao, Y.Y.; Zhang, X.L.; Zhang, H.Q.; Li, H.B.; Yang, S.Q.; Li, J.C. A Coupled Thermo-Mechanical Discontinuum Model for Simulating Rock Cracking Induced by Temperature Stresses. Comput. Geotech. 2015, 67, 142–149. [Google Scholar] [CrossRef]
- Cao, G.; Hui, E.; Hu, X. Temperature in the Vicinity Area of Three Gorges Dam since the Three Gorges Reservoir Impounds. J. Hydraul. Eng. 2012, 43, 1254–1259. [Google Scholar] [CrossRef]
- Du, L.-X.; Niu, L.-H.; Huang, T. Analysis of Water Temperature Variation and Its Influence in Three Gorges Reservoir. Express Water Resour. Inf. 2017, 38, 58–63. [Google Scholar] [CrossRef]
- Xie, T.; Ji, D.; Liu, D.; Zhu, G.; Zhang, N. Water Temperature Monitoring of the Head of the Three Gorges Reservoir and Preliminary Analysis. Resour. Environ. Yangtze Basin 2013, 22, 1201–1206. [Google Scholar]
- Ji, D.; Cheng, Z.; Long, L.; Yan, J.; Yang, Z. The Characteristics of Thermal Stratification in the Head Area of the Three Gorges Reservoir and Ecological Effects in Different Operation Periods. Water Resour. Prot. 2022. Available online: https://kns.cnki.net/kcms/detail/32.1356.TV.20220221.1412.005.html (accessed on 1 March 2022).
- Wang, Y.; Li, G.; Guo, Z.; Guo, Z. Spatial-Temporal Analysis of Monthly Air Temperature Changes from 1979–2014 in the Three Gorges Dam Region. Yaogan Xuebao/J. Remote Sens. 2018, 22, 487–496. [Google Scholar] [CrossRef]
- Wang, R.; Tan, Y. Simulation and Projection of Temperature Change in Three Gorges Reservoir Based on High-Resolution Regional Climate Model. Meteorol. Sci. Technol. 2017, 45, 469–476+491. [Google Scholar]
- Qin, Q.S. During Variation of Air Temperature in the Three Gorges Reservoir. Meteorol. Sci. Technol. 2002, 30, 304–305. [Google Scholar]
- Dugdale, D.S. Yielding of Steel Sheets Containing Slits. J. Mech. Phys. Solids 1960, 8, 100–104. [Google Scholar] [CrossRef]
- Barenblatt, G.I. The Mathematical Theory of Equilibrium Cracks in Brittle Fracture. Adv. Appl. Mech. 1962, 7, 55–129. [Google Scholar]
- Paggi, M.; Wriggers, P. A Nonlocal Cohesive Zone Model for Finite Thickness Interfaces—Part II: FE Implementation and Application to Polycrystalline Materials. Comput. Mater. Sci. 2011, 50, 1634–1643. [Google Scholar] [CrossRef]
- Hadjazi, K.; Sereir, Z.; Amziane, S. Cohesive Zone Model for the Prediction of Interfacial Shear Stresses in a Composite-Plate RC Beam with an Intermediate Flexural Crack. Compos. Struct. 2012, 94, 3574–3582. [Google Scholar] [CrossRef]
- Alam, S.Y.; Kotronis, P.; Loukili, A. Crack Propagation and Size Effect in Concrete Using a Non-Local Damage Model. Eng. Fract. Mech. 2013, 109, 246–261. [Google Scholar] [CrossRef] [Green Version]
- Wu, L.; Tjahjanto, D.; Becker, G.; Makradi, A.; Jérusalem, A.; Noels, L. A Micro-Meso-Model of Intra-Laminar Fracture in Fiber-Reinforced Composites Based on a Discontinuous Galerkin/Cohesive Zone Method. Eng. Fract. Mech. 2013, 104, 162–183. [Google Scholar] [CrossRef] [Green Version]
- Willam, K.; Rhee, I.; Shing, B. Interface Damage Model for Thermomechanical Degradation of Heterogeneous Materials. Comput. Methods Appl. Mech. Eng. 2004, 193, 3327–3350. [Google Scholar] [CrossRef]
- Peng, X.; Yong, H.; Zhang, X.; Zhou, Y. Analysis of Delamination and Heat Conductivity of Epoxy Impregnated Pancake Coils Using a Cohesive Zone Model. Eng. Fract. Mech. 2021, 245, 107555. [Google Scholar] [CrossRef]
- Shu, W.; Stanciulescu, I. Fully Coupled Thermo-Mechanical Cohesive Zone Model with Thermal Softening: Application to Nanocomposites. Int. J. Solids Struct. 2020, 188–189, 1–11. [Google Scholar] [CrossRef]
- Zreid, I.; Fleischhauer, R.; Kaliske, M. A Thermomechanically Coupled Viscoelastic Cohesive Zone Model at Large Deformation. Int. J. Solids Struct. 2013, 50, 4279–4291. [Google Scholar] [CrossRef] [Green Version]
- Fagerström, M.; Larsson, R. A Thermo-Mechanical Cohesive Zone Formulation for Ductile Fracture. J. Mech. Phys. Solids 2008, 56, 3037–3058. [Google Scholar] [CrossRef]
- Benabou, L.; Sun, Z.; Dahoo, P.R. A Thermo-Mechanical Cohesive Zone Model for Solder Joint Lifetime Prediction. Int. J. Fatigue 2013, 49, 18–30. [Google Scholar] [CrossRef]
- Svolos, L.; Bronkhorst, C.A.; Waisman, H. Thermal-Conductivity Degradation across Cracks in Coupled Thermo-Mechanical Systems Modeled by the Phase-Field Fracture Method. J. Mech. Phys. Solids 2020, 137, 103861. [Google Scholar] [CrossRef]
- Al-Amin, M.R.; Amin, M.R.; Sagor, R.H. Numerical Verification of the Dispersion Relation of Trapezoidally Corrugated Slow Wave Structure for Backward Wave Oscillators. IET Microw. Antennas Propag. 2018, 12, 313–319. [Google Scholar] [CrossRef]
- Fleischhauer, R.; Behnke, R.; Kaliske, M. A Thermomechanical Interface Element Formulation for Finite Deformations. Comput. Mech. 2013, 52, 1039–1058. [Google Scholar] [CrossRef]
- Van Mier, J.G.M.; Van Vliet, M.R.A. Influence of Microstructure of Concrete on Size/Scale Effects in Tensile Fracture. Eng. Fract. Mech. 2003, 70, 2281–2306. [Google Scholar] [CrossRef]
- Li, Y.; Wang, J.-Z.K. Reliability Analysis of Crack Control Standard for Steel Lined Reinforced Concrete Penstock. Yangtze River 2018, 49, 103–107. [Google Scholar] [CrossRef]


| Material | Elastic (MPa) | Poisson Ratio | Compression Strength (MPa) | Tensile Strength (MPa) | Liner Coefficient Expansion | Specific Heat (kJ/kg·°C) | Heat Conductivity (W/(m·K) |
|---|---|---|---|---|---|---|---|
| Concrete of penstock | 29,000 | 0.17 | 20.20 | 1.78 | 1.00 × 10⁻⁵ | 0.96 | 1.28 |
| Concrete of dam | 24,000 | 0.17 | 14.60 | 1.00 | 1.00 × 10⁻⁵ | 0.96 | 1.28 |
| Steel liner | 198,000 | 0.30 | 350 1 | 350 1 | 1.20 × 10⁻⁵ | 0.46 | 60.00 |
| Reinforcement | 205,000 | 0.30 | 375 1 | 375 1 | 1.20 × 10⁻⁵ | 0.46 | 60.00 |
| PS cushion layer | 0.4 | 0.30 | / | / | 8.00 × 10⁻⁵ | 1.30 | 0.028 |
| Crack Location | L1 | L2 | L3 | |||||||
|---|---|---|---|---|---|---|---|---|---|---|
| Inner | Middle | Outer | Inner | Middle | Outer | Inner | Middle | Outer | ||
| P/MPa | 7.80 | 30.00 | 20.40 | 10.00 | 42.30 | 13.20 | 8.84 | 48.80 | 15.70 | |
| Temperature field A | ΔT = 7.35 °C | 2.20 | 0.50 | −0.50 | 2.50 | 1.00 | −0.50 | 8.00 | 1.00 | −0.80 |
| ΔT = 14.00 °C | 2.20 | 0.00 | −1.00 | 3.20 | 0.80 | −1.00 | 8.70 | 1.10 | −1.00 | |
| ΔT = 19.50 °C | 3.50 | 1.00 | −1.00 | 5.00 | 2.00 | −1.00 | 9.50 | 1.00 | −2.00 | |
| Temperature field B | ΔT = 5.97 °C | −1.00 | 3.00 | 1.00 | 0.00 | 1.00 | 1.00 | 0.00 | 2.00 | 1.00 |
| ΔT = 9.63 °C | −1.00 | 2.50 | 3.00 | 0.50 | 2.00 | 2.00 | 0.00 | 5.50 | 3.00 | |
| ΔT = 13.08 °C | −1.00 | 3.50 | 4.00 | 1.00 | 3.00 | 2.50 | 0.00 | 8.00 | 4.50 | |
| Temperature field C | ΔT = 6.50 °C | 0.00 | 1.00 | 1.00 | 1.20 | 2.00 | 0.00 | 0.00 | 4.00 | 1.00 |
| ΔT = 19.60 °C | 0.00 | 5.00 | 5.00 | 4.80 | 5.00 | 2.00 | 0.00 | 8.60 | 3.00 | |
| Crack Location | Gradients/°C | Steel Liner | RB1 | RB2 | RB3 |
|---|---|---|---|---|---|
| L1 | 7.35 | 9.00 | 2.50 | −8.00 | −12.00 |
| 14.00 | 20.50 | 7.80 | −20.50 | −29.00 | |
| 19.50 | 23.00 | 9.30 | −24.00 | −35.00 | |
| L2 | 7.35 | 5.50 | 4.50 | −10.90 | −11.20 |
| 14.00 | 10.00 | 9.80 | −21.50 | −20.80 | |
| 19.50 | 13.60 | 14.50 | −30.00 | −27.20 | |
| L3 | 7.35 | 12.00 | 7.20 | −14.00 | −8.00 |
| 14.00 | 23.50 | 12.70 | −26.70 | −33.00 | |
| 19.50 | 26.50 | 16.00 | −36.00 | −44.00 |
| Crack Location | Gradients/°C | Steel Liner | RB1 | RB2 | RB3 |
|---|---|---|---|---|---|
| L1 | 5.97 | −17.50 | −8.00 | 13.80 | 11.80 |
| 9.63 | −23.00 | −10.80 | 26.00 | 20.00 | |
| 13.08 | −30.00 | −17.00 | 40.00 | 34.00 | |
| L2 | 5.97 | −4.50 | −2.00 | 4.90 | 5.00 |
| 9.63 | −8.00 | −3.00 | 13.00 | 9.60 | |
| 13.08 | −15.00 | −4.50 | 17.50 | 9.80 | |
| L3 | 5.97 | −22.00 | −6.00 | 17.00 | 9.50 |
| 9.63 | −29.00 | −9.00 | 30.00 | 23.00 | |
| 13.08 | −40.00 | −12.00 | 45.00 | 38.00 |
| Crack Location | Gradients/°C | Steel liner | RB1 | RB2 | RB3 |
|---|---|---|---|---|---|
| L1 | 6.50 | −7.00 | 2.50 | 6.00 | 5.00 |
| 19.60 | −21.00 | 3.50 | 27.00 | 25.50 | |
| L2 | 6.50 | 1.40 | 4.80 | 2.00 | 4.00 |
| 19.60 | 19.60 | 5.60 | 2.60 | 6.00 | |
| L3 | 6.50 | −19.00 | 2.00 | 12.00 | 3.50 |
| 19.60 | −21.80 | 3.50 | 19.50 | 8.00 |
Publisher’s Note: MDPI stays neutral with regard to jurisdictional claims in published maps and institutional affiliations. |
© 2022 by the authors. Licensee MDPI, Basel, Switzerland. This article is an open access article distributed under the terms and conditions of the Creative Commons Attribution (CC BY) license (https://creativecommons.org/licenses/by/4.0/).
Share and Cite
Ma, Z.; Shi, C.; Wu, H.; Liu, S. Structural Behavior of Massive Reinforced Concrete Structures Exposed to Thermomechanical Loads. Energies 2022, 15, 2671. https://doi.org/10.3390/en15072671
Ma Z, Shi C, Wu H, Liu S. Structural Behavior of Massive Reinforced Concrete Structures Exposed to Thermomechanical Loads. Energies. 2022; 15(7):2671. https://doi.org/10.3390/en15072671
Chicago/Turabian StyleMa, Zhu, Changzheng Shi, Hegao Wu, and Songzi Liu. 2022. "Structural Behavior of Massive Reinforced Concrete Structures Exposed to Thermomechanical Loads" Energies 15, no. 7: 2671. https://doi.org/10.3390/en15072671
APA StyleMa, Z., Shi, C., Wu, H., & Liu, S. (2022). Structural Behavior of Massive Reinforced Concrete Structures Exposed to Thermomechanical Loads. Energies, 15(7), 2671. https://doi.org/10.3390/en15072671