Article

Challenges of Hydrological Engineering Design in Degrading Permafrost Environment of Russia

by
Olga Makarieva
1,2,*,
Nataliia Nesterova
1,2,3,
Ali Torabi Haghighi
4,
Andrey Ostashov
1 and
Anastasiia Zemlyanskova
1,2
1
Melnikov Permafrost Institute, Magadan 677010, Russia
2
Institute of Earth Sciences, Saint Petersburg University, Saint Petersburg 199034, Russia
3
State Hydrological Institute, Saint Petersburg 199004, Russia
4
Water Energy and Environmental Engineering Research Unit, University of Oulu, 90570 Oulu, Finland
*
Author to whom correspondence should be addressed.
Energies 2022, 15(7), 2649; https://doi.org/10.3390/en15072649
Submission received: 28 February 2022 / Revised: 24 March 2022 / Accepted: 30 March 2022 / Published: 4 April 2022

Abstract

:
The study shows that the current network of hydrometeorological observation in the permafrost zone of Russia is insufficient to provide data for the statistical approaches adopted at the state level for engineering surveys and calculations. The alternative to the financially costly and practically impossible expansion of the monitoring network is the development of hydrological research stations and the implementation of new methods for calculating streamflow characteristics based on mathematical modeling. The data of the Kolyma Water-Balance Station, the first research basin in the world in a permafrost environment (1948–1997), and the process-based hydrological model Hydrograph are applied to simulate streamflow hydrographs in remote mountainous permafrost basins. The satisfactory results confirm that mathematical modeling may substitute or replace statistical approaches in the conditions of extreme data insufficiency. The improvement of the models in a changing climate requires the renewal of historical observations at currently abandoned research stations in Russian permafrost regions. The study is important for forming the state policy in climate change adaptation and mitigation measures.

1. Introduction

Global warming has impacted world natural and anthropogenic systems in recent decades [1], and the permafrost zone has undergone the strongest climatic changes that affect all components of the environment, including the transformation of the hydrological regime [2]. Understanding the interactions between changing hydrology and degrading permafrost is essential to reducing uncertainties in predicting the responses of water resources and aquatic ecosystems to climate change in high altitude/latitude regions [3]. Numerous studies show an increase in the total water flow of large rivers of the permafrost zone in the second half of the 20th century [4,5,6], a shift in the timing of floods and significant changes in the intra-annual runoff distribution [7], including the growth of maximum streamflow characteristics [8].
The increasing probability of the occurrence of natural hazards in climate change conditions is stated elsewhere in the world [9]. In the permafrost zone, dangerous phenomena are mostly associated with changes in the characteristics of frozen ground. The infrastructure is affected by the degrading of ice-rich permafrost, which may lead to the loss of mechanical strength, subsidence and foundation failure [10]. Piped systems are especially susceptible to settlement and subsequent leakage [11].
The risks caused by the changes in the functioning of the entire natural system, including the hydrological cycle, are increasing. The average annual total (direct and indirect) damage from floods in Russia is currently estimated at over RUB 40 billion (about USD 500 million) per year, and this value is constantly increasing [12]. A significant part of it is associated with the damage to transport infrastructure—the erosion of road sections, flooding, flushing of bridge constructions and destruction of hydraulic structures. Emergencies are often caused because culverts and hydraulic structures cannot cope with the release of floods of rare probability. They can be associated with improper operation and errors at the stage of engineering and hydrological surveys, design and construction, including the uncertainty of the methods used to calculate hydrological characteristics in the absence of streamflow observations.
The opening of the Nadym–Salekhard road took place in December 2020 and became a significant event for the residents of the Yamal-Nenets Autonomous region. However, the highway was closed for repairs due to the impact of high water already in the spring of 2021 [13].
The statistics on the Magadan region (north-east of Russia) show that hazard floods in this region have occurred annually over the past ten years. Thus, 74 km of roads and 15 bridges were damaged, including at the Kolyma federal highway; the damage amounted to more than RUB 600 million (USD 8.7 million) due to the flood in August 2013 [14]. The regional road “Magadan–Balagannoe–Talon” was closed, and the damage was estimated at RUB 700 million (USD 9.4 million) in 2014. The flood damage in the region reached RUB 250 million (USD 3.4 million) in August 2016. In 2019, the intensity of flood inflow to the Kolyma and Ust-Srednekan reservoirs of the Magadan region was the highest in the last 80 years [15].
Active expansion of socio-economic infrastructure has been implemented by state programs of Arctic development, allowing the extraction, processing and transportation of natural resources despite the observed changes in permafrost territory [16]. They include the large-scale overland transport construction projects in permafrost regions of Russia, such as the railway line “Severnyy shirotnyy khod”, 707 km length in Yamal-Nenets Autonomous Region, connecting the Obskaya station on the left bank of the Ob River and New Urengoy through Salekhard and Nadym. In the future, it is planned to continue this railway to Norilsk through Igarka and Dudinka (connecting the Ob and Yenisei River basins by a land transport corridor) (Figure 1).
The Kolyma–Omsukchan–Omolon–Anadyr highway construction began in 2012. Its planned length is about 2300 km (Figure 1). This road would unite three regions of the Far East—Chukotka, Magadan Region and Yakutia, including the federal highway “Kolyma”. It is also planned to build a new railway line Nizhny Bestyakh–Magadan [17]. The engineering studies and design for the bridge’s construction over the Lena River in Yakutsk have begun. The construction cost will be about RUB 83 billion (USD 1.1 billion). It was planned to put the bridge into operation in 2026. The Lena bridge will connect three federal and five regional highways, the Amur–Yakutsk railway, a river port and an international airport [18].
The planned development program requires scientifically based methods for calculating the characteristics of river streamflow, forecasting and assessing flood risk for the projected, industrial and social infrastructure given the high cost of construction projects. The Russian government draws special attention to the compilation of methodological recommendations for assessing climate risks and corporate plans according to the approved national action plan for adapting the economy and the population to climate change [19].
This study aims to show that the current network of hydrometeorological observation in the permafrost zone of Russia is insufficient to provide data for the statistical approaches adopted at the state level for engineering surveys and calculations. The alternative to the financially costly and practically impossible expansion of the hydrometeorological network is the development of a hydrological research network and the implementation of new methods for calculating flow characteristics based on mathematical modeling.

2. Study Area and Permafrost Data Availability

Permafrost is distributed mainly in the northern hemisphere of the earth and occupies 65% of the territory of Russia. The permafrost type varies from continuous (thickness up to 1500 m or more) to isolated (10–20 m thick) at the southern border of the permafrost distribution (Figure 1) [20]. The forecast and assessment of changes in permafrost conditions and hydrological regime and flow characteristics in Russia are complicated by the rapid reduction in the observation network. It is still the least provided with data of standard hydrometeorological measurements, despite the growing interest in the development of the permafrost zone in Russia. This study analyzes the distribution of ground temperature stations and hydrological gauges where streamflow discharge is measured along the Russian permafrost zone. We investigate the dynamic of those gauges sorted by basin area and DHS in the last several decades.

2.1. Soil Temperature Observation in Permafrost Zone of Russia

Table 1 shows the list of twelve territorial departments of the Russian Hydrometeorological Service (DHS) where permafrost occupies more than 20% of the territory. The total area of those DHS constitutes 13.6 mln km2 with 10.8 mln km2 (80%) covered by permafrost of different types. Continuous permafrost is present in more than half of the area (51%); other types are distributed evenly (each about 10%). Three departments are located entirely in the permafrost zone (Chukotka, Yakutsk and Kolyma with 100, 93 and 87% of continuous type, respectively). Permafrost covers more than 80% in Transbaikal, Irkutsk, Central Siberian and Far Eastern departments, here the proportion of continuous permafrost type ranges from 23 to 56%. The discontinuous permafrost zone varies from 1 to 20%, sporadic and isolated from 1 to 29% in presented DHS. Table 1 contains the data regarding the number of meteorological stations with the data on the ground temperature at any depth in the range of 0.8–3.2 m available online at the official website of the Russian Hydrometeorological Service [21] up to 2008.
At an area of 10.8 mln km2, there are 123 stations monitoring ground temperature. Though the stations are unevenly concentrated close to industrial centers and city agglomerations, on average, one station covers about 87,000 km2; for continuous permafrost, this value increases by three times and reaches 210,000 km2 (for example, together at Chukotka and Kolyma DHS, the north-east of Russia, with a total area 1.17 mln km2 there are only five stations of standard observational network with ground temperature data). As well as the severe lack of stations, they may also present data of uncertain quality (for example, [22]); often, the data contains many gaps and presents a minimum number of ground depths.

2.2. Reduction in Hydrological Observation Network in Permafrost Zone of Russia

Streamflow discharge is the main hydrological engineering characteristic. The historical and current hydrological gauges with streamflow measurements were compiled from [23,24,25,26], respectively.
The number of hydrological gauges with streamflow discharge measurements in the permafrost zone constituted 1577 in 1980 and dropped to 1043 in 2019. The network density has decreased by about 1.5 times over the past 40 years. The situation is even more acute with tiny rivers (catchment area <200 km2)—the number of observation gauges has decreased more than two-fold, and for gauges with a catchment area of 200–2000 km2—1.3-fold (Table 3, Figure 2). One may note that the strongest drop in the number of hydrological gauges occurred between 1980 and 2008. However, the tendency of further decrease is well seen at most DHS. In total, the number of gauges has decreased by 47 (about 5 %) over the past ten years (by six gauges for each DHS on average, ranging from 0 to 11 gauges). The most critical situation is observed in the Kolyma DHS. In 2008–2019, the total number of discharge gauges had dropped from 22 to 17 (23% decrease), the losses (5 gauges) are characteristic for the most crucial data—small rivers with basin areas less than 200 km2. In the Chukchi peninsula, the number of gauges dropped from 3 to 2; considering the area of this DHS (>700 thousand km2), the situation in the north-east of Russia is critical. The main reason for hydrometeorological network reduction is the significant depopulation of northern territories and the limited funding of the service due to the decline of the Russian economy after the collapse of the Soviet Union.
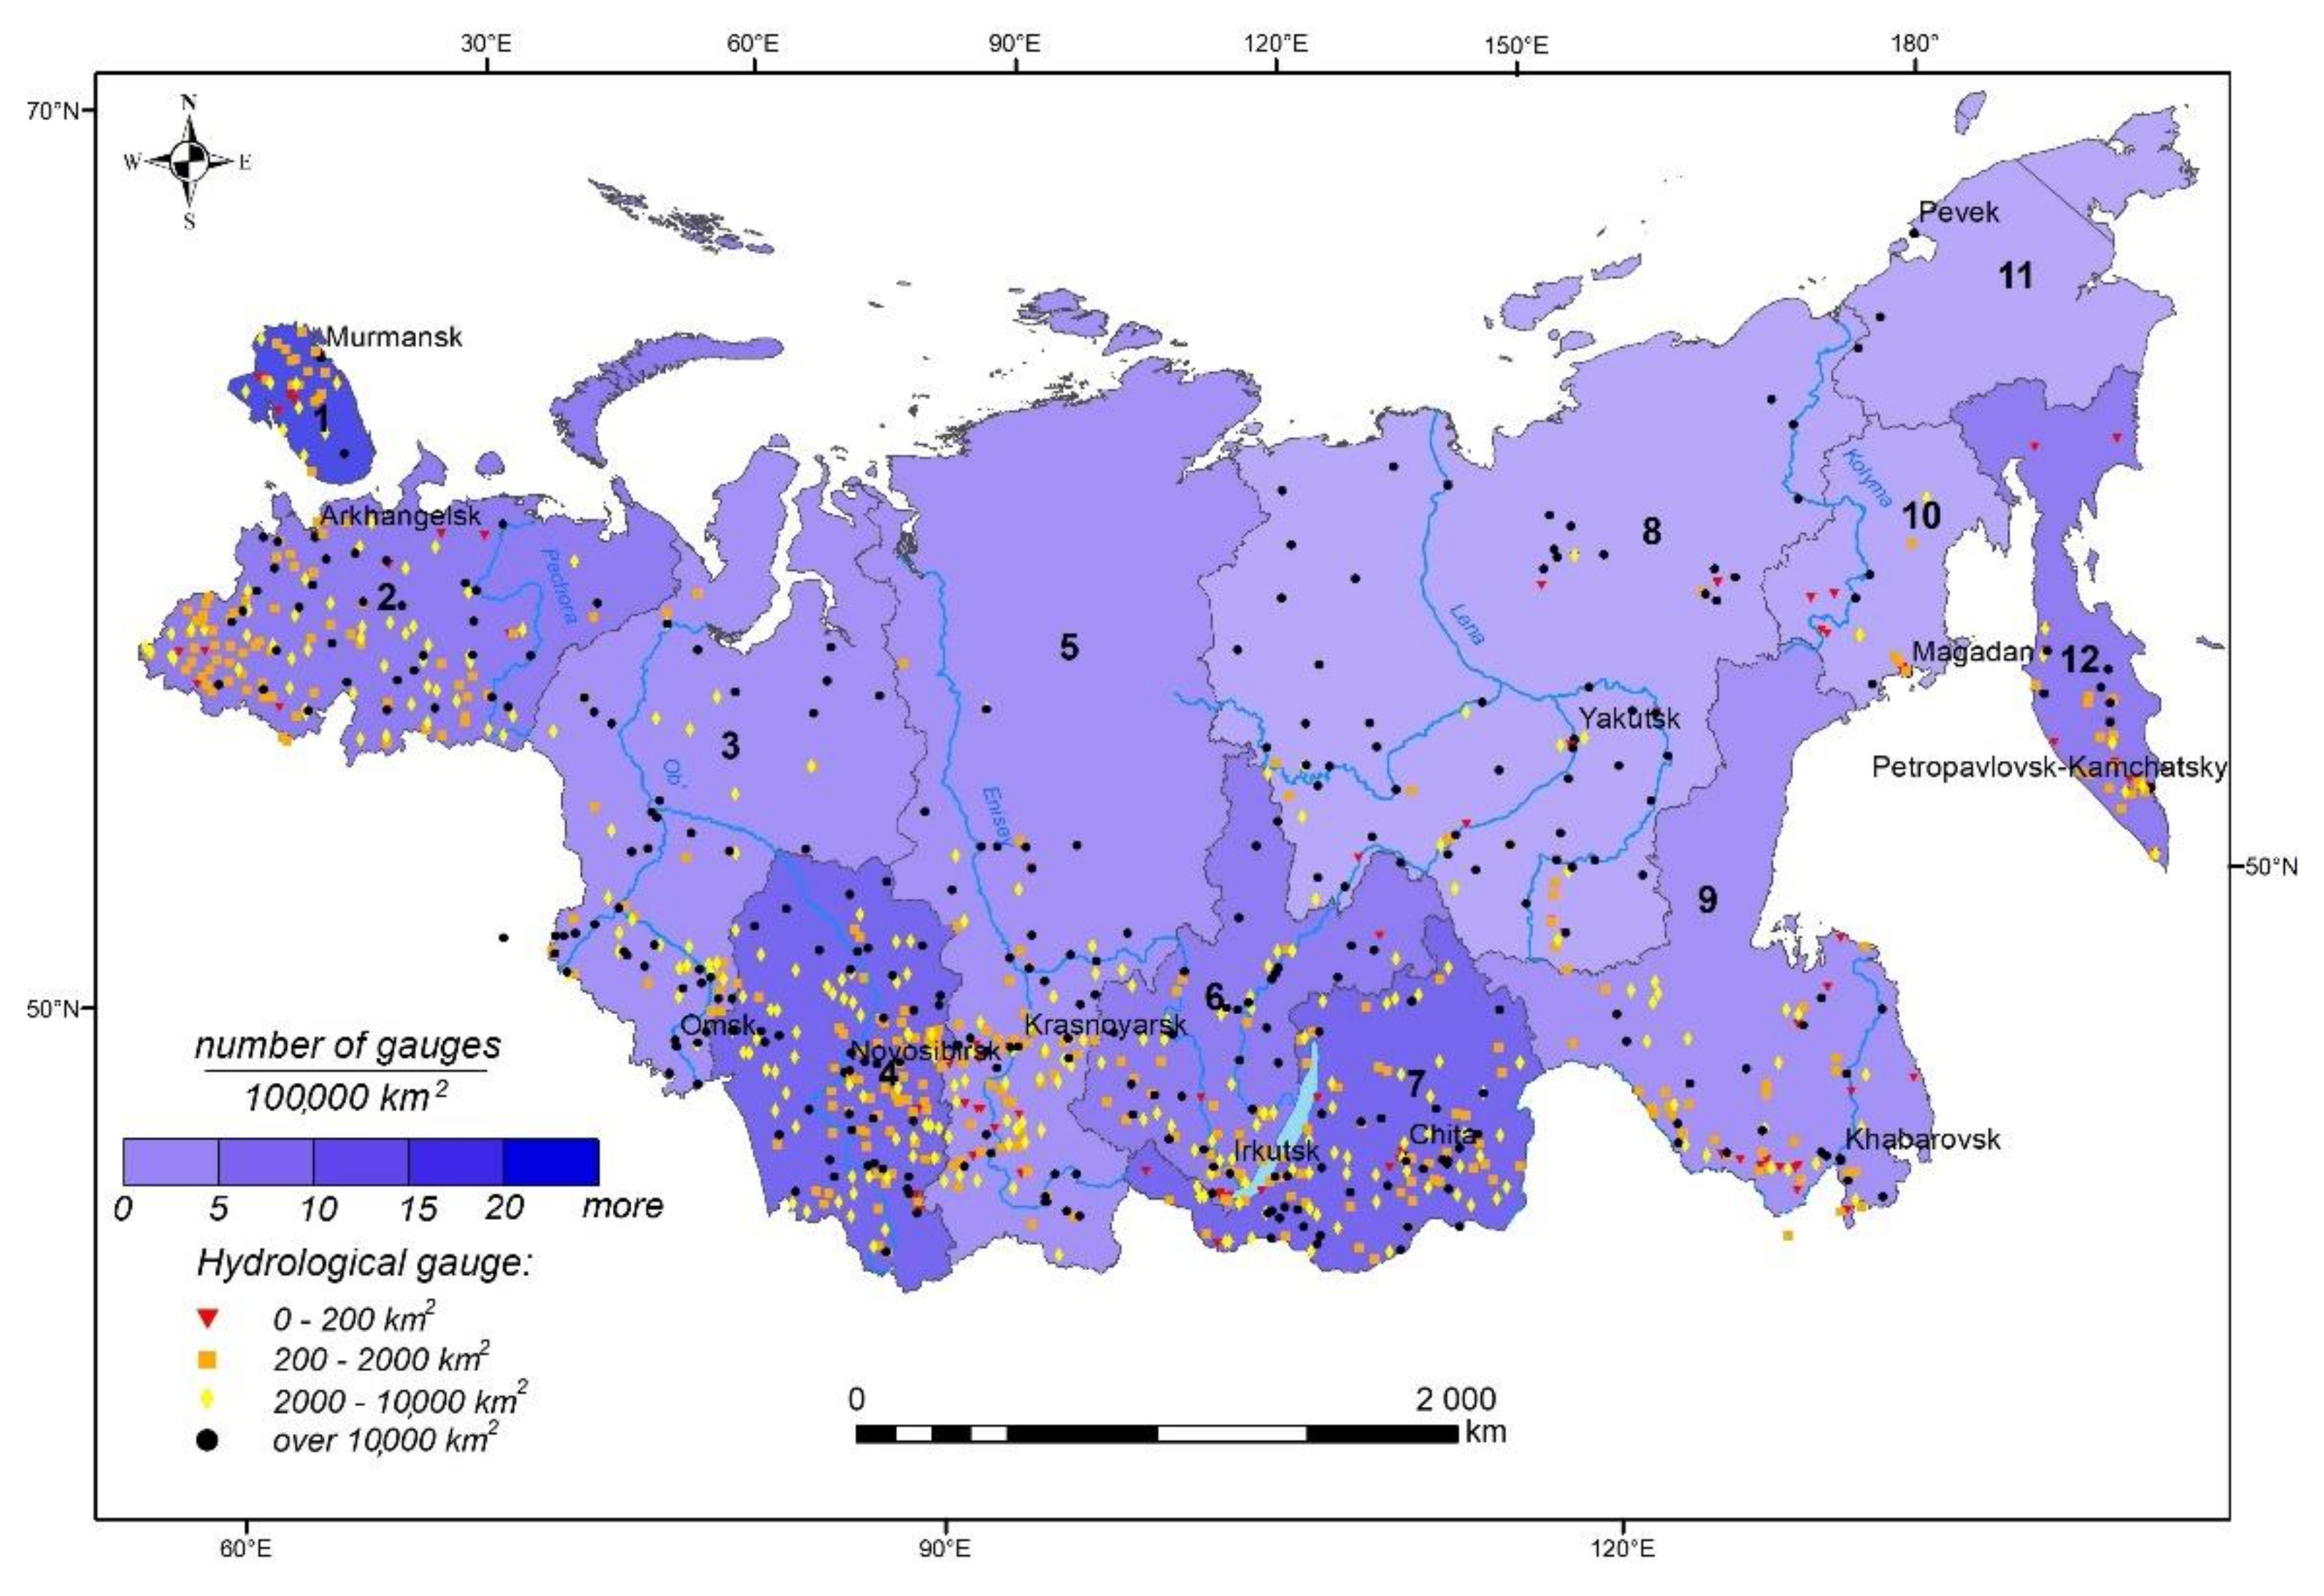
Figure 2 shows the density of hydrological gauges of all area categories in permafrost DHS. By density, we mean the number of any hydrological gauges with discharge measurements per 100,000 km2. Figure 2 also depicts the location of hydrological gauges with different basin areas. Figure 3 gives a more exact idea about the density of gauges in each DHS. Additionally, the percentage of the DHS area covered by the permafrost of any type is shown.
Most territory in east Siberia and the north-east (DHS 8, 10, 11 with 100% permafrost) is characterized by the density of fewer than five gauges per 100,000 km2 (Figure 2). In the Republic of Yakutia (DHS 8), those values are ≤ 0.5 for basin areas less than 10,000 km2 and 1.8 for larger basins. In the Magadan region (DHS 10), the density varies from 0.4 to 1.5 with a total (all gauges) average of 4.0. In Chukotka, there are no gauges in the category less than 10,000 km2. The density is 0.3 for the gauges of basin areas more than 10,000 km2. In DHS 3 and 4 (the Ob’ River basin), most gauges are located beyond the permafrost zone in the south of the regions. The same situation is characteristic for DHS 5, 6 and 9, where the gauges’ density is representative of the non-permafrost zone. In DHS 1 and 2, permafrost is distributed in the north-eastern edges of the regions exactly where no gauges are situated. A relatively acceptable situation with the network density may be considered in DHS 6 and 7 (Irkutsk and Transbaikal regions), where permafrost covers more than 90 % of the territory and the density of gauges with basin areas > 200 km2 reaches 3.5–5.6.

3. Methods

3.1. Modern Methods for Calculating the Hydrological Engineering Characteristics

Any construction projects require engineering field studies and design. Most countries use statistical estimation methods in civil hydrological engineering. Their base is various distribution functions that describe observed streamflow data and estimate hydrological characteristics of low probabilities [27].
Developing cost-effective and sustainable plans requires the assessment of flood risk. In the United States, that computation is done following guidelines in Bulletin 17C [28]. It is recommended that the flow discharge be determined by the method of the probable maximum flood. The probable maximum flood (PMF) calculation is carried out during the construction design of hydraulic engineering facilities for particularly critical structures [29,30,31].
In Europe, most studies are based on statistical methods applied to individual time series of extreme precipitation or extreme streamflow; moreover, many assessments are carried out based on the regional principle. In [32], various approaches for producing climate projections of extreme precipitation and flood frequency, methods for statistical downscaling and bias correction, and alternative hydrological models are presented.
In Canada, flood management is primarily the responsibility of the provinces and territories. Therefore, most flood management activities are executed at the ‘local’ rather than provincial, territorial or federal levels [33]. The statistical frequency analysis is performed on high river flows to obtain a set of design flow values corresponding to selected frequencies of occurrence, commonly interpreted in terms of return periods or annual exceedance probabilities [34]. The statistical approach is used to develop precipitation intensity-duration-frequency estimates, then integrated with urban hydrological models to produce the desired design flow values. The estimated design flows are then used in hydraulic models to generate flood extents and levels to develop flood inundation, flood hazard and other flood-related maps and products [34].
In Russia, the Calculation Set of Rules 33-101-2003 (SR) [35], based on applying statistical processing methods of long-term series of streamflow observations, is currently demanded. The SR is an updated version of the document SNiP 2.01.14-83 [36], issued in 1983, and fundamentally does not differ from its predecessor in terms of methods for calculating runoff characteristics. The previous edition assumed that hydrological processes are statistically stationary, and consequently, retrospective observations can be considered representative. The SR methods recognize climate change and require the use of current hydrometeorological information when making calculations and clarifying the parameters of calculation equations based on the generalization of current hydrological data. However, such recommendations do not offer clearly described methods to consider the influence of climate on streamflow characteristics [37,38,39].
In [40], the calculations of maximum streamflow characteristics for several rivers in the permafrost zone of Russia based on the recommendations of SR were conducted. The calculation was carried out for four very small (up to 200 km2) and two small (up to 2000 km2) river basins located in eastern Siberia and the north-east with different hydrological regimes, provided by long series of streamflow data. Analyzed river basins were treated as ungauged. The data of other hydrological gauges (following the recommendation of SR) was used as the analog for conducting the calculations. Calculated characteristics of maximum discharge of different probabilities were compared with observed values. The results of the study have shown that the choice of analog rivers provided with recent observational data (including last 20–25 years) is limited to 2–3 options of watersheds that have no alternative for the area of up to several hundred thousand km2 and the requirements for the selection of analog rivers are largely wide, leading to large uncertainty of calculation results.

3.2. The Mathematical Modeling Methods and Special Monitoring of Runoff Formation Processes in the Permafrost Zone

Hydrological calculations and forecasts in the conditions of vast and remote permafrost territories, where the network of hydrometeorological observations is either very rare or absent, are related to the use of mathematical models. The permafrost zone imposes increased requirements on hydrological models [2]. Among the hydrological models that describe the processes of heat and moisture transfer in frozen soil and have been tested in cold regions of the earth are the TopoFlow model [41], Cold Region Hydrological Model (CHRM) [42], Variable Infiltration Capacity (VIC) model [43], cryospheric basin hydrological model (CBHM) [44], GEOTop model [45], SoilWater—Atmosphere—Plants model (SWAP) [46],Ecological model for Applied Geophysics (ECOMAG) [47], the Hydrograph model [48,49] and others.
The complexity of runoff formation processes in permafrost regions requires understanding the physical mechanisms of heat and moisture exchange processes to improve and apply mathematical modeling methods. One of the most important obstacles for such studies is obtaining full-scale data of special and experimental observations. Stationary observations at small research catchments are the main source of information about the physical mechanisms of runoff formation and ongoing hydrological cycle changes. Therefore, the low density of the standard observation network may be compensated by the development of a network of research catchments. Canada and the USA, where the area of permafrost territories and their inaccessibility are commensurate with the permafrost zone of Russia, are leading in those studies [50,51,52,53,54]. Watershed research is accompanied by the development and application of mathematical modeling methods.
Russia has lagged significantly behind other Arctic countries in instrumental studies of the hydrological cycle processes over the past 30 years. However, it had the world’s first system of integrated scientific hydrological stations organized in various climatic conditions in the USSR. M. Velikanov was the first to propose the organization of special hydrological stations in various physical and geographical conditions in 1925, and D. Sokolovsky compiled the plan for the placement of 45 field laboratories on the territory of the USSR in 1933. There were already 11 stations from 1928 to 1940. However, most of them were closed entirely during World War II. In 1954, the monography with the first results of the studies at hydrological research stations, called runoff stations, was published [55]. The runoff stations made comprehensive observations of all elements of the water balance and the factors causing their changes. The objects of the study were small catchments and runoff sites characteristic of the region. By 1981, there were 16 water balance stations (WBS) at natural catchments (not subject to reclamation) and nine marsh stations on the territory of the USSR.
The Kolyma Water Balance Station (KWBS) was the only comprehensive research station in the permafrost zone with long-term observation. The location of the KWBS (upper reaches of the Kolyma River, Magadan region) was representative of the vast mountainous territories of the permafrost zone of eastern Siberia, the north-east and the Far East of Russia. Detailed observations of the runoff formation and the seasonal thawing and freezing of soils were carried out at the KWBS from 1947 to 1997 [56]. The processes of formation of water balance [57], hydrogeological structure and talik zone [58], runoff in various landscapes (the distribution of precipitation, evaporation and water runoff in permafrost rocks and mountain relief were studied based on the analysis of observational data [59,60]. Another example is the Mogot research station of the Baikal-Amur expedition of the Russian State Hydrological Institute (1976-1985). The Mogot station was created to provide design and construction solutions for hydrological calculations in the permafrost zone of economic development of the Baikal-Amur mainline [61,62,63,64].
Historically, the observations at WBS have contributed significantly to the development of both applied and fundamental hydrology. Nowadays, there is no permanent state hydrological research station in the permafrost zone of Russia.
In this study we have used one of the available hydrological models which has shown the significant potential to be applied in remote permafrost regions. The parameters of the Hydrograph model were previously elaborated at the base of KWBS data for typical permafrost landscapes [49,56,57,59,60] to simulate the runoff formation processes in hard-to reach river basins of the north-east of Russia. The results are aimed to show that the data of research basins and appropriate process-based models allowing for regionalization of their parameters could become a decent alternative to statistical approaches in the poorly gauged permafrost basins.

3.3. Hydrograph Model

The Hydrograph, a distributed process-based model of runoff formation processes is applied in the study. The model has proven to be an effective tool for research and projection of hydrological processes in the permafrost and on poorly gauged river basins [48,49,65,66]. The model algorithms combine physically based and conceptual approaches in describing the processes of the terrestrial hydrological cycle, which allows a balance to be maintained between the complexity of the design schemes and orientation to limited input information. Precipitation and interception of rainfall water, compaction and ablation of snow cover, moisture and heat flux in the snow cover and in soils, including freezing and thawing, are described in an explicit way in the model. Underground water, slope and channel flow transformation, snow redistribution by wind and evaporation are calculated by conceptual methods that have shown their effectiveness in various conditions of cold regions [49,66]. Using a limited list of meteorological variables (air temperature and humidity, precipitation) as the input information allows the model to be applied at remote, poorly gauged basins. The model parameters are related to runoff formation complexes—landscapes with similar characteristics of soil and vegetation. The sets of parameters refined on the studied catchments (analogous watersheds) can be transferred to ungauged basins with similar surface types. The Hydrograph model is used on watersheds of different sizes from the soil column to the Lena River basin without changing its structure and algorithms [48]. The results of the studies [49,59,65] have shown that the Hydrograph model performs satisfactorily in terms of active layer dynamic and soil temperature simulations. The description of the procedures of basin schematization and model parametrization are presented in detail in the studies [48,49,59,60,66] and therefore is omitted here.
The processes of groundwater and surface flow interactions are complicated in the permafrost zone; therefore, the main limitations of the Hydrograph model are related to the representation of those processes. They include the formation and development of taliks, the formation of giant groundwater aufeis which are widely distributed in the study region, and other geocryological processes. Those processes and phenomena should be studied at research watersheds for the improvement of model algorithms and their parametrization.

4. Results

Four watersheds with an area from 84 to 8290 km2 located in the mountainous regions of such river basins as Yana, Indigirka and Kolyma were chosen as the study objects (Table 3). The following data were used in the modeling process: daily meteorological and hydrological information from standard hydrometeorological networks, previously developed model parameters for main permafrost landscapes [49,59,60]. The assignment of typical landscapes within the watersheds was conducted using a SRTM digital elevation model and Landsat-8 images using previously developed schemes of landscape distribution in the mountainous basins of the Kolyma [60] and Indigirka [66].
Table 3. The characteristics of the simulated watersheds and modelling results.
Large River
Basin
RiverS *HPrYoYsPEQoQsNS
(av)
NS
(max)
IndigirkaSakharynia84.48331966–20129311329418114120.320.76
Artyk-Yuryah6445911966–19918281.827418990.31490.140.72
YanaCharky82902741966–2007216223361120142414900.340.70
KolymaAnmangynda4006681966–198727323737512516181.10.430.71
* here, S—watershed area, km2; H—average watershed elevation, m; Pr—period of simulation, years; Yo, Ys—observed and simulated annual streamflow, mm; P and E—simulated annual precipitation and evaporation, mm; Qo, Qs—observed and simulated maximum discharge (m3/s); NS (av) and NS (max)—average and maximum Nash–Sutcliffe criteria.
The model was run in continuous mode for the period from 22 to 47 years with daily time step. The results of modeling compared to the observed values are presented in Table 3, including the distribution of annual water balance, the Nash–Sutcliffe (NS) criteria for daily streamflow hydrographs and maximum discharges. It is important to mention that all meteorological stations to which data was applied are located beyond the watershed’s borders. In mountainous conditions, it plays a significant role in flood modeling results.
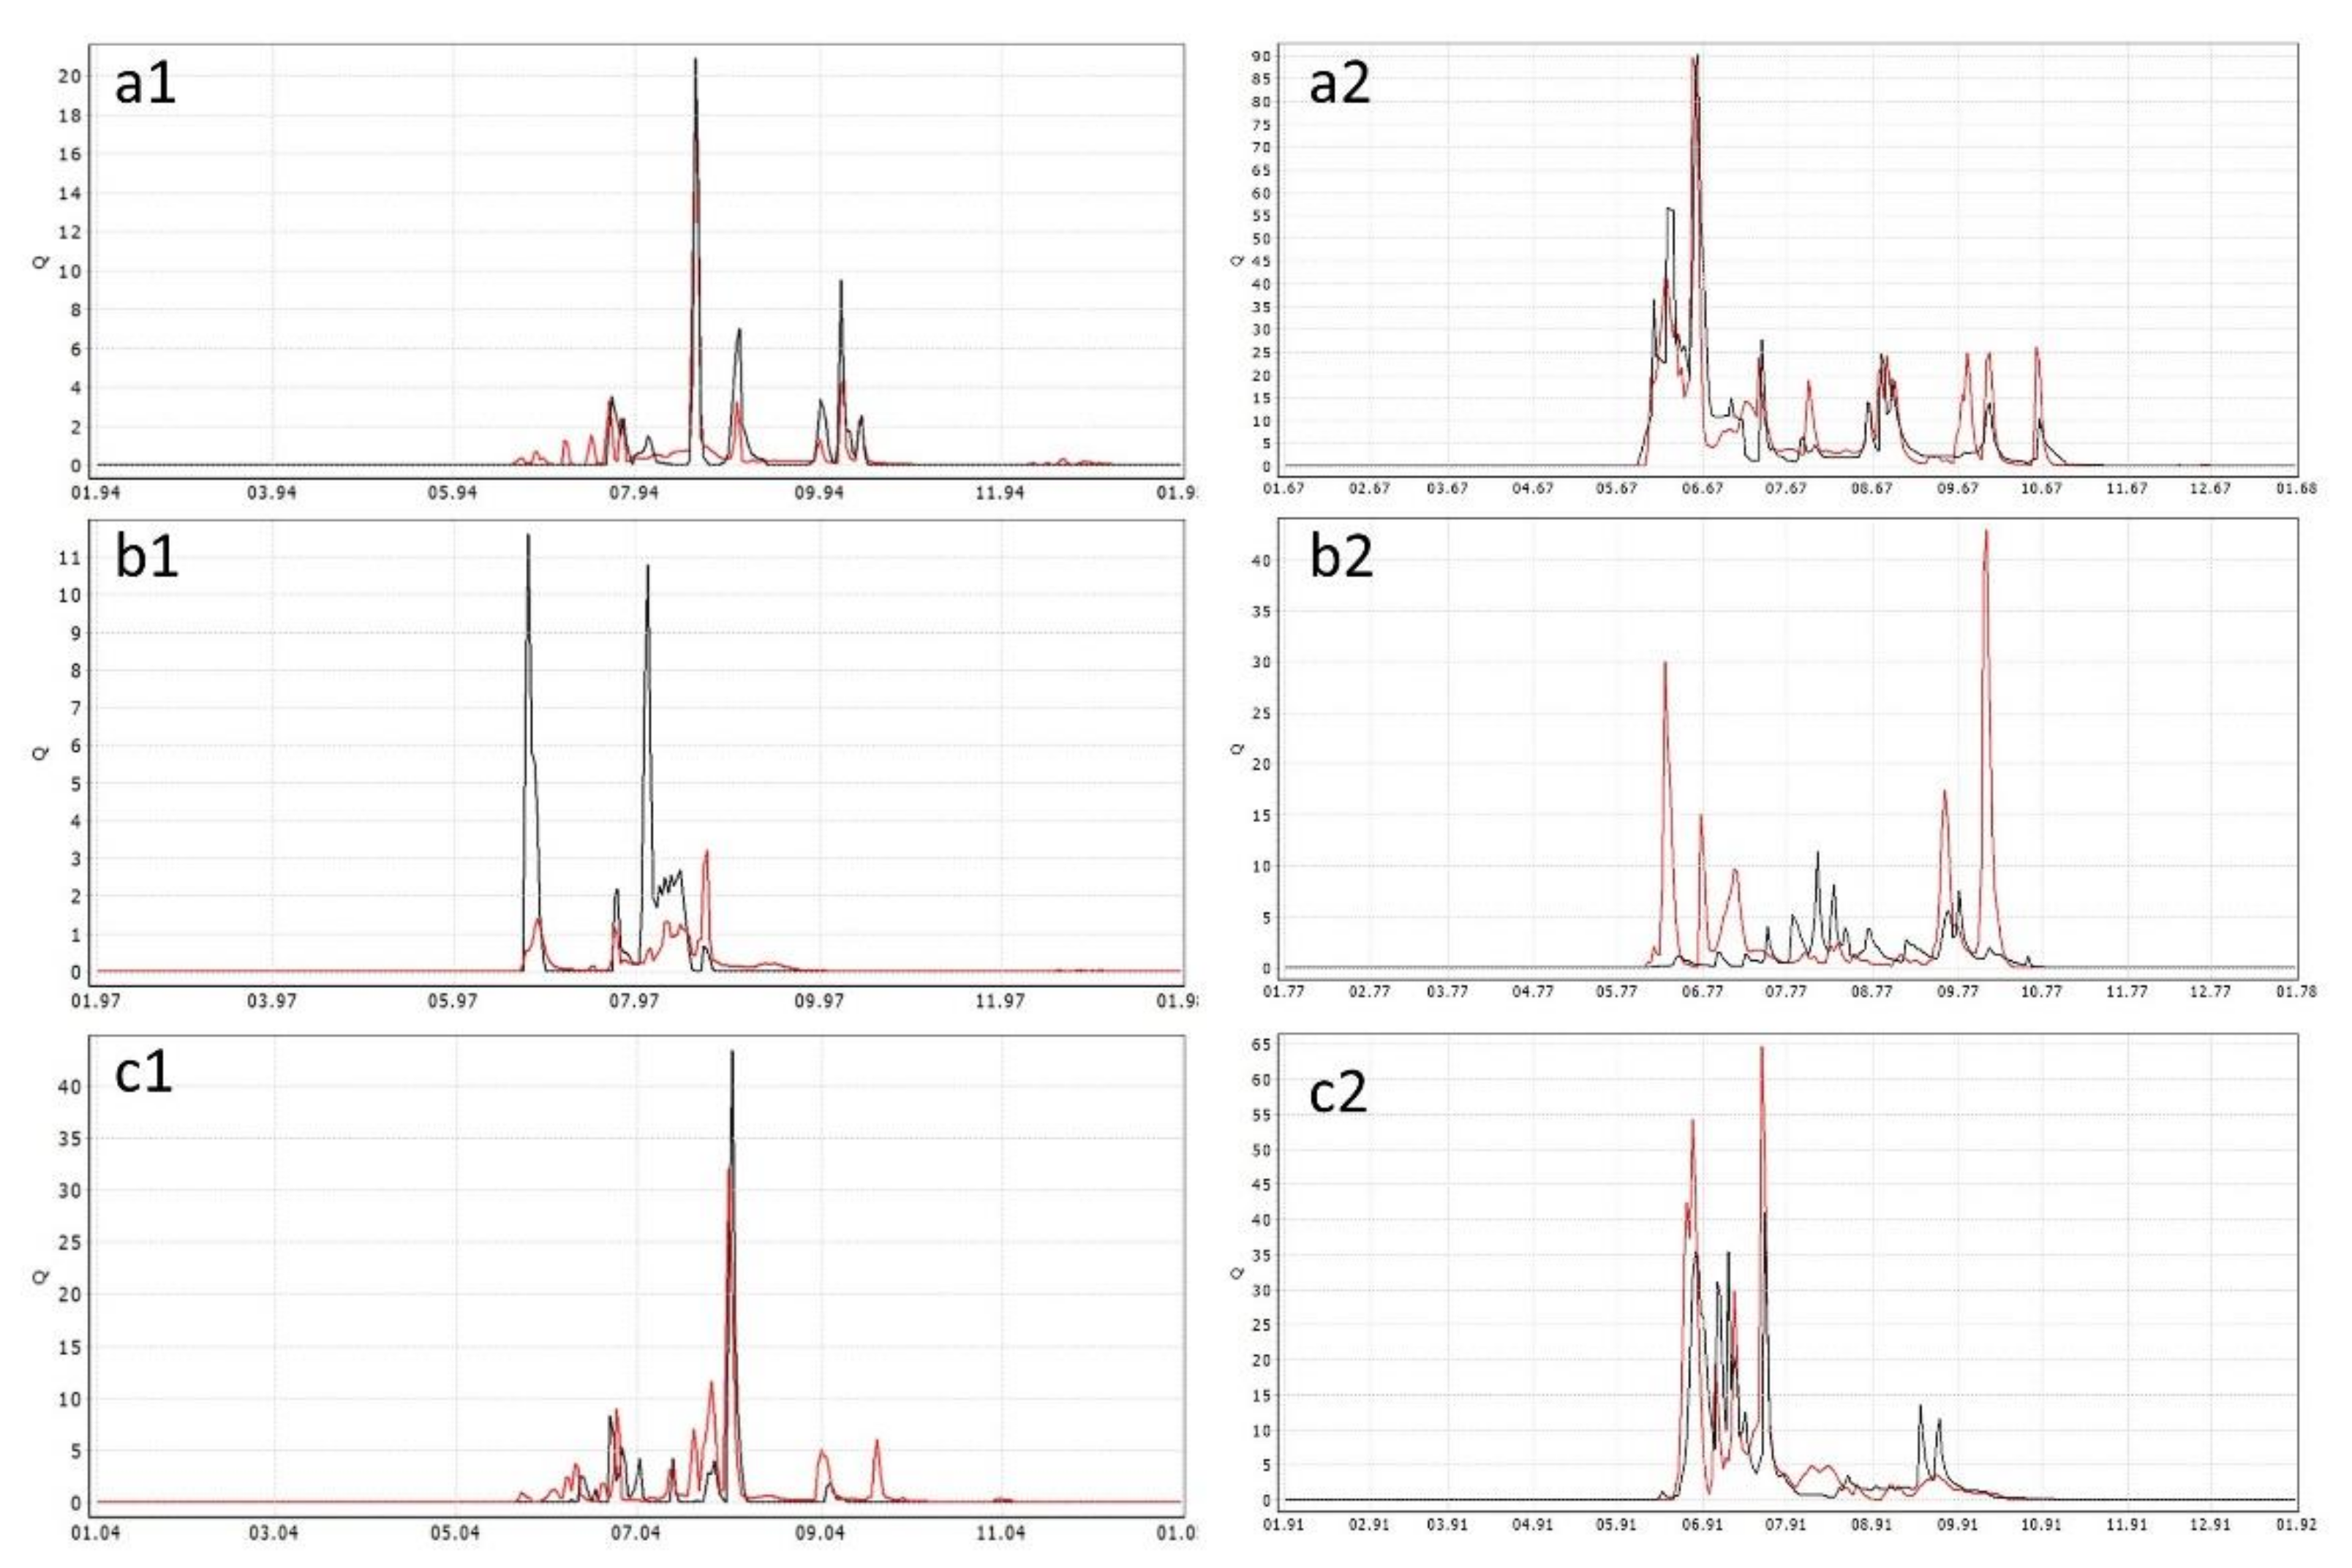
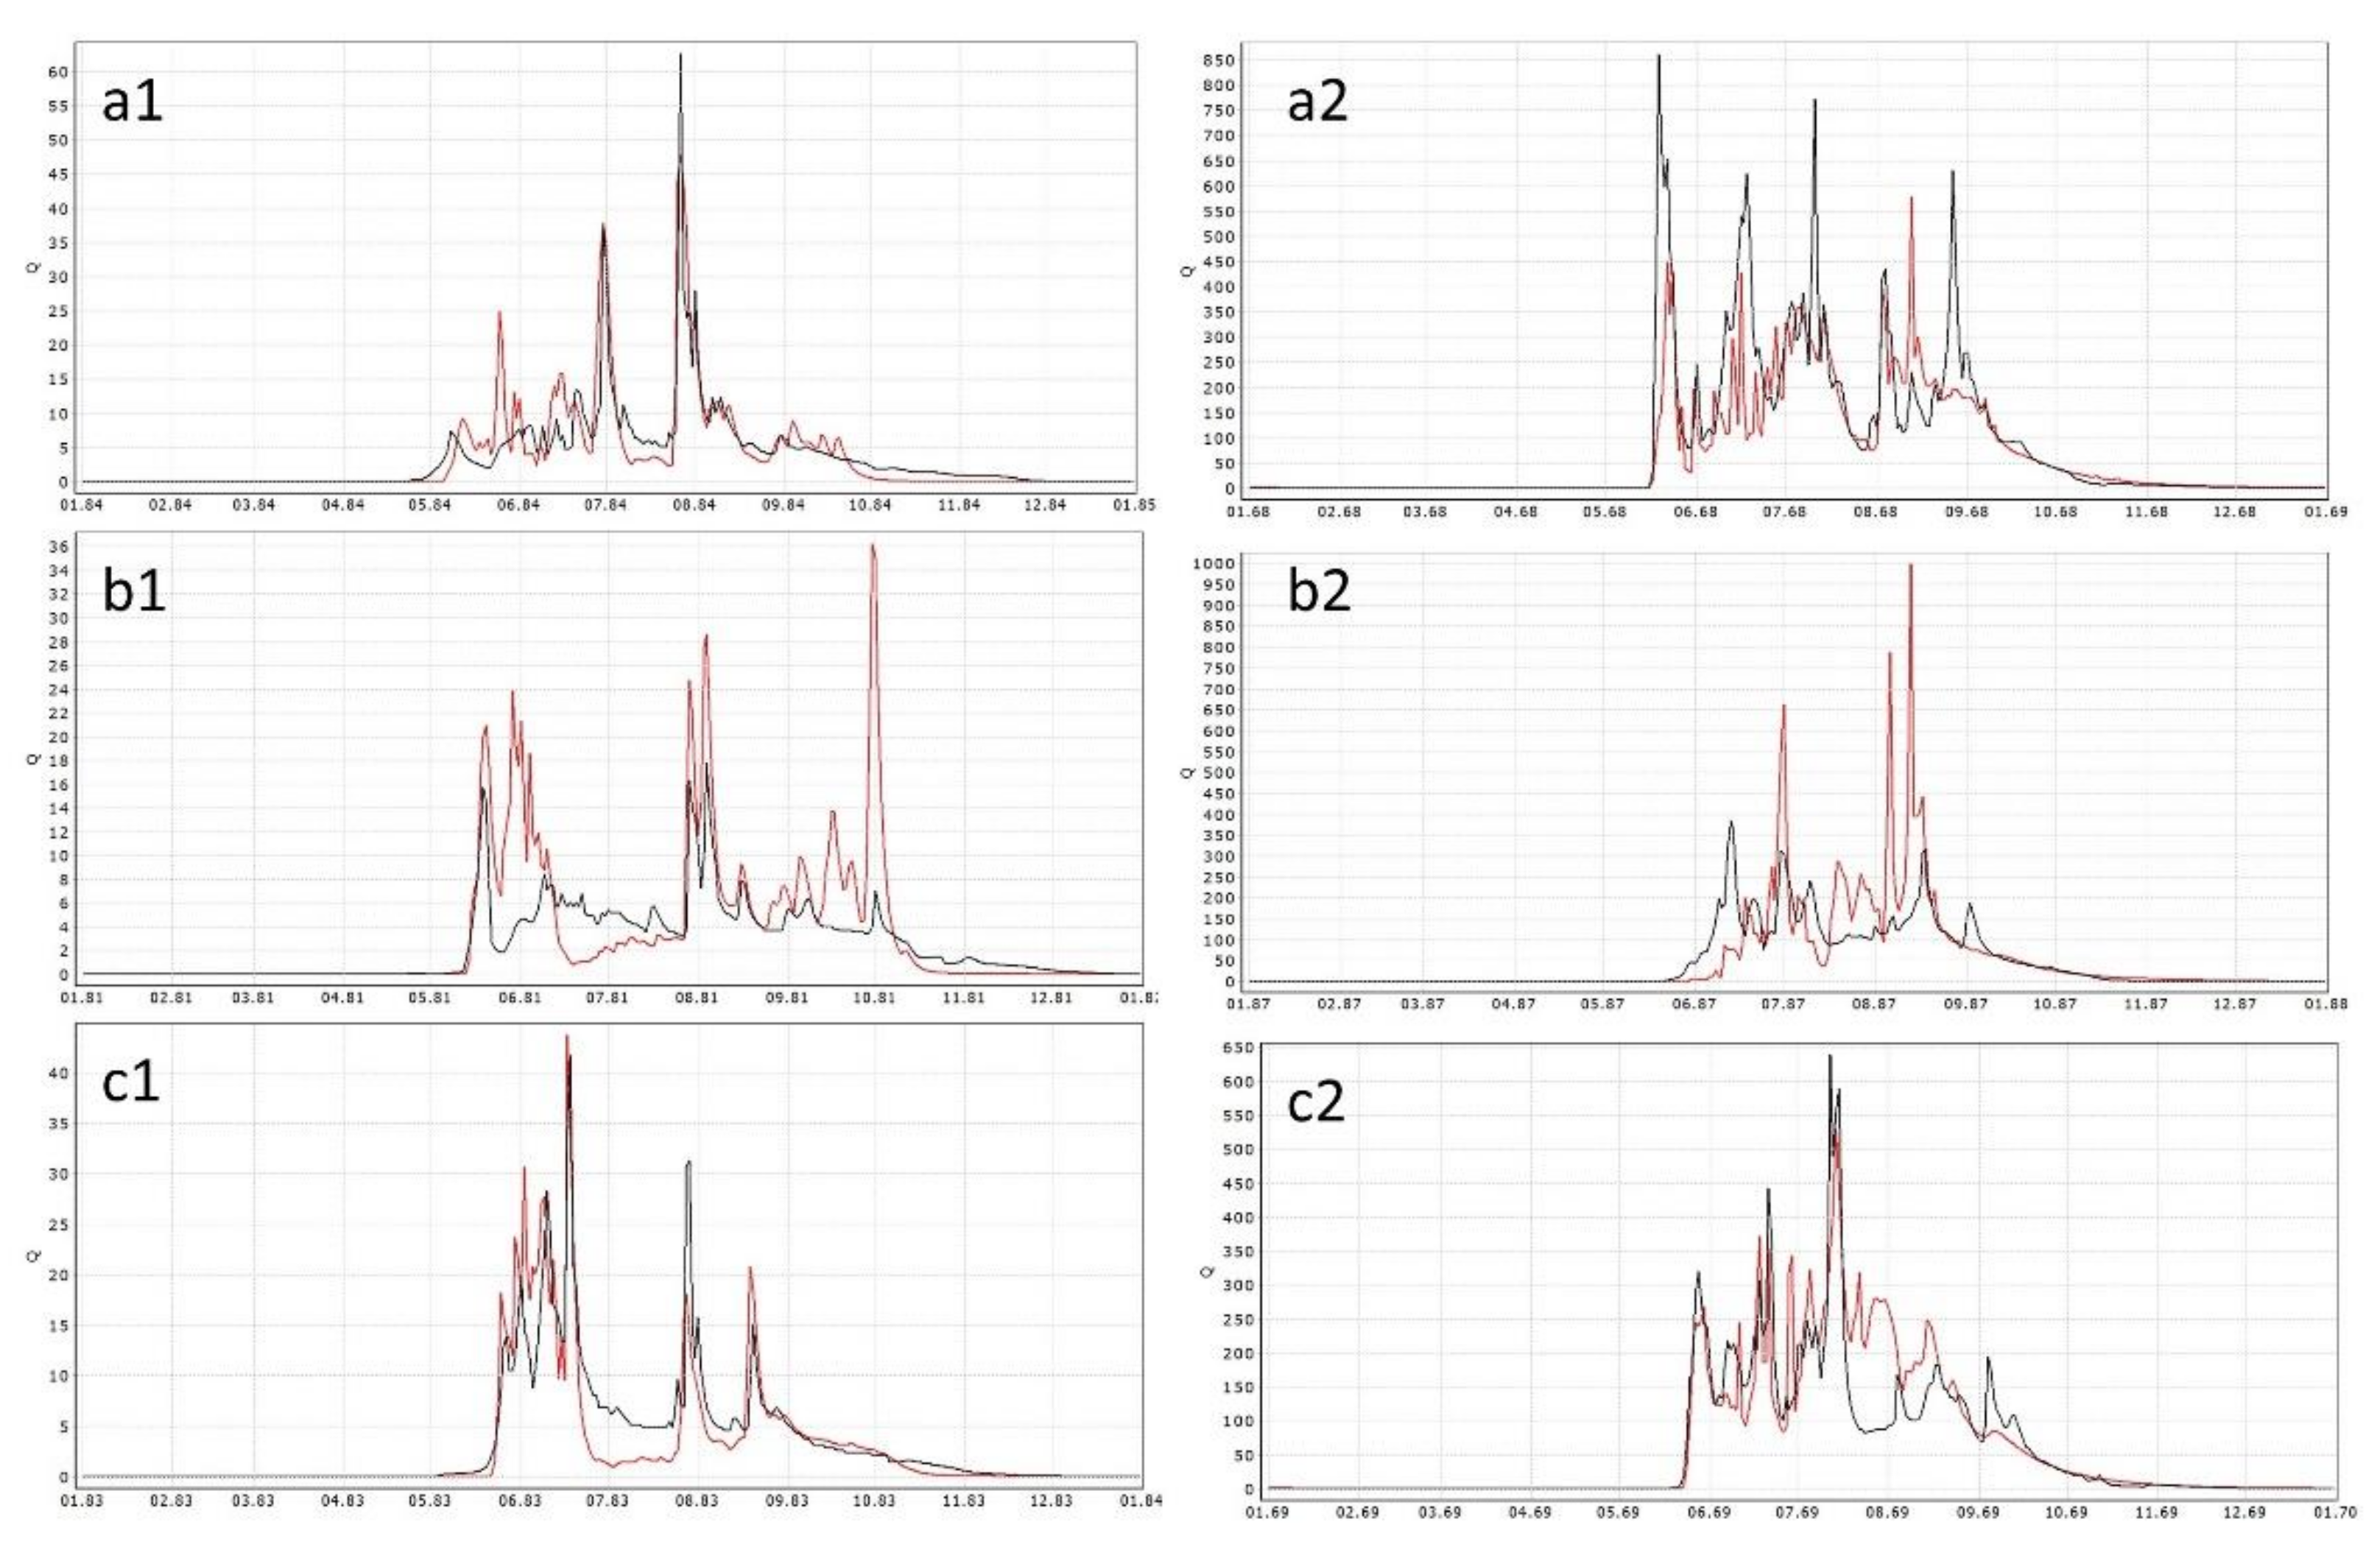
Simulated values of annual precipitation and evapotranspiration vary in the ranges 274–375 and 120–189 mm, respectively. The bias between simulated and observed annual values of streamflow reaches the numbers between 0 to 22%, increasing with the decrease in watershed size. The difference between simulated and observed maximum discharges is proportional to the distance of the meteorological station to the watershed which confirms the limitation of modeling results by input data. One may see observed and simulated hydrographs with good, average and poor convergence which mainly depends on the representativity of the input meteorological data (Figure 4 and Figure 5). The average Nash–Sutcliffe (NS) criteria is not very high varying from 0.14 to 0.43, but in some years, it reaches up to 0.76.
The results confirm that the data of special research basins can be used for model parameter estimation in remote permafrost basins. The quality of simulations is satisfactory. The modeling results may substitute or replace statistical approaches in the conditions of extreme data insufficiency. The improvement of the models in current climate conditions require the renewal of historical observation in currently abandoned research stations.

5. Conclusions

Most of the territory of Russia can be classified as unexplored hydrological territories. Currently, calculations of flow characteristics in the permafrost zone are based on regional statistical parameters. Their refinement was conducted more than 40 years ago, when the hydrological data from all over the country were summarized fully, using unified methods developed in the Russian State Hydrological Institute. One could argue there are serious scientific and practical problems related to the extreme limitations and poor quality of observational data, as well as the lack of funding and human resources to restore a wide hydrological observation network in the permafrost regions of Russia. The main problems related to hazards and water resources are the following: (1) estimating streamflow characteristics in the tasks of engineering and survey design; (2) forecasting the magnitude and frequency of catastrophic floods; (3) predicting the inflow of water into reservoirs and river systems for the needs of hydropower and water transport.
The annual hazard damages in a permafrost region of Russia are comparable with the costs of building a modern research station. For example, the cost of the Samoylov Island Arctic permafrost research site built in the Lena River delta in 2012 was RUB 500 million (about USD 17 million). This station is located in a remote hard-to-reach place and requires complicated logistics for its provision due to the need for self-efficiency [67,68]. Building a station in a less remote place with access to roads, energy and communication networks would significantly reduce the costs while providing important data for coping with the stated problems.
The solution of the tasks set can be achieved only at the state level and should be carried out in three directions:
  • The development of a state program to organize a network of representative catchments in various climatic zones of permafrost regions for the comprehensive monitoring of main components of water balance and hydrological processes using modern equipment with a high time resolution and new research methods. It is also necessary to consider the feasibility of restoring historical stations with a long series of observations, such as the Kolyma water balance station [56]. The development of such a program should be based on the results of a detailed inventory of historical data of standard and specialized information on the characteristics of the natural environment (climate, permafrost, hydrology, hazardous phenomena, landscapes, etc.). The research stations should be equipped for year-round living and may serve educational purposes for student field practice and experience in the future.
Nowadays, limited in scope and duration, some hydrological research is carried out in a permafrost environment by individual research teams on a non-permanent basis of grant funding and without uniform methods [69,70,71]. Obviously, it is impossible to solve the discussed tasks solely by the research teams in terms of capital infrastructure. This is due to the lack of resources for construction works, purchase of transport, maintenance of property, etc. State and business input are required to support such initiatives.
2.
State order for the development of approaches for the estimation of the main hydrological characteristics in engineering and survey design tasks based on mathematical modeling methods.
3.
Improvement (in particular, expansion) of the standard hydrological observation network, based on modern modeling and remote sensing methods and accounting for historical experience, and social and economic development programs [72]. The improvement of the measurements’ quality would require the renewal and expansion of hydrometeorological education which has been in deep decline for the last 30 years.
Implementing these three tasks would require us to solve many problems. Among them are an acute shortage of qualified specialists in hydrometeorology (from observers to researchers), the loss of experience in organizing and conducting complex hydrological research, a lag in the development of modern hydrometeorological devices’ domestic production, financing of the industry on a residual basis, and others.

Author Contributions

Conceptualization, O.M., N.N. and A.T.H.; formal analysis, A.O. and A.Z.; data curation, A.O. and A.Z.; writing—original draft preparation, O.M. and N.N.; writing—review and editing, O.M.; visualization, A.O. and A.Z. All authors have read and agreed to the published version of the manuscript.

Funding

The study was carried out with the support of RFBR (19-55-80028), Russian Geographical Society (“Water resources of the north-east of Russia in the conditions of global and regional changes”) and St. Petersburg State University (project 75295776).

Institutional Review Board Statement

Not applicable.

Informed Consent Statement

Not applicable.

Data Availability Statement

All data is available upon request to the corresponding author.

Conflicts of Interest

The authors declare no conflict of interest. The funders had no role in the design of the study; in the collection, analyses, or interpretation of data; in the writing of the manuscript; or in the decision to publish the results.

References

  1. The Intergovernmental Panel on Climate Change (IPCC). Available online: https://www.ipcc.ch/reports/ (accessed on 20 October 2021).
  2. Walvoord, M.A.; Kurylyk, B.L. Hydrologic Impacts of Thawing Permafrost—A Review. Vadose Zone J. 2016, 15, 6. [Google Scholar] [CrossRef]
  3. Bring, A.; Fedorova, I.; Dibike, Y.; Hinzman, L.; Mård, J.; Mernild, S.H.; Prowse, T.; Semenova, O.M.; Stuefer, S.L.; Woo, M.-K. Arctic terrestrial hydrology: A synthesis of processes, regional effects, and research challenges. J. Geophys. Res. Biogeosciences 2016, 121, 621–649. [Google Scholar] [CrossRef]
  4. Kattsov, V.M.; Kallen, E.; Cattle, H.; Christensen, J.; Drange, H.; Hanssen-Bauer, I.; Johannesen, T.; Karol, I.; Raisanen, J.; Svensson, G.; et al. Future climate change: Modeling and scenarios for the Arctic. In ACIA; Cambridge University Press: Cambridge, UK, 2005; pp. 99–150. [Google Scholar]
  5. Rawlins, M.A.; Serreze, M.C.; Schroeder, R.; Zhang, X.; McDonald, K.C. Diagnosis of the record discharge of Arctic-draining Eurasian Rivers in 2007. Environ. Res. Lett. 2009, 4, 045011. [Google Scholar] [CrossRef] [Green Version]
  6. Alekseevskii, N.I.; Magritskii, D.V.; Mikhailov, V.N. Anthropogenic and natural changes in hydrological restrictions for the use of natural resources in the deltas of the Russian Arctic. Water Manag. Russ. Probl. Technol. Manag. 2015, 1, 14–31. [Google Scholar]
  7. Yang, D.; Kane, D.L.; Hinzman, L.; Zhang, X.; Zhang, T.; Ye, H. Siberian Lena River hydrologic regime and recent change. J. Geophys. Res. 2002, 107, ACL-14. [Google Scholar] [CrossRef]
  8. Tananaev, N.I.; Makarieva, O.M.; Lebedeva, L.S. Trends in annual and extreme flows in the Lena River basin, Northern Eurasia. Geophys. Res. Lett. 2016, 43, 10764–10772. [Google Scholar] [CrossRef]
  9. Ridder, N.N.; Pitman, A.J.; Westra, S.; Ukkola, A.; Do, H.X.; Bador, M.; Hirsch, A.L.; Evans, J.P.; Di Luca, A.; Zscheischler, J. Global hotspots for the occurrence of compound events. Nat. Commun. 2020, 11, 5956. [Google Scholar] [CrossRef]
  10. Anisimov, O.; Streletskiy, D. Geocryological Hazards of Thawing Permafrost. Arctika XXI Century 2015, 2, 60–74. (In Russian) [Google Scholar]
  11. Kolokolova, N.A.; Garris, N.A. About the choice of method of laying pipelines in permafrost. J. THNP 2013, 1, 13–17. (In Russian) [Google Scholar]
  12. Akimov, V.A.; Sokolov, Y.I.; Sosunov, I.V. Global and National Priorities for Disaster Risk Reduction; VNII GOChS (FC) All-Russian Research Institute for Civil Defence of the EMERCOM of Russia (the Federal Science and High Technology Center): Moscow, Russia, 2016; 396p. (In Russian) [Google Scholar]
  13. Pravdaurfo.ru. A New Section of the Destroyed Salekhard-Nadym Highway Is Blocked in YANAO. Available online: https://pravdaurfo.ru/novost/v-yanao-perekryvayut-novyj-uchastok-razrushennoj-trassy-salekhard-nadym/ (accessed on 20 November 2021). (In Russian).
  14. Ria.ru. Traffic Was Closed on the Kolyma Highway Section due to Flooding. Available online: https://ria.ru/society/20170717/1498659385.html (accessed on 19 April 2018). (In Russian).
  15. Newizv.ru. The flood in the Magadan region broke the record of 1939. Available online: https://newizv.ru/news/incident/06-08-2019/navodnenie-v-magadanskoy-oblasti-pobilo-rekord-1939-goda (accessed on 20 November 2021). (In Russian).
  16. Gosudarstvennaja Programma Rossijskoj Federacii «Social’no-Jekonomicheskoe Razvitie Arkticheskoj Zony Rossijskoj Federacii», Utverzhdena Postanovleniem Pravitel’stva Rossijskoj Federacii ot 21 Aprelja 2014 g. № 366 (v Redakcii Postanovlenija Pravitel’stva Rossijskoj Federacii ot 31 Avgusta 2017 g. № 1064). The State Program of the Russian Federation “Socio-Economic Development of the Arctic Zone of the Russian Federation”. Approved by the Government of the Russian Federation of April 21, 2014, No. 366 (as Amended by Government Decree No. 1064 of 31 August 2017). Available online: http://static.government.ru/media/files/GGu3GTtv8bvV8gZxSEAS1R7XmzloK6ar.pdf (accessed on 19 April 2018). (In Russian)
  17. Regnum.ru. A Railway from Yakutia to Magadan Can Be Built along the Kolyma Highway. Available online: https://regnum.ru/news/economy/3352653.html (accessed on 20 November 2021). (In Russian).
  18. Interfax.ru. The Construction of a Bridge across the Lena River in Yakutia Will Be Half Paid by the State. Available online: https://www.interfax.ru/russia/757608 (accessed on 20 November 2021). (In Russian).
  19. Prikaz Ministerstva Ekonomicheskogo Razvitiya Rossijskoj Federacii (MINEKONOMRAZVITIYA Rossii) №267 ot 13 Maya 2021 g. Ob Utverzhdenii Metodicheskih Rekomendacij i Pokazatelej po Voprosam Adaptacii k Izmeneniyam Klimata. Order of the Ministry of Economic Development of the Russian Federation No. 267 Dated May 13, 2021 On Approval of Methodological Recommendations and Indicators on Adaptation to Climate Change. Available online: https://www.economy.gov.ru/material/file/b3cc582c24e7367170b5605f1199c6a9/267_13052021.pdf (accessed on 9 October 2021). (In Russian)
  20. Brown, J.; Ferrians, O.J., Jr.; Heginbottom, J.A.; Melnikov, E.S. 211 Circum-Arctic Map of Permafrost and Ground-Ice Conditions. Available online: https://nsidc.org/212data/ggd318.html (accessed on 1 December 2021).
  21. Hydrometeorological Information—World Data Center. Available online: http://meteo.ru/ (accessed on 5 September 2021). (In Russian).
  22. Makarieva, O.M.; Nesterova, N.V.; Beldiman, I.N.; Lebedeva, L.S. Actual Problems of Hydrological Assessments in the Arctic Zone of Russian Federation and Adjacent Permafrost Territories. Прoблемы Арктики и Антарктики 2018, 64, 101–118. [Google Scholar] [CrossRef]
  23. USSR State Committee for Hydrometeorology and Environmental Control. State Water Cadastre. Long-Term Data on the Regime and Resources of Land Surface Waters; 1 (15); Gidrometeoizdat: Leningrad, USSR, 1986. (In Russian) [Google Scholar]
  24. USSR State Committee for Hydrometeorology and Environmental Control. State Water Cadastre. Long-Term Data on the Regime and Resources of Land Surface Waters; 1 (16); Gidrometeoizdat: Leningrad, USSR, 1987. (In Russian) [Google Scholar]
  25. USSR State Committee for Hydrometeorology and Environmental Control. State Water Cadastre. Long-Term Data on the Regime and Resources of Land Surface Waters; 1 (17); Gidrometeoizdat: Leningrad, USSR, 1985. (In Russian) [Google Scholar]
  26. Automated Information System of State Monitoring of Water Bodies. Available online: https://gmvo.skniivh.ru/ (accessed on 5 September 2021). (In Russian).
  27. Gelder, P.H.A.J.M. Statistical Estimation Methods in Hydrological Engineering. In Proceedings of the International Scientific Seminar, Irkutsk, Russia, 16–23 June 2003; Korytny, L.M., Luxemburg, W.M., Eds.; Publishing House of the Institute of Geography: Moscow, Russia, 2004; p. 11. [Google Scholar]
  28. England, J.F., Jr.; Cohn, T.A.; Faber, B.A.; Stedinger, J.R.; Thomas, W.O.; Veilleux, A.G., Jr.; Kiang, J.E.; Mason, R.R., Jr. Guidelines for determining flood flow frequency—Bulletin 17C. In Techniques and Methods; Book 4; U.S. Geological Survey: Reston, VA, USA, 2019; Chapter 5; p. 148. [Google Scholar] [CrossRef] [Green Version]
  29. World Meteorological Organization. Technical Note, No. 98. Estimation of Maximum Floods: Report of a Working Group; Secretariat of the World Meteorological Organization: Geneva, Switzerland, 1969; Volume 233, p. 208. [Google Scholar]
  30. Asquith, W.H.; Slade, R.M. Documented and potential extreme peak discharges and relation between potential extreme peak discharges and probable maximum flood peak discharges in Texas. In U.S. Geological Survey Water-Resources Investigations Report 95–4249; U.S. Geological Survey: Reston, VA, USA, 1995; p. 58. Available online: https://pubs.er.usgs.gov/publication/wri954249 (accessed on 1 December 2021).
  31. Singh, A.; Singh, V.P.; Byrd, A.R. Computation of probable maximum precipitation and its uncertainty. Int. J. Hydrol. 2018, 2, 504–514. [Google Scholar] [CrossRef] [Green Version]
  32. Madsen, H.; Lawrence, D.; Lang, M.; Martinkova, M.; Kjeldsen, T.R. (Eds.) A Review of Applied Methods in Europe for Flood Frequency Analysis in a Changing Environment; Centre for Ecology & Hydrology on behalf of COST: Swindon, UK, 2012; p. 189. [Google Scholar]
  33. Federal Hydrologic and Hydraulic Procedures for Flood Hazard Delineation Version 1.0 2019 Natural Resources Canada General Information Product 113e.; Natural Resources Canada—Public Safety Canada: Ottawa, Canada, 2019; p. 72.
  34. Khaliq, M.N. An Inventory of Methods for Estimating Climate Change-Informed Design Water Levels for Floodplain Mapping; Technical Report; National Research Council of Canada, Ocean, Coastal and River Engineering: Ottawa, Canada, 2019. [Google Scholar] [CrossRef]
  35. SP 33-101-2003; Determination of Basic Calculated Hydrological Characteristics. Gosstroy of Russia: Moscow, Russia, 2004; p. 73. (In Russian)
  36. SNiP 2.01.14-83; Determination of Calculated Hydrological Characteristics. Stroyizdat: Moscow, Russia, 1983; p. 97. (In Russian)
  37. State Hydrological Institute. Methodological Recommendations for Determining the Calculated Hydrological Characteristics in the Presence of Hydrometric Observations; Vector-TiS: Nizhny Novgorod, Russia, 2007; p. 134. (In Russian) [Google Scholar]
  38. State Hydrological Institute. Methodological Recommendations for the Determination of Computed Hydrological Characteristics when Hydrometric Observations Are Inadequate; AARI: Saint Petersburg, Russia, 2008; p. 66. (In Russian) [Google Scholar]
  39. State Hydrological Institute. Methodological Recommendations for Determining the Calculated Hydrological Characteristics in the Absence of Hydrometric Observations; Nestor-History: Saint Petersburg, Russia, 2009; p. 193. (In Russian) [Google Scholar]
  40. Makarieva, O.M.; Bel’diman, I.N.; Lebedeva, L.S.; Vinogradova, T.A.; Nesterova, N.V. To the question of the validity of the recommendations of SP 33-101-2003 for calculating the characteristics of the maximum runoff of small rivers in the zone of permafrost area (in the order of discussion). Eng. Surv. 2017, 6–7, 50–63. (In Russian) [Google Scholar] [CrossRef]
  41. Schramm, I.; Boike, J.; Bolton, W.R.; Hinzman, L.D. Application of TopoFlow, a spatially distributed hydrological model, to the Imnavait Creek watershed, Alaska. J. Geophys. Res. 2007, 112, G04S46. [Google Scholar] [CrossRef] [Green Version]
  42. Pomeroy, J.W.; Gray, D.M.; Brown, T.N.; Hedstrom, R.; Quinton, W.L.; Granger, R.J.; Carey, S.K. The cold regions hydrological model: A platform for basing process representation and model structure on physical evidence. Hydrol. Process. 2007, 21, 2650–2667. [Google Scholar] [CrossRef]
  43. Cuo, L.; Zhang, Y.; Bohn, T.J.; Zhao, L.; Li, J.; Liu, Q.; Zhou, B. Frozen soil degradation and its effects on surface hydrology in the northern Tibetan Plateau. J. Geophys. Res. Atmos. 2015, 120, 8276–8298. [Google Scholar] [CrossRef] [Green Version]
  44. Rensheng, C.; Wang, G.; Yang, Y.; Liu, J.; Chuntan, H.; Song, Y.; Liu, Z.; Kang, E. Effects of Cryospheric Change on Alpine Hydrology: Combining a Model With Observations in the Upper Reaches of the Hei River, China. J. Geophys. Res. Atmos. 2018, 123, 3414–3442. [Google Scholar]
  45. Dall’Amico, M.; Endrizzi, S.; Gruber, S.; Rigon, R. A robust and energy-conserving model of freezing variably-saturated soil. Cryosphere 2011, 5, 469–484. [Google Scholar] [CrossRef] [Green Version]
  46. Gusev, Y.; Nasonova, O.; Dzhogan, L. Reproduction of Pechora runoff hydrographs with the help of a model of heat and water exchange between the land surface and the atmosphere (SWAP). Water Resour. 2010, 37, 182–193. [Google Scholar] [CrossRef]
  47. Motovilov, Y.G. ECOMAG: Distributed model of runoff formation and pollution transformation in river basins. IAHS Publ. 2013, 361, 227–234. [Google Scholar]
  48. Vinogradov, Y.B.; Semenova, O.M.; Vinogradova, T.A. An approach to the scaling problem in hydrological modelling: The deterministic modelling hydrological system. Hydrol. Processes 2011, 25, 1055–1073. [Google Scholar] [CrossRef]
  49. Semenova, O.; Lebedeva, L.; Vinogradov, Y. Simulation of subsurface heat and water dynamics, and runoff generation in mountainous permafrost conditions, in the Upper Kolyma River basin, Russia. Hydrogeol. J. 2013, 21, 107–119. [Google Scholar] [CrossRef]
  50. National Science Foundation Long-Term Ecological Research (LTER). Available online: https://lternet.edu (accessed on 1 April 2018).
  51. NPR—A Hydrology, Water and Environmental Research Centre. Available online: http://ine.uaf.edu (accessed on 1 April 2018).
  52. Arctic Observatory Network (AON). International Study of Carbon, Water, and Energy Balances in the Terrestrial Arctic. Available online: http://aon.iab.uaf.edu (accessed on 1 April 2018).
  53. Global Water Future. Available online: https://gwf.usask.ca/ (accessed on 15 October 2021).
  54. Global Water Future. Datasets Generated by Previous Projects Changing Cold Regions Network (CCRN). Available online: https://gwf.usask.ca/outputs-data/data.php (accessed on 15 October 2021).
  55. Management of Streamflow Stations; Gidrometeoizdat: Leningrad, USSR, 1954; p. 287. (In Russian)
  56. Makarieva, O.; Nesterova, N.; Lebedeva, L.; Sushansky, S. Water balance and hydrology research in a mountainous permafrost watershed in upland streams of the Kolyma River, Russia: A database from the Kolyma Water-Balance Station, 1948–1997. Earth Syst. Sci. Data 2018, 10, 689–710. [Google Scholar] [CrossRef] [Green Version]
  57. Lebedeva, L.S.; Makarieva, O.M.; Vinogradova, T.A. Spatial variability of the water balance elements in mountain catchments in the North-East Russia (case study of the Kolyma Water Balance Station). Meteorol. Hydrol. J. 2017, 4, 90–101. (In Russian) [Google Scholar]
  58. Mikhailov, V.M. Floodplain Taliks of Northeast of Russia; Geo: Novosibirsk Russia, 2013; p. 244. (In Russian) [Google Scholar]
  59. Lebedeva, L.S.; Semenova, O.M.; Vinogradova, T.A. Hydrological modeling: Seasonal thaw depths in different landscapes of the Kolyma Water Balance Station (Part 2). Earth’s Cryosphere 2015, 2, 35–44. (In Russian) [Google Scholar]
  60. Makarieva, О.М.; Lebedeva, L.S.; Vinogradova, T.A. Modelling of runoff formation processes at small mountain watersheds in the permafrost zone (by the data of the Kolyma Water Balance Station). Earth’s Cryosphere 2020, 1, 43–56. (In Russian) [Google Scholar]
  61. Vasilenko, N.G. Hydrology of the Rivers of the BAM Zone: Expeditionary Research; Nestor-History: Saint Petersburg, Russia, 2013; p. 672. (In Russian) [Google Scholar]
  62. Practical Recommendations on the Calculation of Hydrological Characteristics in the Zone of Economic Development of the Baikal-Amur Mainline; Gidrometeoizdat: Leningrad, USSR, 1986; p. 180. (In Russian)
  63. Vasilenko, N.G.; Khersonskii, E.S. Calculation of the maximum discharge of rain floods in the area of the BAM trail. Proc. SHI 1986, 312, 93–104. (In Russian) [Google Scholar]
  64. Nesterova, N.V.; Makarieva, O.M.; Vinogradova, T.A.; Lebedeva, L.S. Modelling of runoff formation processes in the zone of Baikal-Amur Main line based on the data of the Mogot research site. Water Sect. Russ. Probl. Technol. Manag. 2017, 1, 18–36. (In Russian) [Google Scholar]
  65. Semenova, O.; Vinogradov, Y.; Vinogradova, T.; Lebedeva, L. Simulation of Soil Profile Heat Dynamics and their Integration into Hydrologic Modelling in a Permafrost Zone. Permafr. Periglac. Process. 2015, 25, 257–269. [Google Scholar] [CrossRef]
  66. Nesterova, N.; Makarieva, O.; Post, D.A. Parameterizing a hydrological model using a short-term observational dataset to study runoff generation processes and reproduce recent trends in streamflow at a remote mountainous permafrost basin. Hydrol. Process. 2021, 35, e14278. [Google Scholar] [CrossRef]
  67. Research Station Samoylov Island. Available online: https://eu-interact.org/field-sites/research-station-samoylov-island/ (accessed on 15 October 2021).
  68. Boike, J.; Nitzbon, J.; Anders, K.; Grigoriev, M.; Bolshiyanov, D.; Langer, M.; Lange, S.; Bornemann, N.; Morgenstern, A.; Schreiber, P.; et al. A 16-year record (2002–2017) of permafrost, active-layer, and meteorological conditions at the Samoylov Island Arctic permafrost research site, Lena River delta, northern Siberia: An opportunity to validate remote-sensing data and land surface, snow, and permafrost models. Earth Syst. Sci. Data 2019, 11, 261–299. [Google Scholar] [CrossRef] [Green Version]
  69. Gartsman, B.I.; Shamov, V.V. Field studies of runoff formation in the Far East region based on modern observational instruments. Water Resour. 2015, 6, 589–599. [Google Scholar] [CrossRef]
  70. Tananaev, N.I.; Teisserenc, R. Building a Multi-Disciplinary Observatory in the Lower Yenisei Region (Igarka Geocryology Lab). In Proceedings of the Arctic Science Summit Week 2015, Toyama, Japan, 23–30 April 2015; p. 1. [Google Scholar]
  71. Lebedeva, L.S.; Bazhin, K.I.; Khristoforov, I.I.; Abramov, A.A.; Pavlova, N.A.; Efremov, V.S.; Ogonerov, V.V.; Tarbeeva, A.M.; Fedorov, M.P.; Nesterova, N.V.; et al. Suprapermafrost subaerial taliks, central Yakutia, Shestakovka River basin. Earth’s Cryosphere 2019, 23, 40–50. [Google Scholar] [CrossRef]
  72. Frolova, N.L.; Alekseevskii, N.I.; Zhuk, V.A. Monitoring of hydrological processes and ensuring the safety of water use. Environ. Manag. 2014, 3, 66–68. (In Russian) [Google Scholar]
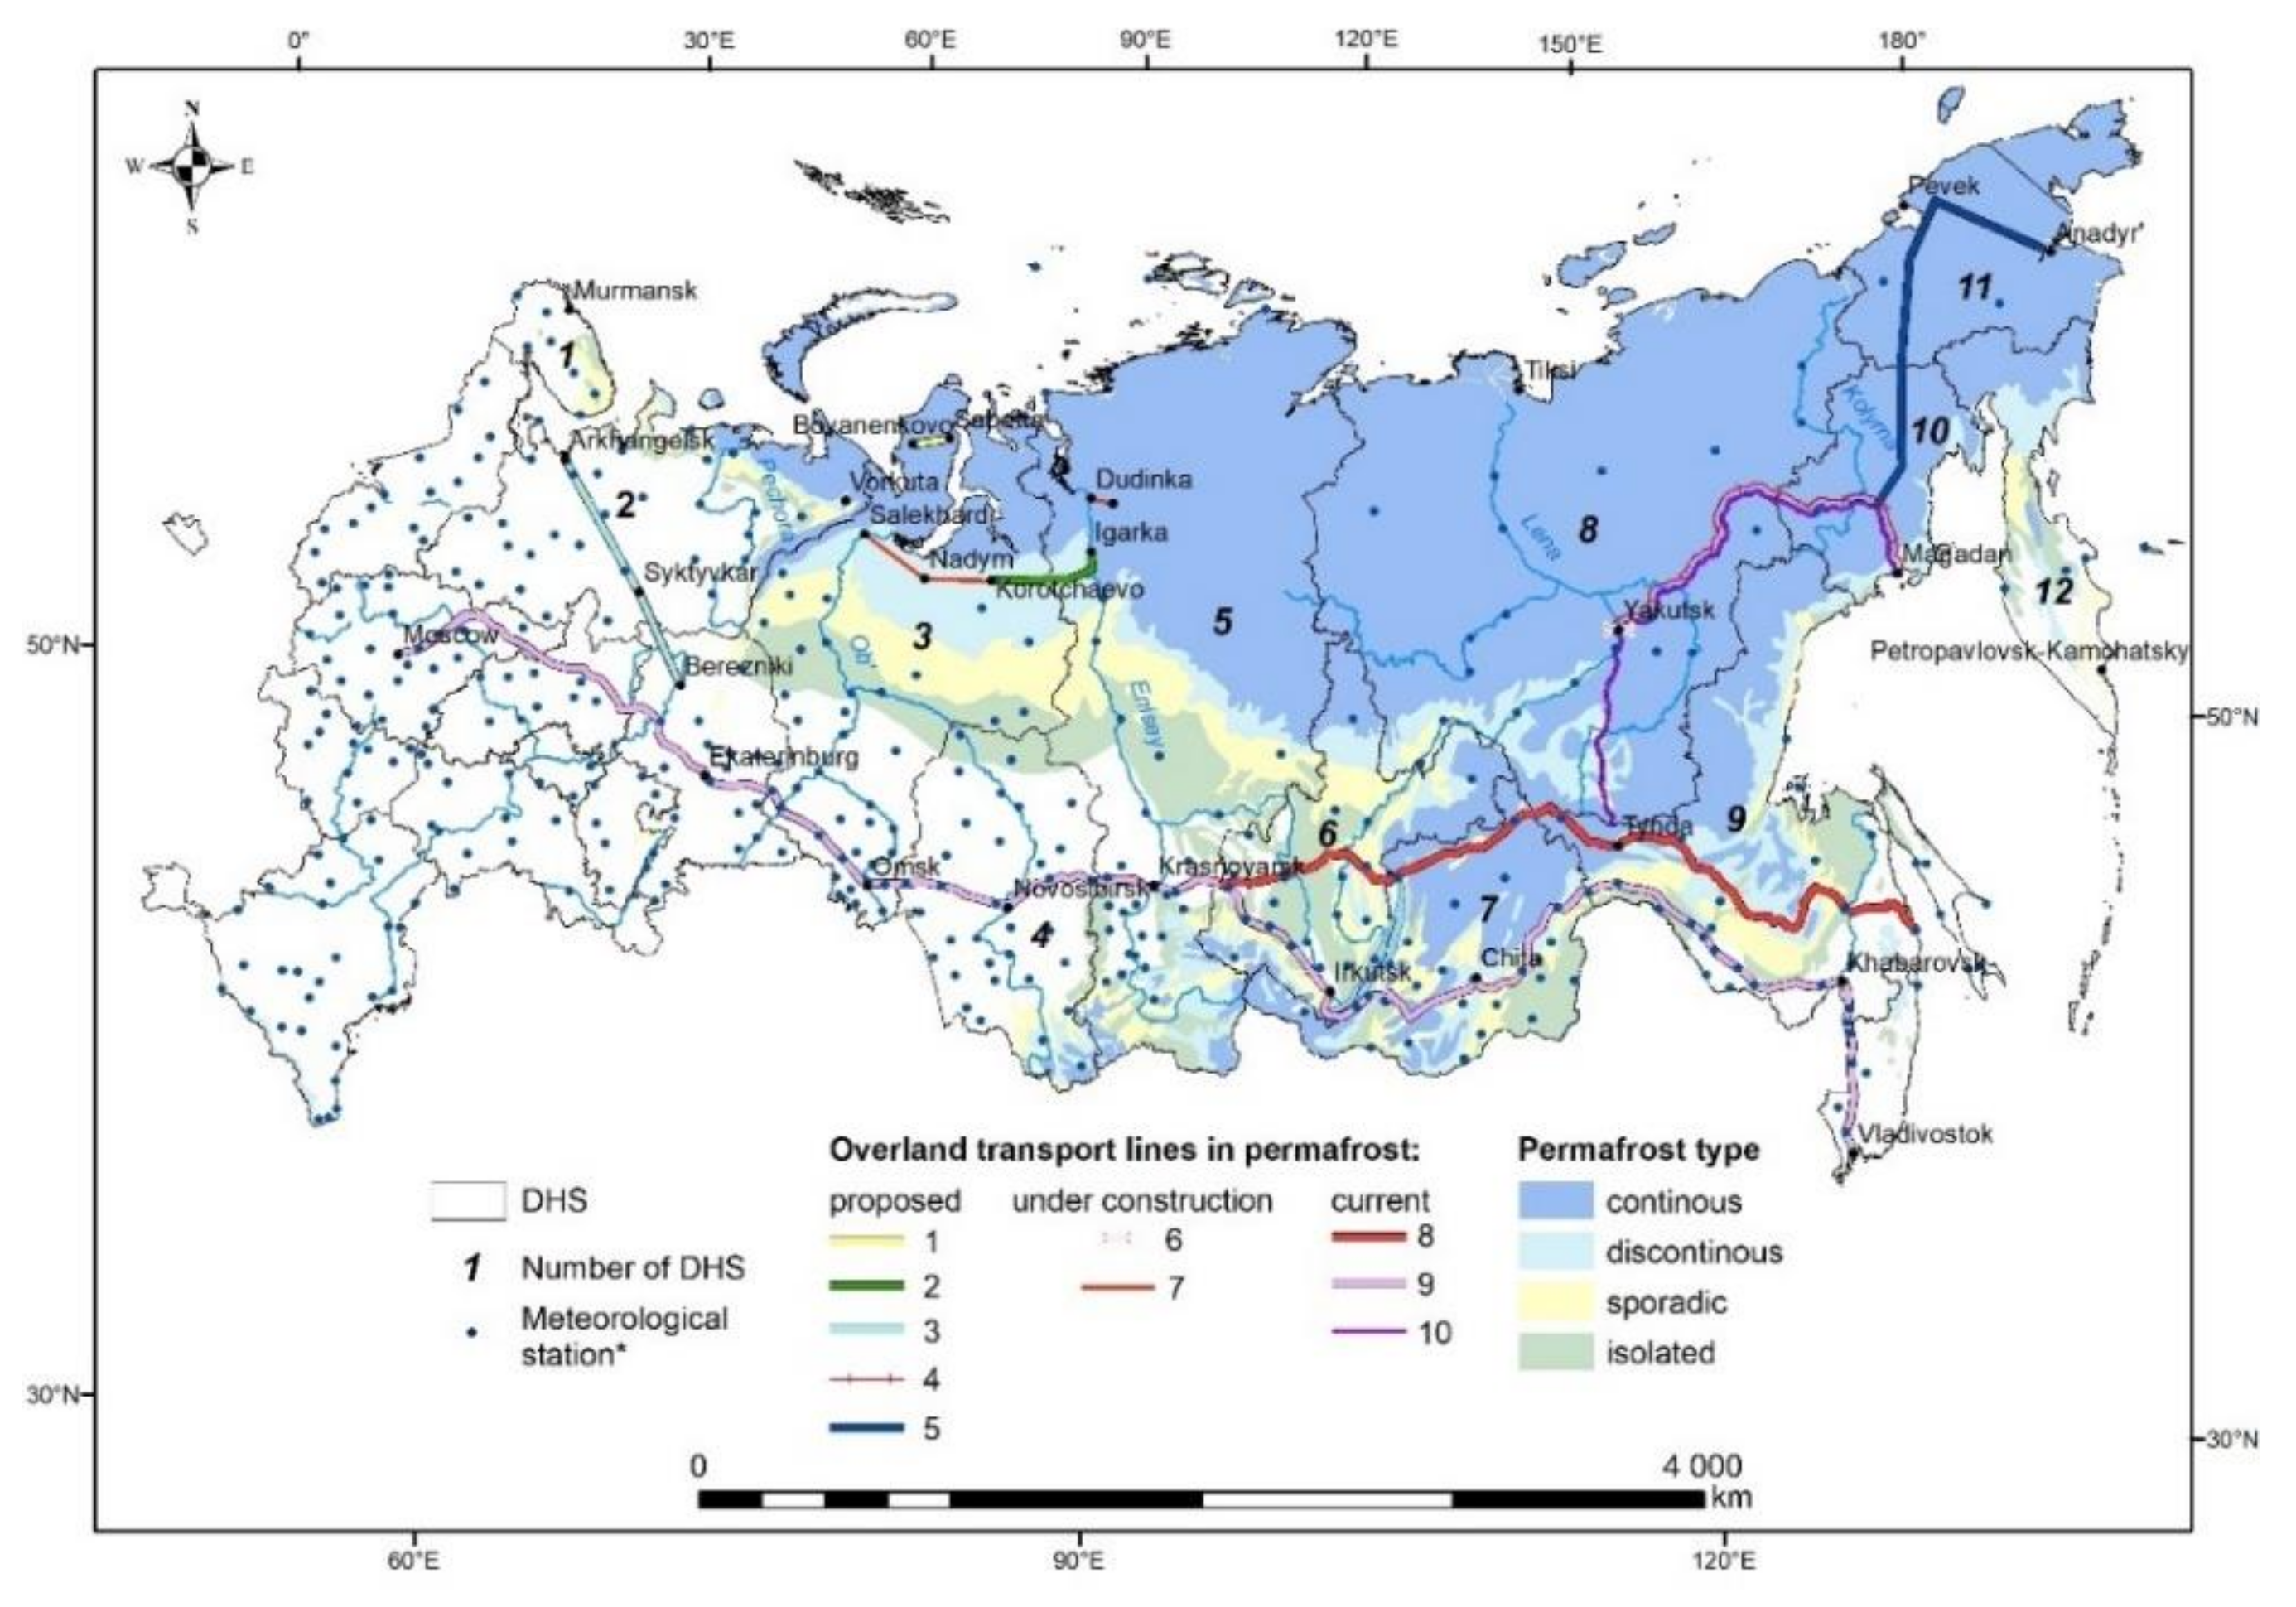
Figure 1. Distribution of permafrost type in the departments of Russian Hydrometeorological Service (DHS) located in permafrost zone (the number of DHS corresponds with Table 1 and Table 2) and * the meteorological stations of Russian Hydrometeorological Service monitoring ground temperature at 0.8–3.2 m depth (N) in 2008. 1—“Bovanenkovo—Sabetta”; 2—railway Korotchaevo—Igarka; 3—“Belkomur” (program of the Russian Arctic); 4—railway Nizhny Bestyakh—Magadan, 5—Kolyma highway—Anadyr; 6—the bridge over the Lena river; 7—railway “Severny shirotny khod”; 8—Baikal-Amur line; 9—Transsib; 10—Kolyma highway and part of the Lena highway.
Energies 15 02649 g001
Figure 2. Total density (number of gauges per 100,000 km2) and location of hydrological network with streamflow observations in the departments of Russian Hydrometeorological Service of permafrost zone (DHS, the numbers correlate to Table 1 and Table 2) by 2019.
Energies 15 02649 g002
Figure 3. The density of hydrological gauges with streamflow discharge observations is classified by basin area in different DHS (see Table 1 and Table 2) with indicated permafrost (%) for DHS territory.
Energies 15 02649 g003
Figure 4. Observed (black) and simulated (red) streamflow hydrographs; 1—Sakharynia, 2—Artyk-Yuryah; (ac)—high, low and average NS criteria.
Energies 15 02649 g004
Figure 5. Observed (black) and simulated (red) streamflow hydrographs; 1—Anmangynda, 2—Charky; (ac)—high, low and average NS criteria.
Energies 15 02649 g005
Table 1. Distribution of permafrost type (%) in the departments of Russian Hydrometeorological Service (DHS) located in a permafrost zone and the number of meteorological stations monitoring ground temperature at 0.8–3.2 m depth (N) in 2019.
DHSArea,
mln km2
Type of Permafrost (%–mln km2–N)
ContinuousDiscontinuousSporadicIsolatedAll
  • Murmansk
0.140–0.00–01–0.00–116–0.02–08–0.01–026–0.04–1
2.
North
1.1415–0.17–12–0.02–04–0.05–14–0.05–126–0.30–3
3.
Ob-Irtysh
1.5121–0.32–020–0.30–018–0.27–414–0.21–673–1.10–13
4.
West Siberian
0.842–0.02–03–0.03–35–0.04–59–0.08–219–0.16–10
5.
Central Siberian
2.5456–1.42–58–0.20–011–0.28–014–0.36–989–2.26–14
6.
Irkutsk
0.773–0.18–215–0.12–324–0.19–7 29–0.22–791–0.70–19
7.
Transbaikal
0.7847–0.37–4 15–0.12–618–0.14–717–0.13–897–0.76–25
8.
Yakutsk
3.0693–2.84–165–0.15–01–0.03–21–0.03–2100–3.06–20
9.
Far East
1.1833–0.39–120–0.24–213–0.15–214–0.17–681–0.95–11
10.
Kolyma
0.4687–0.40–111–0.05–11–0.00–01–0.00–0100–0.46–2
11.
Chukotka
0.71100–0.71–30–0.00–00–0.00–00–0.00–0100–0.71–3
12.
Kamchatka
0.4630–0.14–019–0.09–09–0.04–011–0.05–169–0.32–1
Total14.351–6.96–33 10–1.31–169–1.21–2810–1.31–4280–10.8–122
km2 per station 210,00069,00043,00030,00087,000
Table 2. The number of hydrological gauges where streamflow discharge is measured, classified by basin area.
DHS<200200–20002000–10,000>10,000All
198020082019198020082019198020082019198020082019198020082019
  • Murmansk
2185391815161110911853831
2.
North
1899917071635149343031206160160
3.
Ob-Irtysh
7003518193621245435421327485
4.
West Siberian
1254826564685355474641209169164
5.
Central Siberian
151414504745363334524238153136131
6.
Irkutsk
14774330314531302726271299495
7.
Transbaikal
24108934941575344373934211151127
8.
Yakutsk
38201628131225171360575515110796
9.
Far East
201615332428232219201617967879
10.
Kolyma
3612717551322833742217
11.
Chukotka
70061040012222932
12.
Kamchatka
372119382424175610871025856
Total249122104555364355403299286370305298157710901043
Publisher’s Note: MDPI stays neutral with regard to jurisdictional claims in published maps and institutional affiliations.