Article

Spatial and Temporal Variability of Permafrost in the Western Part of the Russian Arctic

1
Earth’s Cryosphere Institute, Tyumen Scientific Center SB RAS, 625026 Tyumen, Russia
2
Institute of Environmental and Agricultural Biology (X-BIO), Tyumen State University, 625003 Tyumen, Russia
3
Hydrogeological Faculty, Sergo Ordzhonikidze Russian State University for Geological Prospecting, 117485 Moscow, Russia
4
Arctic Research Center, Yamal-Nenets Autonomous District, 629008 Salekhard, Russia
5
Institute of Geography, Russian Academy of Sciences, 119017 Moscow, Russia
6
Institute of Plant and Animal Ecology, Ural Branch of the Russian Academy of Sciences, 629400 Labytnangi, Russia
7
Geophysical Institute, University of Alaska Fairbanks, Fairbanks, AK 99775, USA
8
Faculty of Geology, Lomonosov Moscow State University, 119991 Moscow, Russia
*
Authors to whom correspondence should be addressed.
Energies 2022, 15(7), 2311; https://doi.org/10.3390/en15072311
Submission received: 31 December 2021 / Revised: 28 January 2022 / Accepted: 29 January 2022 / Published: 22 March 2022

Abstract

:
Climate warming in the Russian Arctic over the past 40 years shows a variety of patterns at different locations and time periods. In the second half of the 20th century, the maximum rates of warming were characteristic of the subarctic permafrost regions of Russia. But in the 21st century, the locations of the greatest rates of climate warming moved to the Arctic zone of Russia. It was one of the reasons for a sharp increase in permafrost temperatures, an increase in the depth of seasonal thaw, and the formation of closed taliks. It was found that as a result of climate change, the differences in permafrost temperatures between different cryogenic landscapes in the area of continuous and discontinuous permafrost distribution have decreased, and in the area of sporadic permafrost distribution are now practically absent. The thermal regime of the ground shows dramatic changes everywhere with a pronounced reduction in the depth of zero annual amplitude.

1. Introduction

The study of the state of permafrost is an important aspect of environmental monitoring in Polar regions. The main characteristics of the state of permafrost are the distribution and temperature regime of permafrost, the depth of seasonal thawing and freezing, and the development of periglacial processes. In addition, observations at monitoring sites include studies of climatic characteristics (air and ground-surface temperature, precipitation, etc.), the state and dynamics of ground covers (snow and vegetation), and the recovery rate of disturbed sites [1]. The ground thermal regime in permafrost regions is characterized by the mean annual ground temperature (MAGT) within the active layer, the mean annual temperature of permafrost, the amplitude of temperature fluctuations at different depths throughout the year, and by the depth of zero annual amplitudes (DZAA). The depth of zero annual amplitude is the depth at which the ground temperature changes throughout the year do not exceed 0.1 °C [2].
In recent decades, the problem of permafrost degradation during climate warming in the Arctic has become a priority. Permafrost plays an important role in global climate change, carbon balance, and environmental changes in Arctic regions [3,4]. In-situ evidence shows a warming climate over the past 40–50 years and an increase in MAGT in northern permafrost regions, including the western sector of the Russian Arctic (WRA) [5,6]. Climate warming in the WRA has been recorded since the late 1960s [7,8]. Favorable conditions for permafrost degradation have developed all-over this permafrost region in the 21st century. There is an increase in MAGT, deepening of the permafrost table and replacement of seasonal thawing by seasonal freezing with a development of a residual thaw layer (talik) [9,10,11]. These processes are more pronounced in areas of anthropogenic intervention [12,13,14]. Climate changes also manifested themselves in a gradual northward movement of ecological zones [15,16].
The state of permafrost is studied at specialized monitoring sites, profiles, stations, boreholes and outcrops. The duration of observation at many stations in the permafrost region of Russia reaches 30–40 years, and at a number of sites systematic measurements are carried out over 50 years. Currently, monitoring of permafrost in Russia is developing and expanding the number of observation sites within the framework of the International Circumpolar Active Layer Monitoring (CALM) program and the International Thermal State of Permafrost Project (TSP) [17]. The monitoring data are transferred to the International Database, analyzed, and published annually [3,4,18,19]. Based on the monitoring observations in WRA, extensive factual material was collected and organized into available data archives and GIS packages. The data analysis made it possible to carry out permafrost-climatic cyclic relationships and trend assessments with a high degree of reliability and to obtain several new insights on the evolution and current state of permafrost. These results have been published in regional permafrost assessments [11,15,20,21,22,23,24,25,26,27]. The permafrost monitoring data prove extremely useful in studying the changes in the permafrost regions under climate change and anthropogenic impacts [10,14,28].
The article summarizes long-term data of permafrost monitoring in WRA and shows spatiotemporal variability of patterns in the thermal regime. The multi-scale maps of permafrost dynamics for specific regions were developed based on field data, which validate the existing cartographic representations of recent changes in permafrost regions [18,29,30,31,32].

2. Materials and Methods
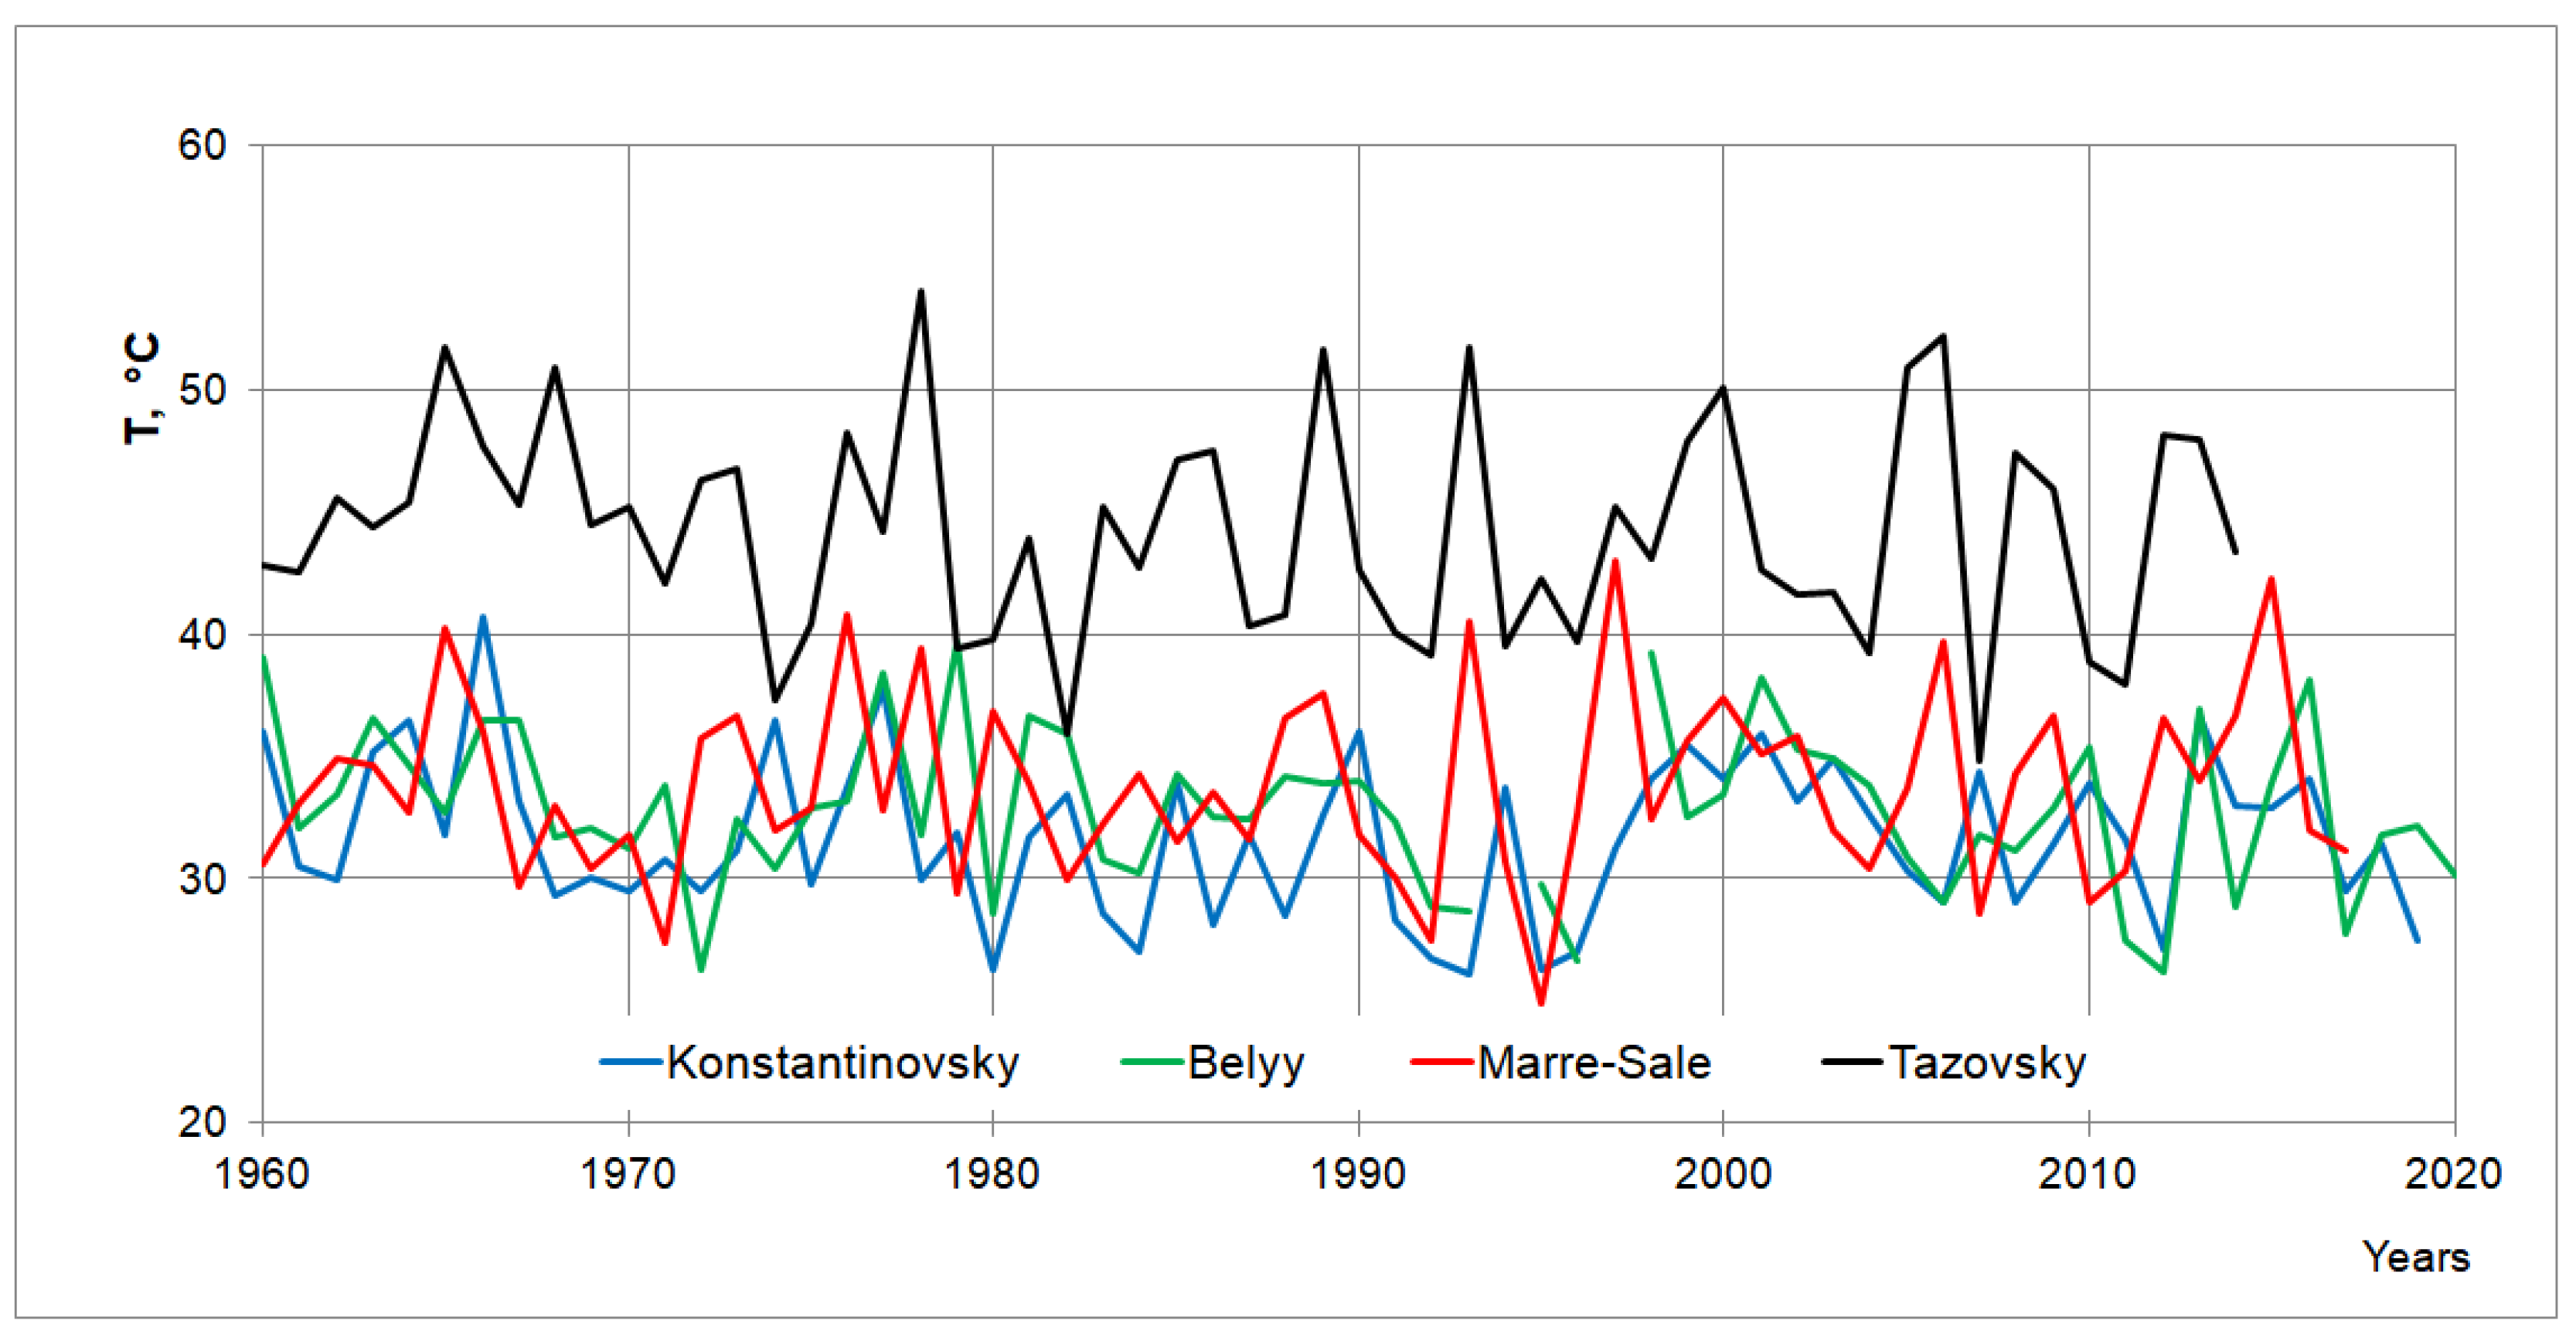
The monitoring of natural changes in the state of permafrost is mostly carried out at observational stations and at periodically visited survey sites. The results are extrapolated and interpolated based on landscape maps produced using remote sensing methods. The article discusses the results of observations of the permafrost thermal regime and active layer obtained at reference stations and sites in different bioclimatic zones of the WRA permafrost region (Figure 1, Table 1).
A representative database of the state of permafrost currently exists for WRA, including 13 specialized active layer monitoring sites and 64 boreholes equipped for monitoring the ground thermal regime across a range of landscape conditions. A more detailed landscape and geocryological characterization of the reference stations is given in [5,11]. At each station in the dominant landscapes, year-round observations of the ground thermal regime in boreholes from 3 to 30 m are conducted using automated ground temperature loggers HOBO-U12 and HOBO-U23 (Onset Computer Corp., Bourne, MA, USA). The reported accuracy of the Hobo temperature sensors is ±0.20 °C; however, an ice bath calibration was carried out prior to sensor installation, improving the accuracy for temperatures near 0 °C to approximately 0.02 °C [33]. All observations of the permafrost temperature in the boreholes were carried out following the protocol of the international GTN-P project [34] and by the same technical means for all boreholes.
At sites with a regular grid of measurements, which are a part of the international CALM network [17], the position of the permafrost table down to a depth of 2.0 m was monitored using a metal probe. In talik areas with greater depths to the top of permafrost, ground penetrating radar (GPR) and seismic methods have proven to be effective [35,36,37,38,39]. The accuracy of determining the permafrost table position by geophysical methods is 0.1–0.2 m.
Data on changes in the state of permafrost was correlated with climatic data obtained at weather stations of WRA, which were located near the permafrost research stations and sites. The locations and names of weather stations are shown in Figure 1. The most complete and verified array of climatic parameters, such as mean annual, mean monthly and mean daily air temperatures, soil temperature, and precipitation, are freely available [http://meteo.ru/data], accessed on 20 January 2022. Annual Roshydromet reports on climate characteristics in the territory of the Russian Federation were also used [16,40,41]. In addition, some geocryological stations are equipped with their own climate observatories located at the boreholes to monitor the local air and soil surface temperatures typical to these landscape conditions.
The existing stations and sites allow us to compare the features of latitudinal, sectoral and landscape variability of geocryological conditions, and the multi-year series of continuous observations allow us to assess the patterns of their temporal variability over many decades in the past.

3. Climate

According to Roshydromet’s classification, the western sector of the Russian Arctic (WRA) lies within a single quasi-homogeneous climatic region [41]. The general trends of climate change in the European part of Russia and north of Western Siberia are very similar and unidirectional and differ only in the magnitude of changes in individual parameters. Climate warming trends varied spatially and temporally during recent decades in the Russian Arctic [11,23,24,42]. According to weather stations there, the present-day mean annual air temperature (MAAT) increased relative to the climatic norm (the thirty-year period from 1961 to 1990) by 1.4 °C, on average. The thawing index (the sum of positive monthly mean air temperatures during the warm period) increased by 6 degree-months on average and the values of frost index grew by 14 degree-months, i.e., both the warm and the cold seasons warmed up by ~10% (Table 2).
Trends of MAAT were estimated as angular coefficients of linear regression. Change between the modern and standard reference 30-year periods has a noticeable 2–4 times increase in the warming rate (Figure 2).
Seasonal amplitudes of air temperature variations were calculated for each year by measuring the difference between the mean temperature of the warmest and coldest month. These amplitudes had no pronounced tendency to de-crease or increase, although they vary from year to year within a wide range of up to 20 °C at certain weather stations (Figure 3).
The duration of a warm period is an important factor that influences the state and dynamics of permafrost and the development of cryogenic processes, permafrost temperature, and active layer depth. Daily air temperature data showed that the duration of the warm period in a year has increased on average by 10–14 days in recent decades in the WRA because the transition through 0 °C arrives about 1 week earlier in the spring and delays by 1 week in the autumn if compared with the standard reference period (data not shown).
The rates of MAAT changes on the territory of the Russian permafrost region were mapped to assess the spatial and temporal patterns of climate warming for the standard reference period (1961–1990) and the modern period (1991–2020) including data from all weather stations. (Figure 4a), a low trend of MAAT was typical during the 1961–1990 period for vast areas of the Arctic (European part of Russia, Western and Middle Siberia, Far East). In most parts of the subarctic, there was a medium trend of MAAT. Areas with high rates of MAAT change (>0.05 °C/year) were observed locally in the subarctic and occupied less than 10% of the Russian permafrost region. The MAAT trend average across weather stations in the Russian permafrost region was 0.031 °C/year.
During the 1991–2020 period, the MAAT trends increased everywhere. Their spatial distribution patterns have changed significantly. The spatially averaged MAAT trend has increased up to 0.052 °C/year for the Russian permafrost region. High rates of climate warming are typical for almost the entire Arctic, average trends are observed in the subarctic, and low trends are characteristic only for the south of the Russian permafrost region (Figure 4b). Such relocation of the center of climatic warming to the Arctic coast was one of the reasons for intensification of degradation of permafrost in the 21st century including a significant increase in permafrost temperature, increase in the depth of seasonal thawing, and partial thawing of permafrost from the surface with formation of taliks.
Soil moisture content and thermal properties of the seasonally thawed layer change during the summer months mainly due to atmospheric precipitation. The total annual amount of atmospheric precipitation in the 21st century in the western sector of the Russian Arctic has increased on average by 50–100 mm compared to the period of the climatic norm, which corresponds to a trend of 1–3 mm/year [11]. Such values coincide with the predicted estimates of climate models [43]. In the territory with a continental climate, the annual precipitation increase is slightly higher than on the Arctic coast with a temperate maritime climate.
MAGT is significantly influenced by snow cover. Snow cover in the study area begins in the first ten days of October, reaches its maximum in April and thaws completely in late May-early June. The snow cover is thickest in the forest tundra and northern taiga. The modern normal maximum—snow depth in Novy Urengoy area was 114 cm, and in Nadym it was 85 cm. In the typical tundra and shrub tundra, snow cover thickness was much less. On Cape Bolvansky normal average snow depth was about 58 cm, and 33 cm in Marre-Sale. Snow depth has greatly increased in the tundra by 1.8 cm/year in the 21st century. In the forest tundra and northern taiga of Western Siberia, the maximum snow thickness trend was 0.6 cm/year [20]. In general, increasing snow depth contributes to the higher rates of ground warming. However, interannual fluctuations in snow thickness may reach 30–60 cm in different years and, accordingly, have a multidirectional effect on the thermal regime of the active layer and permafrost.
Thus, in general, changes in climatic parameters (increase in air temperature, precipitation, and snow cover thickness) have a negative impact on the stability of permafrost. However, a random combination of fluctuations in climatic parameters may result in short periods (a few years in duration) of permafrost stabilization.

4. Results and Discussion

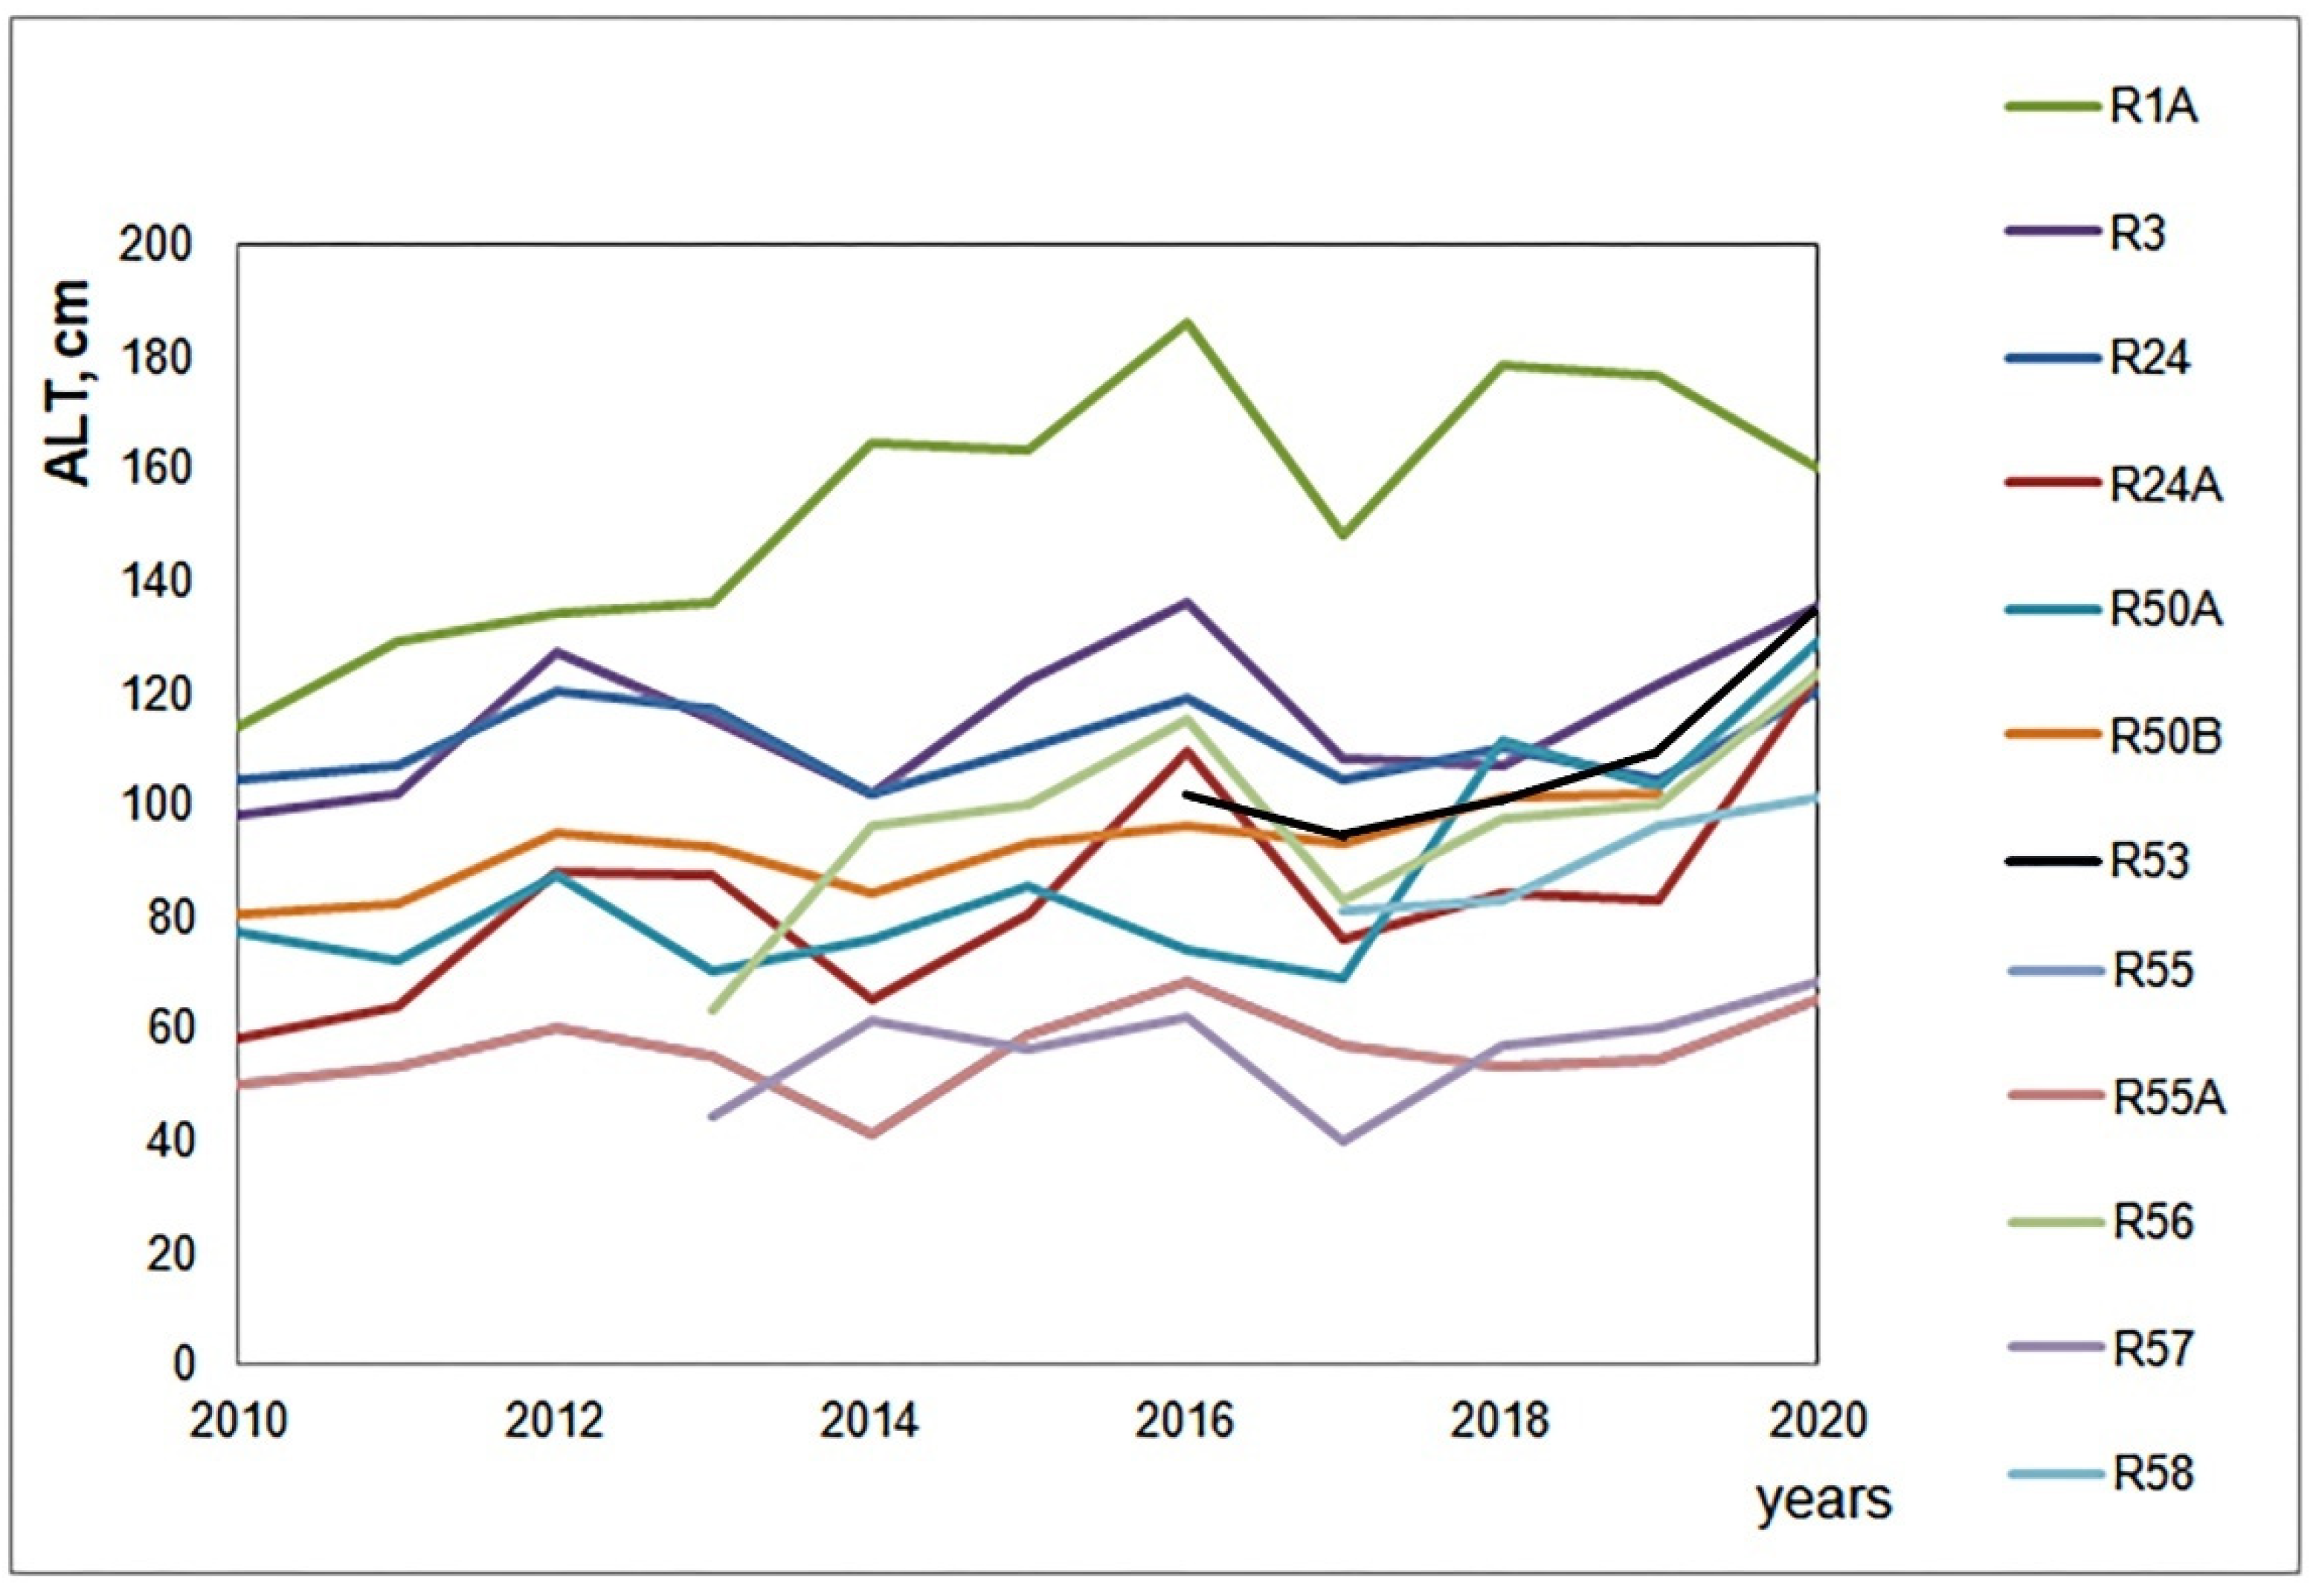
4.1. Active Layer Thickness (ALT)

Modern climatic changes have an immediate impact on the thermal regime of the seasonally thawed layer (STL) and on the maximum depth of the seasonally thawed layer also called the active layer thickness (ALT). Inter-annual variability of ALT at the monitoring sites is substantial and in certain cases exceeds 15–20% of the long-term mean ALT. There is a relatively stable relationship between ALT and the thawing index [44]. Since there is an increase in the sum of above-zero air temperatures and the duration of the warm season, we observe, in general, a multi-year positive trend in ALT at all CALM sites. However, the trend differs significantly across regions and landscape conditions, and the correlation between the increasing thaw depth and thawing indices does not always remain high [12,15,16,20,22,44]. This is related to the effect of other climatic factors on thawing (amount of atmospheric precipitation, characteristics of snow cover, etc.) and to the adaptability of cryogenic landscapes to climatic changes, including growth of mosses, formation of an ice-rich intermediate layer at the base of STL and intra- and interannual variability of the ground thermal properties [11,45].
Observations of the seasonal thaw depth are carried out at 11 monitoring sites in the western sector of the Russian Arctic (see Figure 1). The records of more than 30 years long are available for sites R1, R3, R24, R50A, and R50B. Sites R24A, R56, R57, R58 were established in the last decade. ALT monitoring allowed us to obtain average values for each site, as well as to trace regional and local characteristics in the distribution of this parameter.
At the CALM R1A Nadymsky long-term observational site located on a flat peat plateau (peat thickness up to 0.6 m), the thawing depth could be measured with a metal probe at almost all grid points in 2010. The average STL depth was 114 cm. However, over the last 10 years, the number of points with STL depth of less than 2 m has decreased. In 2015, the probing allowed to measure only 50 out of 121 points of the grid, in 2019—30 points, and in 2020 only 9 points. The average depth of thawing at these 9 points was 160 cm. In the rest of the grid area, the permafrost table descended below 2 m. To find out the actual depth of the permafrost table at these locations, a geophysical survey was carried out. According to the results of seismic profiling, it was established that within the peatland the permafrost table is located at the depths from 2 to 7.5 m, and in waterlogged troughs this depth was more than 8 m. That is, almost the entire area of the CALM R1 grid is underlined by a closed thermal talik above permafrost. A residual thaw layer is now present year-round below the seasonally frozen active layer and above the permafrost table.
Site CALM R50A Urengoy-South is located in the forest tundra and has a heterogeneous landscape structure. Peatlands with peat thickness of 0.5–1 m alternate with sandy hummocky moss-lichen tundra with fragments of larch woodland. The average ALT was 77 cm in 2010. Since then it has gradually increased. In the peatland areas, the average depth of thawing in 2020 reached 129 cm, and in the areas formed with sand from the surface, the thawing depth exceeded 2 m. According to the results of seismic profiling, the permafrost table in the sands descended to a depth of 4–6 m by 2020. Thus, a closed talik was formed on part of the CALM R50A site.
At the CALM site R50B Urengoy—North, located in the southern tundra on the drained watershed with sandy soil, the average depth of thawing in 2010 was 80 cm. Since 2010, the site has been partly disturbed from the process of developing new gas production wells. ALT increased sharply at the site of backfills and along the underground pipelines. By 2012 a closed talik has formed, its depth has not yet been surveyed by geophysical methods or drilling. At the undisturbed part of the site (68 observation points), the thawing depth increased to 102 cm by 2020.
Site CALM R24 Bolvansky is located in the shrub tundra of the European part of Russia in an area of well-drained patchy medallion tundra with soils composed of sandy loam. In the depressions of the local topography, thickets of dense willow have developed. In the western part of the site old off-road vehicle tracks are located. ALT was 104 cm in 2010. Over the last decade, the thawing depth has increased. In the warmest years (2012, 2016, 2020), the thawing depth exceeded the length of the probe in local willow patches and on the old vehicle tracks. In 2020, the thawing depth was measured only at 74 nodes (out of 121 grid points) and was already 120 cm.
On the other CALM sites, the thawing depth is measured at all points of the grid. The thawing depth was also increasing but can still be measured with a metal probe.
Table 3 shows the average values of thaw depth for the monitoring sites under study [calm.gwu.edu]. The trend of ALT over the last decade was calculated for measurements made with the metal probe. The smallest trends were characteristic of sites located in the undisturbed tundra. The maximum thawing depth trend of 8.8 cm/year was observed at the site CALM R53 Harp, and trend of 7.3 cm/year at the site CALM R58 Erkuta, where ALT was measured since 2016 which coincided with a significant increase in air temperature in the last three years. The high thawing trend (6.8 cm/year) at the Nadymsky station cannot be considered reliable, since a closed talik was formed at this site. For the Urengoy-South station (R50A) in the forest tundra, the positive trend of 4.1 cm/year was typical only for the peatland areas, and in the sands a closed thermal talik was formed. At the Labytnangy site (R56) in the forest tundra with 8 years of observations, the thawing trend was 4.7 cm/year. A relatively high trend (3.7 cm/year) was recorded at the Kashin Island (R24A) site, which is located in the shrub tundra, but in interzonal conditions of the Pechora River delta. Thus, against the background of climatic warming, increasing trends in thaw depth were observed everywhere, with the greatest remarkable changes occurring in the forest tundra and northern taiga. In specific landscape conditions or under human-induced disturbances, the thawing rate sharply increases even at sites in the shrub tundra subzone (Figure 5).
The study of the lithological composition and landscape conditions of the CALM sites showed that thawing of permafrost from the surface and the formation of closed taliks begin to occur in landscapes where permafrost ice content is low. These include well-drained areas located on hilltops composed of sandy loams or sands. The presence of peat with strong insulating properties and high ice content in the upper part of the soil column significantly reduces the depth of permafrost thawing and slows down the descending rate of the permafrost table. The minimum values of the seasonal thawing depth in all natural landscapes were observed under the moss layer developed on thick peatlands (polygonal, peat plateaus, palsas, etc.), where ALT does not exceed 60–80 cm and the trends of this depth increase are insignificant regardless of the climatic warming. Peat thickness of less than 25 cm decreases the thawing depth, however during the anomalously hot summers the role of this peat is not that significant.
The study of the lithological composition and landscape conditions of the CALM sites showed that the thawing of permafrost from the surface and the formation of a residual thaw layer occurs in landscapes where the ice content of permafrost is low. These include well-drained areas located on hilltops composed with sandy loams or sands. The presence of peat with strong insulating properties and ice-rich sediments significantly reduces the depth of permafrost thawing and slows down the rate of descending of a permafrost table. The minimum values of the seasonal thawing depth in all natural landscapes were observed under the moss layer developed on thick peatlands (polygonal, peat plateaus, palsas, etc.), where ALT does not exceed 60–80 cm and the trends of this depth increase are insignificant regardless of the climatic warming. A peat thickness of less than 25 cm in the STL decreased thawing depth; however, this was not significant during anomalously hot summers.

4.2. Thermal State of Permafrost

Monitoring data provide an assessment of the current thermal state of permafrost and allow us to evaluate the response of permafrost to climatic changes across different bioclimatic zones and cryogenic landscapes. Generalized data for different environmental settings within the permafrost regions of WRA were obtained by calculating the changes in decadal averages of MAGT for all sites with long periods of observations (Figure 6). There is an unidirectional increasing trend of MAGT in all regions of the Arctic, but with different rates for different environmental conditions. Generally, the rates of ground warming are higher for the regions with cold continuous permafrost and smaller for the warm permafrost areas. As a result, the overall range of the MAGT for different landscapes is reducing.
In the northern taiga and forest tundra of Western Siberia within the area of discontinuous permafrost distribution (stations R1 Nadymsky, R50A South Urengoy, and around Labytnangi and Salekhard), MAGT at 10 m depth varies presently from 0 to −1 °C in all cryogenic landscapes with temperature differences between different landscapes not exceeding 1 °C (Figure 6). The depth of zero annual amplitude of temperature variations (DZAA) lies at 3–6 m. Below this depth, the temperature fluctuations do not exceed ±0.1 °C and the thermal regime of the ground is close to quasi-stationary. Thickening and lateral expansion of thermal closed taliks continue, but the thermal state of the residual thaw layers remains transitional. In warm years, the thickness of the taliks increases. Monitoring of the ground temperature in the active layer and geophysical studies confirm the presence of closed thermal taliks and an increase in the area of their distribution [36,37,38].
In shrub tundra, there is a decrease in the amplitude of seasonal temperature fluctuations in permafrost. DZAA is currently 3–7 m here.
In the north of the European part of Russia (station Bolvansky, continuous per-mafrost) MAGT increased from 1984 to 2020 by 1 to 1.5 °C at the depth of 10 m in all cryogenic landscapes, while the range of MAGT spatial variations across landscapes decreased by almost twice. By 2020, in most cryogenic landscapes of the European North the average MAGT at 10 m depth varied between 0 and −2 °C, which means that with further climate warming permafrost may degrade and thaw from the surface [22,23,24]. Closed thermal taliks have already started to form in depressions and within shrublands on the watersheds. According to geophysical data, drilling, and thermal monitoring of the ground, the thickness of such taliks varies from 2 to 5–6 m [36,37]. Comprehensive geophysical monitoring made it possible to assess the spatial and temporal variability of the depth to the permafrost table using reference profiles at the CALM R24B Kumzha site. According to the results of geophysical studies at the site of a closed thermal talik in sandy soil of the 1st alluvial-marine terrace in the Pechora River delta, there was a stable tendency of deepening of the permafrost table. Depending on the surface and ground conditions, the permafrost table deepened by 0.4–1.8 m at different locations during 2015–2021, with the average rate of 0.23 m/year [36].
In Western Siberia (station Urengoy-North, R50B, shrub tundra) from 1975 to 2020 MAGT increased by 1.9 °C on average and is now in the range of −1 to −3 °C over a large area. Temperature differences between different landscapes have also decreased. Thermal taliks started to form at the sites with human-induced disturbances.
The effect of climate warming on thermal regime of permafrost began to manifest itself in the typical tundra of Western Siberia in the continuous permafrost zone (Marre-Sale station). The thermal regime of all cryogenic landscapes is changing. The watersheds with low permafrost temperatures (originally from −5 to −7 °C) shows the most pronounced changes in MAGT. Nevertheless, permafrost still remains stable with low temperature varying between −3.0 and −5.2 °C. In tundra landscapes with initial temperatures of permafrost from −2 to −4 °C, a decrease in annual amplitudes of ground temperatures down to DZAA was observed. This decrease in the annual amplitudes should inevitably lead to a decrease in DZAA, as has already been recorded in the regions with discontinuous permafrost.
Thus, in all cryogenic landscapes of the western sector of the Russian Arctic, a unidirectional process of increasing in MAGT takes place at different rates, which results in a decrease in the range of permafrost temperatures across different cryogenic landscapes of WRA.

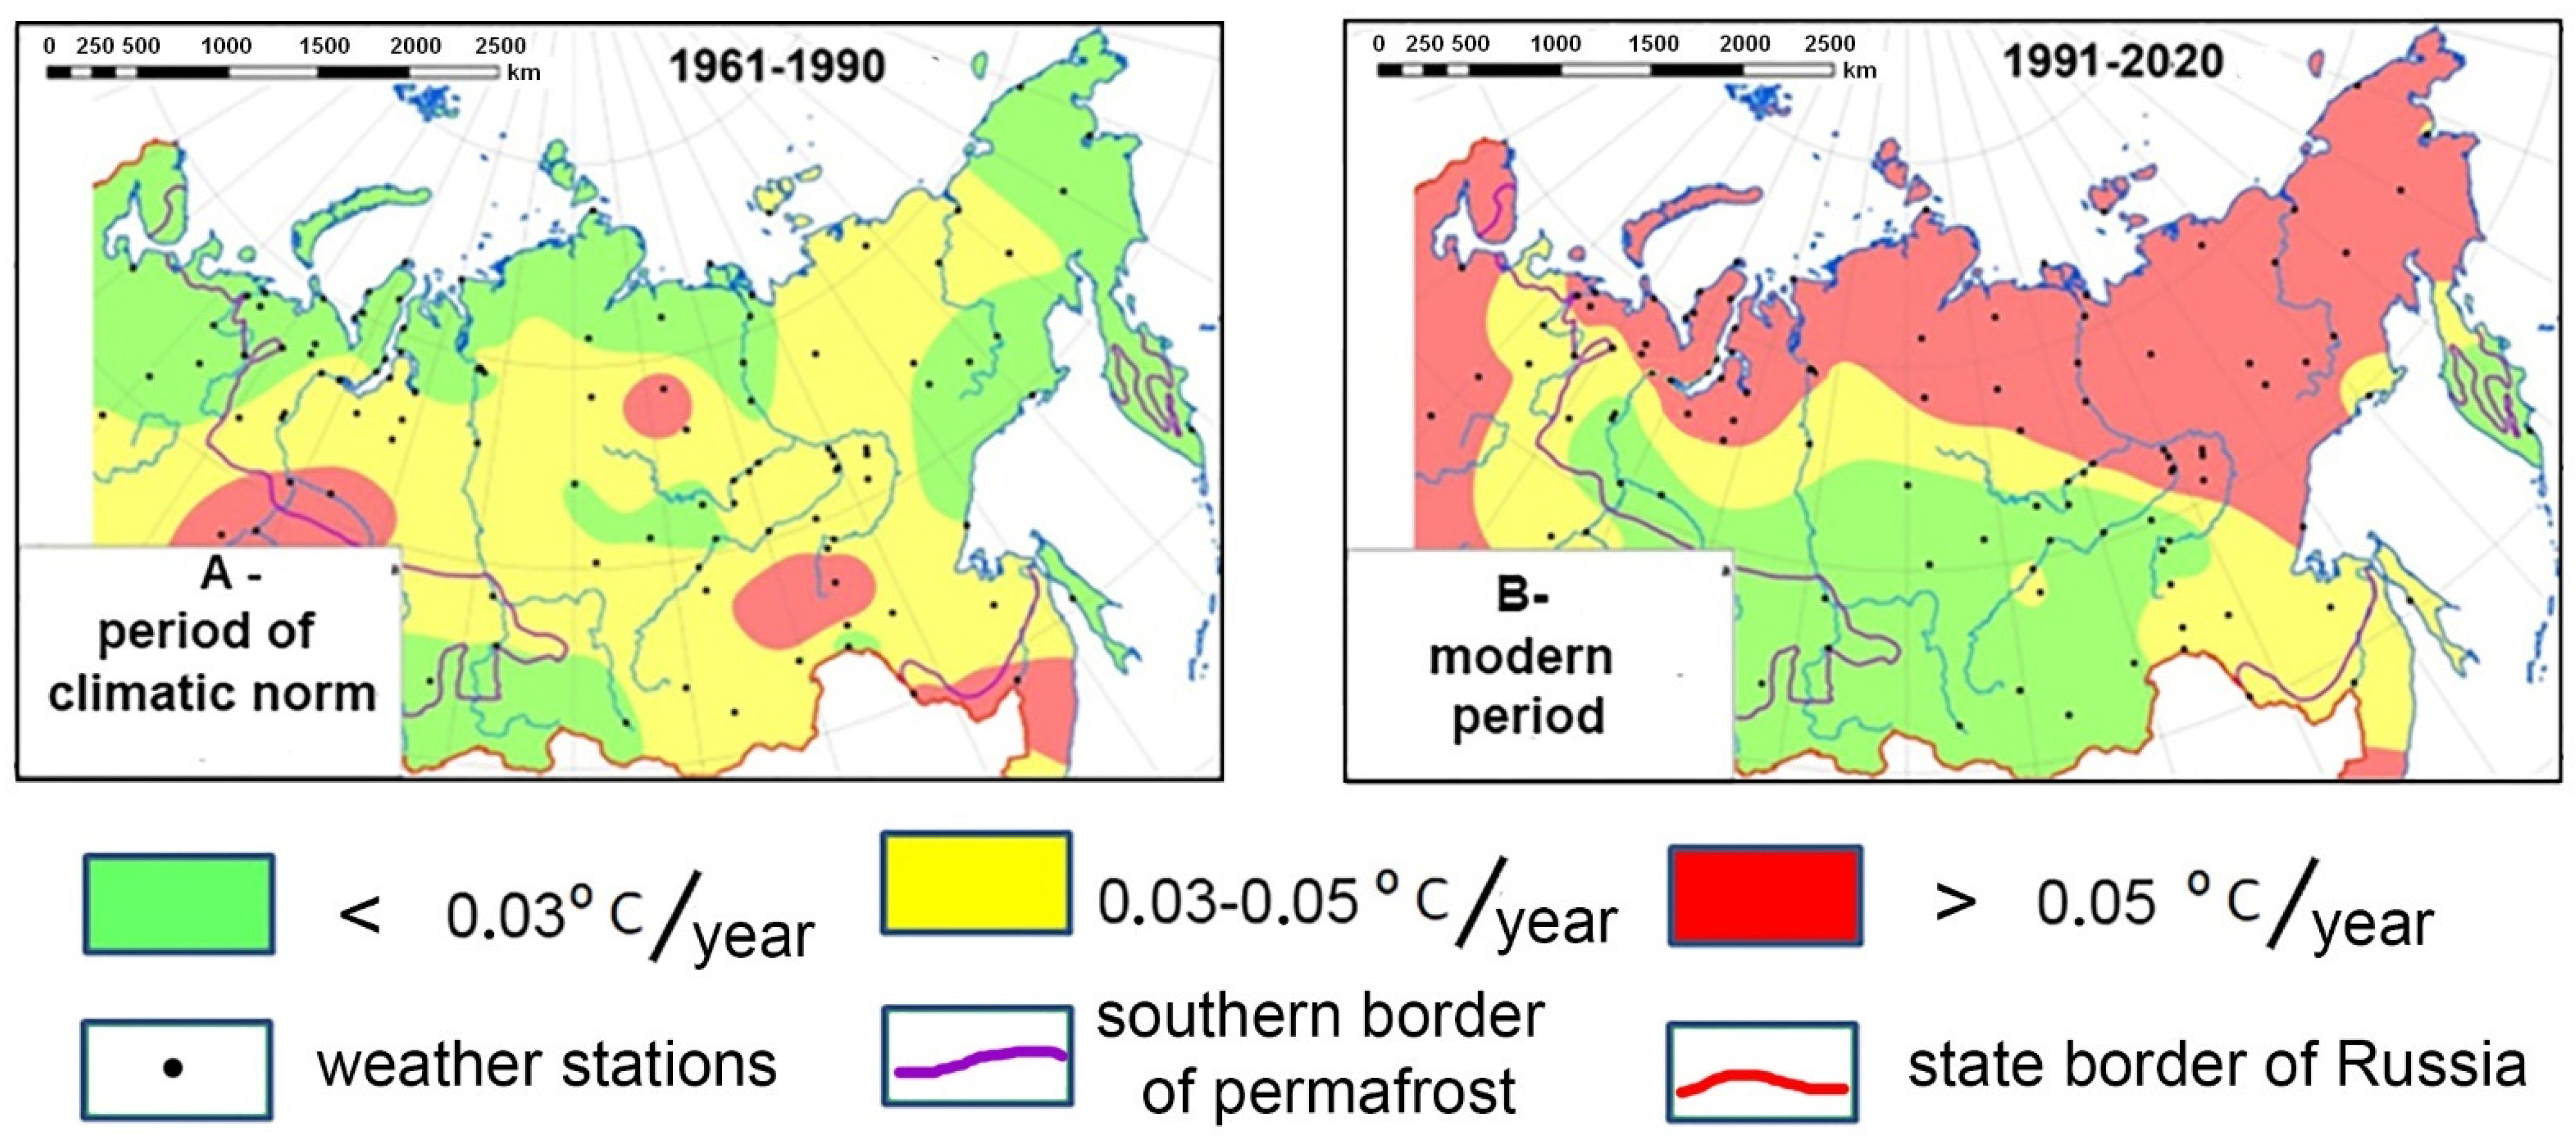
4.3. Sensitivity of Permafrost Region to Climate Change

The thermal state of permafrost and environmental conditions play a significant role in the response of the permafrost region to climate change. In order to quantify this response, a dimensionless coefficient of permafrost landscapes sensitivity to climate change Kα was proposed [47]. The Kα coefficient is calculated as the ratio of the rate of permafrost temperature (MAGT) increase (αg) in different cryogenic landscapes to the rate of the mean annual air temperature (MAAT) increase (αa) for a certain period:
= (αg)/(αa).
Previously A.V. Pavlov and G.V. Malkova [47] considered variations in the linear trends of MAGT for 1965–2005 for different Russian permafrost regions. The average MAGT rate of increase (αg) for this period was 0.03 °C/year, and the rate of the mean annual air temperature increase (αa) was 0.044 °C/year. The Kα coefficient varied within a very wide range (from 0.1 to 1.19), averaging 0.68 for the entire permafrost region, i.e., with an increase in MAAT by 1 °C one could expect an increase in MAGT by about 0.7 °C. Since climate change was very substantial over the last 15 years, we recalculated the trends and coefficients for the period from 1990 to 2020, Table 4. The rates of increase in MAAT (αa) were calculated from the data of the nearest weather station. The increase rates αa for the six reference weather stations ranged from 0.06 °C/year to 0.13 °C/year, with an average value of αa = 0.09 °C/year. MAGT from the boreholes located in different landscape conditions near each station were used to calculate the rates of increase in MAGT αg. The minimum value of αg varied from 0.001 °C/year at the Nadymsky station, to 0.032 °C/year at the Marre-Sale station. The maximum value of αg changes from 0.017 °C/year in Labytnangi to 0.074 °C/year at the Urengoy-North station. For the entire region, the average value of αg in 1990–2020 was 0.032 °C/year. The sensitivity coefficient Kα calculated using equation (1) varies from 0.11 to 0.47, and the average value of Kα is 0.33.
Thus, in the period 1990–2020, the rates of change in MAAT have doubled and the average rate of change in MAGT remained almost the same as for the previous period [48], resulting in halved Kα coefficient. Despite intensive climate warming, the permafrost temperatures turn out to be less sensitive. A conditional increase in MAAT by 1 °C increases the MAGT by only 0.3 °C on average. The smallest changes in MAGT are found in areas where permafrost temperature is close to zero in the northern taiga and forest tundra (stations Nadymsky and Labytnangi). At permafrost temperatures close to 0 °C, high MAAT increasing trends do not lead to synchronous high increasing trends in MAGT due to significant heat consumption for phase transitions during thawing.
The calculated rates of increase in MAGT and the sensitivity coefficients of permafrost regions were used to develop maps of the dynamics of the thermal state of permafrost across various time intervals.

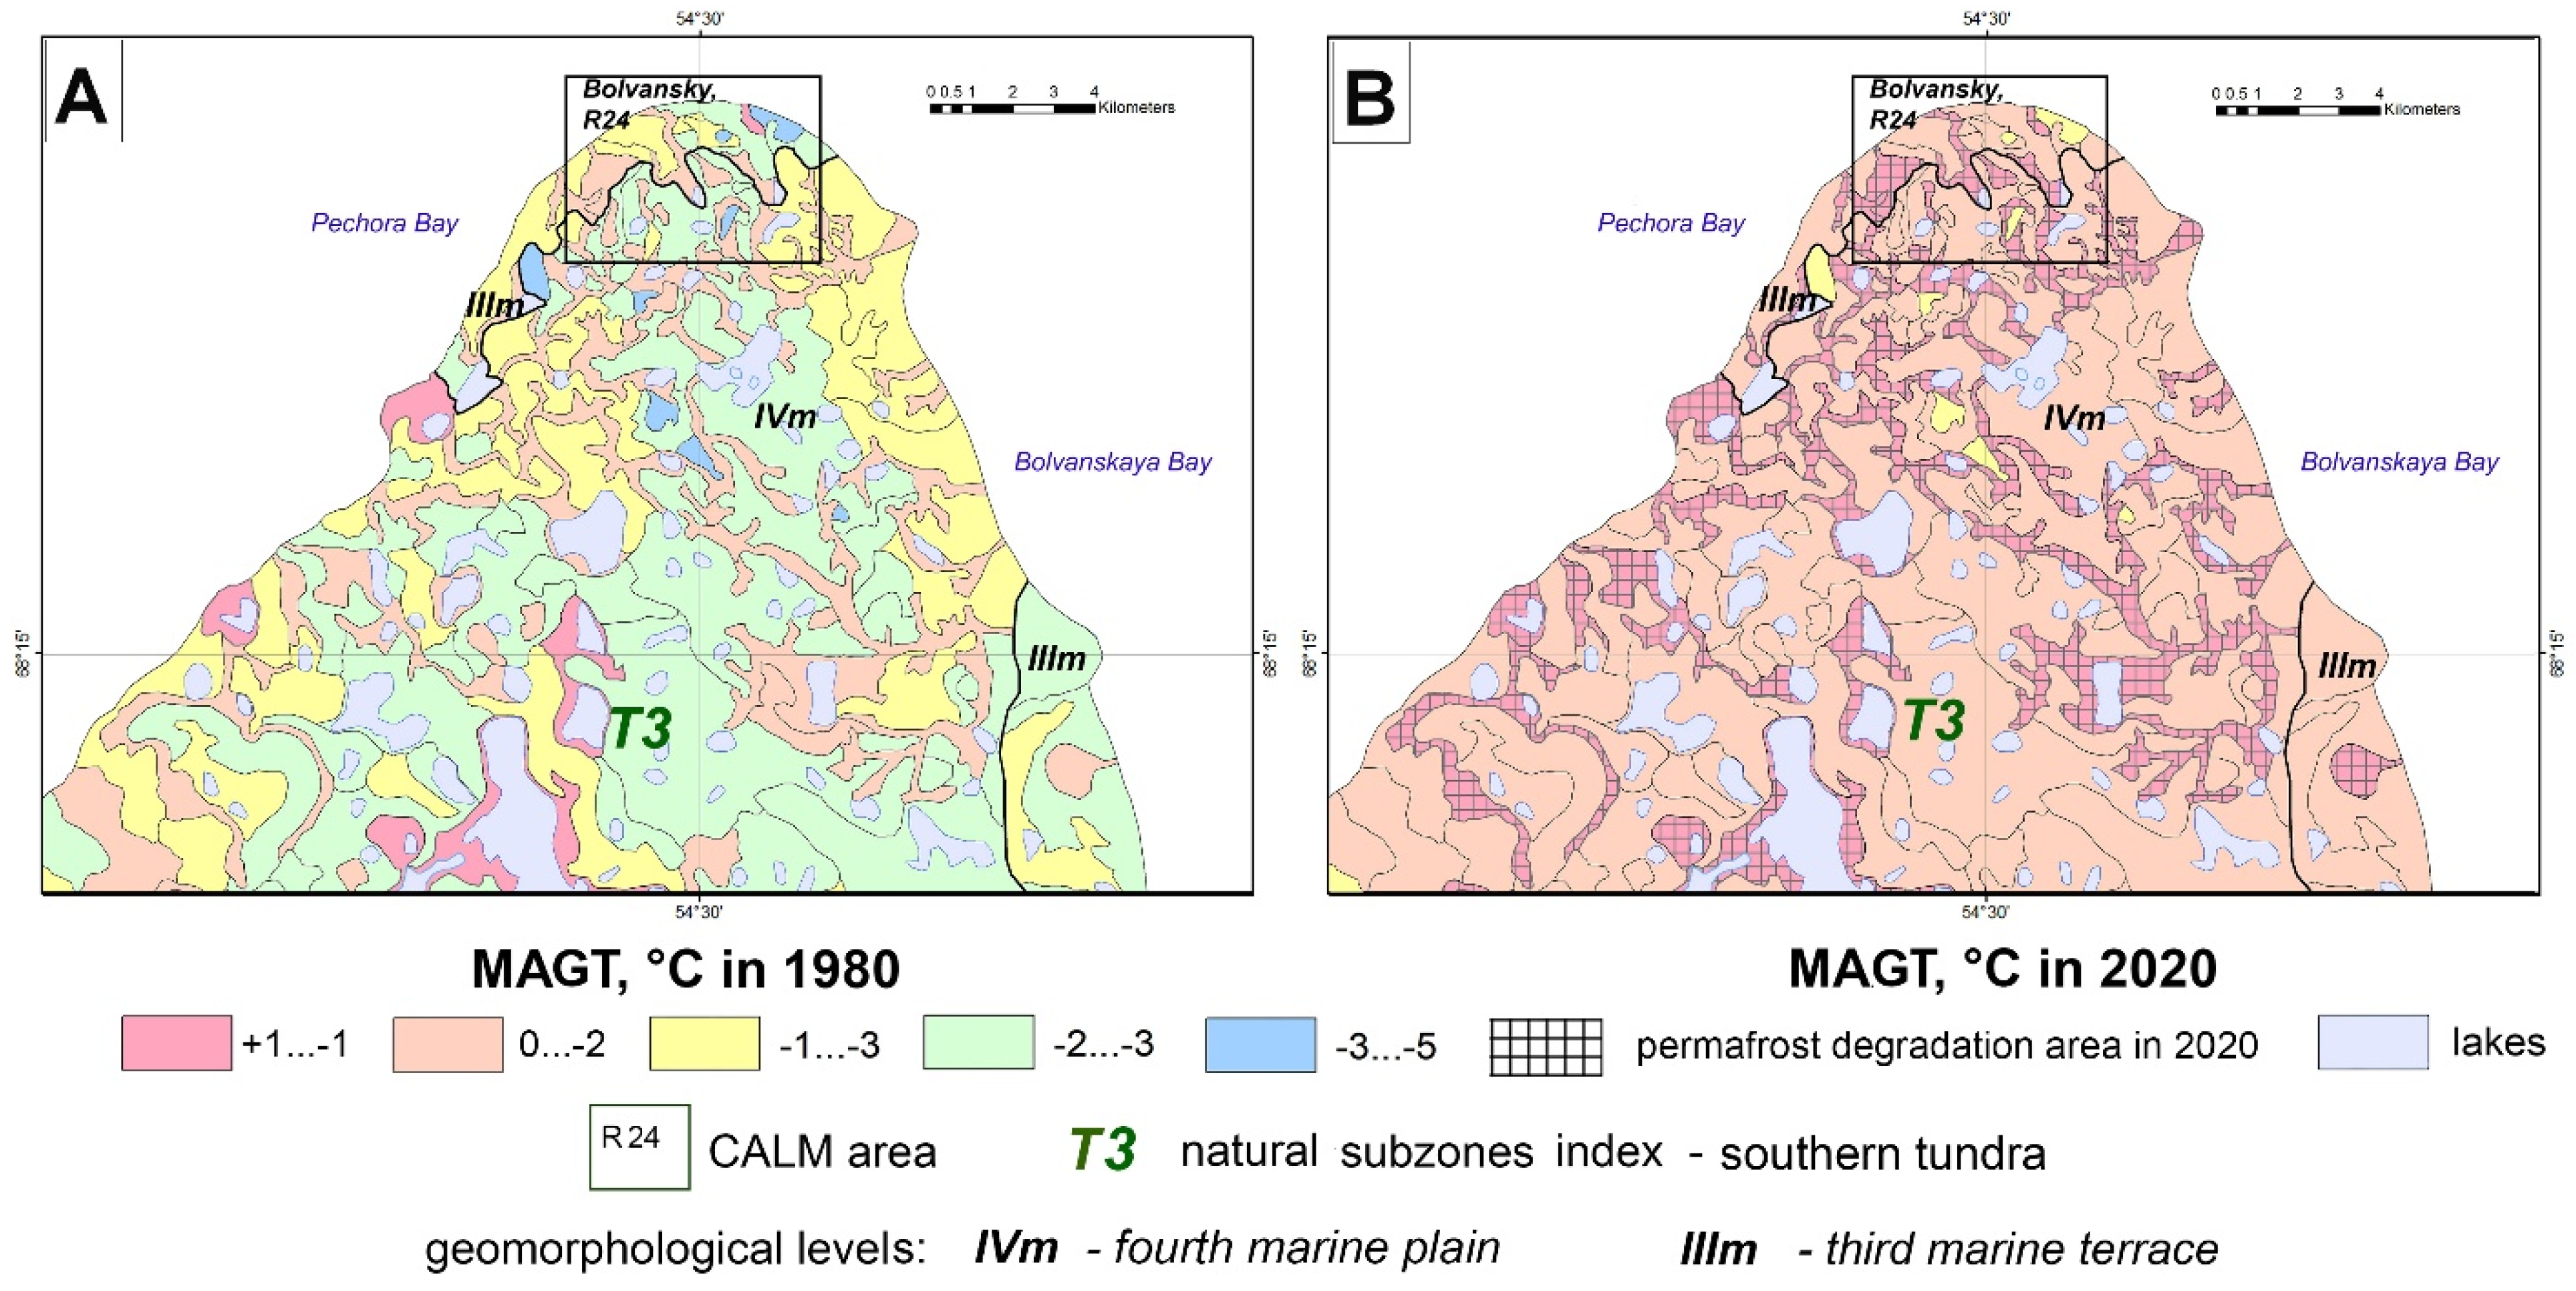
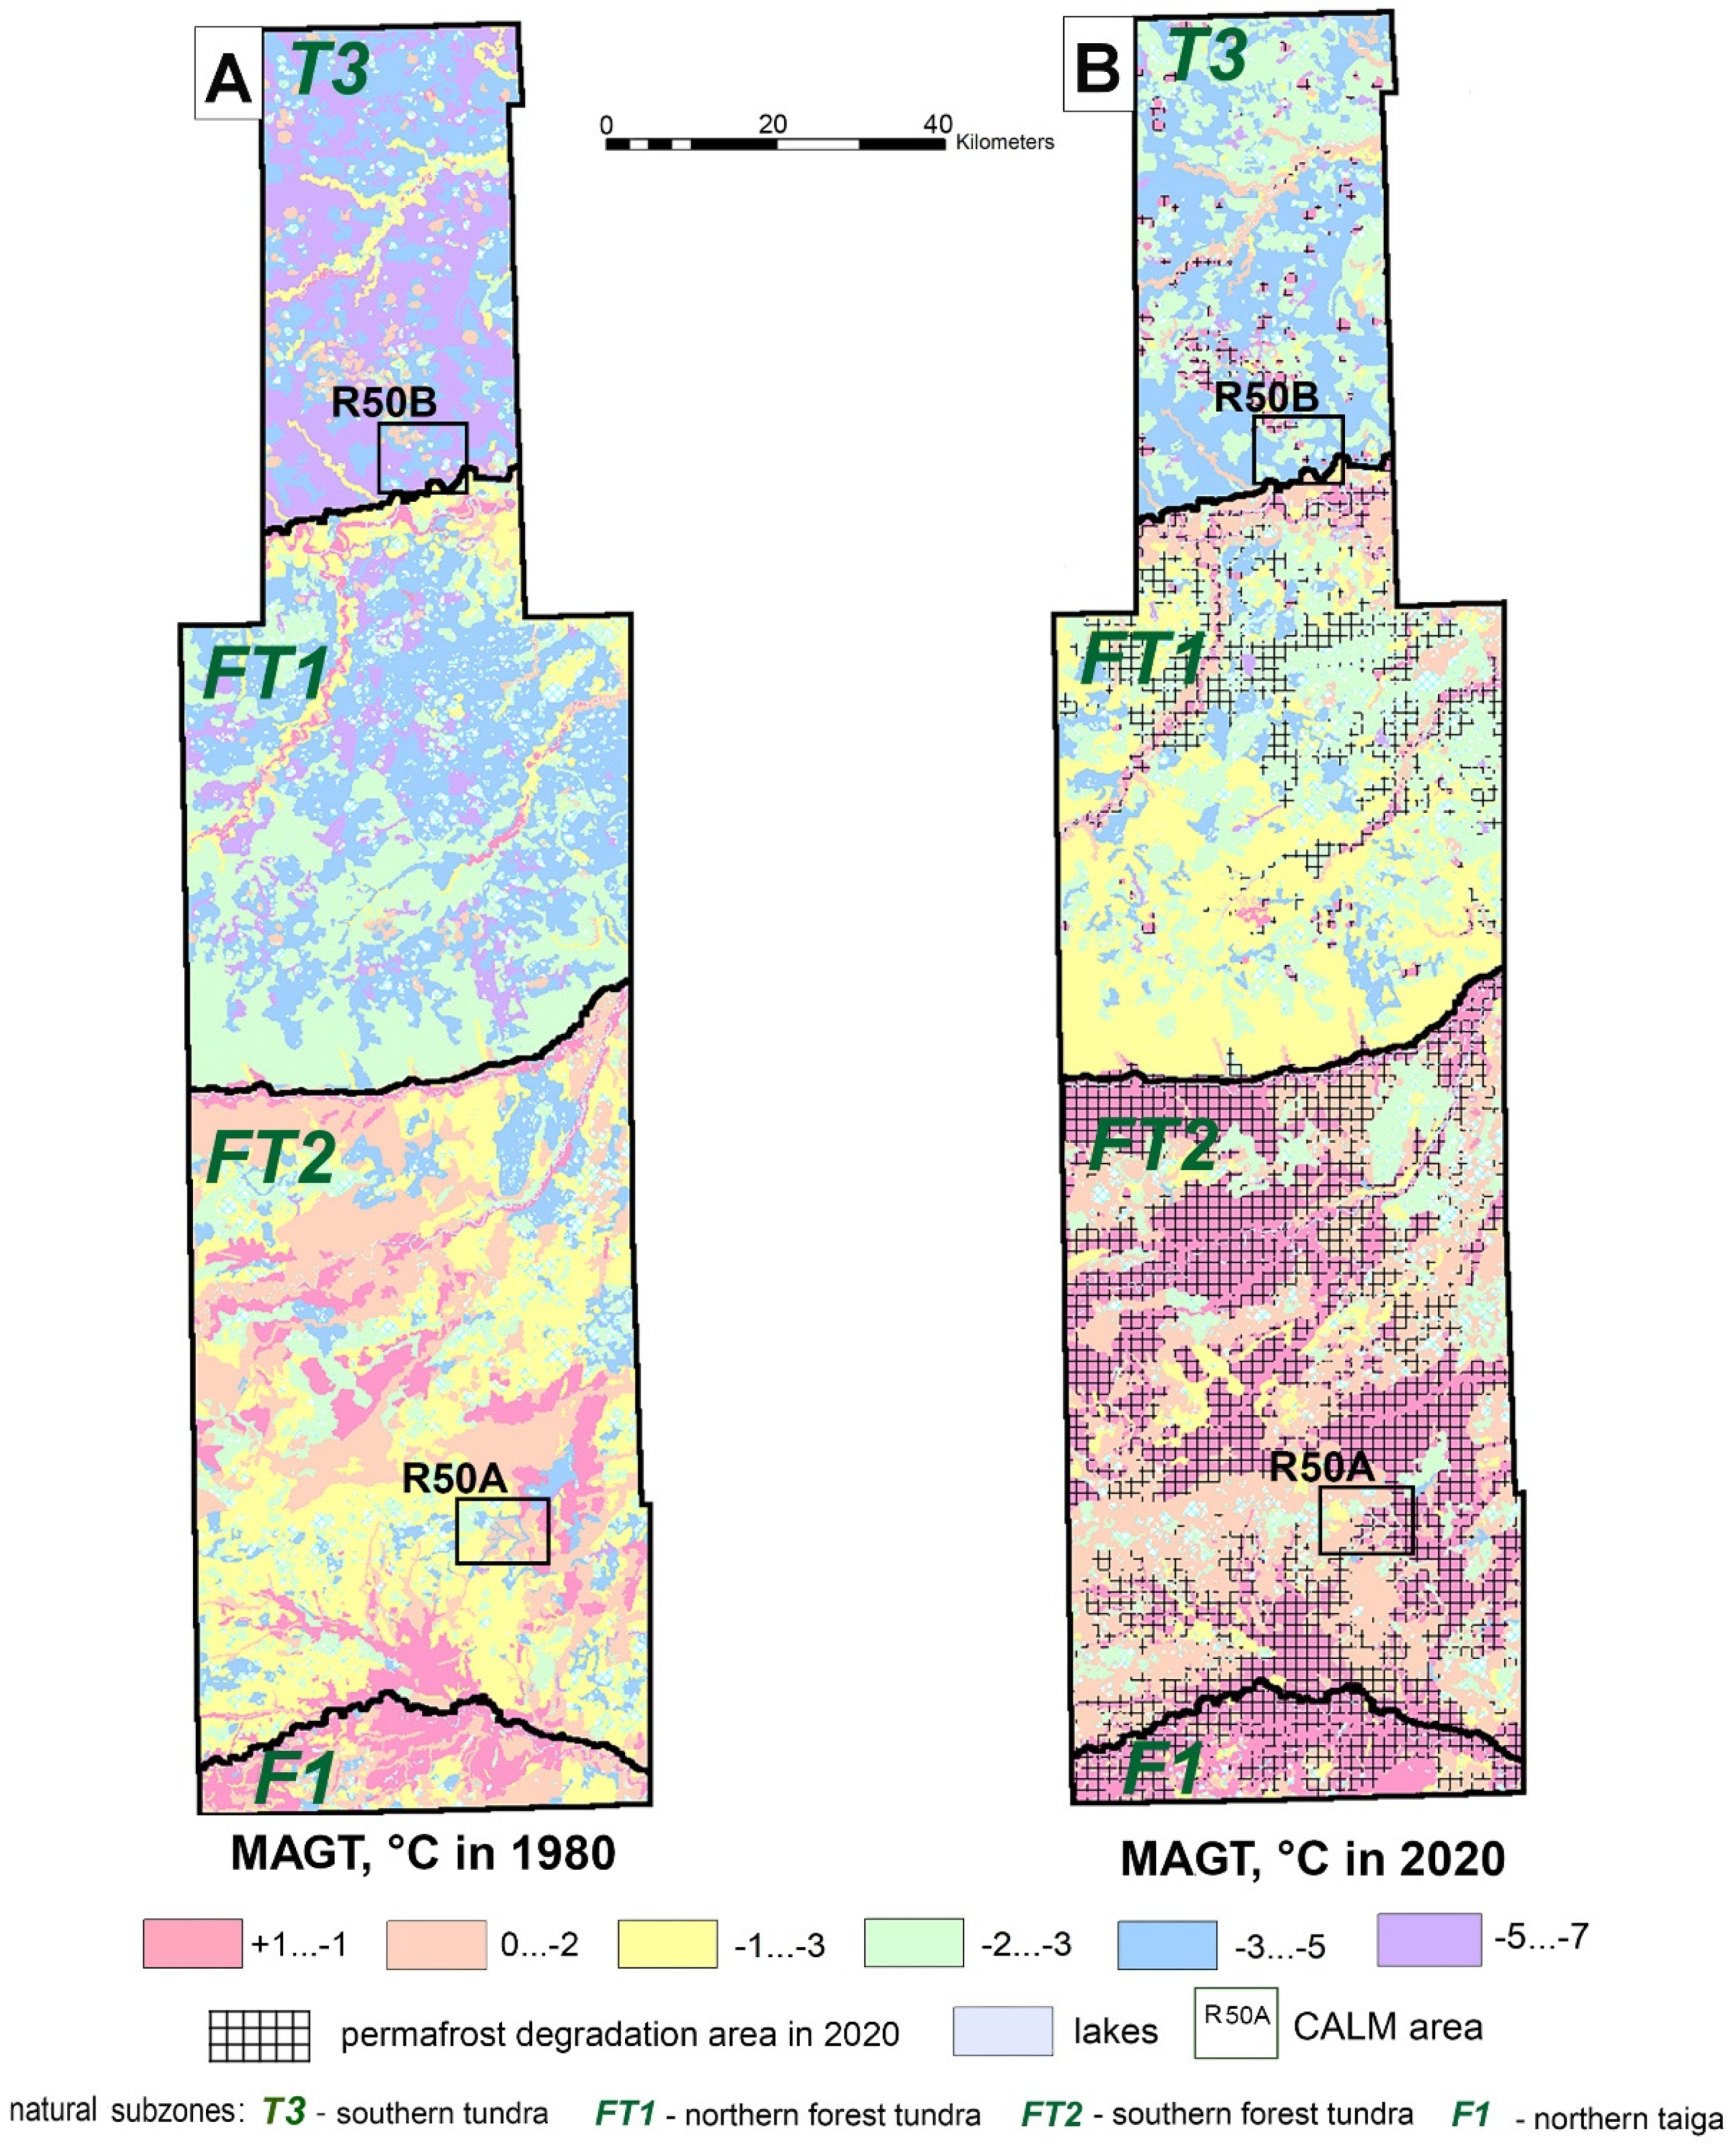
4.4. Dynamic Maps of Temperature of Permafrost

The spatial and temporal patterns of changes in permafrost temperature were analyzed using regional maps of WRA based on a geosystem approach [48,49]. Classification of natural geosystems in the rank of landscapes and ecotypes was carried out using a GIS package based on the interpretation of high-resolution space images. Following the geosystem concept, the landscape base was used to create analytical maps and thematic layers of different content such as lithology, soil water content, ALT, ground temperature, and others including considering temporal changes in these parameters [50]. The geosystem approach made it possible to develop multiscale models of the thermal state of permafrost for several subregions of WRA based on the field data obtained at the reference monitoring sites from the 1970s to the present. Spatiotemporal GIS-models were developed for two time slices of 1980 and 2020 for three regions of WRA:
  • typical tundra around Marre-Sale station, western Yamal (Figure 7);
  • shrub tundra around the Bolvansky station, European territory of Russia (Figure 8);
  • forest tundra and shrub tundra on the territory of the Urengoy field, including Urengoy-South and Urengoy-North stations, Western Siberia (Figure 9).
Maps were constructed using the single legend, including the same colors for each MAGT interval, which facilitates visual comparison of changes in ground temperatures.
In the western Yamal, the MAGT increased and the areas with low temperatures of permafrost (−5 to −7 °C) disappeared completely. In 2020, the cryogenic landscapes with permafrost temperatures from −3 to −5 °C has expanded, and areas with permafrost temperature from −1 to −3 °C appeared inland (Figure 7). Figure 8 clearly shows that in the north of the European part of Russia the range of MAGT changes has decreased from between 0 and −5 °C in the 1980s to between 0 and−2 °C (and at some locations up to −3 °C) at present. On the map from 1980, localized areas of taliks distribution were confined to the wetlands in drained lake depressions and there were very few of them within the selected map fragment (Figure 8).
By 2020, new closed thermal taliks occurred in depressions including khasyreys, runoff troughs, thermokarst gullies and on the shrub covered slopes, where the thickest snow cover is formed, preventing winter cooling. Modern closed thermal taliks occupy about 25% of the total area of watersheds. On the map they are highlighted with a gray shading over the red color. As a rule, they have formed in landscapes where MAGT ranged from 0 °C to −2 °C in the 1980s. Where peat is present in the upper part of the soil column the permafrost continues to remain relatively stable and the MAGT has not yet crossed the 0 °C threshold.
The longest latitudinal span of the map of the thermal state of permafrost was produced for the Urengoy field (Figure 9). In the 1980 s, the lowest MAGT was found mostly in shrub tundra and, locally, in the northern forest tundra. To the south, in the southern forest tundra and northern taiga the permafrost had temperatures mainly in the range from 0 to −3 °C. There were local areas with ground temperatures between +1 and −1 °C where isolated patches of permafrost and closed thermal taliks alternated. These areas were confined to the river and creek valleys, as well as to forested drained terrace slopes composed by sands. The lowest permafrost temperatures in the southern part of the territory were confined to peat plateaus and to frost mounds and ridges.
In 2020, the temperature differences between different landscape types decreased, similarly to other regions described above. The landscapes with temperatures of permafrost from −5 to −7 °C in shrub tundra and northern forest tundra was no longer found. They were replaced by permafrost with temperatures between −3 and −5 °C, which typically is found on flat elevated watersheds occupied by peatlands or on top of the hills and ridges occupied by tundra with thin peat layers. In the central part of the territory cryogenic landscapes of the northern forest tundra with MAGT between −1 and −3 °C are most widely distributed. In the southern forest tundra and northern taiga, landscapes with ground temperatures between +1 and −1 °C are present almost everywhere. Landscape extrapolation of the permafrost temperature monitoring results made it possible to identify on the 2020 map the vast areas with closed thermal taliks in the southern half of the territory. In the northern forest tundra, the beginning of the closed thermal talik formation was recorded primarily in those watersheds where larch forests were advancing northwards. Such areas on the 2020 map are shown with gray shading on the background of colored contours (Figure 9).
The developed permafrost thermal state dynamics models in certain regions of WRA reflect the recent changes in the upper permafrost thermal state and stability. These empirical models can be used to verify the results of physically based numerical permafrost forecasting models which are in development right now for this permafrost region.

5. Conclusions

Extensive data of long-term monitoring has been collected and organized into accessible databases and GIS packages. The obtained observational data allows both to assess the past and current states of permafrost, an important component of the Arctic environment, but also to develop an understanding of different responses of permafrost to climate change within different bioclimatic zones and in different cryogenic landscapes.
Climate changes at a high rate in the western sector of the Russian Arctic (WRA). The rate of MAAT increase varied from 0.08 to 0.16 °C/year over the last 30 years. The duration of the warm period has increased by 2 weeks. Annual precipitation has increased by 50–100 mm/year. The trend of maximum snow depth varied from 0.6 cm/year in the forest tundra and northern taiga of Western Siberia to 1.8 cm/year in Yamal and the north of the European part of Russia.
The ongoing climate change contributed to increase in moisture content in the upper soil horizons resulting in increased heat consumption for phase transitions in the seasonally thawed layer and altered thermal regime of underlying permafrost. Following the background climate warming, positive trends in thaw depth were observed everywhere, but the greatest changes in the active layer occurred in the forest tundra and northern taiga, where closed thermal taliks have started to form. The thawing rate in the southern tundra have increased on sites with favorable landscape conditions or under the impact of human-induced disturbances.
Long-term monitoring of the thermal state of permafrost indicated permafrost temperature increase rates from 0.01 to 0.06–0.07 °C/year across cryogenic landscapes of WRA. Mean annual ground temperature increases unidirectionally, but at different rates. High rates are typical for cold permafrost and low rates for warm permafrost, which decreases the spatial variation in permafrost temperatures of cryogenic landscapes.
A quantitative assessment of the cryogenic landscapes’ response to climate change was carried out using the coefficient of permafrost sensitivity Kα. While the regional average rate of increase in MAAT for the 1990–2020 time period was 0.09 °C/year, the average MAGT increase rate was only 0.032 °C/year for the same time period, i.e., the MAGT increase rate is three times lower than the increase rate of MAAT. At the same time, the sensitivity coefficient Kα varied from 0.11 to 0.47, and its average value was 0.33, which is half of the value for the period of 1965–2005. Moreover, the most stable MAGT was associated with permafrost of a near-zero temperature in the northern taiga and forest tundra (stations Nadymsky, Labytnangi, and Salekhard). At permafrost temperatures close to 0 °C, the high rates of increase in MAAT did not lead to a synchronous high rate of increase in MAGT due to considerable heat consumption for phase transitions during a partial thawing of permafrost.
The dynamic maps of permafrost temperature allowed an estimation of spatiotemporal changes in the thermal regime of permafrost for the representative areas of WRA. The monitoring results of the permafrost temperature dynamics, the dynamics of seasonal thawing, and talik formation presented here indicates that partial degradation of permafrost in WRA and Sub-Arctic has already begun. A deepening of the permafrost table and an occurrence of residual perennial thaw layer in areas of developing thermal taliks has already been observed since the early 21st century in the forest-tundra and northern taiga landscapes in the surroundings of the Urengoy field, Nadym station and Salekhard. However, only recently this process has started in the shrub tundra of the European part of Russia and within watersheds of the northern part of Urengoy area.

Author Contributions

Data curation, V.R. and G.M.; Formal analysis, A.T., M.S. (Maria Sudakova) M.S. (Marat Sadurtdinov), A.S. (Andrey Skvortsov), P.O., Y.K., K.N., G.M., A.V., D.D. and O.P.; Investigation, A.V., A.G., M.S. (Marat Sadurtdinov), G.M., O.P., P.O., G.K. and A.S. (Alexandr Shein); Visualization, G.M., G.K. and A.S. (Alexandr Shein); Writing—Original draft, G.M., A.V., D.D. and O.P.; Writing—Review and editing, G.M., V.R., A.V., G.K. and A.S. (Alexandr Shein). All authors have read and agreed to the published version of the manuscript.

Funding

The research was supported by the international projects CALM and GTN-P. The work was carried out in the framework of State Research Programs 121041600042-7, 121041600043-4, FMGE-2019-0004. The study of permafrost degradation was supported by Russian Science Foundation grant 22-27-00181.

Institutional Review Board Statement

Ethical review and approval are not needed for our studies which did not involve humans or animals.

Informed Consent Statement

Not applicable.

Data Availability Statement

The data that support the findings of this study are available from the corresponding author, upon reasonable request.

Acknowledgments

We thank numerous researchers and students who participated in data collection at CALM and TSP sites in the western Russian Arctic.

Conflicts of Interest

The authors declare no conflict of interest. The funders had no role in the design of the study; in the collection, analyses, or interpretation of data; in the writing of the manuscript, or in the decision to publish the results.

References

  1. Pavlov, A.V. Permafrost-climatic monitoring of Russia: Analysis of field data and forecast. Polar Geogr. 2008, 31, 27–46. [Google Scholar] [CrossRef]
  2. Brushkov, A.V.; Buldovich, S.N.; Volokhov, S.S.; Garagulya, L.S.; Komarov, I.A.; Koshurnikov, A.V.; Kuchukov, E.Z.; Motenko, R.G.; Nesmelova, E.I.; Ospennikov, E.N.; et al. Osnovy Merzlotnogo Prognoza Pri Inzhenerno-Geologicheskikh Issledovaniyakh (Fundamentals of Permafrost Forecasting in Engineering and Geological Research); Geoinfo: Moscow, Russia, 2016; p. 512. [Google Scholar]
  3. Blunden, J.; Boyer, T. State of the climate in 2020. Bull. Am. Meteorol. Soc. 2021, 102, S1–S475. [Google Scholar] [CrossRef]
  4. Biskaborn, B.K.; Smith, S.L.; Noetzli, J.; Matthes, H.; Vieira, G.; Streletskiy, D.A.; Schoeneich, P.; Romanovsky, V.E.; Lewkowicz, A.G.; Abramov, A.; et al. Permafrost is warming at a global scale. Nat. Commun. 2019, 10, 264. [Google Scholar] [CrossRef] [PubMed] [Green Version]
  5. Vasiliev, A.A.; Drozdov, D.S.; Gravis, A.G.; Malkova, G.V.; Nyland, K.E.; Streletskiy, D.A. Permafrost degradation in the Western Russian Arctic. Environ. Res. Lett. 2020, 15, 045001. [Google Scholar] [CrossRef]
  6. Kaverin, D.; Malkova, G.; Zamolodchikov, D.; Shiklomanov, N.; Pastukhov, A.; Novakovskiy, A.; Sadurtdinov, M.; Skvortsov, A.; Tsarev, A.; Pochikalov, A.; et al. Long-term active layer monitoring at CALM sites in the Russian European North. Polar Geogr. 2021, 44, 203–216. [Google Scholar] [CrossRef]
  7. Izrael, Y.A.; Pavlov, A.V.; Anokhin, Y.A. Evolution of the cryolithozone under present-day global climate changes. Russ. Meteorol. Hydrol. 2002, 1, 14–24. [Google Scholar]
  8. Pavlov, A.V.; Malkova, G.V. Sovremennye Izmeneniya Klimata na Severe Rossii (Contemporary Changes of Climate in Northern Russia); Geo: Novosibirsk, Russia, 2006; p. 54. [Google Scholar]
  9. Streletskiy, D.; Anisimov, O.; Vasiliev, A. Permafrost degradation. In Snow and Ice-Related Hazards, Risks, and Disasters; Shroder, J.F., Haeberli, W., Whiteman, C., Eds.; Academic Press: Boston, MA, USA, 2015; pp. 303–344. [Google Scholar] [CrossRef]
  10. Romanovsky, V.; Isaksen, K.; Drozdov, D.; Anisimov, O.; Instanes, A.; Leibman, M.; McGuire, A.D.; Shiklomanov, N.; Smith, S.; Walker, D.; et al. Changing Permafrost and its Impacts. In Snow, Water, Ice and Permafrost in the Arctic (SWIPA) 2017; Arctic Monitoring and Assessment Programme: Oslo, Norway, 2017; pp. 65–102. [Google Scholar]
  11. Vasiliev, A.A.; Gravis, A.G.; Gubarkov, A.A.; Drozdov, D.S.; Korostelev, Y.V.; Malkova, G.V.; Oblogov, G.E.; Ponomareva, O.E.; Sadurtdinov, M.R.; Streletskaya, I.D.; et al. Degradatsiya merzloty: Rezul’taty mnogoletnego geokriologicheskogo monitoringa v zapadnom sektore rossiiskoi Arktiki (Permafrost degradation: Results of long-term geocryological monitoring in the Western sector of Russian Arctic). Kriosf. Zemli 2020, 24, 15–30. [Google Scholar]
  12. Streletskiy, D.A.; Sherstiukov, A.B.; Frauenfeld, O.W.; Nelson, F.E. Changes in the 1963–2013 shallow ground thermal regime in Russian permafrost regions. Environ. Res. Lett. 2015, 10, 125005. [Google Scholar] [CrossRef]
  13. Dubrovin, V.A.; Brushkov, A.V.; Drozdov, D.S.; Zheleznyak, M.N. Izuchennost, sovremennoe sostoyanie, perspektivy i problemy osvoeniya kriolitozony Arktiki (Study, current state, future and challenges of development of permarost in the Arctic). Miner. Resur. Rossii. Ekon. Upr. 2019, 55–64. [Google Scholar]
  14. Shur, Y.; Goering, D.J. Climate change and foundations of buildings in permafrost regions. In Permafrost Soils; Margesin, R., Ed.; Springer: Berlin/Heidelberg, Germany, 2009; pp. 251–260. [Google Scholar] [CrossRef]
  15. Drozdov, D.S.; Malkova, G.V.; Ukraintseva, N.G.; Korostelev, Y.V. Permafrost monitoring of southern tundra landscapes in the Russian European North and West Siberia. In Proceedings of the Tenth International Conference on Permafrost (TICOP). Resources and Risks of Permafrost Areas in a Changing World, Salekhard, Russia, 25–29 June 2012; pp. 65–70. [Google Scholar]
  16. Frolov, A.V. (Ed.) Second Roshydromet Assessment Report on Climate Change and Its Consequences in Russian Federation. General Summary; Federal service for Hydrometeorology and Environmental Monitoring (Roshydromet): Moscow, Russia, 2014; p. 54.
  17. Brown, J.; Hinkel, K.M.; Nelson, F.E. The Circumpolar Active Layer Monitoring (CALM) program: Research designs and initial results. Polar Geogr. 2000, 24, 166–258. [Google Scholar] [CrossRef]
  18. Romanovsky, V.E.; Drozdov, D.S.; Oberman, N.G.; Malkova, G.V.; Kholodov, A.L.; Marchenko, S.S.; Moskalenko, N.G.; Sergeev, D.O.; Ukraintseva, N.G.; Abramov, A.A.; et al. Thermal state of permafrost in Russia. Permafr. Periglac. Processes 2010, 21, 136–155. [Google Scholar] [CrossRef]
  19. Blunden, J.; Arndt, D.S. State of the climate in 2018. Bull. Am. Meteorol. Soc. 2019, 100, Si-S306. [Google Scholar] [CrossRef] [Green Version]
  20. Vasiliev, A.A.; Oblogov, G.E.; Streletskaya, I.D.; Fedin, V.A.; Shirokov, R.S.; Zadorozhnaia, N.A. Thermal regime of the upper part of permafrost in the transition zone from land to sea, Western Yamal. Earth’s Cryosphere 2017, 21, 28–35. [Google Scholar] [CrossRef]
  21. Malkova, G.V. Monitoring srednegodovoi temperatury porod na statsionare Bolvanskii (Mean-annual ground temperature monitoring on the steady-state-station “Bolvansky”). Kriosf. Zemli 2010, 14, 3–14. [Google Scholar]
  22. Malkova, G.V.; Korostelev, Y.V.; Sadurtdinov, M.R.; Skvortsov, A.G.; Tsarev, A.M. Modern climatic changes and temperature regime of permafrost rocks of the European North. In Proceedings of the Rasshirennoe Zasedanie Nauchnogo Soveta po Kriologii Zemli RAN “Aktual’nye Problemy Geokriologii” (Open Session of the Scientific Committee on the Earth’s Cryology of the Russian Academy of Sciences “Urgent Challenges in Geocryology”), Moscow, Russia, 15–16 May 2018; pp. 98–104. [Google Scholar]
  23. Malkova, G.V.; Vasiliev, A.A.; Gravis, A.G.; Drozdov, D.S.; Korostelev, Y.V.; Ponomareva, O.E. Vozdeistvie sovremennykh klimaticheskikh izmenenii na temperaturnyi rezhim merzlykh tolshch rossiiskoi Arktiki (The impact of modern climatic changes on the temperature regime of the frozen strata of the Russian Arctic). In Proceedings of the Vserossiiskaya Konferentsiya, Posvyashchennaya 60-Letiyu Obrazovaniya Instituta Merzlotovedeniya im. P.I. Mel’nikova SO RAN “Ustoichivost’ Prirodnykh i Tekhnicheskikh Sistem v Kriolitozone” (Russian Conference on the Occasion of the 60th Anniversary of the Melnikov Permafrost Institute “Environmental and Infrastructure Integrity in Permafrost Regions”), Yakutsk, Russia, 28–30 September 2020. [Google Scholar]
  24. Malkova, G.V.; Vasiliev, A.A.; Gravis, A.G.; Drozdov, D.S.; Sadurtdinov, M.R.; Skvortsov, A.G.; Tsarev, A.M. Prostranstvennaya i vremennaya izmenchivost’ merzlykh tolshch v zapadnom sektore Rossiiskoi Arktiki—Rezul’taty kompleksnogo monitoringa na geokriologicheskikh statsionarakh (Spatial and temporal variability of permafrost in the Western sector of the Russian Arctic—Results of complex monitoring at geocryological sites). In Proceedings of the Sovremennye Issledovaniya Transformatsii Kriosfery i Voprosy Geotekhnicheskoi Bezopasnosti Sooruzhenii v Arktike (Cryosphere Transformation and Geotechnical Safety in the Arctic), Salekhard, Russia, 8–12 November 2021; pp. 279–282. [Google Scholar]
  25. Ponomareva, O.E.; Drozdov, D.S.; Gravis, A.G.; Berdnikov, N.M.; Bochkarev, Y.N.; Ustinova, E.V.; Leshnevskaya, E.F. Features of permafrost degradation at the southern border of the cryolithozone (according to the results of monitoring in Western Siberia). In Proceedings of the Rasshirennoe Zasedanie Nauchnogo Soveta po Kriologii Zemli RAN “Aktual’nye Problemy Geokriologii” (Open Session of the Scientific Committee on the Earth’s Cryology of the Russian Academy of Sciences “Urgent Challenges in Geocryology”), Moscow, Russia, 15–16 May 2018; pp. 189–195. [Google Scholar]
  26. Drozdov, D.S.; Vasiliev, A.A.; Malkova, G.V.; Moskalenko, N.G.; Orekhov, P.T.; Ukraintseva, N.G. Izmeneniya temperatury mnogoletnemerzlykh porod zapadnogo sektora Rossiiskoi Arktiki v svyazi s izmeneniyami klimata (Temperature changes of permafrost rocks of the western sector of the Russian Arctic in connection with climate changes). In Polyarnaya Kriosfera i Vody Sushi (Polar Cryosphere and Continental Waters); Kotlyakov, V.M., Ed.; Paulsen Editions: Saint-Petersburg, Russia, 2011; pp. 153–170. [Google Scholar]
  27. Orekhov, P.T.; Popov, K.A.; Slagoda, E.A.; Kurchatova, A.N.; Tikhonravova, Y.V.; Opokina, O.L.; Simonova, G.V.; Melkov, V.N. Frost mounds of Bely island in coastal marine settings of the Kara Sea. Earth’s Cryosphere 2017, 21, 41–51. [Google Scholar] [CrossRef]
  28. Mel’nikov, V.P.; Trofimov, V.T.; Orlov, V.P.; Brushkov, A.V.; Drozdov, D.S.; Dubrovin, V.A.; Pendin, V.V.; Zheleznyak, M.N. Prinyatie doktriny izucheniya i okhrany “vechnoi merzloty”—Neobkhodimyi element strategii razvitiya AZRF (Adoption of the doctrine on study and protection of permafrost—The necessary element of the strategy of development of the Arctic Zone of the Russian Federation). In Proceedings of the Rasshirennoe Zasedanie Nauchnogo Soveta po Kriologii Zemli RAN “Aktual’nye Problemy Geokriologii” (Open Session of the Scientific Committee on the Earth’s Cryology of the Russian Academy of Sciences “Urgent Challenges in Geocryology”), Moscow, Russia, 15–16 May 2018; pp. 6–19. [Google Scholar]
  29. Kukkonen, I.T.; Suhonen, E.; Ezhova, E.; Lappalainen, H.; Gennadinik, V.; Ponomareva, O.; Gravis, A.; Miles, V.; Kulmala, M.; Melnikov, V.; et al. Observations and modelling of ground temperature evolution in the discontinuous permafrost zone in Nadym, north-west Siberia. Permafr. Periglac. Processes 2020, 31, 264–280. [Google Scholar] [CrossRef]
  30. Obu, J.; Westermann, S.; Bartsch, A.; Berdnikov, N.; Christiansen, H.H.; Dashtseren, A.; Delaloye, R.; Elberling, B.; Etzelmüller, B.; Kholodov, A.; et al. Northern Hemisphere permafrost map based on TTOP modelling for 2000–2016 at 1 km2 scale. Earth-Sci. Rev. 2019, 193, 299–316. [Google Scholar] [CrossRef]
  31. Westermann, S.; Østby, T.I.; Gisnås, K.; Schuler, T.V.; Etzelmüller, B. A ground temperature map of the North Atlantic permafrost region based on remote sensing and reanalysis data. Cryosphere 2015, 9, 1303–1319. [Google Scholar] [CrossRef] [Green Version]
  32. Nicolsky, D.J.; Romanovsky, V.E. Modeling Long-Term Permafrost Degradation. J. Geophys. Res. Earth Surf. 2018, 123, 1756–1771. [Google Scholar] [CrossRef]
  33. Cable, W.L.; Romanovsky, V.E.; Jorgenson, M.T. Scaling-up permafrost thermal measurements in western Alaska using an ecotype approach. Cryosphere 2016, 10, 2517–2532. [Google Scholar] [CrossRef] [Green Version]
  34. Biskaborn, B.K.; Lanckman, J.P.; Lantuit, H.; Elger, K.; Streletskiy, D.A.; Cable, W.L.; Romanovsky, V.E. The new database of the Global Terrestrial Network for Permafrost (GTN-P). Earth Syst. Sci. Data 2015, 7, 245–259. [Google Scholar] [CrossRef] [Green Version]
  35. Sudakova, M.S.; Sadurtdinov, M.R.; Tsarev, A.M.; Skvortsov, A.G.; Malkova, G.V. Ground-penetrating radar for studies of peatlands in permafrost. Russ. Geol. Geophys. 2019, 60, 793–800. [Google Scholar] [CrossRef]
  36. Sudakova, M.; Sadurtdinov, M.; Skvortsov, A.; Tsarev, A.; Malkova, G.; Molokitina, N.; Romanovsky, V. Using Ground Penetrating Radar for Permafrost Monitoring from 2015–2017 at CALM Sites in the Pechora River Delta. Remote Sens. 2021, 13, 3271. [Google Scholar] [CrossRef]
  37. Sadurtdinov, M.R.; Skvortsov, A.G.; Tsarev, A.M.; Sudakova, M.S.; Malkova, G.V. Geophysical methods for studying the thickness of the melt layer and its properties at CALM sites (European North). In Proceedings of the Vserossiiskaya Knferentsiya, Posvyashchennaya 60-Letiyu Obrazovaniya Instituta Merzlotovedeniya im. P.I. Mel’nikova SO RAN (Russian Conference on the Ocassion of the 60th Anniversary of the Melnikov Permafrost Institute “Environmental and Infrastructure Integrity in Permafrost Regions”), Yakutsk, Russia, 28–30 September 2020; pp. 421–424. [Google Scholar]
  38. Sadurtdinov, M.R.; Skvortsov, A.G.; Sudakova, M.S.; Tsarev, A.M.; Malkova, G.V. Ispol’zovanie seismicheskikh i georadiolokatsionnykh metodov v geokriologicheskikh issledovaniyakh (Seismic and ground penetrating radar methods in permafrost research). Vestn. Sev.-Vostochnogo Nauchnogo Tsentra DVO RAN 2017, 75–86. [Google Scholar]
  39. Skvortsov, A.G.; Sadurtdinov, M.R.; Tsarev, A.M.; Dubrovin, V.A.; Kurchatova, A.N.; Malkova, G.V. The use of seismic methods for studying the structure of permafrost strata. In Proceedings of the Rasshirennoe Zasedanie Nauchnogo Soveta po Kriologii Zemli RAN “Aktual’nye Problemy Geokriologii” (Open Session of the Scientific Committee on the Earth’s Cryology of the Russian Academy of Sciences “Urgent Challenges in Geocryology”), Moscow, Russia, 15–16 May 2018; pp. 162–169. [Google Scholar]
  40. Doklad ob Osobennostyakh Klimata na Territorii Rossiiskoi Federatsii za 2018 God (A Report on Climate Features on the Territory of the Russian Federation in 2018); Roshydromet: Moscow, Russia, 2019.
  41. Doklad ob Osobennostyakh Klimata na Territorii Rossiiskoi Federatsii za 2019 God (A Report on Climate Features on the Territory of the Russian Federation in 2019); Roshydromet: Moscow, Russia, 2020.
  42. Reshetko, M.V.; Moiseeva, Y.A. Klimaticheskie osobennosti i statisticheskie otsenki izmeneniya elementov klimata v raionakh vechnoi merzloty na territorii severa Zapadnoi Sibiri (Climatic features and statistical evaluation of climate change in permafrost regions in the north of Western Siberia). Izv. Tomsk. Politekh. Univ. Inzhiniring Georesursov 2016, 327, 108–118. [Google Scholar]
  43. Linderholm, H.W.; Nicolle, M.; Francus, P.; Gajewski, K.; Helama, S.; Korhola, A.; Solomina, O.; Yu, Z.; Zhang, P.; D’Andrea, W.J.; et al. Arctic hydroclimate variability during the last 2000 years: Current understanding and research challenges. Clim. Past 2018, 14, 473–514. [Google Scholar] [CrossRef] [Green Version]
  44. Pavlov, A.V. Monitoring Kriolitozony (Permafrost Monitoring); Geo: Novosibirsk, Russia, 2008; p. 227. [Google Scholar]
  45. French, H.; Shur, Y. The principles of cryostratigraphy. Earth-Sci. Rev. 2010, 101, 190–206. [Google Scholar] [CrossRef]
  46. CALM—Circumpolar Active Layer Monioring. Available online: https://www2.gwu.edu/~calm/ (accessed on 19 March 2022).
  47. Pavlov, A.V.; Malkova, G.V. Melkomasshtabnoe kartografirovanie trendov sovremennykh izmenenii temperatury gruntov na severe Rossii (Small-scale mapping of trends of the contemporary ground temperature changes in the Russian North). Kriosf. Zemli 2009, 13, 32–39. [Google Scholar]
  48. Mel’nikov, E.S.; Grechishchev, S.E. (Eds.) Vechnaya Merzlota i Osvoenie Neftegazonosnykh Raionov (Permafrost and the Exploration of the Oil-and-Gas Bearing Regions). M., GEOS, 2002. 400p; GEOS: Moscow, Russia, 2002; p. 402. (In Russian) [Google Scholar]
  49. Mel’nikov, E.S. (Ed.) Landshafty Kriolitozony Zapadno-Sibirskoi Gazonosnoi Provintsii (Landscapes of the West Siberian Gas-Bearing Province’s Permafrost Region); Nauka: Novosibirsk, Russia, 1983; p. 165. [Google Scholar]
  50. Ukraintseva, N.G.; Drozdov, D.S.; Korostelev, Y.V.; Korobova, T.A. Terrain indicator approach and results for permafrost studies. In Proceedings of the Tenth International Conference on Permafrost (TICOP). Resources and Risks of Permafrost Areas in a Changing World, Salekhard, Russia, 25–29 June 2012; pp. 463–468. [Google Scholar]
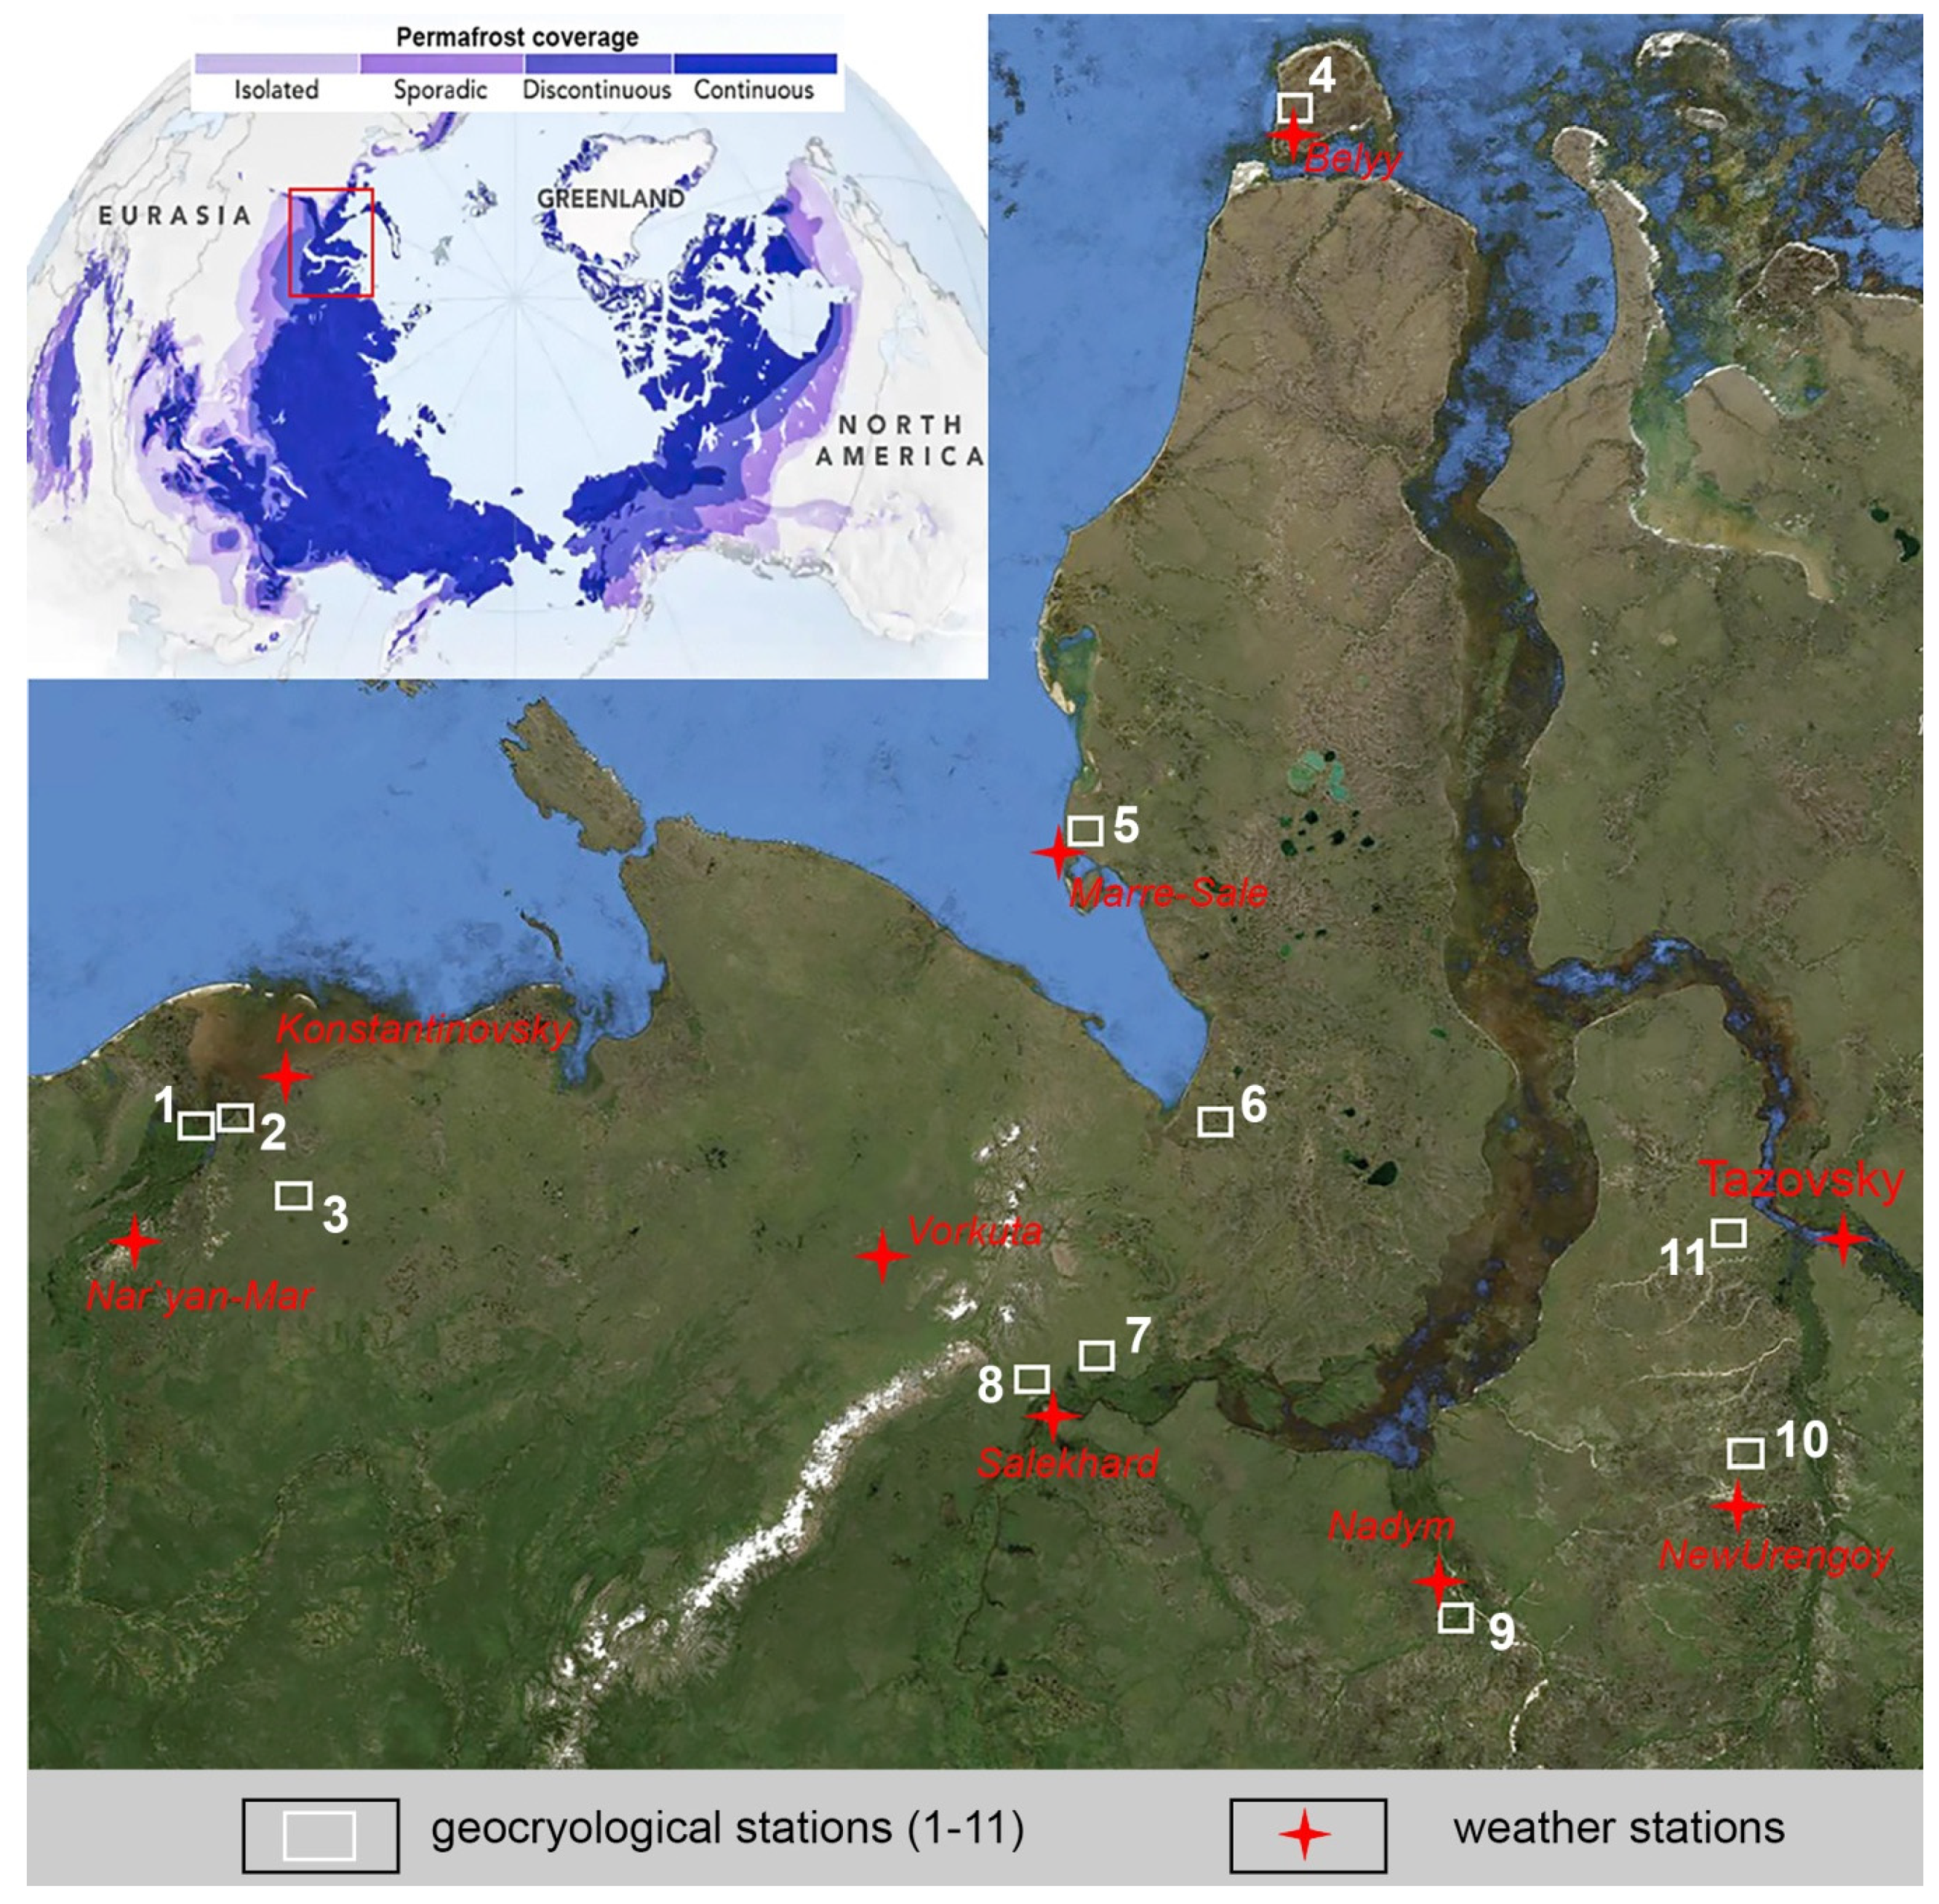
Figure 1. Layout of monitoring facilities and reference meteorological stations of Roshydromet. Sites included in this study: Kashin (1), Bolvansky (2), Shapkina (3), Belyy (4), Marre-Sale (5), Erkuta (6), Oktyabrsky (7), Labytnangy (8), Nadymsky (9), Urengoy-South (10), and Urengoy-North (11).
Energies 15 02311 g001
Figure 2. Changes in mean annual air temperature at weather stations in the western sector of the Russian Arctic.
Energies 15 02311 g002
Figure 3. Changes in the annual amplitude of air temperature by weather stations in northern Russia.
Energies 15 02311 g003
Figure 4. Spatial and temporal changes in the trend of mean annual air temperature in the Russian cryolithozone.
Energies 15 02311 g004
Figure 5. Interannual variability of average thaw depth at CALM sites [46].
Energies 15 02311 g005
Figure 6. Mean annual ground temperature in boreholes averaged over decades at a depth of 10 m in typical cryogenic landscapes at geocryological stations.
Energies 15 02311 g006
Figure 7. Changes in the mean annual ground temperature for two time intervals, Western Yamal, Marre-Sale station, typical tundra: (A) in the 1980s and (B) the modern period, 2020.
Energies 15 02311 g007
Figure 8. Changes in the mean annual ground temperature in southern tundra of the Russian European North for two time intervals: (A) in the 1980s and (B) the modern period, 2020.
Energies 15 02311 g008
Figure 9. Changes in the mean annual ground temperatures for two time intervals: (A) the 1980s, and (B) the modern period, 2020. North of Western Siberia, the territory of the Urengoy field, transect from northern taiga to southern tundra.
Energies 15 02311 g009
Table 1. Metadata of monitoring observations in the western sector of the Russian Arctic.
# In Figure 1Operational Stations and CoordinatesBioclimatic SubzoneDistribution of PermafrostNumber of Boreholes, Observation PeriodCALM Sites,
Observation
Period
Russian European North
1KashinSouthern tundraIsland10 (2012–present)R24A & R24B (100 × 100 m)
(2010–present)
N 68°14′
E 53°51′
2BolvanskySouthern tundraContinuous6 (1983–present)R24 (100 × 100 m),
(1999–present)
N 68°17′
E 54°30′
3ShapkinoSouthern tundraDiscontinuous4 (1983–2019)-
N 67°34′
E 55°07′
Western Siberia
4BelyyArctic tundraContinuous5 (2009–present)R55 & R55A
N 73°20′(100 × 100 m)
E 70°05′(2009–present)
5Marre-SaleTypical tundraContinuous6 (1978–present)R3
N 69°43′(1000 × 1000 m),
E 66°49′(1995–present)
6ErkutaSouthern tundraContinuous-R58
N 68°15′(100 × 100 m),
E 69°04′(2017–present)
7OktyabrskyForest tundraDiscontinuous-R57
N 66°58′(100 × 100 m),
E 67°10′(2013–present)
8Labytnangy and HarpForest tundraDiscontinuous3 (1967, 1977, 2021)R56 & R53
N 66°40′(100 × 100 m),
E 66°24′(2013–present)
9NadymskyNorthern taigaIsland15 (1975–present)R1A & R1B
N 65°18′(100 × 100 m),
E 72°51′(1995–present)
10Urengoy-SouthForest tundraDiscontinuous7 (1975–present)R50A
N 66°19′(100 × 100 m)
E 76°54(2008–present)
11Urengoy-NorthSouthern tundraContinuous7 (1975–present)R50B
N 67°28′(100 × 100 m)
E 76°42′(2008–present)
Table 2. Climatic indicators for reference weather stations.
The Name of the StationMean Annual Tair, °C MAATFreezing Index,
°C-Month
Thawing Index,
°C-Month
1961–19901991–20201961–19901991–20201961–19901991–2020
Nar’yan-Mar−3.8−2.4−83.0−72.037.943.0
Konstantinovsky−5.2−3.6−90.0−77.428.433.8
Vorkuta−6.7−2.7−104.4−94.332.038.1
Belyy−11.1−9.5−145.4−129.910.215.8
Marre-Sale−8.5−6.9−119.7−107.418.424.3
Salekhard−5.9−4.4−113.8−101.642.648.3
Nadym−6.0−4.5−113.8−101.842.648.7
New Urengoy−7.3−6.1
Tazovsky−9.2−7.4−144.1−129.534.340.8
Table 3. Seasonal thawing depth values averaged for each site [46].
NNCALM
/Lithology
20102011201220132014201520162017201820192020Trend in
2010–2020
cm/Year
R1ANadymsky */peat, sand1141291341361641631861481781761606.8
R3Marre-Sale/peat, sand981021271151021221361081071211352.0
R24Bolvansky */sandy loam1041071201171021101191041101041200.3
R24AKashin Island/peat, sand5864888765801097684831233.7
R50AUrengoy-south *
/peat, sand
77728770768574691111031294.1
R50BUrengoy-north *
/loam
8082959284939693101102 2.1
R53Harp, Polar Urals */loam 99941001111348.8
R55Belyy Island
/silt loam
50536055415968575354650.8
R55ABelyy Island/sandy9098114112911111301151071091312.5
R56Labytnangy
/loam
639610011583971001234.7
R57Oktyabrsky
/loam
44615662405760681.7
R58Erkuta
/peat, sand
8183961017.3
Note: * Sites with missing probe measurements.
Table 4. Linear trends of changes in the mean annual air temperature and the permafrost for 1990–2020 according to all temperature boreholes.
Location Temperature Trend, °C/Year
αa,
Average
αg,
Minimum
αg,
Maximum
αg,
Average
R1A Nadymsky0.080.0010.0270.0090.11
R3 Marre-Sale0.130.0320.0670.0500.39
R24 Bolvansky0.080.0100.0520.0380.47
R50A Urengoy-South0.080.0060.0530.0310.38
R50B Urengoy-North0.100.0080.0740.0500.47
Labytnangi0.060.0040.0170.0110.18
Publisher’s Note: MDPI stays neutral with regard to jurisdictional claims in published maps and institutional affiliations.

