Article

Technology-Agnostic Assessment of Wave Energy System Capabilities

1
TECNALIA, Basque Research and Technology Alliance (BRTA), Astondo Bidea, Edificio 700, 48160 Derio, Spain
2
School of Engineering, University of the Basque Country, Plaza Ingeniero Torres Quevedo, 1, 48013 Bilbao, Spain
3
Basque Centre for Applied Mathematics (BCAM), Alameda de Mazarredo 14, 48009 Bilbao, Spain
4
Institute for Energy Systems, School of Engineering, The University of Edinburgh, Edinburgh EH9 3JG, UK
*
Author to whom correspondence should be addressed.
Energies 2022, 15(7), 2624; https://doi.org/10.3390/en15072624
Submission received: 17 March 2022 / Revised: 28 March 2022 / Accepted: 30 March 2022 / Published: 3 April 2022
(This article belongs to the Special Issue Marine Renewable Energy Technology)

Abstract

:
Developing new wave energy technologies is risky, costly and time-consuming. The large diversity of concepts, components and evaluation criteria creates a vast design space of potentially feasible solutions. This paper aims to introduce a novel methodology for the holistic assessment of wave energy capabilities in various market applications based on sound Systems Engineering methods. The methodology provides a consistent hierarchy of performance metrics relevant to the given system of reference, design activity and development stage under consideration as a means to scrutinise wave energy requirements. Full traceability of system requirements and performance metrics is then facilitated by multi-criteria decision tools and aggregation logic, respectively. The qualitative assessment in the case studies has resulted in very different rankings of System Drivers and Stakeholders for the two market applications considered. However, the Stakeholder Requirements and Functional Requirements present a small variation in the weights for the two application markets which results in a quantitative assessment with very similar Global Merit. Finally, the performance benchmark using the Commercial Attractiveness and Technical Achievability concepts enables a more objective comparison in the utility-scale and remote generation markets and a way to concentrate innovation efforts before proceeding to the next development stage.

1. Introduction

Wave energy has attracted the interest of many inventors for more than two centuries. Since the first recorded patent in 1799 [1], engineers have struggled to unravel the key requirements of wave energy technologies. However, it was not until the early 1970s that the mathematical formulation of wave energy interaction allowed us to understand the capture efficiency of marine devices [2]. The first attempt to derive a performance assessment of wave energy technologies was proposed by Nielsen [3]. Suggestions included ratios such as the Capture Width, Energy to Volume or Mass, Power Take-Off Efficiency, Capacity Factor and Capital Cost to Energy. The European project EQUIMAR [4] added other assessment figures to these metrics such as the Operating Cost, Availability Factor and LCOE. Initial work from Weber [5] on the Technology Performance Levels (TPL) has been continued in the US to evolve and endorse the TPL design philosophy, assessment criteria and methods [6]. More recently, IEA-OES has promoted an international evaluation and guidance framework for ocean energy technologies based on the concept of staged development [7]. Stages are loosely related to the Technology Readiness Level (TRL) scale, and at each stage-gate, an evaluation of the relevant metrics is carried out. The first-of-its-kind implementation of this framework has been produced in the DTOceanPlus suite of design tools for ocean energy systems [8].
Clearly, performance requirements are moving from the mere evaluation of the energy production and costs to a more comprehensive assessment. Equally, the evaluation is evolving from the analysis of the basic wave energy subsystems involved in the power conversion to complete wave energy farms including multiple devices, the balance of plant or installation and maintenance activities. Discouragingly, most of the novel wave energy concepts are still focusing their efforts on the optimisation of power capture, leaving out of the initial design considerations of other essential performance requirements and subsystems that later become expensive “add-ons” [9]. In fact, experience in very diverse engineering sectors has shown that the early stages of technology development are crucial to meet cost and performance expectations [10] since engineering problems are built at the concept stage.
The development of a competitive wave energy technology is a long endeavour faced with many challenges. The increased complexity of the assessments coupled with the large diversity of concepts calls for comprehensive development and evaluation methods. Hence, technology developers are encouraged to move to an integrated systems approach [9]. In that respect, Systems Engineering (SE) provides a suitable framework to allow progress towards a successful wave energy technology [11].
SE is a holistic, top-down approach to understanding stakeholder needs, exploring opportunities, documenting requirements and assessing alternatives while considering the whole problem [12]. SE methods have been successfully applied in many industrial sectors (e.g., automotive, aerospace or oil and gas among others) to develop innovative products meeting very diverse and demanding stakeholder needs. Regrettably, the application of SE to wave energy has been much limited and fragmented so far [13].
A thorough and systematic design process should provide engineers with effective means of organising information on system requirements and discriminating it from the information associated with design solutions [14]. System requirements should be specified at different levels of detail (or hierarchy) and be fully traceable throughout the design process [15]. Moreover, since the satisfaction of requirements is the driving force behind SE, evaluation and decision making must rely on the use of well-defined and articulated metrics. Finally, the systematic assessment should be flexible and adaptable to changing market conditions and stakeholder expectations, as they define the relative importance of individual requirements and therefore the solution space.
This paper aims to introduce a novel technology-agnostic methodology for the holistic assessment of wave energy capabilities for various market applications. Each of these capabilities has been characterised by a function and its level of performance, following the approach in [16]. The core contribution of this methodology is to provide a consistent hierarchy of performance metrics relevant for the system of reference, design activity and development stage under consideration as a means to scrutinise wave energy requirements. Full traceability of system requirements and performance metrics is then facilitated by multi-criteria decision tools and aggregation logic, respectively. Finally, customisation of assessment criteria thresholds for the market-specific conditions enables a robust benchmarking of different wave energy technology options as well as the identification of outstanding technical challenges, as will be explained in Section 2.3.
Two new concepts, commercial attractiveness and technical achievability, are introduced and illustrated through case studies. Assuming the primary product for wave energy is likely to be electricity generation [17], the case studies focus on the utility-scale generation and powering remote communities’ markets. Hence, this novel approach contributes to overcoming the limitations of pure qualitative or quantitative evaluating methods as well as allows tracking the reduction in technical risks along the various development stages by means of the performance ratio values.
The outline of this article is as follows. Section 2 introduces the methodology and main SE methods and tools used for the assessment of wave energy capabilities. Section 3 describes the specific implementation of this novel methodology in the environmental, stakeholder and functional domains. Furthermore, the results for two different market applications of wave energy technologies are presented and discussed in Section 4, before drawing the conclusions in Section 5. Finally, the prioritisation for the different domain attributes for the case studies along with their respective interactions is included in the Appendix A.

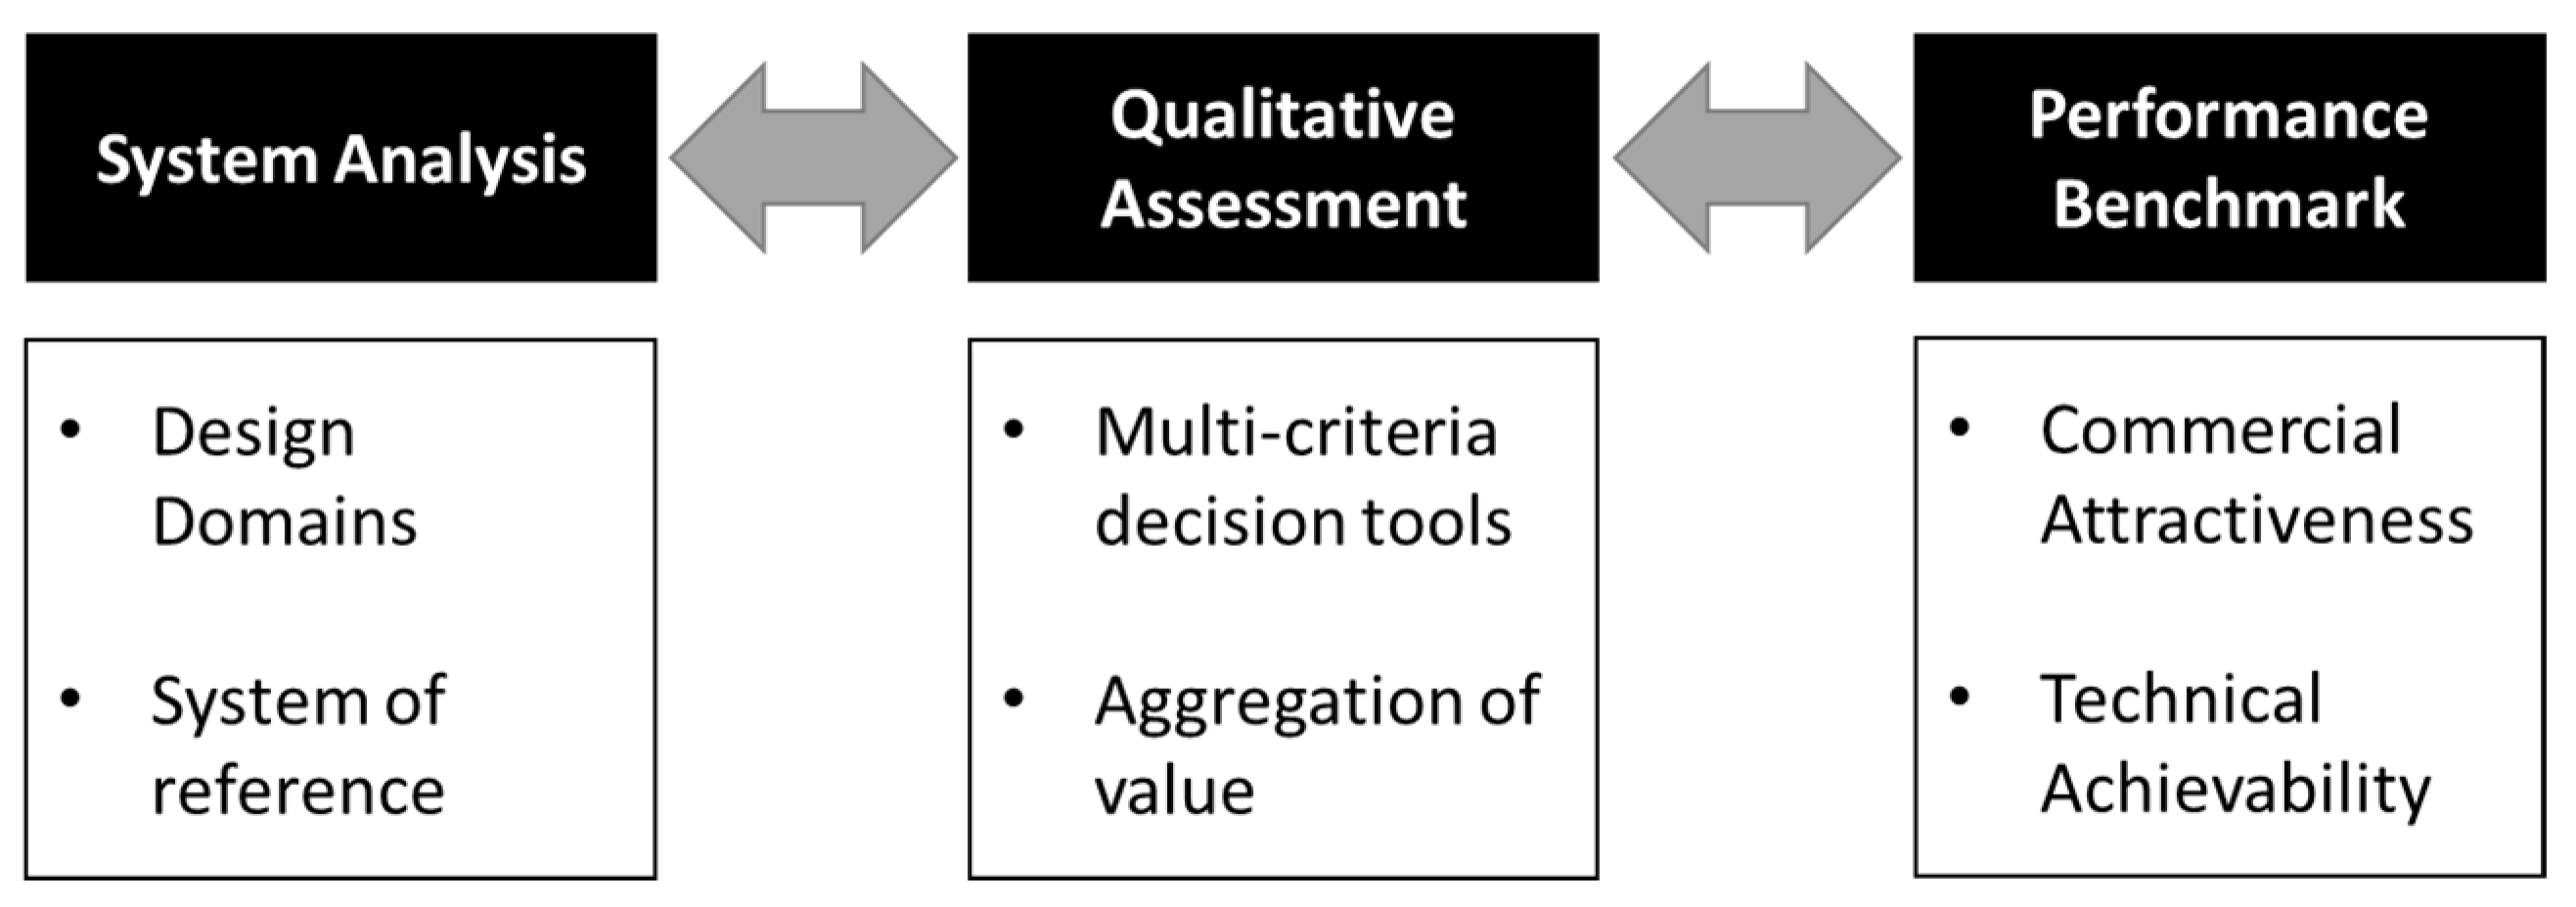
2. Materials and Methods

The proposed evaluation approach consists of system analysis, a qualitative assessment and a performance benchmark (i.e., quantitative assessment) as shown in Figure 1. This method merges the engineering design and validation activities together with multi-criteria decision-making and benchmarking. Hence, it enables a comprehensive evaluation of wave energy technologies at various development stages. It is important to highlight the inherent flexibility of the proposed method. For instance, the evaluation approach can be expanded by adding more granularity, i.e., finer levels of details, as the technology matures, or the design focus (i.e., system of reference) shifts from the farm and device to subsystem levels.
The following sub-sections describe the three components of the systematic design approach for wave energy technologies. Furthermore, the qualitative assessment and performance benchmark are illustrated through a set of case studies comprising two different market applications of wave energy technologies and six hypothetical technology options.

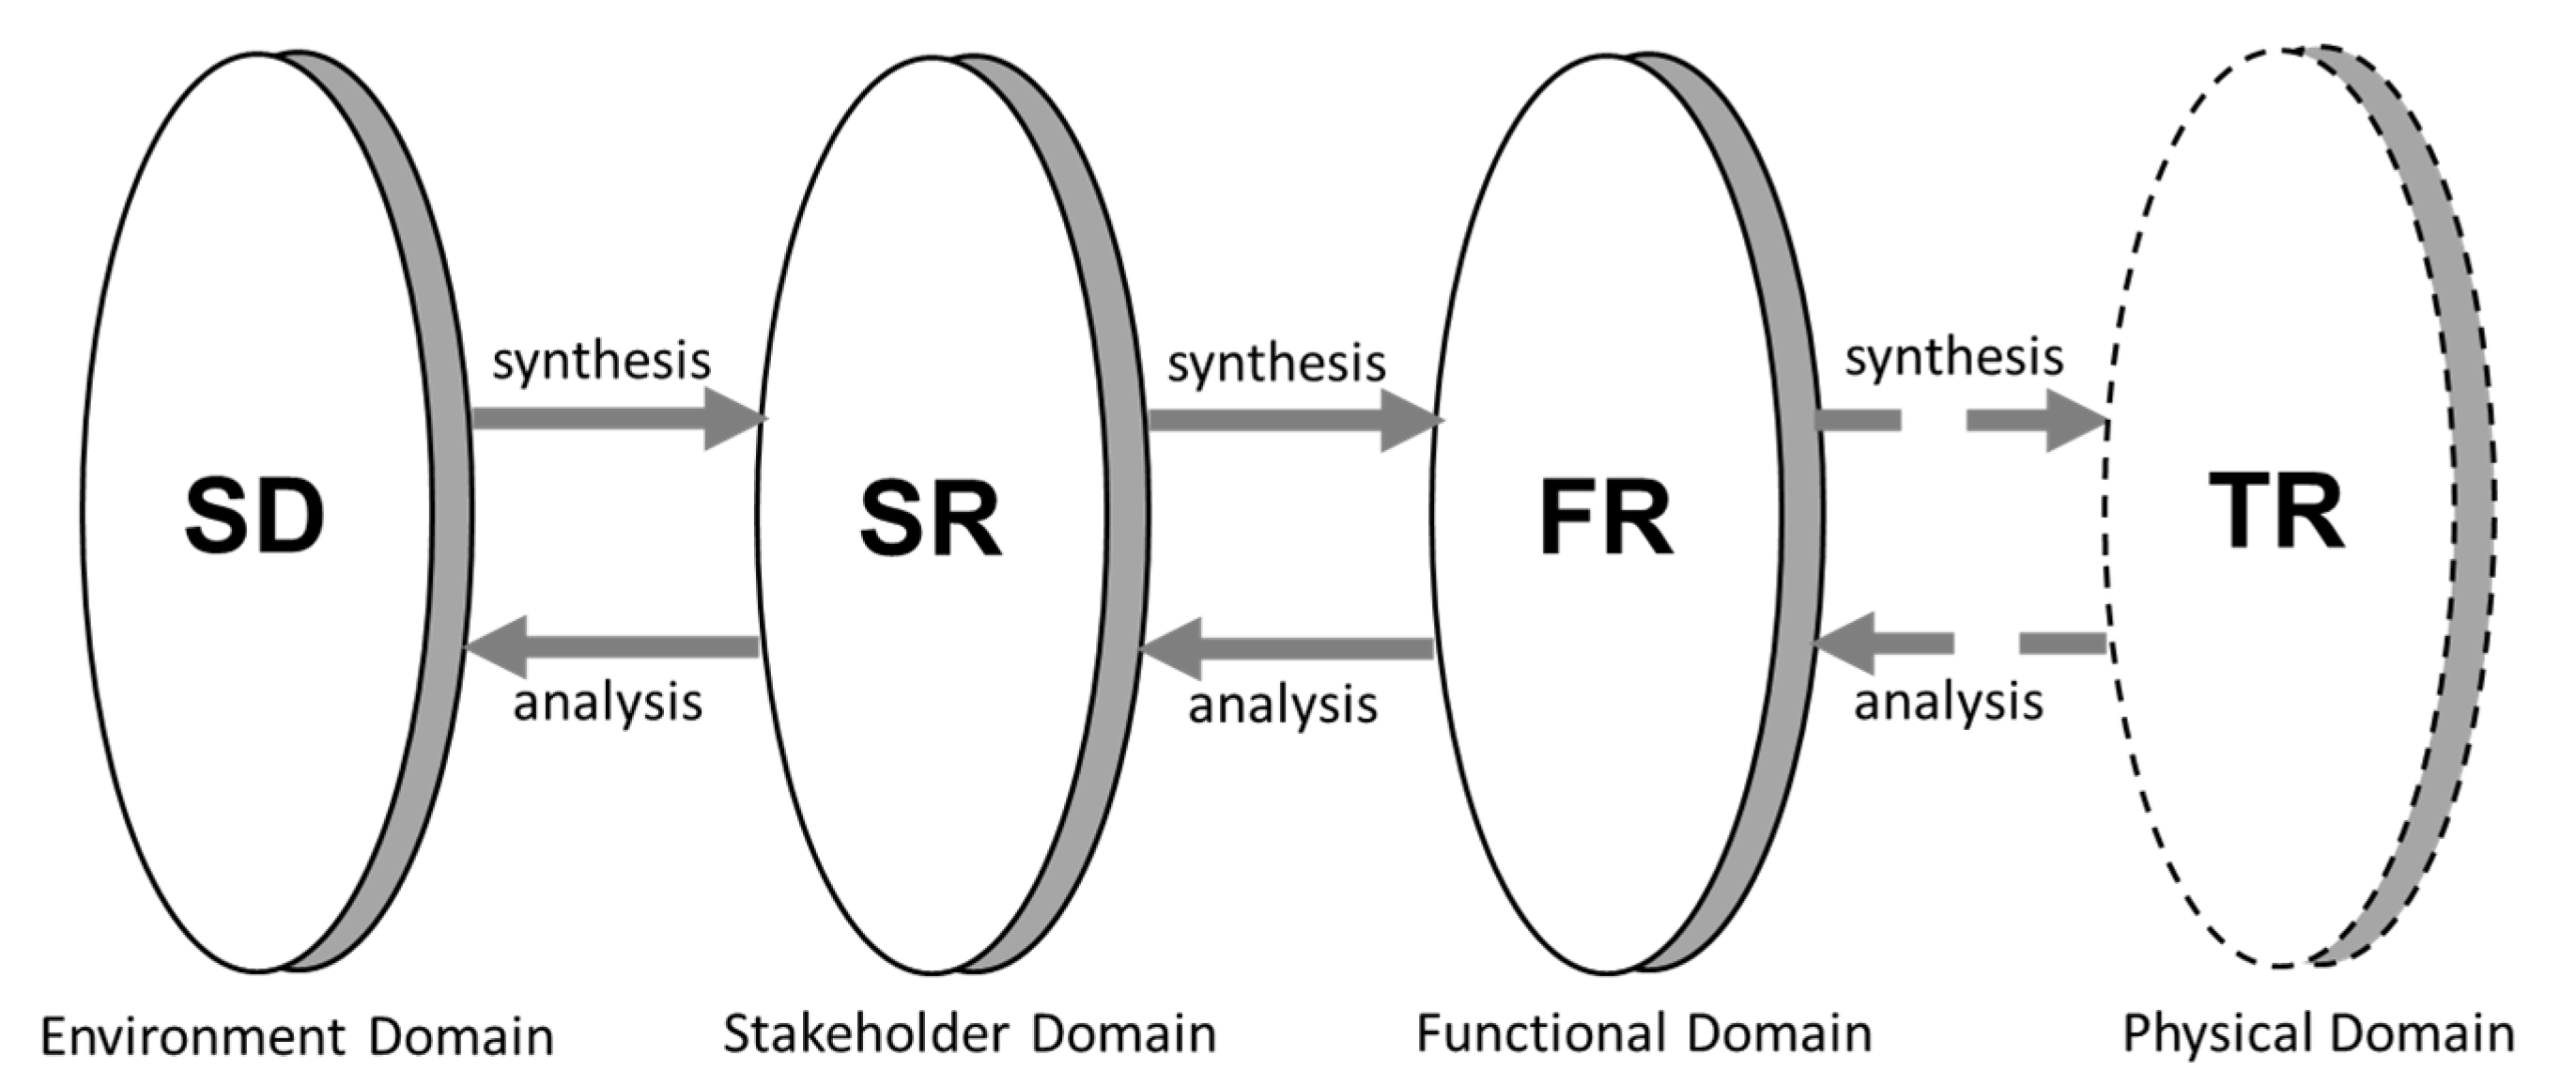
2.1. System Analysis: Requirements, Metrics and System of Reference

Despite the relatively short history of SE, their practitioners have produced a wealth of methods and tools that serve different purposes. As far as system analysis is concerned, it is worth mentioning the Axiomatic Design technique [18], which structures the world of design in separate domains. The concept of design domains is very effective to organise the design process by introducing borderlines between various types of design activities for the development of wave energy technologies. Thus, the wave energy problem is represented differently depending on the corresponding design domain. An associated model is attached to each design domain aiming to capture domain-specific information.
Different domain models can be used to represent the wave energy system depending on the level of abstraction and degree of detail [19]. A full description of the domain frameworks proposed by various authors can be found in [13]. Currently, there is a lack of consensus on the definition of the domains that are common to all engineering projects. However, existing frameworks often limit their use to a maximum of three or four domains.
The proposed assessment method will map the environmental, stakeholder and functional domains (see Figure 2). The transition from left to the right illustrates the engineer’s synthesis activity to achieve an effective design that satisfies the requirements. The opposite way reveals the engineer’s analysis activity supporting verification and validation. Although shown in the graph for the sake of completeness, the physical domain is out of the scope of this paper since it aims to produce a technology-agnostic assessment of wave energy system capabilities and not a specific physical embodiment or set of Technical Requirements (TR).
The environmental domain deals with the external factors that impact the wave energy system. This domain is defined by System Drivers (SD) and their interactions [20]. SD encompass the political, economic, social, technical, legal and environmental factors that limit, facilitate or shape the design solution. The stakeholder domain defines the design problem in the customer’s language, which is still general, ambiguous and highly unmeasurable [21]. It is represented by the Stakeholder Requirements (SR), which are a set of desirable characteristics that the final solution should satisfy. Finally, the functional domain aims to produce a complete, unambiguous and technology-agnostic definition of the design problem space [22]. Functions describe the purposes of the wave energy system and Functional Requirements (FR) and specify what the system must do in order to achieve the SR [20].
Once the critical system properties are established in the form of wave energy system requirements, evaluation criteria are assigned to offer a credible means by which to assess various design options. Metrics linked to the upper system attributes (i.e., SR) are usually referred to as Measures of Effectiveness (MOE). They are reduced in number since the lower level evaluation metrics are successively derived from them [23]. Measures of Performance (MOP) are used to gauge the FR of a design solution, whilst Technical Performance Measures (TPM) are used to demonstrate successful delivery of the TR. MOP are technology-agnostic, and traceability should be maintained both throughout the decomposition process and with regard to the higher-level MOE. This hierarchy of evaluation criteria ensures a holistic assessment that captures different levels of detail and granularity in the metrics. It is worth noting that the concept of design domains coupled with this fundamental hierarchy of evaluation criteria is also consistent with the basic design processes in the V-model [24], a well-known SE approach.
Since any wave energy system can be successively decomposed into smaller entities, the synthesis and analysis activities can be further expanded by repeating the domain mapping process to each subsystem, assembly or component. Regardless of the system scope under consideration, it is essential to identify the entities that interact with it via the system’s external interfaces (i.e., External Systems) and the wider environment where the system is placed (i.e., Context). The External Systems and the Context play a key role in establishing further system requirements [25,26]. Figure 3 depicts the different interactions among the System, External Systems and Context.
As the External Systems and Context are defined in relation to the System, it is necessary to clearly delimit the scope of the wave energy system. Most commonly, technology developers identify the system of reference with their Wave Energy Converter (WEC), whereas suppliers consider it to be one of its main constituents, such as the Power Take-Off (PTO) or the mooring system. The authors of this paper believe it is more appropriate and unbiased to designate the wave energy farm as the baseline system for the global assessment of technologies since this is the final product that can meet the market need for sustainable, affordable, and secure energy. Moreover, this definition is fully consistent with the system analysis conducted by Babarit et al. for wave energy [27]. However, this approach can be equally applied to other systems of reference such as the WEC, PTO or mooring system.

2.2. Qualitative Assessment: AHP, QFD and LSP

Complex engineering problems often require a set of interdependent and competing criteria. The Analytic Hierarchy Process (AHP) is a useful tool that provides a systematic approach to support multi-criteria decision making. Developed by Saaty in 1980 [28], AHP assists in capturing both subjective and objective aspects of an engineering problem by breaking down decisions into a series of pairwise comparisons and combining them into a single scale. Furthermore, AHP includes an effective technique to check the consistency of the evaluation, hence reducing the bias in the final decision. Since its emergence, it has become one of the more widely used multi-criteria analysis methods.
AHP is formalised in four main steps. It starts by decomposing the decision problem into a hierarchy of sub-problems. Decision criteria are placed in an nxn squared matrix and two criteria are compared at each time to determine which one is more important. Whenever the criteria in rows are more important than the ones in columns, the 9-point gradation scale [28] shown in Table 1 is used to quantify the comparison, aij. Otherwise, the reciprocal value is assigned, aji = 1/aij.
Based on each criteria priority, the overall ranking is developed by normalising the judgement matrix. The relative importance, wi, is calculated as follows:
a i j = a i j i = 1 n a i j , i = 1 , 2 , , n ; j = 1 , 2 , , n
w i = j = 1 n a i j n , i = 1 , 2 , , n
Finally, the degree of consistency among the pairwise comparisons is measured by computing the Consistency Index and Consistency Ratio [28]. According to this, a Consistency Ratio below 0.1 is deemed satisfactory.
Until now, AHP has been only applied in wave energy to rank technology options with regard to techno-economic criteria (e.g., energy capture, cost, reliability, environmental friendliness, adaptability) in a single step [29]. To limit the subjectivity of and dependence on expert judgements, AHP will be used in the environmental domain to prioritise System Drivers (SD) at the outset of this novel methodology (please see Appendix A). For the rest of the cross-domain assessments, another matrix-based method will be used, namely Quality Function Deployment (QFD).
QFD [30] is another well-known design tool developed in Japan by the end of the 1960s, being first documented at the Kobe shipyards of Mitsubishi Heavy Industries in 1972. It is used to translate the Voice of the Customer (VoC) into system requirements employing a series of matrices called the House of Quality (HoQ). System requirements initially consisted of just customer needs and technical requirements, but they can equally be functions, design parameters or critical process variables. Furthermore, QFD matrices can be linked in a waterfall manner to ensure the full traceability of the requirements.
QFD is formalised in 6 main steps:
  • To determine the input requirements and relative importance ratings. In the proposed methodology, AHP is adopted for the prioritisation of initial factors, that is, System Drivers (SD).
  • To benchmark how the input requirements are currently satisfied. This step creates an awareness of what already exists and facilitates assigning target values to these requirements.
  • To generate output requirements, which are the restatement of the design problem in the corresponding domain. The Functional Analysis and System Technique (FAST) can be used for the identification of the output requirements [31].
  • The relationship matrix is used to relate the input and output requirements. This way the priorities of the input requirements can be translated into the relative importance ratings of output requirements (Step 6). In order to do so, the relationships traditionally expressed in qualitative symbols (e.g., ⊙ strong, ◯ medium, △ weak) are converted into numerical coefficients (e.g., 9-3-1).
  • The correlation matrix is added to highlight interrelationships between output requirements. Positive relationships represent supporting requirements, whilst negative linkages help identify conflicts and trade-offs. Qualitative symbols (e.g., +, −) or numerical ratings (e.g., 1, −1) are used to describe these relationships.
  • To determine relative importance ratings of the output requirements. The absolute level of importance of the output requirement, wj, is obtained by summing the relative importance of the input requirements, di, multiplied by the quantified numerical coefficients, rij. The relative importance rating, w j , is then computed as:
    w j = i = 1 n d i · r i j , i = 1 , 2 , , n ;   j = 1 , 2 , , m
    w j = w j j = 1 m w j
    where n and m are the number of input and output requirements, respectively.
To determine the relative importance ratings, some authors have proposed normalisation models that also include the correlation matrix. Chen’s approach [32] is aimed to overcome the limitations of other models that produce unreasonable results. In this method, the numerical coefficients, rij, are normalised according to the following equation:
r i j = ( k = 1 m c k j ) r i j j = 1 m ( k = 1 m c k j ) r i j , c [ 1 , 1 ]
where ckj are the number ratings of the correlation matrix.
In wave energy, QFD has been applied to assess the potential of wave energy innovations defined by its functions, without any normalisation and in a single step [33]. The QFD tool with Chen normalisation will be used to link SD to Stakeholders (SH) and assign importance ratings to wave energy requirements in the different domains (please see Appendix A).
Lastly, the aggregation concept is a common feature of multi-criteria analysis methods. Even though tools such as AHP or QFD can be used to derive weightings for the various evaluation criteria, combining the lower-level evaluation criteria into an aggregated score is not a simple task. The TPL methodology [6] introduces four degrees of flexibility to carry out this aggregation into higher-level metrics. The Logical Scoring of Preference (LSP) method proposed by Dujmovic [34] is used here to capture the underlying functional relationships and add more granularity to the aggregation step by allowing the definition of the degree of simultaneity of the requirements being combined from total disjunction to full conjunction [35].
Conjunction in LSP means that the output utility is predominantly affected by the value of the smallest input, calling for simultaneous high input values. The geometric and harmonic means, respectively, are examples of conventional operators that provide increasing levels of simultaneity. Conversely, disjunction means that the output utility allows the replaceability of low-value inputs. The square mean is an example of partial replaceability. Neutrality, that is, the perfect balance between conjunction and disjunction, is denoted in LSP by the weighted arithmetic mean. When combining mandatory and optional inputs or sufficient and optional inputs, conjunctive or disjunctive partial absorption are used, respectively. The intensity of the simultaneity or replaceability can be continuously adjusted by selecting different operators.
Following this approach, the evaluation criteria can be aggregated sequentially into higher hierarchical levels accounting for the degree of simultaneity of the different attributes until the final overarching merit is obtained. The overall suitability can be interpreted as the qualitative degree of satisfaction of all specified requirements. This suitability, s0, is computed from the next level of evaluation criteria, si, as follows:
s 0 = ( i = 1 n w i · s i d ) 1 d ; i = 1 n i = 1 , i = 1 , 2 , , n
where n is the number of evaluation criteria, wn are their weightings, and d is a coefficient that depends on the degree of simultaneity. Values of d range from ∞ for pure conjunction to +∞ for pure disjunction. Additional values are provided in [34] for other alternatives of partial conjunction and disjunction.

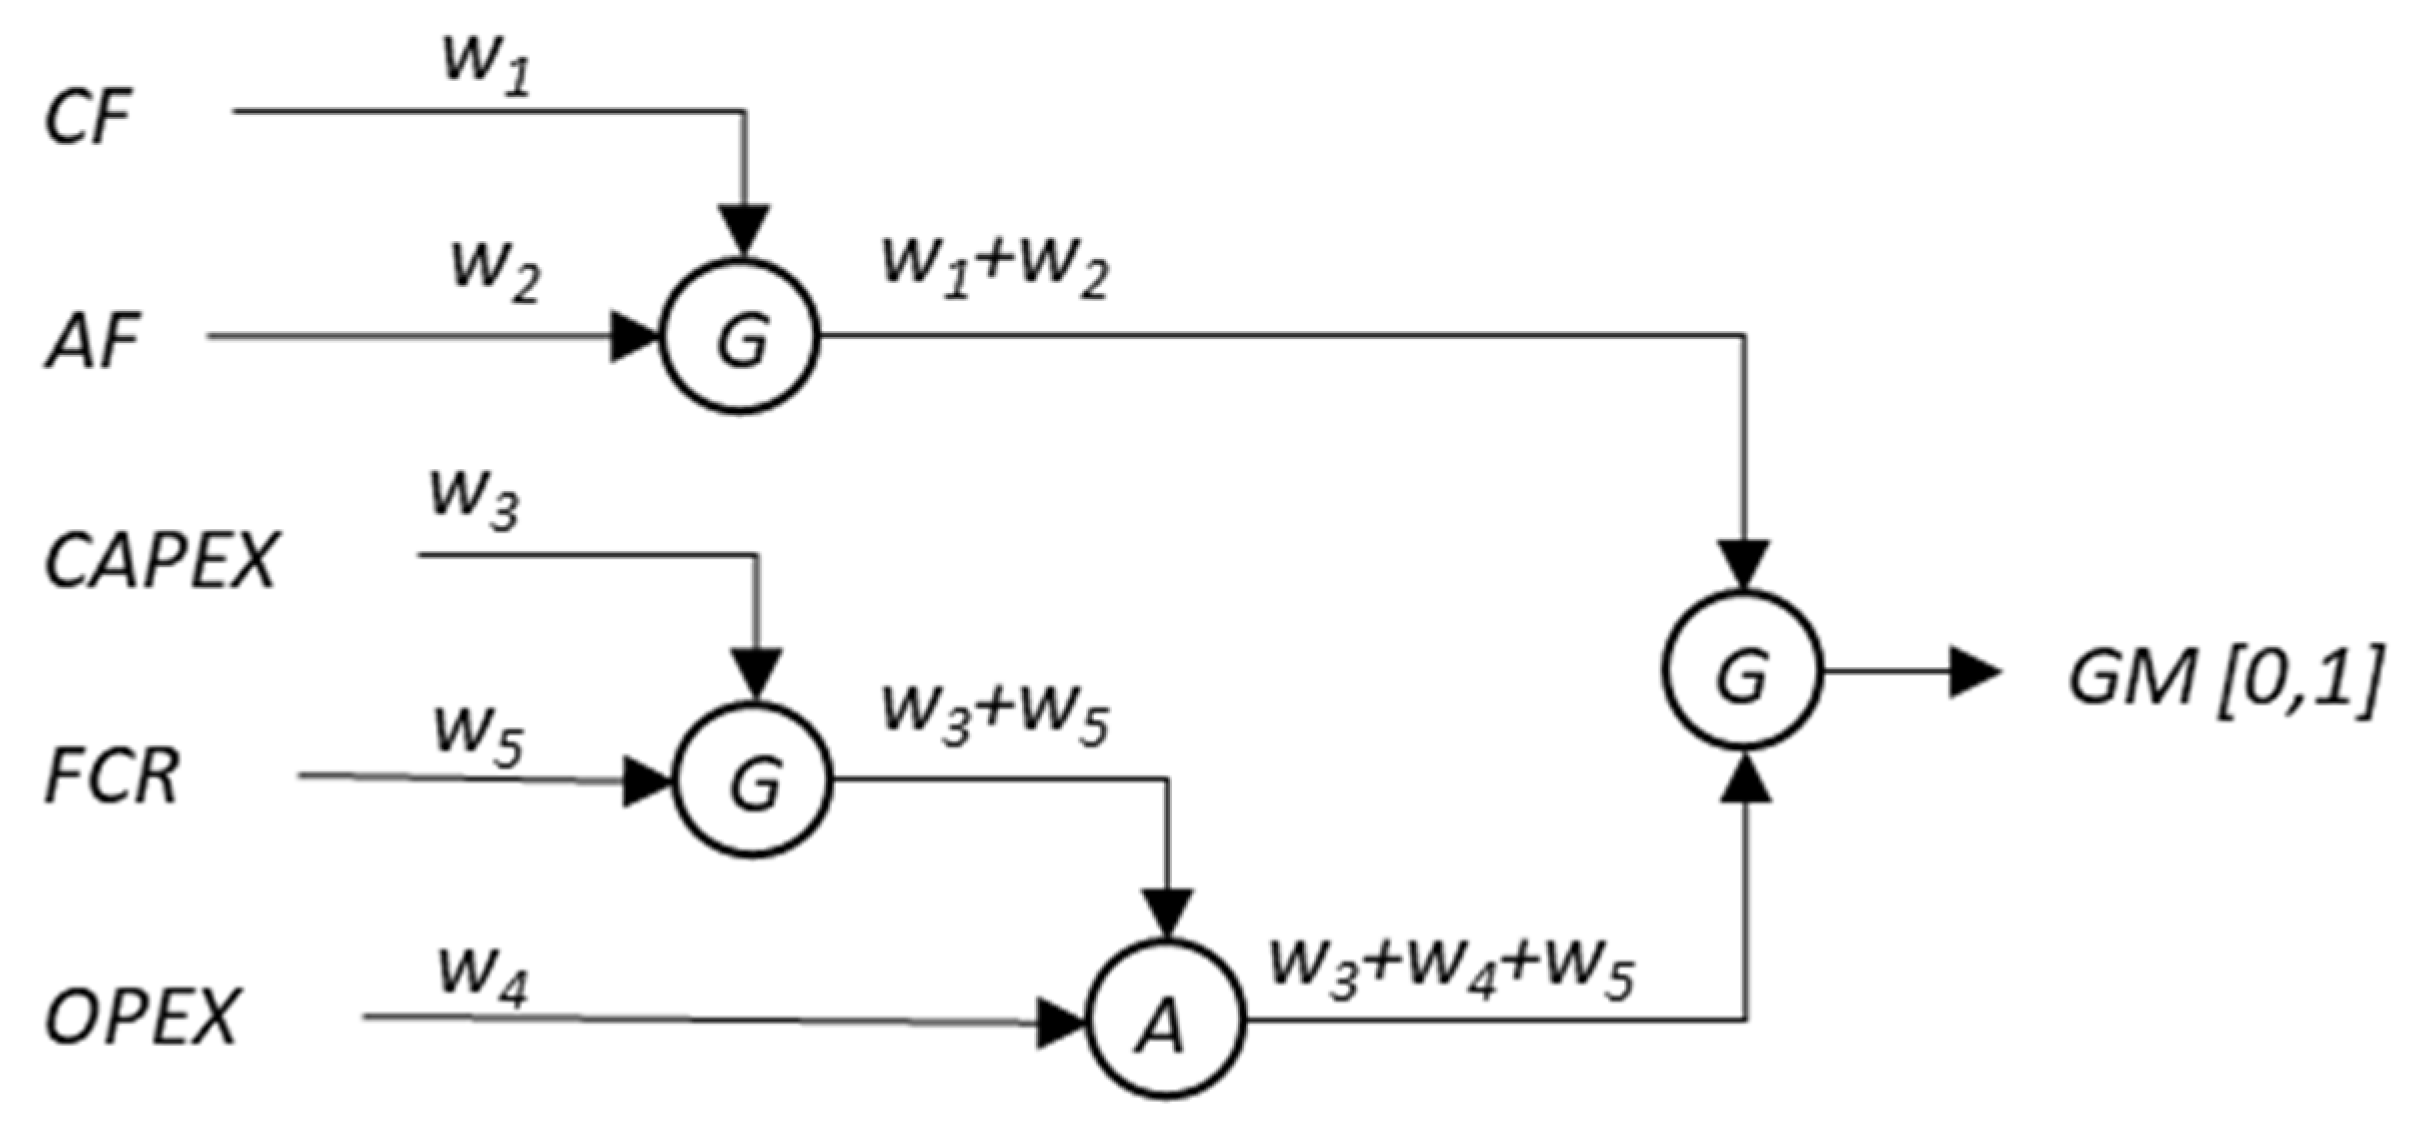
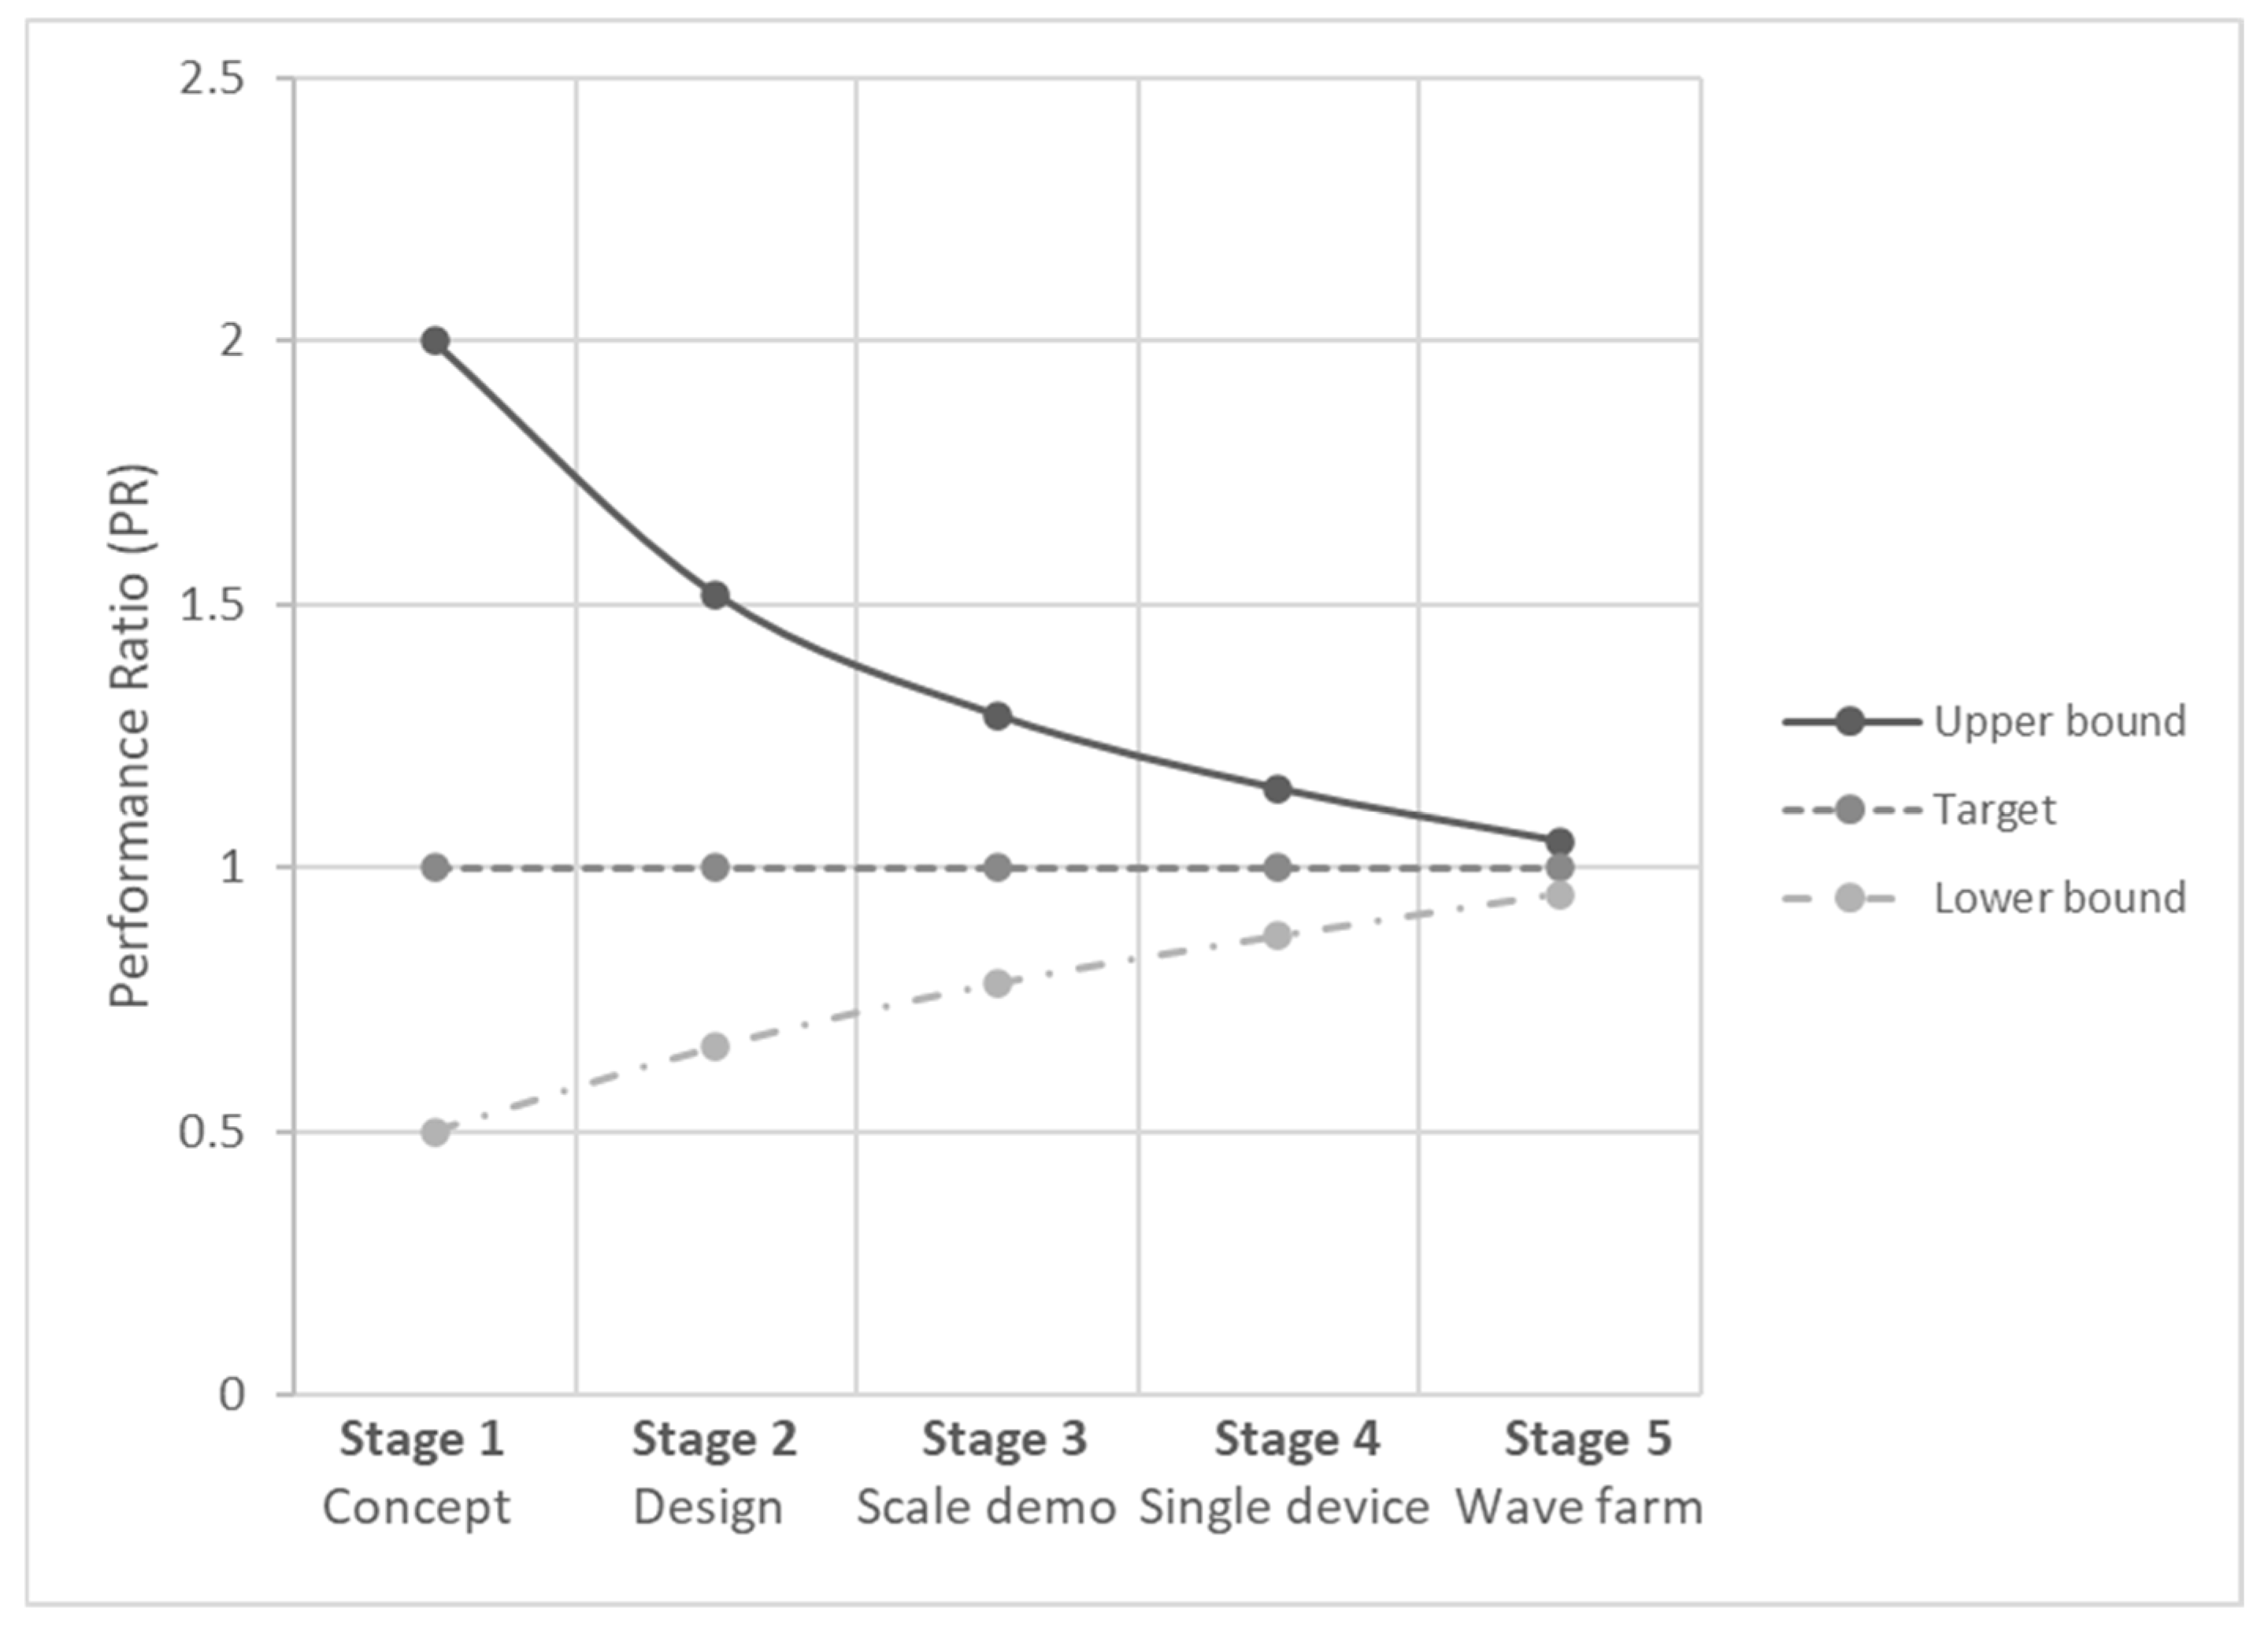
2.3. Performance Benchmark: Commercial Attractiveness and Technical Achievability

To provide a quantitative assessment, system performance needs to be measured against a specified reference. QFD considers a particular step to benchmark how the system requirements are currently satisfied. Awareness of best practices in wave energy helps to assign acceptable, achievable and desirable ranges for system requirements such as in [36] for the capture width. These target values enable benchmarking of the relative performance of wave energy technologies in a quantitative manner. Evaluation criteria targets divide technology performance into two separate regions. There is the region of acceptable performance where the technology either meets or exceeds the specified reference for the corresponding metric. By contrast, unacceptable performance pops up when the technology falls short with regard to this reference value [37]. Any wave energy developer aims to reach the acceptable performance region for all mandatory metrics.
Notwithstanding the metric under consideration, evaluation criteria can present two different performance behaviours. Whereas some metrics in the evaluation hierarchy must decrease to meet the established target, other metrics display an increasing performance pattern. Let us define the Performance Ratio (PR) to overcome this opposing behaviour. For metrics that exhibit decreasing performance (i.e., lower is better), the PRi is calculated as follows:
P R i = T i M i
where Ti and Mi are the target and measured performance values, respectively, for the evaluation criteria i. Typical examples of this category of metrics are the Levelized Cost of Energy (LCOE) and the Mean Time to Repair (MTTR).
Alternatively, for metrics that show an increasing performance pattern (i.e., higher is better), the PRi is calculated reversing this quotient, which accounts for the percentage that the measured performance exceeds the target value.
P R i = M i T i
Some examples of this category of metrics are the Capacity Factor (CF), Availability Factor (AF) and the Mean Time Between Failures (MTBF).
The outcome of performance benchmarking for a wave energy concept gives an estimation of how close or far the technology is to achieving its previously established technical goals. A PRi ≥ 1 will mean that the wave energy technology is in the acceptable performance region for the evaluation criteria i. Conversely, a PRi < 1 denotes an unacceptable performance of this evaluation criteria. Technologies that have all mandatory requirements in the acceptable performance region can be benchmarked in terms of their commercial attractiveness. Otherwise, the technical achievability should be investigated.
Commercial Attractiveness (CA) is a broad concept that can encompass various aspects ranging from economic profitability to stakeholder acceptability and size of the market opportunity. In the field of wave energy, CA has been defined as the ratio of the target LCOE value to the calculated one for the exploration of concepts beyond the existing technologies [38]. Note that this ratio fits perfectly within the generic PR definition from Equation (7), but in this case applied to the Levelized Cost of Energy, a common high-level affordability metric. The assessment of CA is also mentioned in the International Evaluation Framework for Ocean Energy Technologies [7], this time comprising both the cost of energy and sustainability aspects such as environmental and social acceptance. The guideline, however, does not provide any metric for sustainability.
To take into consideration the qualitative aspects beyond mere affordability, the proposed method will define CA as the product of the Global Merit (GM), derived from the qualitative assessment, and the PR for the cost of energy when PR ≥ 1. This definition has the advantage of enabling an objective comparison of wave energy technologies in various markets presenting dissimilar energy prices and responding to different stakeholder demands and priorities.
If   P R 1   CA =   GM P R ;   else   CA = 0
For wave energy technologies that are unable to meet one or more of the mandatory requirements and therefore technological improvements are needed, the Technical Achievability (TA) concept is introduced. It offers a measure of the technology development risk, time or effort to meet the target performance. This concept is particularly useful when guiding technologies with long development times such as wave energy. TA has been formulated in [38] for metrics of power performance and subsystem cost. Improvement factors and learning rates are used to assess the degree of effort needed. Additionally, the reverse LCOE engineering method [13] was proposed to explore the limits for the technical parameters of wave energy technologies. Basically, this is a unidimensional analysis in which all partial evaluation criteria are fixed, and the cost reduction is investigated to achieve a PR = 1.
This method proposes an alternative but more comprehensive definition that can be used to assess wave energy performance at any hierarchical level. This TA definition has been adapted from [39], where it is used to support decisions of new defence technologies through their development lifecycle based on performance assessment. The TA combines the PR and Degree of Difficulty (DD) in the following manner:
TA = P R 1 + ( 1 P R ) DD
The DD provides an effective measure of the probability of risk, whilst (1 − PR), the unmet performance is a measure of the severity or importance of risk. Table 2 presents the DD levels and their corresponding numerical values. The risk levels are based on [39] but the assigned numerical values have been resized to a 9-point scale for consistency with the previous ranking methods. The lower bound (0) indicates that there is no risk in meeting the requirement and success is therefore guaranteed. Alternatively, the upper bound (9) means that it is impossible to meet the requirement. Intermediate levels denote different degrees of difficulty. DD measures the learning rate that needs to happen to achieve a PR = 1.
Figure 4 shows four achievability curves for different DD levels. For instance, the TA of one technology with very low uncertainty and PR = 0.6 (point a) is analogous to a technology with a PR = 0.94 (point c) and very high uncertainty, which requires a fundamental breakthrough. Similarly, a technology with very high uncertainty but the same PR = 0.6 (point b) will see its TA severely decrease to 0.13.

3. Development of the Systematic Design Approach

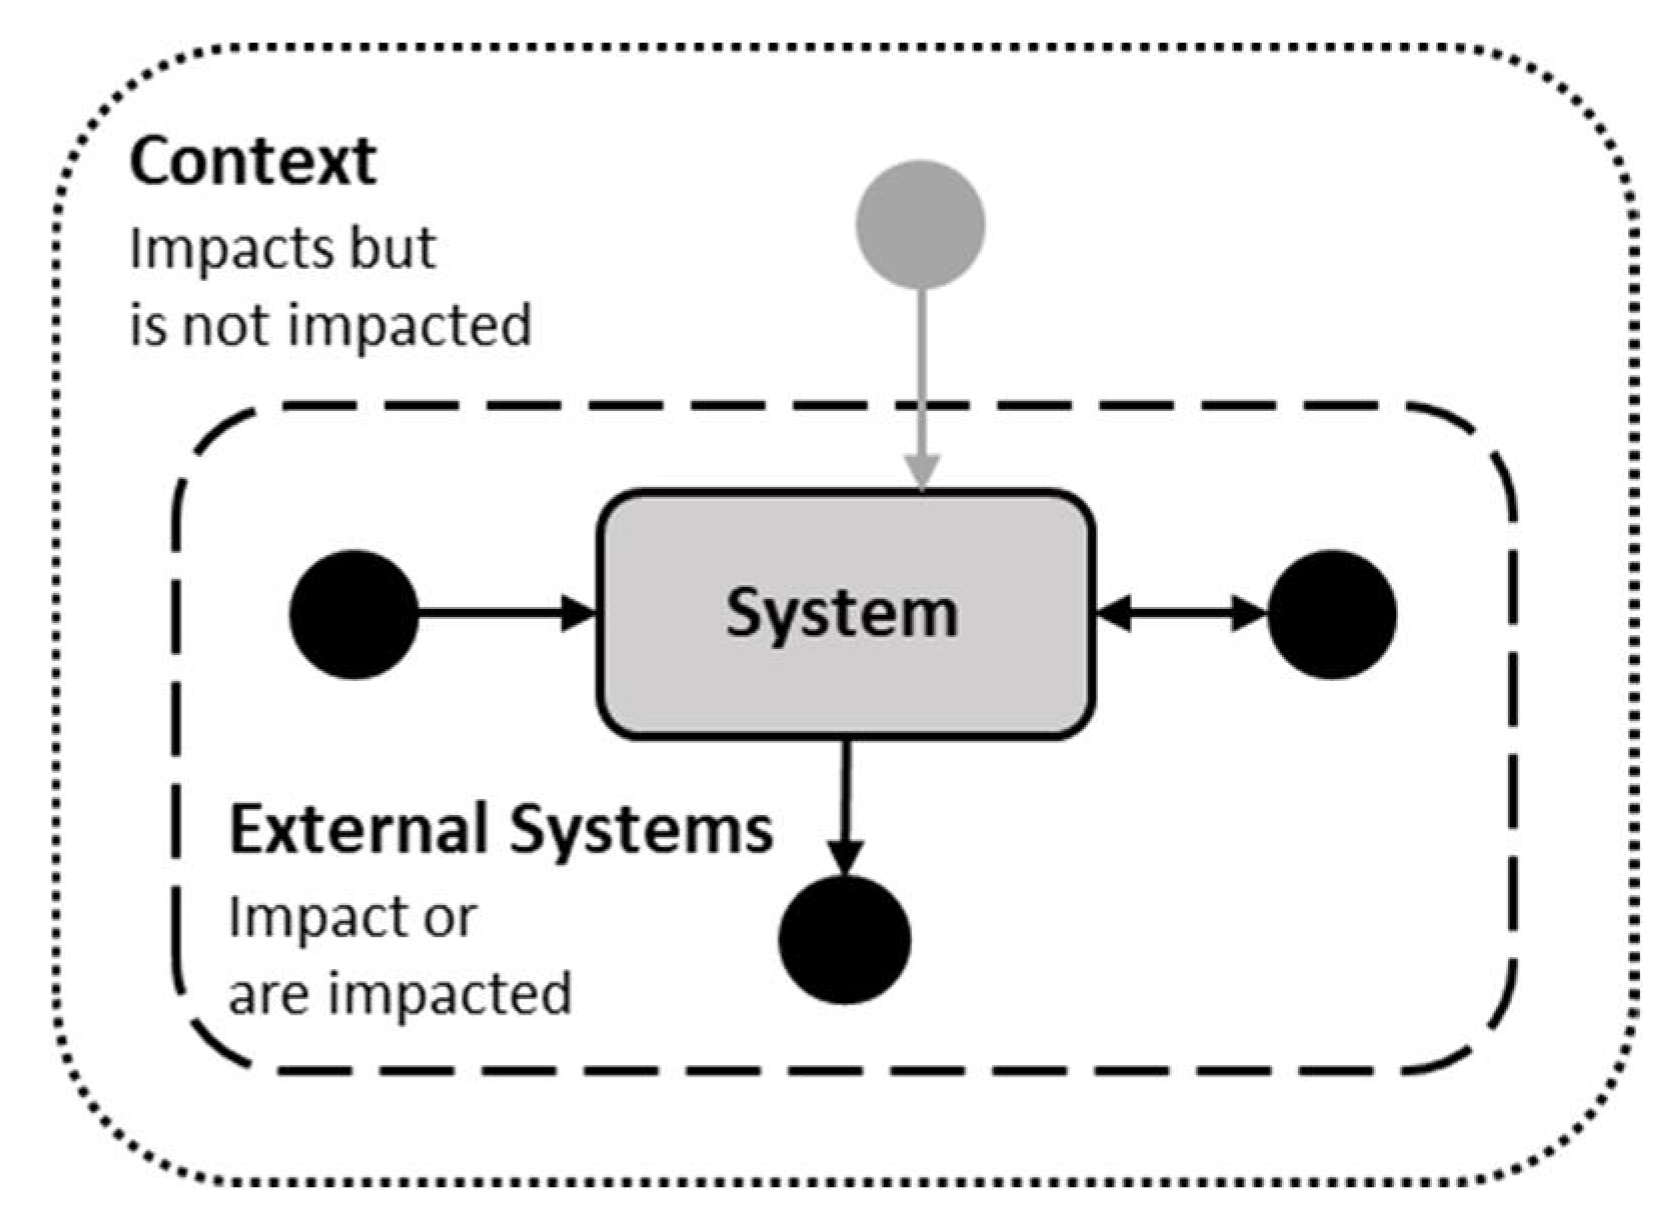
3.1. Analysis of the Overarching Context

3.1.1. Wave Energy Drivers

The environmental domain recognises that the wave energy system exists within a context in which multiple external drivers influence its conception, planning, and operation. These System Drivers (SD) are an essential part of the context and are tightly connected to the intended market application. Two relevant market applications of wave energy technologies have been selected to illustrate this novel methodology, assuming that the main product for wave energy is expected to be power production [17] such as:
  • Market 1: Utility-scale generation.
  • Market 2: Powering remote communities.
A detailed characterisation of these two markets is presented in [26] and summarised in Table 3.
An analysis of wave energy drivers using PESTLE [40] is also presented in [26]. Table 4 summarises the SD for wave energy grouped per category.
SD interaction and prioritisation is also investigated in [26]. A survey of wave energy representatives was conducted to establish the importance ranking of SD for the two power market applications, namely utility-scale and remote communities’ generation. A total of 64 questionnaires were completed, which represents about 6% of the 1100 full-time jobs in the nascent ocean energy estimated by IRENA [41]. The number of responses would ensure a confidence level of 90% with a 10% margin of error. These values can be considered acceptable to suggest a significant effect when working with small populations and original research topics without previous studies. The proposed method uses AHP to transform this prioritisation of SD into weights. The gradation scale shown in Table 1 is used to perform the pairwise comparisons. Results are presented in Section 4 and the Appendix.

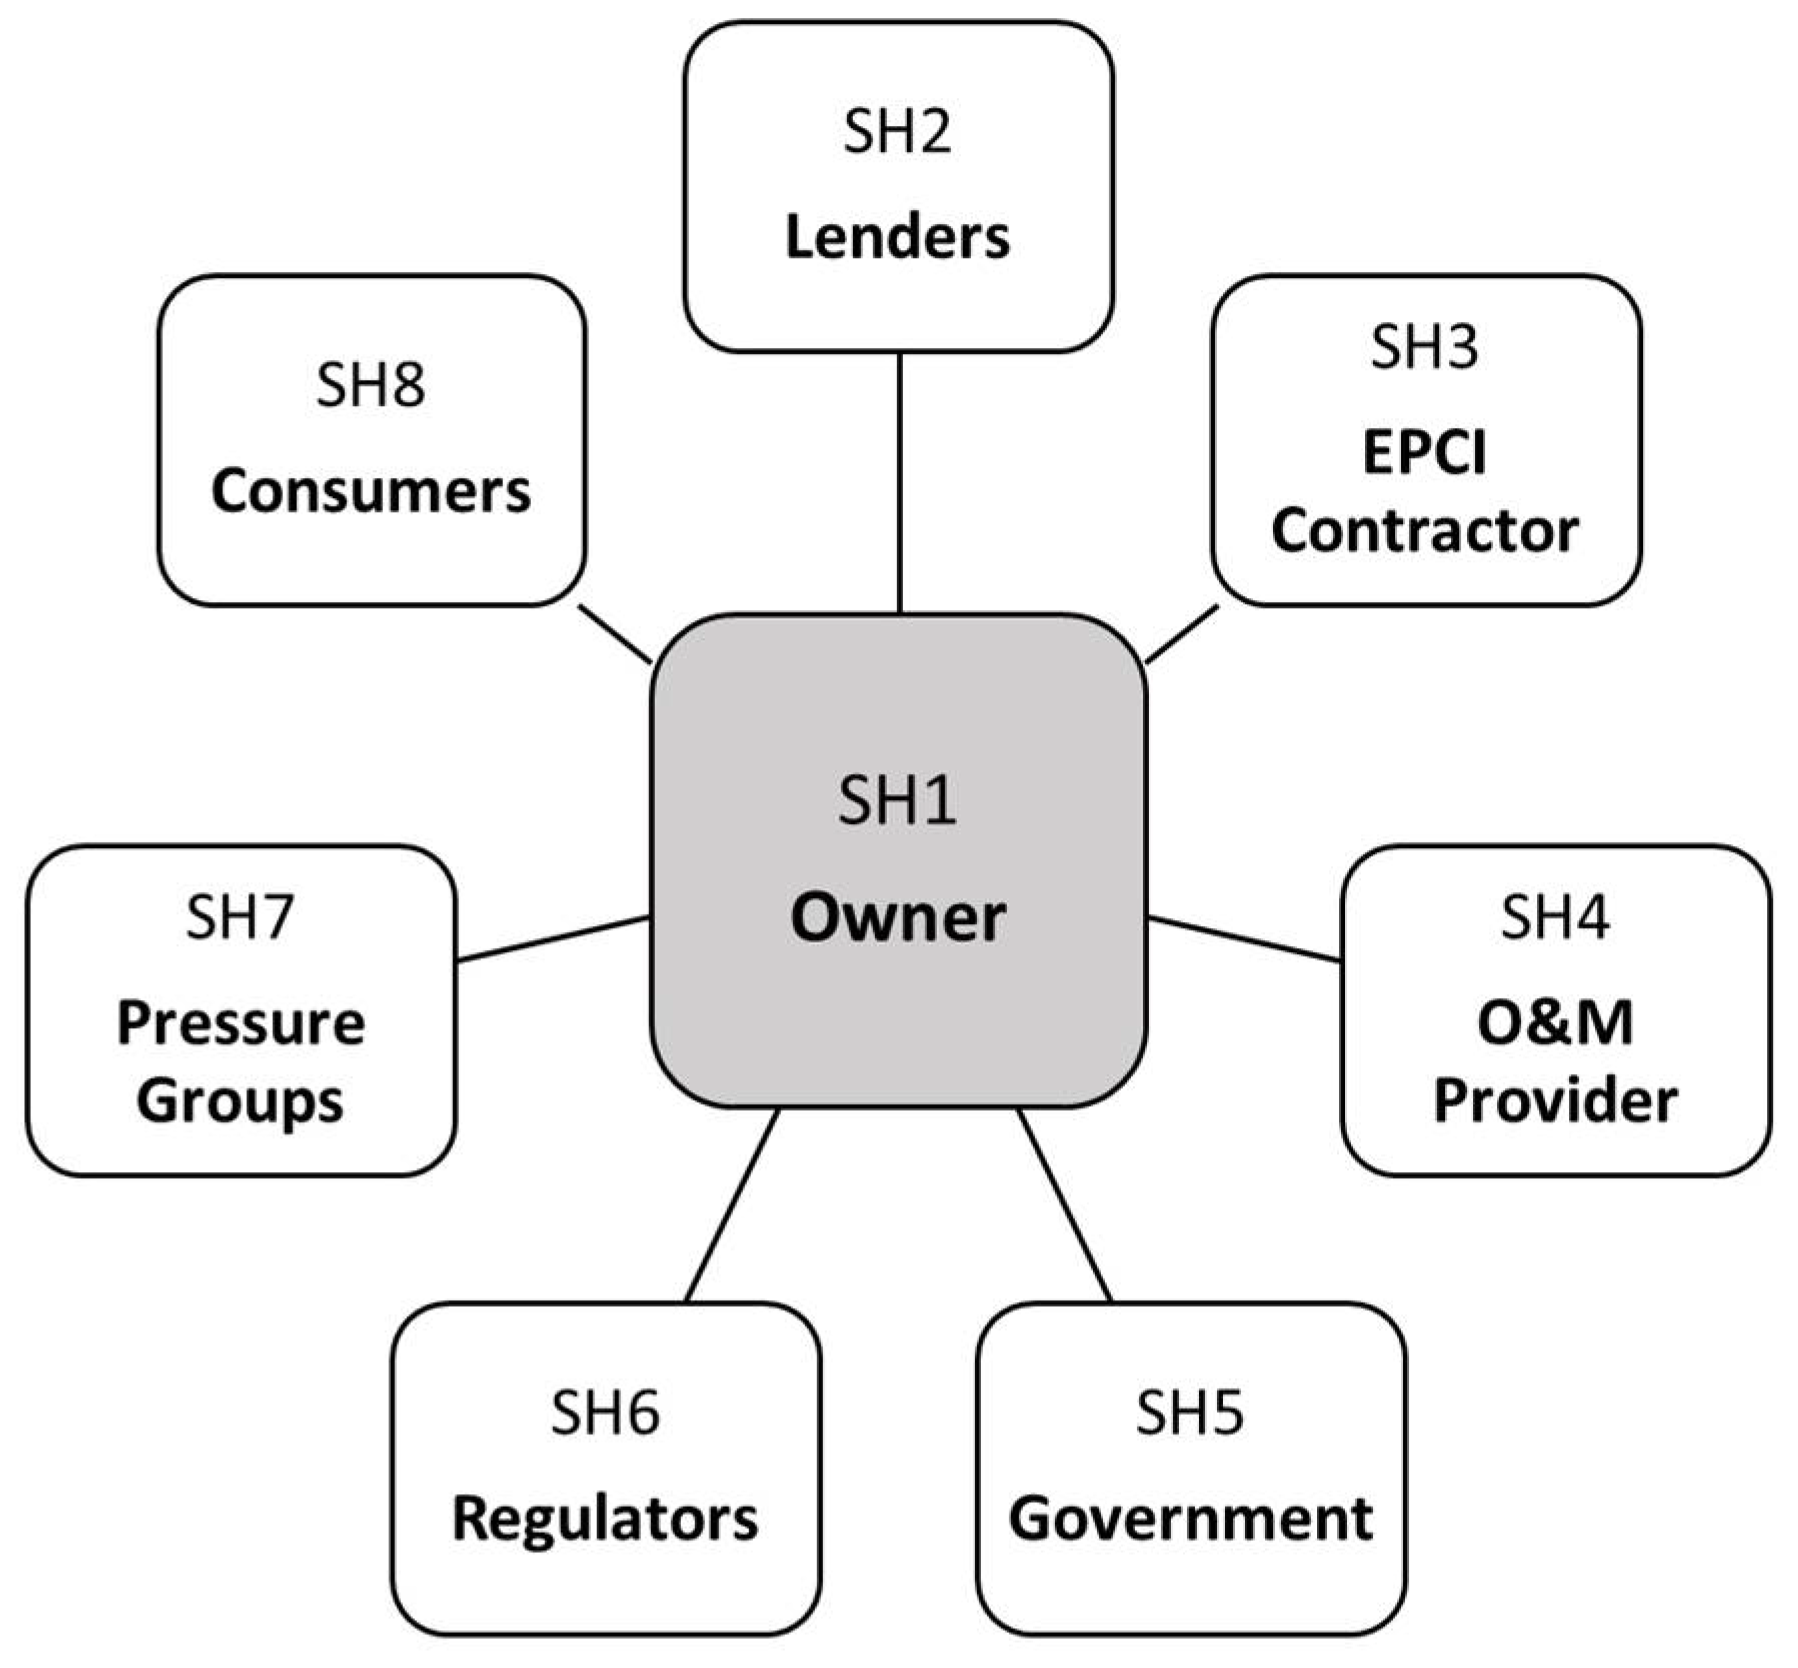
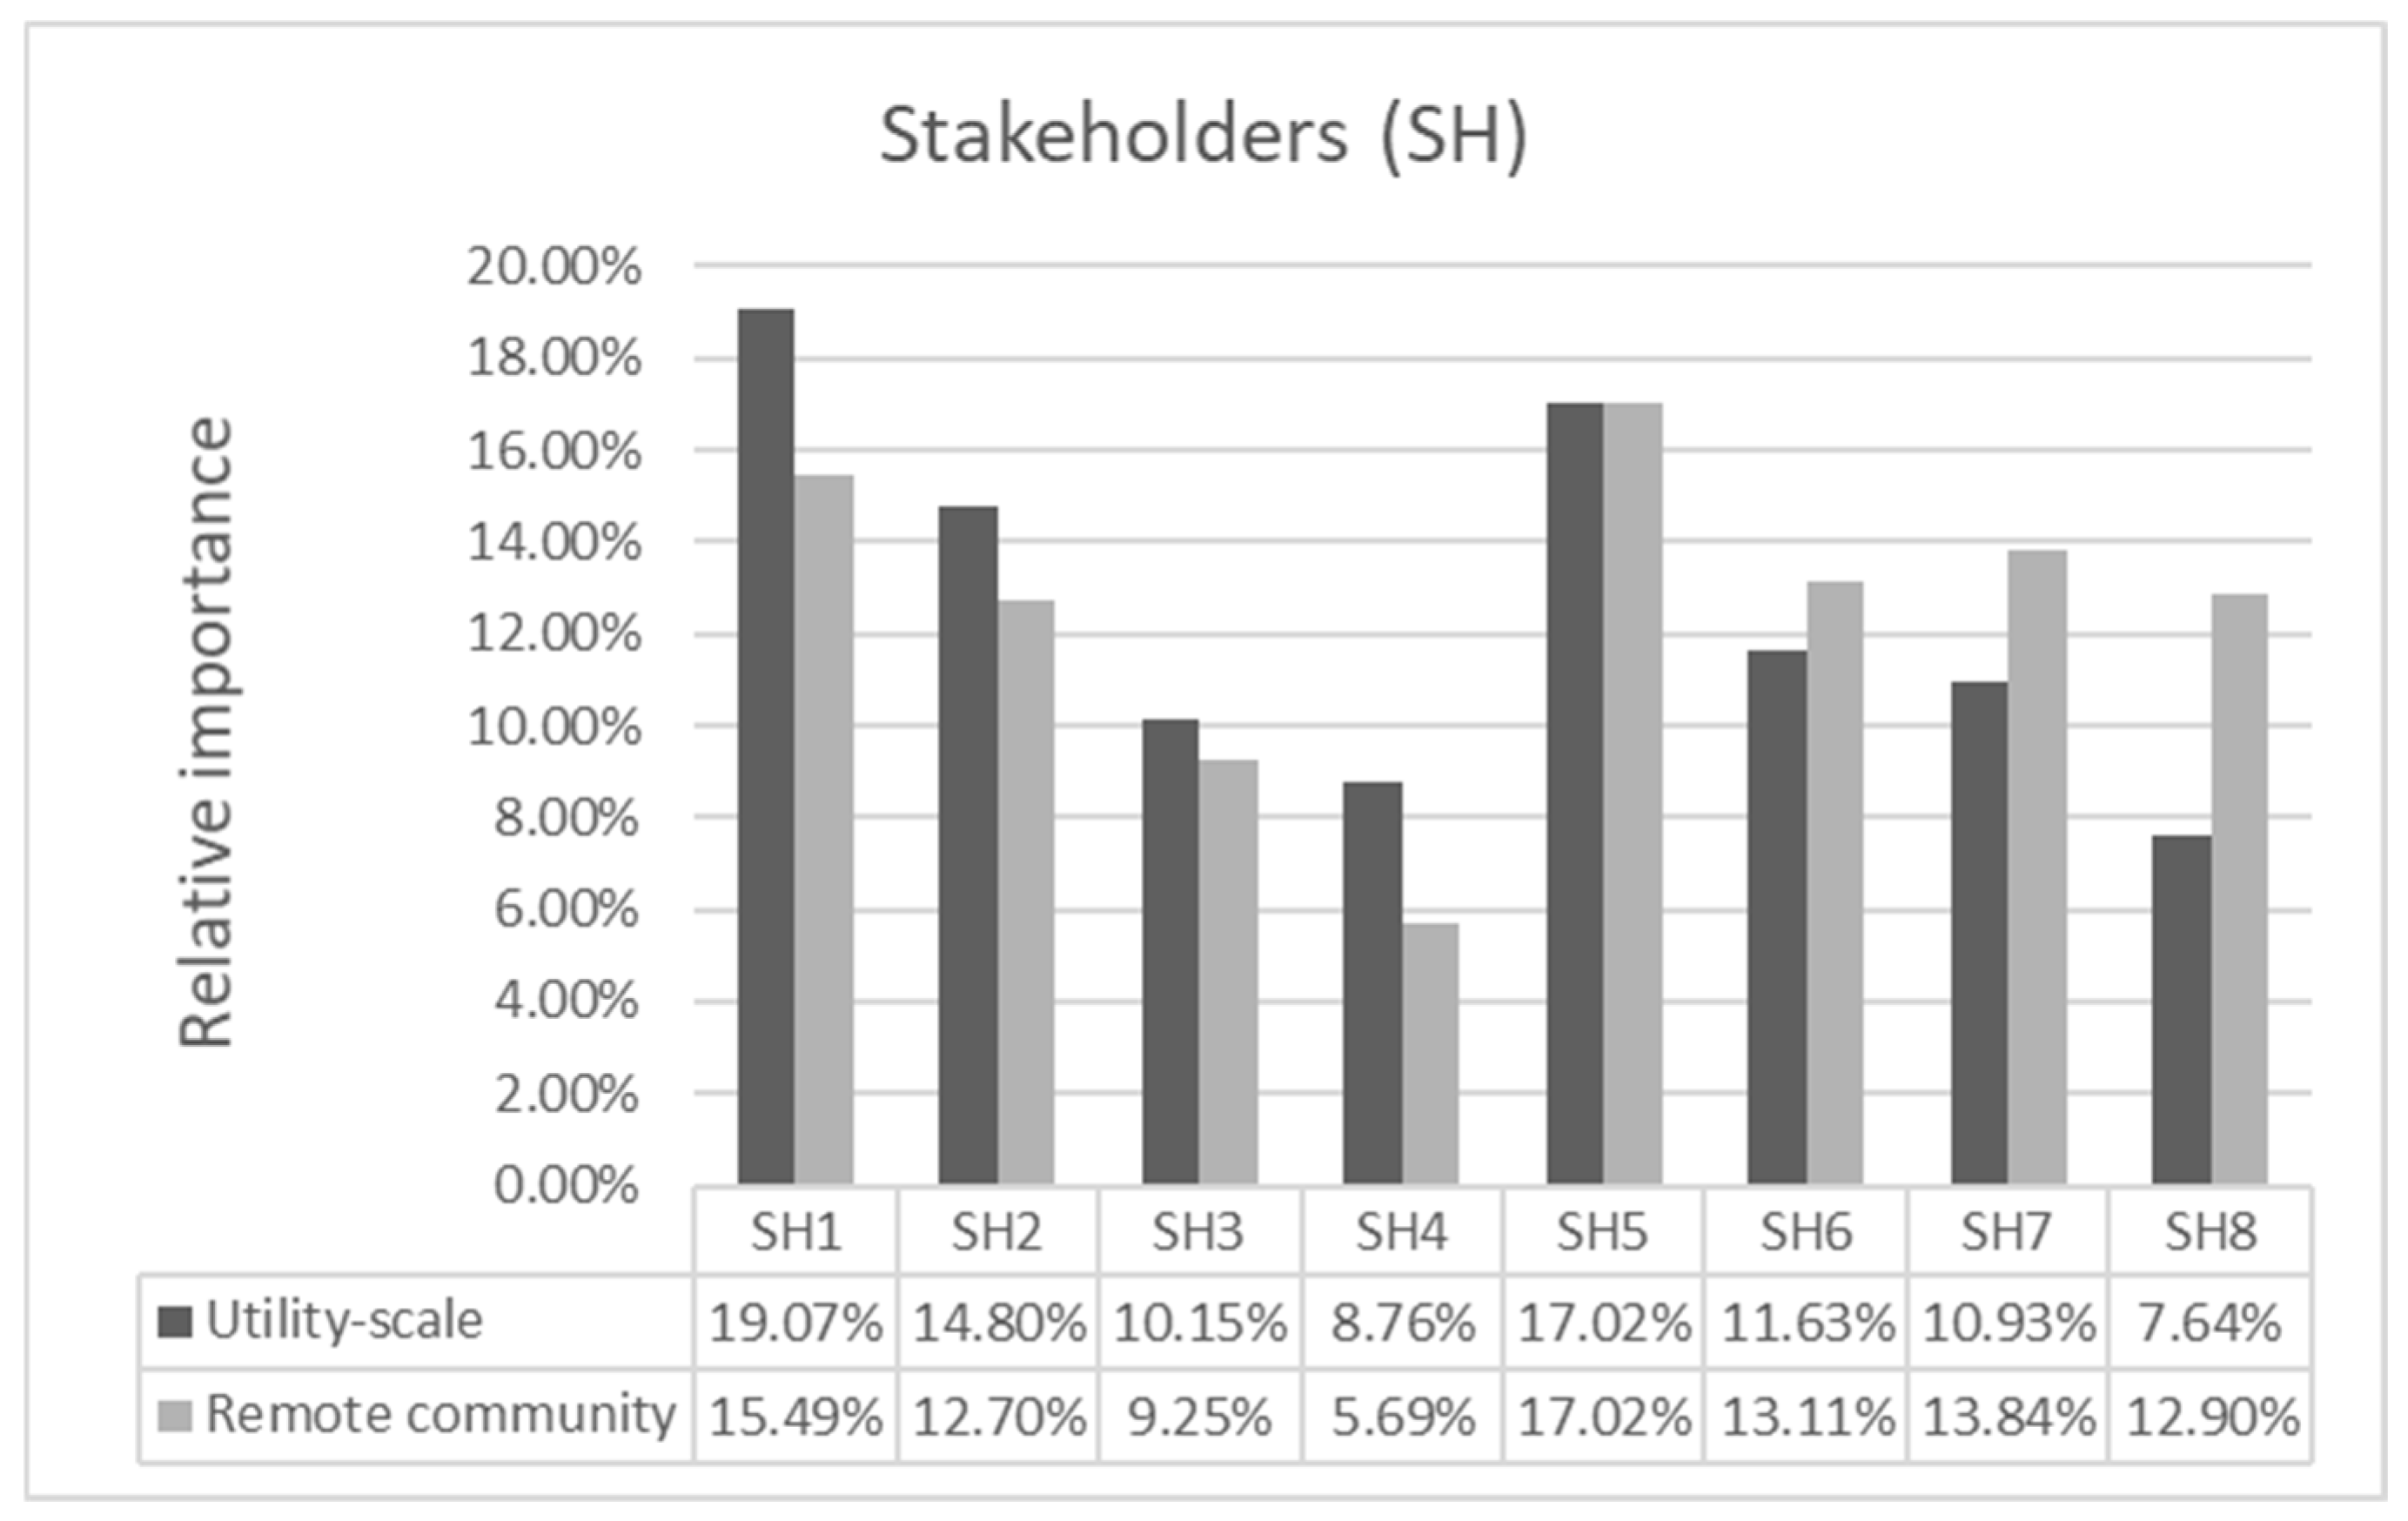
3.1.2. Wave Energy Stakeholders (SH)

The stakeholder domain defines the wave energy design problem in the customer’s language, which is still general, ambiguous and highly unmeasurable. Stakeholder (SH) identification is often an overlooked activity but essential to achieve an effective system. Together with SD, SH define the context where the wave energy system operates.
An analysis of wave energy stakeholders is presented in [26]. This report groups stakeholders in eight broad categories as depicted in Figure 5:
The interaction and prioritisation of the above SH were also investigated in [26], where a survey of wave energy representatives was conducted to establish the interrelationship of SH with SD. In the proposed method, QFD is used to prioritise survey results into SH weights for each application market and SD. The resulting SH relationships with each SD are converted into numerical coefficients using the importance rating scale shown in Table 5. This is one of the linear scales most used in QDF [42]. Results are presented in Section 4 and further completed in the Appendix A.

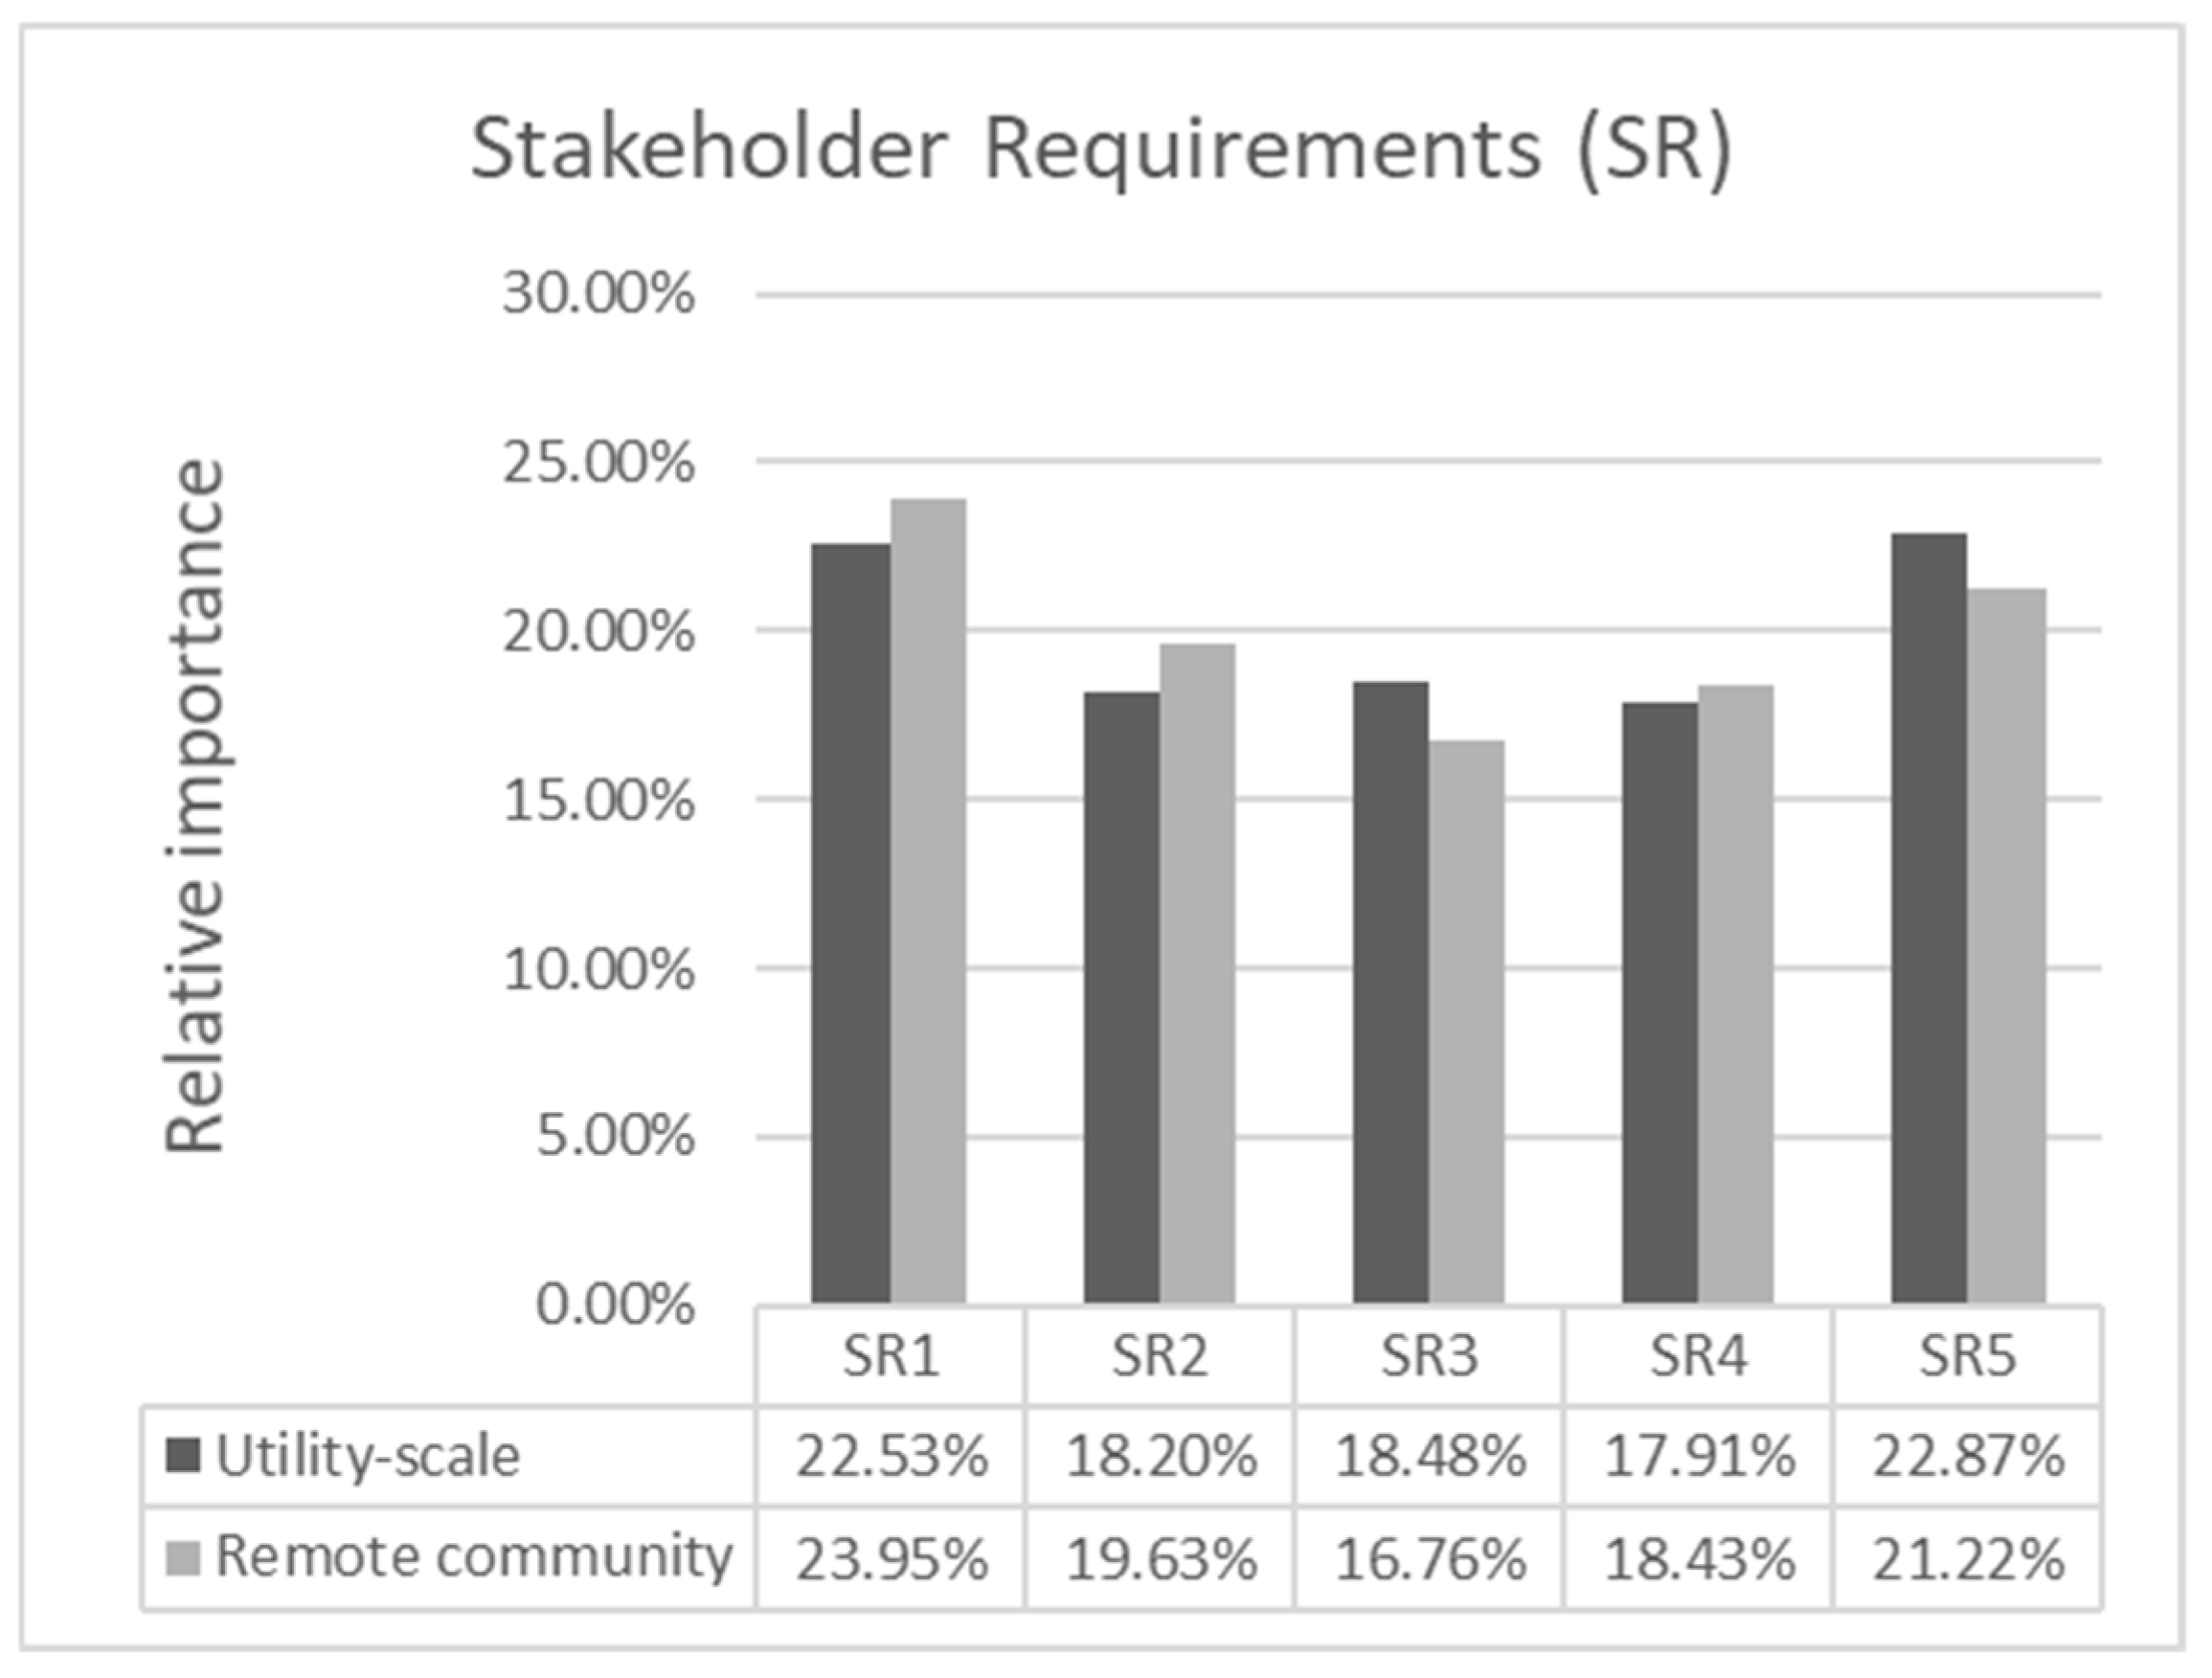
3.1.3. Stakeholder Requirements (SR) and Metrics

The mission statement of a wave energy system is presented in [27] for a utility market application. This overarching goal is reformulated and generalised here to other electricity generation markets as follows: “The wave energy farm converts ocean wave energy into consumable power”. Starting with this mission statement, the roles and expectations of the different stakeholder groups have been structured from various literature sources such as [26,27,43,44]. They are summarised in Table 6.
Underlying all stakeholders’ expectations, there is the need to make wave energy competitive and acceptable for the targeted market, or expressed in another form, wave energy must address the energy trilemma, i.e., energy security, sustainability and affordability [45]. With this in mind, Stakeholder Requirements (SR) and Measures of Effectiveness (MOE) have been identified through an iterative process of distilling stakeholders’ expectations until arriving at the condensed list as shown in Table 7.
It is worthwhile noting that the way SR are elicited greatly facilitates the definition of MOE. In fact, a closer look at the upper system metrics reveals parallelism with the simplified LCOE equation [47].
LCOE = CAPEX FCR + OPEX 8760 CF AF
where the numerator accounts for the annuitized lifetime costs and the denominator the net energy production per year.
In the proposed method, QFD is used to prioritise Stakeholder Requirements (SR). The importance ranking of SR for each application market was obtained with regard to the SH in order to maintain traceability. The same importance rating scale previously shown in Table 5 are used to derive SH–SR relationships. Results are presented in Section 4 and the Appendix A.
Figure 6 presents the aggregation logic of the different metrics into a final measure of suitability or Global Merit (GM). The weights above each arrow, wi, represent the relative importance ratings of the SR. The geometric mean (G) and arithmetic mean (A) operators, respectively, were chosen to combine attributes with a multiplicative and additive nature, respectively.
Affordability (LCOE) is the most common highest-level metric used to assess wave energy options [7]. However, the reader should bear in mind that the global merit of a wave energy option might differ from the preference obtained using the numerical LCOE values since the aggregation logic also accounts for the relative importance expressed by the stakeholders, the underlying degree of simultaneity and the flexibility allowed to the various requirements, all of them qualitative aspects.
To showcase the application of this novel methodology, six illustrative cases of hypothetical wave energy technologies were defined with different combinations of MOE and resulting LCOE. The LCOE was calculated using Equation (11). The numerical values for the different evaluation criteria are summarised in Table 8.
Case 1 represents a high-performing technology in all evaluation criteria. Case 2 has a moderately low capacity factor coupled with competitive lifetime costs. Case 3 displays the highest net energy production but also carries high costs. Case 4 explores a wave energy technology that, despite the net energy production, cannot compensate for the high lifetime costs. Case 5 has a very low capacity factor and moderately high costs. Finally, Case 6 has the highest investment costs and lowest availability resulting in the least affordable alternative.

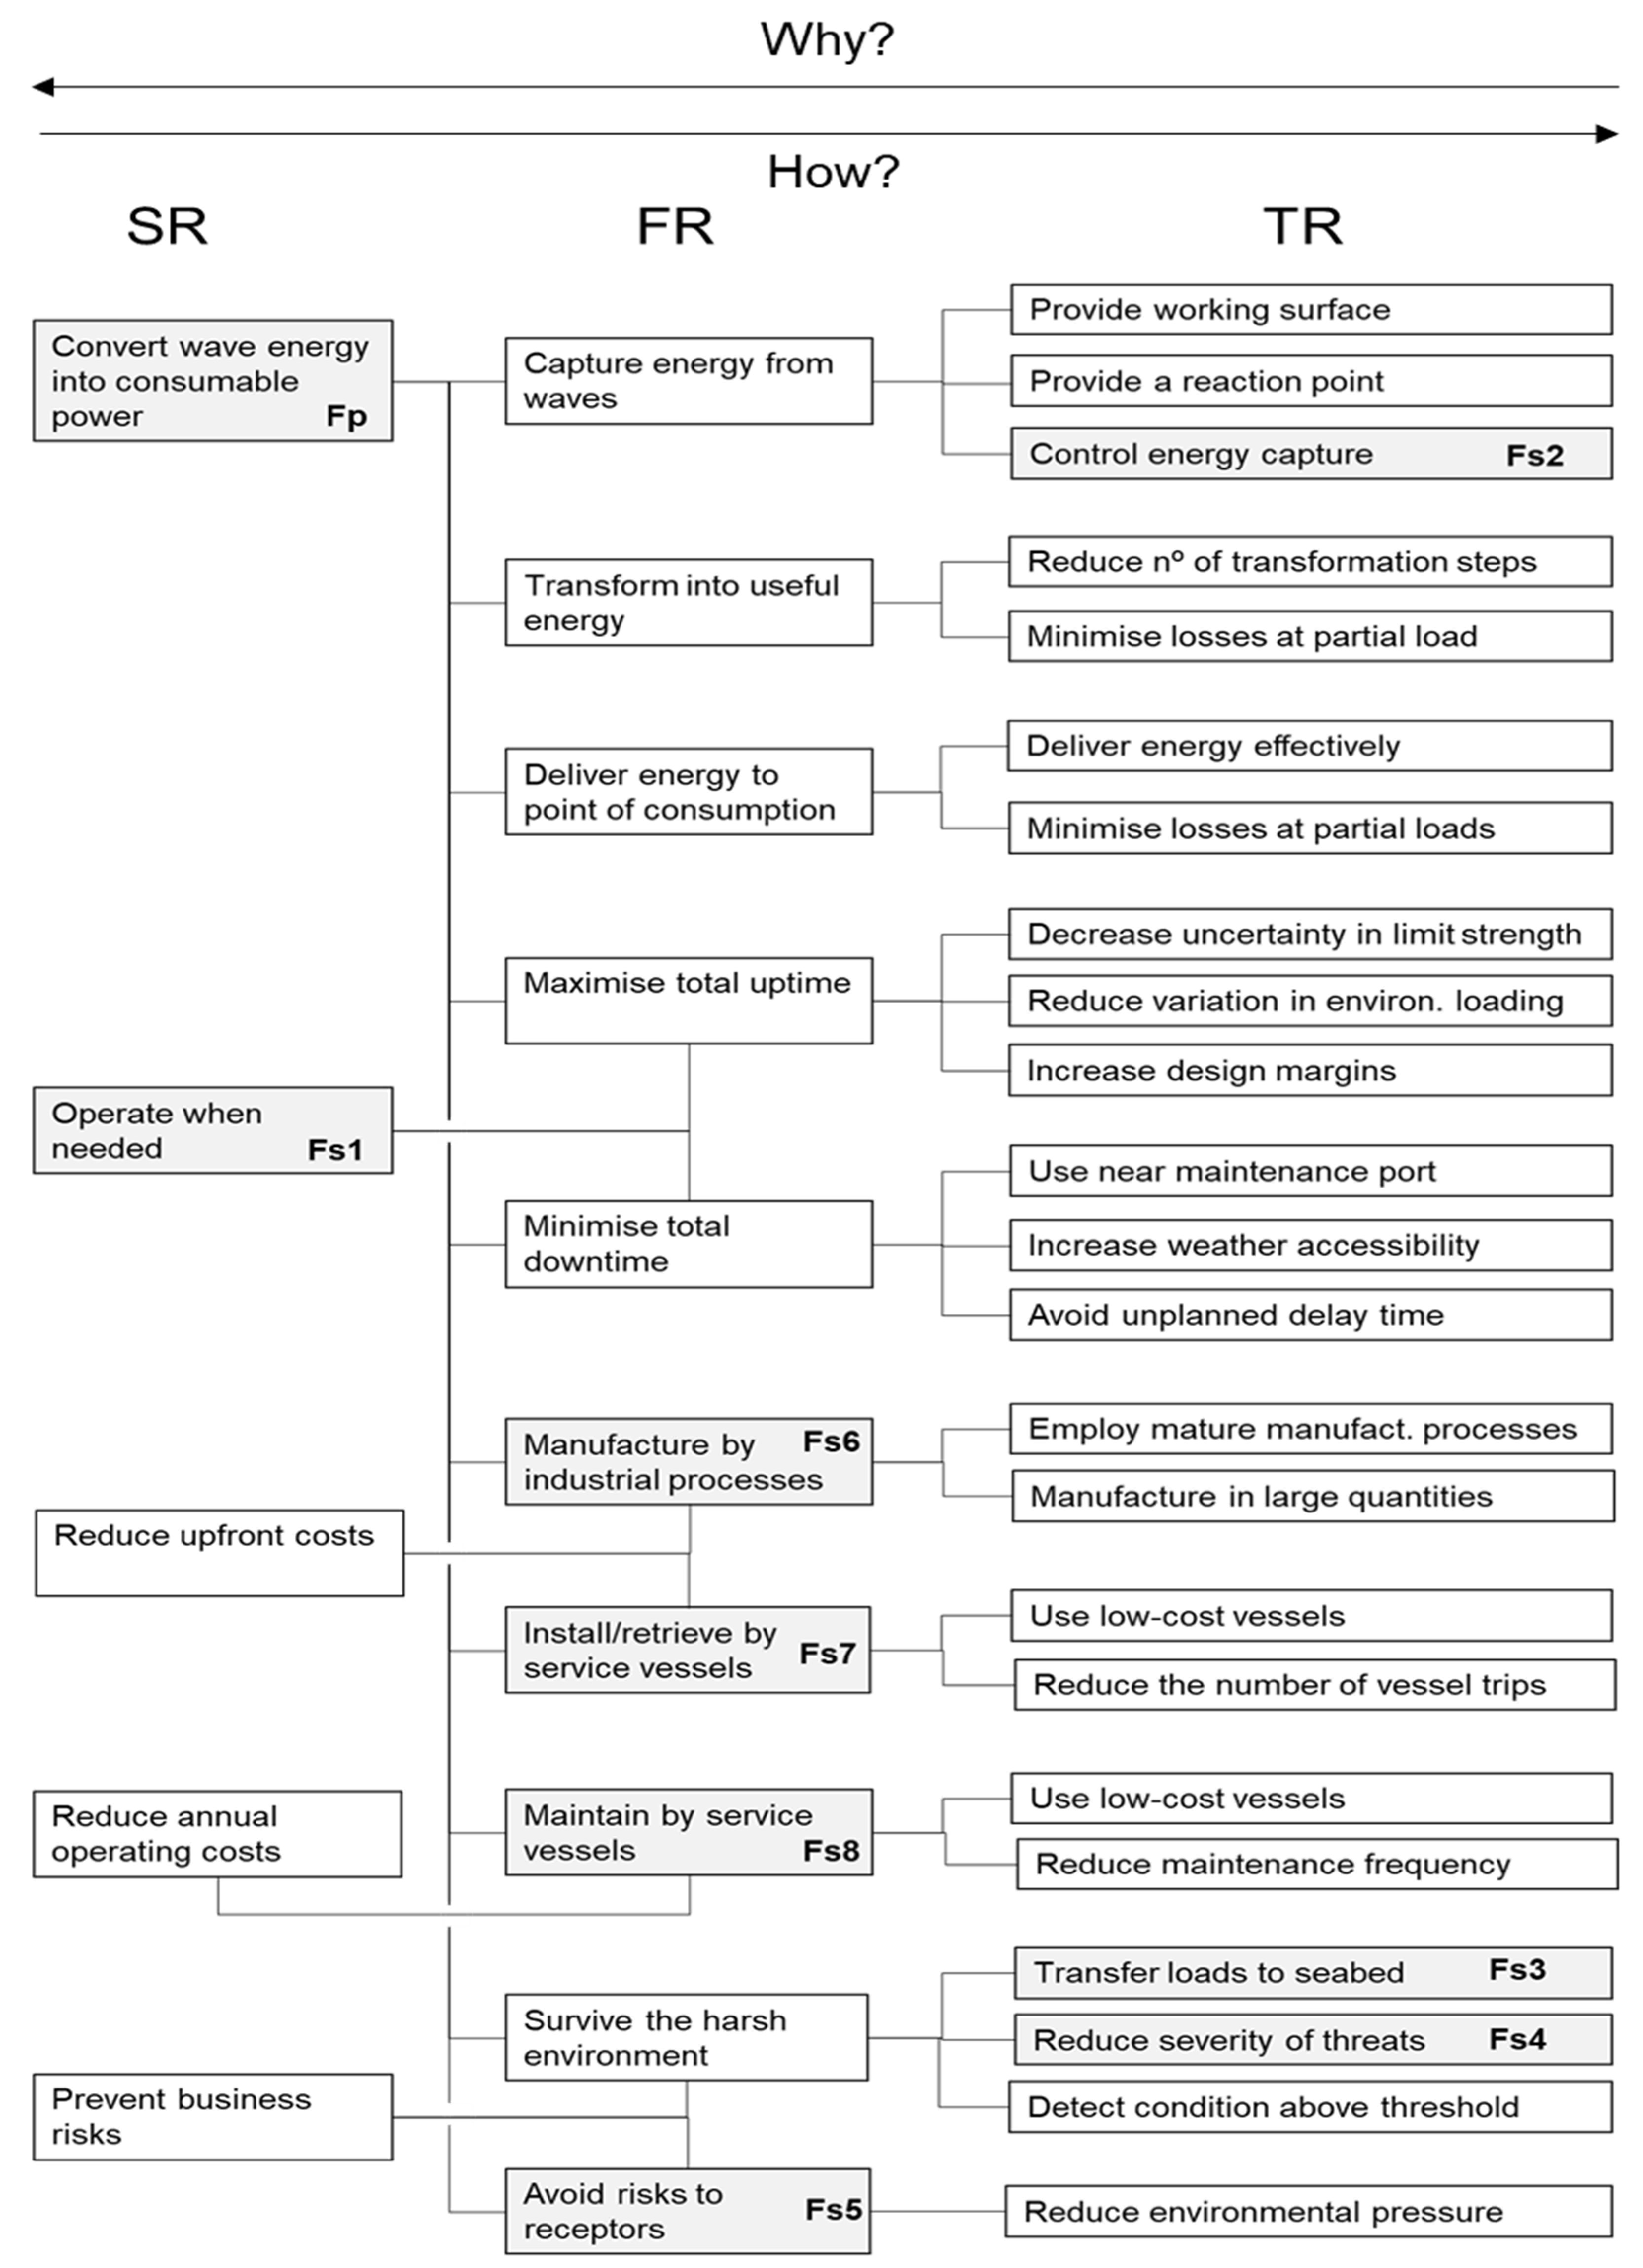
3.2. Functional Analysis

3.2.1. Wave Energy Functions

The functional domain aims to produce a complete, unambiguous and technology-agnostic definition of the design problem space. Functions describe the purposes of the engineering system and functional analysis is used to identify what functions the wave energy system should perform, their logical structure and interactions to satisfy SR efficiently. Functional Requirements (FR) are therefore the bridge between the stakeholders and technical teams, and they should be elicited in all phases of the system lifecycle [16].
Whilst the engineering system exists only for its usage, all life phases must be considered since they add important constraints to the system design. Figure 7 shows the typical lifecycle of a wave energy system and the independent entities to which it is physically or virtually linked (i.e., the External Systems). Stages have been adapted from [27].
The construction phase encompasses all manufacturing, transport and assembly activities performed onshore. Similarly, the end-of-life phase includes reusing, recycling or safely disposing of the parts that make up the wave energy system. The installation, maintenance and retrieval phases comprise the offshore transport. Additionally, maintenance involves inspection, repair, or replacement [48]. Minor repairs can be performed on-site. For major repairs and replacements, the wave energy system might be brought to shore and may require specific industrial processes, likewise for the construction and end-of-life phases. Finally, the operation is the most important phase in the system lifecycle since it is the one that directly adds value to the end-users. The operation phase includes the standby, normal, malfunction and survival modes of the wave energy devices.
Functional analysis is a structured approach to identifying and correlating the functions that a wave energy system must perform during its lifetime [24]. There are two main types of functional analysis with complementary aims. The external analysis, focused on the system user and the identification of its service functions, helps to visualise the interactions of the wave energy system with the External Systems. On the other hand, the internal analysis, focused on the system designer, transforms service functions into internal and technical functions.
The Octopus diagram is one of the most useful tools provided by the APTE method [49] that displays the interactions of the wave energy system with the External Systems. For each of the relevant lifecycle phases, the External Systems are analysed in relation to the wave energy system. An arrow is used to show three different categories of connections: (i) the System allows one External System to modify the status of another one; (ii) the System modifies the status of the External System; and (iii) the System is modified by the External System. Primary functions bind together two External Systems, whereas secondary functions connect just one.
During its operational phase—Figure 8a, the wave energy system interacts with the ocean waves and the point of connection where the converted energy is consumed. Accordingly, the primary function of a wave energy system is stated as follows:
Fp: Convert wave energy into consumable power
This primary function is precisely elicited as the mission statement presented earlier. The remaining operational functions are secondary:
Fs1: Operate when needed
Fs2: Control energy capture
Fs3: Transfer loads to the seabed
Fs4: Reduce the severity of environmental threats
Fs5: Avoid risks to receptors
The rest of the phases, which add constraints to the system design, have been merged into a single diagram—Figure 8b—leading to three additional secondary functions.
Fs6: Manufacture by industrial processes
Fs7: Install by service vessels
Fs8: Maintain by service vessels
The external functional analysis provides a general overview of the service functions of the wave energy system. However, this method cannot be used to examine internal system functionality. For the internal analysis, the Function Analysis System Technique (FAST) is used [31]. The FAST diagram is a hierarchical representation that translates high-level functions into lower-level functions that must be performed by the system. It is built from left to right in the logic of “why” to “how”. Any function to the left is a higher-level function, since reading the FAST diagram in the “why” direction leads to the primary function. Conversely, any function to the right is a lower-level function and represents a means that is needed to achieve the function being addressed (“how”). The first level of decomposition of this functional architecture will be used for eliciting the FR, whereas the second level informs the Technical Requirements (TR). Further levels of detail can be developed applying this process iteratively, a useful approach when the engineering work narrows its focus on subsystems, assemblies or components.
Figure 9 presents the functional decomposition of the wave energy system into FR (first level) and TR (second level). The service functions from the external analysis and the SR are included for the sake of traceability. It can be noted that the resulting FAST diagram structures the functions in consistent levels of detail and engineering domains. Service functions mainly belong to the functional domain (Fs5, Fs6, Fs7, Fs8), but also some to the technical domain (Fs2, Fs3, Fs4) and even the stakeholder domain (Fs1).
It is worthwhile mentioning that the TPL assessment method [6] also provides an analysis of requirements including various levels of functions. The top-level functions are directly linked to the SR and the system mission. The next breakdown level compares with the FR, whereas the lower levels should be related to the TR. The functional tree is not developed to the same depth in all its branches which makes it difficult to apply the design domains method. Moreover, the combination of individual weightings is not traced in the various domains but is assigned through expert judgement.

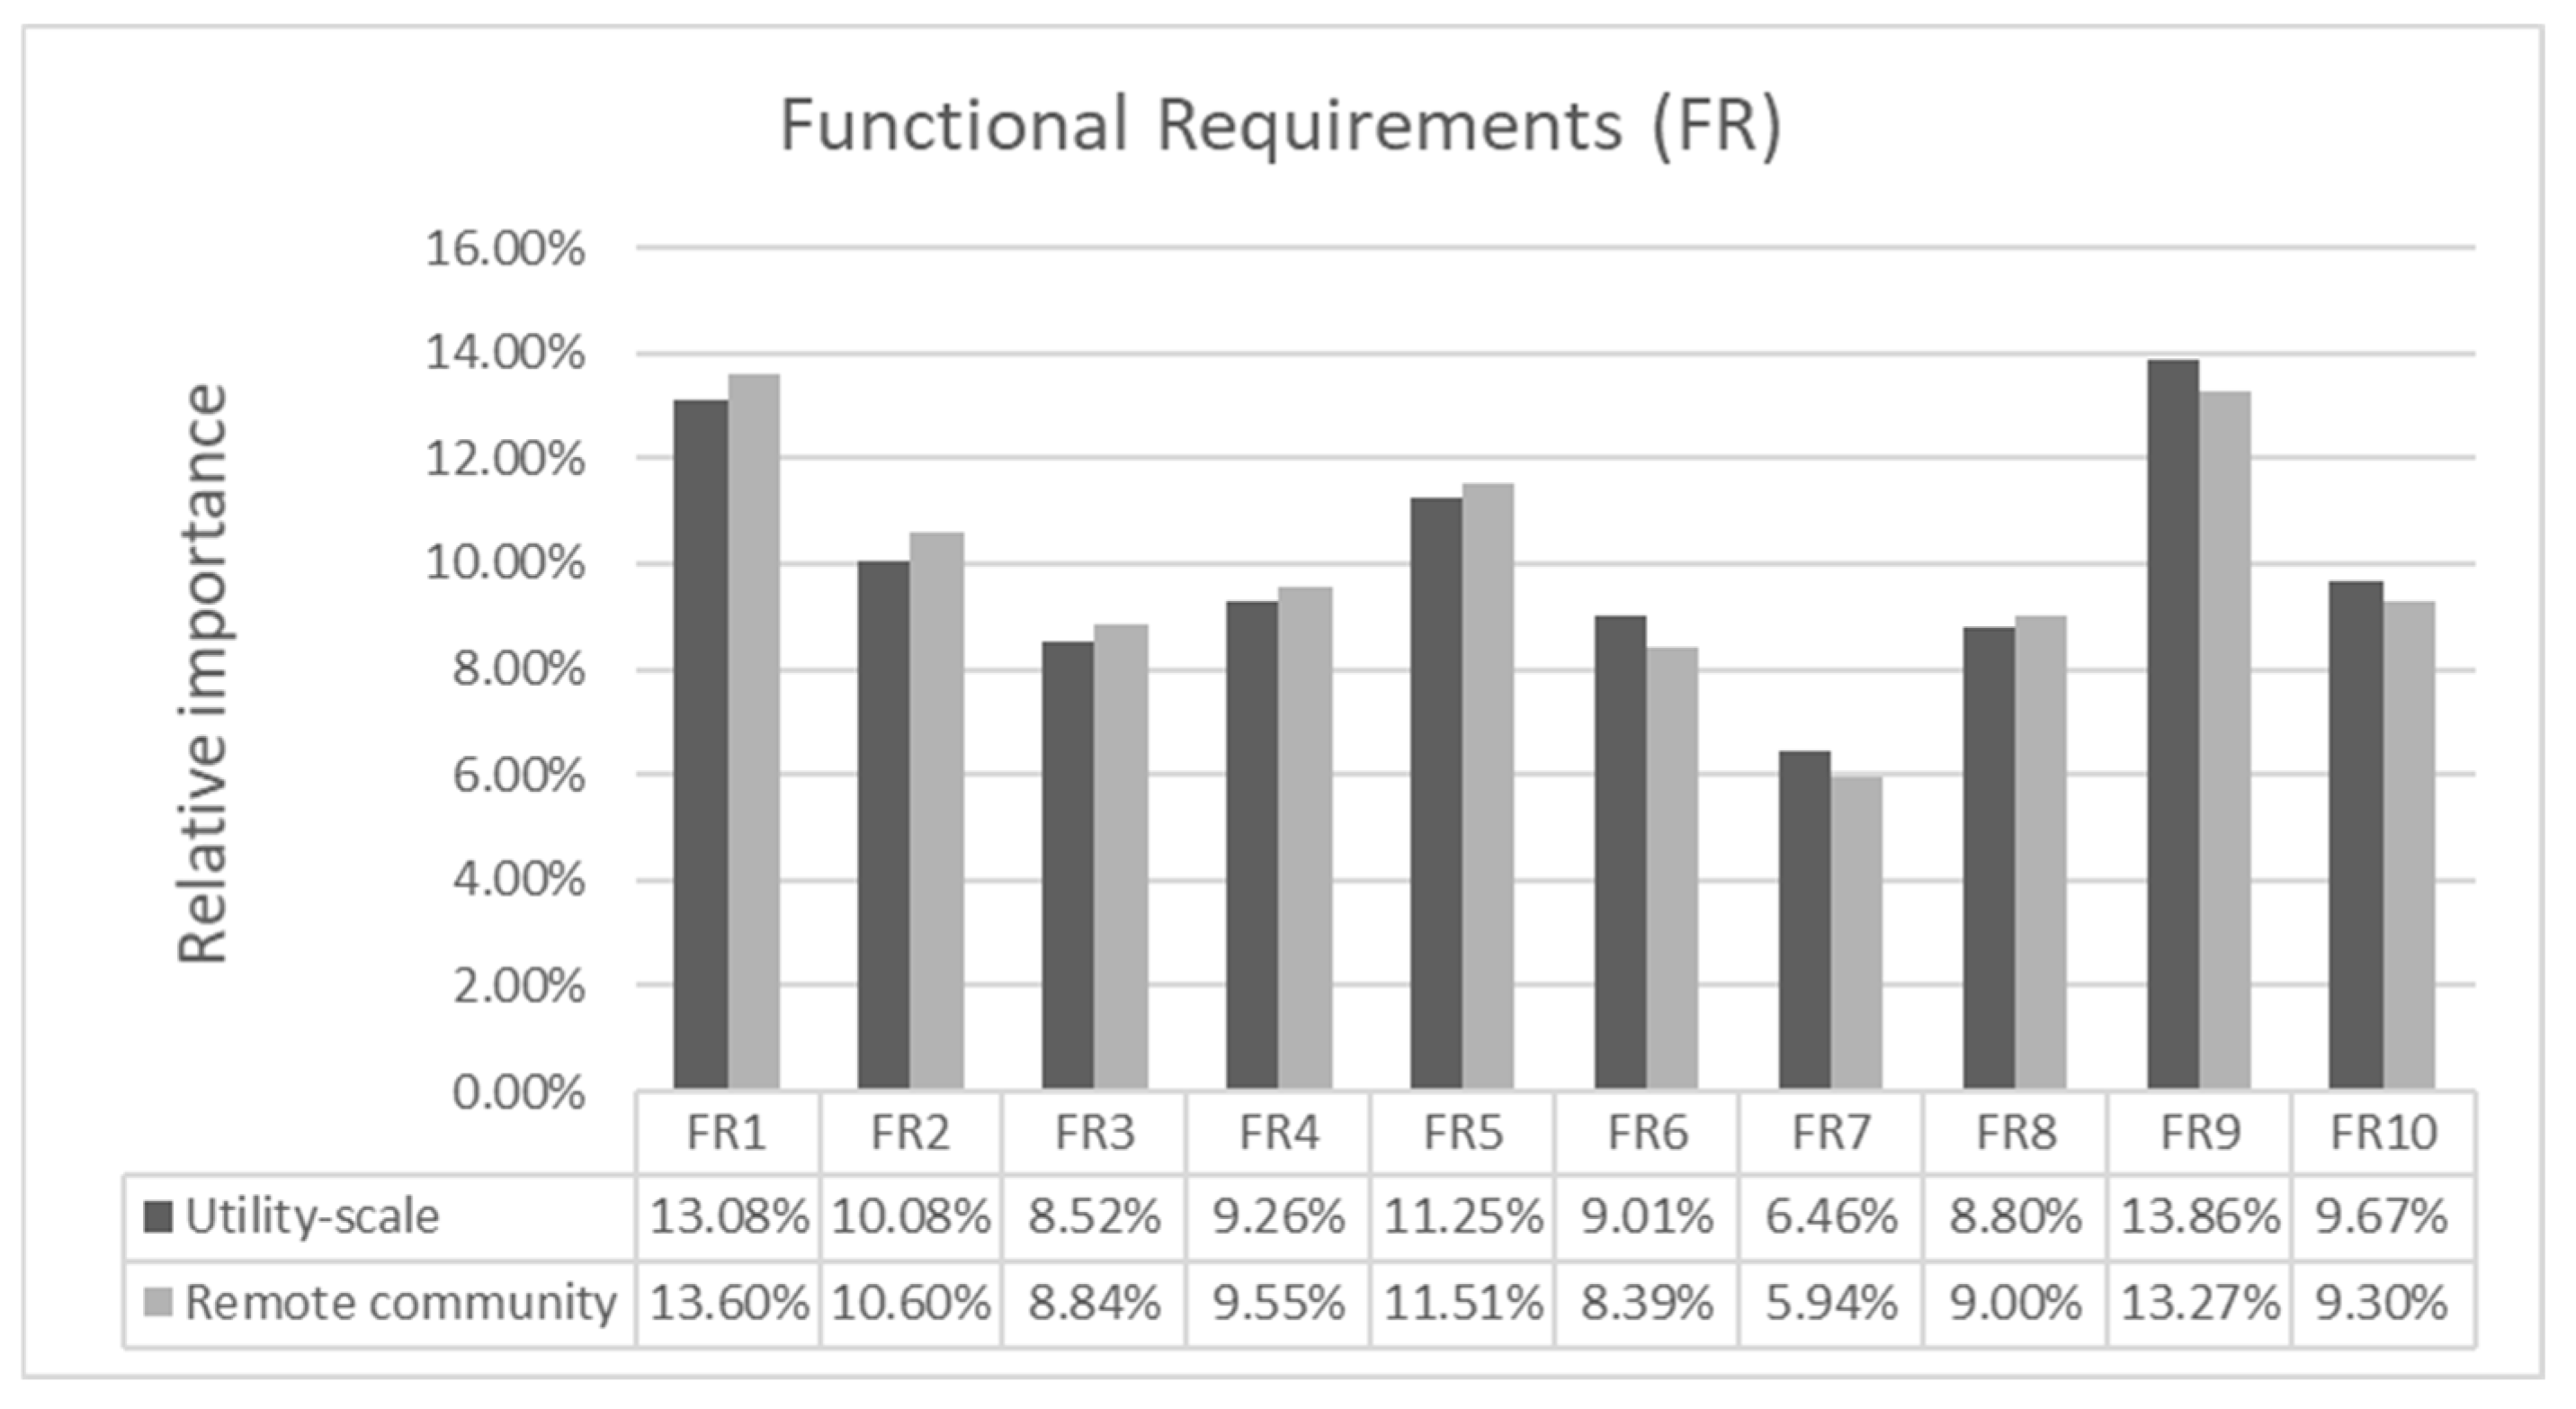
3.2.2. Functional Requirements (FR) and Metrics

The FAST diagram has been used to identify the FR. Measures of Performance (MOPs) are used to specifically gauge the capabilities of a design solution. They are assigned to each requirement to enable the technology-agnostic assessment of wave energy alternatives in an objectivised manner. The wave energy system has 10 main FR as shown in Table 9.
Once again, QFD has been used to prioritise FR in the proposed method. Since SR are only coupled to a reduced number of FR (1 to 3 max), the relative importance ratings of FR have been directly established from literature analysis. The same importance rating scale shown in Table 5 is used to derive SR–SH relationships. The results are presented in Section 4 and further completed in the Appendix A.
Figure 10 presents the aggregation logic of the different MOP. The weights above each arrow, wi, represent the relative importance ratings of the FR. Converting wave energy into consumable power (SR1) requires capturing, transforming, and delivering the energy. These functions have their own efficiency ratings and are combined using the weighted geometric mean (G). Operating when needed (SR2) entails maximising the total uptime and minimising the total downtime. These ratios are combined into the system availability factor employing the harmonic mean (H) which calls for a higher degree of simultaneity. Reducing upfront costs (SR3) involves manufacturing and installation. The neutral arithmetic mean (A) is used in this case as the different cost centres can be compensated. Reducing annual costs has not been split into different functions and the repairability is matched to the operational costs. Finally, preventing business risks require surviving the harsh ocean environment and avoiding risks to receptors. The Quasi-Conjunction (QC) operator is employed to penalise a low utility value of each individual functional requirement.
As mentioned before, the reader should bear in mind that the utility assigned to each MOP might differ from the values estimated with numerical methods, since the aggregation logic also accounts for the relative importance expressed by the stakeholders, the underlying degree of simultaneity and the flexibility allowed to the various requirements.

4. Results and Discussion

4.1. Qualitative Assessment

According to the survey results in [26], the ranking of wave energy drivers considerably differs between the two application markets. Utility-scale is a very competitive market and mainly motivated by Economic and Political factors, whereas the remote community generation market is driven by Social factors. The application of AHP provides more granularity to compare this outcome. The weights resulting from pairwise comparisons are reliable since the Consistency Ratio yields a satisfactory value below 0.1 in both cases. As we can see in Figure 11, the Economic, Political and Technological factors are very important drivers in the utility-scale generation, accounting for almost 85% of the total ratings. However, in remote communities, more drivers come into play. Economic, Political and Technological factors are still important, but the Social factors dominate. Altogether, they account for 92% of the total ratings. It is somehow surprising that the Legal and Environmental factors are considered to have minor importance for both markets, and that also the Social factors score last in the utility-scale market when it is the major motivation for a remote community market. It can be inferred from these results that if wave technology is proven to work, the legal and permitting side will eventually follow.
Additionally, the application of QFD provides further insight into the conclusions obtained in [26]. It confirms that the development of wave energy technologies will be primarily influenced by the needs of the Owner (19%) for utility-scale generation and the Government (17%) for remote community projects. Additionally, it was concluded that the Owner, Lenders, EPCI contractor and O&M provider are slightly more influential in the utility-scale application. This behaviour is reversed for the Regulators, Pressure groups and Consumers in the remote community generation.
From Figure 12 it can be concluded that the Government has the same importance for both markets. Actually, it is the second-ranked SH for the utility-scale market. On the other hand, the Owner scores second (15.5%) after the Government for the remote community generation. Both the Owner and Government play a fundamental role in both markets. The relative weights of the different stakeholder groups for each market will determine the global merit and final suitability of wave energy technologies in the qualitative assessment.
It can be observed in Figure 13 that SR have a relatively similar importance for the two application markets under consideration (variability below 10%). The conversion of wave energy into consumable power, the continuous operation and the annual costs reduction have greater influence in the remote community market. Alternatively, the utility-scale generation market puts more emphasis on the prevention of business risks and the reduction in upfront costs. This qualitative assessment assigns weights above the average importance rating (20%) to wave energy conversion and risk prevention for both markets.
Likewise, as depicted in Figure 14, FR have relatively equal importance for the two application markets under consideration (variability lower than 9%). The functions contributing to each SR follow the same pattern as before. However, we can appreciate that capturing and transforming wave energy, minimising total downtime and surviving the harsh environment are the most relevant requirements, all of them above the average importance rating (10%).
The proposed method differs from the TPL scoring methodology [6] as it considers that most of the capabilities have equal influence. For instance, the same weights are assigned to equivalent pairs of requirements FR6 and FR7, FR2 and FR3, and FR4 and FR5. The traceability of design information and requirements through the different domains offers a more objective way to account for those differences without assuming either a flat distribution or any other arbitrary distribution of weights.

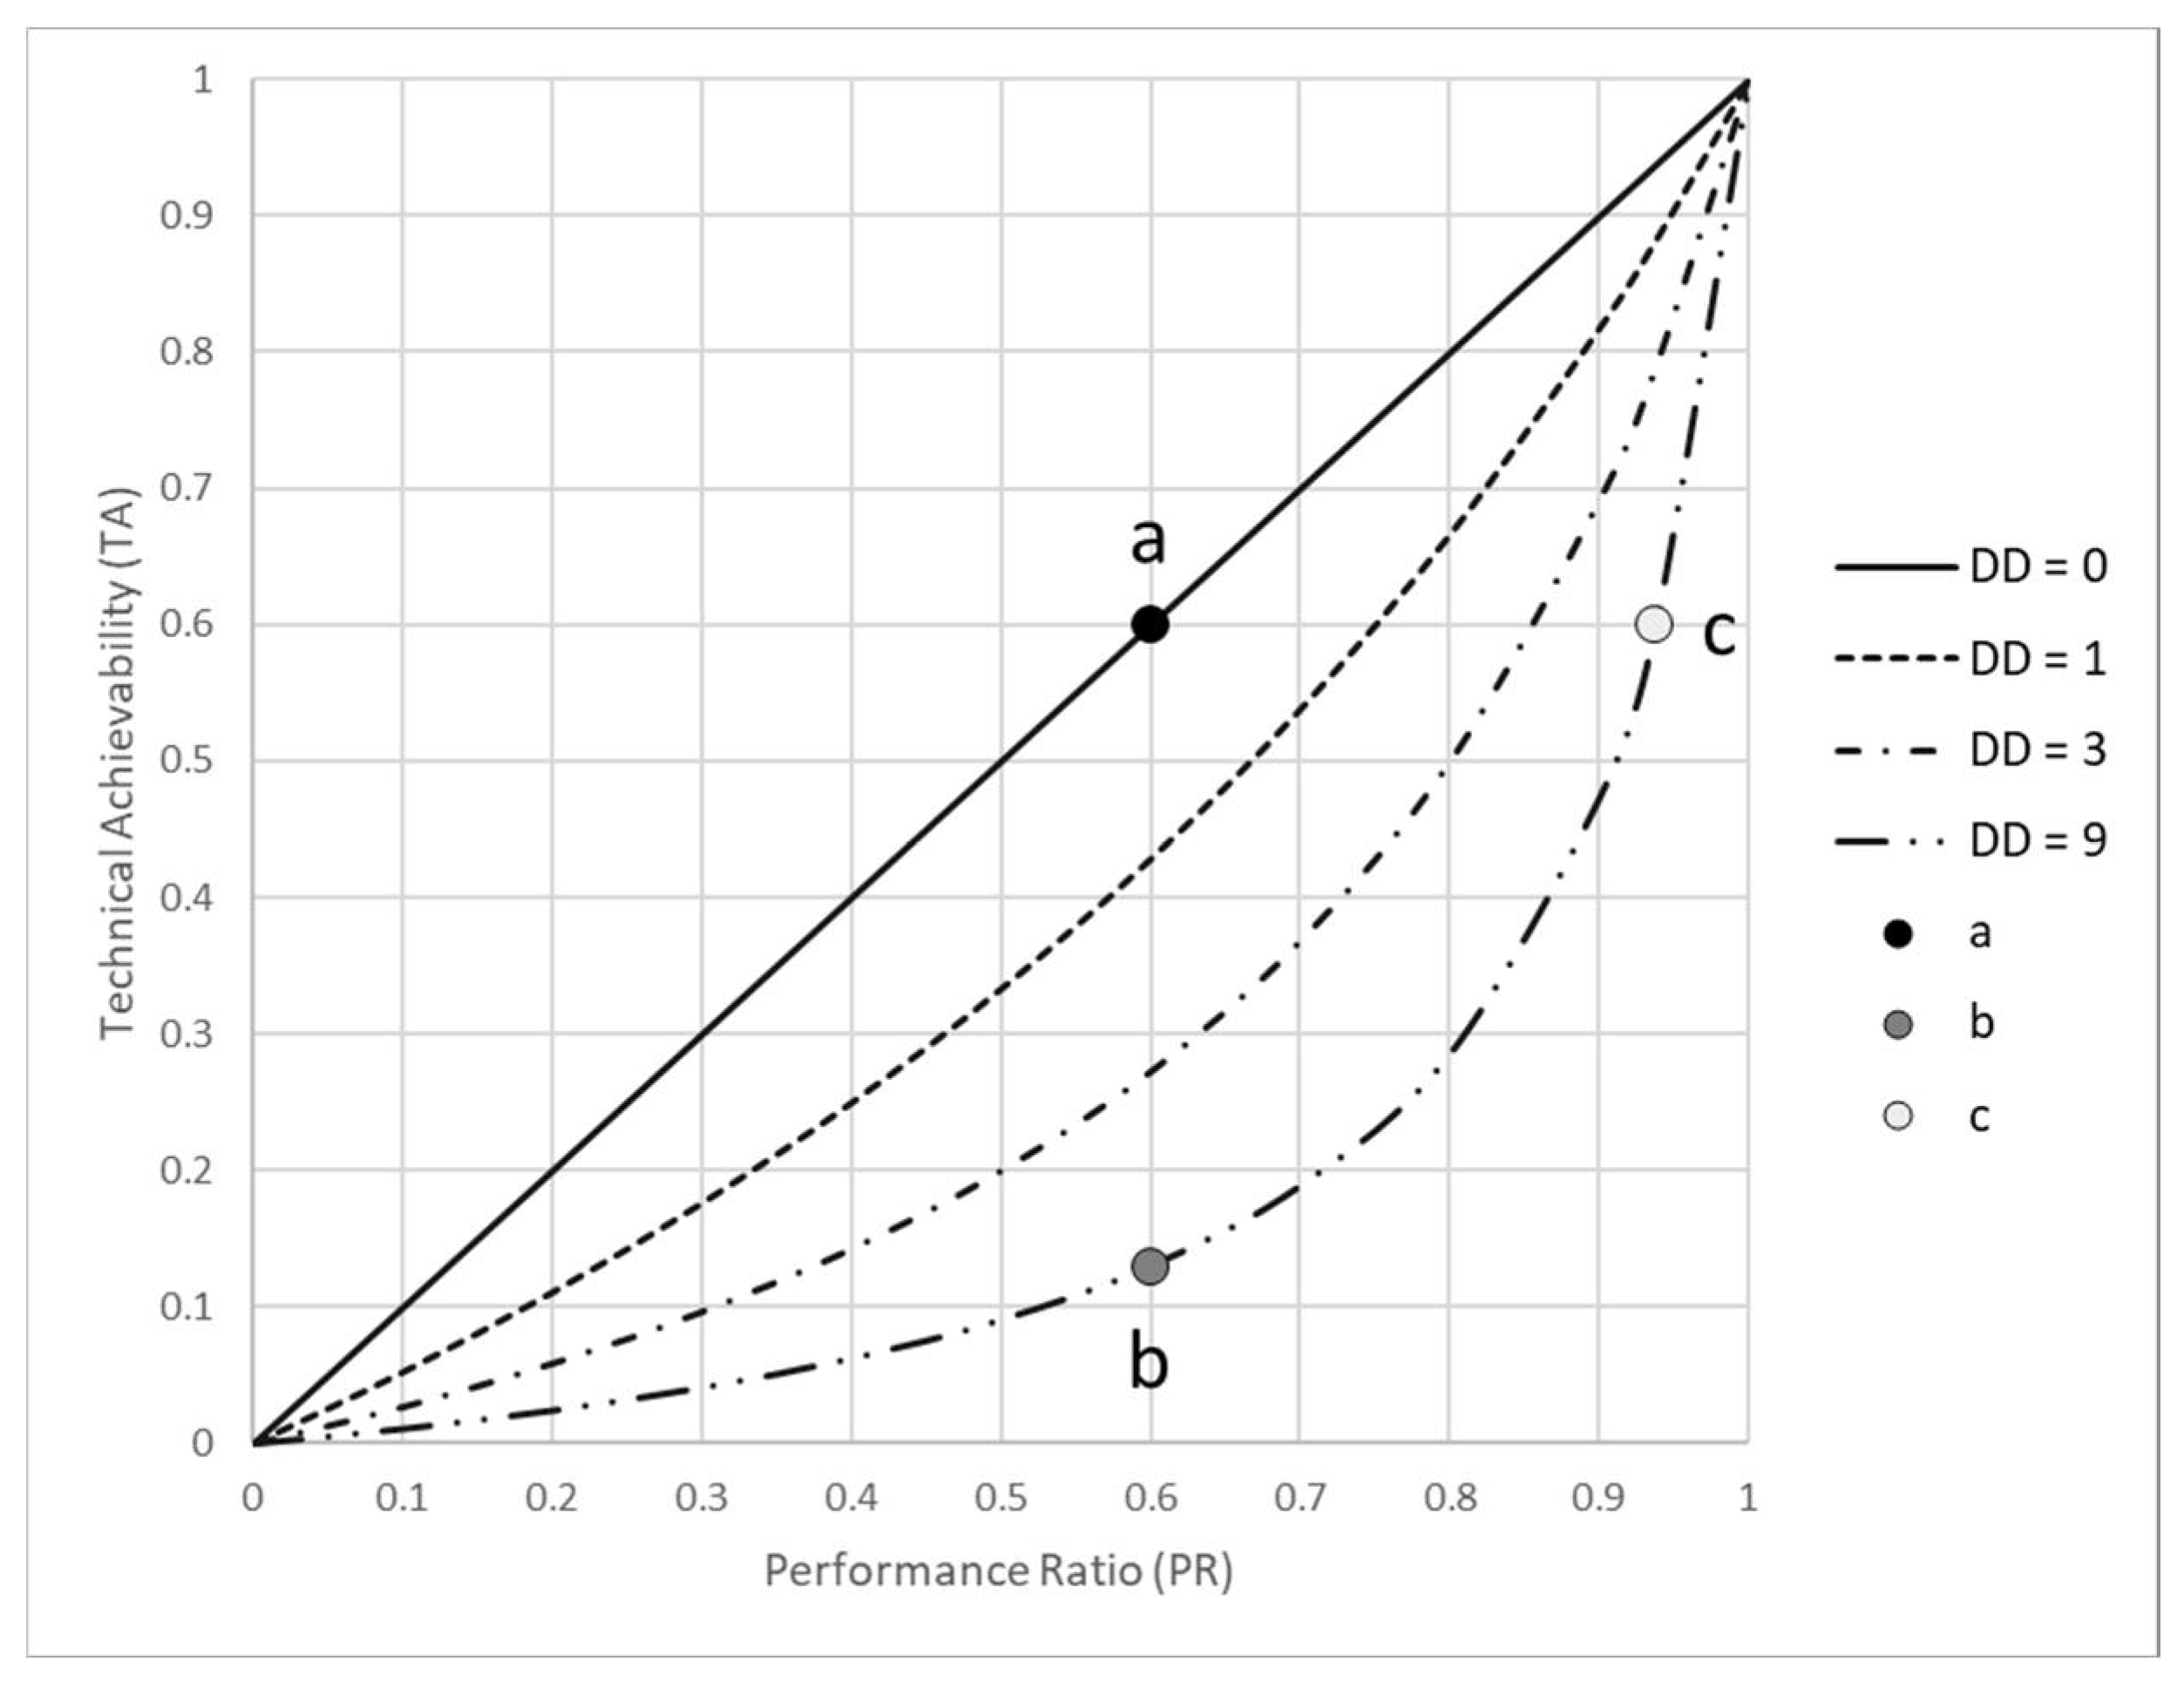
4.2. Performance Benchmark

To compare different wave energy options, a utility function was defined for each MOE. The function was normalised considering maximum (1) and minimum (0) utility values as shown in Table 10. Wave energy literature was examined to assign maximum and minimum bounds.
Table 11 presents the Global Merit (GM) for the six illustrative cases of hypothetical wave energy technologies previously defined in Table 8. The suitability scores were calculated using the aggregation logic as shown in Figure 6 and the weights presented in Figure 13 for each application market. First, the CF and AF as well as the CAPEX and FCR were aggregated as the weighted geometric mean, respectively. Then, the latter was combined with the OPEX through the weighted arithmetic mean. Finally, the resulting values were combined again using the weighted geometric mean. The affordability (LCOE) for the case studies is also shown in Table 8.
It can be noted that the small variation in the weights for the two application markets results in very similar global merits in all six case studies. This result suggests that the application market is less significant than the overall technology performance. In general, the global merit decreases as the affordability (LCOE) increases. However, the qualitative assessment provides a way to disambiguate between technologies with different levels of evaluation criteria leading to the same LCOE. For instance, Case 3 has higher merit than Case 2 although they share the same cost, 100 EUR/MWh. This means that a selection of a wave energy alternative exclusively based on either the LCOE or global merit might yield an unsuitable decision.
Precisely, the EU’s SET-Plan implementation plan for Ocean Energy [53] establishes a target LCOE of 100 EUR/MWh by 2035. This target LCOE can be used as the reference price of energy for the utility-scale generation market. By contrast, according to the World Bank [54], the average price of energy in 30 of the Small Island Development Country States (SIDS) ranges between 160–330 EUR/MWh. Given these high generation costs, wave energy technologies that are not currently affordable in the utility-scale markets may be already cost-competitive in these remote communities. Let us assume 300 EUR/MWh as the reference energy price for the remote community market for this study.
The threshold value of the LCOE divides the technology suitability into acceptable and unacceptable regions. Table 12 presents the Commercial Attractiveness (CA) results for the utility-scale and the remote community markets considering the 100 EUR/MWh and 300 EUR/MWh thresholds, respectively. Cases 1–3 have a combination of MOE that yields a suitable cost of energy for the utility-scale generation market. However, Cases 4–6 can only be compatible with the remote community market.
The concept of CA not only allows selecting the most suitable wave energy option when the LCOE or the global merit are identical for the same market application, but also comparing technologies for different market applications. For instance, Case 4 for remote community generation (CA = 1.32) is more attractive than Case 3 for utility-scale generation (CA = 0.73).
Let us focus now on the Technical Achievability (TA) of a wave energy technology option with PR < 1. This applies to Case 4 for the utility-scale market (see Table 8). This technology option is assumed to be in the design optimisation stage (TRL 4). Case 2 ratings are taken as reference values to compute the PR (see Table 8). For metrics that exhibit decreasing performance, PR is calculated using Equation (7). Otherwise, Equation (8) is used. When PR ≥ 1, the DD is obviously zero as shown in Table 13. For unmet performances, the DD level was estimated. The aggregated DD for the higher-level evaluation criteria was calculated as a weighted average of individual DD. The TA is then computed using Equation (10). The DD is moderate to high (1.32) resulting in a TA of 0.46. This analysis provides a means to concentrate the innovation efforts on improving those areas with the greatest impact on technology performance, in this particular case the CAPEX (0.14) and the OPEX (0.16). The analysis can be replicated at a lower hierarchical level in the functional domain to identify specific improvement areas in the technology capabilities.
Assigning the DD level to the system requirements of a wave energy technology under development seems a quite subjective and challenging task. Despite the difficulties, too little time spent in the early design phases can lead to gaps in understanding the problem requirements, limited opportunities for novel concept generation and wasted time and money developing a concept that is unable to perform well enough to become a viable solution [55].
The ability of new technology to meet its performance targets will depend on its maturity and innovation capability. As the development advances, the expected accuracy of the estimates will improve; thus, the uncertainty band will narrow. Figure 15 presents indicative upper (desired) and lower (threshold) bounds for five development stages derived from [56,57]. Stage 1 refers to concept design, Stage 2 to detailed design, Stage 3 to scaled demonstration, Stage 4 to the validation of a single device and finally Stage 5 to the validation of a complete wave energy farm [7].
For instance, the OPEX performance ratio of 0.44 in Table 11 could have had a DD level 1 at concept design (Stage 1) but would increase to 3 in the design phase (Stage 2, TRL 4) or even could be rated 9 for later stages. The innovation capability is limited as the technology matures and therefore the PR should be penalised with a higher DD at later design stages. Conversely, an early TRL opens the room for improvements through innovation. The same underlying idea is expressed by Weber [5] in the generic WEC development trajectories displayed over a TRL-TPL matrix. Fundamental system changes are only feasible and affordable at low TRLs. Cost reduction and improved performance for mature technologies are mainly limited to learning by doing and economies of scale.
As mentioned in Section 2.3, the DD may also be defined by fundamental limits. Table 14 presents the list of FR, MOP and possible factors that may restrict the innovation capability. It can be noted that the fundamental limits are defined either by attributes of the system design or the External Systems that interact with it. For instance, the deployment site defines the wave energy resource and the distance to the point of connection. Similarly, the service vessels available dictate the charter cost. The technology developer cannot modify the attributes of the External Systems but selects those locations that are most appropriate, thus constraining the total addressable market of the technology.
Other fundamental limits are related to the design of the wave energy device. The number of transformation steps in the PTO, the complexity of the product with components connected in series or the safety class are examples of attributes in which the technology developer has full control. Discontinued technologies such as “WaveBob” or “Pelamis”, with proven components but complex PTOs [58], should have had extremely high component reliability to meet appropriate system reliability. In fact, to achieve system reliability of 90% with five components in series, the individual reliability should be 98%. The same could be said for the PTO efficiency. The number of transformation steps will restrict the capability of the technology to meet the given thresholds.

5. Conclusions

This paper has presented a novel methodology for the holistic assessment of wave energy capabilities in various market applications. It has been implemented in the environmental, stakeholder and functional domains. In this approach, two matrix-based modelling methods, namely AHP and QFD, are combined in a waterfall manner to ensure the proper connectivity of weights and to limit the subjectivity of and dependence on expert judgements. So far, methods based on weights have only been applied separately and in a single step in wave energy. Moreover, the combination with LSP adds more granularity to the aggregation step than current methods.
The qualitative assessment has resulted in very different rankings of System Drivers (SD) and Stakeholders (SH) for the two market applications considered. Utility-scale is mainly motivated by Economic and Political factors, whereas the remote community generation market is mainly driven by Social factors. The development of wave energy technologies is primarily influenced by the needs of the Owner for utility-scale generation and the Government for remote community projects. However, when analysing Stakeholder Requirements (SR) and Functional Requirements (FR), the influence of the application market in the development of wave energy technologies is greatly reduced.
The quantitative assessment supports the previous finding. The small variation in the weights for the two application markets results in very similar Global Merit (GM) in all six case studies. In general, the GM decreases as the affordability (LCOE) increases. The Commercial Achievability (CA) enables comparing technologies for different market applications in a more objective manner. For instance, case study 4 is more attractive with a reference price of 300 EUR/MWh than cases 2 and 3 for utility-scale generation. The Technical Achievability (TA) concept offers a means to concentrate the innovation efforts before proceeding to the next development stage.
The technology-agnostic evaluation of wave energy capabilities can be used by whatever stakeholder and at any stage of technology development. However, the method relies upon the estimation of the different evaluation criteria. To overcome this limitation, future work will extend the implementation of this methodology to the physical domain. The functional allocation to physical realisations will allow detection of conflicts leading to trade-offs which must be addressed with structured innovation methods such as TRIZ [59].

Author Contributions

Conceptualization, P.R.-M., V.N. and J.M.B.; Methodology, investigation and writing, P.R.-M.; Validation, review and editing, V.N., J.M.B. and H.J.; Funding acquisition, J.M.B. All authors have read and agreed to the published version of the manuscript.

Funding

This research received no external funding.

Informed Consent Statement

Not applicable.

Data Availability Statement

Not applicable.

Acknowledgments

The authors would like to thank the Basque Government through the research groups IT1514-22 and GIU19-029. They are also grateful to the 64 international experts in wave energy that voluntarily contributed to the prioritisation exercise of external forces for the two market applications. The knowledge gained from the analysis of responses provides a solid basis for the objective evaluation of wave energy technologies.

Conflicts of Interest

The authors declare no conflict of interest. The funders had no role in the design of the study; in the collection, analyses, or interpretation of data; in the writing of the manuscript, or in the decision to publish the results.

Abbreviations

The following abbreviations are used in this manuscript:
AArithmetic mean
AFAvailability Factor
AHPAnalytical Hierarchy Process
CACommercial Attractiveness
CAPEXCapital Expenditure
CFCapacity Factor
CWCapture Width
DDDegree of Difficulty
EISEnvironmental Impact Score
EPCIEngineering, Procurement, Construction and Installation
FASTFunctional Analysis and System Technique
FCRFixed Charge Rate
FRFunctional Requirements
GGeometric mean
GMGlobal Merit
HHarmonic mean
HoQHouse of Quality
LCOELevelized Cost of Energy
LSPLogic Scoring of Preference
MOEMeasures of Effectiveness
MOPMeasures of Performance
MRManufacturing Requirements
MTBFMean Time between Failures
MTTRMean Time to Repair
O&MOperation and Maintenance
OPEXOperational Expenditure
PESTLEPolitical, Economic, Social, Technological, Legal and Environmental
PPAPower Purchase Agreement
PRPerformance Ratio
PTOPower Take-Off
QCQuasi-Conjunction
QFDQuality Function Deployment
TATechnical Achievability
TPLTechnology Performance Levels
TPMTechnical Performance Measures
TRTechnical Requirement
TRIZTeoriya Resheniya Izobretatelskikh Zadatch (theory of inventive problem solving)
TRLTechnology Readiness Levels
SESystems Engineering
SIDSSmall Island Development Country States
SDSystem Drivers
SHStakeholders
SPVSpecial Purpose Vehicle
SRStakeholder Requirements
VoCVoice of Customer
WECWave Energy Converter

Appendix A

The prioritisation for the different domain attributes used in the case studies along with their respective interactions is included below.
Table A1. System Drivers (SD) for Utility-scale generation.
System DriversSD1SD2SD3SD4SD5SD6
Political FactorsEconomic FactorsSocial FactorsTechnological FactorsLegal FactorsEnvironmental FactorsTotalWeight
SD1Political factors0.280.340.270.220.290.291.6828%
SD2Economic factors0.280.340.300.430.330.362.0434%
SD3Social factors0.040.040.030.030.020.020.183%
SD4Technological factors0.280.170.230.220.240.221.3723%
SD5Legal factors0.040.040.070.040.040.040.264%
SD6Environmental factors0.070.070.100.070.080.070.468%
Table A2. System Drivers (SD) for Remote community generation.
System DriversSD1SD2SD3SD4SD5SD6
Political FactorsEconomic FactorsSocial FactorsTechnological FactorsLegal FactorsEnvironmental FactorsTotalWeight
SD1Political factors0.260.210.490.130.200.201.4825%
SD2Economic factors0.260.210.120.270.230.241.3322%
SD3Social factors0.130.410.240.400.300.341.8230%
SD4Technological factors0.260.100.080.130.170.150.8915%
SD5Legal factors0.040.030.030.030.030.020.183%
SD6Environmental factors0.060.040.030.040.070.050.305%
Table A3. Stakeholders (SH) to Stakeholder Requirements (SR) for Utility-scale generation.
Stakeholder GroupStakeholder Prioritisation RatingSR1SR2SR3SR4SR5
Convert Wave Energy into PowerOperate When NeededReduce Upfront CostsReduce Annual CostsPrevent Business Risks
SH1Owner0.1919.1%0.360.120.200.040.28
SH2Lenders0.1514.8%0.040.190.260.190.33
SH3EPCI Contractor0.1010.1%0.000.000.640.000.36
SH4O&M Provider0.098.8%0.120.270.000.350.27
SH5Government0.1717.0%0.320.050.230.410.00
SH6Regulators0.1211.6%0.240.330.000.000.43
SH7Pressure groups0.1110.9%0.280.360.040.200.12
SH8Consumers0.087.6%0.380.290.000.290.04
Total1.00100.0%0.230.180.180.180.23
22.5%18.2%18.5%17.9%22.9%
Table A4. Stakeholders (SH) to Stakeholder Requirements (SR) for Remote community generation.
Stakeholder GroupStakeholder Prioritisation RatingSR1SR2SR3SR4SR5
Convert Wave Energy into PowerOperate When NeededReduce Upfront CostsReduce Annual CostsPrevent Business Risks
SH1Owner0.1515.5%0.360.120.200.040.28
SH2Lenders0.1312.7%0.040.190.260.190.33
SH3EPCI Contractor0.099.2%0.000.000.640.000.36
SH4O&M Provider0.065.7%0.120.270.000.350.27
SH5Government0.1717.0%0.320.050.230.410.00
SH6Regulators0.1313.1%0.240.330.000.000.43
SH7Pressure groups0.1413.8%0.280.360.040.200.12
SH8Consumers0.1312.9%0.380.290.000.290.04
Total1.00100.0%0.240.200.170.180.21
24.0%19.6%16.8%18.4%21.2%
Table A5. Stakeholder Requirements (SR) to Functional Requirements (FR) for Utility-scale generation.
Stakeholder RequirementsSR Prioritisation RatingFR1FR2FR3FR4FR5FR6FR7FR8FR9FR10
Capture Energy from WavesTransform into EnergyDeliver Energy to Point of ConsumptionMaximise Total UptimeMinimise Total DowntimeManufacture by Industrial ProcessesInstall by Service VesselsMaintain by Service VesselsSurvive the Harsh EnvironmentalAvoid Risks to Receptors
SR1Convert energy into power0.2322.5%0.300.330.230.100.030.000.000.000.000.00
SR2Operate when needed0.1818.2%0.200.090.080.250.200.000.000.130.030.03
SR3Reduce upfront costs0.1818.5%0.000.000.040.130.000.350.280.040.120.04
SR4Reduce annual costs0.1817.9%0.000.000.000.000.240.090.030.280.210.15
SR5Prevent business risks0.2322.9%0.120.040.040.000.120.040.040.040.320.25
Total1.00100.0%0.130.100.090.090.110.090.060.090.140.10
13.1%10.1%8.5%9.3%11.3%9.0%6.5%8.8%13.9%9.7%
Table A6. Stakeholder Requirements (SR) to Functional Requirements (FR) for Remote community generation.
Stakeholder RequirementsSR Prioritisation RatingFR1FR2FR3FR4FR5FR6FR7FR8FR9FR10
Capture Energy from WavesTransform into EnergyDeliver Energy to Point of ConsumptionMaximise Total UptimeMinimise Total DowntimeManufacture by Industrial ProcessesInstall by Service VesselsMaintain by Service vesselsSurvive the Harsh EnvironmentalAvoid Risks to Receptors
SR1Convert energy into power0.2424.0%0.300.330.230.100.030.000.000.000.000.00
SR2Operate when needed0.2019.6%0.200.090.080.250.200.000.000.130.030.03
SR3Reduce upfront costs0.1716.8%0.000.000.040.130.000.350.280.040.120.04
SR4Reduce annual costs0.1818.4%0.000.000.000.000.240.090.030.280.210.15
SR5Prevent business risks0.2121.2%0.120.040.040.000.120.040.040.040.320.25
Total1.00100.0%0.140.110.090.100.120.080.060.090.130.09
13.6%10.6%8.8%9.5%11.5%8.4%5.9%9.0%13.3%9.3%

References

  1. De Girard, P.-H.-J.; de Girard, P.-H. Divers Moyens D’employer Les Vagues de La Mer Comme Moteurs. 1799. Available online: https://books.google.com.hk/books?id=361QAAAAYAAJ&pg=PA99&redir_esc=y&hl=zh-CN&sourceid=cndr#v=onepage&q&f=false (accessed on 29 March 2022).
  2. Cruz, J. (Ed.) Ocean Wave Energy: Current Status and Future Prepectives [i.e., Perspectives]; Green Energy and Technology; Springer: Berlin/Heidelberg, Germany, 2008; ISBN 978-3-540-74894-6. [Google Scholar]
  3. Nielsen, K. Development of Recommended Practices for Testing Ocean Energy Systems; IEA-OES: Lisbon, Portugal, 2003. [Google Scholar]
  4. Ingram, D.M.; Smith, G.; Bittencourt-Ferreira, C.; Smith, H. Protocols for the Equitable Assessment of Marine Energy Converters; Institute for Energy Systems, School of Engineering, University of Edinburgh: Edinburgh, UK, 2011; ISBN 978-0-9508920-1-6. [Google Scholar]
  5. Weber, J. WEC Technology Readiness and Performance Matrix—Finding the Best Research Technology Development Trajectory; ICOE: Dublin, Ireland, 2012; p. 11. [Google Scholar]
  6. Bull, D.; Costello, R.; Babarit, A.; Nielsen, K.; Kennedy, B.; Bittencourt-Ferreira, C.; Roberts, J.; Weber, J. Scoring the Technolgy Performance Level (TPL) Assessment; EWTEC: Cork, Ireland, 2017; p. 10.
  7. Hodges, J.; Henderson, J.; Ruedy, L.; Soede, M.; Weber, J.; Ruiz-Minguela, P.; Jeffrey, H.; Bannon, E.; Holland, M.; MacIver, R.; et al. An International Evaluation and Guidance Framework for Ocean Energy Technology; IEA-OES: Lisbon, Portugal, 2021. [Google Scholar]
  8. DTOceanPlus. DTOceanPlus—Advanced Design Tools for Ocean Energy Systems Innovation, Development and Deployment. Available online: https://www.dtoceanplus.eu/ (accessed on 28 February 2021).
  9. Magagna, D. Workshop on Identification of Future Emerging Technologies in the Ocean Energy Sector: 27th March 2018 Ispra, Italy; Publications Office: Luxembourg, 2018. [Google Scholar]
  10. Fabrycky, W.J.; Blanchard, B.S. Life-Cycle Cost and Economic Analysis. In Prentice Hall International Series in Industrial and Systems Engineering; Prentice Hall: Englewood Cliffs, NJ, USA, 1991; ISBN 978-0-13-538323-0. [Google Scholar]
  11. Costello, R.; Pecher, A. Economics of WECs. In Handbook of Ocean Wave Energy; Pecher, A., Kofoed, J.P., Eds.; Springer: Berlin/Heidelberg, Germany, 2017; Volume 7, pp. 101–137. ISBN 978-3-319-39888-4. [Google Scholar]
  12. INCOSE. Systems Engineering Handbook: A Guide for System Life Cycle Processes and Activities 4.0; Wiley: Hoboken, NJ, USA, 2015. [Google Scholar]
  13. Ruiz-Minguela, P.; Nava, V.; Hodges, J.; Blanco, J.M. Review of Systems Engineering (SE) Methods and Their Application to Wave Energy Technology Development. J. Mar. Sci. Eng. 2020, 8, 823. [Google Scholar] [CrossRef]
  14. Pahl, G.; Wallace, K.; Blessing, L.; Pahl, G. (Eds.) Engineering Design: A Systematic Approach, 3rd ed.; Springer: London, UK, 2007; ISBN 978-1-84628-318-5. [Google Scholar]
  15. Haberfellner, R.; de Weck, O.; Fricke, E.; Vössner, S. Systems Engineering: Fundamentals and Applications; Springer: Berlin/Heidelberg, Germany, 2019; ISBN 978-3-030-13430-3. [Google Scholar]
  16. Wasson, C.S. System Engineering Analysis, Design, and Development; Wiley & Sons, Inc.: Hoboken, NJ, USA, 2016; ISBN 978-1-118-44226-5. [Google Scholar]
  17. Vanegas Cantarero, M. D8.1 Potential Markets for Ocean Energy; DTOceanPlus; European Union: Brussels, Belgium, 2020; p. 121.
  18. Suh, N.P. Axiomatic Design: Advances and Applications. In The MIT-Pappalardo Series in Mechanical Engineering; Oxford University Press: New York, NY, USA, 2001; ISBN 978-0-19-513466-7. [Google Scholar]
  19. Hansen, C.T.; Andreasen, M.M. Two approaches to synthesis based on the domain theory. In Engineering Design Synthesis: Understanding, Approaches, and Tools; Chakrabarti, A., Ed.; Springer: London, UK; New York, NY, USA, 2002; ISBN 978-1-85233-492-5. [Google Scholar]
  20. Bartolomei, J.E.; Hastings, D.E.; de Neufville, R.; Rhodes, D.H. Engineering Systems Multiple-Domain Matrix: An organizing framework for modeling large-scale complex systems. Syst. Eng. 2012, 15, 41–61. [Google Scholar] [CrossRef]
  21. Farid, A.M.; Suh, N.P. (Eds.) Axiomatic Design in Large Systems; Springer: Berlin/Heidelberg, Germany, 2016; ISBN 978-3-319-32387-9. [Google Scholar]
  22. Burge, S. A Functional Approach to Quality Function Deployment; Burge Hughes Walsh: Rugby, UK, 2007. [Google Scholar]
  23. Roedler, G.J.; Jones, C. Technical Measurement. A Collaborative Project of PSM, INCOSE, and Industry; Defense Technical Information Center: Fort Belvoir, VA, USA, 2005.
  24. Liu, D. System Design Principles and Models; CRC Press LLC Taylor & Francis Group: Boca Raton, FL, USA, 2015; ISBN 978-1-4822-8246-7. [Google Scholar]
  25. Buede, D.M.; Miller, W.D. The Engineering Design of Systems: Models and Method, 3rd ed.; Wiley: Hoboken, NJ, USA, 2016; ISBN 978-1-119-02807-9. [Google Scholar]
  26. Ruiz-Minguela, P.; Nava, V.; Blanco, J.M. External Forces Influencing the Development of Wave Energy Technologies for Power Markets; Zenodo: Geneva, Switzerland, 2022; p. 28. [Google Scholar]
  27. Babarit, A.; Bull, D.; Dykes, K.; Malins, R.; Nielsen, K.; Costello, R.; Roberts, J.; Bittencourt Ferreira, C.; Kennedy, B.; Weber, J. Stakeholder requirements for commercially successful wave energy converter farms. Renew. Energy 2017, 113, 742–755. [Google Scholar] [CrossRef]
  28. Saaty, R.W. The analytic hierarchy process—What it is and how it is used. Math. Model. 1987, 9, 161–176. [Google Scholar] [CrossRef] [Green Version]
  29. Zhang, Y.; Zhao, Y.; Sun, W.; Li, J. Ocean wave energy converters: Technical principle, device realization, and performance evaluation. Renew. Sustain. Energy Rev. 2021, 141, 110764. [Google Scholar] [CrossRef]
  30. Mizuno, S.; Akao, Y.; Ishihara, K. (Eds.) QFD, The Customer—Driven Approach to Quality Planning and Deployment; Asian Productivity Organization: Tokyo, Japan, 1994; ISBN 978-92-833-1121-8. [Google Scholar]
  31. Kaufman, J.J.; Woodhead, R. Stimulating Innovation in Products and Services: With Function Analysis and Mapping; Wiley: Hoboken, NJ, USA, 2006; ISBN 978-0-471-77366-5. [Google Scholar]
  32. Chen, L.-H.; Chen, C.-N. Normalisation models for prioritising design requirements for quality function deployment processes. Int. J. Prod. Res. 2014, 52, 299–313. [Google Scholar] [CrossRef]
  33. Stegman, A. Assessing the Market Potential for Wave Energy Innovations. Ph.D. Thesis, The University of Edinburgh, Edinburgh, UK, 2021. [Google Scholar] [CrossRef]
  34. Dujmovic, J.J. A Method for Evaluation And Selection Of Complex Hardware And Software Systems. In Proceedings of the 22nd International Computer Measurement Group Conference, San Diego, CA, USA, 10–13 December 1996; pp. 368–378. [Google Scholar]
  35. Dujmovic, J. Soft Computing Evaluation Logic: The LSP Decision Method and Its Applications; John Wiley & Sons: Hoboken, NJ, USA, 2018; ISBN 978-1-119-25647-2. [Google Scholar]
  36. Babarit, A. A database of capture width ratio of wave energy converters. Renew. Energy 2015, 80, 610–628. [Google Scholar] [CrossRef] [Green Version]
  37. Garvey, P.R.; Cho, C.-C. Acquisition Review Quarterly; Defense Acquisition University Press: Fort Belvoir, VA, USA, 2003; pp. 189–199. [Google Scholar]
  38. Roberts, O.P. Structured Innovation Approach for Application to the Wave Energy Sector; The University of Edinburgh: Edinburgh, UK, 2020. [Google Scholar]
  39. Mahafza, S.; Componation, P.; Tippett, D. A Performance-Based Technology Assessment Methodology to Support DoD Acquisition. Def. Acquis. Rev. 2005, 11, 16. [Google Scholar]
  40. Del Marmol, T.; Feys, B. PESTLE Analysis: Understand and Plan for Your Business Environment. In 50MINUTES.COM—Business; Plurilingua Publishing: Ixelles, Belgium, 2016. [Google Scholar]
  41. IRENA. Renewable Energy and Jobs—Annual Review 2020; International Renewable Energy Agency: Abu Dhabi, United Arab Emirates, 2020; p. 44. [Google Scholar]
  42. Takai, S.; Kalapurackal, R.M. Sensitivity analysis of relative worth in quality function deployment matrices. Concurr. Eng. 2012, 20, 195–202. [Google Scholar] [CrossRef]
  43. Stagonas, D.; Myers, L.E.; Bahaj, A.S. D5.8 Impacts upon Marine Energy Stakeholders; EQUIMAR; European Union: Brussels, Belgium, 2011; p. 16.
  44. Isakhanyan, G.; de Wilt, J.G. Stakeholder Analysis of Marine Parks; Innovation Network: Utrecht, The Netherlands, 2011; ISBN 978-90-5059-448-6. [Google Scholar]
  45. ARUP. Five Minute Guide to the Energy Trilemma; ARUP: London, UK, 2016. [Google Scholar]
  46. Previsic, M. Economic Methodology for the Evaluation of Emerging Renewable Technologies; RE Vision Consulting, LLC: Sacramento, CA, USA, 2011; p. 14. [Google Scholar]
  47. Jenne, D.S.; Yu, Y.-H.; Neary, V. Levelized Cost of Energy Analysis of Marine and Hydrokinetic Reference Models. In Proceedings of the 3rd Marine Energy Technology Symposium, Washington, WA, USA, 27–29 April 2015; p. 8. [Google Scholar]
  48. Rinaldi, G.; Thies, P.R.; Johanning, L. Current Status and Future Trends in the Operation and Maintenance of Offshore Wind Turbines: A Review. Energies 2021, 14, 2484. [Google Scholar] [CrossRef]
  49. Methode APTE » The Tools. Available online: http://methode-apte.com/methode_apte/tools/ (accessed on 29 March 2022).
  50. Price, A.A.E. New Perspectives on Wave Energy Converter Control; The University of Edinburgh: Edinburgh, UK, 2009. [Google Scholar]
  51. Efficiency—DTOceanPlus 1.0 Documentation. Available online: https://dtoceanplus.gitlab.io/documentation/assessment/spey/docs/explanation/Efficiency.html (accessed on 27 March 2022).
  52. Araignous, E.; Safi, G. D6.5 Environmental and Social Acceptance Tools—Alpha Version; DTOceanPlus; European Union: Brussels, Belgium, 2020; p. 73.
  53. Technical Working Group. SET Plan: Ocean Energy Implementation Plan; European Commission: Brussels, Belgium, 2018; p. 50.
  54. OES. Ocean Energy in Islands and Remote Coastal Areas: Opportunities and Challenges; IEA Technology Collaboration Programme for Ocean Energy Systems: Lisbon, Portugal, 2020; p. 32.
  55. Trueworthy, A.M.; DuPont, B.L.; Cavagnaro, R.J. A set-based design approach for the design of high-performance wave energy converters. In Proceedings of the 13th European Tidal and Wave Energy Conference, Naples, Italy, 1–6 September 2019. [Google Scholar]
  56. E06 Committee. Classification for Cost Estimate Classification System; ASTM International: West Conshohocken, PA, USA, 2020. [Google Scholar]
  57. Previsic, M.; Siddiqui, O.; Bedard, R. EPRI Global E2I Guideline Economic Assessment Methodology for Offshore Wave Power Plants; Electric Power Research Institute: Palo Alto, CA, USA, 2004. [Google Scholar]
  58. Dick, W. Wavebob to WRAM: Experience Gained, Lessons Learnt 2015. Available online: https://www.bilbaomarinenergy.com/CMSPages/GetFile.aspx?guid=a123c22c-2052-4e51-bfc6-d255dc01058f (accessed on 21 June 2021).
  59. Altshuller, G. The Innovation Algorithm: TRIZ, Systematic Innovation and Technical Creativity, 1st ed.; Technical Innovation Center: Worcester, MA, USA, 2000; ISBN 978-0-9640740-4-0. [Google Scholar]
Figure 1. Proposed assessment approach.
Energies 15 02624 g001
Figure 2. Domains of the design world (adapted from [13]).
Energies 15 02624 g002
Figure 3. System, External Systems and Context (adapted from [25]).
Energies 15 02624 g003
Figure 4. Technical Achievability.
Energies 15 02624 g004
Figure 5. Wave energy stakeholder groups.
Energies 15 02624 g005
Figure 6. Aggregation of MOE.
Energies 15 02624 g006
Figure 7. Lifecycle of the wave energy system and entities.
Energies 15 02624 g007
Figure 8. Octopus diagram for the operation phase (a) and rest of phases (b).
Energies 15 02624 g008
Figure 9. FAST diagram for the wave energy system.
Energies 15 02624 g009
Figure 10. Aggregation of MOP.
Energies 15 02624 g010
Figure 11. Relative importance of SD for the application market.
Energies 15 02624 g011
Figure 12. Relative importance of SH for the application market.
Energies 15 02624 g012
Figure 13. Relative importance of SR for the application market.
Energies 15 02624 g013
Figure 14. Relative importance of FR for the application market.
Energies 15 02624 g014
Figure 15. Expected accuracy range per development stage.
Energies 15 02624 g015
Table 1. Gradation scale for pairwise comparisons [28].
ImportanceDefinitionExplanation
1EqualFactors contribute equally to the objective
3ModerateOne factor is slightly favoured over another
5StrongOne factor is strongly favoured over another
7Very strongEvidence exists for a factor dominance
9Extremely strongHighest possible validity of a factor
2, 4, 6, 8Intermediate valuesFor a compromise between the above values
Table 2. Technical Difficulty (adapted from [39]).
LevelDegree of Difficulty (DD)Value
1Very low uncertainty (certain feasibility)0
2Moderate uncertainty1
3High uncertainty3
4Very high uncertainty (fundamental breakthrough)9
Table 3. Market characteristics [26].
MarketCharacteristics
Utility-scale generationAttractive but also very competitive.
WEC design is mainly driven by this market.
Increasing demand for renewable electricity.
Legal obligations to meet decarbonisation targets.
Remote community generationA narrower span of competition (sometimes just one option—diesel).
Low energy security and quality.
Consumers are vulnerable to price fluctuation and high energy costs.
Simplified market and regulatory conditions.
Table 4. System Drivers for wave energy [26].
IdCategoryWave Energy Drivers
SD1PoliticalFavourable policies (e.g., energy security, finance, job creation)
Market support mechanisms
Political stability and low bureaucracy
SD2EconomicAccess to finance, credit and insurance
Energy price and/or volatility
SD3SocialGrowing energy demand
Social acceptance
SD4TechnologicalTechnology maturity and certification
Infrastructure readiness
Supply chain availability
SD5LegalSimplified procedures (e.g., consenting, environmental assessment)
Standards and certification
SD6EnvironmentalStricter environmental protection (e.g., pollution, climate change)
The suitable site and resource conditions
Table 5. Importance ratings scale [42].
RatingImpact
0None
1Weak
3Moderate
5Strong
7Very strong
9Extremely strong
Table 6. Stakeholder roles and expectations.
IdStakeholderRolesExpectations
SH1OwnerInitiate the project and design the farm
Provide equity
Set return on investment targets
Manage project risks
Sell electricity to consumers
Competitive profitability
Low project risks
Access to affordable credit
Stability of policy framework
Assess performance levels
Competitive cost of electricity
Predictable generation
Match consumer demand
SH2LendersProvide debt
Set interest rate
Assess financial risk
Low revenue risks
Maintain reputation
SH3EPCI contractorManage farm construction and installation
Provide insurance during construction
Select suppliers
Manage end-of-life recycling
Select best components and systems
Avoid cost overruns and delays
Well understood and manageable risks
SH4O&M providerProvide spare parts and services
Perform (un)scheduled maintenance
Provide insurance during operation
Select service suppliers
Reliability of assets during project lifetime
Avoid cost overruns and delays
Well understood and manageable risks
Safety at sea
SH5GovernmentDevelop and implement sectoral policies
Review compliance
Provide investment and generation incentives
Economic development
Efficient use of public resources
Compliance with regulation
Socio-economic benefits
SH6RegulatorsEstablish permitting requirements
Review project use of ocean space
Provide concession
Compliance with regulation
Maintain reputation
SH7Pressure groupsLobby for or against the project
Improve the well-being of the community
Acceptable environmental impact
No affection to other activities
Socio-economic benefits
SH8ConsumersSet power quality requirements
Purchase generated electricity
Competitive cost of electricity
Predictable generation
Positive social and economic impacts
Table 7. Stakeholder Requirements and metrics.
IdStakeholder Requirement (SR)Measure of Effectiveness (MOE)
SR1Convert wave energy into consumable powerCapacity Factor (CF) [4]
SR2Operate when neededAvailability Factor (AF) [7]
SR3Reduce upfront costsCapital Expenditure (CAPEX) [4]
SR4Reduce annual costsOperational Expenditure (OPEX) [4]
SR5Prevent business risksFixed Charge Rate (FCR) [46]
Table 8. Assessment of wave energy options.
Eval CriteriaCase 1Case 2Case 3Case 4Case 5Case 6
CF (%)302550402025
AF (%)959799989285
CAPEX (M EUR)11.2331.93.5
OPEX (k EUR)4592150210114140
FCR (%)8109.410.2119.3
LCOE (EUR/MWh)50100100150200250
Table 9. Functional Requirements and Metrics.
IdFunctional RequirementsMeasures of Performance (MOP)
FR1Capture energy from wavesNormalised Capture Width (Cwn) [50]
FR2Transform into useful energyTransformation Efficiency (ηt) [7]
FR3Deliver energy to point of consumptionDelivery Efficiency (ηd) [51]
FR4Maximise total uptimeReliability (MTBF = 1/λ 1) [7]
FR5Minimise total downtimeMaintainability (MTTR = 1/μ 2) [7]
FR6Manufacture by industrial processesManufacturability (MANEX) [7]
FR7Install/retrieve by service vesselsInstallability (INSTEX) [7]
FR8Maintain by service vesselsRepairability (REPEX) [7]
FR9Survive the harsh environmentSurvivability (SURV) [7]
FR10Avoid risks to receptorsEnvironmental Impact Score (EIS) [52]
1 λ = failure rate, 2 μ = repair rate.
Table 10. Stakeholder Requirements and Utility.
IdMOEMin = 0Max = 1Utility Function
SR1Capacity Factor (CF)0%≥50%CF/Max
SR2Availability Factor (AF)≤75%100%(AF-Min)/(Max-Min)
SR3Capital Expenditure (CAPEX)≥5 M EUR0 M EUR1–CAPEX/Min
SR4Operational Expenditure (OPEX)≥0.5 M EUR0 M EUR1–OPEX/Min
SR5Fixed Charge Rate (FCR)≥20%≤5%1–(FCR-Max)/(Min-Max)
Table 11. Qualitative assessment of wave energy options.
Global Merit (GM)Case 1Case 2Case 3Case 4Case 5Case 6
Utility-scale0.770.710.730.650.600.51
Remote community0.770.700.740.660.590.51
Table 12. Wave energy attractiveness.
Utility-Scale (100 EUR/MWh)Case 1Case 2Case 3Case 4Case 5Case 6
GM0.770.710.730.650.600.51
PR2.001.001.000.670.500.40
CA1.540.710.73000
Remote Community
(300 EUR/MWh)
Case 1Case 2Case 3Case 4Case 5Case 6
GM0.770.700.740.660.590.51
PR5.993.013.012.001.501.20
CA4.602.112.241.320.890.62
Table 13. TA for the utility-scale generation market.
Eval CriteriaCase 2Case 4
ReferenceRatingsPRDDTA
CF (%)25401.600.001.60
AF (%)97981.010.001.01
CAPEX (M EUR)1.230.403.000.14
OPEX (k EUR)922100.443.000.16
FCR (%)1010.20.981.000.96
LCOE (EUR/MWh)1001500.671.320.46
Table 14. Degree of difficulty factors for FR.
IdMOPFactors
FR1Normalised Capture Width (Cwn)Wave energy resource at the deployment site
FR2Transformation Efficiency (ηt)No. of transformation steps
FR3Delivery Efficiency (ηd)Distance to point of connection
FR4Reliability (MTBF = 1/λ)No. of components in series
FR5Maintainability (MTTR = 1/μ)Time of maintenance operation
FR6Manufacturability (MANEX)Cost of raw materials
FR7Installability (INSTEX)Cost of vessels
FR8Repairability (REPEX)No. of trips
FR9Survivability (SURV)Safety class
FR10Environmental Impact Score (EIS)Environmental pressure
Publisher’s Note: MDPI stays neutral with regard to jurisdictional claims in published maps and institutional affiliations.

