1. Introduction
The environmental impact of the maritime sector is a growing concern and therefore the International Maritime Organization (IMO) has put in place several initiatives and regulations to improve the energy efficiency on board [
1]. Several efforts have been devoted over the years to the improvement of the propulsion and auxiliary generators on board, shifting from diesel to electricity generation and including renewables and alternative energy sources, such as wind, solar PV and fuel cells [
2,
3]. However, the full decarbonization of maritime transportation needs joint efforts that go beyond simply improving the power system of the ship and should instead focus on the overall optimization of the energy management on board. Several approaches have been proposed towards this goal, including energy-efficient navigation routes and analysis and optimization of load allocation [
4]. An extensive energy and exergy analysis of cruise ships is reported in [
5], which highlights some peculiarities of this kind of vessel: contrarily to merchant ships or tankers [
6], the balance between the energy use for propulsion and the other services is more even, with 46% of the total energy used for propulsion, 27% for heat and 27% for electric power generation. At the same time, it is clear from several studies that heat generation is one of the processes that contributes the most to the inefficiencies on board if waste heat recovery is not exploited [
5]. On the contrary, as discussed in [
7], applying waste heat recovery systems on board always improves the energy efficiency index (EEDI) of the cruise ship and leads to significant reductions in fuel consumption. The proposed methods for onboard heat recovery that were investigated include thermally activated desalination systems, single- and double-stage absorption chillers, organic and standard steam turbine systems. Similar conclusions were also found in previous studies [
8,
9].
The diversification of energy generation on board and the push towards waste heat recovery have then transformed the energy system of a cruise ship into a real microgrid with distributed generation features [
10,
11,
12]. Accordingly, as in terrestrial applications, several technologies and methodologies can be applied for optimization, among which the use of energy storage is gaining importance. Given the shift towards electrification on board, as well, different energy storage technologies for electricity have been proposed [
13,
14,
15], but since the amount of waste heat available on board is high and the improvement of ships’ efficiency cannot preclude it from its full exploitation and utilization, the use of thermal energy storage (TES) systems has also been investigated. In [
16], the use of thermal energy storage tanks at three different temperature levels is proposed, i.e., high, medium and low temperature waste heat recovery from the propulsion system, which can then be used to drive thermally activated systems with constant temperatures. In reference [
17], the use of thermal storage on board of merchant ships is also foreseen, mainly to cover the mismatch between waste heat availability and heat demand for space and fuel tanks heating while docking. In reference [
18], instead, waste heat utilization for driving an absorption chiller is proposed, with a storage tank on the chilled water side of the system to cover the mismatch between produced cold water (when heat is available) and the demand on board. In reference [
19], the use of TES is discussed as part of a waste heat recovery strategy from fuel engines and it was found that 15.2% of the total energy from the fuel input is saved using the TES system. Sensible and latent heat storage systems were analyzed for this purpose and it was found that Phase Change Materials (PCMs) represent a good choice, but high heat transfer rates are also needed. The potential for TES in Potable Hot Water (PHW) distribution on board of cruise ships was also discussed in [
20], comparing different distribution system layouts and time-dependent heat requirements. The use of PCMs to improve the thermal performance of the system was suggested, as well. A small-scale prototype of a waste heat recovery system for a cruiser with electrical production and PHW with a latent TES has been presented in [
21], showing that the system is capable of recovering 7.7% of the fuel energy consumed.
When referring to building applications, the provision of PHW is usually referred to as Domestic Hot Water (DHW). Among the different PCMs used for DHW purposes, paraffins are mostly employed due to their high stability, low cost and abundance [
22]. However, the main drawbacks, which can represent a significant limitation for waste heat recovery on board, is the low thermal conductivity. To overcome this issue in DHW tanks, the use of hybrid sensible-latent storage systems has been proposed [
23]. One of the methods for the design of compact and efficient hybrid sensible-latent TES is through the use of encapsulated PCMs that can be inserted in DHW tanks [
20]. The activities reported in the literature on this kind of system are mainly based on numerical approaches. For instance, in [
24] a parametric study was carried out to highlight the design parameters that affect the performance of a hybrid DHW system. The results indicate that PCM melting temperature and distribution are those yielding the main influence. In [
25], the charging process of a DHW with PCM spheres was analyzed and it was found that energy capacity increases with a higher amount of PCM at the expense of lower heat-transfer rates and therefore instant power available to the user. Numerical simulations in TRNSYS were also used in [
26] for the optimization of a DHW tank with PCM for peak shifting. The parameter used for optimization was the amount of PCM, which is strongly dependent on the time-shifting period desired.
Only a few experimental activities have been reported in recent years and have mainly focused on solar DHW systems. For instance, in [
27], direct and indirect heat exchange methods were compared for maximizing the thermal response and storage capacity of solar DHW systems, and the direct heat exchange method was found to increase solar fraction by 18–23% in spring conditions. In [
28], a design with a storage tank filled with PCM and a staggered heat exchanger was investigated, with the aim of maximizing the instant power available to the user. Results indicated that the tank can be charged either by the sun or by a heat pump in less than 2 h, with a heat transfer rate above 5 kW for at least the first half of the storage capacity, thus showing a promising potential for the application. The use of a hybrid storage tank for DHW applications was investigated experimentally and numerically in [
29] and it was found that heat storage capacity per unit of volume increases in a hybrid storage compared with a sensible one, even for the limited fractions of PCM employed. During experiments, 10% of heat storage increase was found by adding 1.3 dm
3 of a hydrate salt mixture to a 50 dm
3 tank.
From the literature analysis presented above it is clear that, even though the need and potential for the use of TES on board, especially of cruise ships, has been identified as one of the solutions for energy efficiency improvement, dedicated experiences and design tools are lacking. For terrestrial applications (i.e., in buildings), several configurations have been tested and discussed for DHW purposes, and the hybrid sensible-latent one has been found to be one of the most promising. However, further experimental proofs and validations are needed, which would also allow for the wider application of the technology in other use-case scenarios.
Starting from this identified research gap, the present paper presents a wide investigation of a hybrid sensible-latent TES for PHW production on board of cruise ships. This represents the first investigation in the literature dealing with the development of a hybrid TES for onboard applications. The work started from the identification of PHW needs on board, the main design parameters were fixed and a lab-scale prototype was manufactured and tested. Experiments with and without PCM capsules were carried out to highlight the effect of the material on the thermal response and energy capacity of the system. In addition, two numerical models, validated starting from the experimental outcomes, were implemented: the first one was a detailed Computational Fluid Dynamic (CFD) model, able to identify the most relevant phenomena affecting the operation of the TES, while the second one was a simplified model implemented as component for ESP-r software, which can be used to investigate the effect of the storage integrated in complex systems in future development activities.
2. Thermal Energy Storage Design
The design process of the TES was based on three major steps. At first, the hot water demand profiles expected on board of cruise ships were identified. Subsequently, a literature and commercial search of possible PCMs was performed, also considering possible means of macro-encapsulations, which are useful to embed the PCM in the sensible tank. Finally, once the material and the capsules were defined, the tank design was completed to optimize the operation of the TES. A lab-scale storage was then manufactured for the experimental characterization under controlled conditions.
2.1. Identification of the Hot Water Demand On-Board
The usual configurations of PHW generation on board exploit the available waste heat source recovered by coolant loops of primary engines. Usually, the available power is sufficient to directly cover the instantaneous PHW demand for hotel application. For this reason, no TES are usually employed, while a continuous hot water generation is guaranteed [
20]. Nevertheless, under some operating conditions the available power is not sufficient, e.g., during docking in the port. Under these circumstances, auxiliary heaters are needed to cover the hot water delivery [
5]. A possible approach to limit the energy consumption of auxiliaries is represented by the integration of either centralized or decentralized TES, which is able to store the surplus of heat provided by the propulsion engines during cruising and to make use of them when less heating power is available. In the literature, there is a lack of experimental data related to hot water consumption on board. Nevertheless, Manzan et al. [
20] proposed a typical hot water daily draw profile for a 5000-person cruise ship, deriving it from other available data for hotel application.
As reported in reference [
20], this profile is characterized by three main peaks, concentrated early in the morning, around lunch time and in the late afternoon. This confirms that a quite variable daily demand is expected, which can be perfectly balanced by integrating short-term TES technologies, which are expected to be charged and discharged at least once per day. In order to maximize the achievable energy storage density, the investigation was focused on latent heat storage technology.
2.2. PCM Selection
In order to proceed with the PCM selection, the expected operating temperature range was investigated. As reported in [
5], two main energy recovery loops can be exploited on board, a high temperature loop, working between 70 °C and 90 °C and a low temperature loop, operating between 40 °C and 60 °C. Considering that according to the sanitation regulations on board, to prevent legionella risks, a minimum hot water temperature of 50 °C is expected [
30], an operating temperature range between 50 °C and 70 °C was considered for the PCM selection. Assuming a minimum temperature difference between the heat transfer fluid and the PCM of 5 K, the operating temperature range of the PCM suitable for the TES was narrowed to 55–65 °C. Accordingly, a literature and market survey was performed, to identify the most suitable material for the given application. An approach similar to the one reported in [
31] was followed, selecting as main decision criteria: the volumetric latent heat, the temperature range of the phase change process, the commercial availability of the material and the possibility of having it already encapsulated.
The first selection was made between organic and inorganic compounds. Since usually the phase change temperature range is broader for organics and their volumetric latent heat is lower due to the low density, the selection was restricted to the inorganics, specifically salt hydrates. After a market search, considering the given operating temperature range, the PCM class identified and the availability of different macro-encapsulation shapes (e.g., spheres, plates, tubes), the salt hydrate S58, provided by the company PCM products, was selected [
10]. The nominal features of the PCM S58 are summarized in
Table 1 [
10].
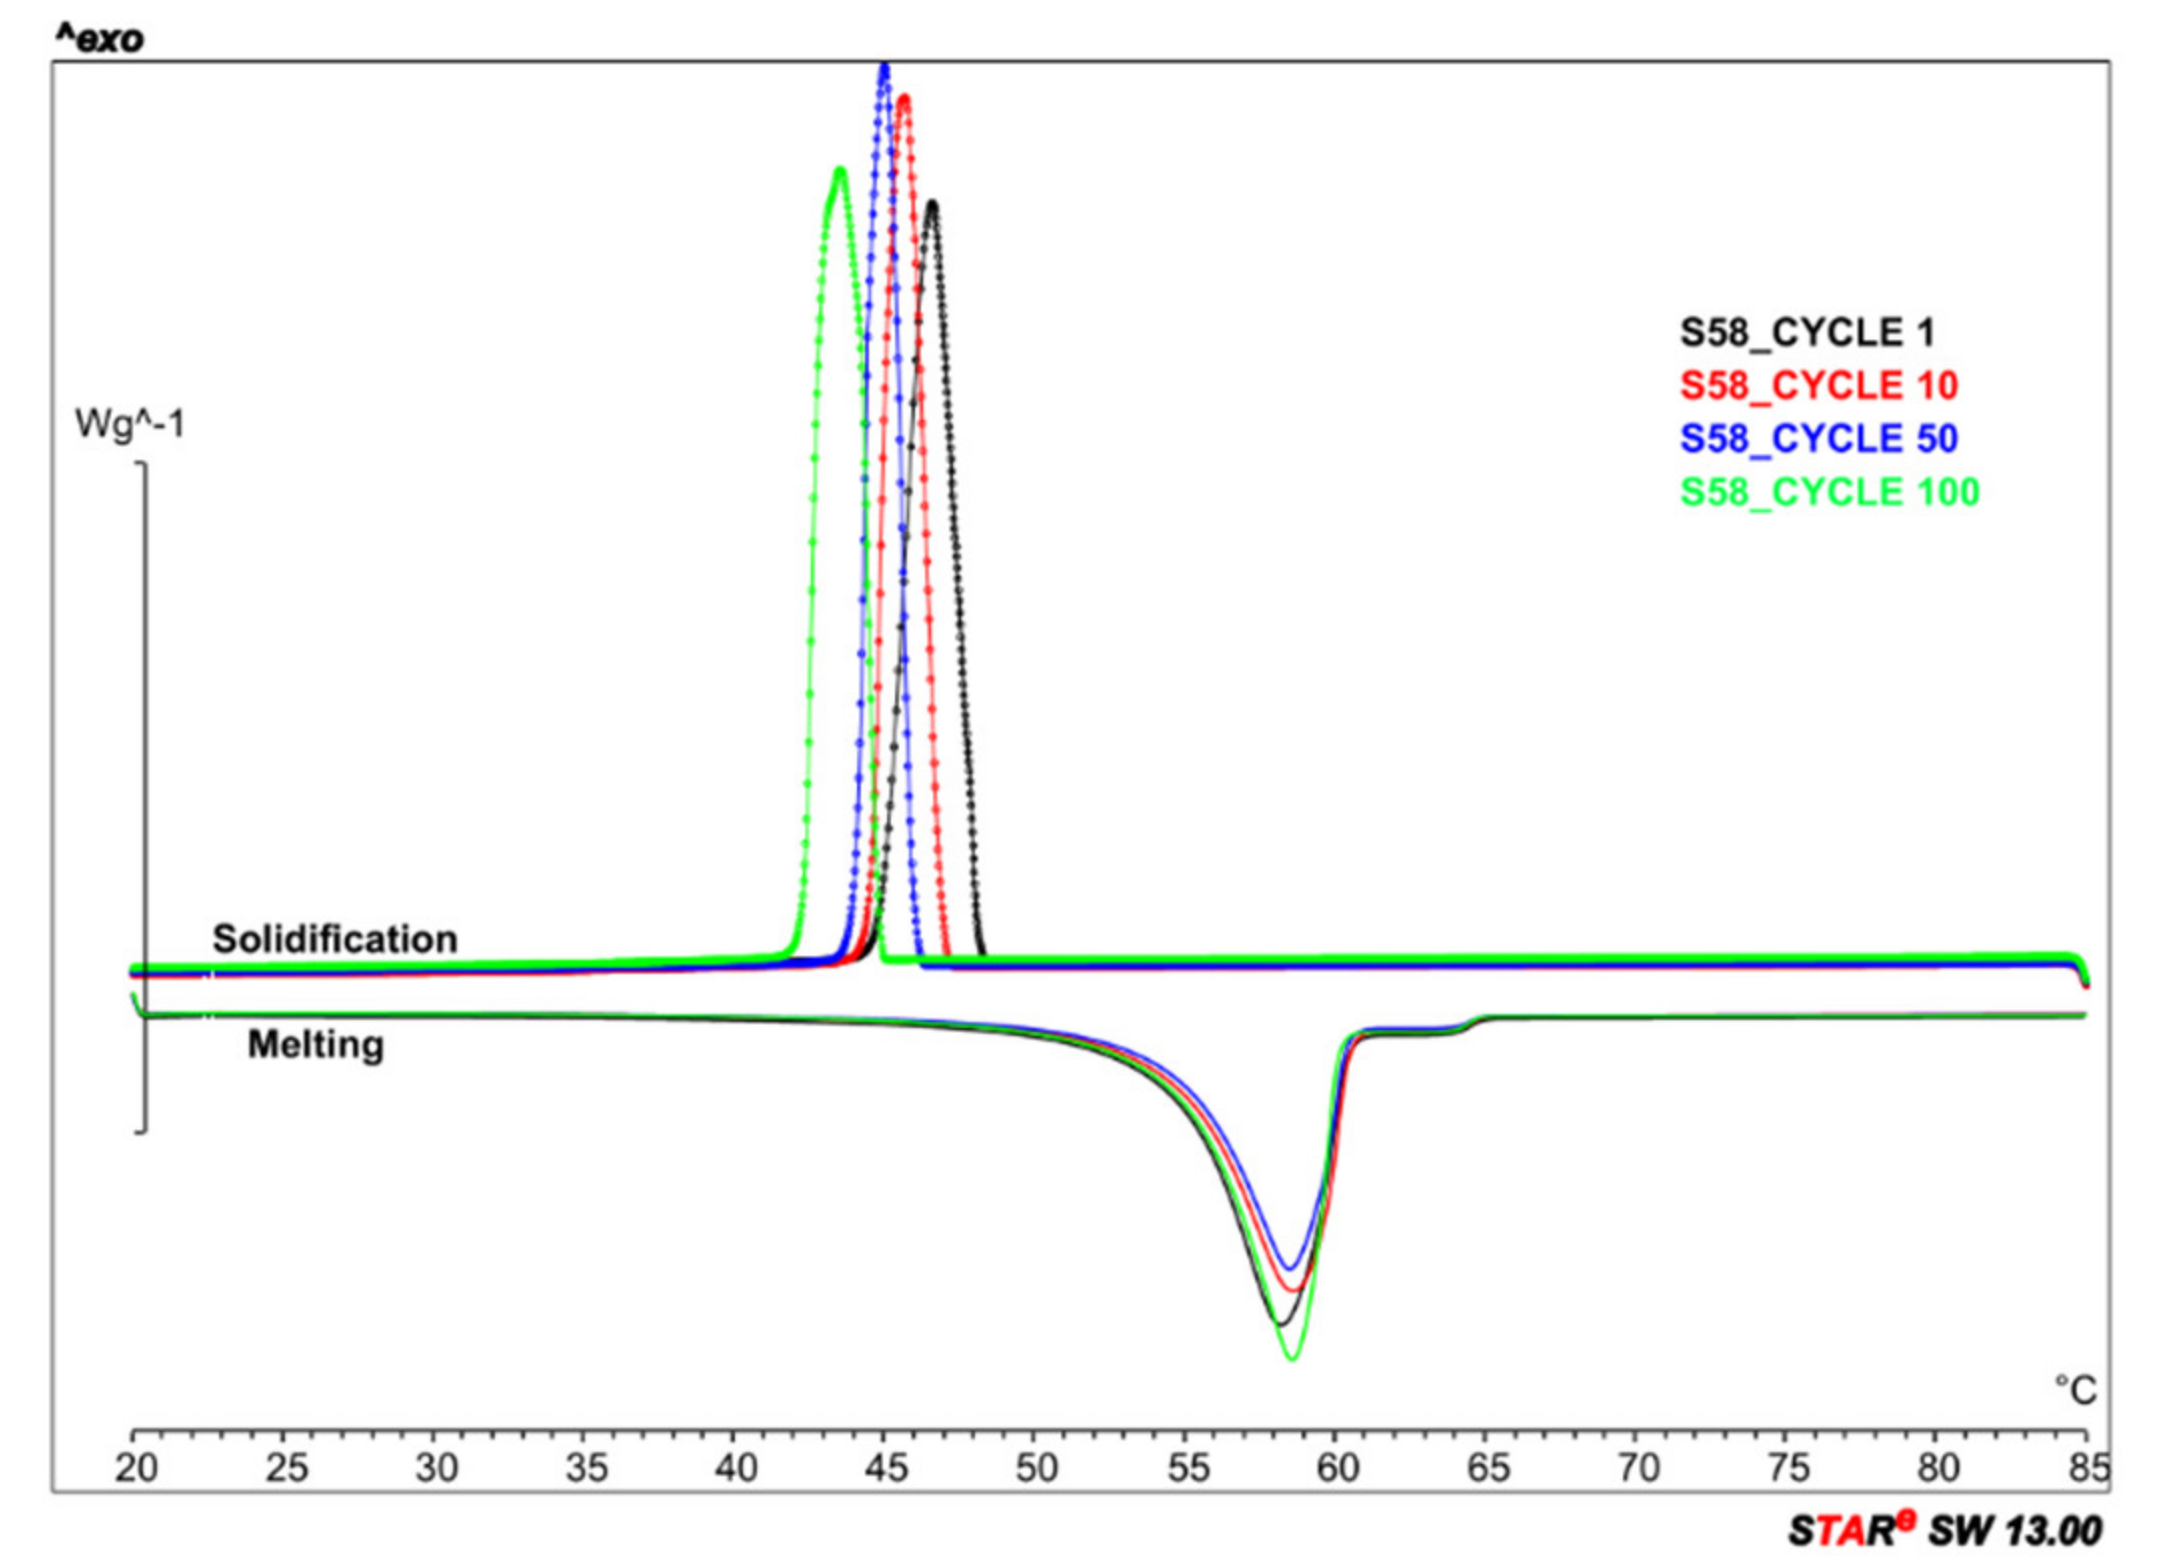
The acquired PCM was then experimentally validated at the CNR ITAE lab by performing 100 consecutive heating and cooling cycles in a Mettler DSC 1 apparatus in the operating range of 20–80 °C, with a heating and cooling rate of 5 K/min. The instrument was calibrated with indium prior the first cycle.
Figure 1 shows the melting and solidification peaks of the PCM S58 at 1, 10, 50 and 100 cycles. As observed from the graph, S58 suffers from a subcooling phenomenon. Therefore, the solidification temperature is lower after every solidification/melting cycle. Nevertheless, it is plausible to assert that this phenomenon is related to the low amount of PCM, 10 mg, tested in the DSC equipment. On the other side, the melting curves are stable during all the cycles. The performed analysis aimed at evaluating the actual latent heat as well as the stability of the PCM upon cycling. A summary of the obtained results is reported in
Figure 2.
Two main parameters were evaluated, namely, the onset melting temperature and the latent heat. It is clear that the onset melting temperature was stable throughout the characterization, being around 55 °C, in line with the nominal value, since the peak melting temperature was always around 58 °C. Differently, the latent heat was almost stable at 128 kJ/kg, with some fluctuations registered during the first cycles being about 13% lower than the nominal one. Thus, a volumetric latent heat of 192 MJ/m3 can be achieved, which can still be considered attractive for the given application.
2.3. Hybrid Sensible/Latent TES Design
The design of the lab-scale TES was based on the hybrid sensible/latent configuration in order to increase the achievable storage density, still guaranteeing a sufficient heat transfer efficiency by using the water inside the tank as heat transfer fluid (HTF) to provide and withdraw thermal energy.
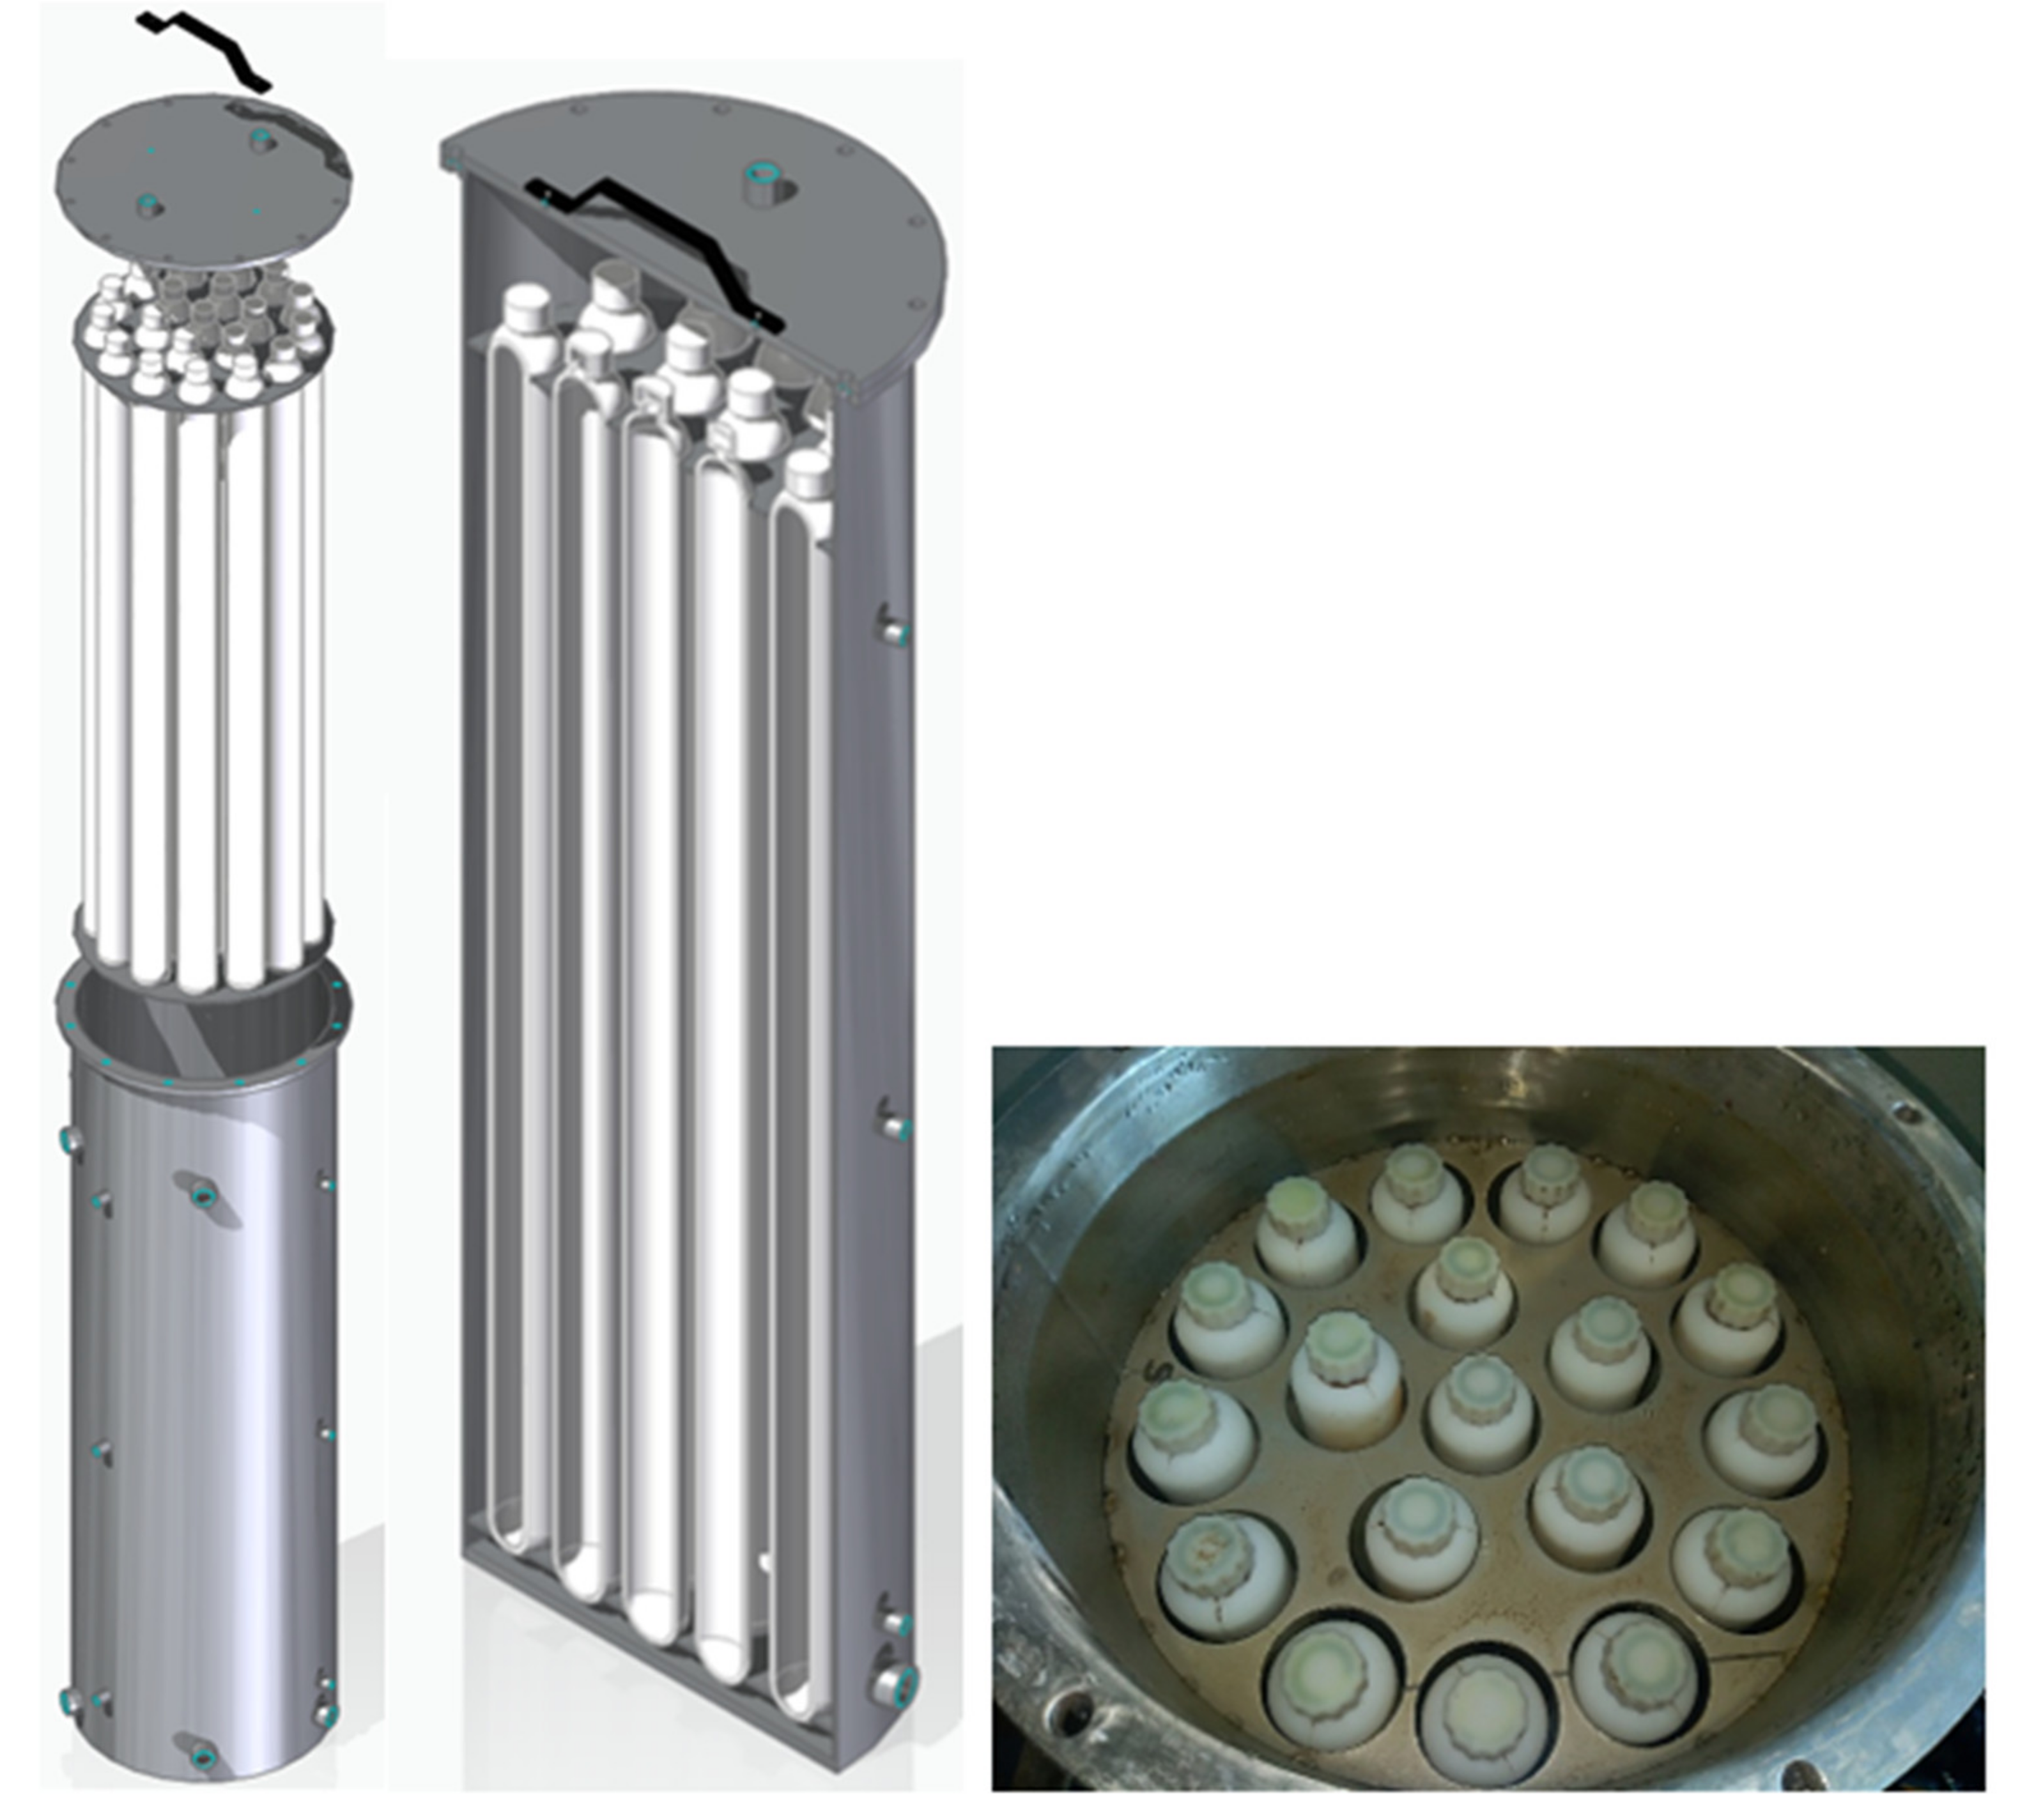
The macro-capsule shape selected was the tubular one, in which the PCM is embedded inside polypropylene tubes, because capsules of this shape are able to operate under the operating temperature range. Each capsule has a weight of 2.7 kg, a height of 1 m and a diameter of 5 cm. A 0.1 m3 cylindrical vertical tank was designed in order to maximize the inclusion of PCM macro-capsules. The tank was equipped with two internal flanges at the top and at the bottom to guarantee the proper positioning of the PCM tubes. Furthermore, in order to properly distribute the HTF inside the tank, the bottoming flange was designed including evenly distributed holes, from which the HTF passed during the charging phase, thus achieving a homogeneous temperature distribution inside the tank.
Two views of the designed storage tank are presented in
Figure 3, highlighting the presence of the flanges for the PCM capsule integration and the distribution of the capsules inside the tank. Furthermore, a detailed view of the inserted macro-capsules is shown.
Table 2 summarizes the main features of the designed and realized storage tank, also including the maximum number of capsules that can be integrated and the overall PCM volume. Reference theoretical TES densities achievable both for purely sensible and hybrid sensible/latent configurations, assuming a 20 K of temperature difference as reference operating conditions are reported as well.
The tank, realized in stainless steel, was properly insulated by means of 1-cm-thick polyurethane foam. Furthermore, six thermocouples (T
0–T
5) were inserted inside the tank, in contact with the water, at three different heights, as represented in
Figure 4. Each pair of inserted thermocouples at each height was installed out of phase of 90°, to evaluate not only the longitudinal but also the transversal temperature distribution. Two adhesive thermocouples were attached over the tank surface at the bottom (T
6) and at the top (T
7). Finally, at the inlet and outlet of the charging and discharging circuits, Pt 100 platinum resistances were installed, which were used to analyze the performance of the storage during both charge and discharge.
4. Experimental Results
In this paragraph, a comparison between two reference tests performed over the two TES configurations are reported to highlight the main identified features, along with some quantitative evaluations of the achievable performance.
4.1. Charging Test
As highlighted in
Table 3, several different boundary conditions for the charging stage were applied. Each charging phase was conducted keeping the inlet temperature to the TES, and the flow rate was kept almost constant until the average temperature inside the storage reached the target one.
Figure 6 compares the dynamic evolution of the measured tank temperatures (
Figure 6a) and charging power (
Figure 6b) for both TES under the same charging conditions, namely an initial temperature of 45 °C, an ending temperature of 75 °C and a flow rate 10 kg/min. Since no huge deviation of the temperatures measured at the same height of the tank and on the external surface were identified, in
Figure 6, only three internal temperatures, measured at three different heights were reported (T
0, T
2 and T
4 according to
Figure 4), along with one of the temperatures measured over the surface of the tank and the environmental temperature.
Analyzing the obtained results, as expected, it is clear that the charging phase can be distinguished in three different sections. An initial stage, which lasts less than 10 min, during which the temperatures increasing inside the tanks are quite comparable. Afterwards, the hybrid TES enters the phase change stage, thus the temperature inside the tank, even if only in contact with the water and not the PCM itself, flattens for about 50 min. Afterwards, the temperatures are again almost overlapped until the TESs reach the target temperature.
The behavior of the two configurations can be even better analyzed looking at the measured thermal power over the whole charging phase. As highlighted in
Figure 6b, the sensible TES configuration achieves a higher initial power, guaranteed by the fact that the hot water coming from the charging circuit is directly injected in the tank, pushing out the cold water. Thus, the power is extremely high at the beginning since it exploits the thermal inertia of the intermediate vessel of the testing rig and then it tends to decrease due to the time needed by the electric boiler to achieve the target temperature. Differently, the hybrid TES is characterized by a lower power at the beginning and a higher power during the following phases of the charging. This is due to the heat-transfer limitation between the water flowing into the TES and the PCM macro-capsules, which does not allow for the exploitation of the full capacity at the beginning of the charging phase and then requires a higher heating power for most of the charging phase. Interestingly, both charging processes last about 1.5 h, even if the hybrid TES stores about 12% more energy than the sensible one under these boundaries. This behavior also impacts the temperature evolution over the surface of the tank. Indeed, for both configurations, there is a temperature increase of about 10 °C during the charging, with the sensible TES initially achieving higher temperature due to the faster temperature increase, while the same temperature is attained at the end of the charging phase.
4.2. Discharging Test
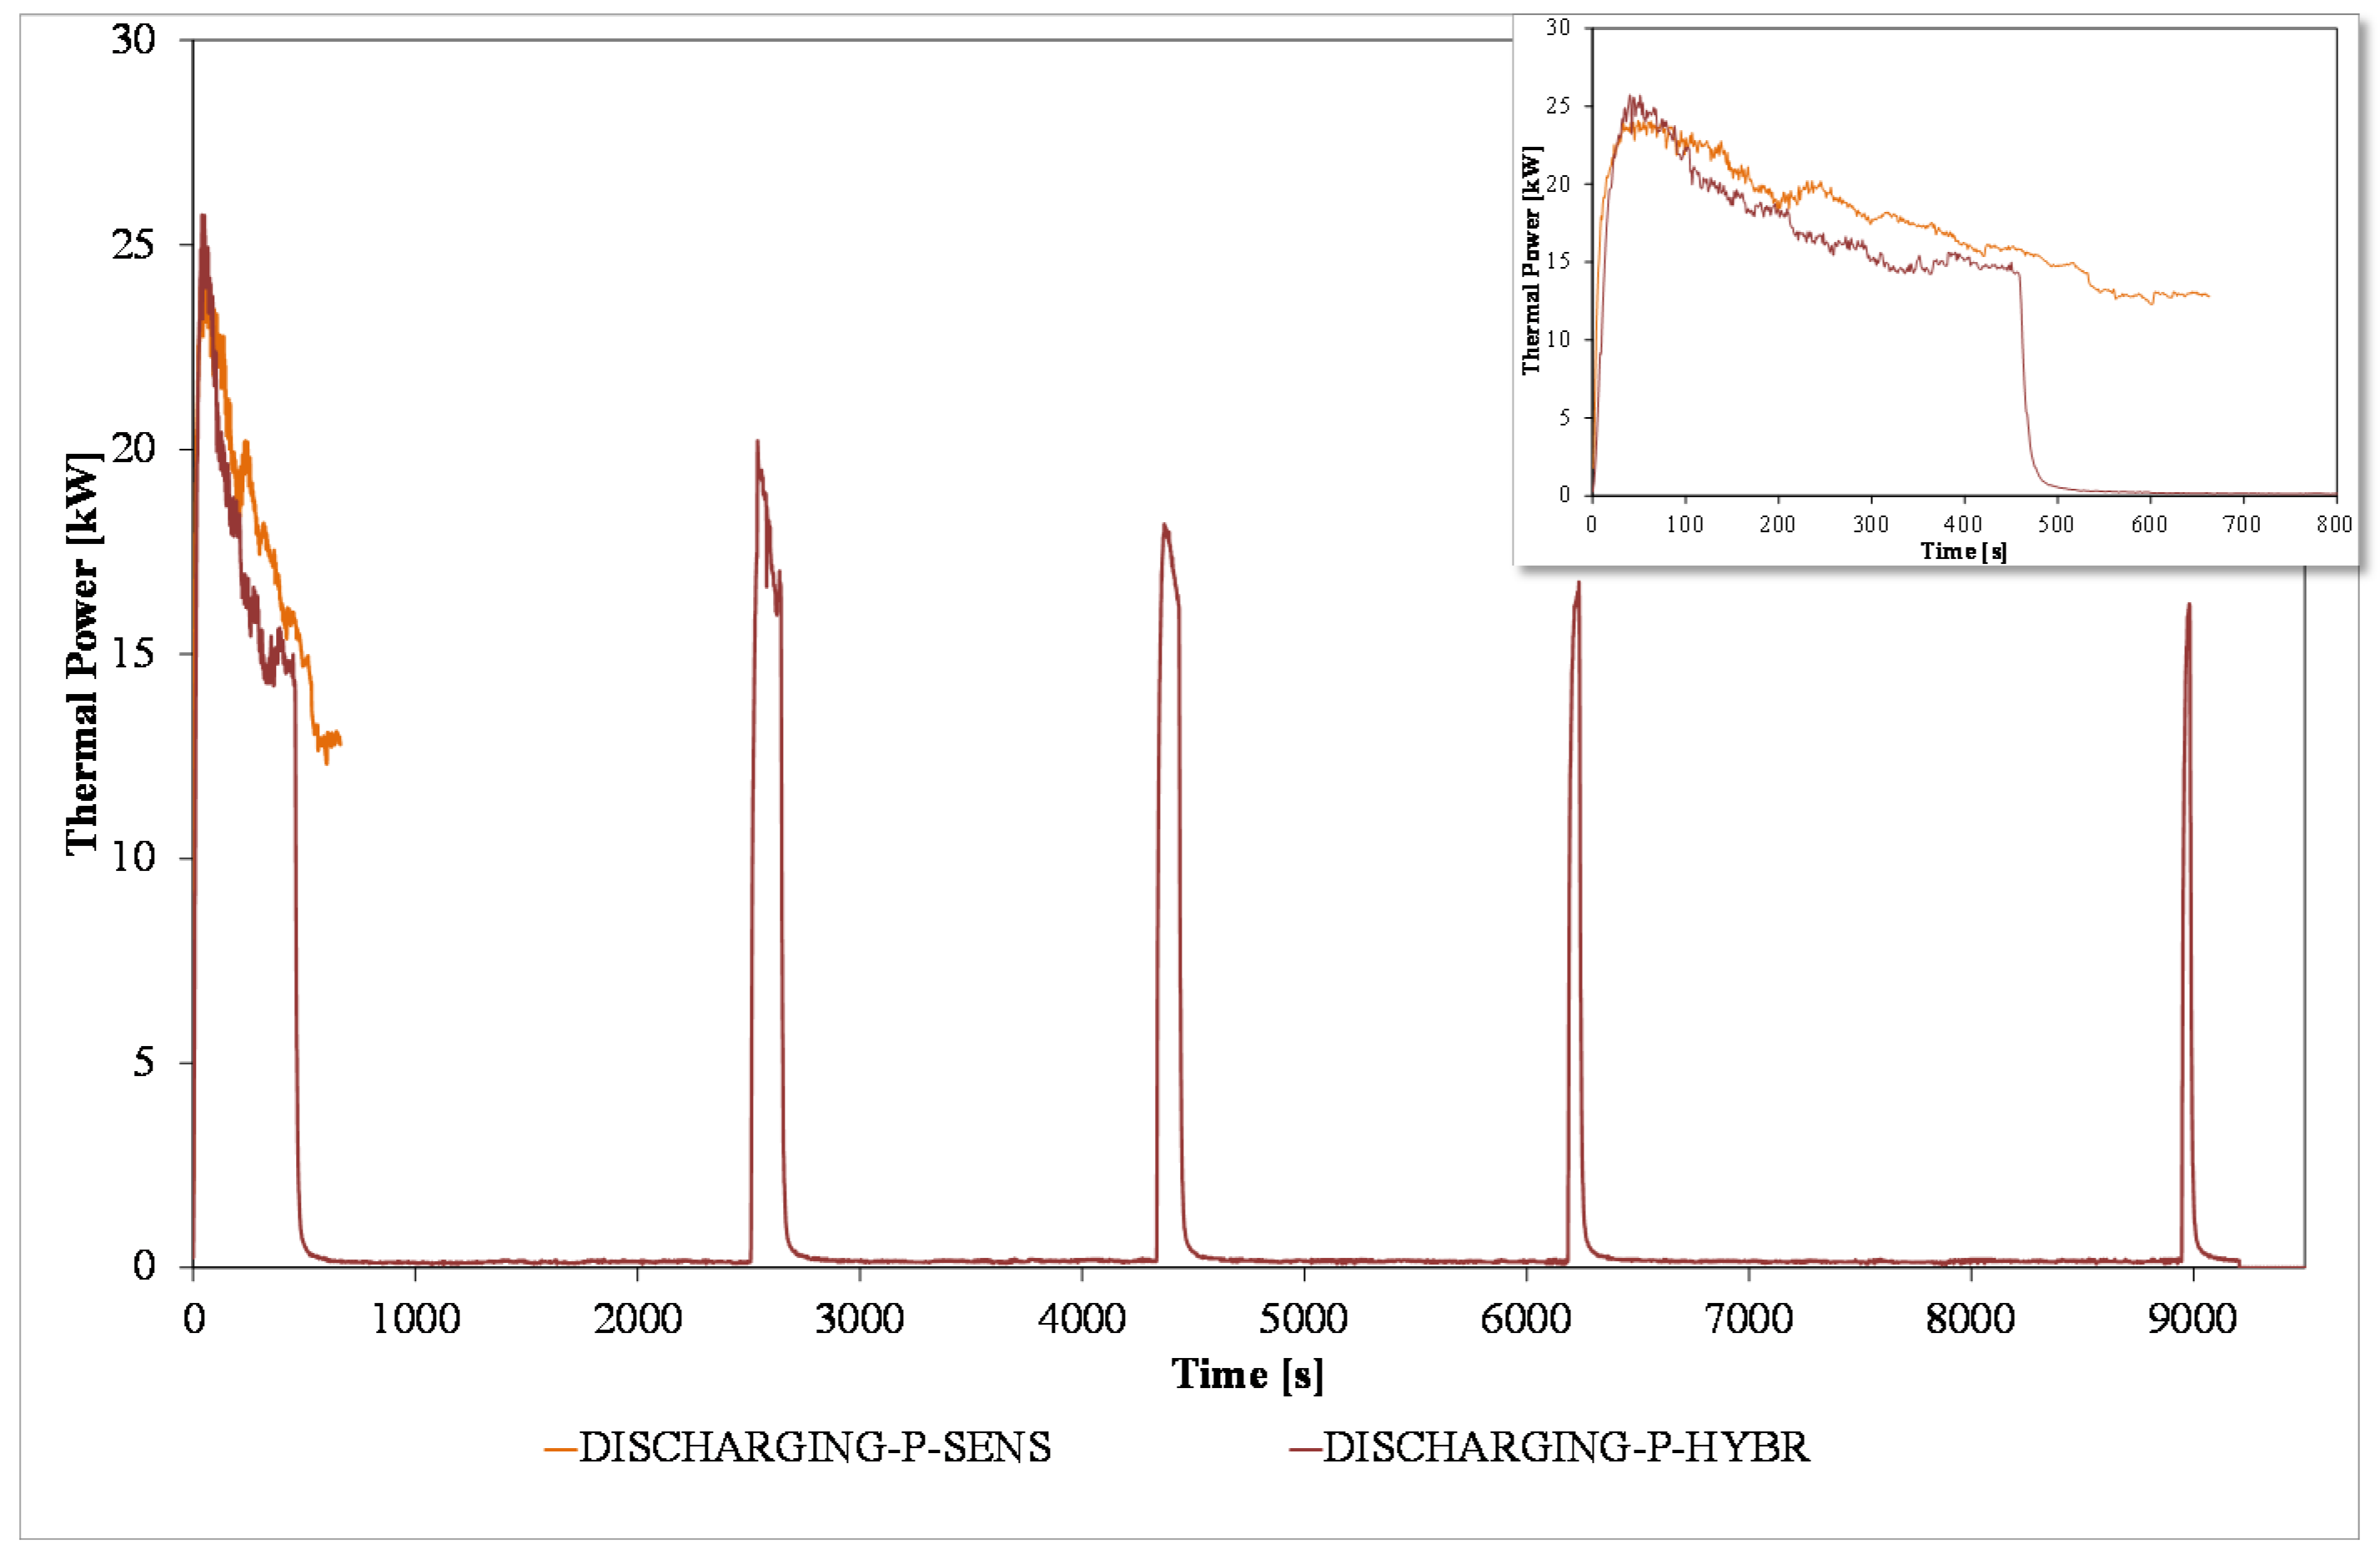
As for the case of the charging test, the discharging phase was comparatively investigated for sensible and hybrid TES under analogous conditions, namely an initial temperature of 70 °C and a flow rate of 12 kg/min. As already discussed before, during discharging phases, the parameter controlling the process is the temperature delivered to the user and the test is interrupted as soon as the temperature to the user falls below 40 °C.
Figure 7 reports the temperature evolution inside the two tanks during the discharging phases. The reported temperature sensors are representing only the temperature at different heights. Indeed, also during the discharging phase, a small gradient in the vertical direction is detected but not transversally. The obtained results reinforce the findings discussed for the charging phase. Indeed, in this case the heat transfer resistance between the water and the macro-capsules reduces the delivery of hot water during the first discharging stage. However, during the stand-by period, due to the temperature difference between the PCM and the water, a re-heating effect of the tank is achieved, which allows for the performance of further discharging phases before having fully discharged the TES. Analyzing in more detail the temperature evolutions inside the TES during the first discharging phase, as reported in the small window in
Figure 7, the sensible TES delivers hot water for a longer time than the hybrid TES; 700 s against 500 s. This means that during this stage, the discharged energy is higher for the sensible TES compared to the hybrid one. This occurs mainly because the amount of water in the sensible tank is higher than in the hybrid one and the replacing PCM is in the liquid phase, so the energy recovered during the sensible cooling down of the material is lower than the one of water, since the specific heat of PCM is almost half the one of water. Furthermore, the heat transfer efficiency is limited by the fact that, as soon as the first layer of PCM starts to solidify, the convective heat transfer inside the macro-capsules is reduced and the heat conduction through the solid PCM becomes the limiting factor, thus further reducing the overall heat transfer efficiency. Accordingly, the temperature of surrounding water drops quickly due to the heat exchange with the user. Differently, the sensible TES does not have any limitation due to internal heat transfer surface area, thus it is able to fully exploit the energy stored until the minimum temperature to the user is provided. This difference is also highlighted in
Figure 8, where the thermal power is reported. Indeed, the sensible TES discharge is about 3 kW more than the hybrid TES, which results in almost 40% more energy discharged in the first run, again in line with the higher amount of water and higher specific heat compared to the PCM. During the stand-by period, the tank was monitored. Once a plateau was reached, a further discharge was performed. The process was repeated until the hybrid TES was able to provide the required temperature to the user. This allowed, in the end, the achievement of an overall discharged energy of about 30% more than the one provided by the sensible TES. It has to also be considered that, due to the longer discharging time, the hybrid TES is also suffering of higher heat losses compared to the sensible one, as confirmed by the cycling temperature of the tank surface, as reported in
Figure 7.
4.3. Performance Indicators
In order to compare the achievable performance of the two TESs, the following performance indicators were defined:
Representing the energy provided to the user, QUSER (kJ), where tdisch (s), is the discharging time for each step; ṁ (kg/s), is the water flow rate on the user side; cp (kJ/kgK), is the water-specific heat; TUSER and TTAP (°C) are the water temperature delivered to the user and the tap water temperature, respectively.
As already proposed in [
29], an equivalent volume of DHW provided by the storage was also considered (Equation (2)) to account for the temperature fluctuation of the inlet tap water as well as the one of the
TUSER, which varies due to the inertia of the mixing valve, used to meet the expected 45 °C.
where
ρw [kg/m
3], represents the water density, considered with a nominal value of 1000 kg/m
3 in the calculations.
TUSER_NOM and
TTAP_NOM (°C) are the nominal constant temperatures delivered to the user and coming from the network, respectively. They were assumed, for the calculations, to be equal to 45 °C and 15 °C, respectively.
The average discharging power is calculated according to Equation (3), considering the different consecutive discharge phases performed by the hybrid storage configuration.
In addition, the energy dissipated towards the environment due to the natural convection was considered in the performance evaluation, as represented by Equation (4). Irradiation losses were neglected in the calculation.
where
Uloss (W/m
2K) is the convective heat transfer coefficient, considered equal to 3.76 W/m
2K, for a cylinder subjected to natural convection [
32];
Atank (m
2) is the external surface area of the tank;
Ttank and
Tenv (°C) are the surface tank temperature and environmental temperature, respectively.
Finally, the overall storage efficiency was calculated as the ratio between the energy delivered to the user and the theoretical stored energy,
QTH (kJ]), calculated by integrating the sensible and latent contribution, according to the operating temperature range and the integral storage curve of the PCM derived from the DSC analysis performed.
4.4. Performance Indicators: Results
The TES performance was evaluated according to the above described parameters, mainly varying the storage starting temperature as well as the discharging flow rate on the primary side of the plate-heat exchanger (HEX 2 in
Figure 5), as reported in
Table 3.
Figure 9 reports the obtained discharged energy and equivalent hot water volume as a function of the initial discharging temperature for both sensible and hybrid TES configurations. The effect of the flow rate is also considered.
As expected, the sensible TES shows a linear increase of the energy stored. Differently, the hybrid TES shows a higher increase of storage capacity, compared to the sensible one, for temperatures slightly above the melting temperature (i.e., from 67 °C to 72 °C) while the difference tends to decrease for higher temperatures, since the contribution of the sensible energy stored by the PCM penalizes the overall storage capacity. On the other hand, the discharging flow rate effect is negligible both for sensible and hybrid TES.
In general, it can be stated that this hybrid configuration can achieve an energy storage capacity of more than 35% more than the correspondent sensible configuration, when the charging temperature is properly selected. The energy increase is reduced to 15–20% when the charging temperature is either too close to the melting range or too high.
Similar considerations can be made for the equivalent hot water production. Interestingly, for the optimized charging temperature, the hybrid TES is able to provide 125 dm3 of hot water even if the tank itself has a volume of 100 dm3, demonstrating the possibility of strongly reducing the size of the tanks.
Figure 10 reports the obtained discharging power for both sensible (
Figure 10a) and hybrid (
Figure 10b) TES. In particular, the reported values were analyzed as a function of starting discharging temperature and flow rates.
As expected, the sensible TES is characterized by an average power linearly increasing with the initial temperature, from 15 to 20 kW. This is mainly due to the temperature gradient between the stored water and the end user. Furthermore, the delivered power is slightly higher for flow rates in the range from 11 to 13 kg/min, compared to the one achieved with flow rates from 9 to 10 kg/min. This can be justified with the increased heat transfer efficiency on the plate-heat exchanger side. Differently, the average discharging power for the hybrid TES looks almost unaffected by the initial starting temperature, with a value oscillating between 15 and 18 kW. This behavior can be justified by the “dumping” effect played by the PCM inside the storage. Indeed, the presence of the macro-capsules filled with the PCM guarantees the maintenance of a quite stable temperature of the water acting as heat transfer fluid inside the tank. Accordingly, when the temperature is lower than the melting temperature, the PCM releases heat, increasing the temperature level of the surrounding water. Differently, when the temperature is higher, since the specific heat of the liquid PCM is quite limited, the temperature decrease of the water is faster than the one obtained for sensible TES, thus bringing the hybrid TES quickly close to the melting range of the PCM itself. This effect is also highlighted by the higher power obtained by the hybrid configuration at a low starting temperature (i.e., between 65 °C and 70 °C). Indeed, under those conditions, the PCM acts as a buffer during the discharge phase, thus keeping the water inside the tank warmer for a longer time, and then maintaining the high temperature difference which guarantees a higher discharging power.
It is relevant to highlight that, despite the integration of the PCM, which increases the energy storage density of the tank, the discharging power is comparable with the sensible TES configuration, demonstrating the potentiality of this approach against the purely latent TES configurations.
Concerning energy losses, it was highlighted that, on average, the hybrid TES dissipated four times more energy than the sensible one. This is justified by the long stand-by periods, during which the hybrid configuration is re-heated, which increases the overall dissipated energy. This represents 2–3% of the overall energy stored, while, for the sensible TES, the dissipated energy is negligible.
The overall efficiency of the sensible TES ranged between 95 and 99%, since the heat losses were minimized and the system was able to withdraw almost all the energy stored. Differently, the hybrid TES showed efficiencies ranging from 80 to 93%. The lower performance can be ascribed to ambient heat losses as well as to the difficulties in extracting all the thermal energy stored inside the macro-capsules. Indeed, due to the extremely slow heat transfer rate obtained when most of the PCM is solidified, the energy cannot be transferred quickly enough to the surrounding water, thus limiting the re-heating effect.
5. Numerical Simulation
The experimental results have been used to validate two numerical models for latent heat storage. Numerical models are useful for extending the analysis to new geometries and different operative conditions. This is of particular importance when PCM is inserted into a plant network with variable tank temperatures: a wrong coupling of PCM material and tank temperature could lead to unwanted decrease of performance. Therefore, a preview of the operating modes of a water network is essential in order to optimize the thermal storage while exploiting the latent contribution. In this paper, two quite different numerical models of the tested tank have been developed. The former is a CFD model which solves the momentum, energy and phase change equations. The main scope of this model is to study the behavior of the heat-exchange phenomena occurring in the tank during the charging and discharging phases. The latter is a simplified model, implemented in the numerical code ESP-r [
33], and useful for long-term simulations which are able to compute and optimize [
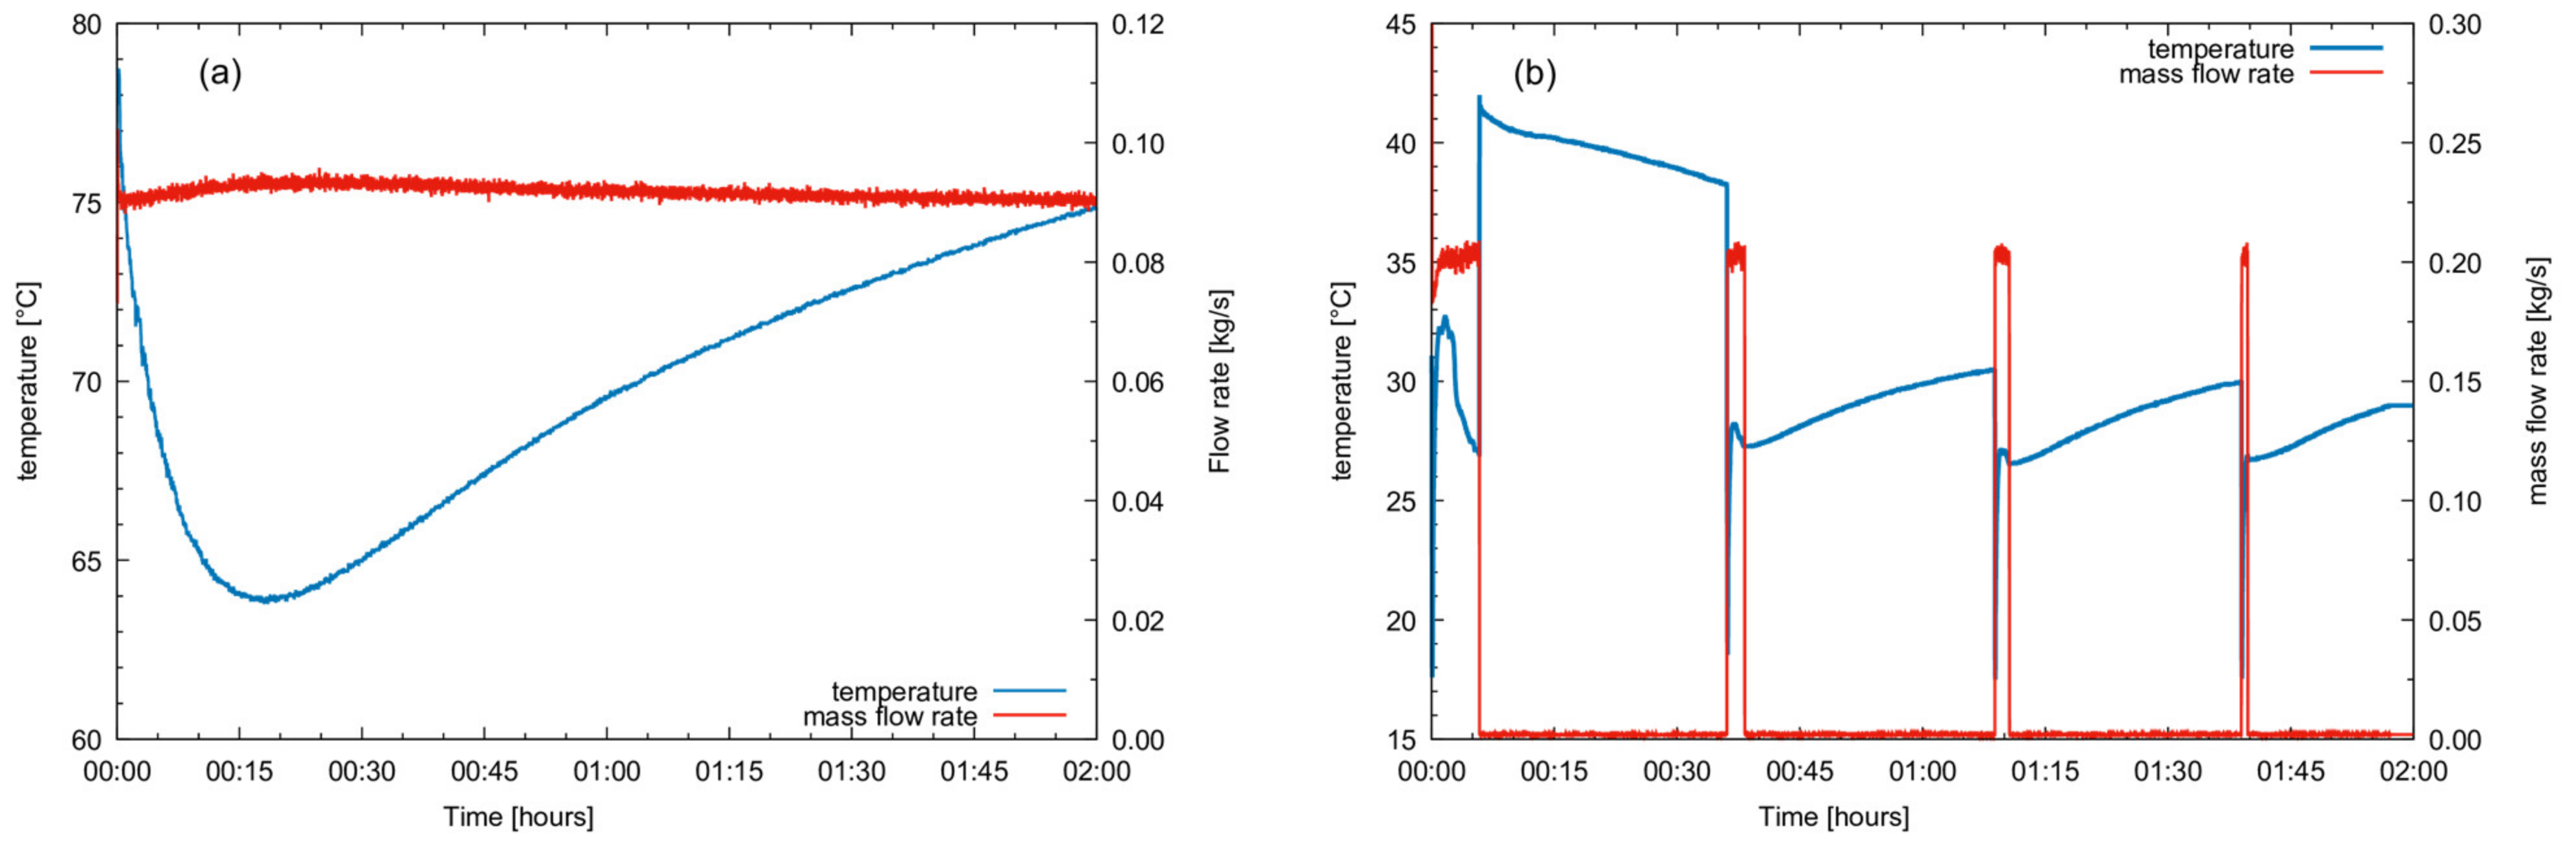
34] the performance of an entire water plant configuration. In order to validate both models, the charge and discharge tests carried on experimentally have been numerically replicated. However, in order to test the effect of the PCM bars, the simulations have been restricted to the tank component only without replicating the whole test rig, while experimental data of temperature and mass flow entering the tank have been used as boundary conditions. In this manner, the numerical models and their ability to reproduce phase-change effects can be directly validated, since the results are not affected by other possible modelling errors related to other components such as heat exchangers or mixing valves. In the following, the results obtained for the charging phase and the discharging phase have been replicated and compared using the two approaches. For the charge phase, the hot water is injected into the lower inlet port and exits from the top; this accentuates the mixing of the hot and cold water into the tank. During the discharge phase, the cold water is injected in the upper inlet port, while the water exits from the bottom outlet. In both cases, the water-mixing occurs with reduced tank stratification. The inlet water temperature and mass flow rates are presented in
Figure 11a for charge and
Figure 11b for discharge.
5.1. CFD Model
The first numerical approach presented here is a CFD numerical model. The scope of the simulation is to acquire a better insight into the behavior of the system, highlighting the phase-change phenomena of the PCM bars and their interaction with the water inside the tank. The model has been developed using the commercial code Fluent and exploits a porosity enthalpy model [
35] implemented into the code. In order to take into account the gravity effect, the Bousinnesq approximation was used for the water in the tank and the PCM, which fills the bars. The simulation parameters for the simulation are reported in
Table 4.
5.1.1. Enthalpy Porosity Model
The model features an enthalpy porosity method, in which the phase change occurs in a mushy zone considered as a porous media where the porosity is considered equal to the liquid fraction
. In the model a source term
S Equation (6) is added to the momentum equation.
where
Amush is a constant fixed to 10
−6 following [
37] and
is a small number to avoid division by zero. The source term is zero when the liquid fraction is equal to 1 and assumes a high value when the liquid fraction is 0 and the material is all solid, so the velocity becomes zero. The energy equation is written in terms of enthalpy as
while the enthalpy is computed as the sum of specific enthalpy and latent heat,
where
L is the latent heat and the liquid fraction
varies between 0 and 1 as:
Tl is the temperature at which the PCM starts to liquefy and
Ts the temperature at which the material starts to solidify. A linear dependence between
α and
T is considered along the range.
5.1.2. Numerical Model
The calculation was performed using ANSYS Fluent software with the pressure base solver and SIMPLE pressure coupling algorithm. Fluent uses a cell-centered control volume and momentum and energy equations have been solved using a second-order upwind scheme to obtain second-order accuracy. The convergence criteria for the continuity and velocity equations were set to 10−4 and 10−9 for energy equation. The solution is time dependent; using an implicit second-order scheme with a time step of 0.1 s for integration, laminar flow was considered.
CFD models are characterized by long simulation times and high CPU use, therefore only half of the tank has been simulated. However, since the geometry of the tank is not symmetric, the model does not reproduce the experimental setup exactly, nevertheless, since a mixed tank was expected, this did not affect the overall results. Since the model represents only one half of the tank, the mass flow rates presented in
Figure 11 have been halved both in charge and discharge tests, while leaving the inlet temperature unaffected.
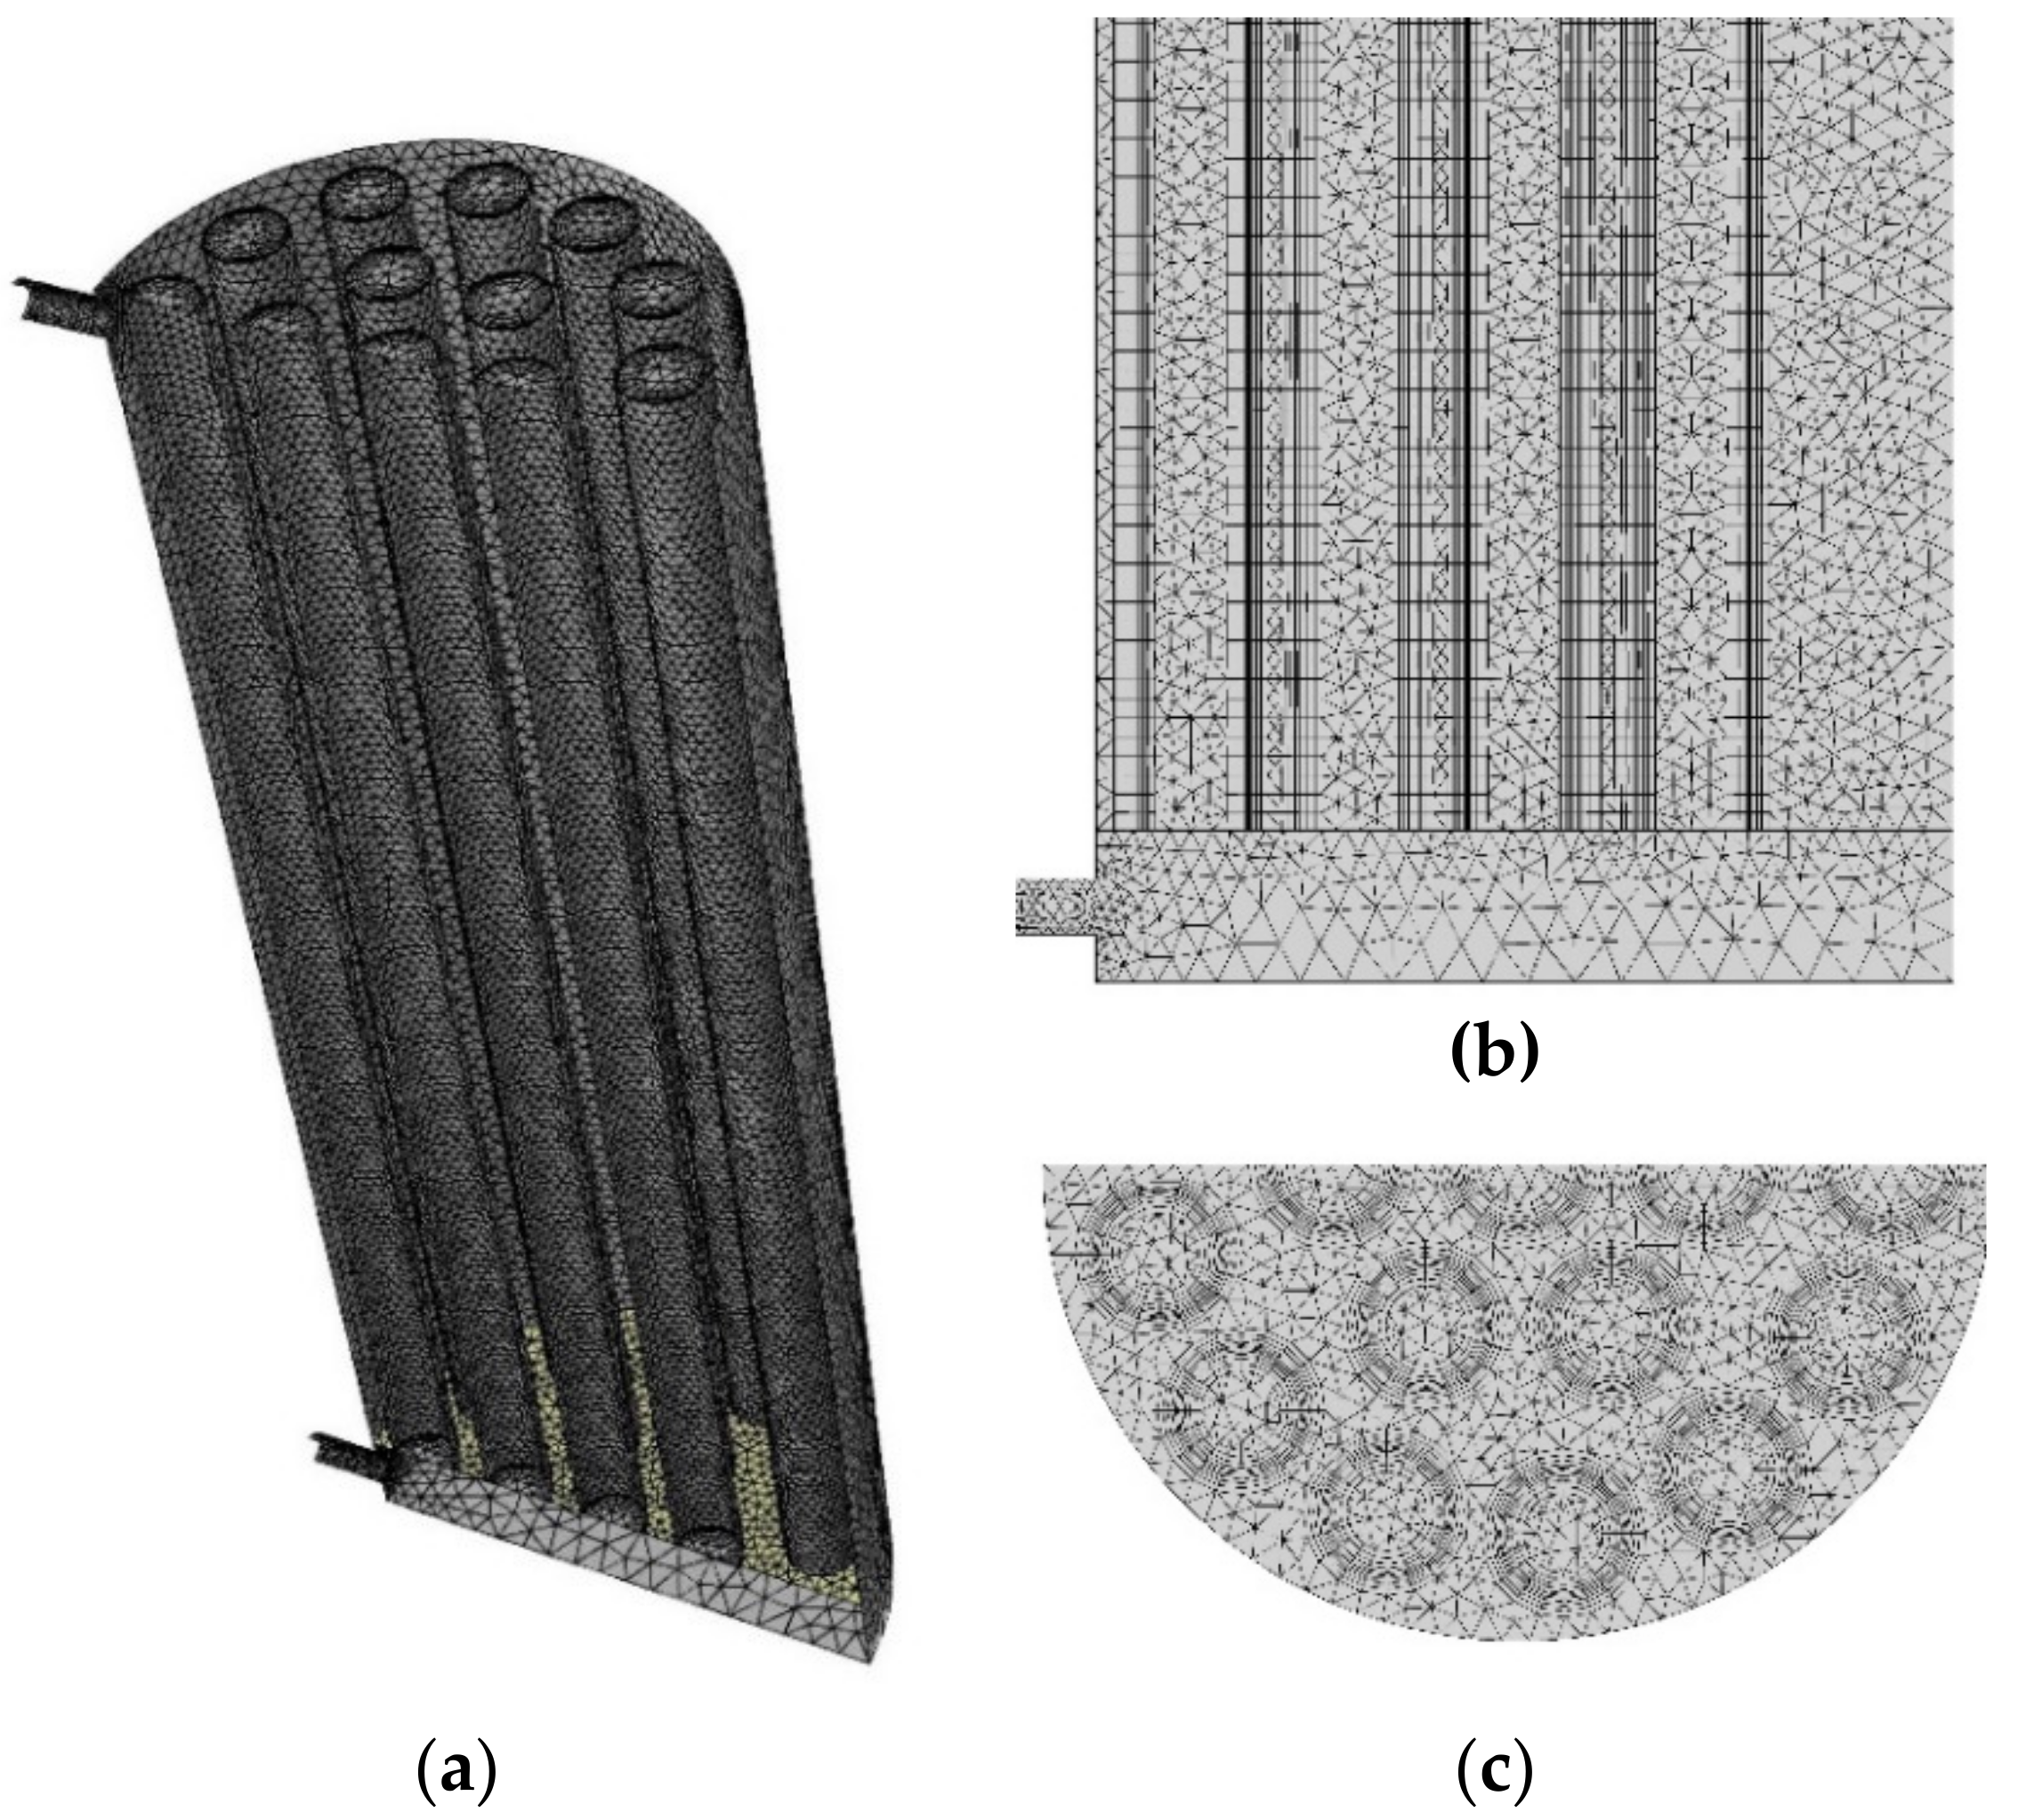
Figure 12a presents the geometry of the tank with the PCM bars and the top wall hidden, while
Figure 12b shows the grid at the bottom of the tank with the inlet plenum and
Figure 12c shows the grid on an horizontal plane at the mid height of the tank. The finite volume grid is made of tetrahedral cells with inflated prismatic cells on the interface between water and PCM bars, as can be seen in
Figure 12c. The grid features 1,162,501 cells with 2,698,076 faces and 437,748 nodes. The simulation required nearly 12 days to simulate the discharging test on a workstation with an Intel Xeon processor and twelve cores using a 0.1 s time step.
5.1.3. CFD Simulation Results
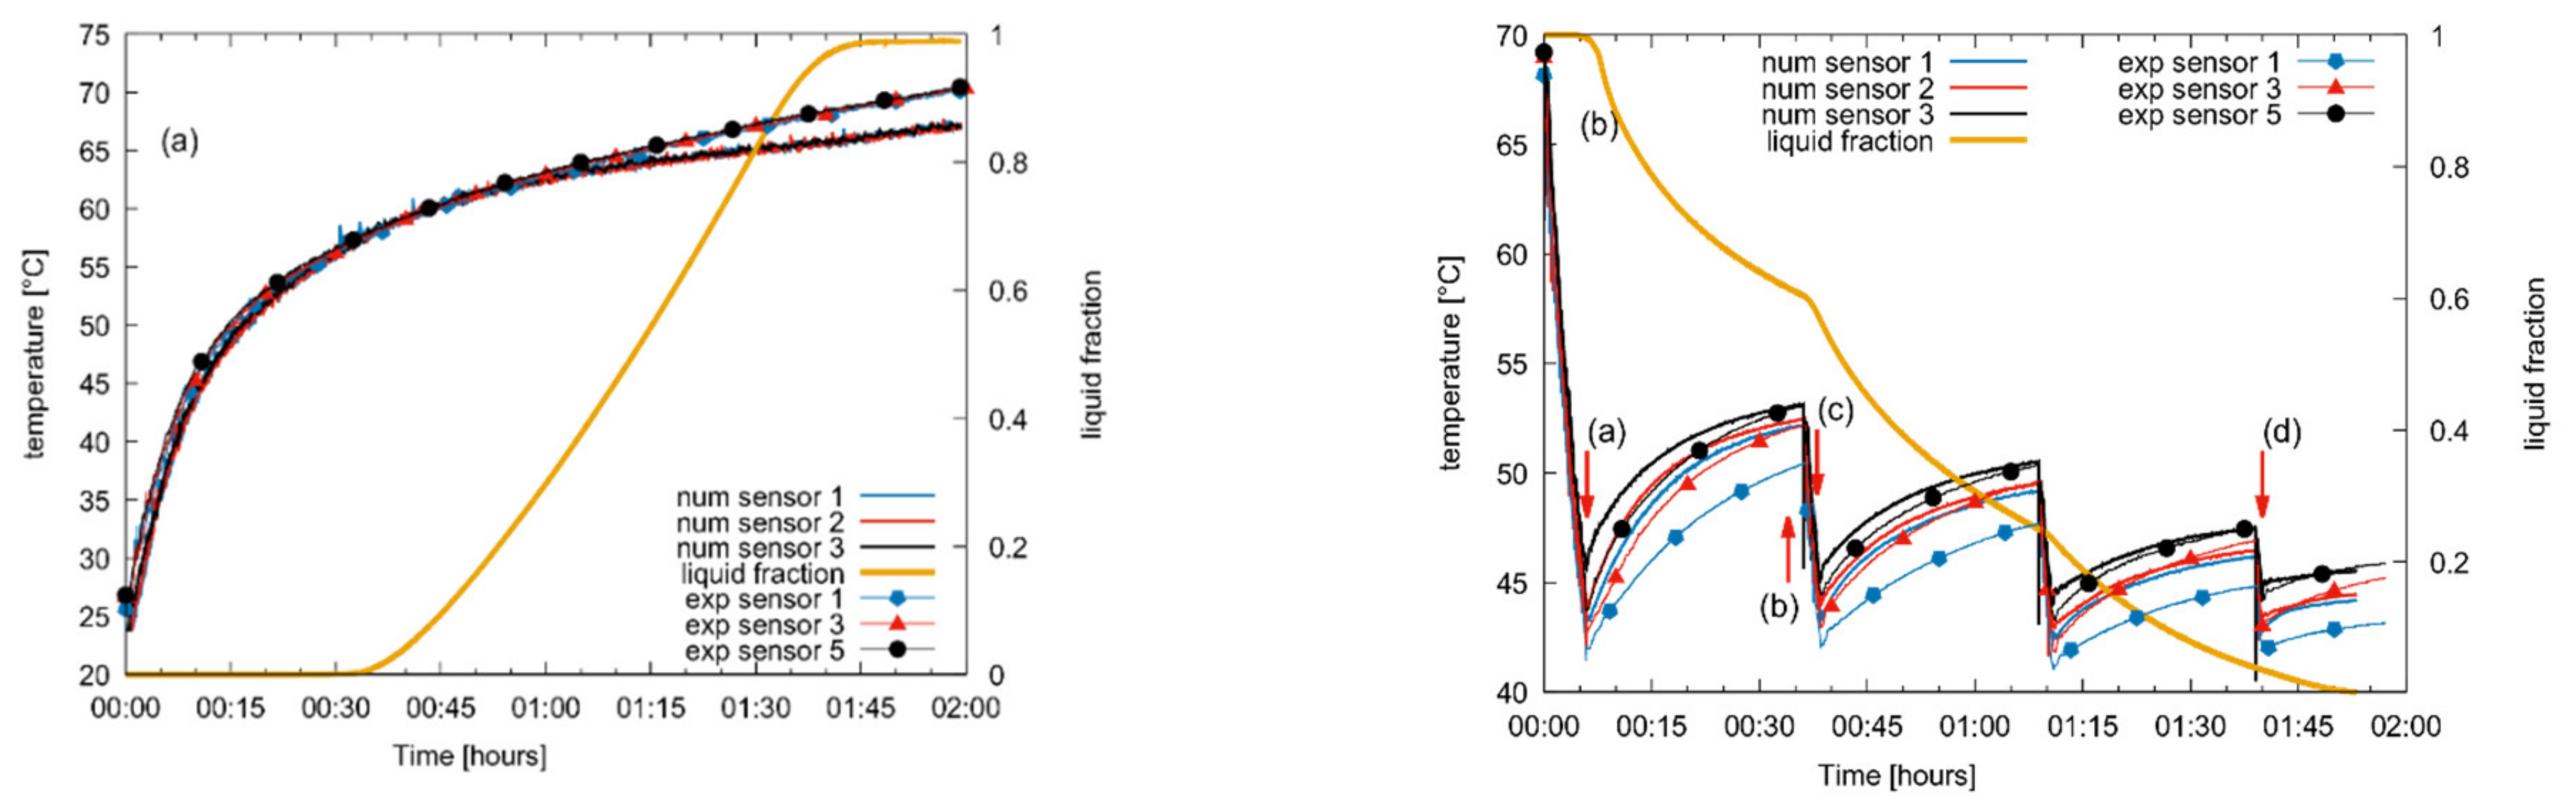
Figure 13 reports the results obtained with the Fluent model. In this case, the results confirm the perfectly mixed behavior during the charge phase as reported in
Figure 13a, however,
Figure 13b shows some stratification during the reheat phase, as observed by the experimental test.
Figure 13 also reports the global value of the liquid fraction to correlate temperature evolution with PCM phase change. During the charge phase the model can accurately predict the temperature increase in the tank for up to one hour; afterwards, the temperature increase is slightly lower, reaching a temperature 3 K lower than the experimental one at the end of the heating case. During the discharge phase (
Figure 13b), stratification can be identified, and the results are quite similar to the ones obtained by the experimental setup. This also highlights that in a perfectly mixed water tank, the PCM bars trigger the water stratification during a reheat phase. The numerical results are in accordance with experimental results with similar temperatures after the reheat phase. The temperature differences between numerical sensor three and experimental sensor five at the end of the reheat phase are −0.045 K, 0.109 K and −0.11 K respectively at the end of the first, second and third reheat phase. For the other sensors, the highest difference is between numerical sensor one and experimental sensor one at the end of the first reheat with a difference of 1.82 K.
Figure 14 reports the temperature distribution on the symmetry plane of the tank during the discharge phase. The timings of the distribution are also reported in
Figure 13b. The temperature of the water of the tank decreases during the first discharge phase, as reported in
Figure 14a, but the PCM bars are still at a higher temperature and the PCM is in the liquid phase due to the low conduction of the PCM. During the first standby phase (
Figure 14b), the PCM bars reheat the surrounding water but the PCM remains in the liquid phase. However, after the second discharge period (
Figure 14c), the water reaches a lower temperature and the PCM bars show a higher temperature, thus the phase-change phenomena occur. After the last discharge phase (
Figure 14d), the PCM bars show a lower temperature, and the PCM has nearly completed the solidification, losing the possibility to reheat the water again. The evolution of liquid fraction inside the PCM bars during the discharge phase can be observed in
Figure 15, referring to the time evolution reported in
Figure 13b. After the first discharge, the bars are still in the liquid phase, and the PCM solidifies during the reheat phase. At the end of the last discharge phase, the PCM is almost in a solid state with a higher temperature than the water inside the tank, which still allows a slight reheating of the water.
5.2. ESP-r Model
Although the CFD model allows an interesting insight into the performance of the latent heat storage, it is not a viable solution for the study of complete plant systems. For this purpose, simplified models are usually employed, such as in references [
34,
38] where an ESP-r component has been specifically developed. For a further validation of the developed model, the charge and discharge tests have been replicated.
5.2.1. Numerical Model
The numerical approach has already been presented in references [
34,
38] and is based on an enthalpy formulation to solve the Stefan problem. Liquid and solid phases are replaced by a single equation, Equation (11):
The formulation is valid for both liquid and solid phases and includes the Stefan heat-balance condition at the interface.
Equation (11) is discretized using a 2d axisymmetric grid and solved at each time step. The PCM bars exchange heat with the surrounding water. However, an improvement has been introduced to the scheme by adding the thermal resistance of the polyethylene encapsulating the PCM. After computing the convective-heat-exchange coefficient [
34], a global-heat-exchange condition referring to the internal diameter is computed using Equation (12):
where the internal radius of the PCM bar is computed as:
where
s represents the thickness of the PCM-encapsulating bars,
re the external radius and
λ the conductivity of encapsulating material. The global coefficient is applied as a boundary condition to the lateral surface of PCM bar discretization. On the upper and lower faces of the PCM bars, the simple one-dimensional global-heat-exchanger condition, Equation (14), is considered.
The container has been easily added to the discretization.
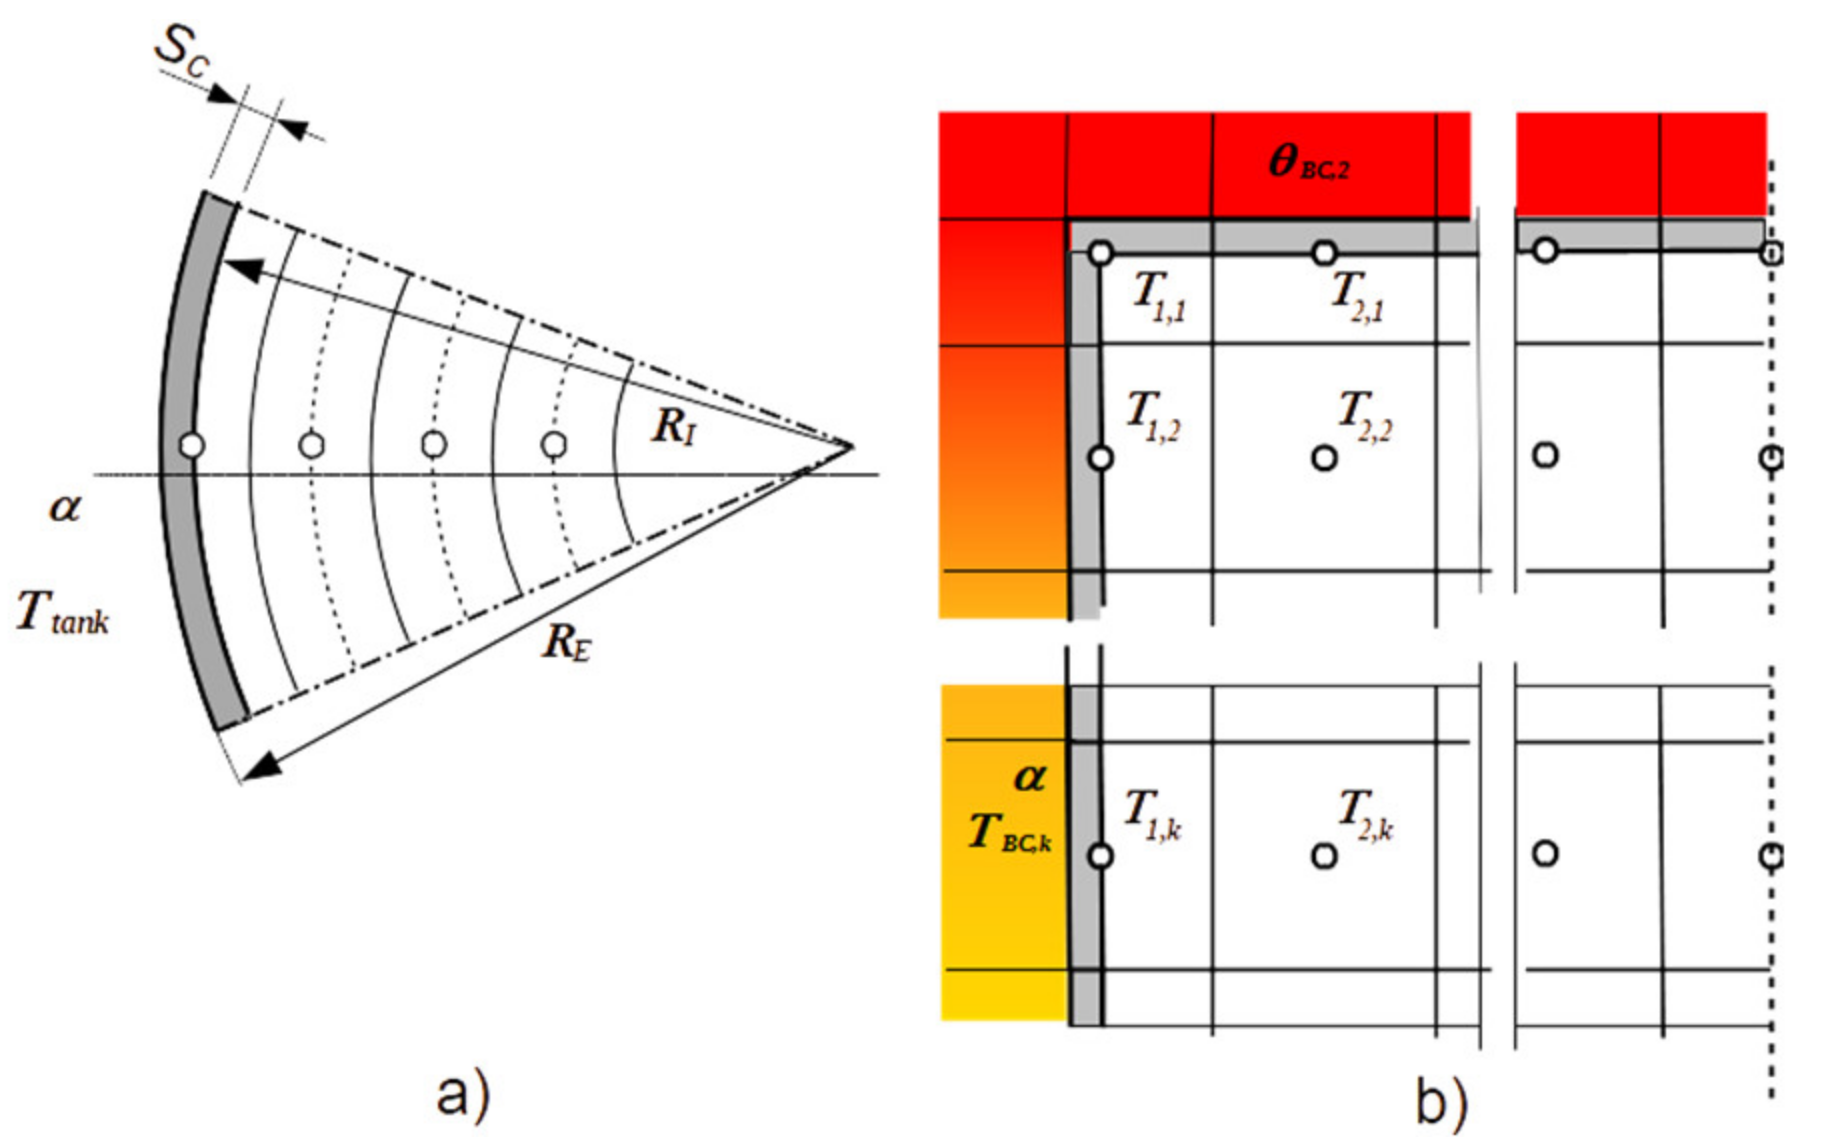
Figure 16 presents the numerical grid of the PCM module, highlighting the discretization of the element at the boundary where the encapsulating material is highlighted.
In this paper, an explicit formulation has been used to solve Equation (11). The discretization of boundary cells must take into account the presence of the encapsulating layer, as presented in Equation (15) where the boundary flux, computed in Equation (16), takes into account relations reported in Equations (14) and (12). The mismatch between the PCM bar discretization and the axial discretization of the water tank has been treated as suggested by Padovan et al. [
34], introducing a mean water temperature boundary condition in correspondence to the grid of the PCM bar discretization as presented in
Figure 16.
5.2.2. Simulation Results
Hybrid TES has been discretized with 20 layers in a vertical direction. The PCM bars have been divided with 20 layers in a vertical and 16 in a radial direction. A finer discretization obtained by increasing the number of layers did not change the results.
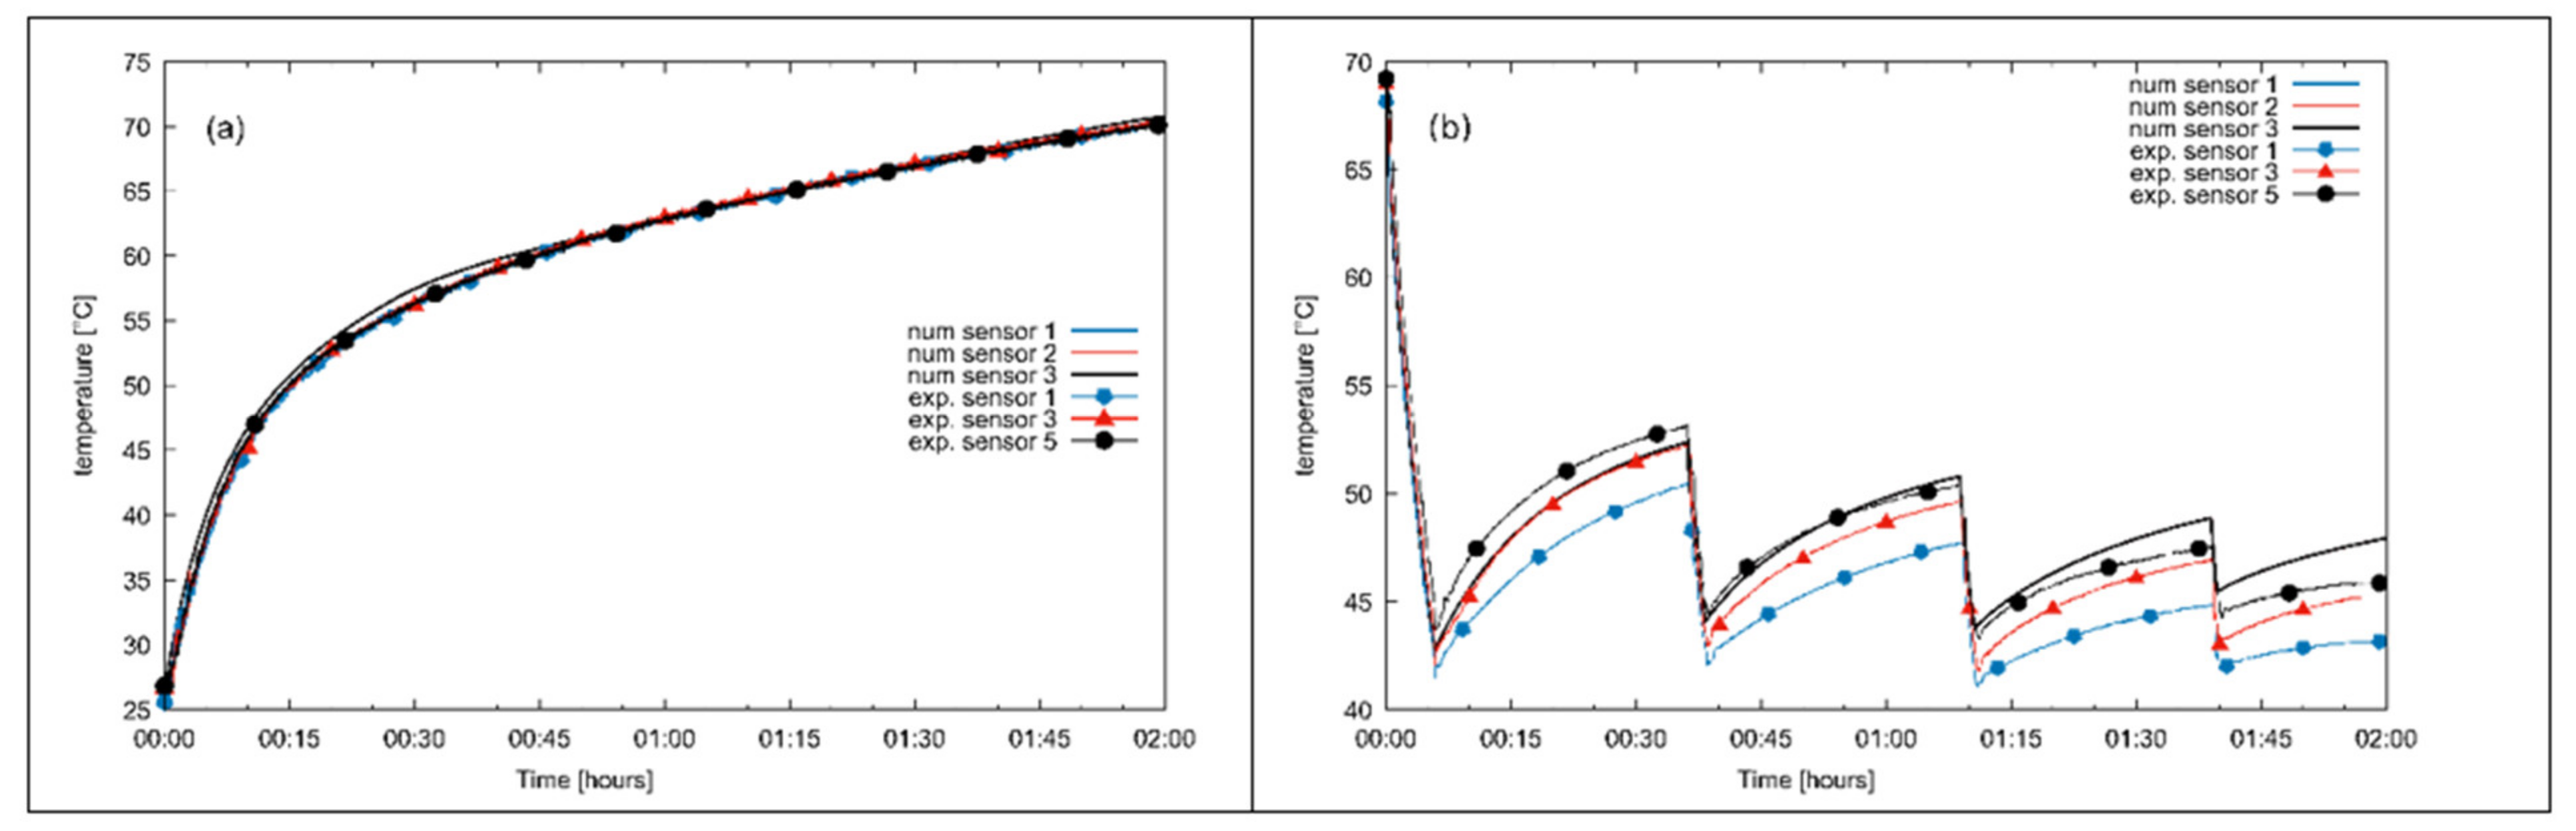
The ESP-r model has some limitations that must be considered when comparing the results with the experimental ones. The original ESP-r tank model features a mixing algorithm, in which the tank layers are mixed if one layer features a temperature higher than the upper ones. The mixing occurs at each simulation time step, with a bottom hot water or upper cold-water injection, the model considers the tank perfectly mixed and no stratification occurs. This can be seen by inspecting
Figure 17. For charging test the numerical results follow almost completely the experimental results, as presented in
Figure 17a. It can be noted that also the experimental result shows a perfectly mixed tank, since the measures of sensors are not distinguishable from each other. The discharge phase is presented in
Figure 17b. While the experimental results show a strong stratification during the reheat phase for all sensors, the results with ESP-r show a stratification for sensor three only, while sensors one and two always show the same temperature. However, the profile of numerical sensors follows the experimental sensor evolution in the first reheat period almost perfectly, while it is slightly higher in the second and third reheat period. Furthermore, it appears that the water tank during the experiments always attains lower temperatures at the end of the discharge period. However, the numerical simulation always considers a fully charged tank at the beginning of the discharge, with PCM bars at the same initial water temperature. However, this could be not true with an initial stratification in the tank and especially into PCM bars, which could affect the subsequent reheat phases.
5.3. Numerical Simulation Results Discussion
The numerical models developed demonstrate that the experimental results could be replicated with quite good results using the two methods, however, with strong differences. The ESP-r model is a simple solution with some limitations in describing the heat-exchange and phase-change phenomena. The stratification model adopted does not allow for the replication of the stratification in the reheat phase, but it is fast and requires very few computing resources. Furthermore, the discretization of the tank is considered in an axial direction only, while the Fluent model discretizes the bars with a full 3-d grid. An additional difference is that the Fluent model simulates the PCM bars also considering convective effects due to buoyancy when the PCM is in liquid phase, while the ESP-r model solves an axisymmetric two-dimensional conduction problem only. The ESP-r model solves the conduction problem considering only one bar, since the model does not consider a radial distribution inside the tank, while the Fluent model considers each bar independently from one other.
The numerical models are quite different from each other, and they are both useful, but for different scopes. ESP-r is fast and can be inserted in whole-plant models, while the Fluent model, on the contrary, can detect different phenomena that better replicate the experimental results. However, the computing resources and the time required hinder the possibility for simulating whole-system plants with PCM-enhanced tanks. However, the information made available to the researcher can provide valuable information for understanding the heat exchange process with phase change.
6. Conclusions
The possibility of enhancing the energy efficiency of ships (e.g., cruise ships) by recovering waste heat for potable hot water delivery, especially during docking phases, is currently hindered by the limited volume availability on board to install sensible hot water storage. This paper investigated a novel hybrid sensible/latent thermal energy storage configuration, which was capable of increasing the energy storage density by maintaining a high-power delivering capability. According to the expected boundary conditions, a commercial PCM with a nominal melting temperature of 58 °C was selected. The driver criterium was the maximization of the volumetric energy storage density, thus a salt hydrate mixture was selected, and its stability analyzed experimentally, confirming good stability with a slight subcooling effect. The designed storage implemented, in a 100 dm3 vertical cylindrical tank, up to 20 cylindrical PCM macro-capsules, summing up to 40 dm3 of PCM. The designed tank was then tested under controlled boundary conditions in the lab, by means of a testing rig, mimicking the operating conditions that could be found on board of a ship, in terms of charging and discharging temperature. The results showed that the hybrid TES maintains a discharging power comparable with the sensible TES, with an overall storage density of up to 35% higher. This behavior is due to the ability of PCM macro-capsules to reheat the surrounding water during stand-by periods, due to the slower reaction of the encapsulated PCM. In order to better investigate the operation of the TES, two numerical models were also developed and validated. Both models were tested against the experimental results and demonstrated to be capable of reproducing the main features of the charging and discharging modes of the hybrid TES. The first model has been implemented in Fluent and allows an insight into the phenomena involved in the heat exchange between the water and PCM macro-capsules. It was capable of reproducing the thermal field inside the TES during the stand-by periods, allowing an appreciation of the phenomenon of water reheating with thermal stratification. The second model is an ESP-r component plant system, and despite the simplifying assumptions being reproduced perfectly, the charging of the TES and the main features of the discharging were well represented, with the reheating effect during the stand-by periods, but with less thermal stratification. However, the model rapid execution times allows the insertion of the component into a plant network for carrying on simulations and optimizations of the performance of a whole system featuring hybrid TES.
The presentation of both experimental and numerical results with different operating modes confirms that the use of a TES with PCM macro-capsules can represent an option for increasing the heat storage on board of ships while limiting the required space.


 ,
, 


