Article

Pitfalls of Using Biomarker Maturity Parameters for Organic Matter Maturity Assessment Suggested by Coal Hydrous Pyrolysis

1
School of Energy & Resources, China University of Geosciences, 29 Xueyuan Road, Beijing 100083, China
2
Department of Geoscience, University of Calgary, 2500 University Drive NW, Calgary, AB T2N 1N4, Canada
*
Author to whom correspondence should be addressed.
Energies 2022, 15(7), 2595; https://doi.org/10.3390/en15072595
Submission received: 26 January 2022 / Revised: 10 March 2022 / Accepted: 25 March 2022 / Published: 2 April 2022

Abstract

:
Crude oil maturity assessment is a vital goal for petroleum geochemistry, and equally important is the exploration of maturity indicators of sufficient credibility. While most molecular proxy parameters have been extensively used and have provided some useful insights; the component ratios approach is somewhat limited in validity regarding oil maturity characterization for variable reasons. Novel thermal trends of hopanes and steranes were observed in a series of hydrous pyrolysates of an immature coal (0.49 %Ro) generated at eight target temperatures ranging from 250–375 °C (measured vitrinite reflectance of 0.71–0.91 %Rm), which–further substantiated this idea. Expelled oil and extractable bitumen were combined as the total soluble organic material (tSOM) for each pyrolysis experiment to mitigate the effects of primary expulsion fractionation. While bitumen extracted from the original coal—the 250 °C tSOM—the 275 °C tSOM (0.49–0.73 %Rm) sequence recorded normal increases in C31 αβ-hopane 22S/(22S + 22R) and decreases in C29–C30 βα-moretane/αβ-hopane ratios, low values and continuous decreases in C29 5α-sterane 20S/(20S + 20R) and ββ/(αα + ββ), Ts/(Ts + Tm) and C29Ts/(C29Ts + C29 αβ-hopane) suggested no biomarker thermal isomerization but predominant control from precursor-to-biomarker transformation. Continuous increases in 22S/(22S + 22R) until 1.43 %Rm accorded with thermal isomerization, but a delayed ratio equilibration at 1.43 %Rm again suggested biomarker precursor interference, which also played a role in the reductions in 20S/(20S + 20R) and ββ/(αα + ββ) to 0.9 %Rm, whereas increasing and high values of C29–C30 βα-moretane/αβ-hopane ratios occurring during 0.73–1.43 %Rm. Reversals in 22S/(22S + 22R) and fluctuations in 20S/(20S + 20R) and ββ/(αα + ββ) at elevated maturity levels with minimum yields of biomarker precursors were predominantly controlled by differential isomer degradative rates. These rarely reported thermal distribution patterns of biomarkers illustrated very complicated biomarker generation–destruction processes during maturation and suggested that the release of bond biomarker to the free status may govern the biomarker maturity ratios rather than thermal isomerization. While the rapid heating conditions and high temperatures in pyrolysis differ inevitably from natural evolution under geological conditions, our study unveiled that unusual biomarker ratios in geological samples could be the norm, contradictory to common beliefs. Accordingly, we propose that isomer concentration is an essential tool to validate maturity estimation of organic matter by isomer ratios, especially for highly mature oils and sediment extracts.

1. Introduction

Numerous molecular ratios derived from component relative abundance of saturated and aromatic hydrocarbons have been used to monitor oil and source rock maturity [1,2,3,4,5,6]. However, the correlations between these molecular ratios and the corresponding maturity level of the equivalent bitumen (petroleum) in the source rocks were largely empirical relationships and no universally consistent scale of correlation could be established. Molecular parameters failed to constrain geothermal history or assess oil maturity, because multiple processes including petroleum generation and expulsion as well as component transformation, dilution, and destruction, were involved from early diagenesis through the oil generation window [7]. Meanwhile, the geological processes that determine the values of these parameter ratios commonly involved several non-maturity-related factors such as organofacies variations, which, for example, were partly responsible for the spread of terpane and sterane isomerization ratios often seen in samples even at the same stratigraphic maturity level [8,9]. Although commonly displaying low values at an immature stage when biogenic gas was generated [10,11], biomarker maturity ratios at this stage could be altered by microbial reworking of organic matter [12] or were often related to carbonate-developing and hypersaline sedimentary environments [13], in either case showing no relevance to the maturity level.
In a normal case when thermal effect was the dominant control, the R to S isomerization at hopane C-22 and sterane C-20 chiral centers and the α(H)- to β(H) epimerization on the ring structures resulted in increases in the more-over-less stable biomarker isomer ratios with increasing temperature/burial depth in artificial heating experiments/natural maturation sequences [14,15,16]. These processes were initially explained by biomarker thermal isomerization and used to derive the hopane and sterane isomerization ratios for organic matter maturity assessment [17,18]. Later studies reported abnormal depth trends of biomarker isomer distribution that failed to be explained by direct isomerization and accordingly proposed differential thermal generation and degradation rates of isomers differing in thermal stability [19,20]. Furthermore, consecutive (e.g., ββ to βα to αβ conversions of the C30 hopane) [21,22], parallel (isomerization of free and bound biomarkers) [1,23,24] and competing (e.g., isomerization, aromatization and destruction) [25] reactions and multiple biomarker contributors (kerogen, bitumen, existing stereoisomers) of hopane and sterane were confirmed to have been involved in biomarker thermal evolution (e.g., [22,26,27]). These collectively suggested the great complexity in biomarker thermal behavior and the uncertainty in the interpretation of biomarker maturity ratios for organic matter maturity assessment. Direct use of the biomarker signature captured in highly matured samples without deep understanding of biomarker evolution from immature to overmature stages would easily result in misinterpretation and confusion. For instance, Chen et al. [28] noted poorly isomerized C29 steranes in some solid bitumen from the Neoproterozoic and Paleozoic source rocks in the Sichuan Basin where all oil had completely cracked to gas. However, their interpretations for such biomarker distribution in solid bitumen were internally inconsistent and confusing, and conflicted with the geochemical literature because the origins of the observed biomarkers had not been verified [29]. Although causes for abnormal biomarker thermal distributions remained ambiguous in existing literature, biomarker isomerization ratios have remained as standard maturity indicators for source rocks and oils in the past decades. However, the validity of biomarker component ratios as maturity indicators might be case-specific, and at least their interpretation should be cross-validated by complementary maturity assessment tools before any conclusion could be drawn.
To gain a better understanding of biomarker thermal behavior and elucidate the controlling factors, hydrous pyrolysis of organic matter (e.g., coal, shale, bitumen, and kerogen) was widely adopted to mimic natural maturation of organic matter by compensating time with temperature [30]. This method was widely applied to study hopane and sterane origins and build kinetic models to describe isomer thermal evolution [24,26]. However, the artificial heating experiments frequently generated divergent results from natural maturation [9,31,32]. Anomalies such as reversals in hopane and sterane isomerization ratio trends and lagged biomarker generation and destruction were reported in the artificially mature samples. Such anomaly was observed in natural cases associated with igneous intrusion generating much stronger-than-normal geothermal regimes [20,27]. Nevertheless, pyrolysis has remained by far the most favorable method for investigating biomarker thermal evolutions due to its affordable timescale and a thorough harvest of both bound and free biomarkers without changing the isomerization patterns dramatically [33,34,35,36].
To raise awareness of the risks of the common use of biomarker maturity ratios without sufficient validation, this study conducted hydrous pyrolysis of aliquots of a coal sample to a broad maturity level range corresponding to a measured vitrinite reflectance (Rm) range of 0.49–1.91%, followed by thorough delineation of hopane and sterane isomer concentrations and ratio trends. Novel biomarker distributions were reported, which suggested an absence of the common link between biomarker maturity ratios and maturity level. Additionally, the driving factors behind the abnormal biomarker maturity trends were investigated, and alternative maturity indicators were proposed as a validator for the biomarker maturity ratios regarding maturity level interpretation. Contrary to common beliefs, our results indicated that unusual distribution of hopanes and steranes inconsistent with maturity level could be the norm in geological samples and have occurred more commonly than reported. Thus, we caution the single use of biomarker ratios for maturity and/or organic matter input interpretation.

2. Samples and Analytical Methods

A block of immature coal sample was collected from a fresh operating surface of the Beishan Coalfield outcrop, where the most coal-proliferous Middle Jurassic Xishanyao Formation occurred. This formation features predominant terrestrial sedimentary facies, including fluvial, delta, and lacustrine shore, and mainly developed organic matter abundant in higher plant materials [37]. The Beishan Coalfield locates at a topographical elevation of 676 m, eastern Junggar Basin, Xinjiang Province, NW China (44°31′47.7″ N, 90°21′57.3″ E) (Figure 1) [38]. There developed eleven coalbed layers with an accumulative thickness of 68.29 m. These coal samples are generally black, highly fragile, light in density, and dominated by lignite with occasional sub-bituminous coal laminae, suggesting a brown coal rank.
Petrographic analysis was performed on a 10 g bulk of the original coal for maceral composition characterization and vitrinite reflectance measurement, followed by Soxhlet extraction. This Soxhlet extract fraction from the original coal without heating was referred to as the original bitumen (OB) throughout this manuscript. Another 76 g block of the original coal sample was crushed to 10–15 meshes to mitigate matrix heterogeneity, before it was divided to eight aliquots close to 10 g each and remolded to eight coal cylinders 35 mm in diameter. Hydrous pyrolysis was performed on these coal cylinders to eight different terminal temperatures, followed by Soxhlet extraction and a subsequent petrographic analysis of the post-extraction residual coal for vitrinite reflectance determination.

2.1. Petrographic Analysis

A Leica Microscope using a CRAIC Microscope photometer was used for vitrinite maceral identification and vitrinite reflectance measurement [39]. To be differentiated from vitrinite reflectance (Ro) of the naturally mature sample (original coal), the vitrinite reflectance measured from artificially mature sample (coal cylinder) was specified as Rm. Vitrinite reflectance was measured at an oil immersion condition using a reflected light of 546 nm and then calibrated using external standard samples [40]. A smooth observation surface perpendicular to the coal laminae trendline on the original coal and randomly selected on each coal cylinder was created and polished for the measurement. As bitumen impregnation only exerts negligible effects on coal vitrinite reflectance [41], measurement prior to and after Soxhlet extraction of the coal cylinders would not generate significant differences. Therefore, Rm for the coal cylinders was measured after Soxhlet extraction, whereas the original coal Ro was measured before extraction. A total number of 60–80 views, including both vitrinite-lean and -rich areas were counted to determine the maximum and the minimum reflectance values for the original coal and the coal cylinders. The standard deviation of all the measured reflectance values for each sample was constrained to <0.1. The average of valid reflectance values for each sample was taken as the ultimate vitrinite reflectance value and used as a maturity level indicator.

2.2. Hydrous Pyrolysis

Hydrous pyrolysis was conducted using the DK-II type pyrolysis equipment developed by Wuxi Petroleum Geology Research Institution, Sinopec (China Petrochemical Corporation). This device simulates episodic hydrocarbon generation and expulsion in the presence of water in pore-space limited source rocks under heat and pressure that largely mimic natural geological thermal and pressure regimes constraining hydrocarbon generation and expulsion. For detailed configuration and operating parameters of this device, readers are referred to Guan et al. [42].
A leak test of the hydropyrolysis reactor was conducted by an initial nitrogen sweep followed by vacuuming and then deionized water impregnation. The coal sample and an equal weight of pressurized deionized water [43] were filled to the hydrous pyrolysis reactor to ensure water impregnation within coal pore structures and exert hydrostatic pressure of the natural strata conditions. Heating temperature was raised at 1 °C/min from room temperature to 250 °C, 275 °C, 300 °C, 320 °C, 340 °C, 350 °C, 360 °C, 375 °C respectively, and held for 96 h for each heating experiment. Episodic petroleum expulsion through a semi-closed system was accomplished by a valve that automatically opened for hydrocarbon generation once system pressure exceeded the programmed maximum pressure at the valve and otherwise remained sealed while pressure was building up by hydrocarbon generation for the next expulsion. Afterwards, the system was cooled down to the ambient temperature to collect the expelled oil with solvent. The total expelled oil generated by each pyrolysis was weighed as a fraction of the original coal sample mass (μg/g coal) after a mild nitrogen blow treatment to evaporate the solvent. The corresponding residual coal was then Soxhlet-extracted to harvest the bitumen fraction, which was also weighed in μg/g coal and combined with the corresponding total expelled oil to obtain the total soluble organic material (tSOM, μg/g coal) generated under each pyrolysis target temperature. The combination of both components for compound concentration and isomerization ratio calculation was aimed at diminishing the influence from biomarker fractionation during primary migration [44,45,46] and consequently obtaining the authentic gross yield of biomarkers from kerogen at different maturity stages. The expelled gases were collected by saturated salty water displacement.

2.3. Bulk Geochemical Composition Analysis

Gas compositions were analyzed by a GC-9160 gas chromatograph interfaced to a MAT-271 mass spectrometer, according to the guidance outlined in China national standards GB/T 10628-2014 (Gas analysis–comparison methods for determining and checking the composition of calibration gas mixtures) and GB/T 13610-2003 (Analysis of natural gas composition by gas chromatography).
n-Hexane (40 mL/g tSOM) was used to precipitate asphaltenes from the tSOMs. Afterwards, the asphaltene fraction was filtered from the solution, dried, and weighed as μg/g coal. Liquid column chromatography was then performed on the de-asphalted maltene fraction using a 50 cm chromatographic column packed with 1 cm cotton wool, 45 cm activated silica gel/alumina and 1 cm cotton wool from bottom to top. Saturated hydrocarbon, aromatic hydrocarbon and resins were sequentially eluted by repeatedly flushing the column with 10 mL n-hexane four times, 10 mL mixed solvents of dichloromethane/n-hexane (1:1; v:v) four times and 10 mL mixed solvents of dichloromethane/ethanol (3:2; v:v) four times [47]. Finally, these eluents were treated with a mild, steady nitrogen blow to evaporate the solvents before the harvested hydrocarbon fractions and resins were weighed and recorded (μg/g coal).
An aliquot of the saturated hydrocarbon fraction (around 50 mg) was subjected to gas chromatography–mass spectrometry (GC–MS) analysis using an Agilent 7890N gas chromatograph interfaced to a 5975C mass selective detector. Duplicates of three randomly selected samples of this sample set as well as one blank sample and two external standard oils were added to the same sample batch for the GC–MS analysis to ensure reproducibility of the data and proper functioning of the analytical equipment. The GC oven temperature was initially 50 °C (holding time 1 min), then up on a ramp of 20 °C/min to 120 °C, then a ramp of 4 °C/min to 250 °C and finally ramped at 3 °C/min to 310 °C (holding time 30 min). Helium was used as the carrier gas and an HP-5MS fused silica capillary column (60 m × 0.25 mm i.d. × 0.25 μm film thickness) was used for the gas chromatography. The ionization source temperature was 190 °C, the ionization energy was 70 eV, the filament current was 100 μA, and the multiplier voltage was 1200 V. Full scan monitoring mode was conducted for compound identification and selective ion monitoring mode was conducted for compound quantification. Perdeuterated n-C24 with a known concentration was used as the internal standard for quantifying saturated hydrocarbons. Compound concentration was calculated using the ratio of compound peak area over that of perdeuterated n-C24. No response factor calibration was performed. Integration of the peak area was performed via the ‘auto-integration’ function of the software, and the difference in the areas between the same peaks of the duplicate and the original sample was generally <10% for the range of compounds of interest, suggesting good reproducibility of the data.

3. Results

3.1. Original Bitumen Characterization

The original coal sample was immature with a Ro value of 0.42%. It contained approximately 87.2 wt% organic matter, 0.3 wt% pyrite and 12.5 wt% other minerals. Maceral composition analysis suggested predominant vitrinite (60.1 wt%), minor inertinite (39.3 wt%) and the smallest proportion of liptinite (0.6 wt%). The original bitumen (OB) showed a predominance in the asphaltenes among the SARA fractions (saturated hydrocarbons, aromatic hydrocarbons, resins and asphaltenes) and contained low levels of saturated hydrocarbon compound classes (Figure 2A and Figure 3). Immature shales from Brazil and the Chinese Bohai Bay Basin also generated early mature bitumen (extractable oil) as in the present study (Figure 2C,D) [48,49], representing proto-oil organic matter.
In terms of biomarkers, the OB lacked C29–C30 hop13(18)enes but had moderate levels of diagenetic hopanoids C27 17β-hopane and C29–C31 ββ-hopanes (Figure 4 and Figure 5; Table 1). No Ts or trace C29Ts were present in the OB (Figure 4, peaks 3, 8; Table 1). C31 αβ-hopanes 22S/(22S + 22R) ratio was low, but C29–C30 βα-moretane/αβ-hopane ratios were higher than unity (Figure 6; Table 1), suggesting a low rank of the original coal [4,5]. This suggestion of immaturity of the sample was consistent with a previous study of the Xishanyao Formation coal based on hopane and sterane maturity ratios [37].
In contrast with the hopanes, the OB preserved very low levels of the 5α-sterane isomers (Figure 4; Table 1). This may be due to a predominance by higher plants in the organic input for the studied coal [37], and a lack of steroidal moieties as in some coal kerogens [50,51]. The C29 5α-sterane isomers were dominated by the ααR and ββR configurations (Figure 4, peaks, 23, 25; Table 1). The 20S/(20S + 20R) ratio was low in the OB but the ββ/(αα + ββ) ratio was approaching the isomerization equilibrium point of 0.67 (Figure 6D, Table 1) [3]. The high anomaly of the ββ/(αα + ββ) may be due to non-maturity factors [52]. However, overall, these ratios should be interpreted with caution because of the low isomer concentrations (Table 1).

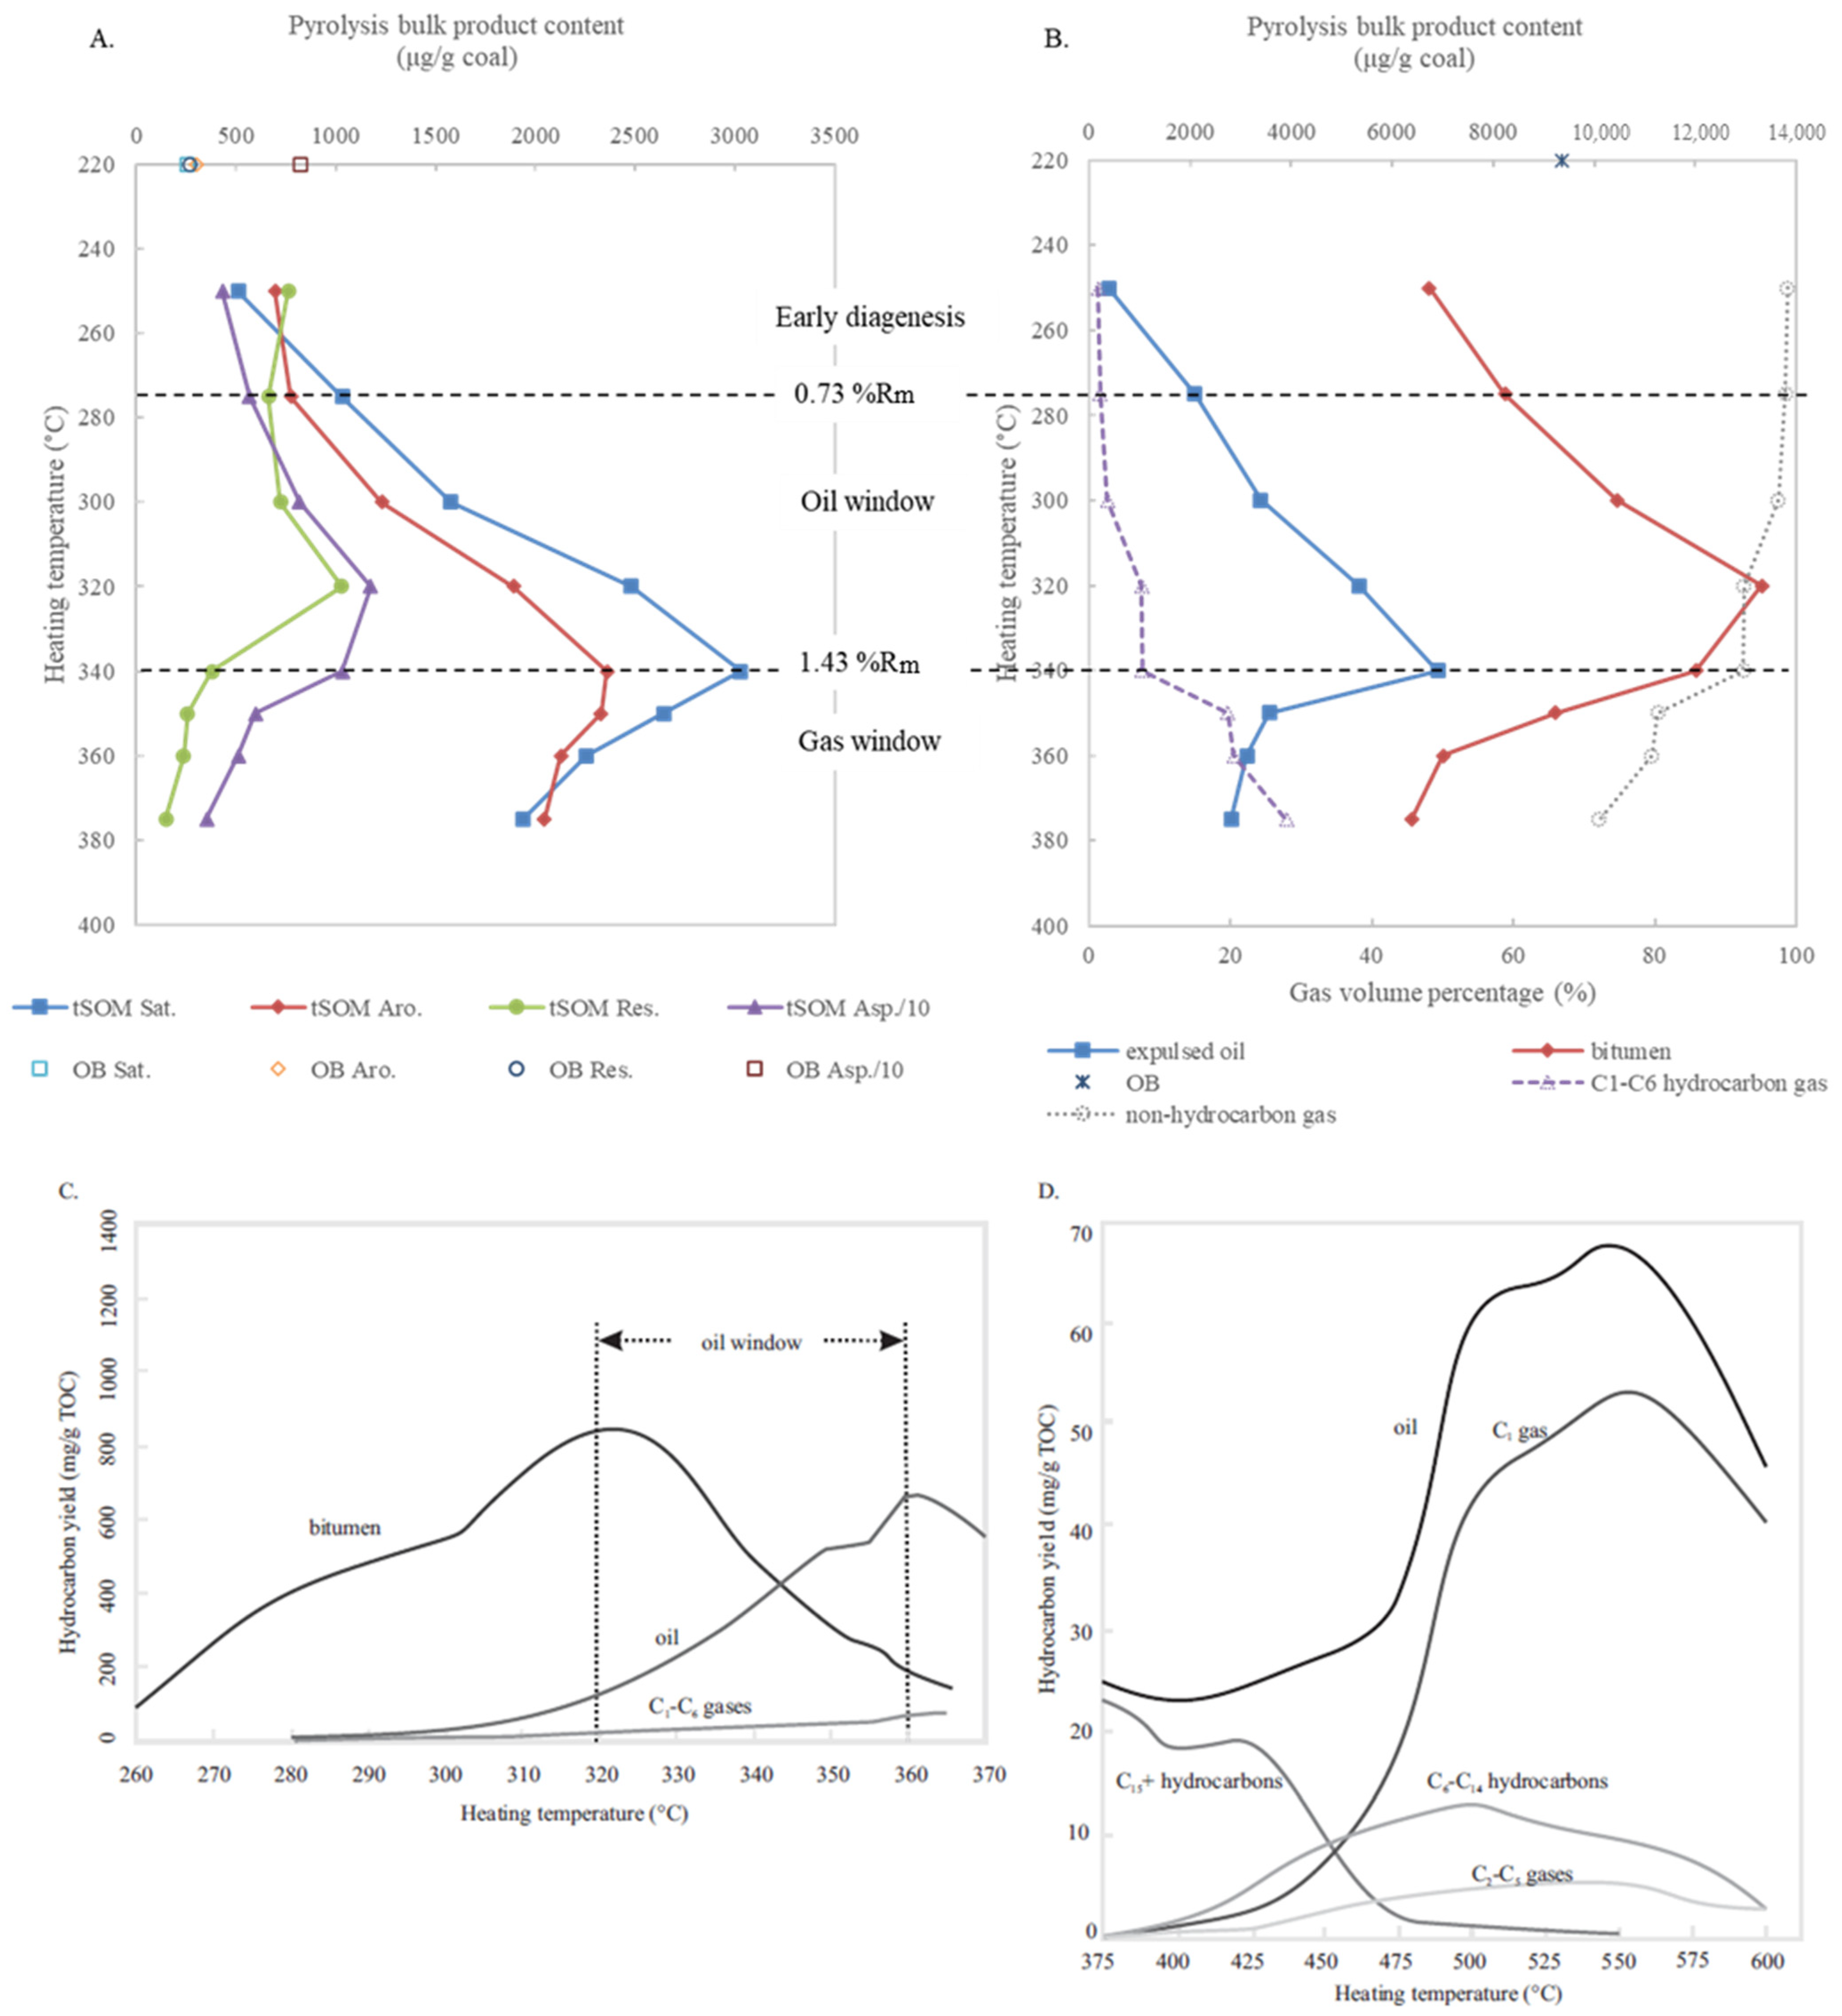
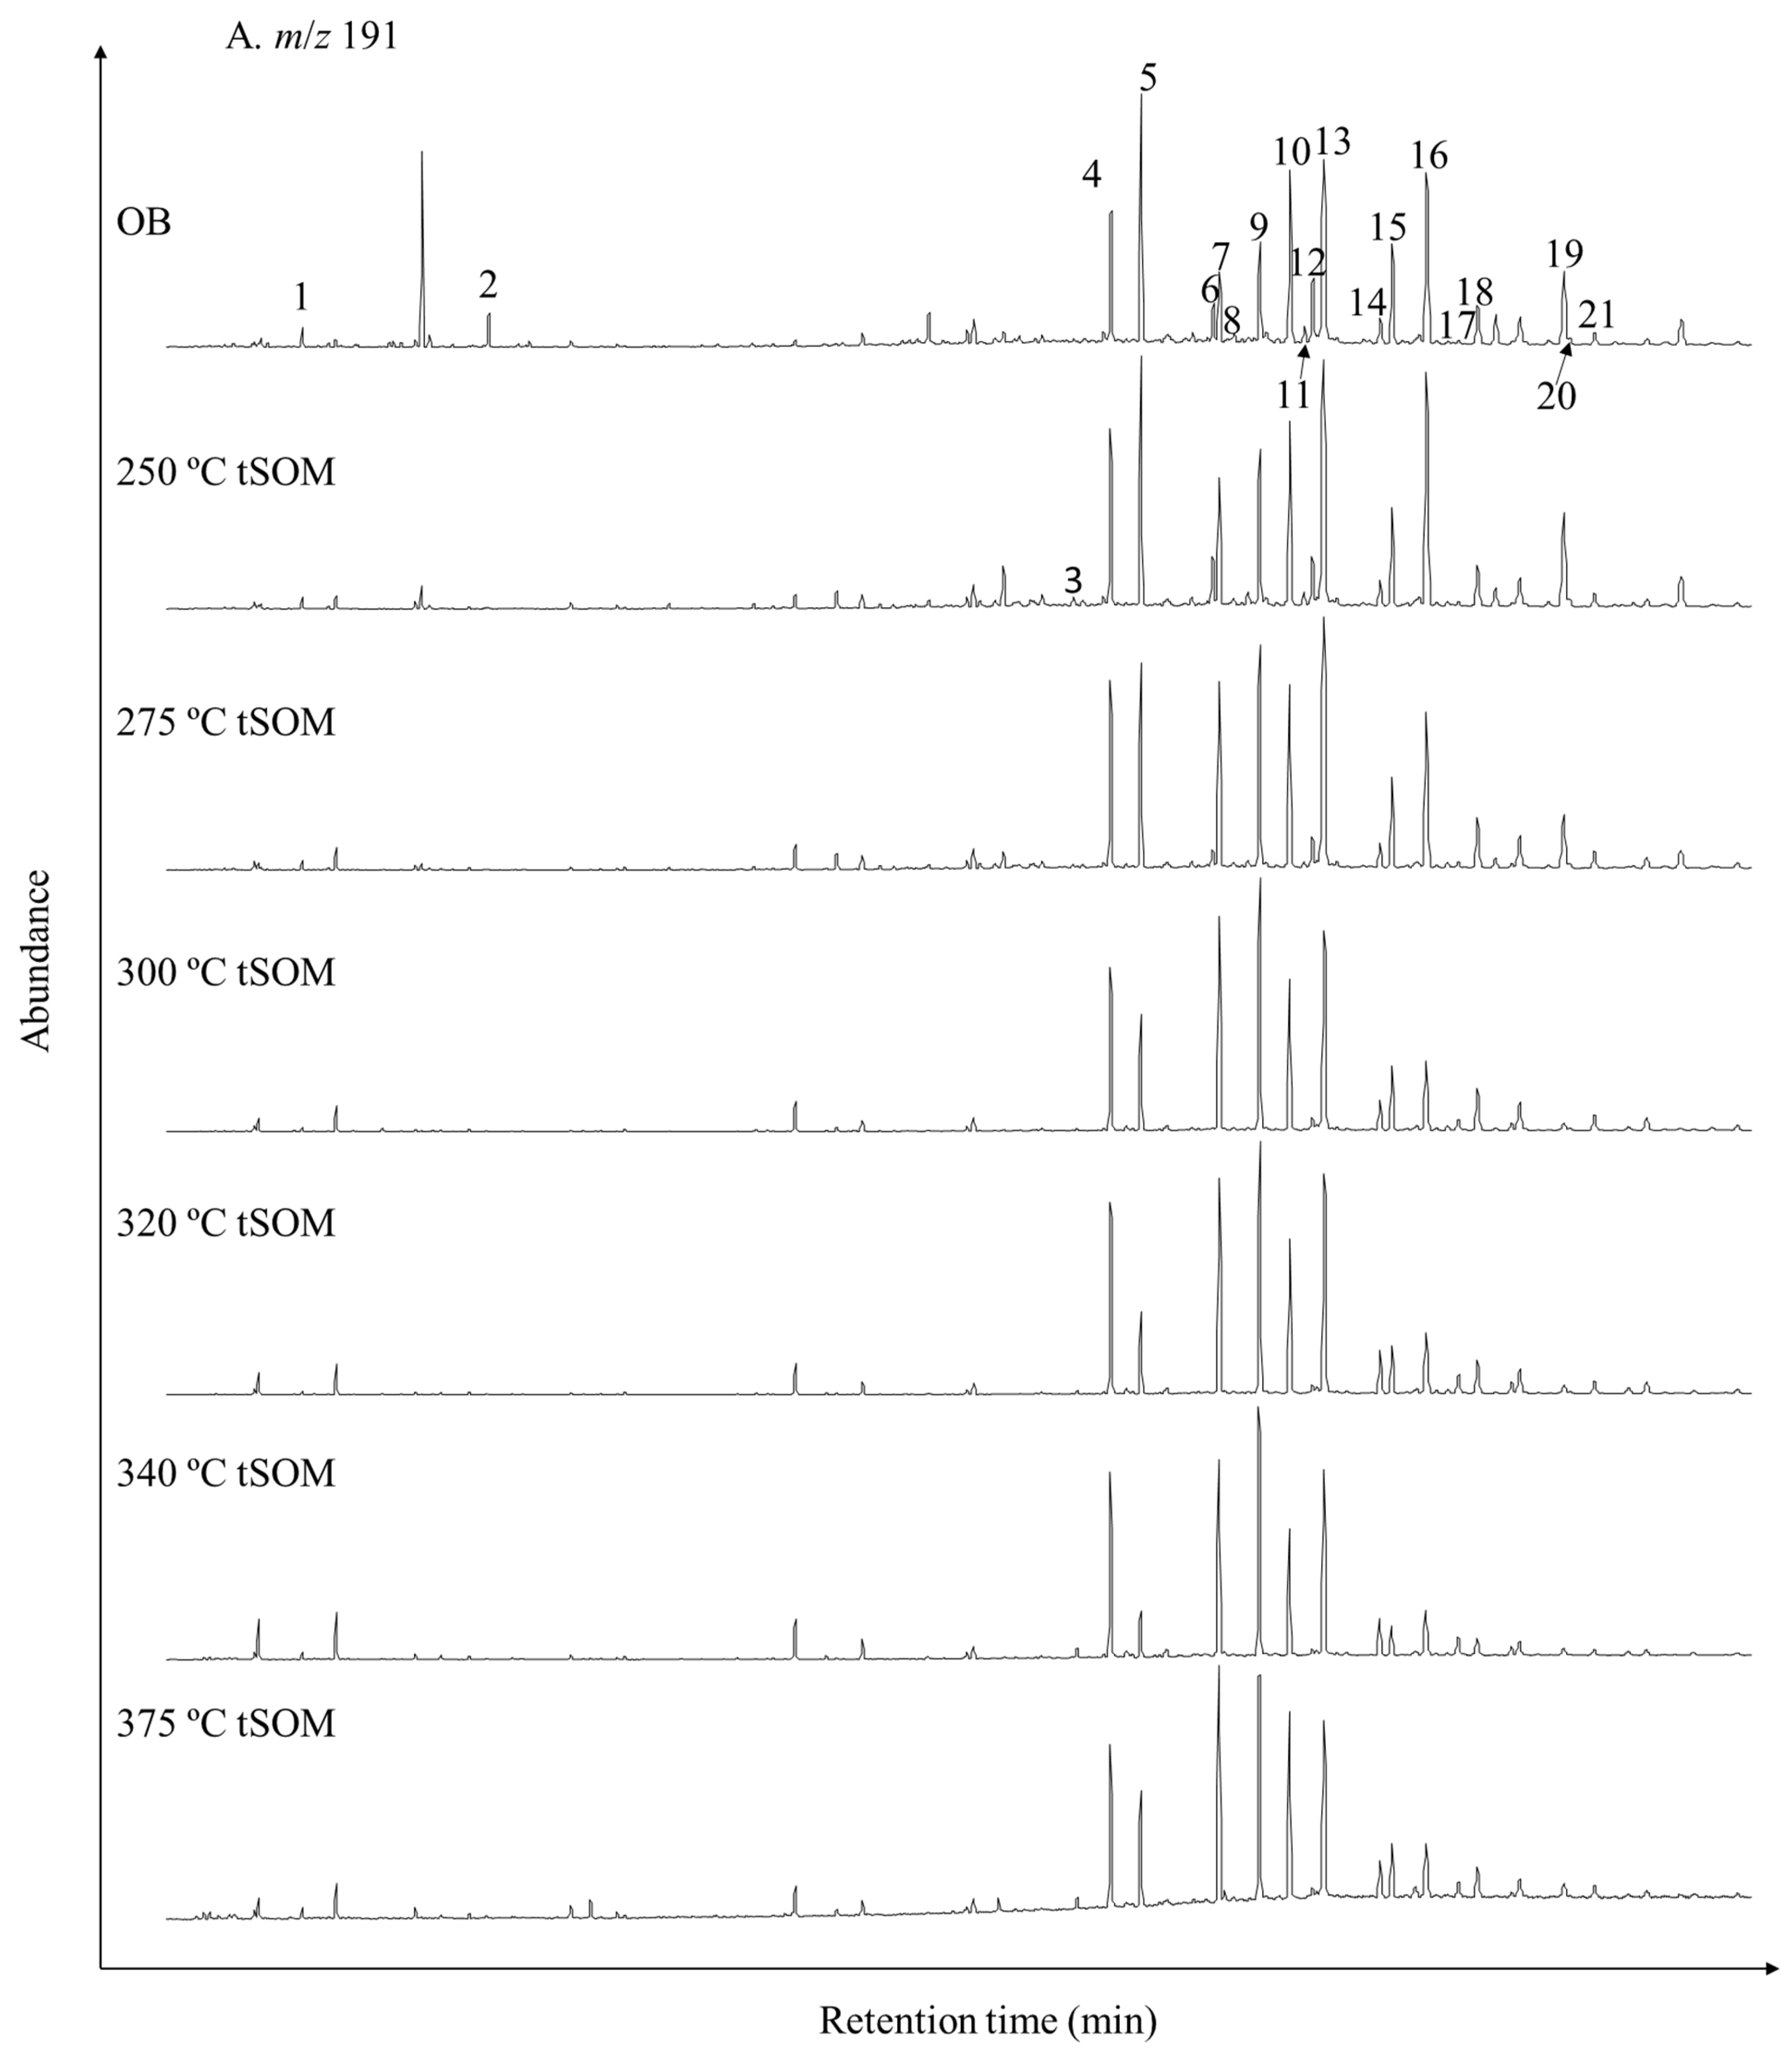
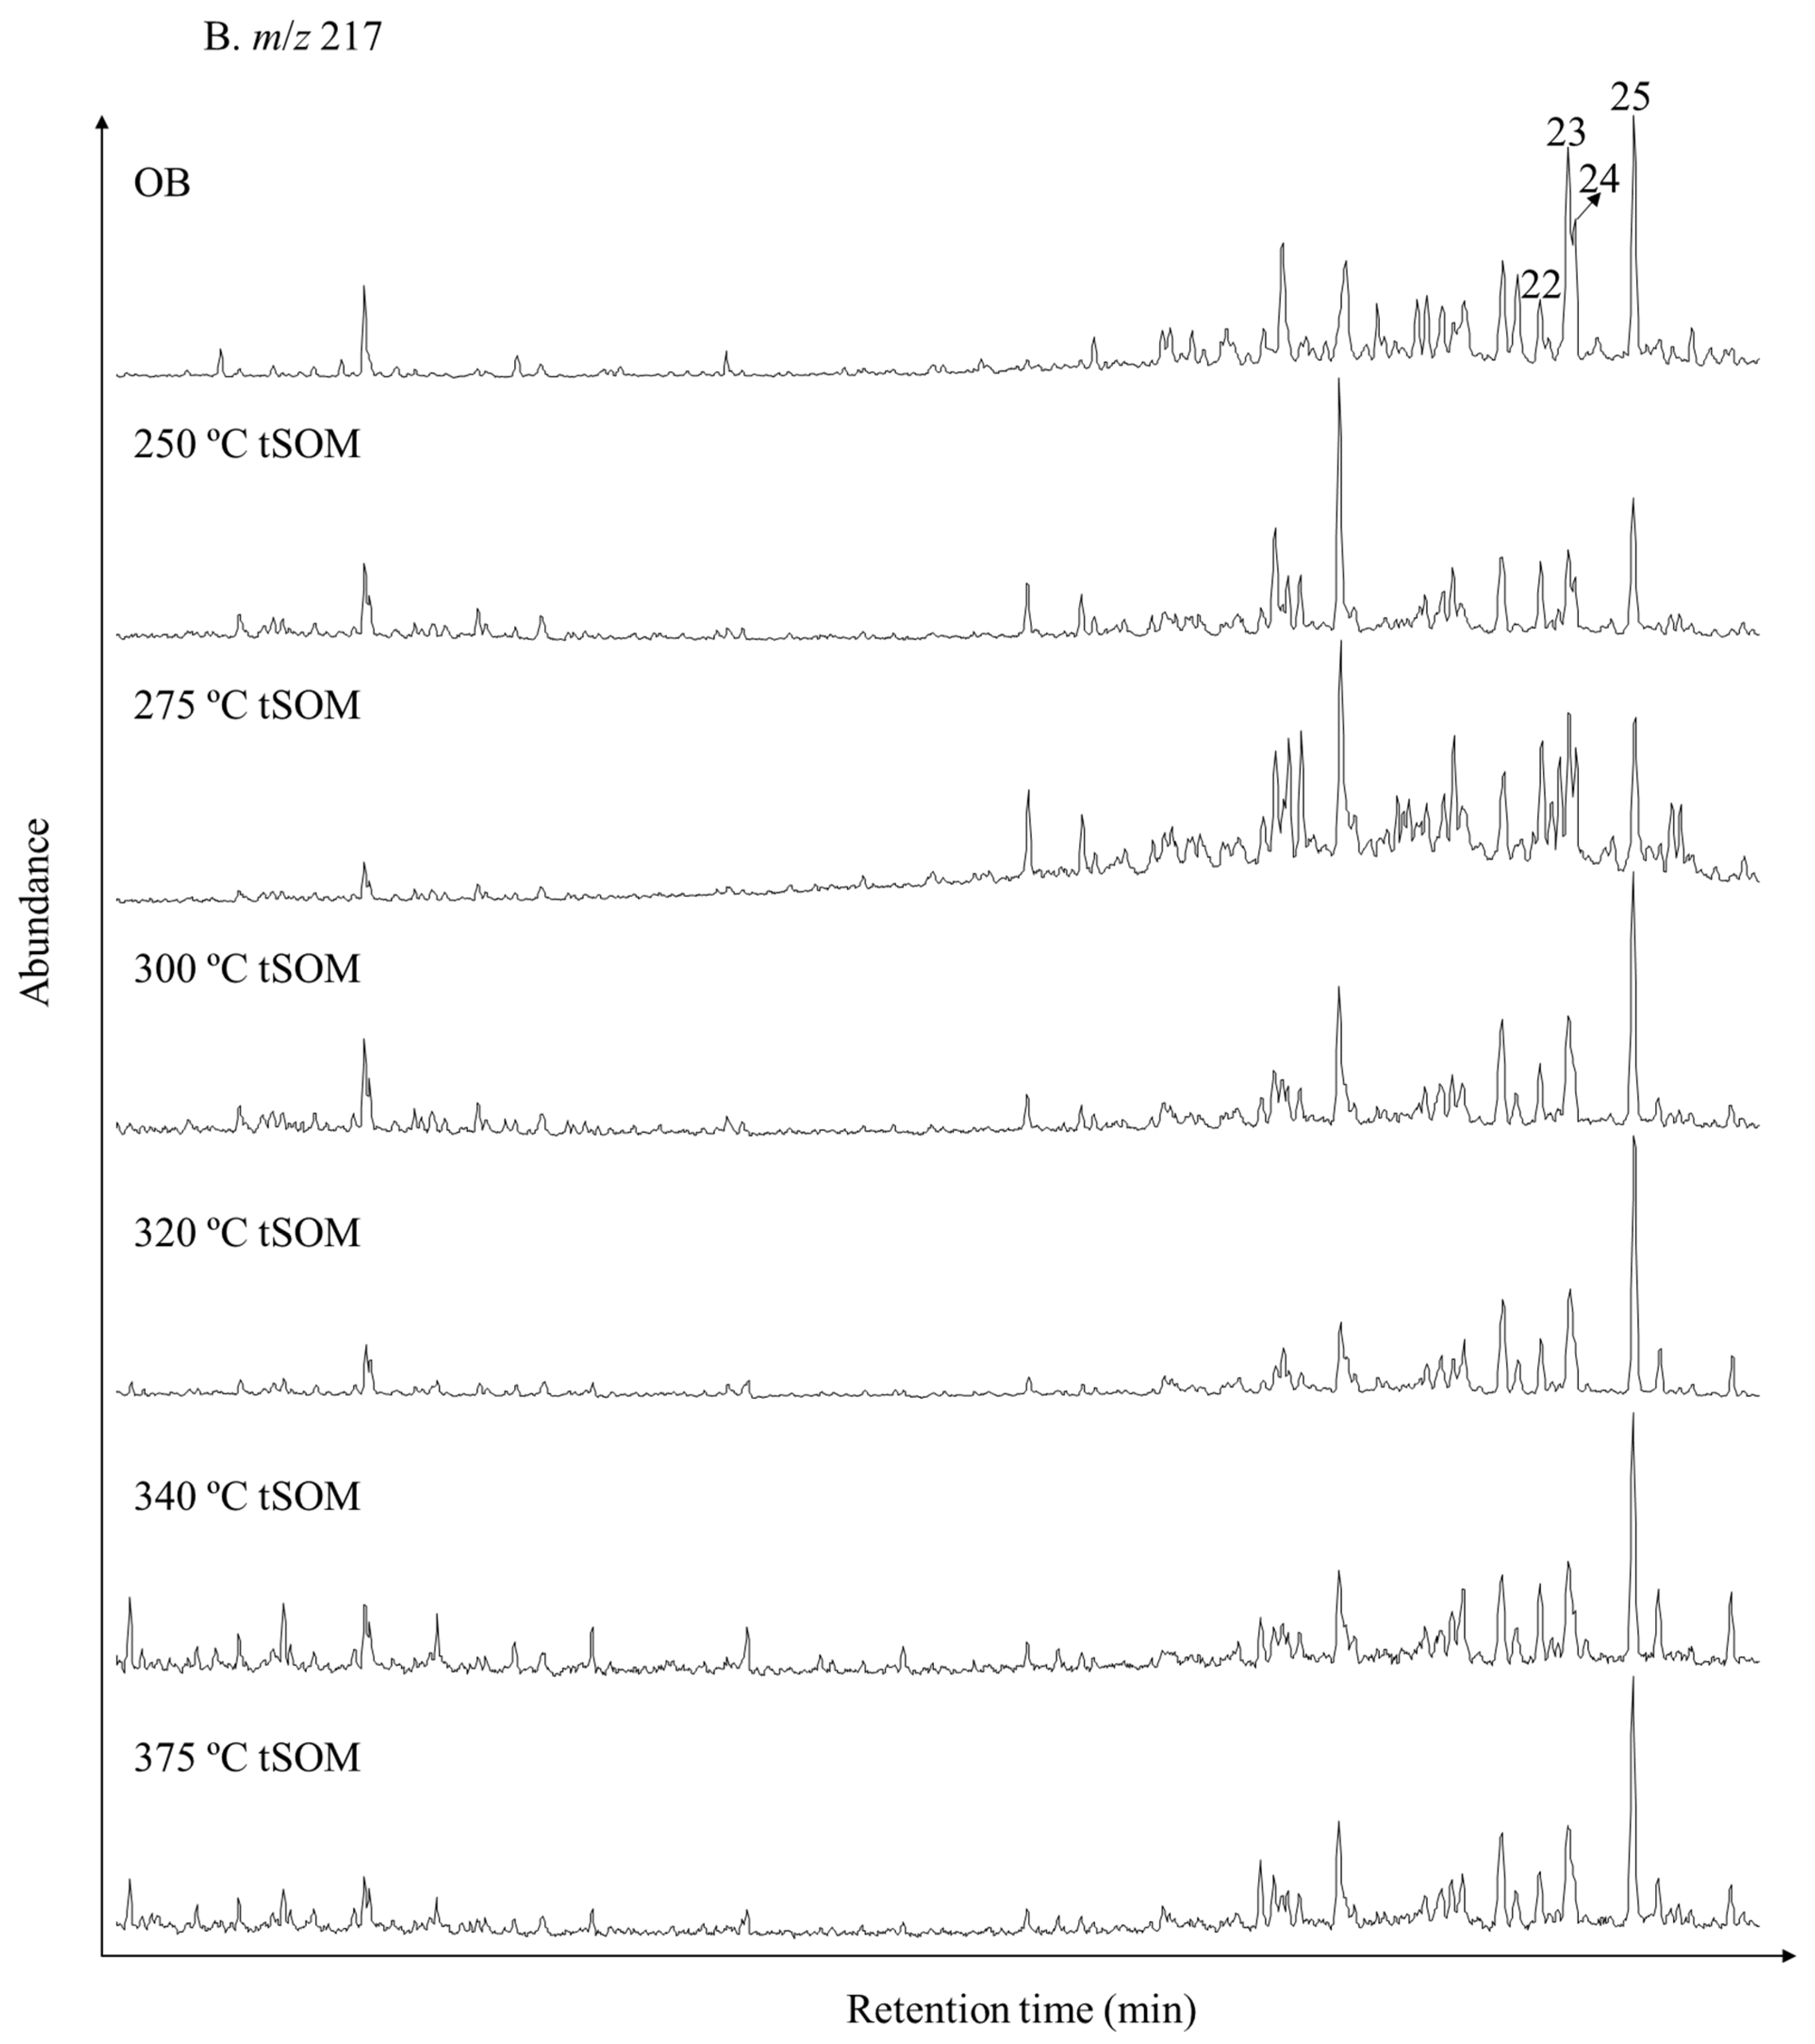
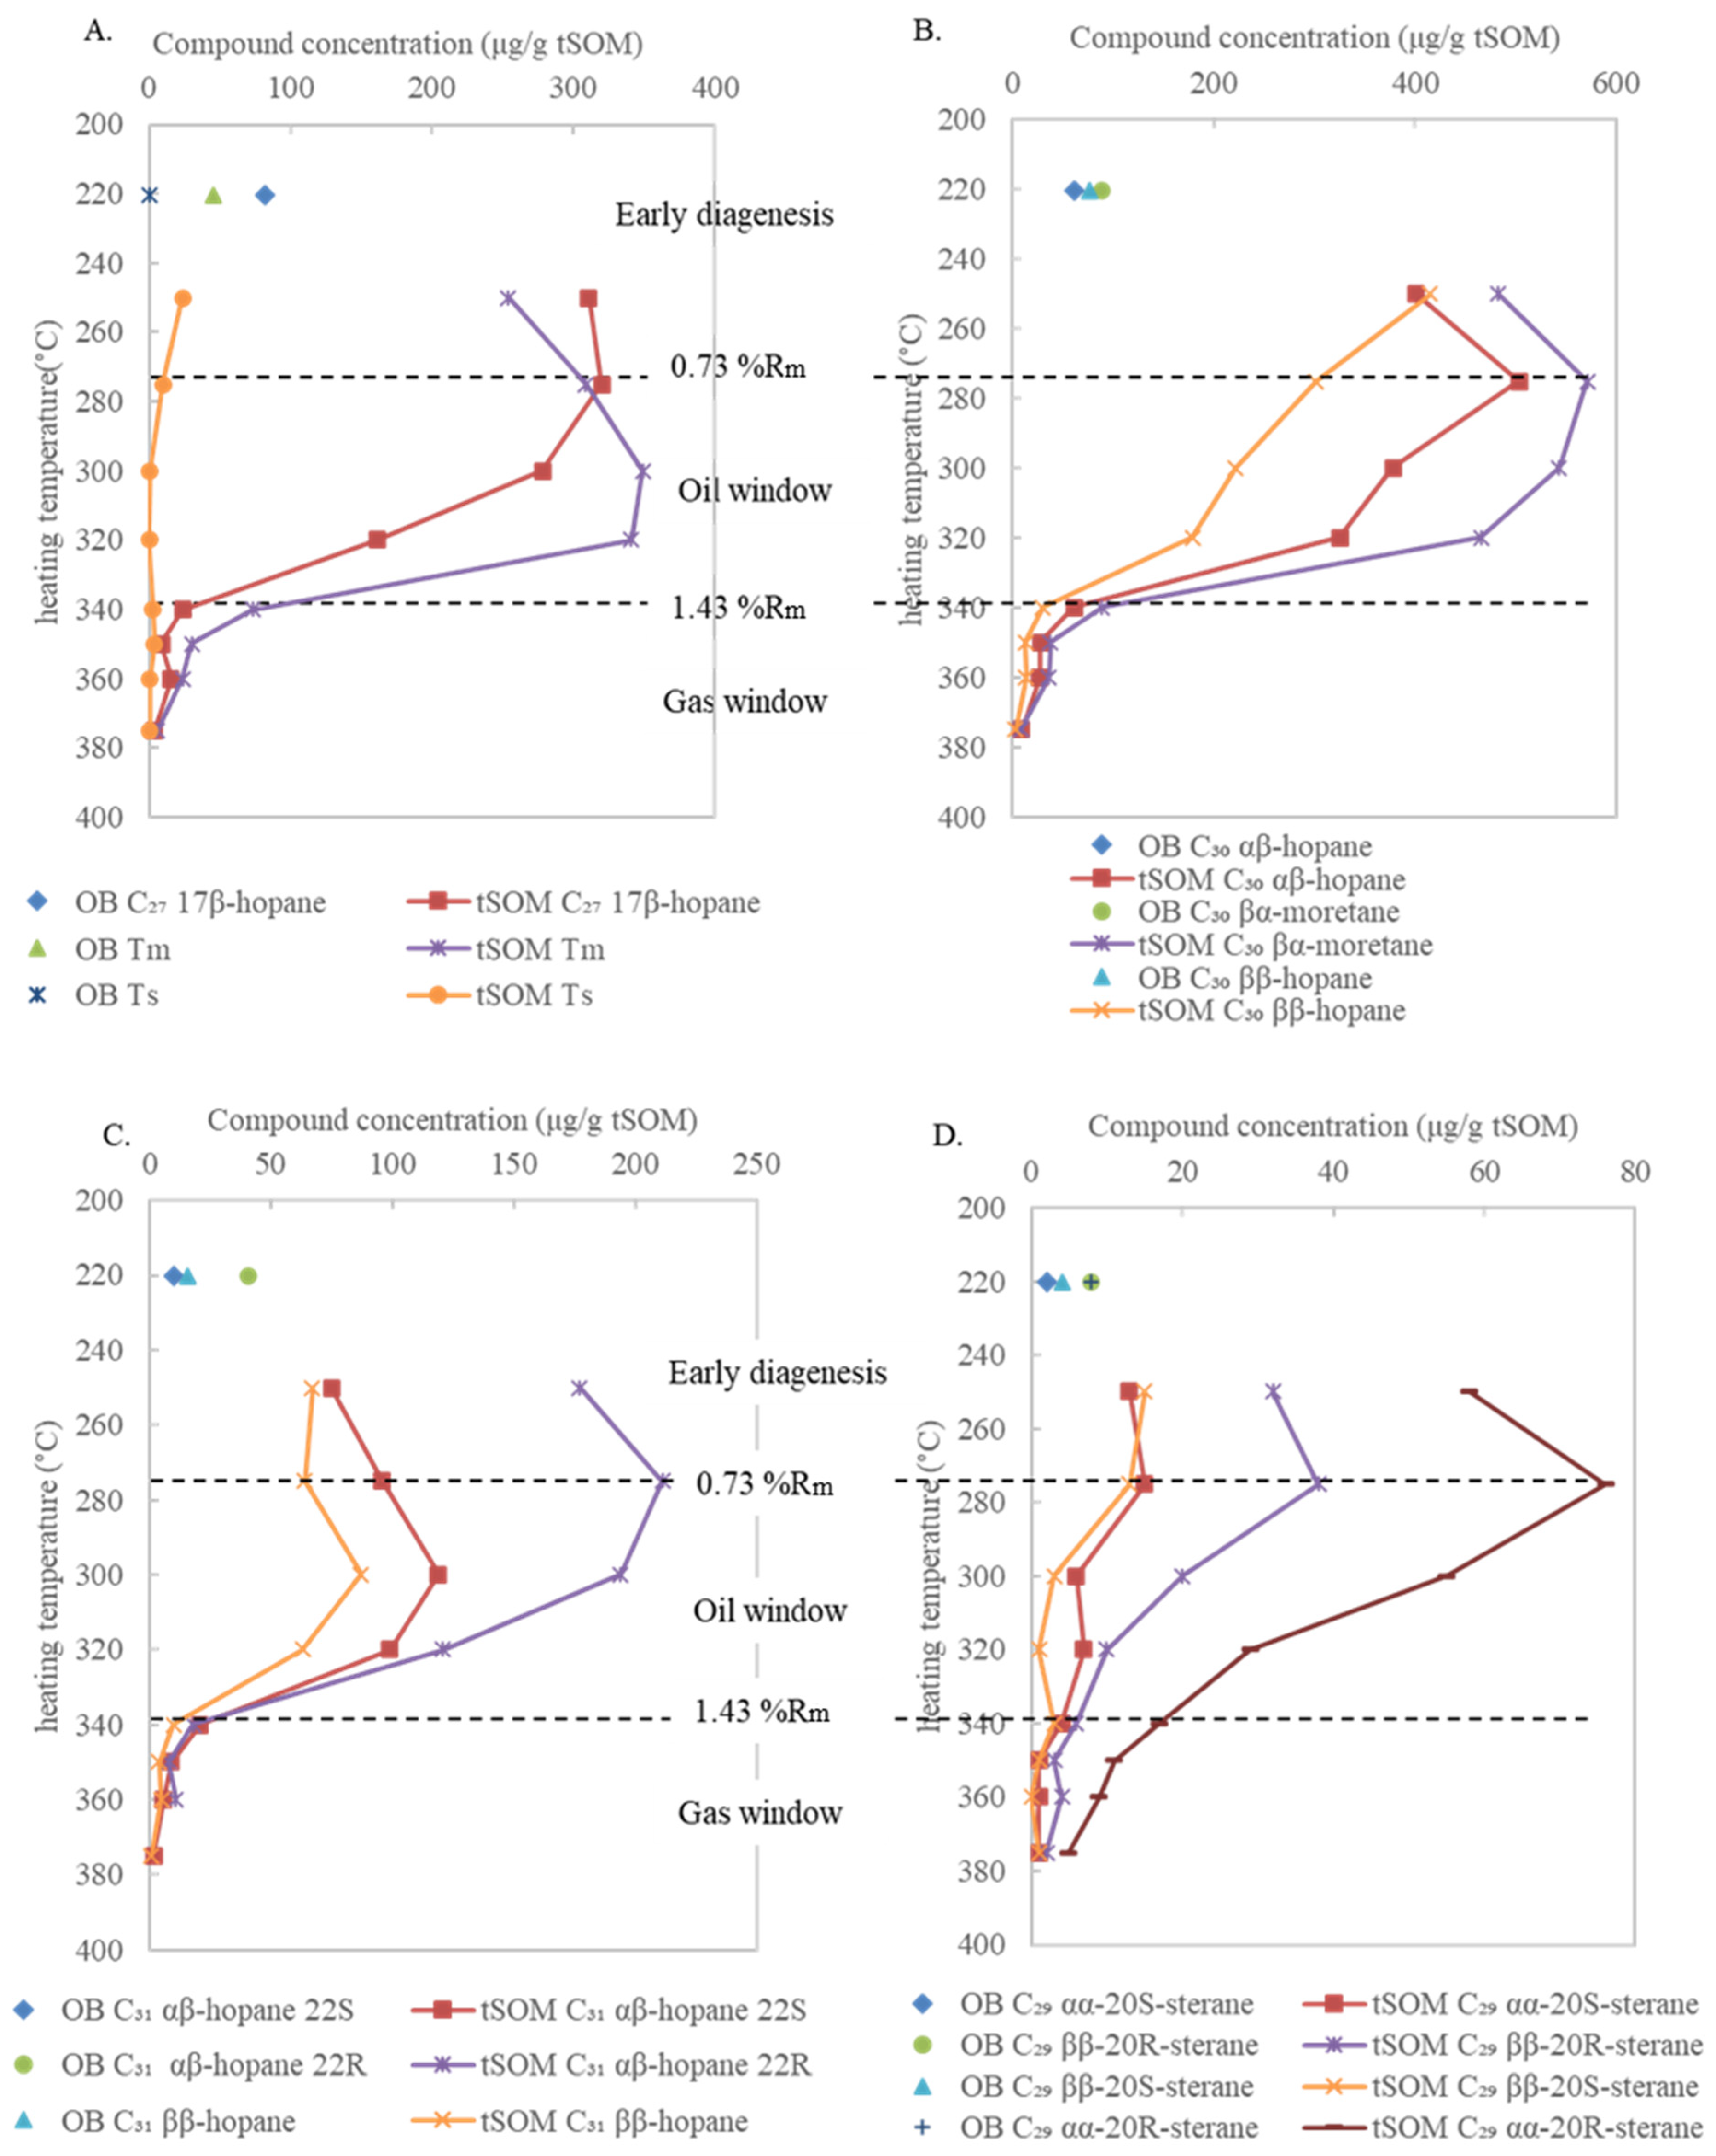
3.2. Variations in Bulk Compositions and Biomarker Distributions with Heating Temperature

Generally, C1–C6 hydrocarbon gases, expelled oil, bitumen, and the SARA components of tSOMs all increased as the heating temperature increased to 340 °C, whereas non-hydrocarbon gases decreased in the same temperature range. Afterwards, the hydrocarbon gases started increasing dramatically, whereas the expelled oil, bitumen, and non-hydrocarbon gases decreased rapidly (Figure 2A,B). Notably, bitumen began diminishing from 320 °C, earlier than the expelled oil, while resins and asphaltenes fractions also initialized decreasing from 320 °C, earlier than the saturated and aromatic hydrocarbons (Figure 2A). The earlier maximization and earlier decreasing of the bitumen rather than the oil fraction, as well as the slow augmentation of the C1–C6 gases before the gas window in this studied sample set accorded with the bulk composition changes in the pyrolysate of a Brazilian source rock consisting of type I kerogen [49] (Figure 2C).
Major saturated compound classes increased remarkably during pyrolysis until 275 °C except tricyclic terpanes, which began reducing earliest from 250 °C (Figure 3). Cyclic biomarkers including alkyl cyclohexanes, tricyclic terpanes, pentacyclic terpanes and steranes simultaneously began decreasing later at 275 °C whereas n-alkanes, pristane + phytane (Pr + Ph) displayed a lagged generation peak at 320 °C and 300 °C, respectively, before decreasing initiated. Notably, the n-alkanes showed another minor generation peak at 350 °C, while alkyl-cyclohexanes and tricyclic terpanes displayed another small peak at 320 °C (Figure 3). Great abundance of the long chain saturated hydrocarbons (C15+, mostly derived from biomarker moieties detached from kerogen via break of weak carbon-heteroatom bonds) compared with the shorter chain C14- hydrocarbons was also reported in the 375 °C pyrolysate of the immature shale from the Bohai Bay basin [48], and the very rapid destruction of these higher carbon number molecules with temperature agreed with the sharp decreases in the biomarker classes beyond 275 °C in the present study (Figure 2D and Figure 3). Despite the considerable changes in bulk compositions and compound class concentrations with increasing target temperature in the present study (Figure 2A,B and Figure 3), the small temperature increments between adjacent target temperatures and the generally paralleled trends of compound yield-temperature curves between the present study and previous studies substantiated the validity of data in the present study.
Like most bulk components, hopane and sterane isomers were significantly enriched under the thermal effect until a maximum generation was reached at 275 °C (Figure 5). Among hopane and sterane isomers, Tm, C31 ββ-hopane and C31 αβ-hopane 22S showed a lagged generation peak beyond 275 °C. Most biomarker compounds either disappeared or were reduced to trace amounts at 340 °C (Figure 5, Table 1), whereas stable isomers Ts, C29Ts and unstable hopanoid precursors C29–C30 hop(13)18enes (Figure 4, peaks 3, 8, 6, 11) disappeared at 275 °C or 300 °C in the tSOMs (Table 1).
Ts/(Ts + Tm) and C29Ts/(C29Ts + C29 αβ-hopane) decreased to zero at 300 °C and 275 °C respectively, which was caused by rapid increases in Tm and C29 αβ-hopane (Figure 5 and Figure 6; Table 1). C29–C30 βα-moretane/αβ-hopane ratios were consistently higher than unity over the 0.49 %Ro–1.74 %Rm (OB–360 °C tSOM) sequence, and both ratios decreased before 275 °C, increased to 300 °C, and then remained steady in high values until 360 °C (Figure 6; Table 1).
The 22S/(22S + 22R) ratio increased consistently to 340 °C and decreased afterwards, when both isomers were being generated under temperatures < 275 °C (or 300 °C) and both being destroyed under temperature > 275 °C (or 300 °C). In contrast, the 20S/(20S + 20R) and ββ/(αα + ββ) ratios decreased steadily from the OB to the 300 °C tSOM and then increased until 340 °C (Figure 5 and Figure 6; Table 1). However, ratio values at 340 °C should be scrutinized because of the low biomarker isomer concentrations.

4. Discussion

4.1. Hopane and Sterane Distribution in the OB–275 °C tSOM (0.49 %Ro–0.73 %Rm) Stage

Rapid generation of the hydrocarbon fractions, the saturated hydrocarbon compound classes and individual hopane and sterane isomers as well as high volume percentages of nonhydrocarbon gases from OB to the 275 °C tSOM (0.49 %Ro–0.73 %Rm) (Figure 2, Figure 3 and Figure 5) were typical changes in the composition of kerogen thermal pyrolysate at an early diagenesis stage [51,53,54]. Moderate levels of non-hydrocarbon hopanoids indicated bacterial lipids detached from the coal kerogen during heating and Soxhlet extraction [55,56]. In contrast, low yields of Ts, C29Ts and steranes suggested a scarcity of precursors for these biomarker compounds in the coal kerogen [57].
In this stage, increases in isomer concentrations and in the 22S/(22S + 22R) ratio whereas a decrease in C29–C30 βα-moretane/αβ-hopane ratios suggested a higher generation rate of C31 αβ-hopane 22S than the 22R isomer, and of αβ than βα isomers of C29–C30 hopanes. These observations agreed with previous studies [15,58] and may imply occurrence of isomerization but of unknown extent.
However, small yields of Ts and C29Ts that were almost one magnitude lower than those of C27 17β-hopane and Tm, and C29 αβ-hopane, respectively, and the consistently decreasing Ts/(Ts + Tm) and C29Ts/(C29Ts + C29 αβ-hopane) (Figure 5 and Figure 6; Table 1) contradicted previous accounts on natural diagenesis products, where these isomers all increased rapidly with increasing trends of the maturity ratios [59,60]. No indication for thermal rearrangement of Tm to Ts and of C29 αβ-hopane to C29Ts or correlation with thermal maturity was implied by the ratio changes in the present study. Irregular biomarker behavior such as this was reported to have occurred in rapidly maturating organic matter affected by igneous intrusion in natural geological settings [27,61] and in pyrolysis [26], and were explained by intense and accelerated heating that rapidly destroyed biomarker compounds. However, how a high geo-thermal anomaly caused novel biomarker distributions remained ambiguous. Alternatively, the absence of C27 18α(H)-22,29,30-trisnorneohop-13(18)-ene and the low initial level and rapid disappearance of C29 neohop13(18)ene, which were diagenetic intermediates of Ts and C29Ts [27,62], might also be responsible for the minimal Ts and C29 Ts generation. In contrast, Tm and C29 αβ-hopane were continuously released from macromolecules under the thermal effect, resulting in low maturity ratios [34].
The consistently high abundances of the C29–C30 hopanes ββ and βα isomers comparable to the αβ isomer concentrations (Table 1) contradicted the commonly observed rapid disappearance of the ββ isomers and thermal reduction of the βα isomers [22,23,63] that supported the normal ββ to βα to αβ thermal evolutionary route of hopanes [64]. In addition, the high C29–C30 βα-moretane/αβ-hopane ratios persisting to the oil window (275 °C, 0.73 %Rm) diverged from the normally < 0.15 values in oil [4] or the equilibrium point of 0.9 in coal [51]. Again, as both the βα-moretane and the αβ-hopane stereoisomers could be derived directly from molecules synthesized by living organisms [65,66] such as bacterial hop-17(21)-ene acids [67,68], the predominance of the βα configuration was mostly likely controlled by a predominant thermal transformation of biomarker precursors of the βα-moretanes. Similarly, Farrimond et al. [59] reported dramatic increases in the βα and αβ isomers from direct transformation of biomarker precursors (e.g., bound biomarkers, macromolecules) other than a stereochemical conversion of the ββ configuration. Therefore, direct βα to αβ isomerization [18] was poorly supported by our data.
Increases in both the 22R and 22S isomers of the C31 αβ-hopane and a simultaneous increase in the 22S/(22S + 22R) ratio until 275 °C (Figure 5 and Figure 6) implied a direct 22R to 22S isomerization, but the extent of such a transformation could not be confirmed. Since hopanoid precursors homohop-17(21)-hopenes reaching the 22R to 22S isomerization equilibrium were reported to occur in shallow organic matter [58], biomarker precursors from bacterial sources might also influence the ratio trend [23].
In contrast to the 22R and 22S isomer pair, consistent diminishments in the ββ/(αα + ββ) and 20S/(20S + 20R) ratios accompanied by generation of the C29 5α-sterane isomers (Figure 5 and Figure 6; Table 1) clearly disproved direct 22R to 22S or α to β isomerization or more rapid generation of 20S relative to 20R or of ββ relative to αα isomer that were widely reported in natural and artificial coal maturation cases [16,69]. Instead, our data supported reversed relative generation rates of these isomers, which implied either additional supplies of the less stable isomers and/or a hindrance of the 20R to 20S and αα to ββ conversion. Lu et al. [70] explained a reversed 20S/(20S + 20R) trend in immature shale pyrolysate by bound biomarker release from kerogen rather than by isomerization. They further proposed a lower activation energy required to detach sterane moieties from kerogen than that for in-kerogen isomerization. If this is true for the current study, the reversed sterane isomerization trends could be predominantly controlled by biomarker precursors directly released through pyrolysis without isomerization. Alternatively, some studies proposed lagged isomer conversion of the bound biomarkers compared with that of their free counterparts during heating [23,33,36,71], this could result in more unstable isomers being released later from kerogen to dilute the low contents of free biomarkers already presented in the OB and reverse the maturity trend (i.e., causing reductions in the ββ/(αα + ββ) and 20S/(20S + 20R) ratios with increasing temperatures).

4.2. Hopane and Sterane Distribution in the 275–340 °C (0.73–1.43 %Rm) Stage

Initiation of hopane and sterane destruction at 275 °C marked the onset of the oil window, when biomarkers including alkyl-cyclohexanes, tricyclic terpanes, hopanes and steranes began declining dramatically [59,72]. This diagenesis boundary featured a notable increase in the generation of hydrocarbon gases and an obvious decrease in the non-hydrocarbon gases proportion (Figure 2B). The oil window lasted until 340 °C, after which less oil was expelled from the coal, hydrocarbon fractions in the tSOMs were diminished, and the hydrocarbon gases showed a significant increase in its proportion of the generated gas (Figure 2). The earlier reduction in the yield of extractable bitumen from the 320 °C tSOM compared with the expelled oil yield agreed with the observations regarding the oil window by Spigolon et al. [49] (Figure 2C). The decreases in resins and asphaltenes proportions and the corresponding increases in saturated and aromatic hydrocarbons from 320 to 340 °C were consistent with the high hydrocarbon and low polar components characteristics of light oils. The minor generation peaks in cyclohexane and bicyclic sesquiterpanes at 320 °C and a maintenance of tricyclic terpanes level likely reflected the generation of ‘secondary biomarkers’ at the cost of polycyclic biomarkers [54,73,74], as previous research suggested bicyclic sesquiterpanes, tricyclic terpanes and other 1–3 ring aliphatic compounds could originate from hopanoid thermolysis [19,75]. This was supported by the fact that increases in cyclohexane and bicyclic sesquiterpanes (729–1072 μg/g tSOM and 319–422 μg/g tSOM, respectively) were partly offset by the reduction in hopanes (2500–2200 μg/g tSOM) in the 300–320 °C range (Table 1). The oil window generally featured predominant production of crude oil [76] and massive destruction of biomarkers [72,77].
The sterane isomer concentrations dropped quickly from 275 °C, in contrast with the much more moderate decreases in the hopane isomer concentrations (Figure 3 and Figure 5). Except a predominance of higher plants in organic input of the studied coal [37] and commonly much more abundant hopanoids than steroids in coal kerogen pyrolysate [50,51], this phenomenon was also likely caused by the different covalent bound types linking sterol and hopanoids to kerogen that caused lagged generation maxima of hopanes than steranes in shale kerogen pyrolysate [50]. Additionally, easier cleavage of single bond linked sterols than multiply linked hopanoids [50,56] and destruction of steroid A-ring upon detaching from kerogen [78] could also be possible reasons for the distinct behaviors between hopanes and steranes.
The continuous accumulation of less stable Tm, C29 βα-hopane and C31 ββ-hopane from 275 to 300 °C was quite abnormal, which was in a strong contrast to the reduction in the more stable hopanes and all sterane isomers (Figure 5; Table 1). These changes were responsible for the continuous decreases in the maturity trends of Ts/(Ts + Tm) and C29Ts/(C29 αβ-hopane + C29Ts) and increases followed by a high value plateau in the C29–C30 βα-moretane/αβ-hopane ratios (Figure 6, Table 1). These anomalous trends apparently contradicted previous observations in which Ts/(Ts + Tm) and C29Ts/(C29 αβ-hopane + C29Ts) increased to elevated maturity levels [5] and C29–C30 βα-moretane/αβ-hopane ratios reduced to 0.15 upon onset of the oil window [4].
Similar reversed maturity trends were explained by the influence from organic facies and clay catalysis by previous studies [14,62,77]. However, both factors could be ruled out in this study with samples being aliquots of the original coal. Notably, the increase in Tm (from 309 to 349 μg/g tSOM, Table 1) was offset by the decrease in C27 17β(H)-22,29,30-trisnorhopane (from 320 to 278 μg/g tSOM, Table 1) at the 275–300 °C (0.73–0.9 %Rm) stage. It was possible that Ts was not bound to kerogen and the release of the bound Tm diluted the free biomarker inventory, or more likely additional supplies of Tm from the conversion of C27 17β(H)-22,29,30-trisnorhopane and other hopanoid precursors detached from kerogen were responsible for the continuous increases in Tm and the reversal in the Ts/(Ts + Tm) ratio [51,74,79]. Similarly, contributions from biomarker precursors were also the most likely reason for the high abundances of thermally labile C29–C30 ββ-hopanes and slower or comparable reduction rates of the C29–C30 βα-moretanes compared with the αβ-hopanes that apparently showed much limited extents of the βα to αβ isomerization (Figure 5 and Figure 6; Table 1).
An increase in the 22S isomer and a decrease in the 22R isomer of the C31 αβ-hopane resulting in an increase in the 22S/(22S + 22R) ratio from 275 to 300 °C seemed to support a direct isomerization. However, this ratio was as low as <0.4 at the initiation of the oil window (Table 1), contradicting the account by Vu et al. [51] on hopanes generated from a series of New Zealand coals, which arrived at the equilibrium point of 0.6 at 0.6–0.8 %Ro at the beginning of the oil window. The retarded progression to the ratio equilibrium point in the present study suggested a significant deficiency in the generation of 22S and additional supply of 22R isomer by sources most likely represented by hopane precursors (e.g., bound hopanoid counterparts and macromolecules). Continuous increases in 22S/(22S + 22R) at the 300–340 °C (0.9–1.43 %Rm) range and ratio reversals at higher temperatures (>340 °C) while both isomers were being destroyed could be explained by differential thermal degradation rates of the 22R and 22S isomers [20,21,59]. This agreed with Chen et al. [80], which suggested that in high temperatures beyond that for biomarker isomerization, biomarker parameters were predominantly controlled by relative generative and degradative rates. However, it was less likely that the relative degradation rates reversed abruptly to account for the ratio reversals upon the gas window (340 °C, Figure 6C). Furthermore, previous researchers observed a trend reversal at the equilibrium point of the 22S/(22S + 22R) ratio upon the oil window [21,81,82], much earlier than in our study. Therefore, 22R to 22S isomerization probably played a significant role in the ratio increases in the 300–340 °C sequence despite of the reduction in the 22S isomer concentration, while additional sources for 22R from biomarker precursors during this phase was still remarkable to decelerate the 22S/(22S + 22R) ratio equilibration. In contrast, intensive destruction of biomarker precursors and hopane isomers preferably degrading the 22S configuration at elevated temperatures [59,61,83,84,85] explained the reduction of this ratio over the gas window (Figure 6C).
For the sterane isomers, although both higher and lower thermal degradation rates of the labile isomers relative to the stable isomers were reported for the C29 5α-sterane ααS, ααR, ββS and ββR isomers [27,59,61,81,84], it was unreasonable that the relatively stable isomers first degraded faster and then slower than their less stable counterparts to account for the prior decrease followed by increases in the 20S/(20S + 20R) and ββ/(αα + ββ) ratios when the ααS, ααR, ββS and ββR isomers were all decreasing (Figure 5D and Figure 6D). Instead, biomarker precursor contribution was again suggested by the small 20S/(20S + 20R) and ββ/(αα + ββ) ratios far less than their respective equilibration values of 0.55 and 0.67 [3,18] and the continuous decreases in both maturity ratios over the oil window. On the other hand, the reversals in the 20S/(20S + 20R) and ββ/(αα + ββ) ratios at elevated temperatures when minimized influence from biomarker precursors was expected could be explained by faster thermal alteration of the less than the more stable counterparts [59,85].
Therefore, due to the involvement of biomarker precursors (e.g., bound biomarker, macromolecules) in kerogen and bitumen, the interpretation of changes in hopane and sterane maturity ratio trends was complicated in the present study as in, for example, Pan et al. [86]. Direct isomerization could not be confirmed by a ratio increase accompanied by simultaneous increases in isomers (e.g., 22R and 22S isomers in the 275–300 °C stage). Neither can relative thermal degradation rates be determined among isomers simply based on a reversal in ratio trends (e.g., sterane isomers during the oil window). Both resulted in the absence of a reliable link between isomer ratios and maturity level. However, apparently the analysis of biomarker isomer concentrations shed light on the real driving factor behind isomer ratio changes and could thus be the supplementary maturity assessment tool to the isomer maturity ratios.

5. Implications

Changes in hopane and sterane concentrations and isomerization ratio over a 250–340 °C temperature range (0.71–1.43 %Rm) of hydrous pyrolysis in our study had poor indications for a direct isomerization of hopane and sterane isomers proposed by Mackenzie et al. [18] and hinted the controlling role of biomarker precursor transformation in hopane and sterane thermal conversion before intensive oil cracking occurred. Involvement of non-hydrocarbon biomarker precursors were frequently applied to explain the occurrence of abnormally high isomerization ratios [68,87] and irregular biomarker maturity trends in immature to low mature organic matters [6,88]. However, our data suggested that the influence from biomarker precursors on hopane and sterane thermal conversion could sustain much later to the end of the oil window until 340 °C (1.43 %Rm) at high heating rates applied in pyrolysis experiments.
Previous studies revealed additional complexity caused by involvement of kerogen (or other sources of biomarker precursors) in biomarker thermal evolution [59]. Furthermore, it was found that isomerization reaction driven by low activation energy preferably occurred at low heating rates over a long geological period, whereas thermal cracking and aromatization requiring high activation energy favored rapid heating conditions [25]. Therefore, although artificial heating could somewhat mimic the prolonged geological thermal evolution [89], it often resulted in a hindrance to successful progression of complete hopane and sterane isomerization routes and consequently led to perplexing hopane and sterane isomer distributions [25,34,90]. Such confusing distributions included insufficient hopane and steranes isomerization accompanied by aromatized steroids [1,16,19], delayed biomarker generation and degradation [59], and reversed trends of hopane and sterane isomerization ratios [19]. Isomerization degrees as low as those in our study suggested by 20S/(20S + 20R) and ββ/(αα + ββ) values were also observed in coal maturation sequences under a high anomaly geotherm regime and were explained by the constraints of limited heating time and elevated heating temperature [32,36,61,91]. Furthermore, previous research found high heating rates and temperatures applied in artificial heating enabled concurrence of reactions such as defunctionalization, isomerization and aromatization that normally occur sequentially in natural geological conditions, which further complicated the thermal behavior of hopane and sterane isomers [24,92]. Therefore, the rapid heating conditions in our study and the involvement of various biomarker precursor sources collectively caused the retarded stereochemical conversion of hopanes and steranes before the most intensive biomarker thermal cracking initiated. This highlighted the essential role of sufficient heating time and a normal thermal regime in generating regular behavior of hopane and sterane isomers [1], which was also crucial to establishing the correlations between hopane and sterane maturity parameters with organic matter maturity level. Moreover, this also implied that thermal behavior of biomarkers in hydrous pyrolysis and under geological conditions may be largely incompatible, although long natural thermal evolution history could be theoretically compensated via high heating rates in pyrolysis. Maturity estimation of organic matters developed in high geo-thermal anomalies using biomarker-derived maturity ratios was vulnerable to misleading interpretations.
Like previous studies, the observations in the present study questioned the common application of biomarker isomerization ratios as universally fit maturity gaugers for organic matter different in type and heating history. For example, the fact that Ts/(Ts + Tm) and C29Ts/(C29 αβ-hopane + C29Ts) failed to work for the entire maturation sequence (0.49–1.91 %Rm) contradicted prior application of them in estimating elevated maturities [5,6,37,72]. The observation that the C31 αβ-hopane 22S/(22S + 22R) ratio consistently increased to the end of the oil window (340 °C, 1.43 %Rm) and that the 20S/(20S + 20R) and ββ/(αα + ββ) ratios remained ineffective from the early diagenesis to the oil window (original coal–340 °C, 0.49–1.43 %Rm) unparalleled the widely accepted operating range of these ratios over the early diagenesis to the early oil window stage (<0.7 %Ro). Our findings suggested very poor alignment of isomerization ratio changes with maturity level. Meanwhile, our study also suggested biomarker concentrations may act as effective maturity parameters that could cross-validate the biomarker ratios for maturity assessment for the right maturity range and to avoid wrong interpretations of maturity. van Graas [5] found an extended functioning maturity range of hopane and sterane concentrations to higher maturity levels at 1.0% Ro. Dzou et al. [19] proposed the use of sterane isomer concentration changes to a broader maturity range (>0.7 %Ro) to illuminate the latent reactions responsible for a net 22S/(22R + 22S) ratio increase and revealed simultaneous isomer formation and destruction. Both studies supported the potential of biomarker isomer concentration as effective alternative maturity parameter.

6. Conclusions

A series of hydrous pyrolysis experiments were performed on eight aliquots of an immature brown coal (0.49 %Ro) to eight target heating temperatures ranging from 250–375 °C (0.71–1.91 %Rm). Changes in bulk compositions and concentrations of major saturated compound classes in the total soluble organic material (expelled oil + extractable bitumen) agreed with previous research on natural thermal evolution. However, the normal maturity trends of 22S/(22S + 22R) ratio and C29–C30 βα-moretane/αβ-hopane ratios in the early diagenesis stage (OB–275 °C tSOM, 0.49 %Ro–0.73 %Rm) provided no definite evidence for direct isomerization but indicated influence from biomarker precursors. This factor also resulted in abnormal biomarker maturation trends, including consistent decreases in the Ts/(Ts + Tm), C29Ts/(C29Ts + C29 αβ-hopane), C29 5α-sterane ββ/(αα + ββ) and 20S/(20S + 20R) ratios and continuously high values of the C29-C30 βα-moretane/αβ-hopane ratios until well into the oil window. Due to the rapid heating conditions, biomarker precursor transformation to the less stable isomers concurred with biomarker interconversion, resulting in retarded progression of hopane and sterane isomerization equilibration. Isomerization ratio trends reversed at elevated maturity levels when interference from biomarker precursors was minimized and only at this point could these ratios reliably indicate relative degradation rates of isomers. Generally, no correlation between hopane and sterane isomerization ratios or with the maturity level could be established from our data. While the insufficient heating time and rapid heating rates in artificial maturation may alter the distribution of biomarkers, abnormal occurrence of biomarkers in highly mature geological samples could be the norm, due to the composite impact of much more complicated and diverse processes unveiled by our study. Nevertheless, biomarker concentration provided valuable cross-validation information on maturity level, supplementary to the biomarker isomerization maturity ratios, and thus it should be included in the maturity assessment, especially for highly mature oil and sediment extracts.

Author Contributions

Conceptualization, M.Y. and H.H.; methodology, M.Y. and H.H.; software, M.Y.; validation, M.Y. and H.H.; formal analysis, M.Y.; investigation, M.Y.; resources, H.H.; data curation, M.Y.; writing—original draft preparation, M.Y.; writing—review and editing, H.H.; visualization, M.Y.; supervision, H.H.; project administration, H.H.; funding acquisition, H.H. All authors have read and agreed to the published version of the manuscript.

Funding

This research was funded by National Natural Science Foundation of China (Grant Number 41873049).

Institutional Review Board Statement

Not applicable.

Informed Consent Statement

Not applicable.

Data Availability Statement

No new data were created or analyzed in this study. Data sharing is not applicable to this article.

Acknowledgments

Faculty, staff, and students from China University of Geosciences (Beijing): Dazhen Tang is thanked for providing the original coal sample for the hydrous pyrolysis experiments; Damao Wu is thanked for contributing the petrographic analysis results of the original and residual coal samples. students Qin Wei, Chengyu Chai and Houfei Lin are thanked for sample processing and conducting the hydrous pyrolysis experiments. China Scholarship Council is acknowledged for supporting Mengsha Yin’s study.

Conflicts of Interest

The authors declare no conflict of interest.

References

  1. Grantham, P.J. Sterane isomerisation and moretane/hopane ratios in crude oils derived from Tertiary source rocks. Org. Geochem. 1986, 9, 293–304. [Google Scholar] [CrossRef]
  2. Mackenzie, A.S. Applications of Biological makes in petroleum geochemistry. In Advances in Petroleum Geochemistry; Brooks, J., Welte, D., Eds.; Academic Press: New York, NY, USA, 1984; Volume 1, pp. 115–2104. [Google Scholar]
  3. Seifert, W.K.; Moldowan, J.M. Applications of steranes, terpanes and monoaromatics to the maturation, migration and source of crude oils. Geochim. Cosmochim. Acta 1978, 42, 77–95. [Google Scholar] [CrossRef]
  4. Seifert, W.K.; Moldowan, J.M. The effect of thermal stress on source-rock quality as measured by hopane stereochemistry. Phys. Chem. Earth 1980, 12, 229–237. [Google Scholar] [CrossRef]
  5. van Graas, G.W. Biomarker maturity parameters for high maturities: Calibration of the working range up to the oil/condensate threshold. Org. Geochem. 1990, 16, 1025–1032. [Google Scholar] [CrossRef]
  6. Waples, D.W.; Machihara, T. Biomarkers as maturity indicators. In Biomarkers for Geologists: A Practical Guide to the Application of Steranes and Triterpanes in Petroleum Exploration; AAPG Methods in Exploration Series, 9; The American Association of Petroleum Geologists: Tulsa, OK, USA, 1991; pp. 19–40. [Google Scholar]
  7. Huang, H.; di Primio, R.; Pedersen, J.H.; Silva, R.; Algeer, R.; Ma, J.; Larter, S. On the determination of oil charge history and the practical application of molecular maturity markers. Mar. Pet. Geol. 2022, 139, 105586. [Google Scholar] [CrossRef]
  8. Dahl, J.; Moldowan, J.M.; Suandararaman, P. Relationship of biomarker distribution to depositional environment: Phosphoria Formation, Montana, USA. Org. Geochem. 1993, 20, 1001–1017. [Google Scholar] [CrossRef]
  9. Rullkötter, J.; Marzi, R. Natural and artificial maturation of biological markers in a Toarcian shale from northern Germany. Org. Geochem. 1988, 13, 639–645. [Google Scholar] [CrossRef]
  10. Bechtel, A.; Oberauer, K.; Kostić, A.; Gratzer, R.; Milisavljević, V.; Aleksić, N.; Stojanović, K.; Groß, D.; Sachsenhofer, R.F. Depositional environment and hydrocarbon source potential of the Lower Miocene oil shale deposit in the Aleksinac Basin (Serbia). Org. Geochem. 2018, 115, 93–112. [Google Scholar] [CrossRef] [Green Version]
  11. Sun, T.; Wang, C.; Duan, Y.; Li, Y.; Hu, B. The organic geochemistry of the Eocene–Oligocene black shales from the Lunpola Basin, central Tibet. J. Asian Earth Sci. 2014, 79, 468–476. [Google Scholar] [CrossRef]
  12. Yin, M.; Huang, H.; Cheng, L. Molecular fingerprints in shales from the Sanhu biogenic gas fields in eastern Qaidam Basin, NW China: Evidence of biodegradation of shale organic matter. Mar. Pet. Geol. 2021, 133, 105289. [Google Scholar] [CrossRef]
  13. Sun, X.; Zhang, T.; Sun, Y.; Milliken, K.L.; Sun, D. Geochemical evidence of organic matter source input and depositional environments in the lower and upper Eagle Ford Formation, south Texas. Org. Geochem. 2016, 98, 66–81. [Google Scholar] [CrossRef]
  14. Hackley, P.C.; Ryder, R.T.; Trippi, M.H.; Alimi, H. Thermal maturity of northern Appalachian Basin Devonian shales: Insights from sterane and terpane biomarkers. Fuel 2013, 106, 455–462. [Google Scholar] [CrossRef]
  15. Stojanović, K.; Šajnović, A.; Sabo, T.J.; Golovko, A.; Jovančićević, B. Pyrolysis and catalyzed pyrolysis in the investigation of a neogene shale potential from Valjevo-Mionica Basin, Serbia. Energy Fuels 2010, 24, 4357–4368. [Google Scholar] [CrossRef]
  16. Vuković, N.; Životić, D.; Mendonça Filho, J.G.; Kravić-Stevović, T.; Hámor-Vidó, M.; de Oliveira Mendonça, J.; Stojanović, K. The assessment of maturation changes of humic coal organic matter—Insights from closed-system pyrolysis experiments. Int. J. Coal Geol. 2016, 154–155, 213–239. [Google Scholar] [CrossRef]
  17. Mackenzie, A.S.; McKenzie, D. Isomerization and aromatization of hydrocarbons in sedimentary basins formed by extension. Geol. Mag. 1983, 120, 417–470. [Google Scholar] [CrossRef]
  18. Mackenzie, A.S.; Patience, R.L.; Maxwell, J.R.; Vandenbroucke, M.; Durand, B. Molecular parameters of maturation in the Toarcian shales, Paris Basin, France—I. Changes in the configurations of acyclic isoprenoid alkanes, steranes and triterpanes. Geochim. Cosmochim. Acta 1980, 44, 1709–1721. [Google Scholar] [CrossRef]
  19. Dzou, L.I.P.; Noble, R.A.; Senftle, J.T. Maturation effects on absolute biomarker concentration in a suite of coals and associated vitrinite concentrates. Org. Geochem. 1995, 23, 681–697. [Google Scholar] [CrossRef]
  20. Raymond, A.C.; Murchison, D.G. Effect of igneous activity on molecular-maturation indices in different types of organic matter. Org. Geochem. 1992, 18, 725–735. [Google Scholar] [CrossRef]
  21. Abbott, G.D.; Wang, G.Y.; Eglinton, T.I.; Home, A.K.; Petch, G.S. The kinetics of sterane biological marker release and degradation processes during the hydrous pyrolysis of vitrinite kerogen. Geochim. Cosmochim. Acta 1990, 54, 2451–2461. [Google Scholar] [CrossRef]
  22. van Duin, A.C.T.; Sinninghe Damsté, J.S.; Koopmans, M.P.; van de Graaf, B.; De Leeuw, J.W. A kinetic calculation method of homohopanoid maturation: Applications in the reconstruction of burial histories of sedimentary basins. Geochim. Cosmochim. Acta 1997, 61, 2409–2429. [Google Scholar] [CrossRef]
  23. Murray, I.P.; Love, G.D.; Snape, C.E.; Bailey, N.J.L. Comparison of covalently-bound aliphatic biomarkers released via hydropyrolysis with their solvent-extractable counterparts for a suite of Kimmeridge clays. Org. Geochem. 1998, 29, 1487–1505. [Google Scholar] [CrossRef]
  24. Peters, K.E.; Moldowan, J.M.; Sundararaman, P. Effects of hydrous pyrolysis on biomarker thermal maturity parameters: Monterey Phosphatic and Siliceous members. Org. Geochem. 1990, 15, 249–265. [Google Scholar] [CrossRef]
  25. Li, M.; Wang, P.; Johns, R.B. Changes to unbound biomarkers in low-rank coals during simulated coalification. Energy Fuels 1991, 5, 885–895. [Google Scholar] [CrossRef]
  26. Eglinton, T.I.; Douglas, A.G. Quantitative study of biomarker hydrocarbons released from kerogens during hydrous pyrolysis. Energy Fuels 1988, 2, 81–88. [Google Scholar] [CrossRef]
  27. Farrimond, P.; Bevan, J.C.; Bishop, A.N. Hopanoid hydrocarbon maturation by an igneous intrusion. Org. Geochem. 1996, 25, 149–164. [Google Scholar] [CrossRef]
  28. Chen, Z.; Simoneit, B.R.; Wang, T.G.; Yang, Y.; Ni, Z.; Cheng, B.; Luo, B.; Yang, C.; Chen, T. Biomarker signatures of Sinian bitumens in the Moxi–Gaoshiti Bulge of Sichuan Basin, China: Geological significance for paleo-oil reservoirs. Precambrian Res. 2017, 296, 1–19. [Google Scholar] [CrossRef]
  29. Huang, H.; Li, J. Biomarker signatures of Sinian bitumens in the Moxi–Gaoshiti bulge of Sichuan Basin, China: Geological significance for paleo-oil reservoirs: Discussion. Precambrian Res. 2018, 314, 487–491. [Google Scholar] [CrossRef]
  30. Ritter, U.; Aareskjold, K.; Schou, L. Distributed activation energy models of isomerisation reactions from hydrous pyrolysis. Org. Geochem. 1993, 20, 511–520. [Google Scholar] [CrossRef]
  31. Landais, P.; Michels, R.; Elie, M. Are time and temperature the only constraints to the simulation of organic matter maturation? Org. Geochem. 1994, 22, 617–630. [Google Scholar] [CrossRef]
  32. Tannenbaum, E.; Ruth, E.; Kaplan, I.R. Steranes and triterpanes generated from kerogen pyrolysis in the absence and presence of minerals. Geochim. Cosmochim. Acta 1986, 50, 805–812. [Google Scholar] [CrossRef]
  33. Bishop, A.N.; Love, G.D.; McAulay, A.D.; Snape, C.E.; Farrimond, P. Release of kerogen-bound hopanoids by hydropyrolysis. Org. Geochem. 1998, 29, 989–1001. [Google Scholar] [CrossRef]
  34. Li, Z.; Huang, H.; Zhang, S. The effect of biodegradation on bound biomarkers released from intermediate-temperature gold-tube pyrolysis of severely biodegraded Athabasca bitumen. Fuel 2020, 263, 116669. [Google Scholar] [CrossRef]
  35. Lockhart, R.S.; Meredith, W.; Love, G.D.; Snape, C.E. Release of bound aliphatic biomarkers via hydropyrolysis from Type II kerogen at high maturity. Org. Geochem. 2008, 39, 1119–1124. [Google Scholar] [CrossRef]
  36. Love, G.D.; McAulay, A.; Snape, C.E.; Bishop, A.N. Effect of process variables in catalytic hydropyrolysis on the release of covalently bound aliphatic hydrocarbons from sedimentary organic matter. Energy Fuels 1997, 11, 522–531. [Google Scholar] [CrossRef]
  37. Qian, Y.; Zhang, T.; Wang, Z.; Tuo, J.; Zhang, M.; Wu, C.; Tian, C. Organic geochemical characteristics and generating potential of source rocks from the Lower-Middle Jurassic coal-bearing strata in the East Junggar Basin, NW China. Mar. Pet. Geol. 2018, 93, 113–126. [Google Scholar] [CrossRef]
  38. Zeng, Q.; Pu, Y.; Cao, Z. Kinetics of oxidation and spontaneous combustion of major super-thick coal seam in Eastern Junggar Coalfield, Xinjiang, China. J. Loss Prev. Process Ind. 2018, 56, 128–136. [Google Scholar] [CrossRef]
  39. Luo, Q.; Zhong, N.; Dai, N.; Zhang, W. Graptolite-derived organic matter in the Wufeng-Longmaxi Formations (Upper Ordovician-Lower Silurian) of southeastern Chongqing, China: Implications for gas shale evaluation. Int. J. Coal Geol. 2016, 153, 87–98. [Google Scholar] [CrossRef]
  40. Luo, Q.; Qu, Y.; Chen, Q.; Xiong, Z. Organic geochemistry and petrology of mudrocks from the upper Carboniferous Batamayineishan Formation, Wulungu Area, Junggar Basin, China: Implications for petroleum exploration. Energy Fuels 2017, 31, 10628–10638. [Google Scholar] [CrossRef]
  41. Barker, C.E.; Lewan, M.D.; Pawlewicz, M.J. The influence of extractable organic matter on vitrinite reflectance suppression: A survey of kerogen and coal types. Int. J. Coal Geol. 2007, 70, 67–78. [Google Scholar] [CrossRef]
  42. Guan, D.; Xu, X.; Li, Z.; Zheng, L.; Tan, C.; Yao, Y. Theory and practice of hydrocarbon generation within space-limited source rocks. In Springer Geology; Springer: Singapore, 2017; pp. 1–189. [Google Scholar]
  43. Lewan, M.D.; Winters, J.C.; McDonald, J.H. Generation of oil-like pyrolyzates from organic-rich shales. Science 1979, 203, 897–899. [Google Scholar] [CrossRef]
  44. Eseme, E.; Littke, R.; Krooss, B.M.; Schwarzbauer, J. Experimental investigation of the compositional variation of petroleum during primary migration. Org. Geochem. 2007, 38, 1373–1397. [Google Scholar] [CrossRef]
  45. Fan, Z.; Philp, R.P. Laboratory biomarker fractionations and implications for migration studies. Org. Geochem. 1987, 11, 169–175. [Google Scholar]
  46. Jiang, Z.; Philp, R.P.; Lewis, C.A. Fractionation of biological markers in crude oils during migration and the effects on correlation and maturation parameters. Org. Geochem. 1988, 13, 561–571. [Google Scholar]
  47. Shi, Q.; Hou, D.; Chung, K.H.; Xu, C.; Zhao, S.; Zhang, Y. Characterization of heteroatom compounds in a crude oil and its saturates, aromatics, resins, and asphaltenes (SARA) and non-basic nitrogen fractions analyzed by negative-ion electrospray ionization Fourier transform ion cyclotron resonance mass spectrometry. Energy Fuels 2010, 24, 2545–2553. [Google Scholar]
  48. Shao, X.; Pang, X.; Li, M.; Li, Z.; Zhao, Y. Hydeocarbon generation from lacustrine shales with retained oil during thermal maturation. Pet. Sci. 2020, 17, 1478–1490. [Google Scholar] [CrossRef]
  49. Spigolon, A.L.D.; Lewan, M.D.; de Barros Penteado, H.L.; Coutinho, L.F.C.; Mendonça Filho, J.G. Evaluation of the petroleum composition and quality with increasing thermal maturity as simulated by hydrous pyrolysis: A case study using a Brazilian source rock with Type I kerogen. Org. Geochem. 2015, 83–84, 27–53. [Google Scholar] [CrossRef]
  50. Garcia, R.; Moinelo, S.R.; Lafferty, C.J.; Snape, C.E. Pyrolytic desulfurization of some high-sulfur coals. Energy Fuels 1991, 5, 582–586. [Google Scholar] [CrossRef]
  51. Vu, T.T.A.; Zink, K.G.G.; Mangelsdorf, K.; Sykes, R.; Wilkes, H.; Horsfield, B. Changes in bulk properties and molecular compositions within New Zealand Coal Band solvent extracts from early diagenetic to catagenetic maturity levels. Org. Geochem. 2009, 40, 963–977. [Google Scholar] [CrossRef]
  52. Elie, M.; Mazurek, M. Biomarker transformations as constraints for the depositional environment and for maximum temperatures during burial of Opalinus Clay and Posidonia Shale in northern Switzerland. Appl. Geochem. 2008, 23, 3337–33354. [Google Scholar] [CrossRef]
  53. Jenisch, A.; Richnow, H.H.; Michaelis, W. Chemical structural units of macromolecular coal components. Org. Geochem. 1990, 16, 917–929. [Google Scholar] [CrossRef]
  54. Koopmans, M.P.; De Leeuw, J.W.; Lewan, M.D.; Damsté, J.S.S. Impact of dia- and catagenesis on sulphur and oxygen sequestration of biomarkers as revealed by artificial maturation of an immature sedimentary rock. Org. Geochem. 1996, 25, 391–426. [Google Scholar] [CrossRef]
  55. Farrimond, P.; Love, G.D.; Bishop, A.N.; Innes, H.E.; Watson, D.F.; Snape, C.E. Evidence for the rapid incorporation of hopanoids into kerogen. Geochim. Cosmochim. Acta 2003, 67, 1383–1394. [Google Scholar] [CrossRef]
  56. Lee, C.; Love, G.D.; Jahnke, L.L.; Kubo, M.D.; Des Marais, D.J. Early diagenetic sequestration of microbial mat lipid biomarkers through covalent binding into insoluble macromolecular organic matter (IMOM) as revealed by sequential chemolysis and catalytic hydropyrolysis. Org. Geochem. 2019, 132, 11–22. [Google Scholar] [CrossRef]
  57. Bowden, S.A.; Farrimond, P.; Snape, C.E.; Love, G.D. Compositional differences in biomarker constituents of the hydrocarbon, resin, asphaltene and kerogen fractions: An example from the Jet Rock (Yorkshire, UK). Org. Geochem. 2006, 37, 369–383. [Google Scholar] [CrossRef]
  58. Sinninghe Damsté, J.S.; Van Duin, A.C.T.; Hollander, D.; Kohnen, M.E.L.; De Leeuw, J.W. Early diagenesis of bacteriohopanepolyol derivatives: Formation of fossil homohopanoids. Geochim. Cosmochim. Acta 1995, 59, 5141–5157. [Google Scholar] [CrossRef]
  59. Farrimond, P.; Taylor, A.; TelnÆs, N. Biomarker maturity parameters: The role of generation and thermal degradation. Org. Geochem. 1998, 29, 1181–1197. [Google Scholar] [CrossRef]
  60. Norgate, C.M.; Boreham, C.J.; Wilkins, A.J. Changes in hydrocarbon maturity indices with coal rank and type, Buller Coalfield, New Zealand. Org. Geochem. 1999, 30, 985–1010. [Google Scholar] [CrossRef]
  61. Farrimond, P.; Bevan, J.C.; Bishop, A.N. Tricyclic terpane maturity parameters: Response to heating by an igneous intrusion. Org. Geochem. 1999, 30, 1011–1019. [Google Scholar] [CrossRef]
  62. Farrimond, P.; Telnæs, N. Three series of rearranged hopanes in Toarcian sediments (northern Italy). Org. Geochem. 1996, 25, 165–177. [Google Scholar] [CrossRef]
  63. Tannenbaum, E.; Aizenshtat, Z. Formation of immature asphalt from organic-rich carbonate rocks—II. Correlation of maturation indicators. Org. Geochem. 1984, 6, 503–511. [Google Scholar] [CrossRef]
  64. Ensminger, A.; van Dorsselaer, A.; Spyckerelle, C.; Albrecht, P.; Ourisson, G. Pentacyclic triterpenes of the hopane type as ubiquitous geochemical markers: Origin and significance. In Advances in Organic Geochemistry; Tissot, B., Bienner, F., Eds.; Editions Technip: Paris, France, 1973; pp. 245–260. [Google Scholar]
  65. Rosa-Putra, S.; Nalin, R.; Domenach, A.M.; Rohmer, M. Novel hopanoids from Frankia spp. and related soil bacteria. Eur. J. Biochem. 2001, 268, 4300–4306. [Google Scholar] [CrossRef] [PubMed]
  66. Zhang, Z.; Wang, C.; Qiu, X.; Huang, X.; Xie, S. Occurrence of highly abundant bacterial hopanoids in Dajiuhu peatland, central China. Front. Earth Sci. China 2009, 3, 320–326. [Google Scholar] [CrossRef]
  67. Sinninghe Damsté, J.S.; Schouten, S.; Volkman, J.K. C27–C30 neohop-13(18)-enes and their saturated and aromatic derivatives in sediments: Indicators for diagenesis and water column stratification. Geochim. Cosmochim. Acta 2014, 133, 402–421. [Google Scholar] [CrossRef] [Green Version]
  68. ten Haven, H.L.; De Leeuw, J.W.; Peakman, T.M.; Maxwell, J.R. Anomalies in steroid and hopanoid maturity indices. Geochim. Cosmochim. Acta 1986, 50, 853–855. [Google Scholar] [CrossRef]
  69. Sun, L.; Zhang, Z.; Wu, Y.; Wang, Z.; Shen, Q. Features of liquid hydrocarbon and biomarker maturity ratios during HTHP semi-open system pyrolysis of type II and III source rocks. Pet. Sci. Technol. 2017, 35, 1063–1069. [Google Scholar] [CrossRef]
  70. Lu, S.T.; Ruth, E.; Kaplan, I.R. Pyrolysis of kerogens in the absence and presence of montmorillonite-I. The generation, degradation and isomerization of steranes and triterpanes at 200 and 300 °C. Org. Geochem. 1989, 14, 491–499. [Google Scholar] [CrossRef]
  71. Love, G.D.; Snape, C.E.; Carr, A.D.; Houghton, R.C. Release of covalently-bound alkane biomarkers in high yields from kerogen via catalytic hydropyrolysis. Org. Geochem. 1995, 23, 981–986. [Google Scholar] [CrossRef]
  72. Fang, R.; Littke, R.; Zieger, L.; Baniasad, A.; Li, M.; Schwarzbauer, J. Changes of composition and content of tricyclic terpane, hopane, sterane, and aromatic biomarkers throughout the oil window: A detailed study on maturity parameters of Lower Toarcian Posidonia Shale of the Hils Syncline, NW Germany. Org. Geochem. 2019, 138, 103928. [Google Scholar] [CrossRef]
  73. Koopmans, M.P.; Schaeffer-Reiss, C.; De Leeuw, J.W.; Lewan, M.D.; Maxwell, J.R.; Schaeffer, P.; Damsté, J.S.S. Sulphur and oxygen sequestration of n-C37 and n-C38 unsaturated ketones in an immature kerogen and the release of their carbon skeletons during early stages of thermal maturation. Geochim. Cosmochim. Acta 1997, 61, 2397–2408. [Google Scholar] [CrossRef]
  74. Seifert, W.K. Steranes and terpanes in kerogen pyrolysis for correlation of oils and source rocks. Geochim. Cosmochim. Acta 1978, 42, 473–484. [Google Scholar] [CrossRef]
  75. Alexander, R.; Kagi, R.I.; Noble, R.; Volkman, J.K. Identification of some bicyclic alkanes in petroleum. Org. Geochem. 1984, 6, 63–72. [Google Scholar] [CrossRef]
  76. Tissot, B.P.; Welte, D.H. Petroleum Formation and Occurrence; Springer: Berlin/Heidelberg, Germany; New York, NY, USA, 1984; p. 699. [Google Scholar]
  77. Moldowan, J.M.; Dahl, J.; Zinniker, D.; Barbanti, S.M. Underutilized advanced geochemical technologies for oil and gas exploration and production-1. The diamondoids. J. Pet. Sci. Eng. 2015, 126, 87–96. [Google Scholar] [CrossRef]
  78. van Graas, G.W. Biomarker distributions in asphaltenes and kerogens analysed by flash pyrolysis-gas chromatography-mass spectrometry. Org. Geochem. 1986, 10, 1127–1135. [Google Scholar] [CrossRef]
  79. Pan, C.; Geng, A.; Zhong, N.; Liu, J. Kerogen pyrolysis in the presence and absence of water and minerals: Steranes and triterpenoids. Fuel 2010, 89, 336–345. [Google Scholar] [CrossRef]
  80. Chen, Z.; Simoneit, B.R.; Wang, T.G.; Huang, W.; Yan, D.; Ni, Z.; Liu, K. Effects of high temperatures on biomarker ratios during oil-to-gas cracking experiments at two pressures. Org. Geochem. 2016, 101, 108–131. [Google Scholar] [CrossRef]
  81. Peters, K.E.; Moldowan, J.M. Effects of source, thermal maturity, and biodegradation on the distribution and isomerization of homohopanes in petroleum. Org. Geochem. 1991, 17, 47–61. [Google Scholar] [CrossRef]
  82. Strachan, M.G.; Alexander, R.; Subroto, E.A.; Kagi, R.I. Constraints upon the use of 24-ethylcholestane diastereomer ratios as indicators of the maturity of petroleum. Org. Geochem. 1989, 14, 423–432. [Google Scholar] [CrossRef]
  83. Bishop, A.N.; Abbott, G.D. The interrelationship of biological marker maturity parameters and molecular yields during contact metamorphism. Geochim. Cosmochim. Acta 1993, 57, 3661–3668. [Google Scholar] [CrossRef]
  84. Mißbach, H.; Duda, J.P.; Lünsdorf, N.K.; Schmidt, B.C.; Thiel, V. Testing the preservation of biomarkers during experimental maturation of an immature kerogen. Int. J. Astrobiol. 2016, 15, 165–175. [Google Scholar] [CrossRef]
  85. Requejo, A.G. Maturation of petroleum source rocks—II. Quantitative changes in extractable hydrocarbon content and composition associated with hydrocarbon generation. Org. Geochem. 1994, 21, 91–105. [Google Scholar] [CrossRef]
  86. Pan, C.; Peng, D.; Zhang, M.; Yu, L.; Sheng, G.; Fu, J. Distribution and isomerization of C31–C35 homohopanes and C29 steranes in oligocene saline lacustrine sediments from Qaidam Basin, Northwest China. Org. Geochem. 2008, 39, 646–657. [Google Scholar] [CrossRef]
  87. Köster, J.; Van Kaam-Peters, H.M.E.; Koopmans, M.P.; De Leeuw, J.W.; Sinninghe Damsté, J.S. Sulphurisation of homohopanoids: Effects on carbon number distribution, speciation, and 22S/22R epimer ratios. Geochim. Cosmochim. Acta 1997, 61, 2431–2452. [Google Scholar] [CrossRef]
  88. Peakman, T.M.; Maxwell, J.R. Early diagenetic pathways of steroid alkenes. Org. Geochem. 1988, 13, 583–592. [Google Scholar] [CrossRef]
  89. Han, Z.; Yang, Q.; Pang, Z. Artificial maturation study of a humic coal and a torbanite. Int. J. Coal Geol. 2001, 46, 133–143. [Google Scholar] [CrossRef]
  90. Liang, M.; Wang, Z.; Zheng, J.; Li, X.; Wang, X.; Gao, Z.; Luo, H.; Li, Z.; Qian, Y. Hydrous pyrolysis of different kerogen types of source rock at high temperature-bulk results and biomarkers. J. Pet. Sci. Eng. 2015, 125, 209–217. [Google Scholar] [CrossRef]
  91. Strachan, M.G.; Alexander, R.; Van Bronswijk, W.; Kagi, R.I. Source and heating rate effects upon maturity parameters based on ratios of 24-ethylcholestane diastereomers. J. Geochem. Explor. 1989, 31, 285–294. [Google Scholar] [CrossRef]
  92. Lewan, M.D.; Bjorøy, M.; Dolcater, D.L. Effects of thermal maturation on steroid hydrocarbons as determined by hydrous pyrolysis of Phosphoria Retort Shale. Geochim. Cosmochim. Acta 1986, 50, 1977–1987. [Google Scholar] [CrossRef]
Figure 1. A location map of the Beishan Coalfield and the sampling site (Adapted from Zeng et al. [38]).
Energies 15 02595 g001
Figure 2. (A) Changes in saturated hydrocarbons, aromatic hydrocarbons, resins and asphaltenes (SARA) compositions (μg/g coal) in the original bitumen (OB) and the total soluble organic materials (tSOMs); (B) Bitumen yield (μg/g coal) from the original coal, expelled oil and extractable bitumen contents (μg/g coal) in the tSOMs, and hydrocarbon and nonhydrocarbon gas percentages (%) generated under different heating target temperatures (own elaboration); (C) Yields of bulk hydrocarbons generated under different heating target temperatures 2015. (D) Yields of total expulsed oil and various compound classes under different heating target temperatures of semi-open pyrolysis of a preheated immature shale core to 350 °C from the Bohai Bay Basin, China, after Shao et al. [48]. In (A,B), the OB was assigned a heating temperature of 220 °C for visualization purpose only. Asphaltene content was divided by 10 to be displayed on the same scale as the other SARA fractions. Sat.: saturated hydrocarbons; Aro.: aromatic hydrocarbons; Res.: resins; Asp.: asphaltenes.
Energies 15 02595 g002
Figure 3. Changes in the concentrations of different saturated hydrocarbon compound classes in the OB and in the tSOMs (own elaboration),. Each data dot on subfigure (AF) represents the concentration of the compound class generated either in the original bitumen (OB) or in the total soluble organic material (tSOM) under different heating target temperatures. Note: The OB was assigned a heating temperature of 220 °C for visualization purpose only. See Table 1 for the formula of the summed concentration of each compound class.
Energies 15 02595 g003
Figure 4. Distribution pattern of (A) terpanes on the m/z 191 selected ion chromatogram trace and (B) steranes on the m/z 217 trace in the OB and the tSOMs (own elaboration). Peak identification was referred to Farrimond et al., (1996): 1. C21 tricyclic terpane; 2. C23 tricyclic terpane; 3. C27 18α-22,29,30-trisnorneohopane (Ts), 4. C27 17α-22,29,30-trisnorhopane (Tm); 5. C27 17β-22,29,30-trisnorhopane; 6. C29 neohop13(18)ene; 7. C29 αβ-norhopane; 8. C29 18α-30-norneohopane (C29Ts); 9. C29 βα-moretane; 10. C30 αβ-hopane; 11. C30 neohop13(18)ene; 12. C29 ββ-hopane; 13. C30 βα-moretane; 14. C31 αβ-22S-hopane; 15. C31 αβ-22R-hopane; 16. C30 ββ-hopane; 17. C32 αβ-22S-hopane; 18. C32 αβ-22R-hopane; 19. C31 ββ-hopane; 20. C33 αβ-22S-hopane; 21. C33 αβ-22R-hopane; 22. C29 ααS-sterane; 23. C29 ββR-sterane; 24. C29 ββS-sterane; 25. C29 ααR-sterane.
Energies 15 02595 g004aEnergies 15 02595 g004b
Figure 5. Variations in hopane and sterane isomer concentrations in the OB and the tSOMs (own elaboration). Each data dot on subfigure (AD) represents concentration of the corresponding compound in either the original bitumen (OB) or the total soluble organic material (tSOM), e.g., OB C27 17β-hopane referring to the concentration of C27 17β-hopane in the original bitumen. The OB was assigned a heating temperature of 220 °C for visualization purpose only. See Figure 4 for peak identification.
Energies 15 02595 g005
Figure 6. Changes in hopane and sterane maturity ratios in the OB and the tSOMs generated under different target temperatures (own elaboration). Each data dot on subfigure (AD) represents ratio value in either the original bitumen (OB) or the total soluble organic material (tSOM), e.g., OB Ts/(Ts + Tm) referring to the Ts/(Ts + Tm) ratio value generated in the original bitumen. The OB was assigned a heating temperature of 220 °C for visualization purpose only. C29 βα/αβ = C29 βα-moretane/C29 αβ-hopane; C30 βα/αβ = C30 βα-moretane/C30 αβ-hopane. See Figure 4 and Table 1 for peak identification and ratio explanation.
Energies 15 02595 g006
Table 1. Changes in investigated isomer concentrations (µg/g tSOM), compound class concentrations (µg/g tSOM) and biomarker ratios in the OB and the tSOMs (own elaboration).
Peak No. in Figure 4Sample TypeOBtSOMtSOMtSOMtSOMtSOMtSOMtSOMtSOM
heating target temperature (°C)\250275300320340350360375
Ro (%)0.490.710.730.91.191.431.51.741.91
3Ts02410103411
4Tm462543093493417330246
5C27 17β-hopane82311320278161249164
6C29 neohop13(18)ene135625000000
7C29 αβ-hopane252375104744248640349
8C29Ts530000000
9C29 βα-moretane3427056157451510447408
10C30 αβ-hopane614015033783256128279
11C30 neohop13(18)ene4210000000
12C29 ββ-hopane258273600000
13C30 βα-moretane884835715434658938368
14C31 αβ-hopane 22S1075961199921962
15C31 αβ-hopane 22R41177211194121188113
16C30 ββ-hopane764153022221793013143
19C31 ββ-hopane166764876310451
22C29 αα-20S-sterane21315674111
23C29 ββ-20R-sterane8323820106342
24C29 ββ-20S-sterane41513313101
25C29 αα-20R-sterane858765529171195
C29 βα-moretane/C29 αβ-hopane1.361.141.101.211.211.211.181.180.89
C30 βα-moretane/C30 αβ-hopane1.441.201.141.441.431.461.361.330.89
Ts/(Ts + Tm)00.090.03000.040.120.040.14
C29Ts/(C29Ts + C29 αβ-hopane)0.170.010000000
22S/(22S + 22R)0.200.300.310.380.450.540.530.350.40
20S/(20R + 20S)0.270.240.200.110.170.230.130.070.22
ββ/(αα + ββ)0.550.400.360.270.230.300.250.290.33
n-alkanes150420,34120,00326,63039,71724,92227,89518,1116085
Pr + Ph33818552716336527651030704721149
alkyl-cyclohexanes77144215807291072705738456164
bicyclic sesquiterpanes97710531942283150333
tricyclic terpanes212512391141153531168
pentacyclic terpanes380256231542500220042519317546
steranes4231334313480149126
Note: 20S/(20R + 20S) = (C29 ββ-20S-, + C29 αα-20S-steranes)/(C29 ββ-20S-, + C29 αα-20S-, + C29 ββ-20R-, + C29 αα-20R-steranes); ββ/(ββ + αα) = (C29 ββ-20S-, + C29 ββ-20R-steranes)/(C29 ββ-20S-, + C29 αα-20S-, + C29 ββ-20R-, + C29 αα-20R-steranes); 22S/(22S + 22R) = C31 αβ-hopane 22S/(22S + 22R); n-alkanes were calculated from n-C11n-C35; alkyl-cyclohexanes were calculated from C8–C27 homologues; bicyclic sesquiterpanes were calculated from C14–C16 homologues; tricyclic terpanes were calculated from C19–C26 tricyclic terpanes; pentacyclic terpanes were calculated from C27–C35 hopanes; steranes were calculated from C27–C29 5α-steranes (ααS, ββR, ββS, ααR). See Figure 4 for peak identification and explanation for compound abbreviations.
Publisher’s Note: MDPI stays neutral with regard to jurisdictional claims in published maps and institutional affiliations.

