1. Introduction
Lithium-ion batteries are widely used in electric vehicles due to their great energy density, high voltage, and small self-discharge rate [
1,
2]. However, lithium-ion batteries should be working under certain temperature conditions. The best temperature range is usually between 20 °C and 40 °C, and the maximum temperature difference should be controlled within 5 °C [
3,
4]. Excessively higher or lower temperatures could affect the normal working of the battery, reduce its capacity, and shorten its life [
5]. When the temperature is extremely high, thermal runaway may even occur, resulting in security incidents [
6]. In addition, lithium-ion batteries will release a large amount of heat during long-term cycles and rapid charging and discharging processes. Insufficient and uneven heat dissipation can easily lead to local heat accumulations, which cause uneven temperature distributions in the batteries and in the battery pack, and affect their consistency and safety [
7]. Therefore, it is essential to employ an effective battery thermal management system (BTMS) to regulate the temperatures and equalize the heat in the batteries.
According to the kinds of heat transfer mediums, the BTMSs commonly used in electric vehicles mainly include air cooling, liquid cooling, heat pipe cooling, PCM cooling, and hybrid cooling. The air-cooling type relies on the air as the heat transfer medium [
8]. However, due to the smaller specific heat capacity and lower thermal conductivity of the air, its temperature regulation and thermal equalization capabilities are usually not as good as those of the liquid cooling type. The liquid cooling type can be further classified into indirect cooling and direct cooling (also known as immersion cooling). Indirect cooling is to attach one or a few cooling plate(s) or pipe(s) on the cells, and the heat is taken away by the flowing coolant (such as a water–glycol solution) in the channel(s) of the cooling plate(s) or pipe(s) [
9,
10,
11,
12]. Direct cooling is usually to immerse the cells in the coolant, so it can directly contact the cells, and absorb the heat from them. According to the working state of the coolant, the BTMS with immersion cooling can be further classified into liquid-filled BTMS and liquid-circulated BTMS [
13]. In the former, the coolant is stationary, and in the latter, the coolant is circulating. In addition, phase change materials (PCMs) and heat pipes are also commonly used in the research on BTMSs [
14,
15]. Moreover, hybrid cooling is used to combine two or more cooling methods to improve the cooling efficiency of the whole system. The characteristics of these BTMS technologies are summarized in
Table 1, including their application levels, advantages, and limitations [
16,
17,
18,
19,
20].
In immersion cooling, the coolant is in direct contact with the cells, eliminating the thermal resistance caused by the air gaps and thermal conductive materials. So, theoretically its heat transfer efficiency will be high. Chen et al. [
21] compared the thermal management performance of several different cooling methods by experiment and calculation, including air cooling, plate cooling, and immersion cooling. It was found that when obtaining the same cooling effects, the air cooling consumed more energy, while the two liquid cooling methods consumed less. However, under small mass flow rates, the immersion cooling worked better in controlling the maximum temperature and maximum temperature difference of the cells than the plate cooling. Dubey et al. [
22] compared the performance of immersion cooling and plate cooling applied on a 21,700 lithium-ion battery module by the CFD method. It was found that the performance of the two methods was basically the same at a lower discharge rate. However, at a higher discharge rate, the maximum temperature and maximum temperature difference in the battery module with immersion cooling were both remarkably lower than those in the battery module with plate cooling. Besides, with the increase in the flow rate of the coolant, the pressure drop in the cooling plate rose significantly, up to 15–25 times that of the immersion cooling.
However, since the cells are immersed in the coolant directly, the coolant must be a fluid with insulation resistivity. So, conductive coolants are no longer suitable for the BTMS with immersion cooling. For example, Sundin et al. [
23] investigated the application of a non-conductive AmpCool AC-100 coolant developed by Engineered Fluids in the BTMS with immersion cooling. It was found that the average temperature of the cells was maintained at about 22.5 °C during rapid charging and discharging cycles, and the temperature fluctuation of each monitor was very small. In contrast, when forced air cooling was used, the average temperature was 28.7 °C, and the temperature fluctuation was much greater. Bhattacharjee et al. [
24] designed an immersion cooling system for a lithium-ion battery stack at the scale of kWs. The system also used the AmpCool AC-100 coolant developed by Engineered Fluids. Simulation results showed that, compared with air cooling and plate cooling, the immersion cooling could significantly reduce the maximum temperature of the battery stack during discharging. Jithin et al. [
25] applied deionized water, mineral oil, and AmpCool AC-100 to the BTMS with immersion cooling. It was found that the deionized water could control the average temperature rise of the cells within 5 °C under low mass flow rate (0.003 kg/s). Its cooling effect was the best, and its power consumption was the lowest. The cooling effects of mineral oil and AmpCool AC-100 were similar, but the power consumption of AmpCool AC-100 was less.
Tian et al. [
26] applied hydrofluoroether (HFE-6120) to a BTMS with immersion cooling, and found that compared with those of air cooling, the maximum temperature, maximum temperature difference, and temperature standard deviation of the battery module with immersion cooling were significantly reduced under the same power consumption. Wang et al. [
27] used a transformer oil with high insulation resistivity as the coolant, and designed an immersion cooling thermal management system for pouch-type lithium-ion cells. The effects of the immersion depth and the flow rate on the maximum temperature and the maximum temperature difference were investigated. It was found that when the cells were completely immersed in the coolant, the cooling performance was the best. By increasing the flow rate of the coolant, the cooling performance could be further improved. Patil et al. [
28] immersed the pouch-type lithium-ion cells in a non-conductive coolant, and designed a BTMS with immersion cooling. It was found that when the coolant was flowing and tab cooling was assisted, the cells could obtain the lowest temperature rise and the smallest temperature difference. Meanwhile, the effects of the discharge rate, spacing between the cells, type and flow rate of the coolant, and inlet and outlet positions on the thermal management performance were investigated.
Typically, the coolant of the BTMS with immersion is in direct contact with the cells. However, Luo et al. [
29] designed a special sealing structure for the battery module. Water was injected into the cooling channels as the coolant, which could directly contact the cells without causing a short circuit. It was found that the maximum temperature of the cells discharged at 2C could be controlled below 50 °C at the flow rate of 200 mL/min, and the maximum temperature difference could be controlled within 5 °C at the flow rate of 500 mL/min.
Thermal safety design for cells is also essential in BTMSs [
30]. The immersion cooling with the application of the dielectric coolant can effectively inhibit the propagation if the thermal runaway of a single cell occurs [
20]. For example, Wu et al. [
31] used silicone oil as the coolant to design a BTMS based on immersion cooling. The temperatures of the battery modules with immersion cooling and with tubular liquid cooling were compared through numerical simulations. It was found that the maximum temperature rise and maximum temperature difference of the battery module with immersion cooling were significantly lower than those with tubular liquid cooling, and the immersion cooling could effectively suppress the spread of thermal runaway.
In summary, immersion cooling has a simpler design structure and lower pressure drop, and could achieve better performance in BTMSs. With the continuous increase in consumers’ demands for the power of electric vehicles, as well as the rapid application of fast charging technology, higher requirements have been surfaced for BTMSs under high-rate charge and discharge conditions. It is necessary to investigate the performance and design method of immersion cooling in the BTMS more deeply. However, the current studies on BTMSs with immersion cooling did not investigate the effects of the viscosity, specific heat capacity, thermal conductivity, and other material parameters of the coolant on the thermal management performance of the system, nor did they discuss the pressure drop of the coolant. To fill the above knowledge gaps, this research designed a BTMS with immersion cooling based on the pouch-type lithium-ion cells and the coolant of dimethyl silicone oil. The coolant was in direct contact with the cells and absorbed the heat. The performance of the BTMS was obtained by a numerical method and compared with that of the natural cooling method. The effects of the flow rate, viscosity, specific heat capacity, and thermal conductivity of the coolant on the maximum temperature (MAT) and the maximum temperature difference (MATD) of the cell, as well as the pressure drop of the coolant, were further investigated, which could provide references for the design and application of BTMSs with immersion cooling in the future.
3. Performance of BTMS with Immersion Cooling
According to whether the coolant experiences phase transition during the convective heat transfer process [
35], immersion cooling can be classified into single-phase immersion cooling and two-phase immersion cooling [
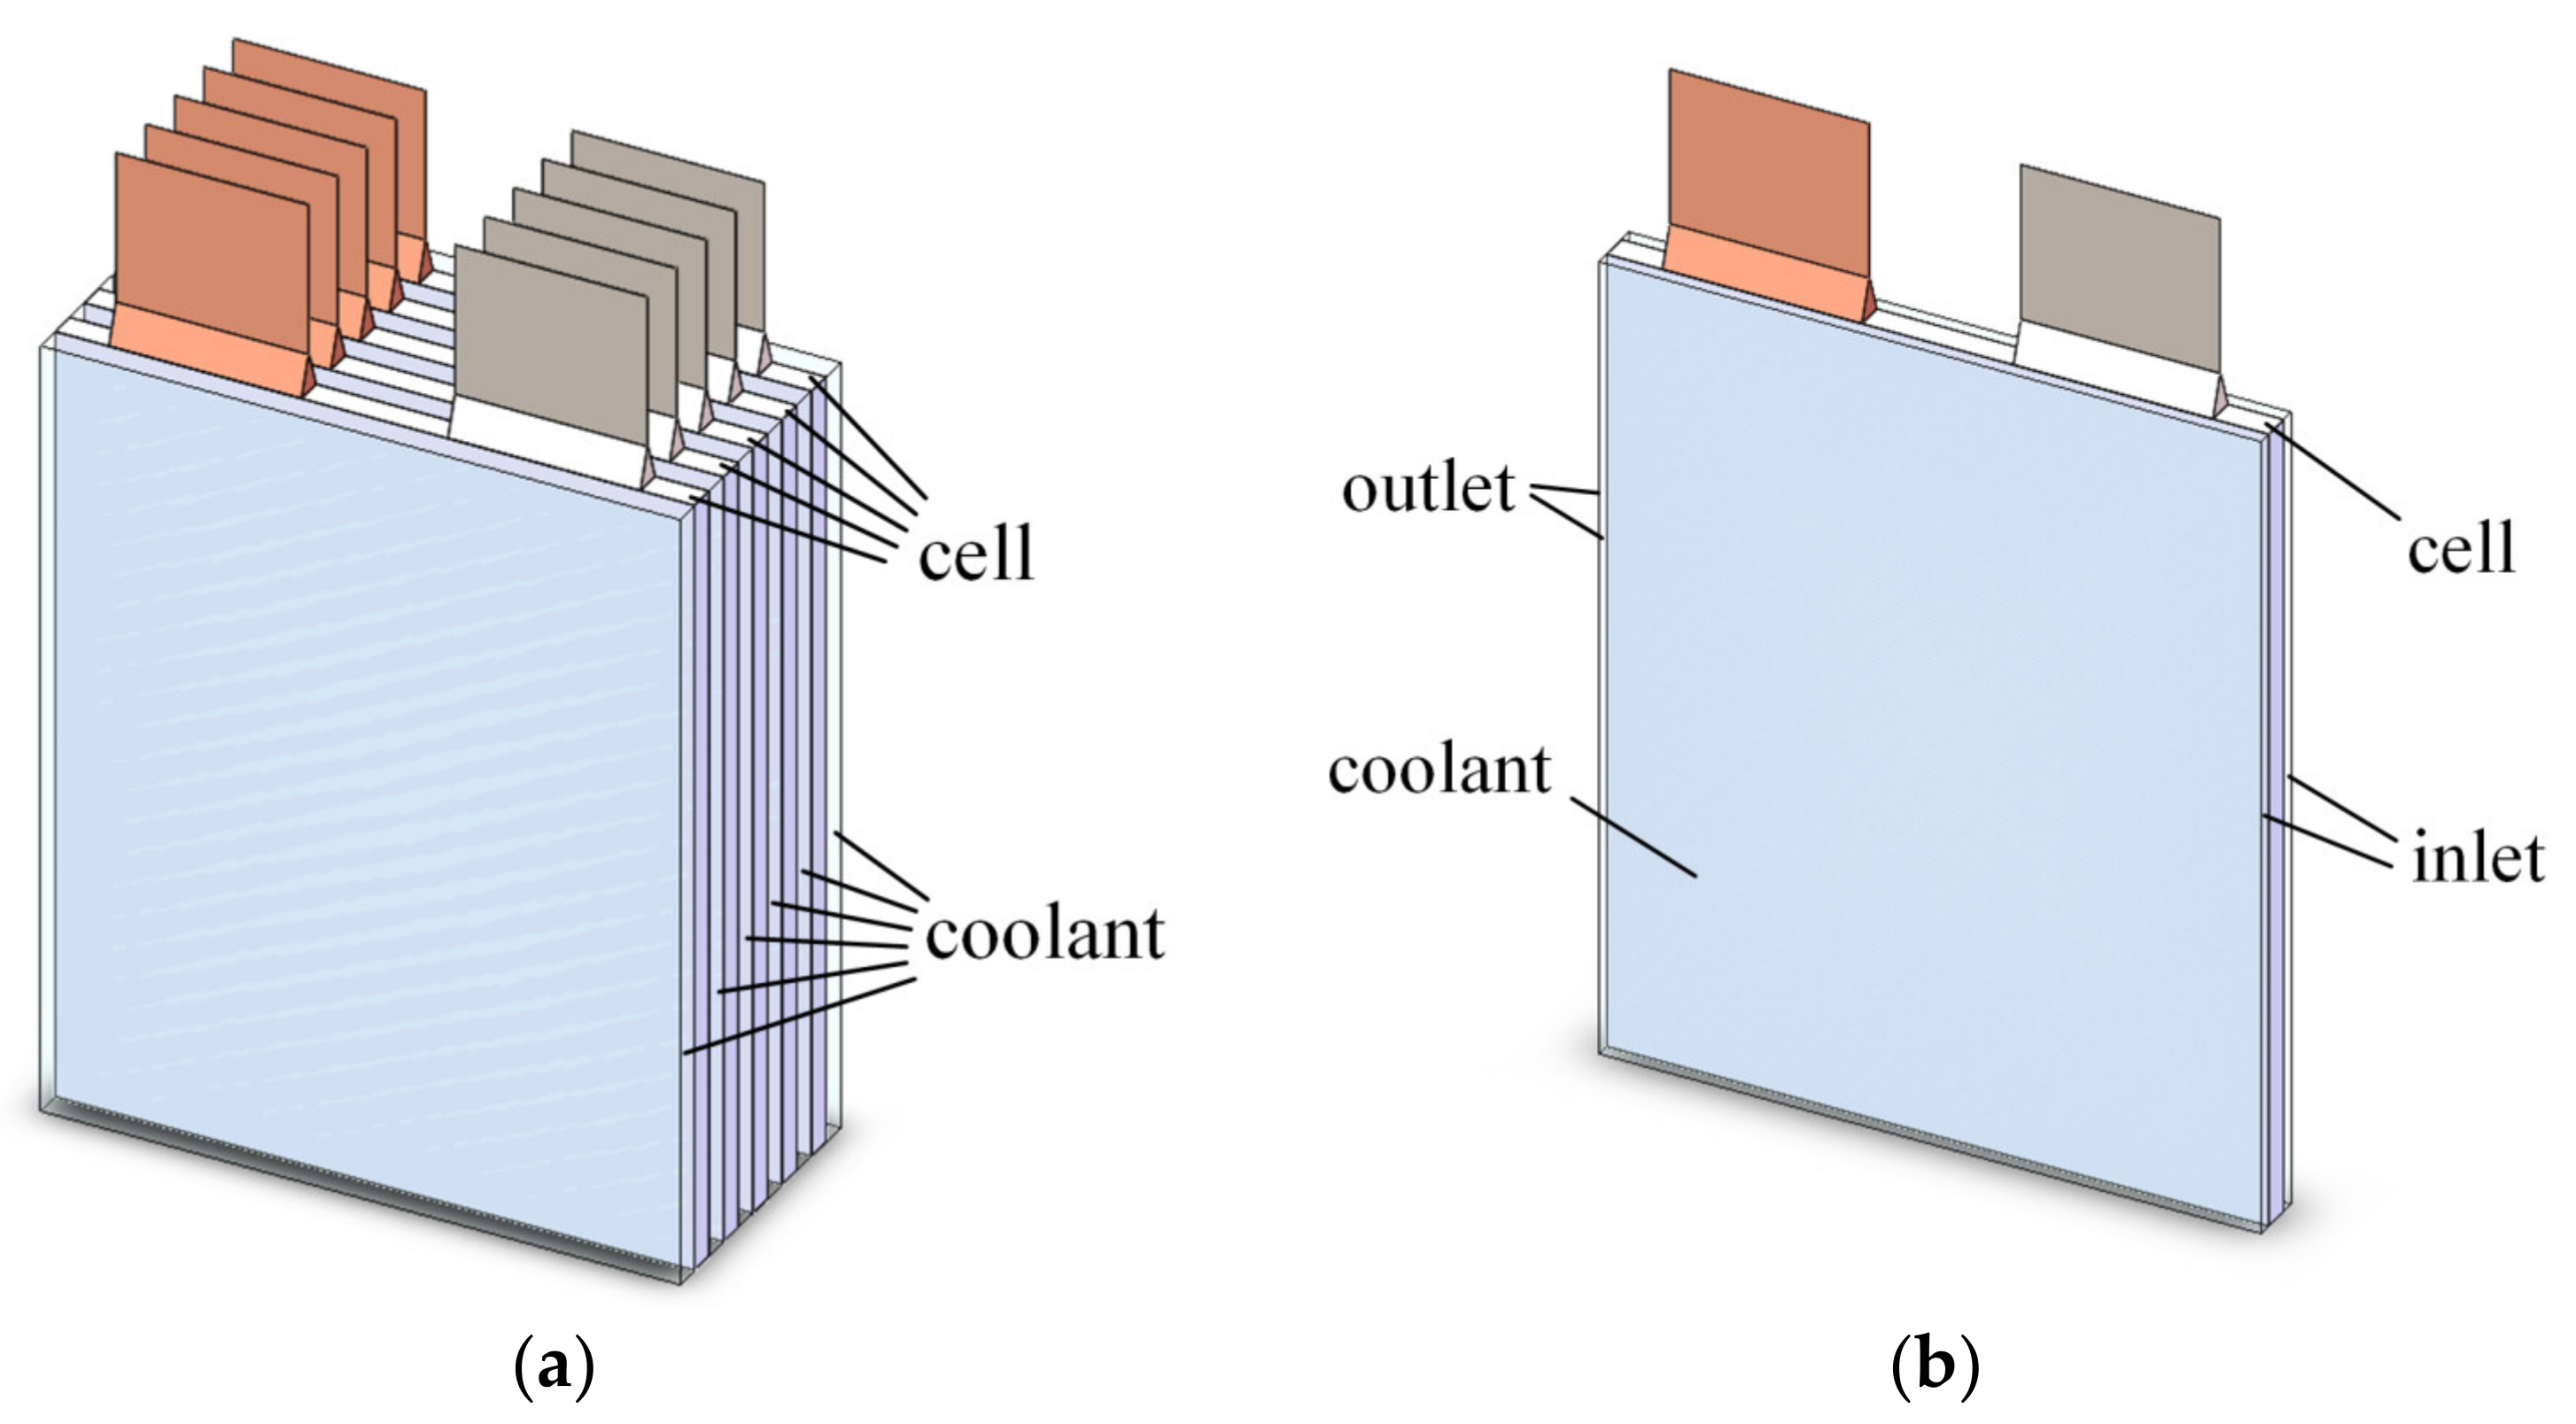
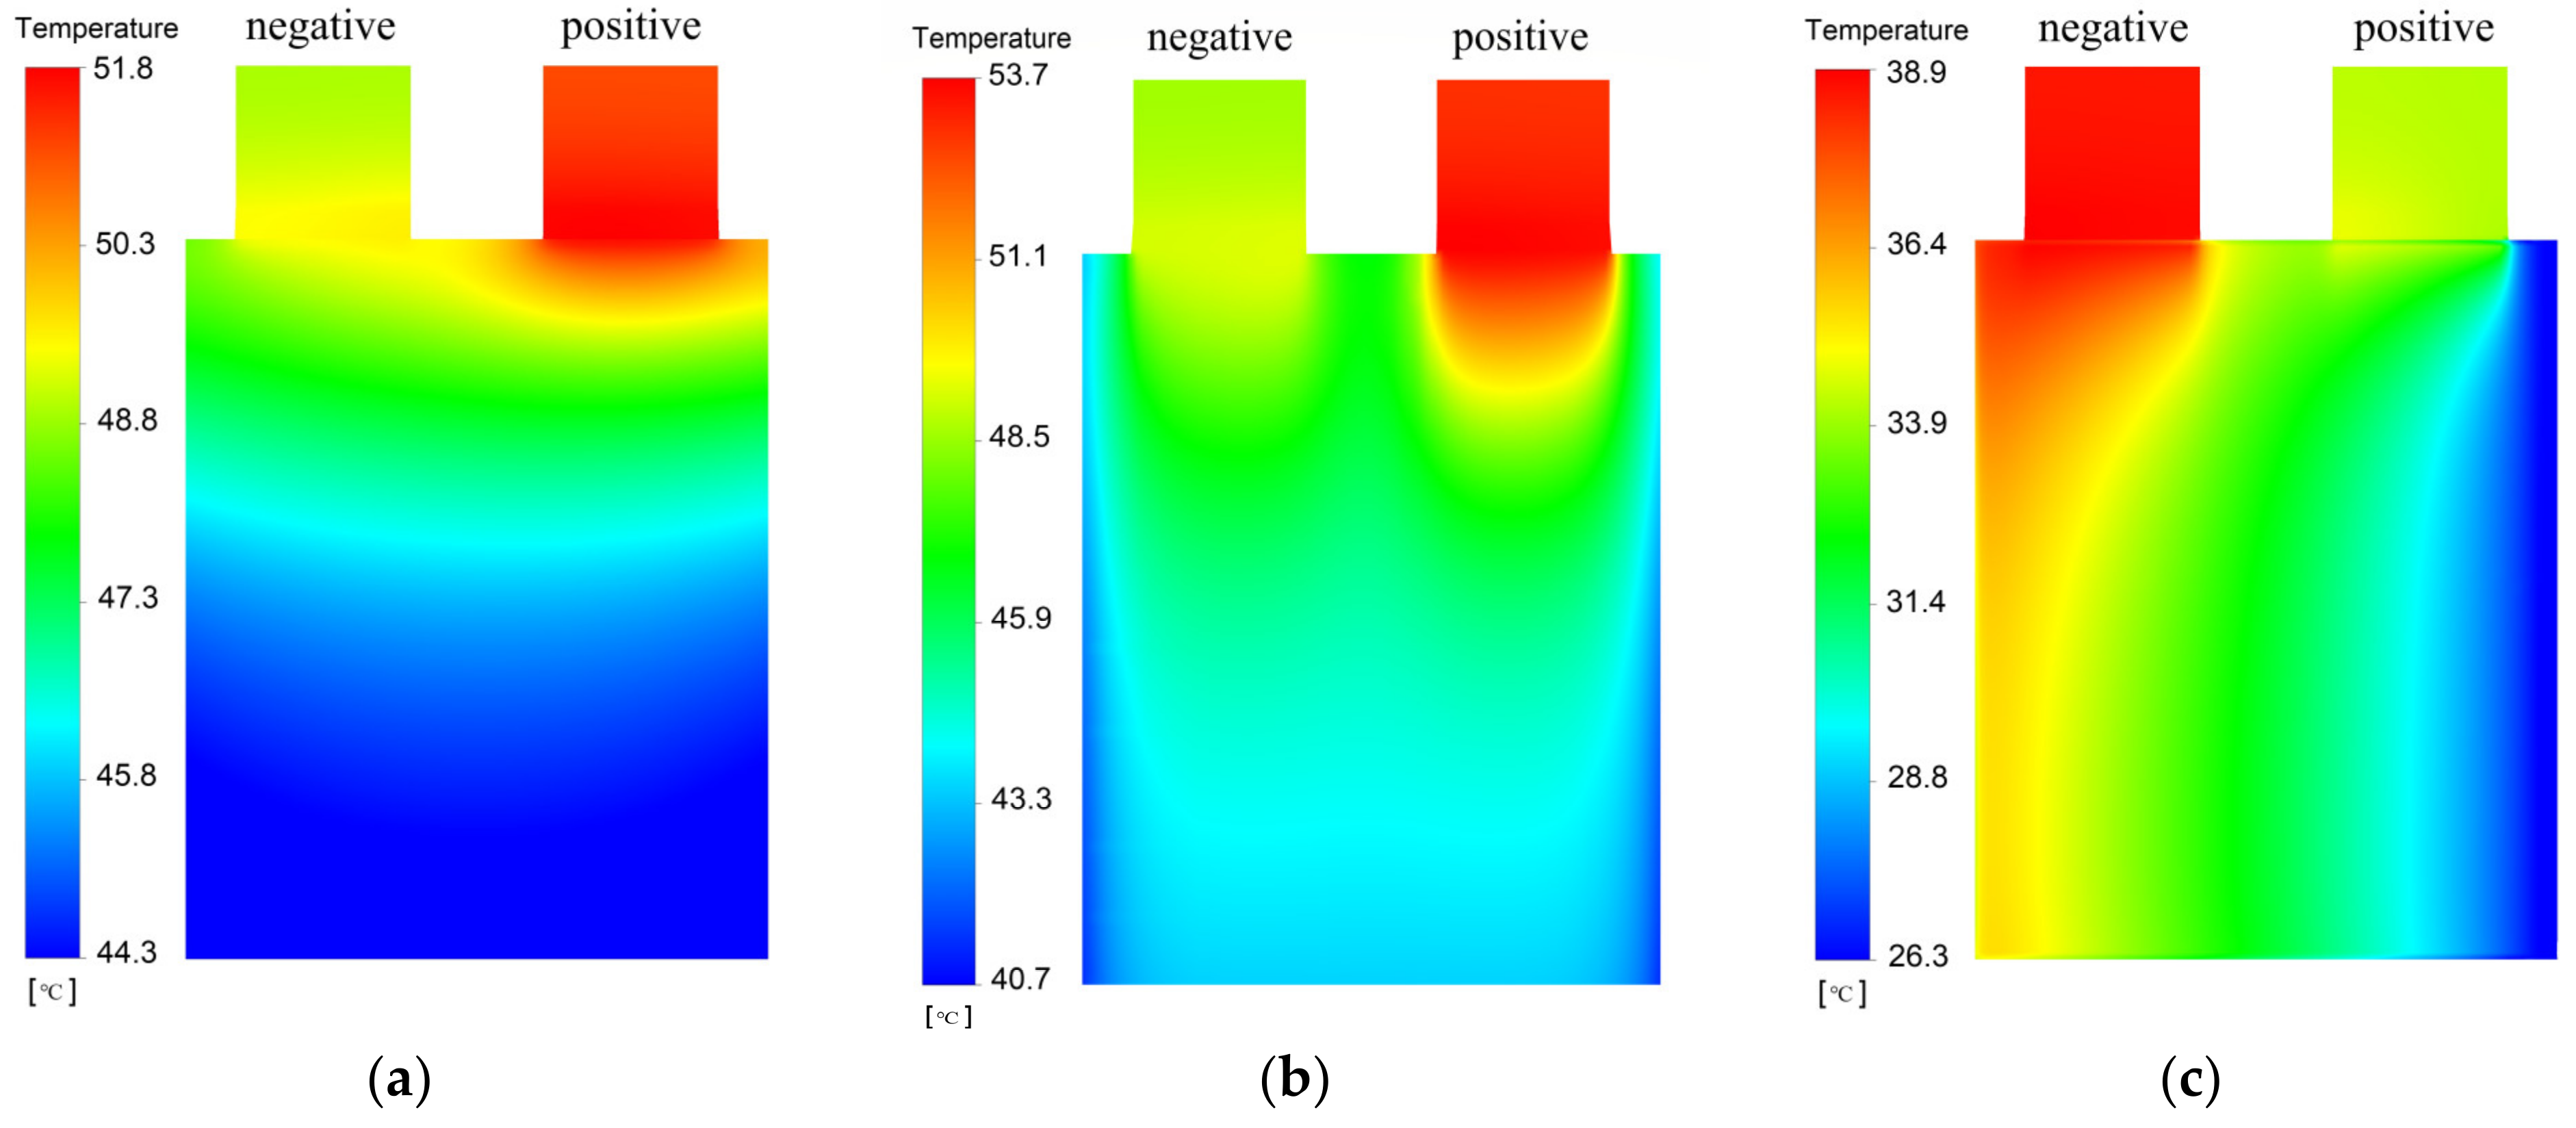
20]. In this research, due to the thermal characteristics of the dimethyl silicone oil, the coolant did not experience phase transition, so it belongs to single-phase immersion cooling. Compared with two-phase immersion cooling, single-phase immersion cooling usually has a simpler structure and lower cost., The MAT and the maximum temperature difference (MATD) of the cell (excluding the tabs) with immersion cooling during the 3 C discharging process are shown in
Figure 8. The temperature distribution on the cell at the end of the 3 C discharge is shown in
Figure 9. There are two conditions considered in immersion cooling: stationary immersion cooling (the flow rate of the coolant is 0 mm/s), and flowing immersion cooling (the flow rate of the coolant is 1 mm/s). For comparison, the temperature information on the cell with natural cooling is also provided in the figures. Natural cooling is to put one single cell in the air, cooled passively by natural convective heat transfer. The model is the same with the one in
Section 2.1.
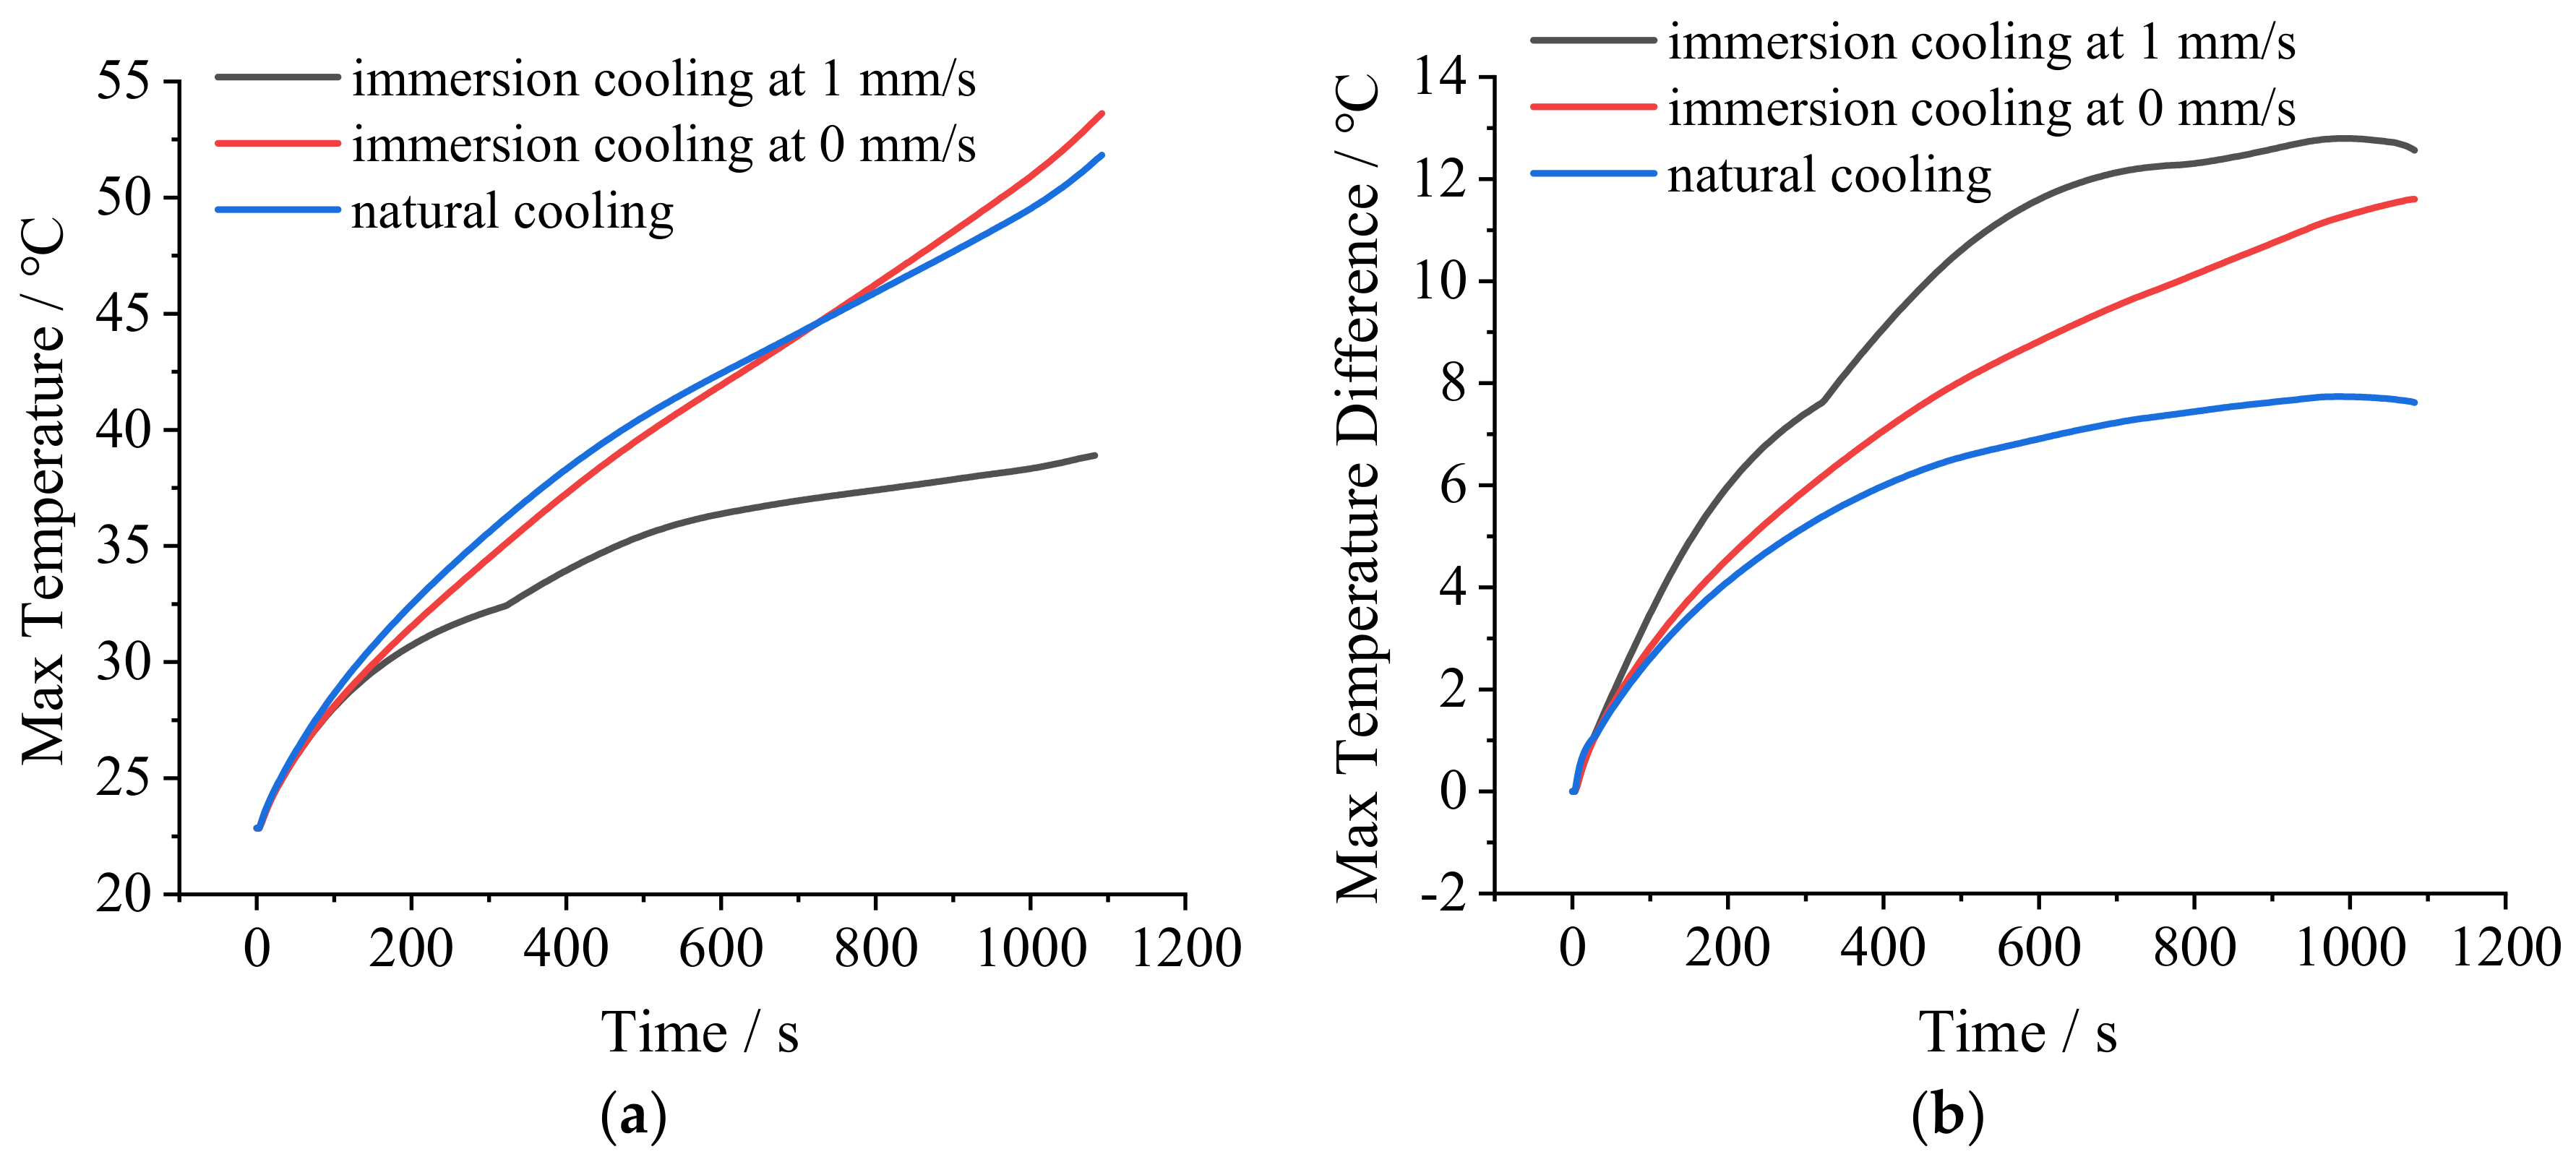
It can be seen from
Figure 8a that the MAT of the cell with natural cooling demonstrated a rapid upward trend during discharging. At the end of discharge, the MAT of the cell reached 51.8 °C, which exceeded the suitable temperature range of lithium-ion batteries. However, with stationary immersion cooling, the MAT of the cell also demonstrated a rapid upward trend. At the end of discharge, the MAT reached 53.6 °C, which even exceeded that with natural cooling. This was caused by several reasons. First, the specific heat capacity of dimethyl silicone oil is relatively small (1630 J·kg
−1·k
−1), and is much smaller than that of water (4200 J·kg
−1·k
−1). So, its heat absorption and storage capability are relatively weak. Second, the model of the cell with immersion cooling is part of the battery module. The tight arrangement of the cells and the heat generated by the surrounding cells both affect the heat dissipation of the cell. Third, the stationary coolant only exchanges heat with the cell. Other thermal boundary conditions of the coolant are adiabatic. Therefore, during the discharging process, the temperature of the coolant increases continuously, and the heat exchange between the coolant and the cell decreases continuously. Eventually, the temperature of the cell rises rapidly. However, natural cooling involves only putting one cell in the air at 23 °C. The higher the temperature of the cell, the stronger the heat exchange between the air and the cell. So, at the end of discharge, the MAT of the cell with natural cooling is slightly lower than that with stationary immersion cooling. However, if the cell is put in a tightly packed battery module, the MAT at the end of discharge could be much higher.
With flowing immersion cooling, the MAT of the cell was significantly lower than those with natural cooling and stationery immersion cooling during the entire discharging process. At the end of discharge, the MAT was greatly reduced to 38.9 °C, within the suitable temperature range of lithium-ion batteries. This is because the flowing coolant can absorb and take the heat away from the cell continuously, thus greatly improving the cooling effect.
However, as shown in
Figure 8b, the MATDs of the cells with stationary immersion cooling and flowing immersion cooling were both significantly greater than that with natural cooling during the entire discharging process. At the end of discharge, the MATD of the cell with stationary immersion cooling reached 11.6 °C, and that with flowing immersion cooling reached 12.6 °C. Both of them exceeded the limit of 5 °C. The reason is related to the temperature distribution of the cell. As shown in
Figure 9a,b, with natural cooling and stationary immersion cooling, the MATs both appear at the junction between the positive tab and the cell. The MITs both appear at the lower part of the cell. Therefore, the MATDs of the cells were determined by the temperature near the positive tab and the temperature of the lower part of the cell under these two conditions.
With natural cooling, the temperature near the tab is higher, where the convective heat exchange between the cell and the air is stronger. So, the increase in the MAT is inhibited. The temperature of the lower part of the cell is lower, where the convective heat exchange between the cell and the air is weaker. So, the increase in the MIT is accelerated. The combined action of the two factors results in a smaller MATD of the cell. With stationary immersion cooling, the temperature of the coolant close to the junction between the positive tab and the cell is higher after the coolant absorbs heat, so its cooling capability is weakened, and the increase in the MAT is accelerated. The temperature of the coolant far from the tab is lower, so its cooling capability is stronger, and the increase in the MIT is inhibited. The coolant with higher temperature is in the upper part, and coolant with lower temperature is in the lower part. It inhibits the convective heat transfer in the coolant, thereby further increasing the MATD of the cell.
As shown in
Figure 9c, with flowing immersion cooling, the MAT appears at the left side of the cell, and the MIT appears at the right side of the cell. The temperature gradually increases from the right to the left. This is because the coolant with lower temperature was in direct contact with the cell at the inlet, so the cooling effect on the cell close to the inlet was very good. However, in the initial settings, the flow rate of the coolant was only 1 mm/s. During the flowing process, its temperature gradually increased, and the convective heat exchange between the coolant and the cell was weaker. So, the closer to the outlet, the greater the temperature rise of the cell, resulting in the increase in MATD. It is also noted that the MAT was transferred from the junction of the positive tab and the cell to the junction of the negative tab and the cell. Although the positive tab has greater heat production, and is not in direct contact with the coolant, a good cooling effect can also be achieved through heat conduction since it is closer to the inlet of the coolant. The negative tab is far away from the inlet, so its temperature is the highest, but still far below the corresponding temperatures with natural cooling and stationary immersion cooling.
Through the above analysis it can be seen that, compared with natural cooling and stationary immersion cooling, flowing immersion cooling demonstrates strong temperature suppression capability. The MAT of the cell can be controlled within 40 °C during the 3 C discharging process. The temperature of the tabs is also much lower. However, due to the small flow rate of the coolant, the MATD of the cell cannot be controlled within 5 °C, which needs to be further improved.
4. Effects of Different Parameters on the Performance of Immersion Cooling
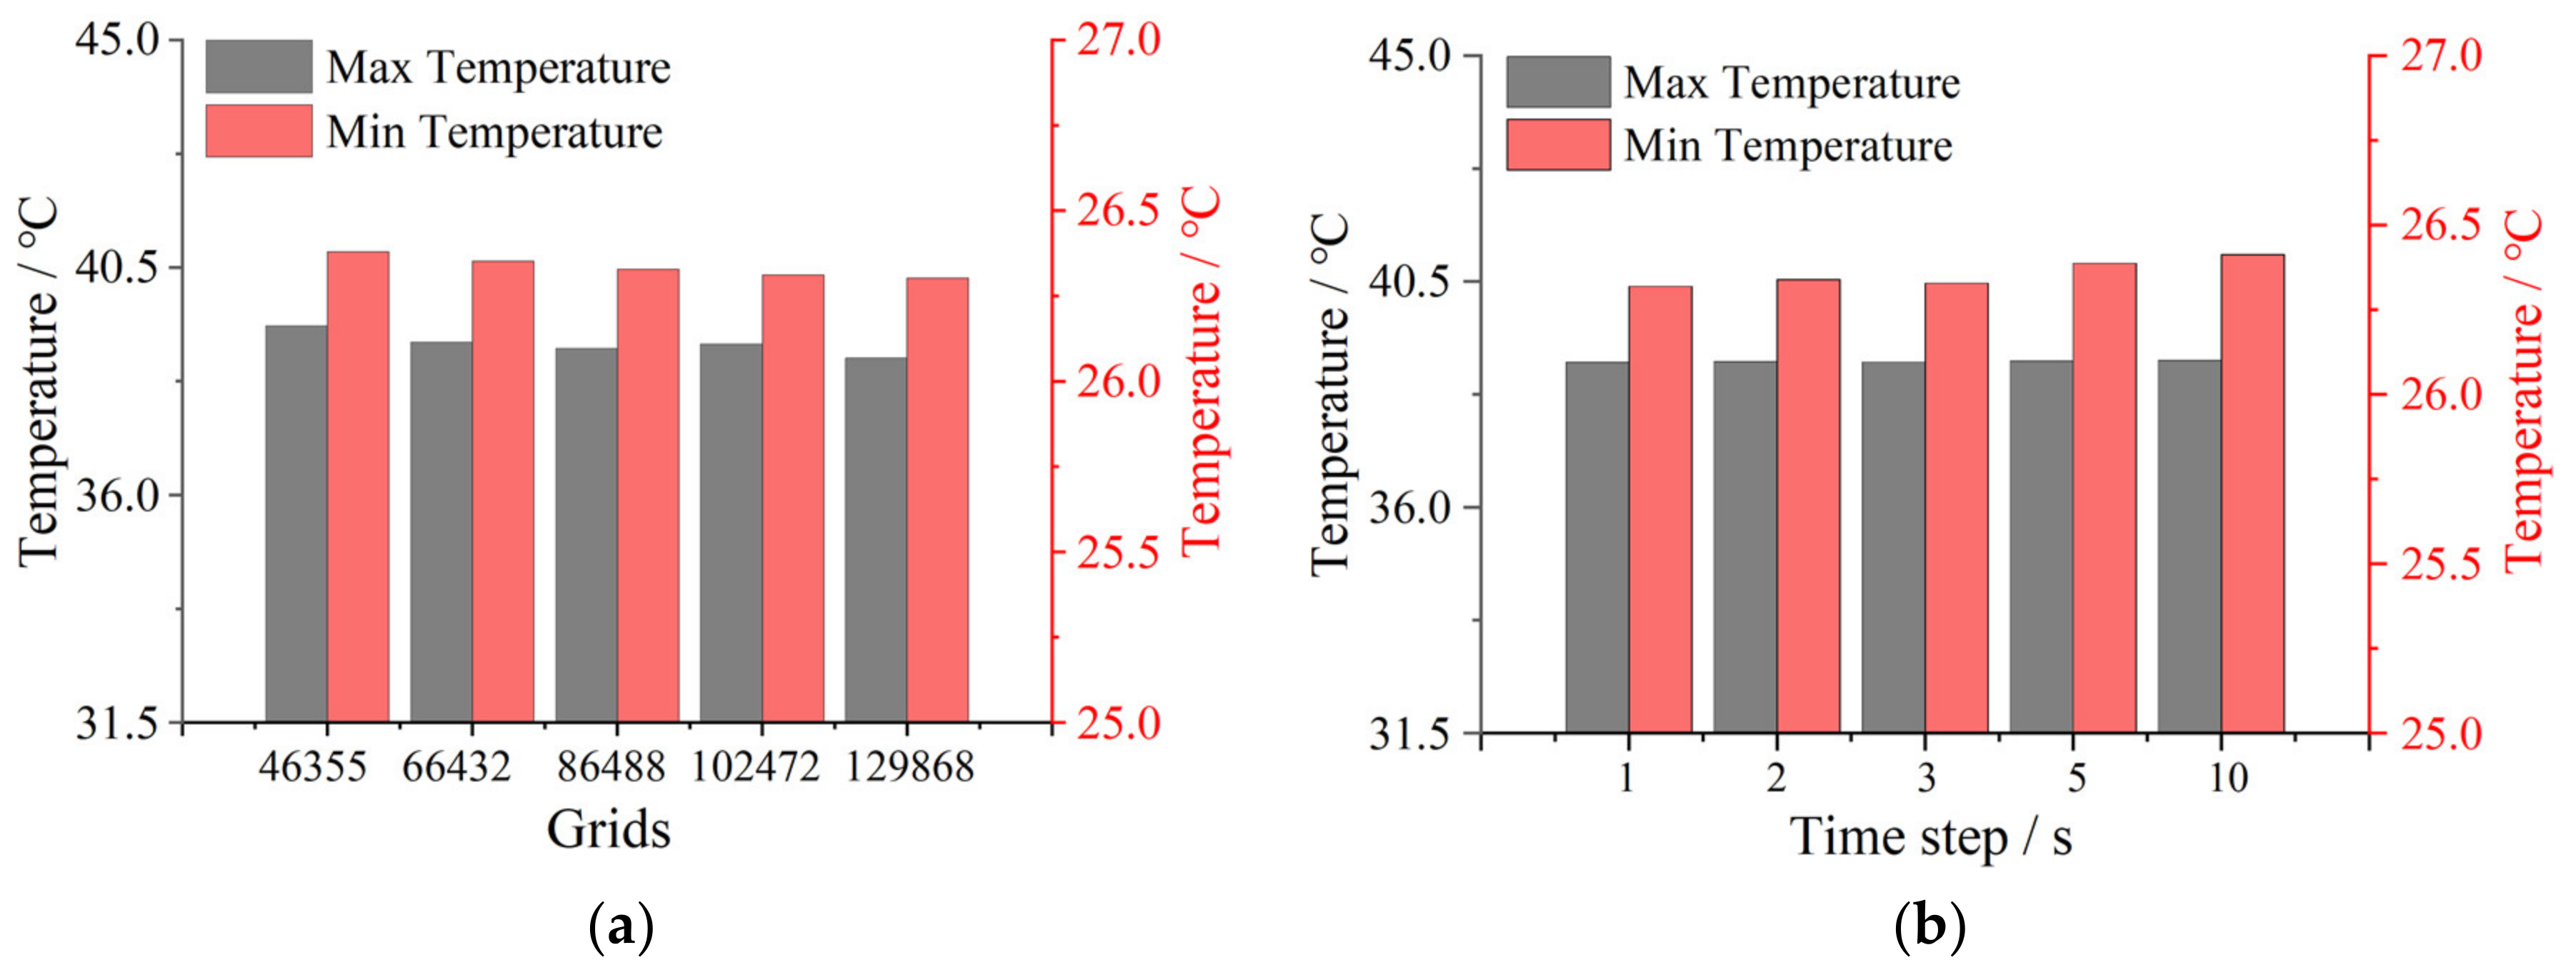
The BTMS with immersion cooling has many parameters that could affect its performance, such as the flow rate, viscosity, specific heat capacity, and thermal conductivity of the coolant. By changing these parameters, their effects on the performance of immersion cooling were investigated, so as to provide references for the design and optimization of the BTMS. The method was to change one parameter at a time, while keeping the other parameters constant: the single variable method. The MAT and MATD of the cell (excluding the tabs) at the end of 3 C discharge, as well as the pressure drop of the coolant, were used as indicators. To facilitate analysis, the MIT of the cell was also supplemented as an indicator.
4.1. Flow Rate
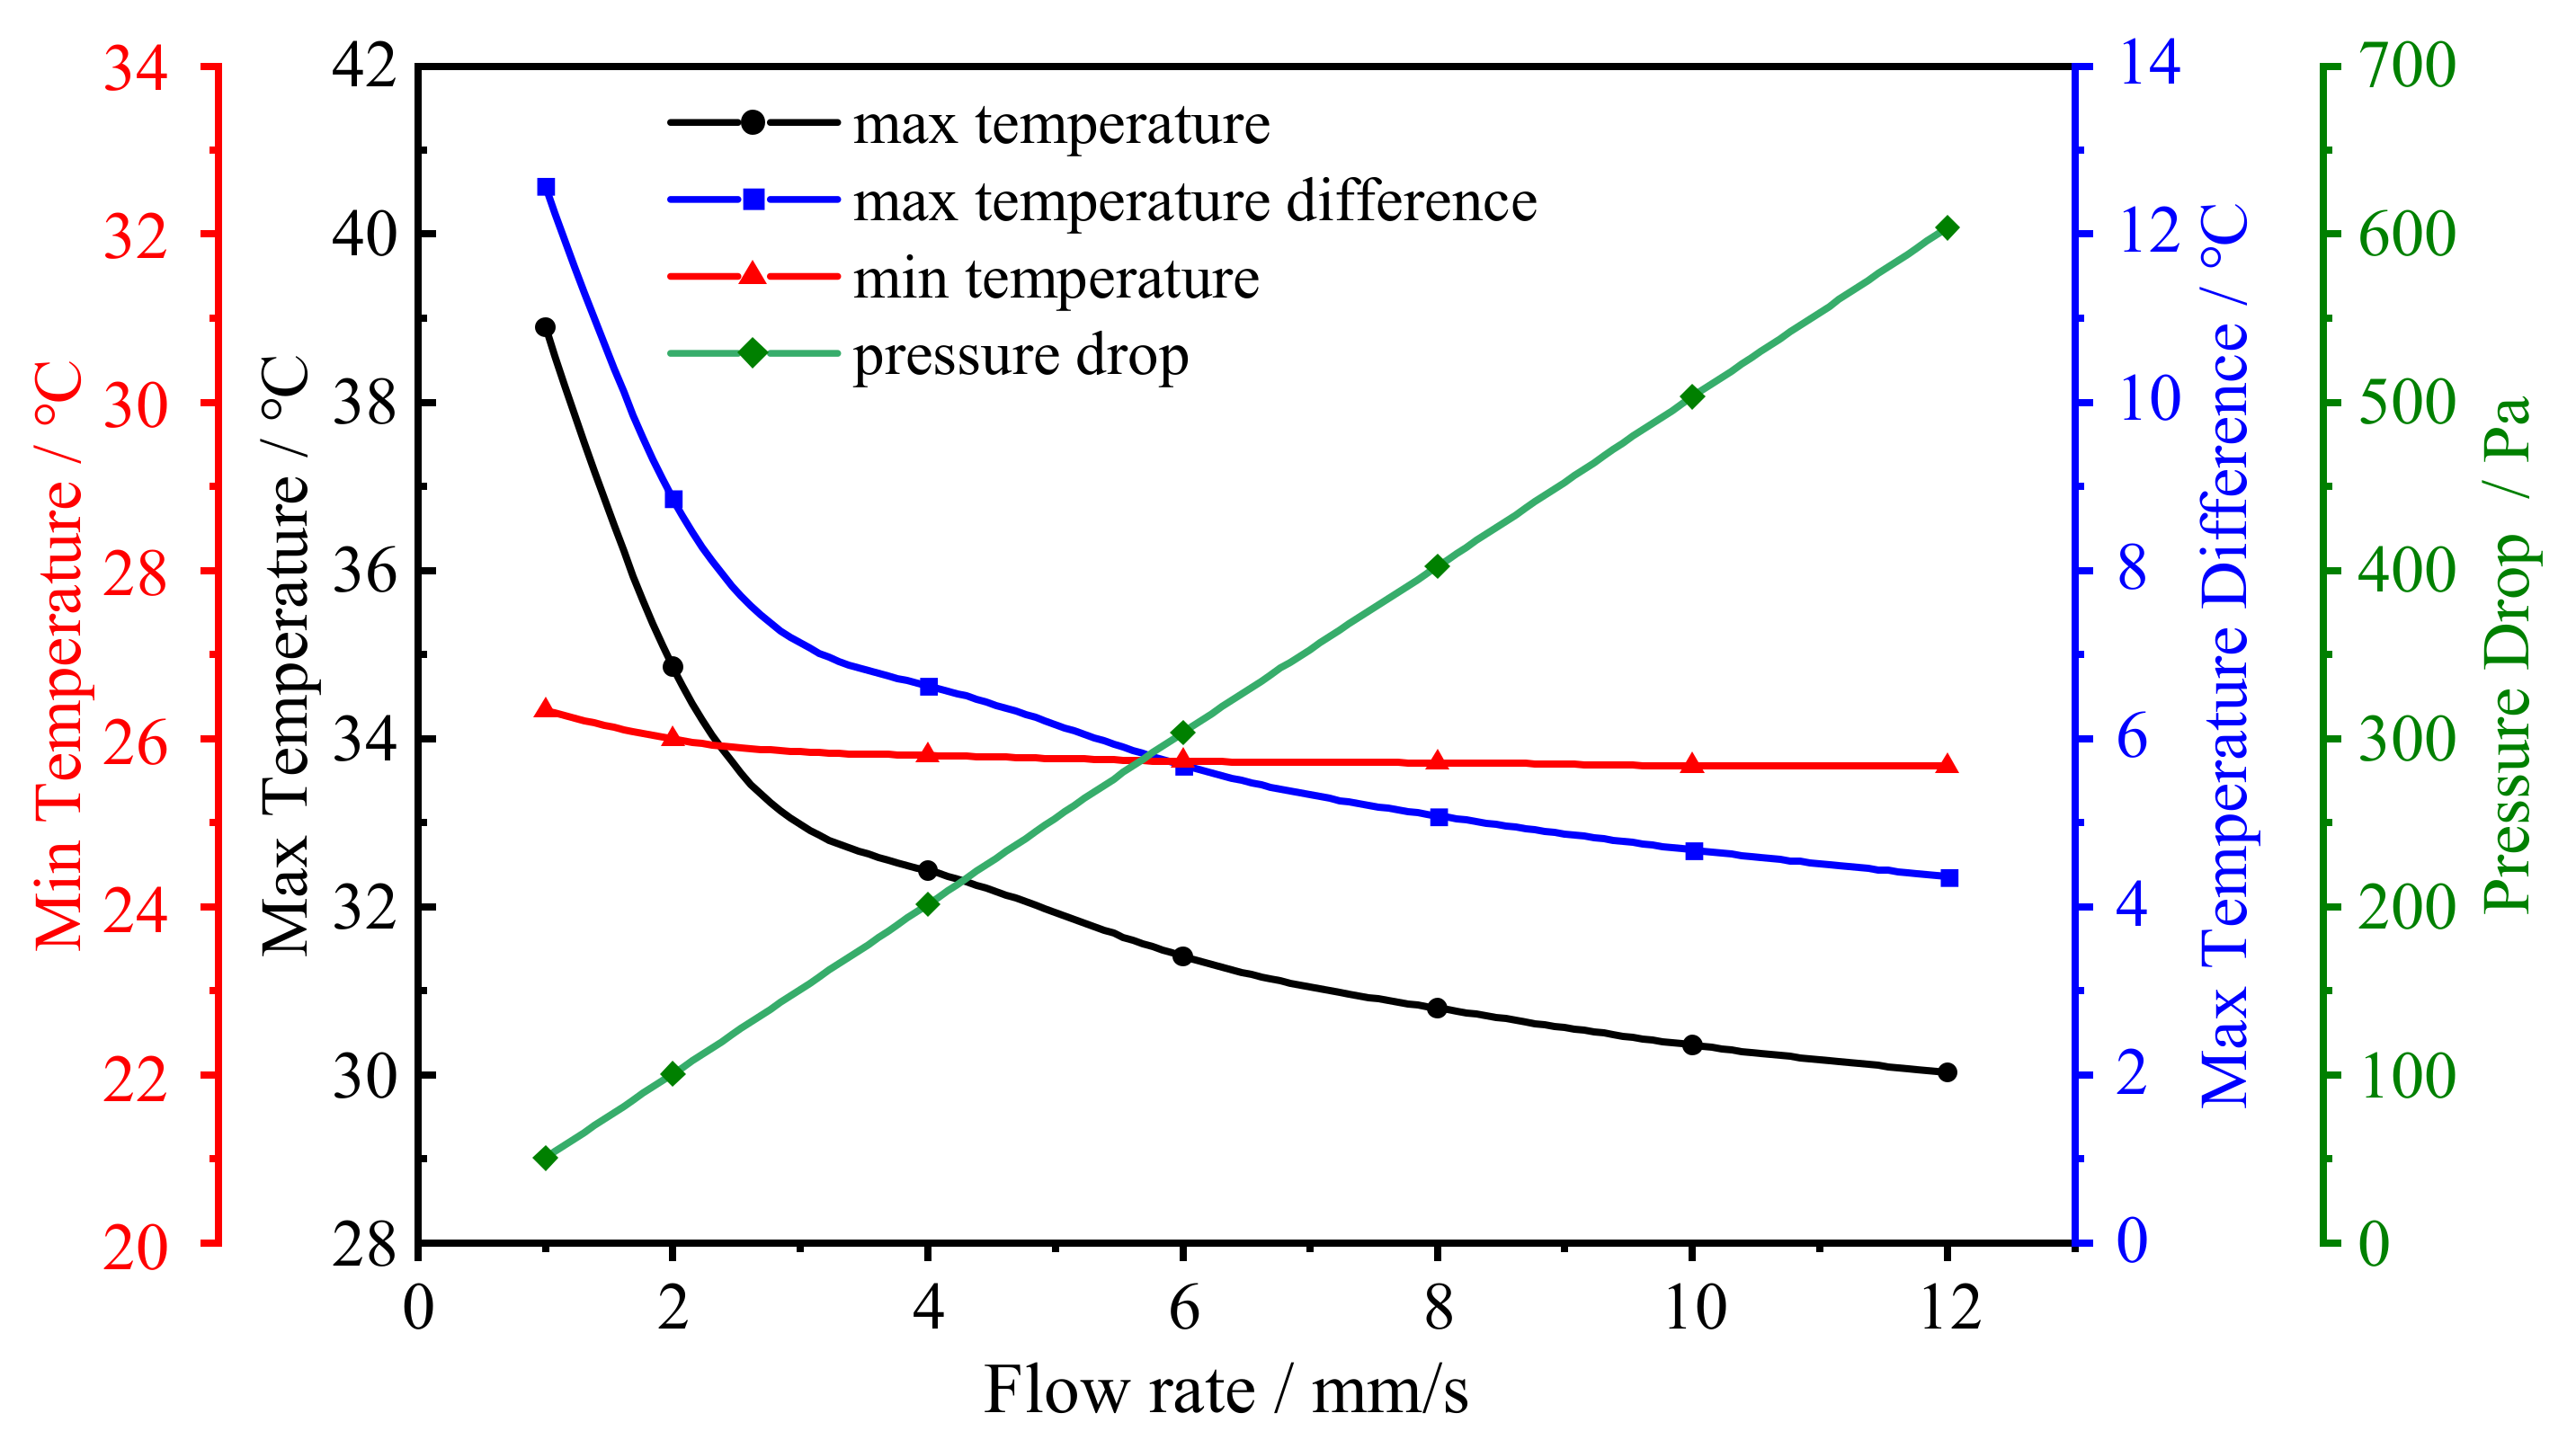
The flow rate determines the mass flow of the coolant passing through the cell, which in turn determines whether it can quickly remove heat from the cell. However, the flow of the coolant requires power. The lower the flow rate of the coolant, the lower the energy consumption of the system. In the initial settings, the flow rate of the coolant was 1 mm/s. To investigate its effect on the performance of immersion cooling, the flow rate was set to 2 mm/s, 4 mm/s, 6 mm/s, 8 mm/s, 10 mm/s, and 12 mm/s, with the other parameters remaining unchanged. The MAT, MIT, and MATD of the cell at the end of discharge, as well as the pressure drop of the coolant, are shown in
Figure 10.
It can be seen that, with the increase in the flow rate, the MAT of the cell decreased from 38.9 °C to 29.9 °C, a reduction of 9.0 °C. The MATD decreased from 12.5 °C to 4.3 °C, a reduction of 8.2 °C. Both of them demonstrate significant downward trends. This is because, as the flow rate increases, the coolant can take more and more heat away from the cell. However, as shown in
Figure 9c, when the flow rate is 1 mm/s, the temperature of the cell near the inlet of the coolant is already low, but the temperature of the cell near the outlet of the coolant is much higher. When the flow rate increases, the convective heat exchange between the coolant and the cell near the inlet of the coolant and the cell near the outlet of the coolant will both increases. However, the increase in the latter is greater than that of the former. So, the decline in the MAT will be much greater than that of the MIT, which reduces the MATD of the cell. When the flow rate reaches 8 mm/s, the MATD decreases to 5 °C.
It can also be seen that the flow rate influences the pressure drop significantly. The higher the flow rate, the greater the pressure drop, and they are in direct proportion. This is because the flow pattern of the coolant is laminar, and the pressure drop is mainly composed of the frictional pressure drop in the channel:
where
, after substitution:
where
is the flow rate of the coolant,
is the dynamic viscosity of the coolant,
l is the length of the channel, and
D is the hydraulic diameter of the channel.
The pressure drop of the coolant determines the pumping power of the circulating system. The pumping power required by the coolant in the flow channel is:
where
A is the cross-sectional area of the flow channel. Therefore, the pumping power increases with the pressure drop. In practical applications, there is a trade-off between cooling performance and pumping cost.
Therefore, by increasing the flow rate of the coolant, the MAT and MATD of the cell can be effectively reduced. However, the pump providing the power will consume more energy. The flow rate should be adjusted in real time according to the actual needs of the BTMS.
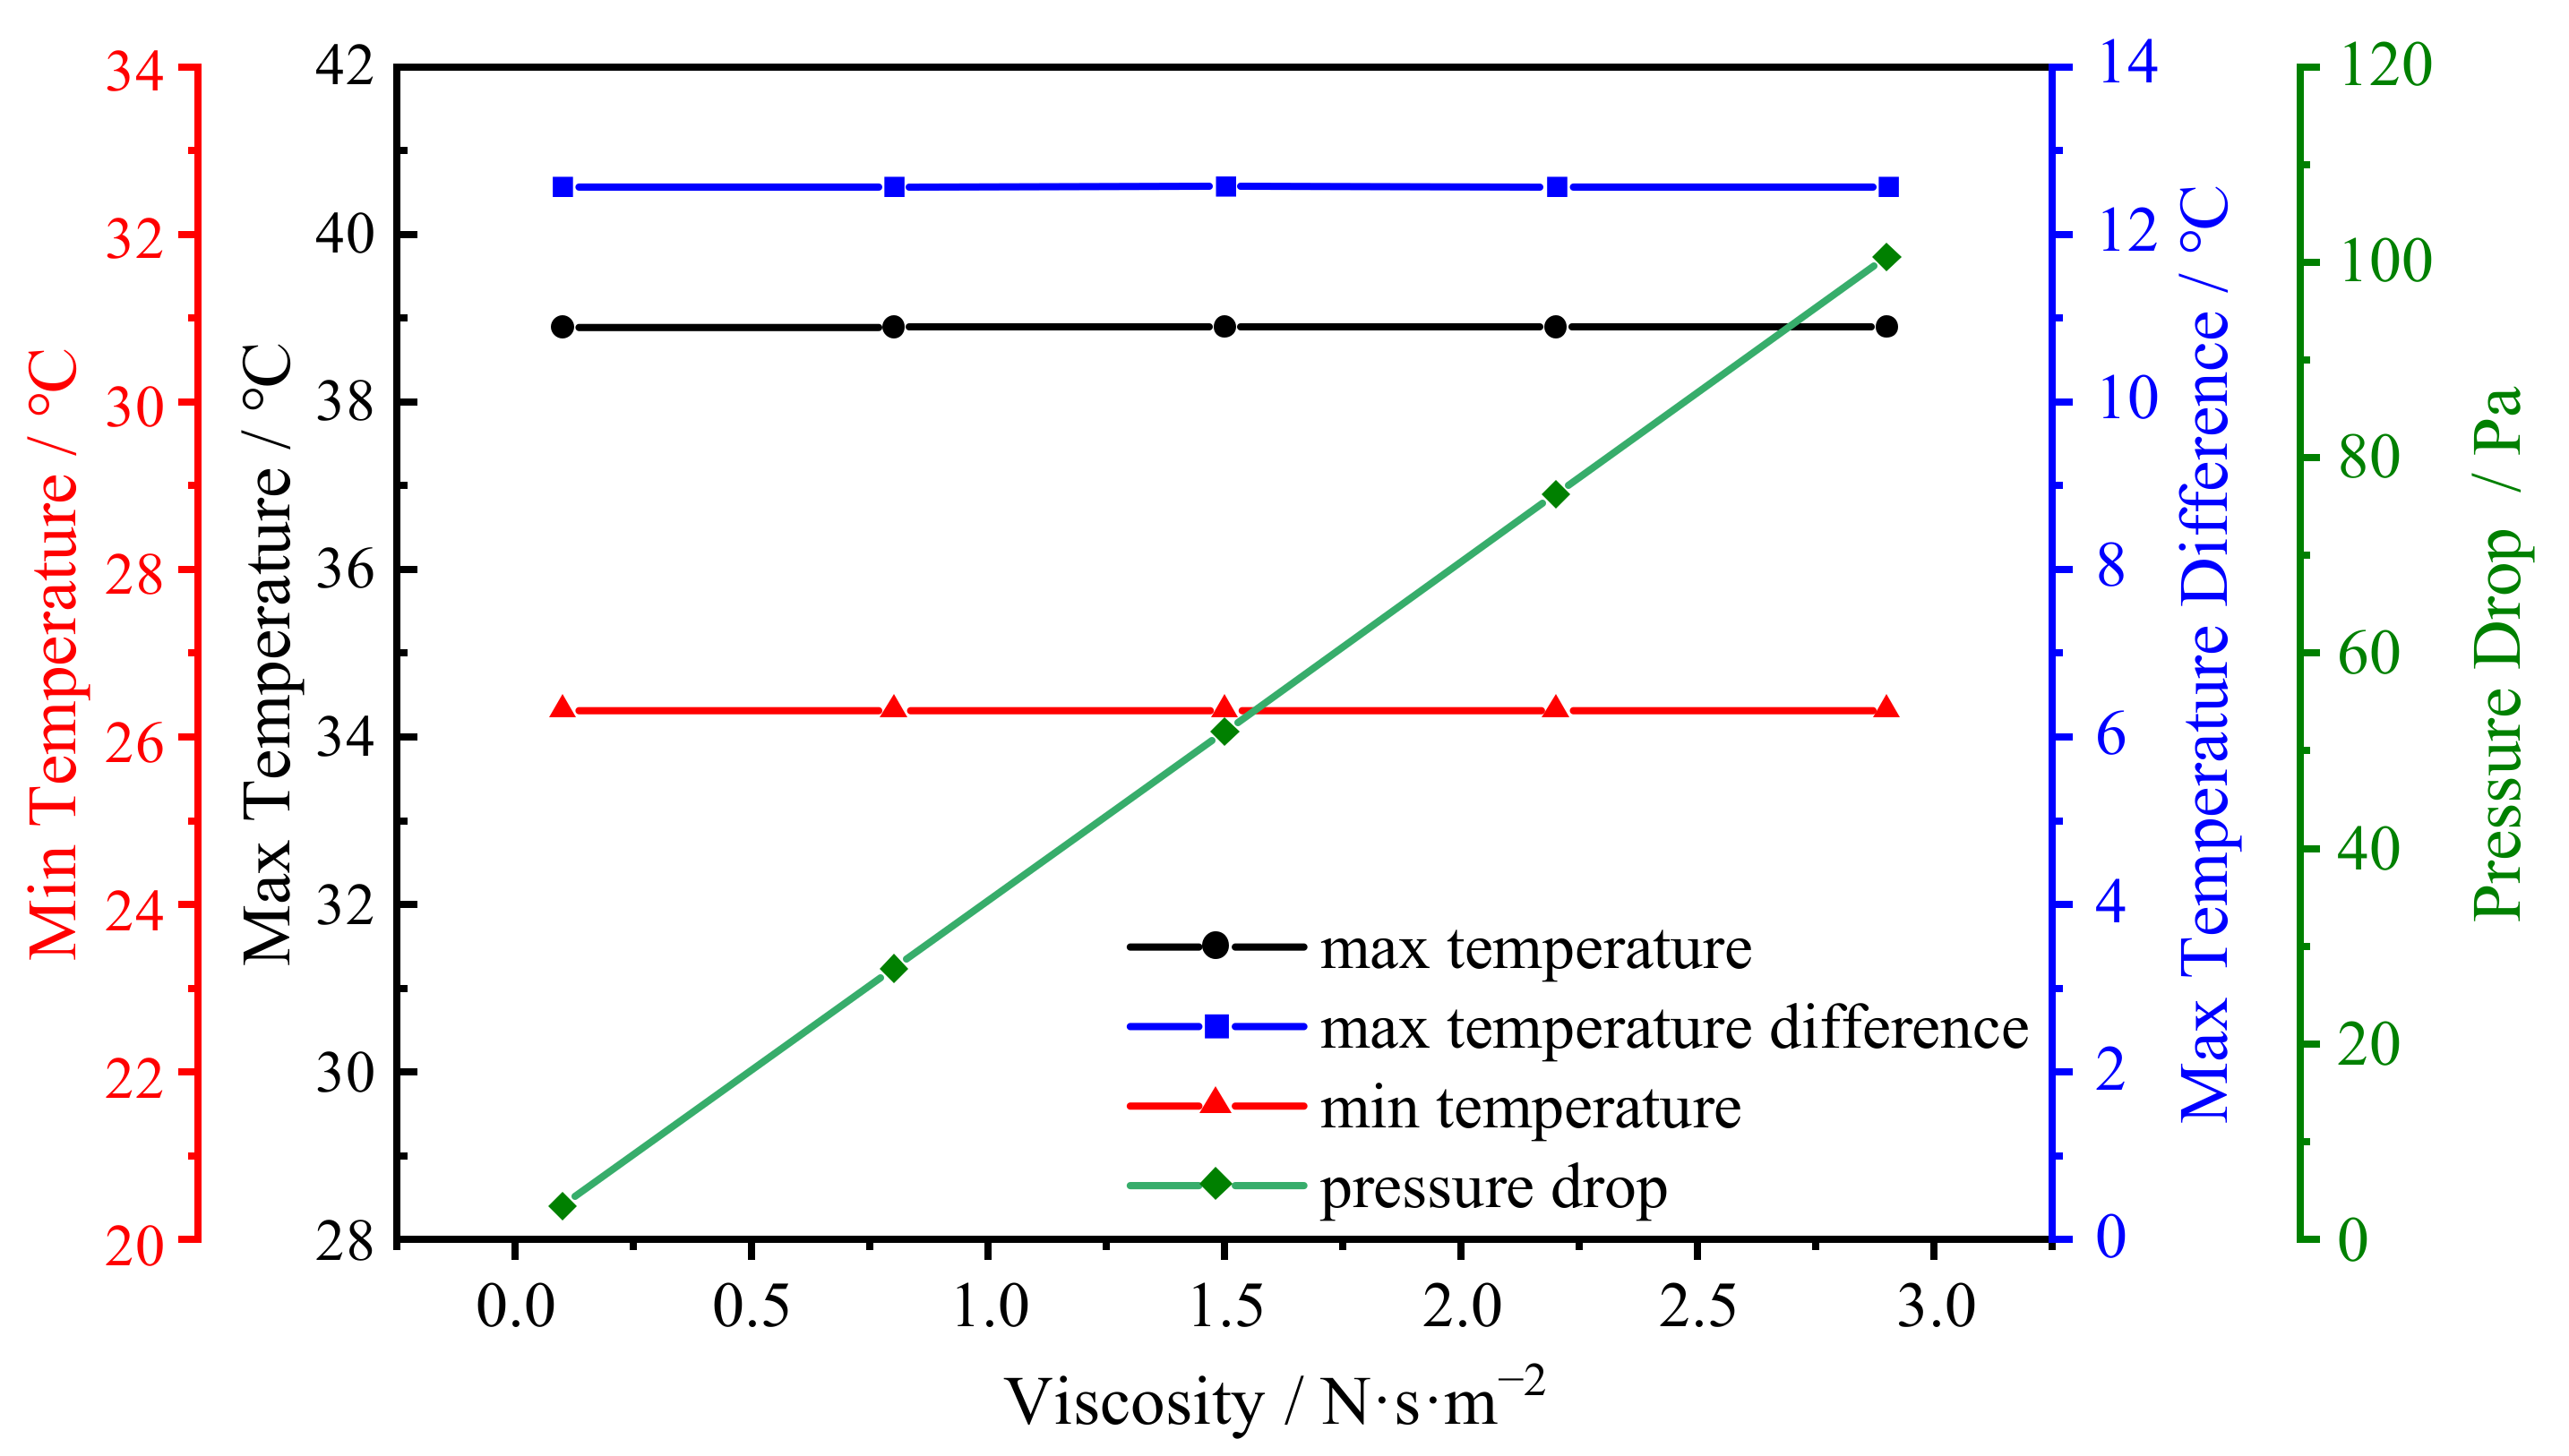
4.2. Viscosity
The viscosity of the coolant is one of the material properties. The viscosity of water is about 0.001 N·s·m
−2, while that of high-viscosity silicone oil can reach tens of thousands of N·s·m
−2. In the initial settings, the coolant is dimethyl silicone oil, and its viscosity is 1.456 N·s·m
−2. To investigate its effect on the performance of immersion cooling, the viscosity was set to 0.1 N·s·m
−2, 0.8 N·s·m
−2, 1.5 N·s·m
−2, 2.2 N·s·m
−2, and 2.9 N·s·m
−2, with the other parameters remaining unchanged. The MAT, MIT, and MATD of the cell at the end of discharge, as well as the pressure drop of the coolant, are shown in
Figure 11.
It can be seen that the viscosity of the coolant basically does not influence the MAT and MATD of the cell. The MAT is maintained at 38.9 °C stably, and the MATD is maintained at 12.5 °C stably. After calculating the Reynolds numbers of the coolant with different viscosities, it was found that they were all below 2100, so the flow patterns were all laminar. Therefore, the change in the viscosity has little effect on the flowing process of the coolant, and the convective heat transfer between the coolant and cell basically does not change.
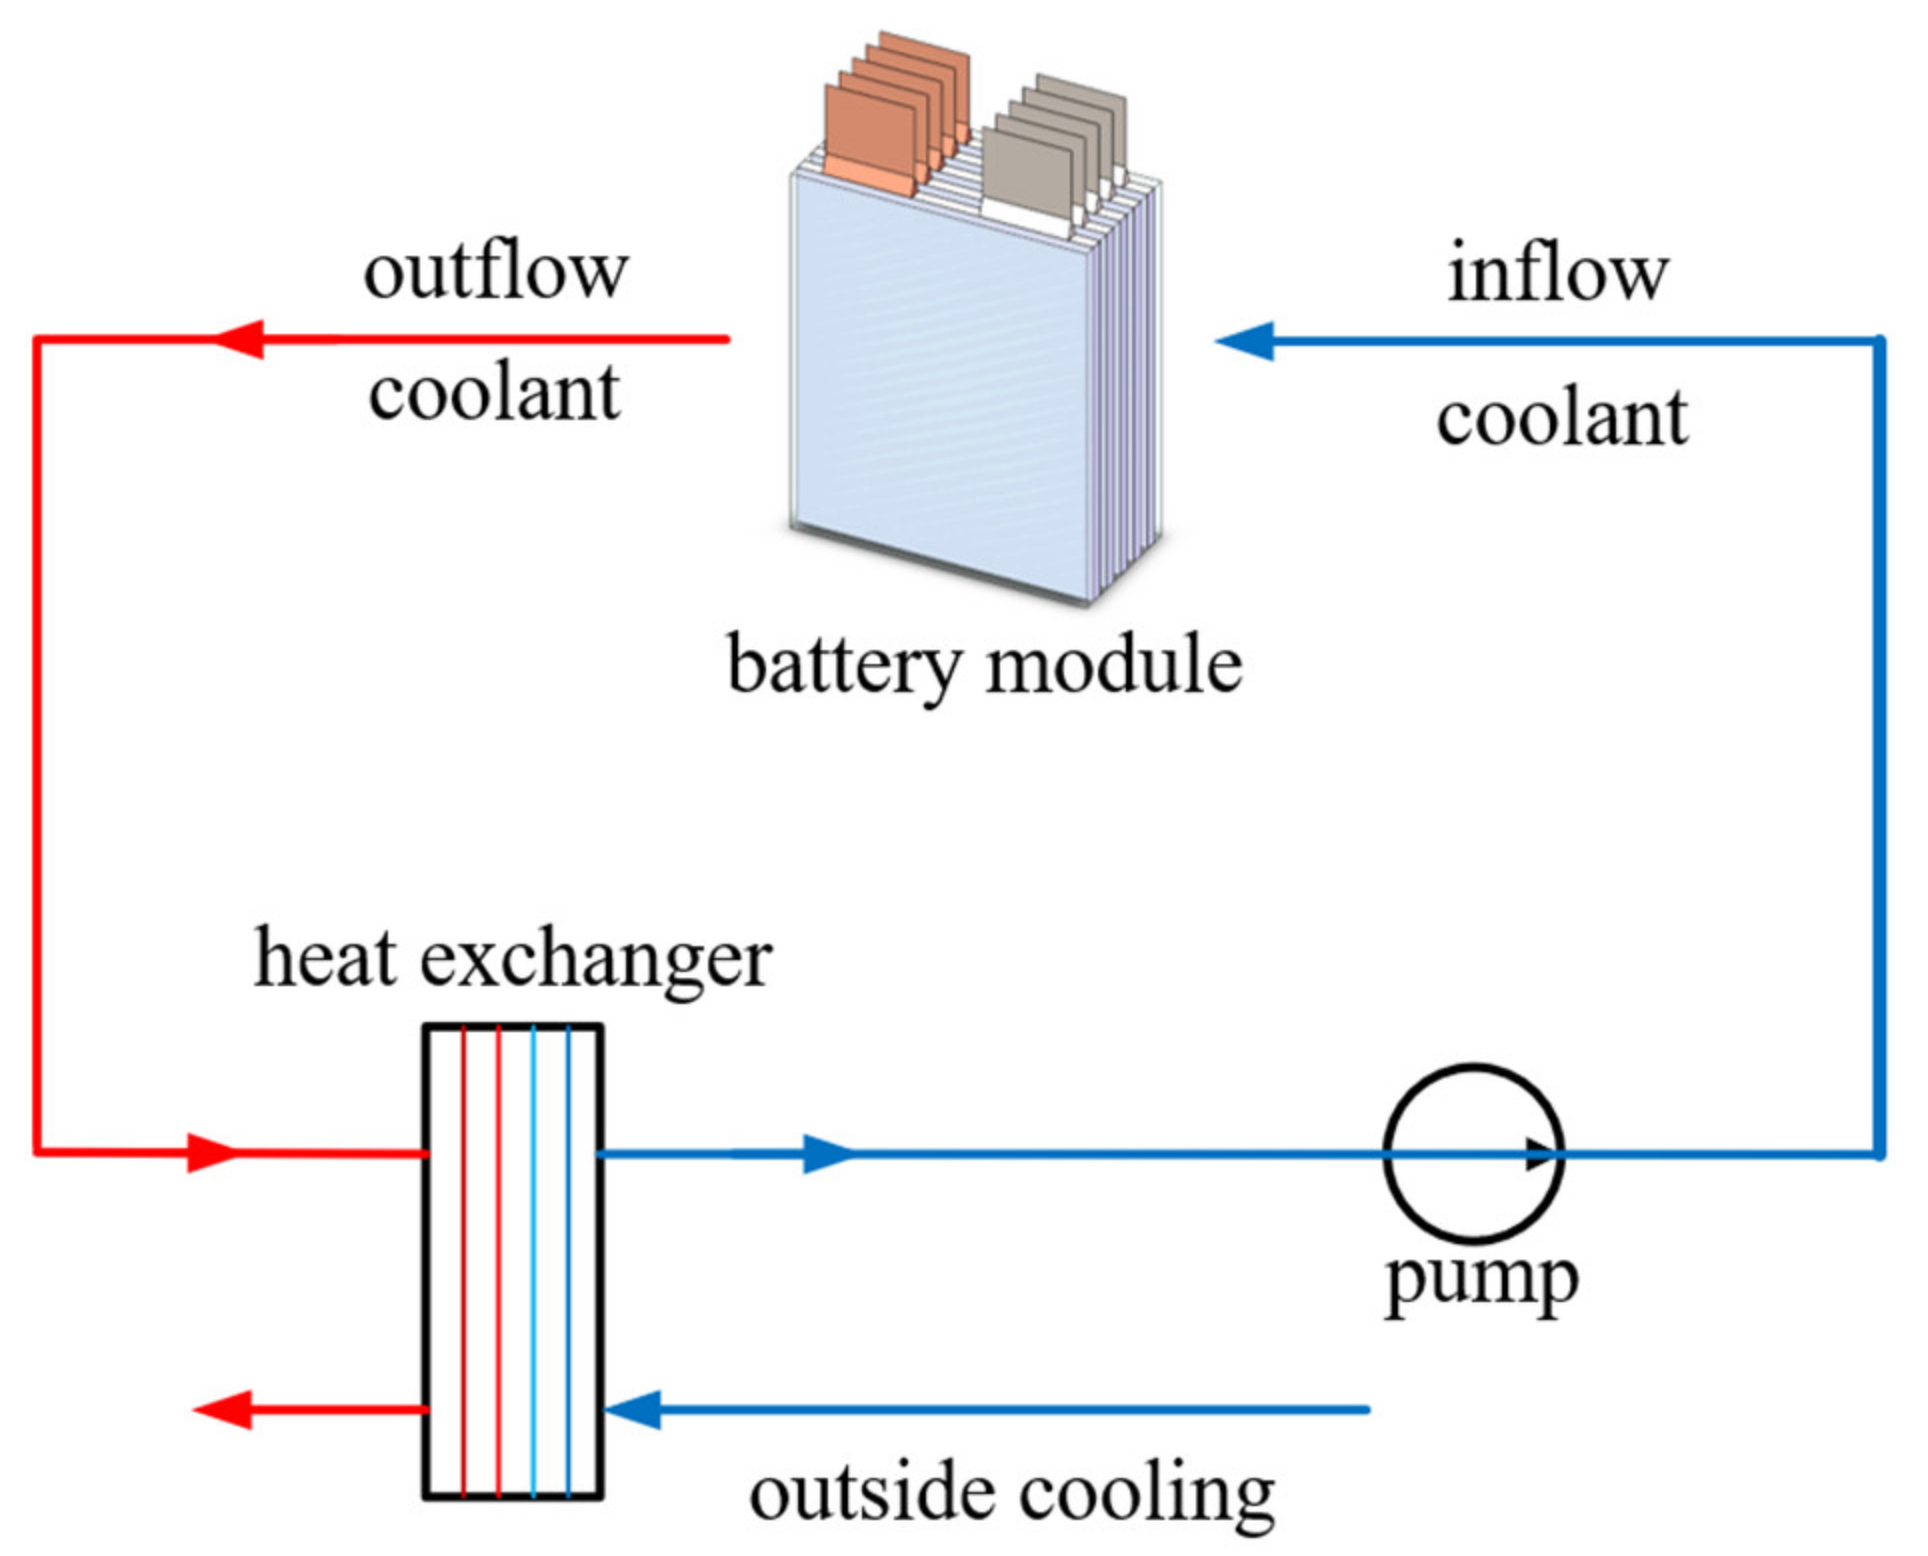
However, the viscosity influences the pressure drop significantly. The greater the viscosity, the greater the pressure drop—in direct proportion—which is consistent with Equation (17). For the BTMS with immersion cooling in this research, shown in
Figure 5, the coolant needs to circulate in the system and exchange heat in the heat exchanger. Higher viscosity is not conducive to the flow of coolant, and will also increase the energy consumption of the system. Therefore, the coolant with lower viscosity is better.
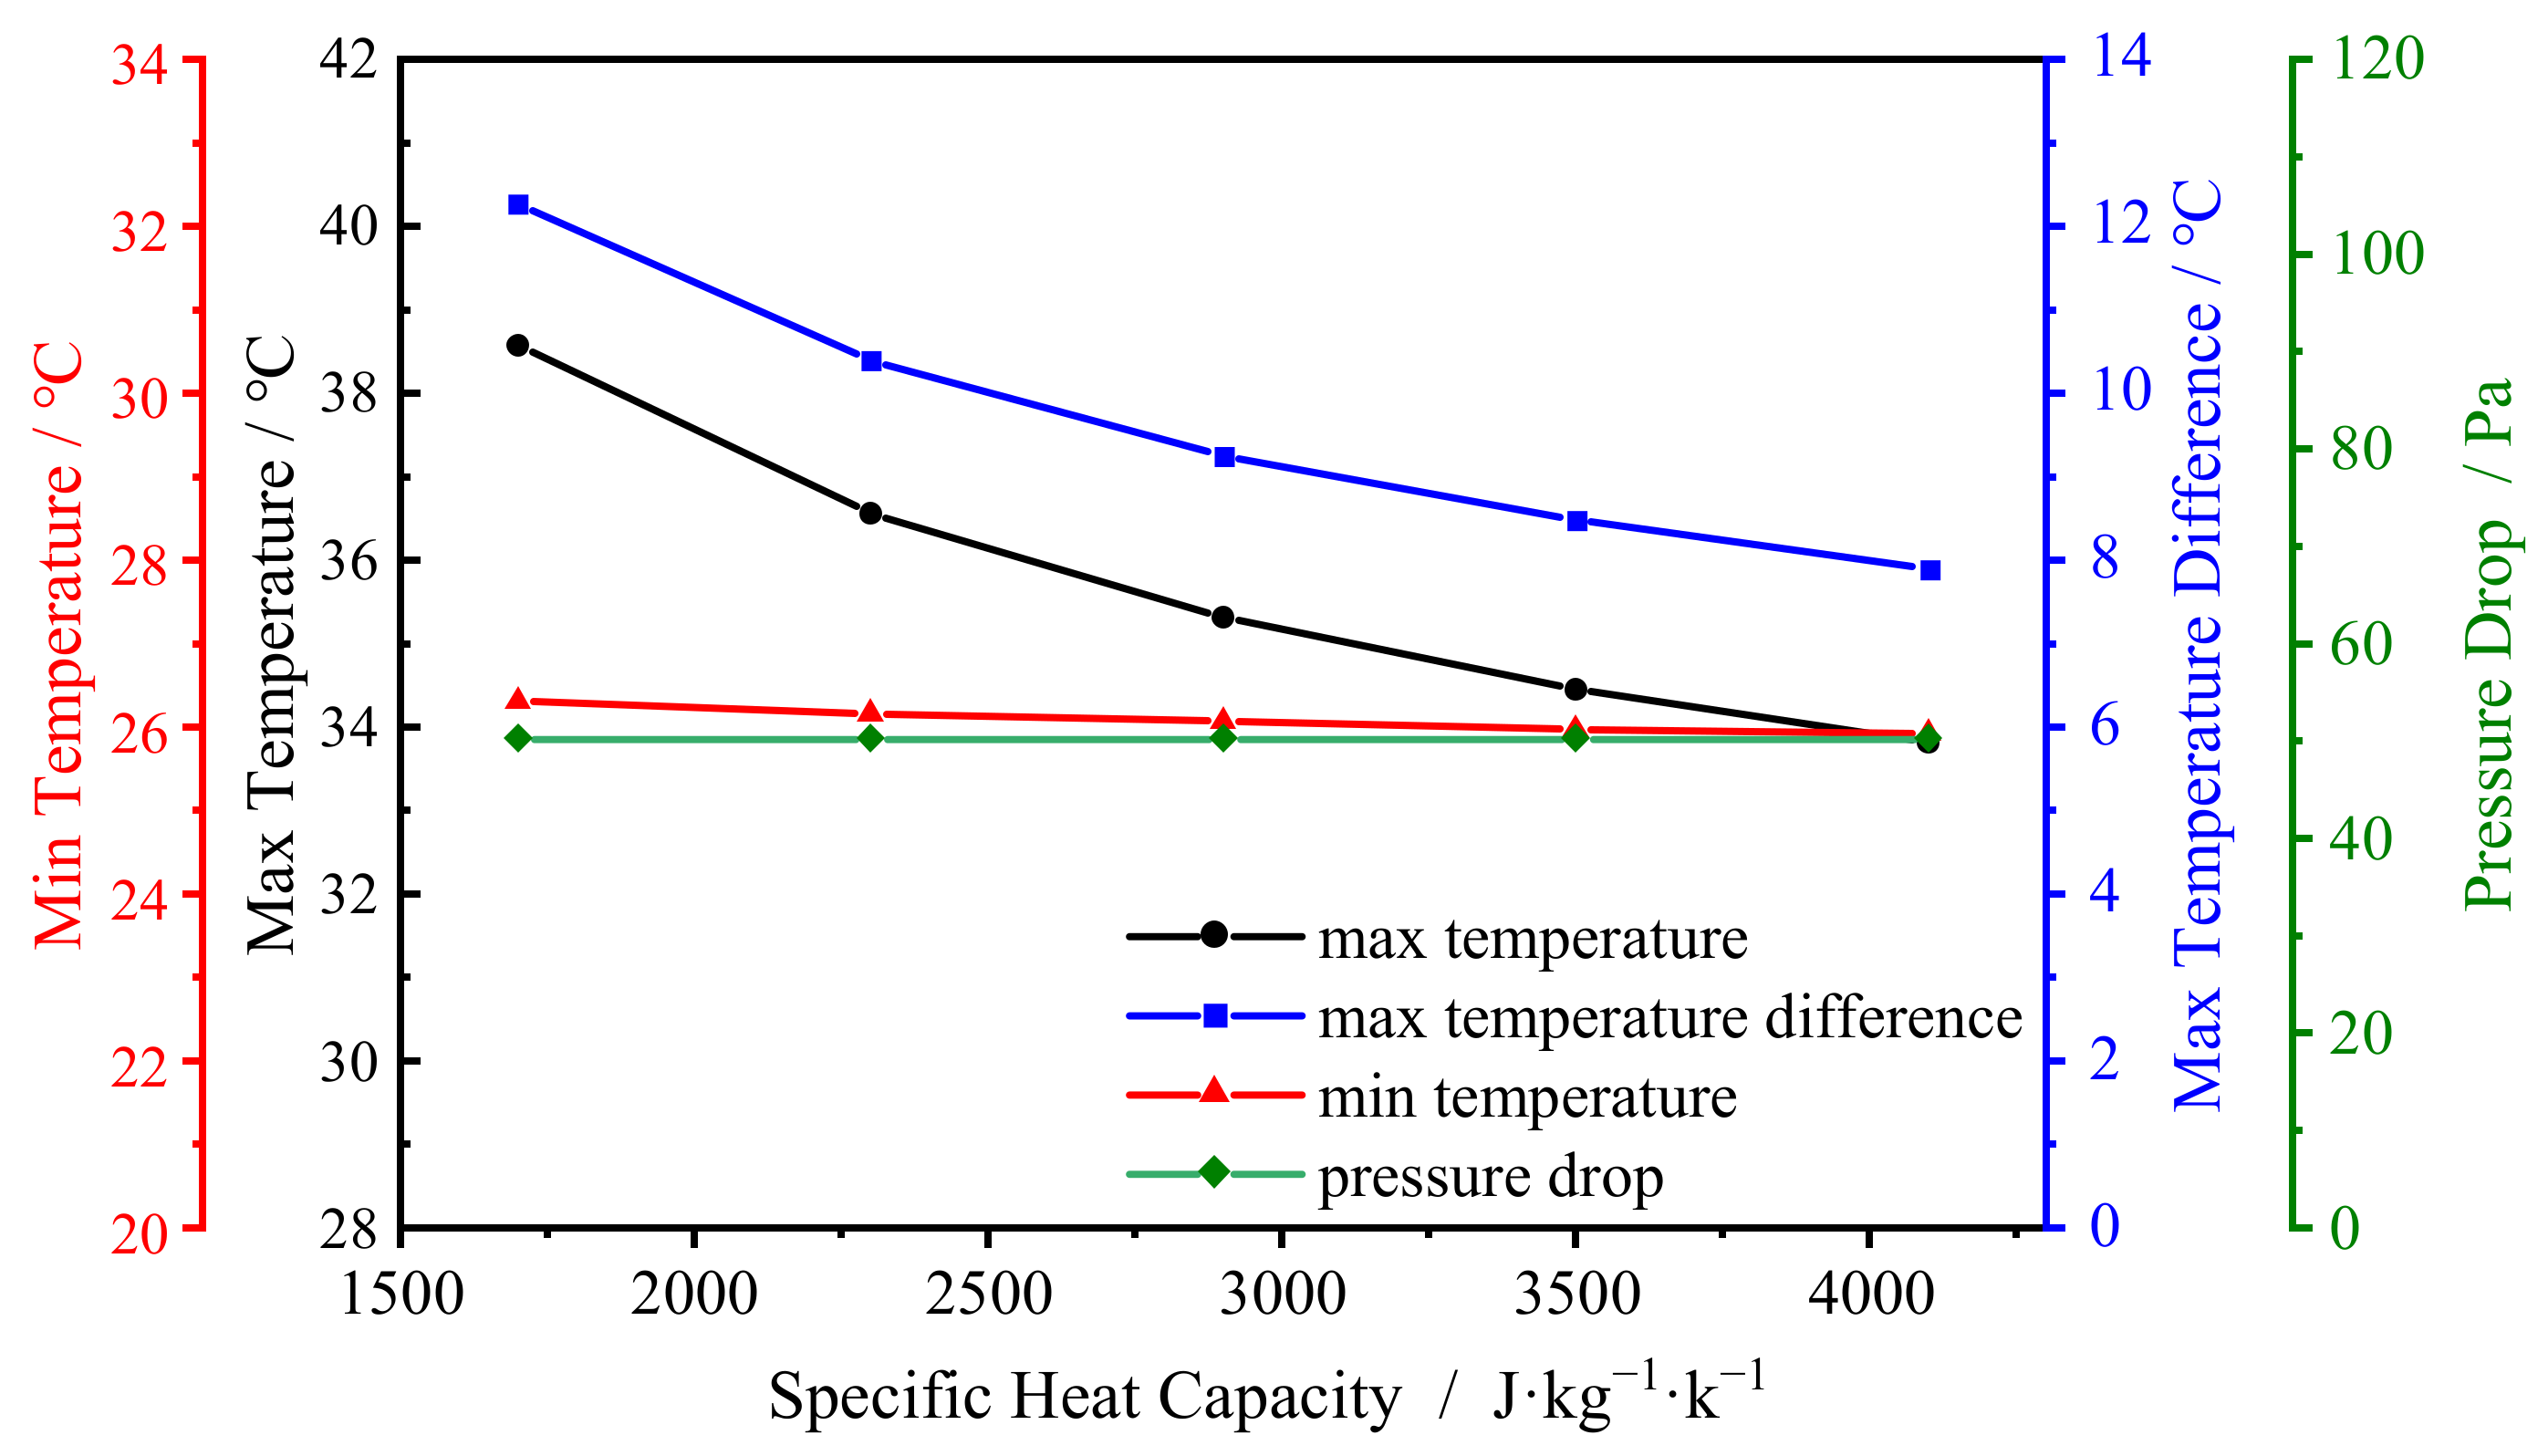
4.3. Specific Heat Capacity
Specific heat capacity refers to the heat absorbed or released by a substance of unit mass when it rises or falls to unit temperature. The specific heat capacity of the coolant is also one of the material properties. At room temperature, the specific heat capacity of water is about 4200 J·kg
−1·k
−1. While in the initial settings, the specific heat capacity of dimethyl silicone oil is 1630 J·kg
−1·k
−1. To investigate its effect on the performance of immersion cooling, the specific heat capacity was set to 1700 J·kg
−1·k
−1, 2300 J·kg
−1·k
−1, 2900 J·kg
−1·k
−1, 3500 J·kg
−1·k
−1, 4100 J·kg
−1·k
−1, with the other parameters remaining unchanged. The MAT, MIT, MATD of the cell at the end of discharge, as well as the pressure drop of the coolant are shown in
Figure 12.
It can be seen that with the increase in the specific heat capacity of the coolant, both the MAT and the MATD of the cell demonstrate downward trends. The MAT of the cell decreases from 38.6 °C to 33.8 °C, a reduction of 4.8 °C. The MATD decreased from 12.2 °C to 7.8 °C, a reduction of 4.4 °C. However, the MIT decreased from 26.3 °C to 25.9 °C, a reduction of only 0.4 °C. The reason for this phenomenon is that specific heat capacity reflects the heat capacity per unit mass of the coolant. In the convective heat transfer process between the coolant and the cell, the greater its value is, the more heat can be transferred through convection. So, the convective heat exchange is stronger, significantly reducing the temperature of the cell. However, since the temperature of the cell near the inlet of the coolant is already low, the change in the specific heat capacity has a greater effect on the MAT than on the MIT. So, the MATD also decreases with the MAT.
It can also be seen that the pressure drop of the coolant basically does not change with the specific heat capacity. This is because the specific heat capacity is a thermal parameter of the material. It mainly affects the heat exchange between the coolant and the cell, not the flow pattern of the coolant.
Therefore, when designing the BTMS with immersion cooling, the coolant with greater specific heat capacity can effectively enhance its performance. Adding phase change material (PCM) into the coolant is an effective way to increase its specific heat capacity, such as the PCM emulsion and encapsuled PCM [
9,
36].
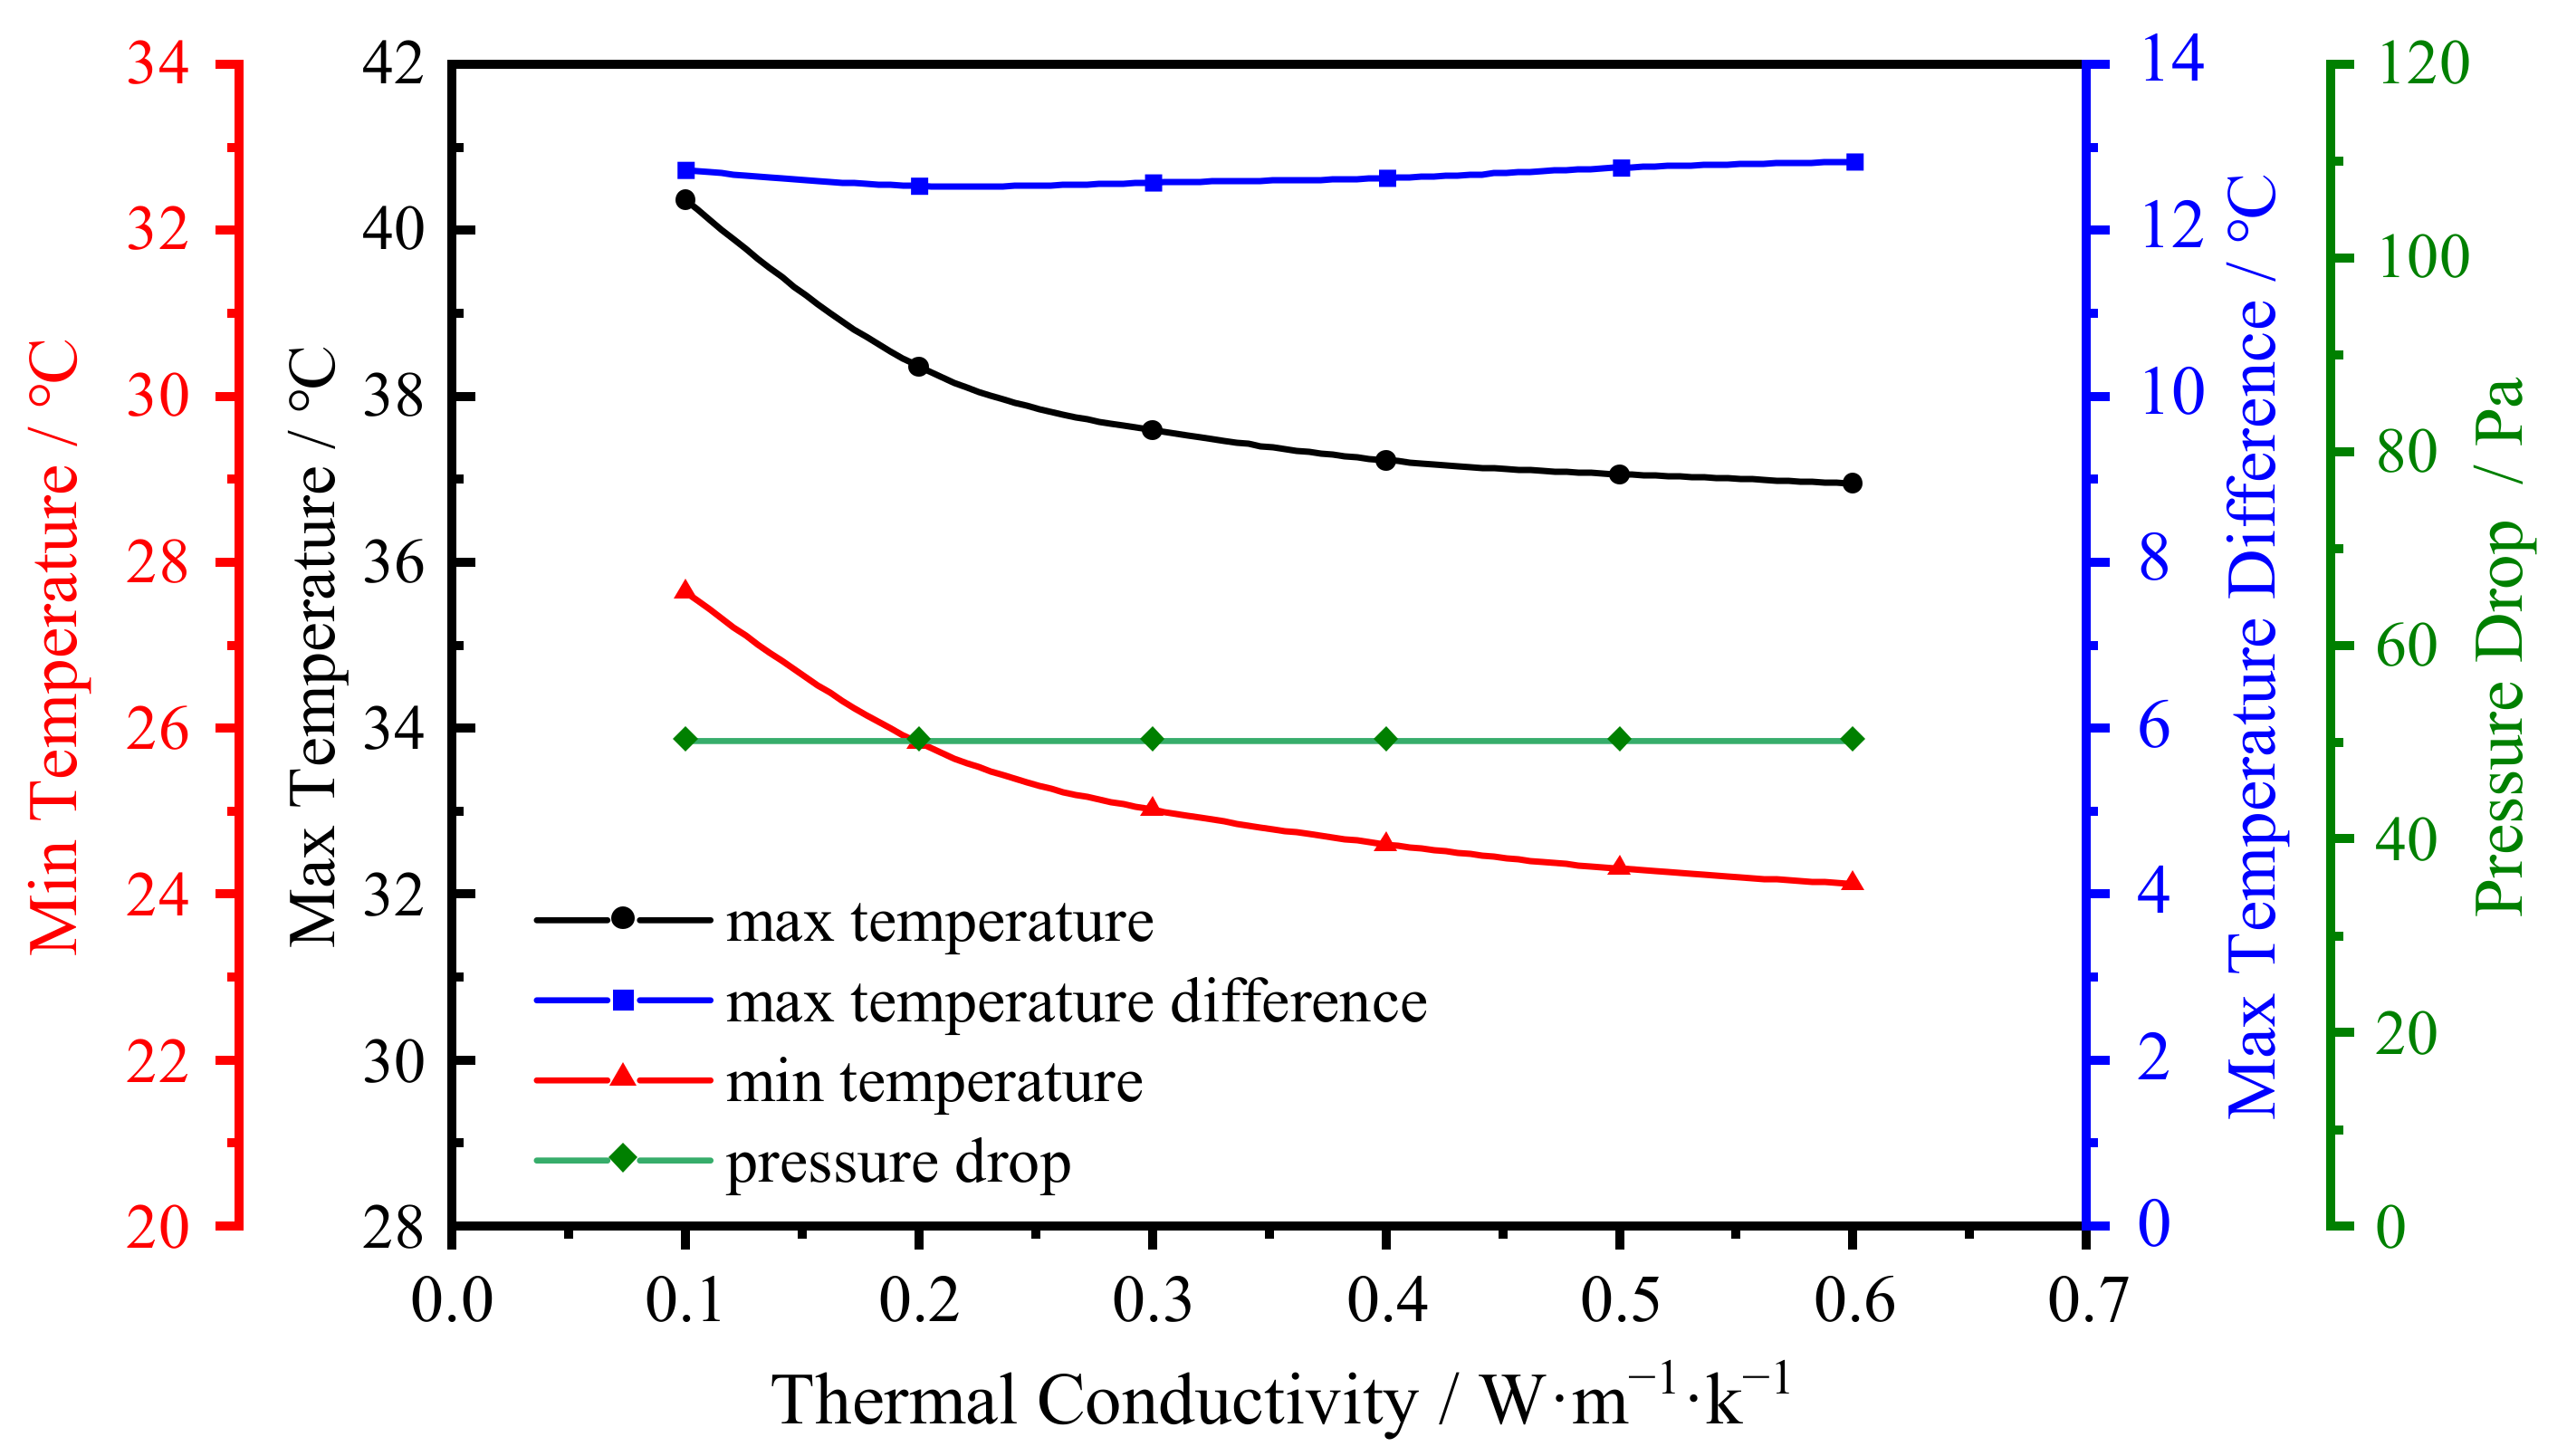
4.4. Thermal Conductivity
Thermal conductivity refers to the heat transmitted directly by the material of unit section and unit length under unit temperature difference. The thermal conductivity of the coolant can directly affect the convective heat transfer between the coolant and cell. At room temperature, the thermal conductivity of water is 0.6009 W·m
−1·k
−1, and that of the nanofluid prepared by Huang et al. [
37] increased by 4.3% compared with water. In the initial settings, the thermal conductivity of dimethyl silicone oil was 0.16 W·m
−1·k
−1. To investigate its effect on the performance of immersion cooling, the thermal conductivity was set to 0.1 W·m
−1·k
−1, 0.2 W·m
−1·k
−1, 0.3 W·m
−1·k
−1, 0.4 W·m
−1·k
−1, 0.5 W·m
−1·k
−1, 0.6 W·m
−1·k
−1, with the other parameters remaining unchanged. The MAT, MIT, and MATD of the cell at the end of discharge, as well as the pressure drop of the coolant, are shown in
Figure 13.
It can be seen that, with the increase in the thermal conductivity of the coolant, both the MAT and the MIT of the cell demonstrate downward trends. The MAT decreased from 40.4 °C to 37.0 °C, a reduction of 3.4 °C. The MIT decreased from 27.6 °C to 24.1 °C, a reduction of 3.5 °C. When the fluid with uniform temperature passes through a solid wall with another temperature, a fluid layer with a great temperature change will be formed near the solid wall, which is called the thermal boundary layer. It can be regarded as a fluid layer with a temperature gradient, which is also the main area where heat exchange occurs. In the thermal boundary layer of laminar flow, the heat transfer in the direction perpendicular to the wall mainly depends on thermal conduction. Therefore, the thermal conductivity plays an important role in the convection heat exchange between the coolant and the cell. Increasing thermal conductivity can better promote the convective heat exchange between them, thereby enhancing the cooling effect. Since the convective heat exchange between the coolant and the entire cell is enhanced, the MAT and the MIT are reduced synchronously, resulting in insignificant changes in the MATD of the cell.
It was also noticed that, in the previous analysis, the MIT of the cell was always around 26 °C. However, after increasing the thermal conductivity, the MIT demonstrated a significant downward trend. The reason is that the convective heat exchange between the coolant and the cell at the inlet determines the MIT. In the initial setting, the smaller thermal conductivity of dimethyl silicone oil functioned as a bottleneck, restricting the convective heat exchange between the coolant and the cell at the inlet.
It can also be seen that the pressure drop of the coolant basically did not change with thermal conductivity. This is also because the thermal conductivity was a thermal parameter of the material. It mainly affects the heat exchange between the coolant and the cell, not the flow pattern of the coolant.
Therefore, when designing the BTMS with immersion cooling, the coolant with greater thermal conductivity can effectively enhance its performance. Adding thermal conductive micro-particles into the coolant is an effective way to improve its thermal conductivity [
13,
38].


