Article

Analysis of Efficiency of Thermopressor Application for Internal Combustion Engine †

1
School of Energy and Power, Jiangsu University of Science and Technology, No.2 Mengxi Road, Zhenjiang 212003, China
2
Heat Engineering Department, Admiral Makarov National University of Shipbuilding, Heroes of Ukraine Avenue 9, 54025 Mykolayiv, Ukraine
3
Department of Air Conditioning and Refrigeration, Admiral Makarov National University of Shipbuilding, Heroes of Ukraine Avenue 9, 54025 Mykolayiv, Ukraine
*
Author to whom correspondence should be addressed.
This paper is an extended version of our paper published in 2021 MPSU-2021, E3S Web of Conferences 323, 00017, Kraków, Poland, 19–21 May 2021; 6p, Published online.
Energies 2022, 15(6), 2250; https://doi.org/10.3390/en15062250
Submission received: 15 February 2022 / Revised: 10 March 2022 / Accepted: 17 March 2022 / Published: 19 March 2022
(This article belongs to the Special Issue Computational Thermal, Energy, and Environmental Engineering)

Abstract

:
Contact cooling using thermopressor technologies is a promising direction for the development of energy-efficient technologies. This technology is based on the implementation of the thermo-gas-dynamic compression effect in special contact heat exchangers that consists of increasing the pressure while decreasing the temperature during the evaporation of a finely dispersed liquid injected into a gas flow moving at a speed close to sound. Upon application of the thermopressor for charge air cooling of the engine, the following result was obtained: an increase in the air pressure after the turbocharger by 340 to 480 kPa. The thermopressor can be used as a boost stage after the turbocharger, resulting in the reduction of a basic turbocharger compression work and the increase of engine power output accordingly. Reducing the work allows for the same air flow rate on the internal combustion engine to reduce the compressor power by 10 to 12%. This increases the temperature of the exhaust gases at the inlet of the exhaust boiler by 10 to 15 °C and boiler steam capacity, resulting in an increase in the power output of the utilization turbine generator with a corresponding reduction in the fuel consumption of the diesel generator of the ship power plant by 2 to 3%.

1. Introduction

Thermopressor technologies are based on the implementation of the thermo-gas-dynamic compression effect in special contact heat exchangers (thermopressor or aerothermopressor) that consists in increasing the pressure while decreasing the temperature during the evaporation of a finely dispersed liquid injected into a gas flow moving at a speed close to sound [1,2].
Contact-cooling using thermopressor technologies is a promising reserve for increasing the efficiency of using the secondary heat of power plants based on internal combustion engines, due to highly efficient cooling of the charge air [3].
In research [1] the experimental results and theoretical researches are resulted. They allowed the authors to conclude that an increase in total pressure by 20% is quite achievable. An experimental research of 20 liquid injection systems was conducted. The system of maximum water supply with low speed turned out to be the best. The maximum thermopressor diameter during the experiments was 280 mm. At the same time, an increase in the total flow pressure by 3% was achieved.
Fowle [4] researched the thermopressor operation on the gas turbine exhaust gases. The author designed and researched an experimental thermopressor with gas consumption at 11.5 kg/s. In the experiments, the relative effect of thermo-gas dynamic compression achieved 5%, with the injection of about 8% of water (relative to the flow of gas). The paper obtained data on the pressure loss due to local and hydraulic resistance in thermopressor different parts; the total pressure decrease without liquid injection achieved 14%.
However, in the presented work, a thermopressor was studied that worked with the power plant engine exhaust gases, and the use of a thermopressor for cooling the power plant engine cycle air was not considered.
Low-, medium- and high-speed internal combustion engines are widely used in power plants of transport and stationary energy. The air parameters at the turbocharger (TC) discharge and at the inlet to the cylinders significantly affect the fuel and energy efficiency of the engine. Every 10 degrees, an increase in air temperature causes a decrease in the effective efficiency of marine low-speed diesel engines by 0.5–0.7% [5,6] with a corresponding increase in specific fuel consumption [7,8]. The decrease in engine power is caused by a decrease in the mass air flow in the cylinders, due to a decrease in the air density with an increase in temperature [9,10].
The charge air cooling of the internal combustion engine is carried out in order to ensure normal operating conditions of the turbocharger and to increase the air mass charge in the cylinders. The air can be cooled in refrigerators of various designs: round-tubular, flat-tubular with corrugated common plates, with a surface made of shaped sheets, etc. Cooling the charge air for every 10 K increases the air mass entering the working cylinder by 2.0–2.5% and leads to a decrease in the average temperature of the operating cycle and the heat density of the diesel engine parts at increased boost pressure [11,12].
The increase in air temperature depends on the degree of pressure increase, compressor efficiency and heat exchange with the walls, that is, on the compressor design. Engine intake air temperature can be high at high pressure ratios (unless charge air cooling is used), adversely affecting the engine efficiency [13,14]. Moreover, there is an improvement in the environmental performance of the internal combustion engine as a result of a decrease in the average temperature in the cycle with a decrease in the charge air temperature. Compressors of turbocharging units of modern marine internal combustion engines have relatively high-pressure ratios, εc is 3 to 5. In this case, the capacities of the compressor and the turbine are approximately equal, and the turbine uses almost the entire heat drop of the exhaust gases. In this case, additional energy can be obtained only by reducing the compression work in the compressor and thus unloading the turbine [15].
The development of modern energy-efficient technologies for power plants can cause a low level of waste heat use [16,17]: the temperature of gases after the heat recovery boilers is about 180 °C, charge air temperature is 140–220 °C and the temperature of the engine cylinders’ cooling water is 90–120 °C. Heat with such a thermal potential can be used in several ways:
  • The use of the combustion products heat for the steam production in the heat recovery boiler (reduction of the specific fuel consumption is 2–3%) [18,19].
  • Turning to heat recovery boilers with two-pressure circuits (additionally increases the capacity of the utilization turbine generator by 15–30%) [20,21,22].
  • To improve the turbocharge system [23,24].
  • The use of the high-temperature cooling method of the internal combustion engine [25,26].
  • The use of combined energy production technologies with simultaneous production of heat (steam, hot water), electrical energy (generator, shaft generator) and cold (heat-using ejector and absorption refrigeration machines) [27,28,29].
The most common way to improve the fuel and energy efficiency of a power plant is contact cooling of the air flow by water injection [30,31]. It is promising to cool the charge air of the internal combustion engine with a thermopressor, which provides an increase in efficiency and a reduction in fuel consumption, due to a decrease in temperature and an increase in compressed air pressure. It leads, in turn, to a decrease in the compression power consumption [32]. Changing the operating conditions of power plants and, consequently, the thermopressor thermal load, require rational organization of work processes and the determination of a rational design pressure increase that would provide the maximum effect [33,34]. Further development of this direction is to use the secondary heat of power plants (the heat of air or combustion products compressed by compressors) to accelerate the air (gas) flow to a speed close to the sound one and practically instantaneous (with a minimum length and aerodynamic resistance) evaporation of injected water [4,35].
On the basis of the presented analysis, on the current state of development of technologies for increasing the fuel and energy efficiency of power plants based on internal combustion engines, the main task of the research was formulated: to develop and analyze improved thermopressor systems for utilizing the energy of combustion products with cooling the working fluid (air) of the engines, principles and methods of their implementation.

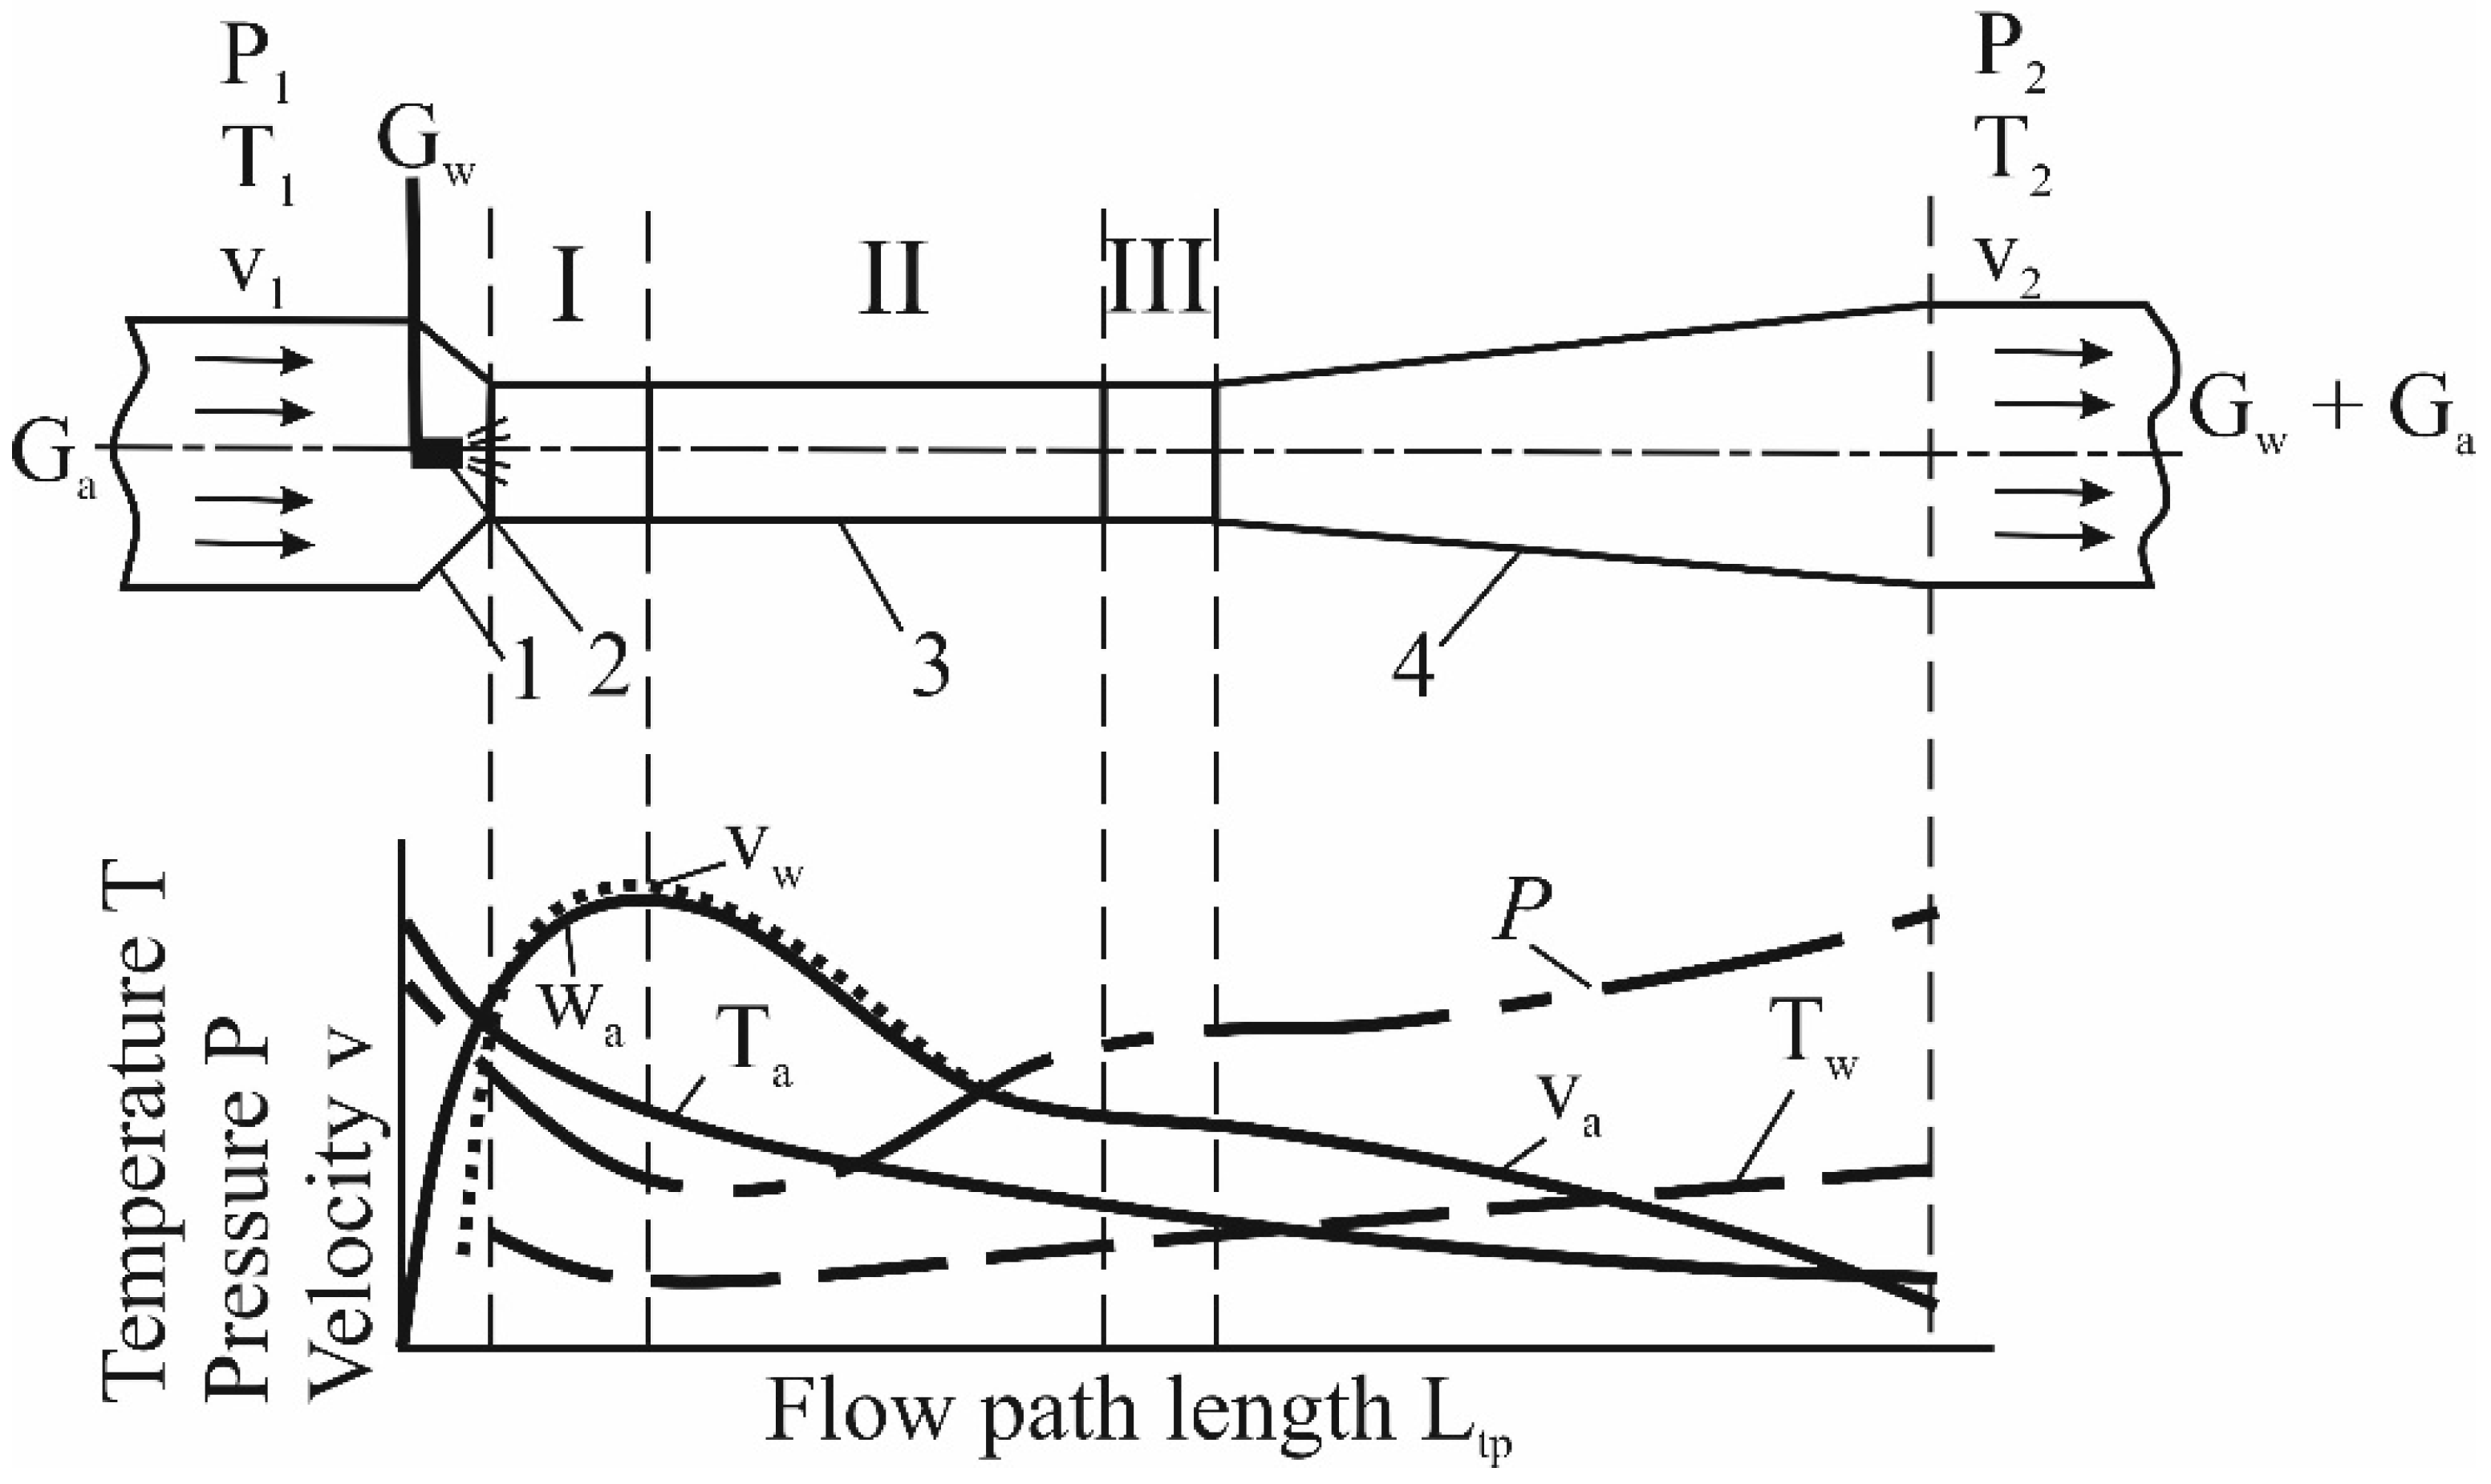
2. Model of Thermopressor

A comparative–computational research method was used in the work to determine the thermodynamic and energy efficiency of a thermopressor cooling system as part of a power plant. To use this method, a proprietary software package was developed which allows for the following:
  • To simulate all working processes in the thermopressor;
  • To calculate the main structural elements of the thermopressor;
  • To calculate the energy efficiency and main characteristics of the engine with thermopressor cooling systems, taking into account changes in climatic and hydrometeorological conditions, as well as partial operating modes of the power plant.
The characteristics calculation of the thermopressor (air pressure, Pa; air temperature, Ta; air velocity, va; water velocity, vw; etc.) and its basic geometric parameters of the flow path under the given operating conditions of the power plant engine was carried out according to the presented methods [36,37,38]. The calculation took into account the pressure loss in the nozzle part (confuser), working chamber and diffuser, as well as with the frontal resistance of water droplets [39,40,41].
The main parameters calculation of the internal combustion engine was carried out by using the software packages Diesel-RK and CEAS (MAN B&W) [42], taking into account the change in the corresponding parameters of the air at the inlet to the engine cylinders, as well as the partial operating modes. To use the above software systems, an additional control program was developed, in which the parameters of wet air at the inlet and outlet of the turbocharger were determined [43].
The mathematical model of the thermopressor should take into account the following: features of thermo-gas-dynamic compression in the evaporation chamber; evaporation of a drop in a flow of moist air moving at a speed close to sound, features of crushing and transformation of the dispersed flow in the main elements of the thermopressor flow part, features of the liquid injection process into the flow of moist air, friction losses in the elements of the thermopressor flow part and features of the heat transfer processes during the phase transition (boiling) in the evaporation chamber.
Hence, the mathematical model of the thermopressor should include the following components:
(1)
Mathematical model of liquid (water) drop evaporation in a flow of moist gas (air) moving at a speed close to sound;
(2)
Mathematical model of the thermo-gas-dynamic compression working process in the evaporation chamber.
The development of a droplet evaporation mathematical model should describe the processes of liquid leakage and evaporation. Such models should consider workflows that involve a complex of bubbles under conditions of thermodynamic instability. However, the development of such a model requires a separate study with an experiment to determine the dispersion of the flow.
When developing a mathematical model of the thermo-gas-dynamic compression working process in the evaporation chamber, it is advisable to use the classical thermo-gas-dynamic dependences, which were given and tested in known research studies [35,44,45].
The operation of the thermopressor is based on the effect of thermo-gas-dynamic compression—if the gas flow, which moves at a transonic speed, cools, then the pressure will increase. In the real thermopressor (Figure 1), the gas-expansion process occurs in a well-profiled nozzle almost adiabatically. In the narrow part of the nozzle, where the gas flow moves at a speed of (0.5–0.9) Ma, a flow of mechanically finely atomized cooling water is supplied (mode I). In the evaporation area, the interaction of these flows takes place, which is expressed in the acceleration and fragmentation of droplets and some deceleration of the gas flow, heating and evaporation of droplets, and cooling of the gas (mode II). A two-phase flow is formed, moving at a high speed, in which the processes of heat and mass transfer, changes in the composition of the vapor–gas–liquid mixture and all flow parameters take place. These processes continue in the diffuser, where there is a general deceleration of the flow and an increase in static pressure (mode III).
To calculate the characteristics of the thermopressor as part of the engine charge-air-contact-cooling system, it is necessary to use a mathematical model that takes into account the influence of thermo-gas-dynamic compression processes [35,36].
The main assumptions made in the development of the mathematical model of the thermopressor are as follows:
(1)
No heat exchange of the surface of the thermopressor with the environment;
(2)
The air parameters correspond to the parameters on the compressor outlet of the power plant engine;
(3)
The amount of liquid (water) injected corresponds to the modes of operation (including partial modes) of the power plant (temperature, pressure and relative humidity of the engine charge air);
(4)
The modes of power plant operation are influenced by changes in climatic and hydrometeorological conditions (temperature, pressure, relative humidity and moisture of the inlet air);
(5)
The problem of modeling two-phase flows in a thermopressor was set as stationary;
(6)
The problem of heat calculation of the thermopressor with phase transition was solved in conjugate setting—taking into account the decrease of pressure;
(7)
Ehen calculating the pressure decrease (including phase transitions) adopted classic models that take into account the resistances against the flow part walls of the thermopressor, as well as the influence of local resistances (compression, expansion);
(8)
When calculating the resistances losses, the presence of a dispersed flow in the thermopressor flowing part (evaporation chamber, diffuser) was taken into account;
(9)
Liquid droplets evaporation is carried out in the evaporation chamber and the thermopressor diffuser;
(10)
Liquid droplets evaporation is carried out to full saturation of air, i.e., to the value of relative humidity φ = 100%, while evaporation in the whole apparatus may not be complete;
(11)
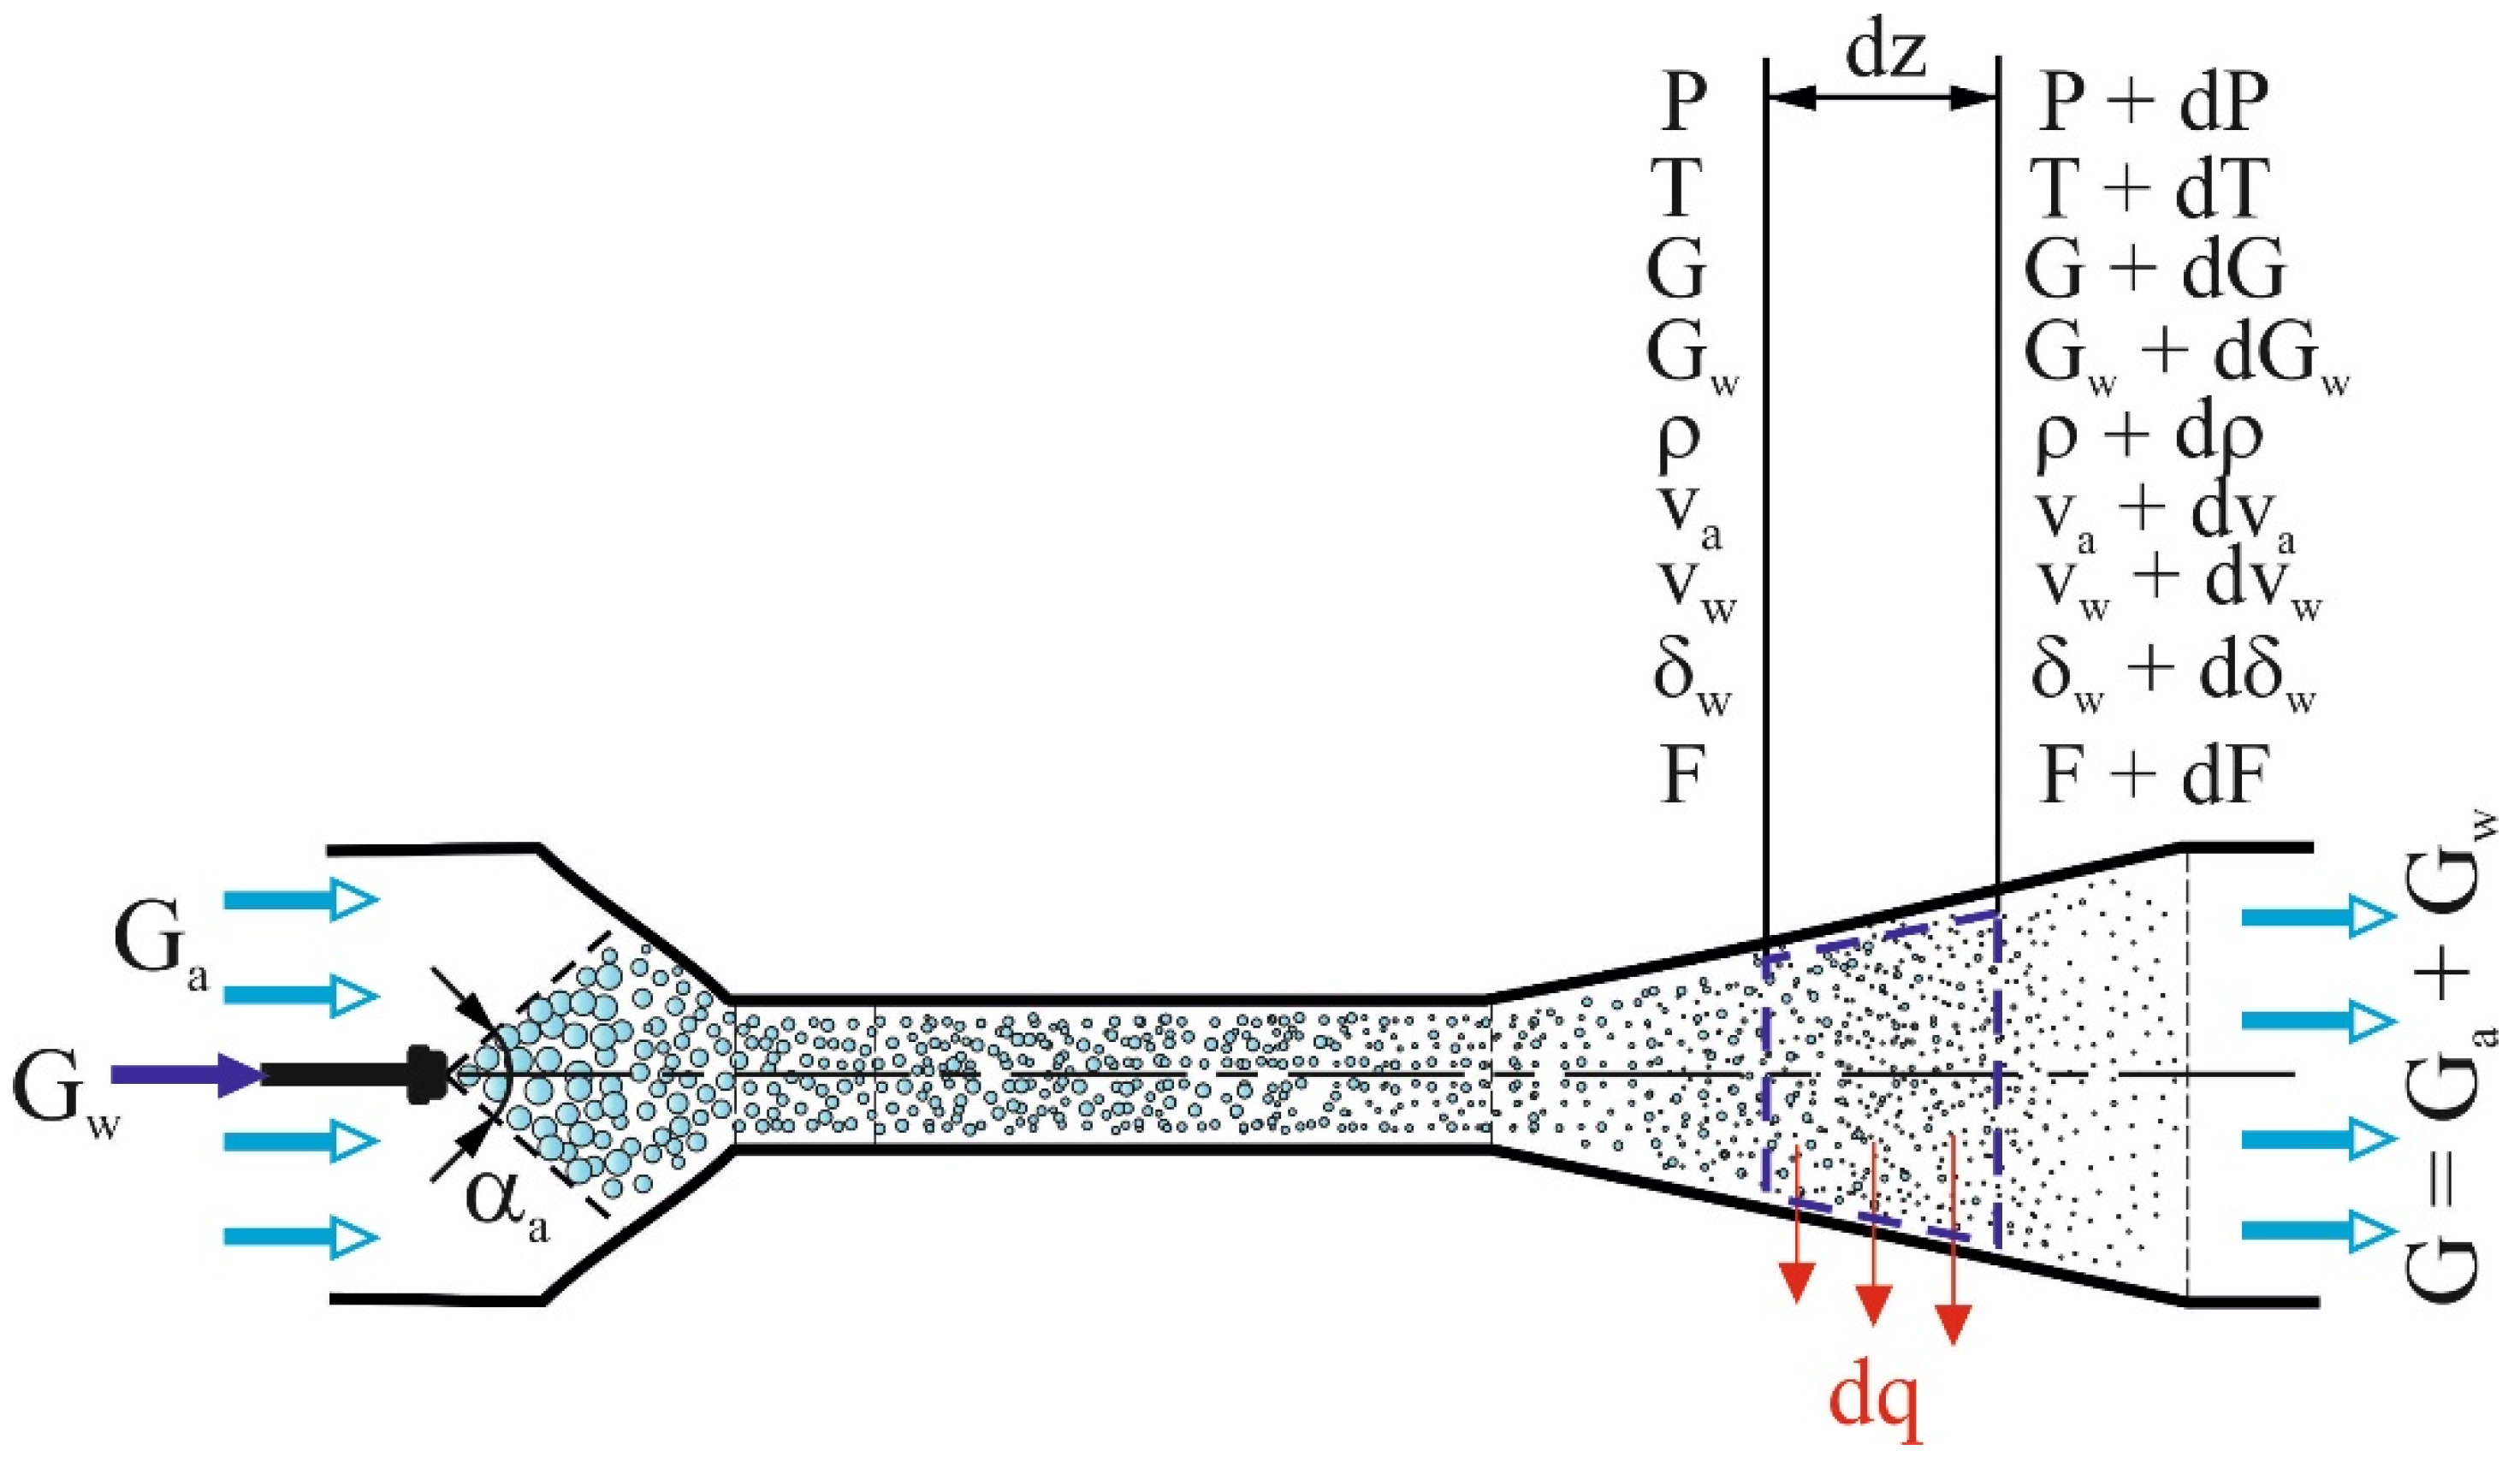
When determining the parameters of wet gas (air), we considered the boundary conditions of the third kind; that is, the known inlet temperature, pressure, relative humidity and heat-transfer laws determined the heat flux density and heat flow in the tube length dz. From the air heat balance and liquid (water) was its temperature, pressure and relative humidity at the outlet of the section dz, and based on the pressure drop due to hydraulic resistance and pressure increase due to thermo-gas-dynamic compression calculated the pressure at the outlet of the section dz, which served as input parameters for the next section of the thermopressor flow part.
(12)
When numerically integrating the evaporation chamber, the step was chosen so that the pressure increase did not exceed ΔPtp = (Ptp2/Ptp1) = 1.0001, (0.01%), which allows us to move from the final differences in temperature and pressure to full differentials;
(13)
Water droplets are injected into the moving air flow at transonic speed (Ma = 0.35–0.95);
(14)
The physical properties, flow rate and composition of the gas along the length of the thermopressor flow part remain constant;
(15)
The cross-sectional area of the evaporation chamber is constant (the shape of the chamber is cylindrical).
The input data for the calculation thermopressor cooling system mathematical model are as follows: parameters of the injected water (temperature, Tw1; velocity at the nozzle outlet, vw; mass flow, Gw; and initial droplet diameter δw); parameters of air (pressure, Pa1; temperature, Ta1; relative humidity, φa1; moisture content, da1; mass flow, Ga; and initial velocity, va); and parameters of the thermopressor (the geometry of the flow path is the taper angle of the confuser, αc; diffuser, βd; the evaporation chamber diameter, Dch; the length, Ltp; and the relative length of the main elements, ltp, and cross-sectional area of the thermopressor flow part F) (Figure 2).
Based on the solution of the differential equations system of flow thermodynamics [35,46,47], equations of the flow velocity, pressure, density and temperature of the flow were obtained under the combined effect of consumption and heat factors.
Equation of mass balance:
G a + G w = G ,
where Ga is the air mass flow rate, Gw is the injected liquid mass flow rate and G is the resulting mixture mass flow rate.
Equation for the flow velocity [48]:
( Ma 2 1 ) d v v = [ 1 ( 1 + k 1 2 Ma 2 ) σ ] dG G ,
where Ma is the Mach number:
Ma = v a s ,
where k is the adiabatic coefficient, v is the flow velocity and as is the sound velocity.
The thermopressor criterion characteristic:
σ = | d T 0 T 0 × G d G | = Δ I 0 w c p T 0 ,
where ΔI0w is the difference in the total enthalpies of liquid and vapor at the temperature and velocity of their movement, cp is the heat capacity at constant pressure and T0 is the flow stagnation temperature.
Equation for the pressure:
( Ma 2 1 ) d P P = kMa 2 [ 1 ( 1 + k 1 2 Ma 2 ) σ ] d G G
Equation for the density:
( Ma 2 1 ) d ρ ρ = Ma 2 ( 1 1 + k 1 2 Ma 2 Ma 2 σ ) d G G ,
where ρ is the flow density.
Equation for the temperature:
( Ma 2 1 ) d T T = 2 ( 1 + k 1 2 Ma 2 ) × ( 1 kMa 2 + 1 2 σ ) d T T ,
where T is the flow temperature.
Equations for the air stagnation pressure and density:
d P 0 P 0 = kMa 2 2 σ d G G = kMa 2 2 σ d T 0 T 0
and
d ρ ρ = ( 1 + kMa 2 2 ) σ d G G = ( 1 + kMa 2 2 ) σ d T 0 T 0
As a consequence of the law of reversal of influences during contact evaporative cooling of the gas flow, it was found that the main effect is determined only by the thermal effect, which is associated with the heat consumption for the injected liquid evaporation. Therefore, regardless of the criterion value, σ, the parameters of pressure and density grow during the liquid evaporation in a subsonic flow.
The main flow parameters that change as a result of thermo-gas-dynamic compression: Pa, Ta, va, Ga, Gw, F, vw, Tw and δw (Figure 2). Basic laws and equations for determining the main flow parameters [49,50]:
  • Mass conservation law (continuity equation) for each of the flow components, gas (air) and water;
  • Newton’s law of motion (momentum theorem) and the first law of thermodynamics (energy equation) for the flow of liquid and gas;
  • Laws of heat transfer, mass transfer and evaporation of droplets;
  • Equations of state for a mixture of ideal gases (Gibbs–Dalton law);
  • Equations of the laws of gas flow thermodynamics to determine the Mach number, stagnation temperature and pressure of the ideal gas and wet gas (air).
The parameters of the thermopressor working processes change along the flow part, so it is recommended to present them in a differential form.
Continuity equation:
dGa = 0
and
d G w G = d G a G = d G G = d ρ ρ + d v v + d F F
Momentum conservation equation:
d P P + kMa 2 ( d v v + 4 Σ ξ 2 × d z D ch + G w G × d v w v + ( 1 v w v ) d G G ) = 0 ,
where Σξ is the resistance coefficient of the thermopressor flow part surface.
Energy conservation equation:
d T T d q G w G d I w c p T + ( I w I w + v 2 2 ( 1 v w v 2 ) c p T ) × d G G + ( k 1 ) Ma 2 × ( d v v + G w G v w v d v w v ) = 0
where q is the heat amount that is removed during the drop evaporation in an air flow, I′w is the water enthalpy, I″w is the steam enthalpy and T is the flow temperature.
By combining the above Equations (2)–(9), we can calculate the behavior of the flow [1,35] (change in Mach number, Ma; total gas-flow pressure, dP/P; gas-flow temperature, dT/T; gas flow inhibition temperature, dT0/T0; droplet diameter in gas flow, δw; and gas-flow inhibition pressure, dP0/P0) under different influences on the local section, dz: cross-sectional area of the thermopressor flow part dF/F, friction against the wall of the flow part ΔPfr, and flow rate and droplets (acceleration) dv, dvw.
In the case of liquid injection into the air flow at equal air velocities and injected water, the difference between the total water enthalpies and steam, after bringing it to the same temperature and velocity with the air, is approximately equal to the vaporization heat, r:
Δ I 0 w = I w I w r
Hence, it follows that the thermopressor criterion characteristic is calculated as follows:
σ r c p T 0
By solving Equation (9), we obtain the following:
d P 0 P = kMa 2 2 σ d T 0 T 0
By solving Equation (16), using the quadrature method, we obtain the following:
d P 0 P 0 = kMa 2 2 σ d T 0 T 0
By solving this equation, the equation for an ideal thermopressor is determined, i.e., without taking into account the friction forces:
P 02 P 01 = ( T 02 T 01 ) kMa 2 2 σ ,
where T01 and T02 are the stagnation flow temperature in the inlet and outlet thermopressor; P01 and P02 are the stagnation flow pressure in the inlet and outlet thermopressor.
The mathematical model must take into account the presence of two-phase flow in the thermopressor evaporating chamber. To determine the speed of sound in a two-phase medium, the equation for water and steam is used [37,48]:
a s = 1 x ( 1 + ( 1 x ) v w x v w ) × k p ρ ,
where x is the degree of dryness for the evaporation chamber inlet:
x = G a G a + G w ,
To determine the friction pressure loss, we must determine the total hydraulic resistance in the thermopressor flow part:
Δ P loss = Δ P loc + Δ P fr + Δ P w = ( ξ loc + Σ ξ L tp D ch + ξ w ) ρ v 2 2 ,
where ΔPloc is the thermopressor local resistance, ΔPfr is the friction resistance; ΔPw is the hydraulic resistance of liquid droplets and Ltp/Dch is the relative length (caliber) of the evaporation chamber.
The local resistance coefficient depends on the geometric parameters of the thermopressor elements—confuser and diffuser:
ξ loc = ξ loc . d + ξ loc . c ,
where ξloc.d is the diffuser local resistance coefficient, and ξloc.c is the confuser local resistance coefficient.
The local coefficient of confuser resistance is determined by the following formula [37,44]:
ξ loc . c = ( λ c 1 8 sin α 2 ) × ( 1 ( d ch 4 d c 4 ) ) ,
where λc1 is the average value of the hydraulic resistance coefficients at the beginning (λ1) and at the end (λ2) of the confuser (λc1 = (λ1 + λ2)/2); α is the angle of conicity, ° (accepted α = 40°); dc is the confuser diameter, m; and dch is the evaporation chamber diameter, m.
Local coefficient of diffuser resistance [37,44]:
ξ loc . d = ( λ c 2 8 sin β 2 ) × ( 1 ( d ch 4 d d 4 ) ) + sin β × ( 1 ( d ch 2 d d 2 ) ) 2 ,
where λc2 is the average value of the hydraulic resistance coefficients at the beginning λ1 and at the end λ2 of the diffuser; β is the angle of conicity, ° (accepted β = 10°); and dd is the diffuser diameter, m.
It is also necessary to take into account the hydraulic resistance coefficient of liquid droplets injected into the flow, ξw (the flowing part section of the thermopressor, which corresponds to mode I (Figure 1)—acceleration or deceleration of the drop—depending on the initial speed at the exit of the nozzle):
ξ w = ( 16 Re + 2.2 Re 0.5 + 0.32 ) × ( 1.5 μ w + μ a μ w + μ a ) ,
where Re is the Reynolds number for a flow, μw is the fluid dynamic viscosity coefficient and μa is the dynamic viscosity coefficient for air.
To assess the efficiency of the thermopressor used, we need to calculate the degree of pressure increase:
ε tp = P tp 2 P tp 1
The value of the drop aerodynamic resistance largely depends on the drop diameter. The recommended droplet diameter should be less than 50 μm. In this case, the smaller the drop diameter, the lower the aerodynamic drag on mode I and II. Hence, the degree of pressure increase in the thermopressor will be larger.
Today there are a models number and analytical solutions that describe the processes of liquid outflow (including superheated) and its evaporation. A relatively accurate model is a model that considers the work processes associated with the complex (ensemble) of bubbles in conditions of thermodynamic instability [51].
Furthermore, in the model, it is assumed that the number of bubbles is constant throughout the process. The coagulation processes and crushing of bubbles are excluded. The size, kinematic and thermophysical characteristics of the bubbles are the same. The velocity and pressure fields near each bubble are symmetric.
The efficiency of spraying liquid (water) by the nozzle is determined by the maximum and average drop diameter, the angle and length of the stable spray torch.
The size droplets distribution is determined by the spray spectrum (dispersion). This spectrum is usually determined by the normal distribution law. In the study of injection systems for low-viscosity liquids, the effective droplets’ diameters in the flow were determined [35], and they are equal to about 10 μm (30% of the total number of droplets). Such diameters can be obtained for mechanical (hydrodynamic) injectors at fluid pressures greater than 2–3 MPa.
However, it should be noted that the use of such a model has few problems that can be solved in experimental researches. One of the problems is the large droplets’ evaporation in the flow and their distribution. The use of the model without the drop evaporation kinetics in this case is correct. This is primarily due to the fact that in experimental research, special nozzles of fine spray type “Fog” were used, which provide a dispersion of 10–20 microns. Liquid injection, acceleration and distribution of droplets in the flow are carried out in the receiving chamber. The flow enters the evaporation chamber already prepared. Therefore, we can assume that the dispersed flow consists of very small droplets, which are distributed in the flow evenly at equal distances from each other.
The next step after the working processes of the thermopressor cooling system calculation is to define the working operation characteristics (depending on the type of power plant engine): power, Ne (changes in power ΔNe); efficiency, ηe (changes in efficiency Δηe); specific fuel consumption, ge (changes in specific fuel consumption Δge); and others. Depending on the type of power plant, as well as the schematic design with the use of the thermopressor cooling system, the next step in mathematical model calculating is to calculate the parameters and characteristics of heat exchange, electric power and utilization equipment.
A software package that was developed by References [25,36] allows us to calculate the characteristics of equipment or systems and circuit design solutions when used as part of a power plant: an electric generator (based on an internal combustion engine), heat-using refrigeration machines (ejector refrigeration machine and absorption refrigeration machine), a turbine generator or steam generator as part of a trigeneration unit (stationary units) or as part of a turbo-compound unit (power plants of sea vessels), a recovery boiler of one or two pressures and propulsion complex of a ship power plant. Simulation of the thermopressor cooling system operation makes it possible to reveal the efficiency of using such a system as part of a power plant and compare it with traditional methods of cooling and humidifying air (gas).

3. Validation of Thermopressor Model

For the verification of the mathematical model, an experimental setup was developed to determine the performance characteristics of the thermopressor under conditions of contact cooling of the marine diesel engine charge air (Figure 3) [25].
The experimental thermopressor consists of the following elements (Figure 4): a receiving chamber with a nozzle and system for injecting water into the flow, a confuser, an evaporation chamber, a diffuser, nozzles for installing temperature and pressure sensors. All elements of the thermopressor are removable and allowed us to carry out studies for the different geometric characteristics (Table 1).
An information measuring system was developed for the given experimental setup. This system allows for measurements of pressure, temperature and flow rate with simultaneous automatic recording of data into an electronic protocol. The data were recorded by the system at 1.0 s intervals. To determine each operating point, characterizing a certain operating mode of the thermopressor, 10 measurements were carried out. To collect and organize the exchange of information, a PI485/USB RS485 communication interface converter was used. The information received from the measuring system (Figure 5) was transmitted directly to the computer and processed by using the licensed SSD 3.5 software from RegMik. The discharge pressure of the air flow was measured by a pressure-measuring sensor—model A-10, manufactured by Wika, Germany. A ceramic pressure sensor was used as a sensing element. The measurement range was 0–600 kPa.

4. Analysis of Thermopressor Operation

Analyzing the obtained data of mathematical modeling of thermopressor working, the maxima of pressure increase were revealed as a result of the effect of thermogasdynamic compression. With a decrease in the droplet diameter to 3 μm, the maximum pressure value increases that is, the evaporation process proceeds more intensively, occupying a smaller section of the working chamber. The evaporation efficiency increases with an increase in the total surface droplets area.
Depending on the initial parameters (air temperature, Mach number at the evaporation chamber inlet and droplet diameter) (Figure 6 and Figure 7), at Ma = 0.50, the pressure increase is ΔPtp = 3.0–6.0% (7–17 kPa); at Ma = 0.60, the pressure increase is ΔPtp = 4.0–8.5% (11–25 kPa); and at Ma = 0.74, the pressure increase is ΔPtp = 7.0–12.5% (20–40 kPa). It can also be seen that, with an increase in the initial air temperature, the relative increase in total pressure increases.
The nature of the absolute pressure distribution along the length of the chamber for different initial droplet diameters has the same tendency. The larger the droplet diameter, the less the effect of thermo-gas-dynamic compression, which is associated with an increase in the aerodynamic drag of droplets and a decrease in the intensity of evaporation. However, with an increase in the initial air temperature, the diameter of the droplet increases accordingly, with the possibility of obtaining a positive effect from thermo-gas-dynamic compression.
The nature of the relative and absolute temperature distribution of humidified air values is illustrated in the following charts (Figure 8). The temperature decrease occurs more slowly at the initial temperature, Ttp1 = 500 K, and the relative temperature has lower indices, Ttp1/Ttp2 = 1.465–1.472 (Figure 8a). However, with an increase in the initial temperature to Ttp1 = 550 K, the value of the relative temperature is aligned along the evaporation chamber length (Ttp1/Ttp2 = 1.595–1.603 (Figure 8b).
Depending on the initial parameters (air temperature, Mach number at the evaporation chamber inlet and droplet diameter), the humidified air temperature at the evaporation chamber outlet decreases: at Ttp1 = 500 K, it decreases by ΔTtp = 160–165 K; at Ttp1 = 550 K, by ΔTtp = 207–212 K.
The amount of water injected into the air flow (Figure 9) does not exceed 10%, and, accordingly, the amount of water required for complete evaporation at the initial temperature, Ttp1 = 500 K, is the relative water amount, gw = 5.40–5.47 %; at Ttp1 = 550 K—gw = 6.55–6.60%.
For effective heat transfer between phases, it is necessary to maintain the maximum value of the relative temperature at the outlet of the thermopressor. That is, at the beginning of the process of spraying water for more intense evaporation, the Mach number should reach the maximum values for a subsonic flow Ma = 0.95. However, the increase in Mach numbers continues in the process of liquid evaporation, which is associated with an increase in the vapor-air flow density. This fact should be taken into account when designing the thermopressor flow paths to prevent the flow from going to supersonic speeds. For the investigated evaporation chamber at the initial air flow temperature Ttp1 = 500 K, the Mach number increases by 11% and reaches the value of Ma = 0.85–0.92; at Ttp1 = 550 K, the Mach number increases by 12% and reaches the value of Ma = 0.71–0.83.
The main characteristics of the water evaporation process in the low-flow thermopressor working chamber (Ga = 1.0–1.5 kg/s), as obtained by mathematical modeling (Ma = 0.50), are illustrated in the following charts (Figure 10). It can be seen that, in the presence of incomplete evaporation, it is possible to provide a droplet diameter of less than δw = 20 μm at the thermopressor outlet.
It should be noted that, with an initial droplet diameter of more than 20–30 microns, the achievement of a positive effect from thermo-gas-dynamic compression is possible only at high initial temperatures above Ttp1 = 450 K (177 °C), which is possible when cooling the air between gas turbine compressor stages or behind the ICE compressor; in addition, such conditions must correspond to the modes in the exhaust gas systems of gas turbine and internal combustion engines.
The further development of the method designing consists in rational distribution of the overall design refrigeration capacity between two ranges. The ambient air processing is considered as a two-stage one and includes a fluctuation range as the high-temperature and stable range as the low-temperature stage.
A diagram with the use of the thermopressor as a charge air cooler (CAC) for a turbocharger of a low-speed internal combustion engine with a waste-gas-heat-recovery system in a waste-heat-recovery boiler of the same pressure is shown in Figure 11. The efficiency analysis was carried out in relation to the standard traditional scheme of charge air cooling of a ship’s internal combustion engines. The calculations were performed for a low-speed main engine, 5S50MC-C (MAN B&W) (Ne = 8300 kW, n = 105 rpm). The calculation of the thermopressor parameters is carried out taking into account its joint work with the turbocharger.
The increase in pressure in the thermopressor, ΔPtp, significantly depends on the value of the temperature decrease during cooling, Ttp. The temperature at the thermopressor inlet corresponds to the air temperature at the discharge of the turbocharger. In the scheme with one-stage compression, the temperature at the thermopressor inlet is Tc2 = 190–270 °C (Figure 12). The higher the temperature at the suction temperature and the degree of pressure increase in the TC εc, the higher the temperature according to the turbocharger. Since a thermopressor cooling system, in fact, is a two-stage air compression (the first degree is TC, the second degree is a thermopressor), then the degree of pressure increase εc will be lower (Figure 12); therefore, Tc2 = Tc2′ = 170–250 °C. Then the temperature in front of the thermopressor decreases and, accordingly, the degree of pressure increase εtp will be lower.
For a system with total εc.tp = 4.25, the decrease in compression work is Δlc = 10–13 kJ/kg; at εc.tp = 4.00, the decrease in compression work is Δlc = 9.0–12.5 kJ/kg; and at εc.tp = 3.85, the decrease in compression work is Δlc = 8.5–12.0 kJ/kg (Figure 13a,b). A decrease in work lc allows, at the same, air-flow rates on the internal combustion engine to reduce the compressor power by ΔNc = 100–200 kW (10.0–11.5%) (Figure 13b).
At the minimum temperature at the thermopressor outlet, ttp2, the temperature was taken to be 2–3 °C higher than the dew point temperature. It was taken into account that water injection continues in the thermopressor until the air is completely saturated, that is, φ = 100%. The decrease in the air temperature is Δttp = 110–160 °C, which makes it possible to increase the air pressure by ΔPtp′ = 520–670 kPa (15–18%) (Figure 14 and Figure 15) with “ideal” compression (without taking into account losses friction against the channel walls), and ΔPtp = 340–480 kPa (10–13%) is the actual compression in the thermopressor (Figure 15 and Figure 16). In this case, the degree of the air temperature decrease in the thermopressor will be Ttp1/Ttp2 = 1.30–1.45 (Figure 16). The thermopressor uses as a second stage of compression in the pressurization system, and therefore it is appropriate to evaluate its efficiency by the degree of pressure increase, εtp = 1.10–1.13.
A check was carried out for the adequacy of the theoretical calculated data of the pressure degree increasing in the thermopressor obtained during the simulation. The degree of discrepancy with the experimental data shows from +7% to −6% (Figure 17), which can be considered satisfactory.
The obtained result of experimental data comparison and calculated data makes it possible to state that the mathematical model is effective and can be used for the analysis of thermopressor circuits.

5. Analysis of Thermocompressor Application for Exemplary Internal Combustion Engine

The next analysis of the results shows the following. A decrease in the air temperature and an increase in pressure (Figure 15) in the thermopressor are quite significant, which, accordingly, affects the decrease in the flow rate in the TC; as a result, the temperature of the exhaust gases through the utilization turbine (UT) increases (Figure 18). Thus, at a constant temperature of gases at the inlet to the UT (Tg1 = 300–400 °C), the temperature of the exhaust gases will be Tg2 = 205–285 °C, and when using the scheme with TP—T′g2 = 220–300 °C, which is 15 °C higher than for the basic scheme.
Our comparison of the thermopressor from the point of view of a heat exchanger (charge air cooler) with a stationary air cooler shows that the thermal load on the thermopressor is Qtp = 1600–3700 kW. However, the air temperature at the discharge of the thermopressor (Figure 19) is still high (ttp = 65–85 °C). Therefore, it is advisable to install an additional charge air cooler behind the thermopressor. The heat load on such a CAC is Qcac2 = 200–1200 kW; hence, the total heat load on the TP and the additional CAC will be Qtot = 2000–4800 kW (Figure 20), which is less than for the standard charge-air-cooling system Qcac = 2400–5200 kW (more by 7–15%). The lower thermal load in the proposed scheme can be explained by the fact that the air temperature at the TC when working together with the TP is 20–25 °C lower.
It would be appropriate to evaluate the thermopressor efficiency by taking into account the energy consumption for the supply of fresh water for injection into the thermopressor (Figure 21). According to calculations, the water consumption for injection is Gw = 0.6–1.2 kg/s (2.2–4.3 m3/h), while the water pump power is Nw = 0.3–0.7 kW. The moisture content of the air increases by Δdtp = 40–60 g/kg. Consequently, the power of the injection pump is rather small (0.3–0.5%) in comparison with the decrease in the compressor power ΔNc = 100–200 kW.
The use of the thermopressor leads to a decrease in the TC power, and then the unnecessary heat drop (work) of the TC turbine decreases; the required turbine power and the required gas flow rate also decrease. Hence, it is appropriate to pass (bypass) the excess amount of gas past the turbine, due to which the exhaust gases temperature is increases. The gases’ thermal potential is increased, so they can be used in a waste heat recovery boiler. Thus, the temperature at the recovery boiler inlet increases by almost ΔTrb = 10–15 °C (Figure 22), taking into account that the temperature gases at the recovery boiler outlet is constant and equal to Trb2 = 160 °C. The additional heat load (with the corresponding additional consumption steam) is ΔQrb = 150–300 kW (10–15%).
As shown by the thermal scheme calculations, the amount of steam produced in the recovery boiler is more than enough for needs of this dry cargo ship. Therefore, it is advisable to use the obtained additional steam to drive a utilization turbine generator (UTG), thereby reducing the load on the ship’s power plant, with a corresponding decrease in fuel consumption for diesel generators.
A scheme of a thermopressor charge-air-cooling system with a comprehensive utilization of the exhaust gases heat in the recovery boiler with two circuits of high and low pressure and UTG is shown in Figure 23.
An analysis of the UTG operation was carried out (Figure 24 and Figure 25); it can be seen that an increase in the thermal power in the recovery boiler of two pressures allows an increase in steam production by ΔDutg = 0.07–0.12 kg/s (250–430 kg/h), which, in turn, increases the power of the UTG by ΔNutg = 45–90 kW.
It was proposed to install two MAN B&W 7L16/24 diesel generators on the ship with a rated power Ne = 770 kW and a specific fuel consumption ge = 195 g/(kW∙h). Reducing the load on the ship power plant when the UTG is used (Figure 26) reduces the specific fuel consumption up to Δge = 4–7 g/(kW∙h), while temporarily reducing the fuel consumption ΔGe = 10–18 kg/h (240– 430 kg/day). The analysis of economic feasibility shows that the reduction in fuel consumption per voyage within 28 days will be ΔGe.v = 7–12 tons. Taking into account the annual operation of the vessel, the reduction in fuel consumption per year will be ΔGe.y = 90–150 tons (Figure 27).

6. Conclusions

Circuit solutions to use the thermopressor technologies for charge air cooling of engines were studied and analyzed. We determined that the load reduction on the ship power plant with a corresponding reduction in the fuel consumption of diesel generators is 2–3%. This was achieved by using the thermopressor as a boost stage (second compression ratio in the supercharging system) after the turbocharger, resulting in a reduction of a basic turbocharger compression work by 10 to 12% and increase of engine power output accordingly. Reducing the load on the ship power plant when the utilization turbine generator is used reduces the specific fuel consumption on 4 to 7 g/(kW∙h).
With an initial droplet diameter of more than 20–30 μm and Mach number of Ma = 0.50, the achievement of a positive effect from thermo-gas-dynamic compression is possible only at high initial temperatures above Ttp1 = 450 K (177 °C). In this case, the increase in charge air pressure reaches 12%.
The branches of the predominant application of thermopressor technologies include plants of stationary and marine power energy based on internal combustion engines and gas turbine engines. The use of thermopressor technologies provides a significant reduction in fuel consumption.
Directions for future research in this area are as follows: the research of droplet evaporation thermophysical processes in the working chamber of a thermopressor, and the thermopressor research under the condition of incomplete evaporation of water in the flow path.

Author Contributions

Conceptualization, Z.Y., D.K. and M.R.; methodology, M.R., A.R. and R.R.; software, D.K. and H.K.; validation, Z.Y., D.K., M.R., R.R., A.R. and V.K.; formal analysis, Z.Y., D.K., M.R., R.R., A.R. and V.K.; investigation, Z.Y., D.K., M.R. and R.R.; resources, H.K.; data curation, D.K. and M.R.; writing—original draft preparation, D.K. and H.K.; writing—review and editing, D.K., M.R. and A.R.; supervision, D.K. and M.R.; project administration, D.K. and M.R.; funding acquisition, Z.Y. All authors have read and agreed to the published version of the manuscript.

Funding

This research received no external funding.

Data Availability Statement

Not applicable.

Conflicts of Interest

The authors declare no conflict of interest.

Nomenclature and Units

CACcharge air cooler
GTgas turbine
LSliquid separator
TCturbocharger
TPthermopressor
UTutilization turbine
UTGutilization turbine generator
Symbols and units
δwdroplet diameterμm
assound velocitym/s
cpheat capacity at constant pressurekJ/(kg·K)
ΔDUTGincrease in steam consumption produced in the recovery boilerkg/s; kg/h
damoisture contentg/kg
Dchevaporation chamber diametermm
Eecost of fuel saved$
Fcross-sectional area of the thermopressor flow partm2
Gmass flowkg/s
ΔGefuel economykg/h; tons
Gaair mass flowkg/s
gespecific fuel consumptiong/(kW∙h)
gwrelative water amount%
Gwwater injected mass flowkg/s
I′wwater enthalpykJ/kg
I″wsteam enthalpykJ/kg
kadiabatic coefficient
lccompression work
Ltpflow path lengthmm
ltprelative flow path length
Ltp/Dchrelative length (caliber) of the evaporation chamber
MaMach number
NepowerkW
Nwwater pump powerkW
Nccompressor powerkW
ΔNutgincrease in UTG powerkW
Qthermal loadkW
qheat amount that is removed during the drop evaporationkJ/kg
rvaporization heatkJ/kg
ReReynolds number
Tflow temperature°C; K
T0flow stagnation temperature°C; K
Taair temperature°C; K
Twwater temperature°C; K
Ttp1flow temperature before thermopressor°C; K
Ttp2flow temperature after thermopressor°C; K
Tc2air temperature after compressor°C; K
Tininlet air temperature°C; K
Tgexhaust gases temperature °C; K
T1/T2relative temperature
vflow velocitym/s
vaair velocitym/s
vwwater droplet velocitym/s
ΔI0wdifference in the total enthalpies of liquid and vapor at the temperature and velocity of their movementkJ/kg
ηeefficiency
φarelative humidity%
Pflow pressurePa
P0stagnation flow pressurePa
ΔPflow pressure increasePa; %
ΔPtpflow pressure increase in the thermopressorPa; %
ΔPtp.dryflow pressure increase in the thermopressor (without water)Pa; %
ΔPlossfriction pressure lossPa; %
ΔPfrfriction resistance Pa
ΔPloclocal resistance Pa
ΔPwhydraulic resistance of liquid dropletsPa
∑ξresistance coefficient of the thermopressor flow part surface
εdegree of pressure increase
εcalccalculated degree of pressure increase
εexpexperiment degree of pressure increase
εtpthermopressor degree of pressure increase
εccompressor degree of pressure increase
εc.tptotal degree of pressure increase (with use thermopressor)
μadynamic viscosity coefficient for airPa·s
μwfluid dynamic viscosity coefficientPa·s
ρflow densitykg/m3
σthermopressor criterion characteristic
ξloclocal resistance coefficient
ξloc.cconfuser local resistance coefficient
ξloc.ddiffuser local resistance coefficient
ξwhydraulic resistance coefficient of liquid droplets injected into the flow
Subscripts
0stagnation parameter
1before
2after
aair
ccompressor; confuser
calccalculated
chevaporation (working) chamber
ddiffuser
drywithout water
efuel
e.vper voyage
e.yper year
expexperiment
gexhaust gas
ininlet
rbrecovery boiler
tpthermopressor
wwater

References

  1. Shapiro, A.H.; Wadleigh, K.R. The Aerothermopressor—A Device for Improving the Performance of a Gas-Turbine Power Plant. Proc. Trans. ASME 1956, 78, 617–653. [Google Scholar] [CrossRef]
  2. Konovalov, D.; Kobalava, H.; Radchenko, M.; Scurtu, I.C.; Radchenko, R. Determination of hydraulic resistance of the aerothermopressor for gas turbine cyclic air cooling. In Proceedings of the TE-RE-RD 2020, E3S Web of Conferences, Constanta, Romania, 26–27 June 2020; Volume 180, p. 14. [Google Scholar]
  3. Konovalov, D.; Radchenko, R.; Kobalava, H.; Zubarev, A.; Sviridov, V.; Kornienko, V. Analyzing the efficiency of thermopressor application in the charge air cooling system of combustion engine. In Proceedings of the V International Scientific and Technical Conference Modern Power Systems and Units (MPSU 2021), E3S Web of Conferences, Kraków, Poland, 19–21 May 2021; p. 323. [Google Scholar] [CrossRef]
  4. Fowle, A. An Experimental Investigation of an Aerothermopressor Having a Gas Flow Capacity of 25 Pounds Per Second; Massachusetts Institute of Technology: Cambridge, MA, USA, 1972. [Google Scholar]
  5. Yao, Z.; Qian, Z.Q.; Li, R.; Hu, E. Energy efficiency analysis of marine high-powered medium-speed diesel engine base on energy balance and exergy. Energy 2019, 176, 991–1006. [Google Scholar] [CrossRef]
  6. Radchenko, A.; Trushliakov, E.; Kosowski, K.; Mikielewicz, D.; Radchenko, M. Innovative turbine intake air cooling systems and their rational designing. Energies 2020, 13, 6201. [Google Scholar] [CrossRef]
  7. Bistrovic, N.; Bernecic, D. Energy efficiency in maritime transport. In 18th Annual General Assembly of the International Association of Maritime Universities—Global Perspectives in MET: Towards Sustainable, Green and Integrated Maritime Transport; IAMU: Blaj, Romania, 2017; Volume 32017, pp. 47–50. [Google Scholar]
  8. Horlock, J.H.; Winterbone, D.E. The Thermodynamics and Gas Dynamics of Internal-Combustion Engines; Clarendon Press: Oxford, UK, 1986. [Google Scholar]
  9. Trushliakov, E.; Radchenko, A.; Radchenko, M.; Kantor, S.; Zielikov, O. The Efficiency of Refrigeration Capacity Regulation in the Ambient Air Conditioning Systems. In Advances in Design, Simulation and Manufacturing III; Ivanov, V., Pavlenko, I., Liaposhchenko, O., Machado, J., Edl, M., Eds.; LNME: London, UK, 2000; pp. 343–353. [Google Scholar] [CrossRef]
  10. Kornienko, V.; Radchenko, M.; Radchenko, R.; Konovalov, D.; Andreev, A.; Pyrysunko, M. Improving the efficiency of heat recovery circuits of cogeneration plants with combustion of water-fuel emulsions. Therm. Sci. 2021, 25, 791–800. [Google Scholar] [CrossRef] [Green Version]
  11. Radchenko, M.; Mikielewicz, D.; Tkachenko, V.; Klugmann, M.; Andreev, A. Enhancement of the operation efficiency of the transport air conditioning system. In Advances in Design, Simulation and Manufacturing III; Ivanov, V., Pavlenko, I., Liaposhchenko, O., Machado, J., Edl, M., Eds.; LNME: London, UK, 2020; pp. 332–342. [Google Scholar] [CrossRef]
  12. Zhao, Z.; Wang, Z.; Xie, S.; Zhang, M.; Ouyang, T. A Novel Design of Power-Cooling Cogeneration System Driven by Solid Oxide Fuel Cell Waste Heat in Ocean-Going Vessels. J. Clean. Prod. 2021, 318, 128532. [Google Scholar] [CrossRef]
  13. Wang, K.; Zhao, C.; Cai, Y. Effect of intake air humidification and EGR on combustion and emission characteristics of marine diesel engine at advanced injection timing. J. Therm. Sci. 2021, 30, 1174–1186. [Google Scholar] [CrossRef]
  14. Radchenko, A.; Stachel, A.; Forduy, S.; Portnoi, B.; Rizun, O. Analysis of the Efficiency of Engine Inlet Air Chilling Unit with Cooling Towers. In Advances in Design, Simulation and Manufacturing III; Ivanov, V., Trojanowska, J., Pavlenk, I., Zajac, J., Peraković, D., Eds.; Lecture Notes in Mechanical Engineering: London, UK, 2020; pp. 322–331. [Google Scholar] [CrossRef]
  15. Shukla, P.; Izadi, M.; Marzocca, P.; Aidun, D.K. A heat recovery study: Application of intercooler as a feed-water heater of heat recovery steam generator. In Proceedings of the ASME International Mechanical Engineering Congress and Exposition, Proceedings (IMECE), Columbus, OH, USA, 30 October–3 November 2022; IMECE: Columbus, OH, USA, 2010; Volume 5, pp. 611–617. [Google Scholar] [CrossRef]
  16. Baldi, F.; Ahlgren, F.; Nguyen, T.V.; Thern, M.; Andersson, K. Energy and exergy analysis of a cruise ship. Energies 2018, 11, 2508. [Google Scholar] [CrossRef] [Green Version]
  17. Jamaluddin, K.; Wan Alwi, S.R.; Abdul Manan, Z.; Hamzah, K.; Klemeš, J.J. Development of numerical trigeneration system cascade analysis with transmission and storage energy losses consideration. IOP Conf. Ser. Mater. Sci. Eng. 2020, 884, 012019. [Google Scholar] [CrossRef]
  18. Manzela, A.A.; Hanriot, S.M.; Gomez, L.C.; Sodre, J.R. Using engine exhaust gas as energy source for an absorption refrigeration system. Appl. Energy 2010, 8, 1141–1148. [Google Scholar] [CrossRef]
  19. Sakalis, G.N.; Tzortzis, G.J.; Frangopoulos, C.A. Synthesis, design and operation optimization of a combined cycle integrated energy system including optimization of the seasonal speed of a VLCC. Proc. Inst. Mech. Eng. Part M J. Eng. Marit. Environ. 2021, 235, 41–67. [Google Scholar] [CrossRef]
  20. Olszewski, W.; Dzida, M. Selected combined power systems consisted of self-ignition engine and steam turbine. Pol. Marit. Res. 2018, 25, 198–203. [Google Scholar] [CrossRef] [Green Version]
  21. Danilecki, K.; Eliasz, J. The Potential of Exhaust Waste Heat Use in a Turbocharged Diesel Engine for Charge Air Cooling; SAE Technical Paper: Warrendale, PE, USA, 2020. [Google Scholar]
  22. Sterkhov, K.V.; Khokhlov, D.A.; Zaichenko, M.N.; Pleshanov, K.A. Thermal scheme development for combined cycle power plant with high-pressurized heat recovery steam generator. In Proceedings of the 2nd 2020 International Youth Conference on Radio Electronics, Electrical and Power Engineering, REEPE, Moscow, Russia, 12–14 March 2020. [Google Scholar] [CrossRef]
  23. Stefanopoulou, A.G.; Kolmanovsky, I.; Freudenberg, J.S. Control of variable geometry turbocharged diesel engines for reduced emissions. IEEE Trans. Control. Syst. Technol. 2000, 8, 733–745. [Google Scholar] [CrossRef] [Green Version]
  24. Project Guide Two-Stroke Engines; MC Programme: Copenhagen, Danish. Available online: https://www.man-es.com/marine/products/planning-tools-and-downloads/project-guides/two-stroke (accessed on 24 February 2022).
  25. Guzzella, L.; Amstutz, A. Control of diesel engines. IEEE Control. Syst. 1998, 18, 53–71. [Google Scholar] [CrossRef]
  26. Konovalov, D.; Radchenko, M.; Kobalava, H.; Radchenko, A.; Radchenko, R.; Kornienko, V.; Maksymov, V. Research of characteristics of the flow part of an aerothermopressor for gas turbine intercooling air. Proc. Inst. Mech. Eng. Part A J. Power Energy 2021, 2021, 09576509211057952. [Google Scholar] [CrossRef]
  27. Cipollone, R.; Di Battista, D.; Vittorini, D. Experimental assessment of engine charge air cooling by a refrigeration unit. Energy Procedia 2017, 126, 1067–1074. [Google Scholar] [CrossRef]
  28. Radchenko, M.; Radchenko, R.; Tkachenko, V.; Kantor, S.; Smolyanoy, E. Increasing the Operation Efficiency of Railway Air Conditioning System on the Base of Its Simulation Along the Route Line. In Integrated Computer Technologies in Mechanical Engineering; Nechyporuk, M., Pavlikov, V., Kritskiy, D., Eds.; Springer: Berlin/Heidelberg, Germany, 2020; Volume 1113, pp. 461–467. [Google Scholar] [CrossRef]
  29. Kew, P.A.; Cornwell, K. Development of a highly compact steam generator. Appl. Therm. Eng. 2005, 25, 2604–2614. [Google Scholar] [CrossRef]
  30. Steffens, D. The Diesel Engine and the Environment. In Session Chair—Wayne Cole; Cole Engineering: Houston, TX, USA, 2003; p. 36. [Google Scholar]
  31. Jonsson, M.; Yan, J. Humidified gas turbines—A review of proposed and implemented cycles. Energy 2005, 30, 1013–1078. [Google Scholar] [CrossRef]
  32. Sexton, W.R.; Sexton, M.R. The Effects of Wet Compression on Gas Turbine Engine Operating Performance. In Proceedings of the GT2003 ASME Turbo Expo: Power for Land, Sea and Air 2009, Atlanta, GA, USA, 16–19 June 2003. [Google Scholar] [CrossRef]
  33. Huang, L.; Chen, X.; Li, X.; Zhang, W.; Wang, X.; Huang, M. Development status of marine diesel engine turbocharging technology. Tuijin Jishu/J. Propuls. Technol. 2020, 41, 2438–2449. [Google Scholar] [CrossRef]
  34. Isa, N.M.; Tan, C.W.; Yatim, A.H.M. A comprehensive review of cogeneration system in a microgrid: A perspective from architecture and operating system. Renew. Sustain. Energy Rev. 2018, 81, 2236–2263. [Google Scholar] [CrossRef]
  35. Kim, Y.; Negash, A.; Shamsi, S.S.M.; Shin, D.; Cho, G. Experimental study of a lab-scale organic rankine cycle system for heat and water recovery from flue gas in thermal power plants. Energies 2021, 14, 4328. [Google Scholar] [CrossRef]
  36. Konovalov, D.; Kobalava, H.; Radchenko, M.; Sviridov, V.; Scurtu, I.C. Optimal Sizing of the Evaporation Chamber in the Low-Flow Aerothermopressor for a Combustion Engine. In Advanced Manufacturing Processes II. InterPartner 2020; LNME: London, UK, 2021; pp. 654–663. [Google Scholar] [CrossRef]
  37. Oh, H.W. Advanced Fluid Dynamics; IntechOpen: Rijeka, Croatia, 2012; p. 282. [Google Scholar] [CrossRef]
  38. Radchenko, A.; Trushliakov, E.; Tkachenko, V.; Portnoi, B.; Prjadko, O. Improvement of the Refrigeration Capacity Utilizing for the Ambient Air Conditioning System. In Advanced Manufacturing Processes II. InterPartner 2020; Tonkonogyi, V., Ivanov, V., Trojanowska, J., Oborskyi, G., Eds.; Lecture Notes in Mechanical Engineering: London, UK, 2021; pp. 714–723. [Google Scholar]
  39. Wang, S.K. Handbook of Air Conditioning and Refrigeration, 2nd ed.; McGraw-Hill: New York, NY, USA, 2000; p. 1401. [Google Scholar]
  40. Chandra, K.G.; Kale, D.D. Pressure drop for two-phase air-non-newtonian liquid flow in static mixers. Chem. Eng. J. Biochem. Eng. J. 1995, 59, 277–280. [Google Scholar] [CrossRef]
  41. Radchenko, M.; Radchenko, A.; Radchenko, R.; Kantor, S.; Konovalov, D.; Kornienko, V. Rational loads of turbine inlet air absorption-ejector cooling systems. Proc. Inst. Mech. Eng. Part A J. Power Energy 2021, 2021, 09576509211045455. [Google Scholar] [CrossRef]
  42. CEAS Engine Calculations. MAN Diesel Turbo. Available online: https://www.man-es.com/marine/products/planning-tools-and-downloads/ceas-engine-calculations (accessed on 24 February 2022).
  43. Radchenko, R.; Pyrysunko, M.; Radchenko, A.; Andreev, A.; Kornienko, V. Ship engine intake air cooling by ejector chiller using recirculation gas heat. In AMP InterPartner-2020; Tonkonogyi, V., Ivanov, V., Trojanowska, J., Oborskyi, G., Eds.; LNME: London, UK, 2021; pp. 734–743. [Google Scholar] [CrossRef]
  44. Dixon, S.L.; Hall, C.A. Fluid Mechanics and Thermodynamics of Turbomachinery, 7th ed.; IOP Publishing: Bristol, UK, 2013; p. 537. [Google Scholar] [CrossRef]
  45. Schobeiri, M.T. Turbomachinery Flow Physics and Dynamic Performance; Springer: Berlin/Heidelberg, Germany, 2012; p. 725. [Google Scholar] [CrossRef]
  46. Hirschel, E.H. Basics of Aerothermodynamics, 2nd ed.; Springer: Berlin/Heidelberg, Germany, 2015; p. 446. [Google Scholar] [CrossRef]
  47. Granet, I.; Bluestein, M. Thermodynamics and Heat Power, 8th ed.; CRC Press: Boca Raton, FL, USA, 2014; p. 816. [Google Scholar]
  48. Borghi, R.; Anselmet, F. Turbulent Multiphase Flows with Heat and Mass Transfer; John Wiley & Sons, Inc.: Hoboken, NJ, USA, 2013; p. 445. [Google Scholar] [CrossRef]
  49. Duroudier, J. Fluid Transport: Pipes; Elsevier Inc.: Amsterdam, The Netherlands, 2016; p. 348. [Google Scholar]
  50. Zou, Z.; Wang, S.; Liu, H.; Zhang, W. Axial Turbine Aerodynamics for Aero-Engines: Flow Analysis and Aerodynamics Design; Springer: Berlin/Heidelberg, Germany, 2018; p. 563. [Google Scholar] [CrossRef]
  51. Barabash, P.; Solomakha, A.; Sereda, V. Experimental investigation of heat and mass transfer characteristics in direct contact exchanger. Int. J. Heat Mass Transf. 2020, 162, 120359. [Google Scholar] [CrossRef]
Figure 1. Spatial profiles of the main thermopressor operation parameters: 1—confuser; 2—nozzle; 3—evaporation chamber; 4—diffuser.
Energies 15 02250 g001
Figure 2. Changes in the parameters of the dispersed flow involved in the thermo-gas-dynamic compression process at the local section of the thermopressor flow path.
Energies 15 02250 g002
Figure 3. Experimental setup for studying the thermopressor characteristics: scheme (a); experimental setup photo (b): 1—inlet pipeline; 2—air filter; 3—screw compressor; 4—safety valve; 5—air receiver; 6, 9—control valves; 7—three-section moisture separator; 8—drain oil and moisture; 10—temperature compensator; 11—gas air heater; 12, 13—inlet and outlet of hot gas; 14—water reserve tank; 15—control valve of the injection system; 16—return pipeline; 17—pipeline for supplying water to the injection system; 18—high pressure pump; 19—experimental thermopressor; 20—control valve at the outlet; 21—output pipeline; 22—nozzle; information-measuring system: 23—communication interface; 24—eight-channel temperature meter; 25—computer; 26—eight-channel pressure meter; P—pressure sensors; T—temperature sensors; M—electric motor.
Energies 15 02250 g003
Figure 4. Experimental thermopressor.
Energies 15 02250 g004
Figure 5. Information-measuring system: (1) communication interface, (2) computer with installed software interfaces, (3) eight-channel temperature meter, (4) temperature sensors, (5) pressure sensors, (6) eight-channel pressure meter and (7) thermal imaging camera.
Energies 15 02250 g005
Figure 6. Dependences of the relative pressure increase, ΔPtp = Ptp2/Ptp1, on the droplet diameter, δw, at different air temperatures and Mach numbers at the inlet: (a) Ma = 0.50, (b) Ma = 0.60 and (c) Ma = 0.74.
Energies 15 02250 g006
Figure 7. Dependences of the absolute pressure increase, Ptp = Ptp2 − Ptp1, on the droplet diameter, δw, at different air temperatures and Mach numbers at the inlet: (a) Ma = 0.50, (b) Ma = 0.60 and (c) Ma = 0.74.
Energies 15 02250 g007
Figure 8. Dependences of the relative temperature, Ttp1/Ttp2, at the Ttp1 = 500 K (a) and at the Ttp1 = 550 K (b) and temperature at the end of the thermo-gas-dynamic compression process, Ttp2, (c) on the droplet diameter, δw, at different air temperatures at the inlet.
Energies 15 02250 g008aEnergies 15 02250 g008b
Figure 9. Dependences of the relative amount of water evaporated in the air flow, gw, on the droplet diameter, δw, at different air temperatures at the inlet: (a) at Ttp1 = 500 K and (b) at Ttp1 = 550 K.
Energies 15 02250 g009
Figure 10. Dependences of changes in pressure, Ptp2; air temperature, Ttp2; air velocity, va; and droplet diameter, δw, along the length of the thermopressor flow path, Ltp (ltp).
Energies 15 02250 g010
Figure 11. A scheme of the charge-air-cooling system with a thermopressor for low-speed marine engines: LS—liquid separator; CACLP—charge air cooler; TC—turbocharger; TP—thermopressor; HE1—heat exchangers; CP—circulation pump.
Energies 15 02250 g011
Figure 12. Dependences of the air temperature at the turbocharger discharge without a thermopressor, Tc2; by using a thermopressor, Tc2′; degree of pressure increase, εc at different total pressure increase, εc.tp, on the inlet air temperature, Tin.
Energies 15 02250 g012
Figure 13. Dependences of the turbocharger power, Nc; reducing the turbocharger power, ΔNc (a); decrease in the work on compression, Δlc; the decrease in the power of the TC, ΔNc; the degree of pressure increase, εc, (b) at different total pressure increase, εc.tp, on the inlet air temperature, Tin.
Energies 15 02250 g013
Figure 14. Dependences of the decrease in the thermopressor air temperature, ΔTtp; an increase in the air pressure at the discharge with “ideal” compression, ΔPtp′ (105 Pa), and with real compression, ΔPtp, at different total pressure increase, εc.tp, on the inlet air temperature, Tin.
Energies 15 02250 g014
Figure 15. Dependences of the decrease in the thermopressor air temperature, ΔTtp; an increase in the air pressure at the discharge with “ideal” compression, ΔPtp′ (%), and with real compression, ΔPtp, at different total pressure increase, εc.tp, on the inlet air temperature, Tin.
Energies 15 02250 g015
Figure 16. Dependences of the relative decrease in air temperature in the thermopressor Ttp1/Ttp2; the degree of pressure increase in the thermopressor εtp at different total pressure increase, εc.tp, on the inlet air temperature, Tin.
Energies 15 02250 g016
Figure 17. Comparison of the experimental data on the measurement of the relative pressure degree increase in the thermopressor εexp with the calculated εcalc in accordance with the mathematical model at different flow rates of water, Gw.
Energies 15 02250 g017
Figure 18. Dependences of the exhaust gases’ temperature before UT Tg1, exhaust gases’ temperature (for a circuit without a thermopressor) Tg2, exhaust gases’ temperature (for a circuit with a thermopressor) T′g2 at different total pressure increase, εc.tp, on the inlet air temperature, Tin.
Energies 15 02250 g018
Figure 19. Dependences of the air moisture content at the thermopressor outlet, dtp2; air temperature at the thermopressor outlet, Ttp2; decrease in the additional CAC air temperature, ΔTcac; degree of pressure increase, εc′, at different total pressure increase, εc.tp, on the inlet air temperature, Tin.
Energies 15 02250 g019
Figure 20. Dependences of the heat load on heat exchanger, Qcac; thermopressor, Qtp; additional heat exchanger, Qcac2; total heat load, Qtot2, at different total pressure increase, εc.tp, on the inlet air temperature, Tin.
Energies 15 02250 g020
Figure 21. Dependences of the water pump power, Nw; the water mass flow for injection in the thermopressor, Gw; an increase in the air moisture content, Δdtp, at different total pressure increase, εc.tp, on the inlet air temperature, Tin.
Energies 15 02250 g021
Figure 22. Dependences of the recovery boiler heat load, ΔQrb; an increase in the exhaust gases temperature at the recovery boiler inlet, ΔTrb, at different total pressure increase, εc.tp, on the inlet air temperature, tin.
Energies 15 02250 g022
Figure 23. A scheme of a thermopressor charge-air-cooling system with integrated waste gas heat recovery in the heat-recovery boiler and UTG: LS—liquid separator; CACLP—charge air cooler; TC—turbocharger; TP—thermopressor; HE1, HE2—heat exchangers; CP—circulation pump.
Energies 15 02250 g023
Figure 24. Dependences of the increase in UTG power ΔNutg, increase in steam consumption produced in the recovery boiler of two pressures ΔDutg at different total pressure increase εc.tp on the inlet air temperature Tin.
Energies 15 02250 g024
Figure 25. Dependences of the increase in UTG power ΔNutg; reduction in fuel consumption, ΔGe, reduces the specific fuel consumption, Δge, at different total pressure increase, εc.tp, on the inlet air temperature, Tin.
Energies 15 02250 g025
Figure 26. Dependences of the fuel economy for the voyage ΔGe.v; the cost of fuel saved for the voyage Ee.v; and reduction of the specific fuel consumption by diesel generators, Δge, at different total pressure increase, εc.tp, on the inlet air temperature, Tin.
Energies 15 02250 g026
Figure 27. Dependences of the fuel economy for the year ΔGe.y and the cost of fuel saved for the year Ee.y at different total pressure increase, εc.tp, on the inlet air temperature, Tin.
Energies 15 02250 g027
Table 1. Geometrical characteristics of the experimental thermopressor.
ParameterValue
Receiving chamberValue
ConfuserDiameter D1 = 65 mm; length L1 = 200 mm
Evaporation chamberInlet diameter Dc1 = 65 mm; outlet diameter Dc2 = 25 mm;
length Lc = 34 mm; convergent angle α = 30°
DiffuserDiameter Dch = 25 mm; length Lch = 125; 175 mm
(relative length lch = 5; 7)
NozzleInlet diameter Dd1 = 25 mm; outlet diameter Dd2 = 65 mm;
length Lch = 192 mm; divergent angle β = 6°
Publisher’s Note: MDPI stays neutral with regard to jurisdictional claims in published maps and institutional affiliations.

