Abstract
The effects of two different metal oxide catalysts, SnO and Li2O, on the dehydrogenation temperature of Carbazole and N-Ethylcarbazole (NE), respectively, were investigated by the Thermogravimetric analyzer and Differential Scanning Calorimetry. Thermogravimetric experiments were performed with 10wt% SnO and Li2O added to Carbazole and N-Ethylcarbazole, respectively, and compared to pure Carbazole and N-Ethylcarbazole. The results showed that the dehydrogenation temperature of N-Ethylcarbazole was lower than that of Carbazole, and the dehydrogenation temperature of N-Ethylcarbazole +SnO was the lowest, and SnO is an ideal dehydrogenation catalyst for N-Ethylcarbazole. Experiments using Differential Scanning Calorimetry and a Thermogravimetric analyzer showed that with the addition of catalyst, the activation energy of the mixture was more significant and stable, and the thermal hazard was reduced, whereas the relative dehydrogenation temperature was increased. This study provides important information for improving the design of dehydrogenation catalysts for organic liquid hydrogen storage processes.
1. Introduction
As clean energy with excellent development potential in the 21st century, hydrogen has broad application prospects in energy, transportation, industry, and construction. Moreover, because its product is only water and achieves zero CO2 emissions, hydrogen research has become a key focus across the world [1].
Like the traditional energy sources of natural gas, liquefied petroleum gas, and gasoline, hydrogen has high energy and high deflagration hazard [2].
In the past, faulty hydrogen storage practices have resulted in far too many hydrogen explosion mishaps worldwide. Two people were killed and six others were injured when a hydrogen fuel storage tank exploded in Gangneung City, Gangwondo, South Korea on 23 May 2019. In a chemical facility in Santa Clara, California, a hydrogen storage tank spilt and exploded in June 2019, disrupting the hydrogen supply for local hydrogen fuel cell vehicles. The hydrogen transportation method was involved in the California explosion, which occurred when a hydrogen delivery trailer released high-pressure gaseous hydrogen, causing spontaneous combustion during the leak and discharge, and then a chain explosion. On 4 August 2021, a hydrogen tank in a Shenyang company compound exploded.
Various hydrogen storage technologies have been tried so far, for instance, pressurized gaseous hydrogen storage [2,3,4], cryogenic liquefaction hydrogen storage [4,5], carbonaceous materials hydrogen storage [4,6,7,8], metal alloy hydrogen storage [9], complexation hydride hydrogen storage [10,11], glass microspheres hydrogen storage [12], liquid organic hydrogen storage [13,14,15], and so on. Although most of them are well-developed, their efficiency is still low. Organic liquid hydrogen storage, for example, is safe and convenient to carry, has considerable hydrogen storage capacity, is recyclable, and uses little energy [16]. However, technological barriers must be overcome, such as sophisticated dehydrogenation technology, high dehydrogenation energy consumption, and off-line catalyst technology. Since the 1980s, reversible hydrogen storage in liquid organic hydrogen carriers (LOHC) has been promoted as a key technology for the energy transition from fossil fuels to renewable energy sources [17,18,19]. To store hydrogen safely and efficiently for a long time, the carrier compound must have considerable activation energy. The thermal stability of the compound can be improved by adding a catalyst. A safe and suitable compound can improve the efficiency of hydrogen storage.
Wang [20] added three iridium complexes, , , and , to N-Ethylcarbazole to improve the dehydrogenation reaction of N-Ethylcarbazole. Studies have shown that is the most active catalyst, which not only maintains its activity at 150 °C, but also improves the thermodynamic constraints.
Sotoodeh [21] found that catalysts with different mass ratios of Pd/SiO2 have good catalytic dehydrogenation activity for perhydro N-Ethylcarbazole (12H-NECZ) at 150–170 °C, and 4.0 wt% Pd/SiO2 can achieve 100% conversion at 170 °C, whereas H2 recovery reaches 69%.
Yang et al. [22] compared the catalytic dehydrogenation activities of four commercially supported noble metal catalysts supported by Al2O3 for perhydro N-Ethylcarbazole (H12-NEC). The order of performance size was: Pd > Pt > Ru > Rh. Among them, under the experimental conditions, only Pd and Pt could satisfy the conditions of complete dehydrogenation and 100% selectivity to perhydro N-Ethylcarbazole.
Two organic liquid hydrogen storage materials, N-Ethylcarbazole (NE) and Carbazole, were utilized as carriers in this experiment, along with two catalysts, Tin(II) Oxide (SnO) and Lithium oxide (Li2O). To determine kinetic parameters, kinetic analysis used thermogravimetric (TG) and differential thermogravimetry (DTG) data. This research can be utilized to assess the thermal hazard mechanism of organic liquids, including catalysts, and to reduce industrial accidents when hydrogen is stored and transported, using NE and Carbazole as a reference.
2. Experimental Methods
2.1. Samples
The primary materials involved in the experiment included lithium oxide (CAS number: 12057-24-8), N-Ethylcarbazole (CAS number: 86-28-2), Carbazole (CAS number: 86-74-8), and tin(II) oxide (CAS number: 21651-19-4) and were purchased from Adamas Reagent, Ltd.
Before the experiment, the experimental items used were stored in a dry vacuum to avoid interaction with external conditions.
The structure of liquid organic hydrogen carriers is presented in Figure 1 [23].
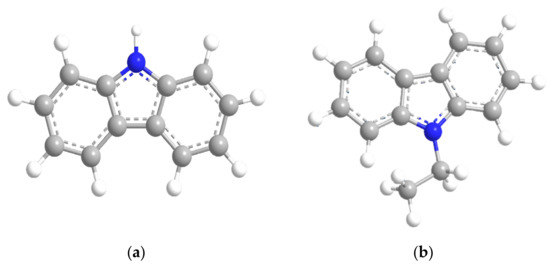
Figure 1.
The structure of liquid organic hydrogen carriers (LOHC): (a) Carbazole; (b) N-Ethylcarbazole.
2.2. Sample Preparation
This experiment used Thermogravimetric Analysis (TGA2, Mettler-Toledo Co., Zurich, Switzerland) [24,25,26,27] and Differential Scanning Calorimetry (HP DSC3, Mettler-Toledo Co., Zurich, Switzerland) equipment [28,29] for testing. TG had to maintain control of the heating rate (β) as well as assess the weight loss. The sample sizes were 10 mg and 0.1 mg, with a mass ratio of 1:9 for lithium oxide and tin oxide to Carbazole and NE. The temperature range for heating was 30–300 °C. In this experiment, the β was set at 1, 2, 4, 6, and 10 °C/min to ensure the highest and minimum β ratios were higher than 5. The same β of 10 was used in the Differential Scanning Calorimetry (DSC) experiment, and the sample quality was the same as in the TG experiment.
2.3. Catalyst Dehydrogenation Principle
The dehydrogenation reaction in this study is the dehydrogenation reaction of NE and Carbazole at high temperatures and in the presence of catalysts (SnO and Li2O). Using a suitable catalyst to catalyze the dehydrogenation of the compound, the purpose of dehydrogenation can be achieved, and the carbon–hydrogen bond that can be broken and the carbon–carbon bond that can be damaged must be maintained. The schematic diagram is shown in Figure 2 [23].
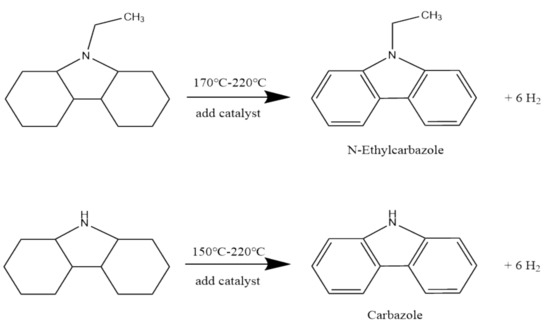
Figure 2.
Schematic diagram of dehydrogenation of NE and Carbazole at elevated temperature and in the presence of catalysts (SnO and Li2O).
2.4. Kinetic Model
2.4.1. FWO Method
The Flynn–Wall–Ozawa method is currently a widely used integration method of thermodynamic analysis [30]. Different values of β are found with the same α, where G(α) is a fixed value, lgβ and 1/T are linear relations, and Ea is calculated from the slope. The kinetic equation is presented as the following Equation (1) [24]:
2.4.2. Vyazovkin Method
The Vyazovkin method is a model-free kinetic integration method, which can find the equivalent conversion method of the corresponding temperature function under the same conversion rate α, where tα,t is the time required to reach various conversion rates. Its formula is shown in the following equation [28,31]:
2.4.3. Kissinger Method
The Kissinger equation is based on the Arrhenius equation, which leads to the following equations:
when T = Tp, d2α/dt2 = 0. Substitute into Equation (3) to obtain [28]:
where f′(α) = df(α)/dα, and m is the value at the maximum transition. Kissinger assumed that f′(αm) is independent of β and that f′(αm) is approximately equal to 1.0. By a simple logarithmic transformation, Equation (4) becomes [28]:
2.4.4. KAS Method
The Kissinger–Akahira–Sunose (KAS) kinetic model is considered an evaluation of the Arrhenius equation using a differential method, and the Arrhenius model equation is [32]:
k has a linear relationship with the reaction temperature [28]. The reaction rate can be converted to the change in the conversion rate per unit time, as shown in Equations (7) and (8) [28].
Combining Equations (6)–(8), they can be rewritten as [33]:
Then, taking the derivative of Equation (9), Equation (10) can be obtained:
Since A, f(α), and Ea are all affected by temperature T, Ea and A have nothing to do with α. Therefore, Equation (10) can be extended to Equations (11) and (12) [33]:
2.4.5. Starink Method
To obtain better thermodynamic parameters, the KAS equation is slightly adjusted by the Starink model, and Equation (13) can be obtained after adjustment [28]:
where i and C are approximated values using a specific type of integrated temperature. Cs is usually constant. According to the KAS kinetic model, when Ea is i = 1.8 and C = 1.0037, the calculation of Ea is more accurate, and Equation (14) is as follows [28]:
3. Results
3.1. DSC Analysis
Figure 3 shows the DSC results of the heat flow as a function of temperature for pure Carbazole and Carbazole, plus two catalysts with 10% mass SnO and Li2O, respectively. Carbazole and NE are both crystalline at standard temperature and pressure, so when Carbazole and NE reach the melting point, the melting endotherm produces the first endothermic peak, and the second endothermic peak is the temperature at which Carbazole and NE dehydrogenate. Pure Carbazole was used as the reference group: the initial temperature T0 was 310.94 °C, the peak temperature was 334.34 °C, the maximum heat release rate was 2.072 mW/mg, and the total released heat was 243.75 J/g. The T0 of Carbazole plus SnO and Li2O were 348.67 and 347.48 °C, respectively; the peak temperatures were 354.54 and 354.76 °C; the maximum heat release rates were 4.22 and 4.71 mW/mg, respectively, at 253.10 and 262.38 J/g. Pure NE was used as the reference group: the initial temperature T0 was 342.01 °C, the peak temperature was 344.43 °C, the maximum heat release rate was 7.45 mW/mg, and the total released heat was 277.69 J/g. The T0 of NE plus SnO and Li2O were 339.98 and 331.98 °C, respectively, the peak temperatures Tp were 341.89 and 342.41 °C, and the maximum heat release rates were 5.98 and 2.64 mW/mg, respectively. The total released heat was 189.46 and 191.92 J/g, respectively.
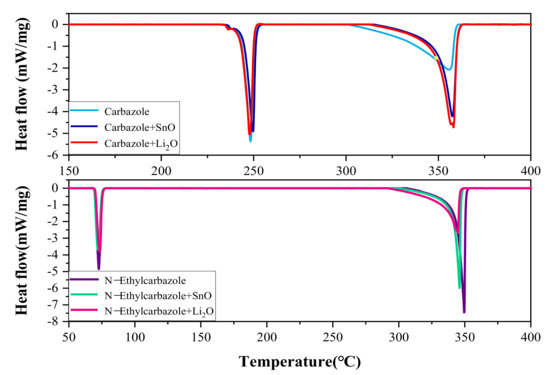
Figure 3.
Heat fluxes versus temperatrue of Carbazole, NE, and mixtures.
The DSC results show that mixing NE with two catalysts of SnO and Li2O can advance the onset temperature of dehydrogenation, reduce the maximum heat release rate and total heat release rate of the mixture, and reduce the maximum heat release rate and the thermal hazard of NE.
3.2. Thermogravimetric Analysis
Figure 4 displays the TG and DTG curves of mass loss and mass loss derivative versus temperature for Carbazole and NE with added Li2O and SnO, separately.
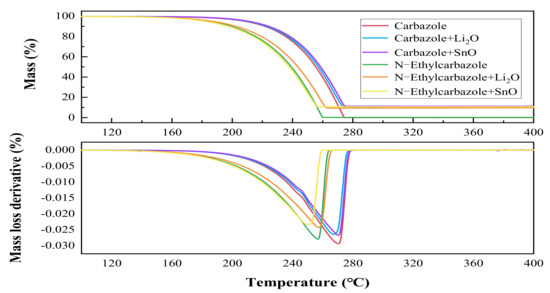
Figure 4.
Mass loss and mass loss derivative versus temperature of TG-DTG curves for Carbazole and N-Ethylcarbazole and with additives.
The results showed that the maximum temperature of mass loss of pure Carbazole and pure NE were 273.62 and 258.33 °C, and the mass loss rates were −0.02933 and −0.02794 per/min, respectively. The maximum temperature of mass loss of Carbazole + Li2O and Carbazole + SnO were 269.91 and 272.30 °C. This shows that when the release of hydrogen reaches the maximum, the mass loss rates were −0.02642 per/min and −0.02671 per/min, respectively. The maximum temperature of mass loss of NE + Li2O and NE + SnO were 262.5 and 250.7 °C, and the mass loss rates were −0.02423 and −0.02328 per/min, respectively. The maximum temperature and mass loss rate of pure Carbazole and pure NE were lower than of Carbazole + Li2O, Carbazole + SnO, NE + Li2O, and NE + SnO. The results indicated that Li2O and SnO significantly increased the dehydrogenation yields of Carbazole and NE. They showed that the onset temperature of dehydrogenation of NE (154.16 °C) was lower than that of Carbazole (175.33 °C), and the onset temperature of dehydrogenation of the mixture of NE and SnO (141.50 °C) was lower than that of pure NE and hydrogen emissions. As the temperature increased, the hydrogen release rate was faster, so that SnO had a lower effect on reducing NE. Therefore, the onset temperature of the dehydrogenation of the Carbazole was promoted. After adding a catalyst, the dehydrogenation yield increased, but the dehydrogenation temperature increased relatively, and different catalysts had different Ea.
Figure 5 illustrates the thermal weight loss rate of NE mixed with SnO: the higher the β, the longer the dehydrogenation initiation time is delayed. For example, when the β is 10 °C/min, the starting temperature of dehydrogenation is about 190 °C, and the end temperature is about 260 °C. When the β is 1 °C/min, the dehydrogenation starts at 130 °C and ends at 200 °C, and the dehydrogenation reaction achieves effective dehydrogenation at low temperature. At the same time, the DTG diagram shows that the dehydrogenation rate gradually slows down with the increase in the β.
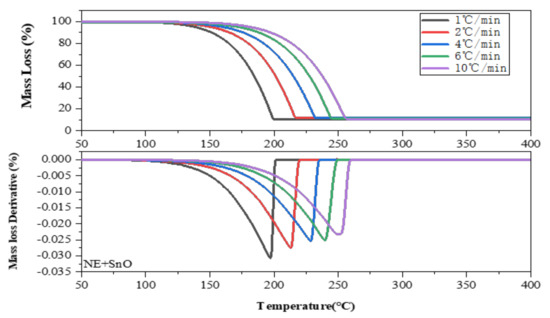
Figure 5.
Curve of thermogravimetric loss of NE + SnO at β of 1.0, 2.0, 4.0, 6.0, and 10.0 °C/min in TG experiments.
3.3. Kinetic Results
Different catalysts used in various organic liquid hydrogen storage materials will increase the dehydrogenation yield, but relatively speaking, the dehydrogenation temperature will increase, and multiple catalysts have different activation energies.
Since NE has a lower dehydrogenation temperature and a lower heat release rate than Carbazole, and NE plus SnO has the lowest dehydrogenation temperature and a lower heat release rate, a detailed thermodynamic analysis was carried out for its activation thermokinetic parameters.
We determined the thermokinetic parameters based on the TG experiment. Figure 6a illustrates the linear fitting results of versus 1/T for NE + SnO: the slope of the fitting line is −9550.87, the coefficient of determination R2 is 0.99751, and Ea is 79.40 kJ, according to the equation/mol.
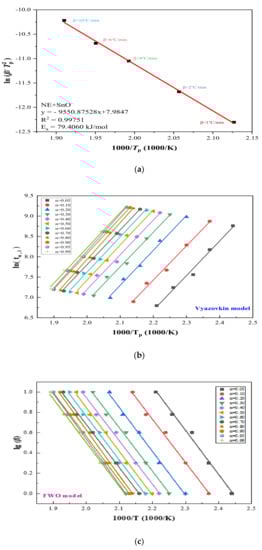
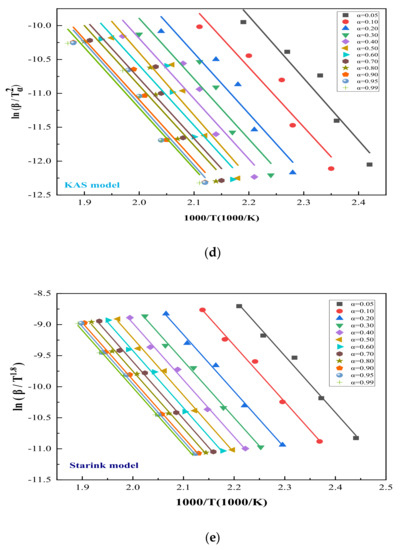
Figure 6.
Diagram of NE + SnO in TG experiments through four kinetic simulation methods: (a) Ea determination from Kissinger method of various β; (b) differential isoconversional analysis of using Vyazovkin method at β of 1, 2, 4, 6, and 10 °C/min; (c) differential isoconversional analysis of using FWO method at β of 1, 2, 4, 6, and 10 °C/min; (d) differential isoconversional analysis of using KAS method with β of 1, 2, 4, 6 and 10 °C/min; (e) differential isoconversional analysis of using Starink method at β of 1, 2, 4, 6, and 10 °C/min.
To confirm the reliability of our data, we continued to analyze the experimental data using a variety of isotransformation methods, and multiple comparisons yielded reliable data.
We also used FWO, Vyazovkin, Starink, and KAS, four methods to verify the reliability of our data, and 12 different α of five β were selected for the differential. Figure 6b shows the fitting results using the Vyazovkin method under different α, and the consequences of FWO, KAS, and Starink are shown in Figure 6c–e, respectively.
Figure 6b–e illustrate the linear relationship between 12 conversion rates α using five heating rates β in four different models. The trends are similar: Ea and R2 gradually increase with the increase in α, and the linear functions obtained by the KAS method and the Starink method are almost the same. To further prove the accuracy of the data, Ea and R2 of the four methods are set out in Table 1 for further details. Table 1 lists the thermodynamic models of FWO, KAS, Starink and Vyazovkin, and the Ea and R2 of NE + SnO were summarized and averaged. The results were only slightly different, with R2 reaching 0.995, close to 1, proving that our experimental data were reliable: the mean Ea of NE + SnO is 74.1291 kJ/mol.

Table 1.
Calculated Ea and R2 values through FWO, KAS, Starink, and Vyazovkin methods.
Table 2 shows that the Ea of Carbazole after adding the catalyst is always higher than that of the NE mixed catalyst, and the Li2O catalyst makes the Ea of Carbazole the highest, up to 108.98 kJ/mol.
Table 2.
Calculated and R2 values from NE and Carbazole mixed with catalysts.
The Li2O catalyst enhances the activation energy of Carbazole, and the SnO catalyst is more effective in enhancing the activation energy of NE.
4. Discussion
In the past, experiments have proved the feasibility of NE and Carbazole as organic liquid hydrogen storage materials. For example, the dehydrogenation temperature is low, and their safety is relatively low. The addition of metal oxide dehydrogenation catalysts to organic liquid hydrogen storage materials has been under investigation to reduce their dehydrogenation temperature and improve their thermal stability, but few thermodynamic analyses and comparative experiments have been conducted.
We performed DSC and TG calorimetry experiments and analyzed and compared the results of various linear regression methods. The DSC results show that the metal oxide has a significant delaying effect on the occurrence time of the initial thermal reaction and reduces its endothermic heat. The addition of SnO to reduce the endothermic heat of NE echoes the increase in Ea obtained from the TG experimental results. Furthermore, the addition of NE to SnO would be safer than Li2O.
We added the two metal oxides Li2O and SnO to Carbazole and NE and used five thermodynamic methods. After simulation with different β and α, we found that adding additives can improve the safety of hydrogen storage materials and increase the dehydrogenation temperature. This study provides a scientific basis for adding metal oxidants to NE and Carbazole. More research is still required to find suitable additives for organic liquid hydrogen storage materials.
5. Conclusions
The addition of metal oxide dehydrogenation catalysts to organic liquid hydrogen storage materials has been investigated to reduce their dehydrogenation temperature and improve thermal stability. In this study, the thermal analysis and kinetic analysis of pure Carbazole and pure NE and the mixture of two catalysts, SnO and Li2O, respectively, revealed that the addition of catalysts could improve the performance of Carbazole and NE. It provides a reference for studying the thermal stability of organic liquid hydrogen storage materials after adding catalysts. From the paper, the following conclusions can be drawn:
(1) Different metal oxidation catalysts affect the dehydrogenation temperature of different organic liquid hydrogen storage materials. For example, of the two organic liquid hydrogen storage materials, the dehydrogenation temperature of Carbazole is higher than that of NE. On the other hand, the dehydrogenation temperature of NE + SnO is 258.33 °C, lower than that of pure NE, at 250.7 °C. The addition of SnO provides high-efficiency low-temperature dehydrogenation, indicating that SnO is an ideal dehydrogenation catalyst for NE.
(2) Through thermokinetic analysis, Ea generally increases after adding a catalyst, proving that NE and Carbazole will be more stable after adding SnO and Li2O. SnO has a good effect on the activation energy of NE, with Ea at 76.29 kJ/mol. Li2O has a good effect on the activation energy of Carbazole, with Ea at 108.98 kJ/mol. The calculated activation energy of Carbozole is generally higher than that of NE, which corresponds to the higher dehydrogenation temperature of Carbazole than that of NE in the TGA experiment.
(3) This study provides feasible experimental data for further research on adding metal oxides to organic liquid hydrogen storage materials. Based on the two metal oxide catalysts discussed in this study, the feasibility of adding SnO to NE has been demonstrated. This research is attractive and promising from the perspective of experimental data and application. The selection of suitable catalysts for organic hydrogen storage materials will remain the focus of future research.
Author Contributions
Writing—review and editing, L.-J.X. and A.-C.H.; Formal analysis, A.-C.H.; data curation: Y.-C.L.; Conceptualization, Y.T.; Methodology, H.-L.Z.; Supervision, Z.-X.X.; funding acquisition, J.-C.J. All authors have read and agreed to the published version of the manuscript.
Funding
This research was funded by National Natural Science Foundation of China (No. 21927815) and the National Key Research Development Program of China (Nos. 2019YFC0810701 and 2021YFC3001203).
Institutional Review Board Statement
Not applicable.
Informed Consent Statement
Not applicable.
Conflicts of Interest
The authors declare no conflict of interest.
Nomenclature
| Roman Symbols | ||
| Symbol | Unit | Description |
| ΔHd | J/g | Heat of decomposition |
| A | 1/s | Frequency factor |
| C | dimensionless | Constant |
| Cs | dimensionless | Constant for Starink method |
| kJ/mol | Apparent activation energy | |
| f(α) | dimensionless | Differential form of reaction mechanism function |
| g(α) | dimensionless | Integral kinetic function |
| n | dimensionless | Partial order of reaction |
| k | Rate constant at infinite temperature | |
| K | 1/min | Reaction rate constant |
| t | min | Time |
| T | K | Absolute temperature |
| T0 | °C | Apparent onset temperature |
| °C | Peak temperature | |
| R | 8.314J/(mol×K) | Universal gas constant |
| R2 | dimensionless | Coefficient of determination |
| Greek Letters | ||
| α | Dimensionless | Conversion degree |
| β | °C/min | Heating rate |
| γ | dα/dt | Degree of conversion rate |
| kg/m3 | Density | |
| Sub- and Superscript | ||
| Symbol | Description | |
| LOHC | liquid organic hydrogen carriers | |
| NE | N-Ethylcarbazole | |
| DSC | Differential Scanning Calorimetry | |
| TG | Thermogravimetric | |
| DTG | Differential thermogravimetry | |
References
- Schlapbach, L. Hydrogen-storage materials for mobile applications. Nature 2001, 414, 353–358. [Google Scholar] [CrossRef] [PubMed]
- Züttel, A. Materials for hydrogen storage. Mater. Today 2003, 23, 24–33. [Google Scholar] [CrossRef]
- Zheng, J.; Liu, X.; Xu, P.; Liu, P.; Zhao, Y.; Yang, J. Development of high pressure gaseous hydrogen storage technologies. Int. J. Hydrog. Energy 2012, 37, 1048–1057. [Google Scholar] [CrossRef]
- Jiang, Z.; Pan, Q.; Xu, J.; Fang, T. Current situation and prospect of hydrogen storage technology with new organic liquid. Int. J. Hydrog. Energy 2014, 39, 17442–17451. [Google Scholar] [CrossRef]
- Peschka, W.; Carpetis, C. Cryogenic hydrogen storage and refueling for automobiles. Int. J. Hydrog. Energy 1980, 619–626. [Google Scholar] [CrossRef]
- Dillon, A.C.; Jones, K.M.; Bekkedahl, T.A.; Kiang, C.H.; Bethune, D.S.; Heben, M.J. Storage of hydrogen in single-walled carbon nanotubes. Nature 1997, 386, 377–380. [Google Scholar] [CrossRef]
- Cheng, H.M.; Yang, Q.H.; Liu, C. Hydrogen storage in carbon nanotubes. Carbon 2001, 39, 1447–1455. [Google Scholar] [CrossRef]
- Mohan, M.; Sharma, V.K.; Kumar, E.A.; Gayathri, V. Hydrogen storage in carbon materials—A review. Energy Storage 2019, 1, e35. [Google Scholar] [CrossRef]
- Cummings, D.L.; Powers, G.J. The Storage of Hydrogen as Metal Hydrides. Ind. Eng. Chem. Process Des. Dev. 1974, 13, 182–192. [Google Scholar] [CrossRef]
- Schuth, F.; Bogdanovic, B.; Felderhoff, M. Light metal hydrides and complex hydrides for hydrogen storage. Chem. Commun. 2004, 2004, 2249–2258. [Google Scholar] [CrossRef]
- Rönnebro, E. Development of group II borohydrides as hydrogen storage materials. Curr. Opin. Solid State Mater. Sci. 2011, 15, 44–51. [Google Scholar] [CrossRef]
- Schmitt, M.L.; Shelby, J.E.; Hall, M.M. Preparation of hollow glass microspheres from sol–gel derived glass for application in hydrogen gas storage. J. Non Cryst. Solids 2006, 352, 626–631. [Google Scholar] [CrossRef]
- Boudjahem, A.G.; Bouderbala, W.; Bettahar, M. Benzene hydrogenation over Ni–Cu/SiO2 catalysts prepared by aqueous hydrazine reduction. Fuel Process. Technol. 2011, 92, 500–506. [Google Scholar] [CrossRef]
- Wang, W.T.; Liu, H.Z.; Wu, T.B.; Zhang, P.; Ding, G.D.; Liang, S.G.; Jiang, T.; Han, B.X. Ru catalyst supported on bentonite for partial hydrogenation of benzene to cyclohexene. J. Mol. Catal. A Chem. 2012, 355, 174–179. [Google Scholar] [CrossRef]
- Zieliński, M.; Wojciechowska, M. Iridium supported on MgF2–MgO as catalyst for toluene hydrogenation. Catal. Commun. 2012, 18, 1–4. [Google Scholar] [CrossRef]
- Deyko, G.S.; Glukhov, L.M.; Kustov, L.M. Hydrogen storage in organosilicon ionic liquids. Int. J. Hydrog. Energy 2020, 45, 33807–33817. [Google Scholar] [CrossRef]
- Newson, E.; Haueter, T.; VonRoth, P.H.F.; Scherer, G.W.H.; Schucan, T.H. Seasonal storage of hydrogen in stationary systems with liquid organic hydrieds. Int. J. Hydrog. Energy 1998, 23, 905–909. [Google Scholar] [CrossRef]
- Teichmann, D.; Arlt, W.; Wasserscheid, P.; Freymann, R. A future energy supply based on Liquid Organic Hydrogen Carriers (LOHC). Energy Environ. Sci. 2011, 4, 2767–2773. [Google Scholar] [CrossRef]
- Niermann, M.; Drünert, S.; Kaltschmitt, M.; Bonhoff, K. Liquid organic hydrogen carriers (LOHCs) – techno-economic analysis of LOHCs in a defined process chain. Energy Environ. Sci. 2019, 12, 290–307. [Google Scholar] [CrossRef]
- Wang, Z.; Tonks, I.; Belli, J.; Jensen, C.M. Dehydrogenation of N-ethyl perhydrocarbazole catalyzed by PCP pincer iridium complexes: Evaluation of a homogenous hydrogen storage system. J. Organomet. Chem. 2009, 694, 2854–2857. [Google Scholar] [CrossRef]
- Sotoodeh, F.; Zhao, L.; Smith, K.J. Kinetics of H2 recovery from dodecahydro-N-ethylcarbazole over a supported Pd catalyst. Appl. Catal. A-Gen. 2009, 362, 155–162. [Google Scholar] [CrossRef]
- Yang, M.; Dong, Y.; Fei, S.; Ke, H.; Cheng, H. A comparative study of catalytic dehydrogenation of perhydro-N-ethylcarbazole over noble metal catalysts. Int. J. Hydrog. Energy 2014, 39, 18976–18983. [Google Scholar] [CrossRef]
- Heublein, N.; Stelzner, M.; Sattelmayer, T. Hydrogen storage using liquid organic carriers: Equilibrium simulation and dehydrogenation reactor design. Int. J. Hydrog. Energy 2020, 45, 24902–24916. [Google Scholar] [CrossRef]
- Zhou, H.L.; Jiang, J.C.; Huang, A.C.; Tang, Y.; Zhang, Y.; Huang, C.F.; Liu, S.H.; Shu, C.M. Calorimetric evaluation of thermal stability and runaway hazard based on thermokinetic parameters of O,O–dimethyl phosphoramidothioate. J. Loss Prev. Process Ind. 2022, 75, 104697. [Google Scholar] [CrossRef]
- Tsai, Y.T.; Yang, Y.; Huang, H.C.; Shu, C.M. Inhibitory effects of three chemical dust suppressants on nitrocellulose dust cloud explosion. AIChE J. 2020, 66, e16888. [Google Scholar] [CrossRef]
- Gao, X.; Jiang, L.; Xu, Q. Experimental and theoretical study on thermal kinetics and reactive mechanism of nitrocellulose pyrolysis by traditional multi kinetics and modeling reconstruction. J. Hazard. Mater. 2020, 386. [Google Scholar] [CrossRef] [PubMed]
- Guo, Y.; Zhao, N.N.; Zhang, T.; Gong, H.; Ma, H.; An, T.; Zhao, F.; Hu, R. Compatibility and thermal decomposition mechanism of nitrocellulose/Cr2O3 nanoparticles studied using DSC and TG-FTIR. RSC Adv. 2019, 9, 3927–3937. [Google Scholar] [CrossRef] [Green Version]
- Liu, Y.C.; Huang, A.C.; Tang, Y.; Ma, X.M.; Yang, Y.P.; Wu, Z.H.; Shu, C.M.; Xing, Z.X.; Jiang, J.C. Thermokinetic model establishment and numerical simulation of 2,4,6-trinitrophenol based on eco-friendly synthesis method. J. Energetic Mater. 2021, 1–20. [Google Scholar] [CrossRef]
- Liu, S.H.; Hou, H.Y.; Chen, J.W.; Weng, S.Y.; Lin, Y.C.; Shu, C.M. Effects of thermal runaway hazard for three organic peroxides conducted by acids and alkalines with DSC, VSP2, and TAM III. Thermochim. Acta 2013, 566, 226–232. [Google Scholar] [CrossRef]
- Huang, A.C.; Chuang, Y.K.; Huang, C.F.; Shu, C.M. Thermokinetic analysis of the stability of malic and salicylic acids in cosmeceutical formulations containing metal oxides. J. Therm. Anal. Calorim. 2017, 132, 165–172. [Google Scholar] [CrossRef]
- Vyazovkin, S.; Sbirrazzuoli, N. Isoconversional Kinetic Analysis of Thermally Stimulated Processes in Polymers. Macromol. Rapid Commun. 2006, 27, 1515–1532. [Google Scholar] [CrossRef]
- Wang, Q.; Liu, S.H.; Huang, A.C.; Huang, C.F.; Chuang, Y.K.; Shu, C.M. Effects of mixing malic acid and salicylic acid with metal oxides in medium- to low-temperature isothermal conditions, as determined using the thermal activity monitor IV. J. Therm. Anal. Calorim. 2018, 133, 779–784. [Google Scholar] [CrossRef]
- Yang, Y.P.; Huang, A.C.; Tang, Y.; Liu, Y.C.; Wu, Z.H.; Zhou, H.L.; Li, Z.P.; Shu, C.M.; Jiang, J.C.; Xing, Z.X. Thermal Stability Analysis of Lithium-Ion Battery Electrolytes Based on Lithium Bis(trifluoromethanesulfonyl)imide-Lithium Difluoro(oxalato)Borate Dual-Salt. Polymers 2021, 13, 707. [Google Scholar] [CrossRef]
Publisher’s Note: MDPI stays neutral with regard to jurisdictional claims in published maps and institutional affiliations. |
© 2022 by the authors. Licensee MDPI, Basel, Switzerland. This article is an open access article distributed under the terms and conditions of the Creative Commons Attribution (CC BY) license (https://creativecommons.org/licenses/by/4.0/).