Article

Effects of Reversed Shock Waves on Operation Mode in H2/O2 Rotating Detonation Chambers

Center for Combustion and Propulsion, CAPT and SKLTCS, Department of Mechanics and Engineering Science, College of Engineering, Peking University, Beijing 100871, China
*
Author to whom correspondence should be addressed.
Energies 2021, 14(24), 8296; https://doi.org/10.3390/en14248296
Submission received: 8 October 2021 / Revised: 15 November 2021 / Accepted: 6 December 2021 / Published: 9 December 2021

Abstract

:
Operation modes are an important topic in the research of Rotating Detonation Chamber (RDC) as it can affect the stability of RDC. However, they have not been discussed in detail due to the limitation of measurement means in experiments. The aim of this research is to investigate the mechanism of different operation modes by numerical simulation. In this paper, a numerical simulation for RDCs with separate injectors is carried out. Different operation modes and mode switching are analyzed. There is a series of reversed shock waves in the flow field. It was found that they have great effects on operation mode and mode switching in RDCs. A reversed shock wave can transit into a detonation wave after passing through isolated fresh gas region where fresh gas and burnt gas distribute alternatively. This shock-to-detonation transition (SDT) phenomenon will influence the ignition process, contra-rotating waves mode and mode switching in RDCs. SDT makes the number of detonation wave increases, resulting in multi-wave mode with one ignition. Moreover, quenching of detonation waves after collision and SDT after passing through isolated fresh gas region are the mechanism of contra-rotating waves mode in RDCs with separate injectors. In addition, when the inlet total temperature increases, a shock wave is easier to transit into a detonation wave. The distance that a shock wave travels before SDT decreases when temperature increases. This will result in mode switching. Therefore, SDT determines that there is a lower bound of detonation wave number.

1. Introduction

Rotating Detonation Engine (RDE) is one of future engine concepts. It has many advantages, such as high thermal efficiency, adjustable quantity of flow, simple structure and so on. So it has attracted the attention of many researchers. The structure of Rotating Detonation Chamber (RDC) is always an annular cylinder or a hollow cylinder. Gas flow into the chamber by micro-nozzles. Rotating detonation waves spread in circumference direction, burning gas and generating thrust.
The rotating detonation wave was first achieved by Voitsekhovskii [1] in the 1960s in a disk-shaped chamber. In the 1990s, Bykovskii et al. [2] carried out experimental research on RDE with different fuels. From then on, more experiments on RDCs were carried out in many different countries. Recently, RDCs with different fuels have been realized in experiments [3,4,5]. Pressure signal in RDCs can be get by high-frequency pressure sensors [6,7,8,9,10,11,12,13,14]. Wave information in RDCs could be get from pressure signal. Currently, visualization technologies have been applied in research of RDCs using high speed camera. High speed OH* chemiluminescence images can show the instantaneous reaction progress in RDC [15,16].
However, due to the limitation of measurement means, the detailed flow field cannot be visualized in experiments. Therefore, numerical simulations for RDCs were carried out [17,18,19,20,21,22]. Some phenomena discovered in experiments were reproduced in simulation and their mechanisms were explained, such as reinitiation [12,17] and delay time after ignition [7,13,16]. In convection simulations for RDCs, gas is injected through the whole injection wall, but the actual condition is that gas is injected by micro-nozzles distributed on the injection wall. Numerical and experimental research shows that RDCs with separate injectors have many phenomena different from RDCs with full-face injection, such as isolated fresh gas region, more likely to form multiple wave mode, complex wave structure and so on. Because of these features, RDCs with discrete injectors are suitable for studying mode switching.
Operation modes can affect the stability of RDC and therefore are an important topic in RDC research. Anand et al. concluded four operation modes in RDCs [8]. They are single wave mode, multiple wave mode, contra-rotating waves mode and colliding waves mode. Mode switching means change between different operation modes and change in the number of detonation waves existing in the RDC responding to sudden change in working condition, such as switch from one wave mode to two wave mode [8,23]. Mode switching in RDCs has already been discovered in experiments [8,13,23]. However, the mechanism and process of mode switching is difficult to be revealed by experiments. Batista et al. carried out simulation to explain the mechanism of Descending Modal Transition(DMT) process [24]. They found that critical reactant mixing height is an indicator of detonation wave viability. The Wolanski criterion implies an upper limit on the number of sustainable detonations in RDCs. However, the mechanism of other operation modes and mode switching have not been explained.
In this paper, different operation modes and mode switching are analyzed by numerical simulation for RDCs with separate injectors. It is found that reversed shock waves and shock-to-detonation-transition (SDT) have great effects on operation modes and mode switching in RDCs. These effect are discussed in detail. This research can shed insights on the understanding of stability in RDCs.

2. Methodology

In 2-dimensional simulation, the chamber is regarded as an infinitely thin cylinder, ignoring the variety in radial direction. The chamber is 2 cm in diameter and 5 cm in length, as shown in Figure 1. A one dimensional detonation wave is used for ignition. The initial pressure distribution is shown in Figure 1. The pre-mixed fuel is injected into the chamber through the micro-nozzles on the head end wall. As shown in Figure 2, micro-nozzles and solid walls are distributed alternatively on the injection wall. Solid lines represent solid walls. Dashed lines represent injection zones. Similar injection pattern has been used by Fujii et al. [21]. Gas is injected into the chamber at Laval nozzles through injection zones, the area ratio of injection zone to throat is around 3.7. The length of an injection zone is LI, the length of a solid wall is LS. A combination of an injection zone and a solid wall is called an injection unit. N denotes the number of injection units on the injection wall. The length of one injection unit is L/N, in which L is the circumference. The ratio of length of an injection zone to length of an injection unit is called injection ratio, represented by k.
2-dimensional Euler equations with source term is used as governing equations. Diffusion is ignored according to the work of Oran et al. [25]. Two-step chemistry model [26,27] is used for the stoichiometric hydro-oxygen reaction. The equations are shown as follows:
U t + F x + G θ + S = 0
U = [ ρ ρ u ρ v ρ E ρ α ρ β ] ,   F = [ ρ u ρ u 2 + p ρ u v ρ E u + p u ρ u α ρ u β ] ,   G = 1 r [ ρ v ρ u v ρ v 2 + p ρ E v + p v ρ v α ρ v β ] ,   S = [ 0 0 0 q w ˙ β w ˙ α w ˙ β ]
p = ρRT
E = p ( γ 1 ) ρ + 1 2 ( u 2 + v 2 )
In which ρ is the density, u and v represents axial and circumferential velocity, E is energy per unit mass, including thermal energy and kinetic energy, α and β are reaction progress parameters of induction zone and heat release zone, respectively. In the two-step chemistry model [26,27], the reaction rate is:
w ˙ α = k 1 ρ e E 1 / R T
w ˙ β = { k 2 p 2 ( β 2 exp ( E 2 R T ) ( 1 β ) 2 exp ( E 2 + q R T ) )   α < 0 0                 α 0
The flux terms are treated by the fifth-order WENO scheme. Third-order Runge–Kutta method is used for time integration. The extrapolated outflow boundary condition is used [18,28]:
Y b = Y 1 ( 1 r ) + Y r
where Y b are the boundary values, Y 1 are the current values in the first cell near the boundary, Y are the values of the ambient fluid parameters, r = 0.05. The ambient pressure p is 1 atm. When the local pressure on the inflow boundary is larger than the stagnation pressure of the pre-mixed fresh gas or a solid wall is set here, the fresh gas cannot be injected into the chamber, the reflection boundary condition is used. Elsewise gas is injected into the chamber by Laval nozzles.
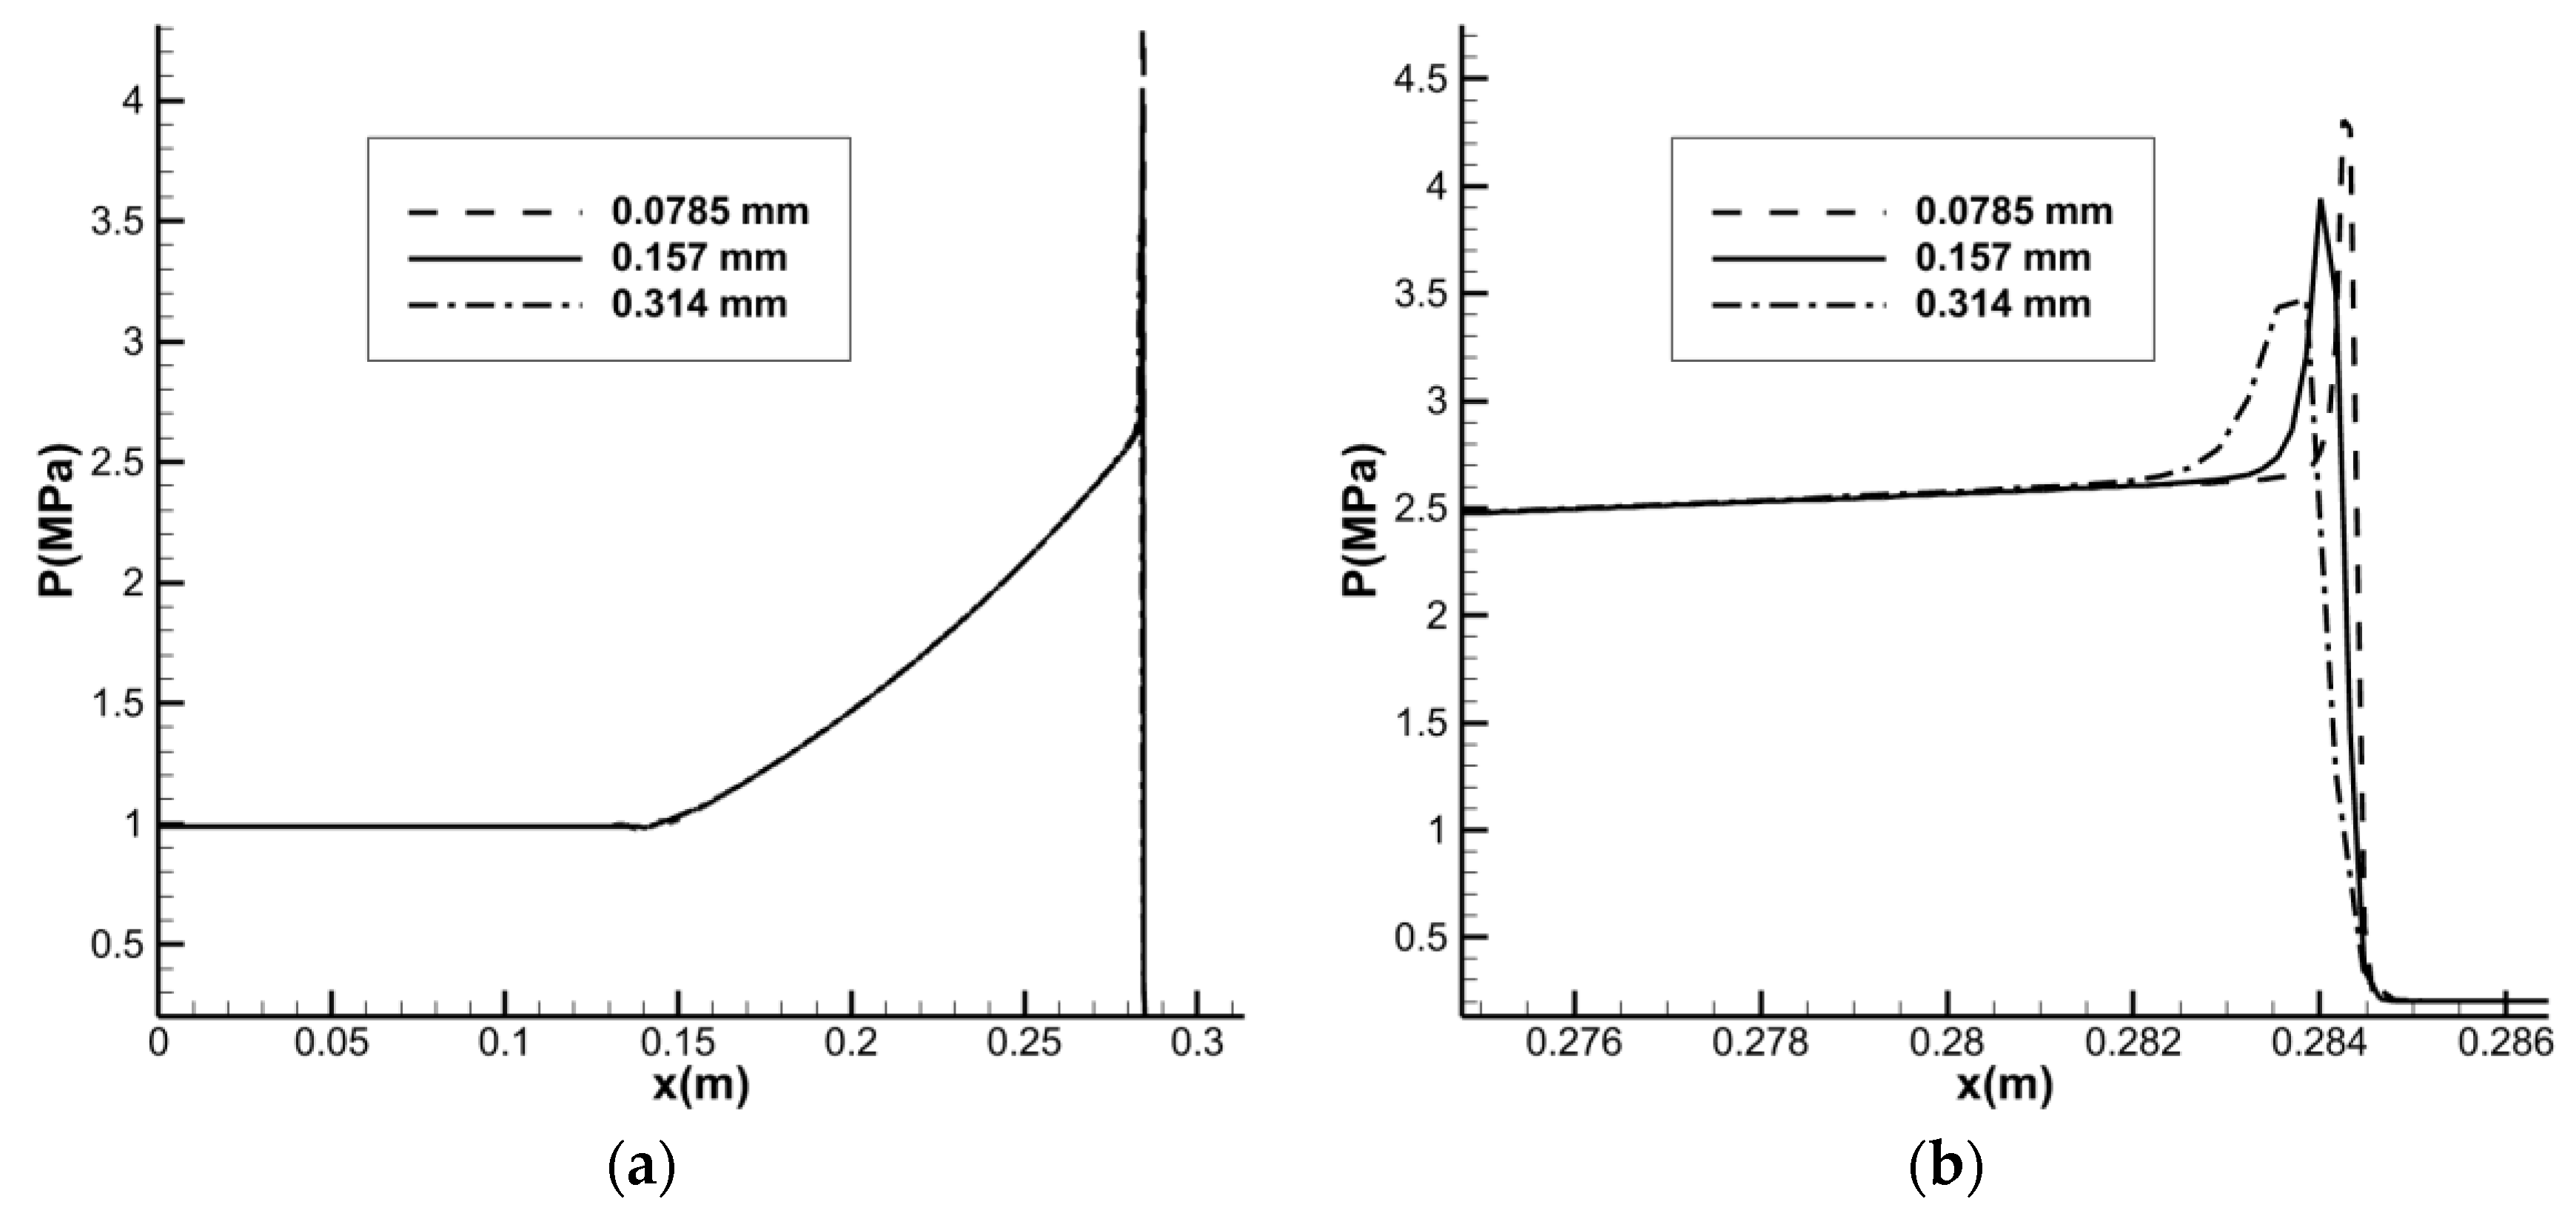
The grid size used in this paper is around 0.157 mm. Simulation with different grid sizes are carried out for the validation of the feasibility of the results and the grid independence. For one-dimensional detonation tube problem, the grid sizes of the calculation examples are 0.0785 mm, 0.157 mm and 0.314 mm respectively. The detonation tube is 0.314 m long, filled with stoichiometric hydro-oxygen mixture, pressure of 0.2 MPa and temperature of 400 K. As shown in Figure 3, the pressure curves of different grid sizes are basically consistent. The detonation velocity is 2847 m/s, almost the same as the C-J velocity 2852 m/s. This proves that simulate for detonation wave is accurate with these grid sizes.
Figure 4 shows the pressure contours and temperature contours in RDCs with separate injectors with different grid size. In this case, N = 20, k = 0.75, inlet total pressure P = 30 atm, inlet total temperature T = 800 K. In Figure 4a, the grid size is around 0.157 mm. In Figure 4b, the grid size is around 0.0785 mm, half of that in (a). In the results with different grid size, there are both 2 detonation waves in the flow field. The wave structure and temperature distribution are also nearly the same. We can see observe reversed shock waves in both results, and number of reversed waves are the same. As a result, we adopt the grid in Figure 4a in this paper.

3. Results and Discussion

Figure 4 shows one typical results of RDCs with separate injectors. In the flow field, fresh gas is separate by several segments of burnt gas. We call this isolated fresh gas. There is a series of reversed shock waves. We found that reversed shock waves can transit into detonation waves. This SDT phenomenon plays an important role in operation mode of RDE. The formation and stability of reversed shock waves, SDT after passing through isolated fresh gas region and its specific effects on operation modes in RDCs are discussed then.

3.1. Formation and Stability of Reversed Shock Waves

There is a series of reversed shock waves in typical flow field of RDCs with separate injectors. They are caused by discontinuity in isolated fresh gas region in front of detonation waves [22]. When a detonation wave step into fresh gas from burnt gas, a reversed shock wave will be produced. The reversed shock wave will be strengthened after colliding with a detonation wave. Therefore, reversed shock waves can spread lastly in the flow field.
Reversed shock waves have also been discovered in experiments [9,15]. Fabian Chacon et al. found three types of counter propagating secondary waves using circuit wave analysis. They are detonation wave, counter propagating fast wave and counter propagating slow wave pair. They also visualized counter propagating waves in high speed OH* chemiluminescence images.
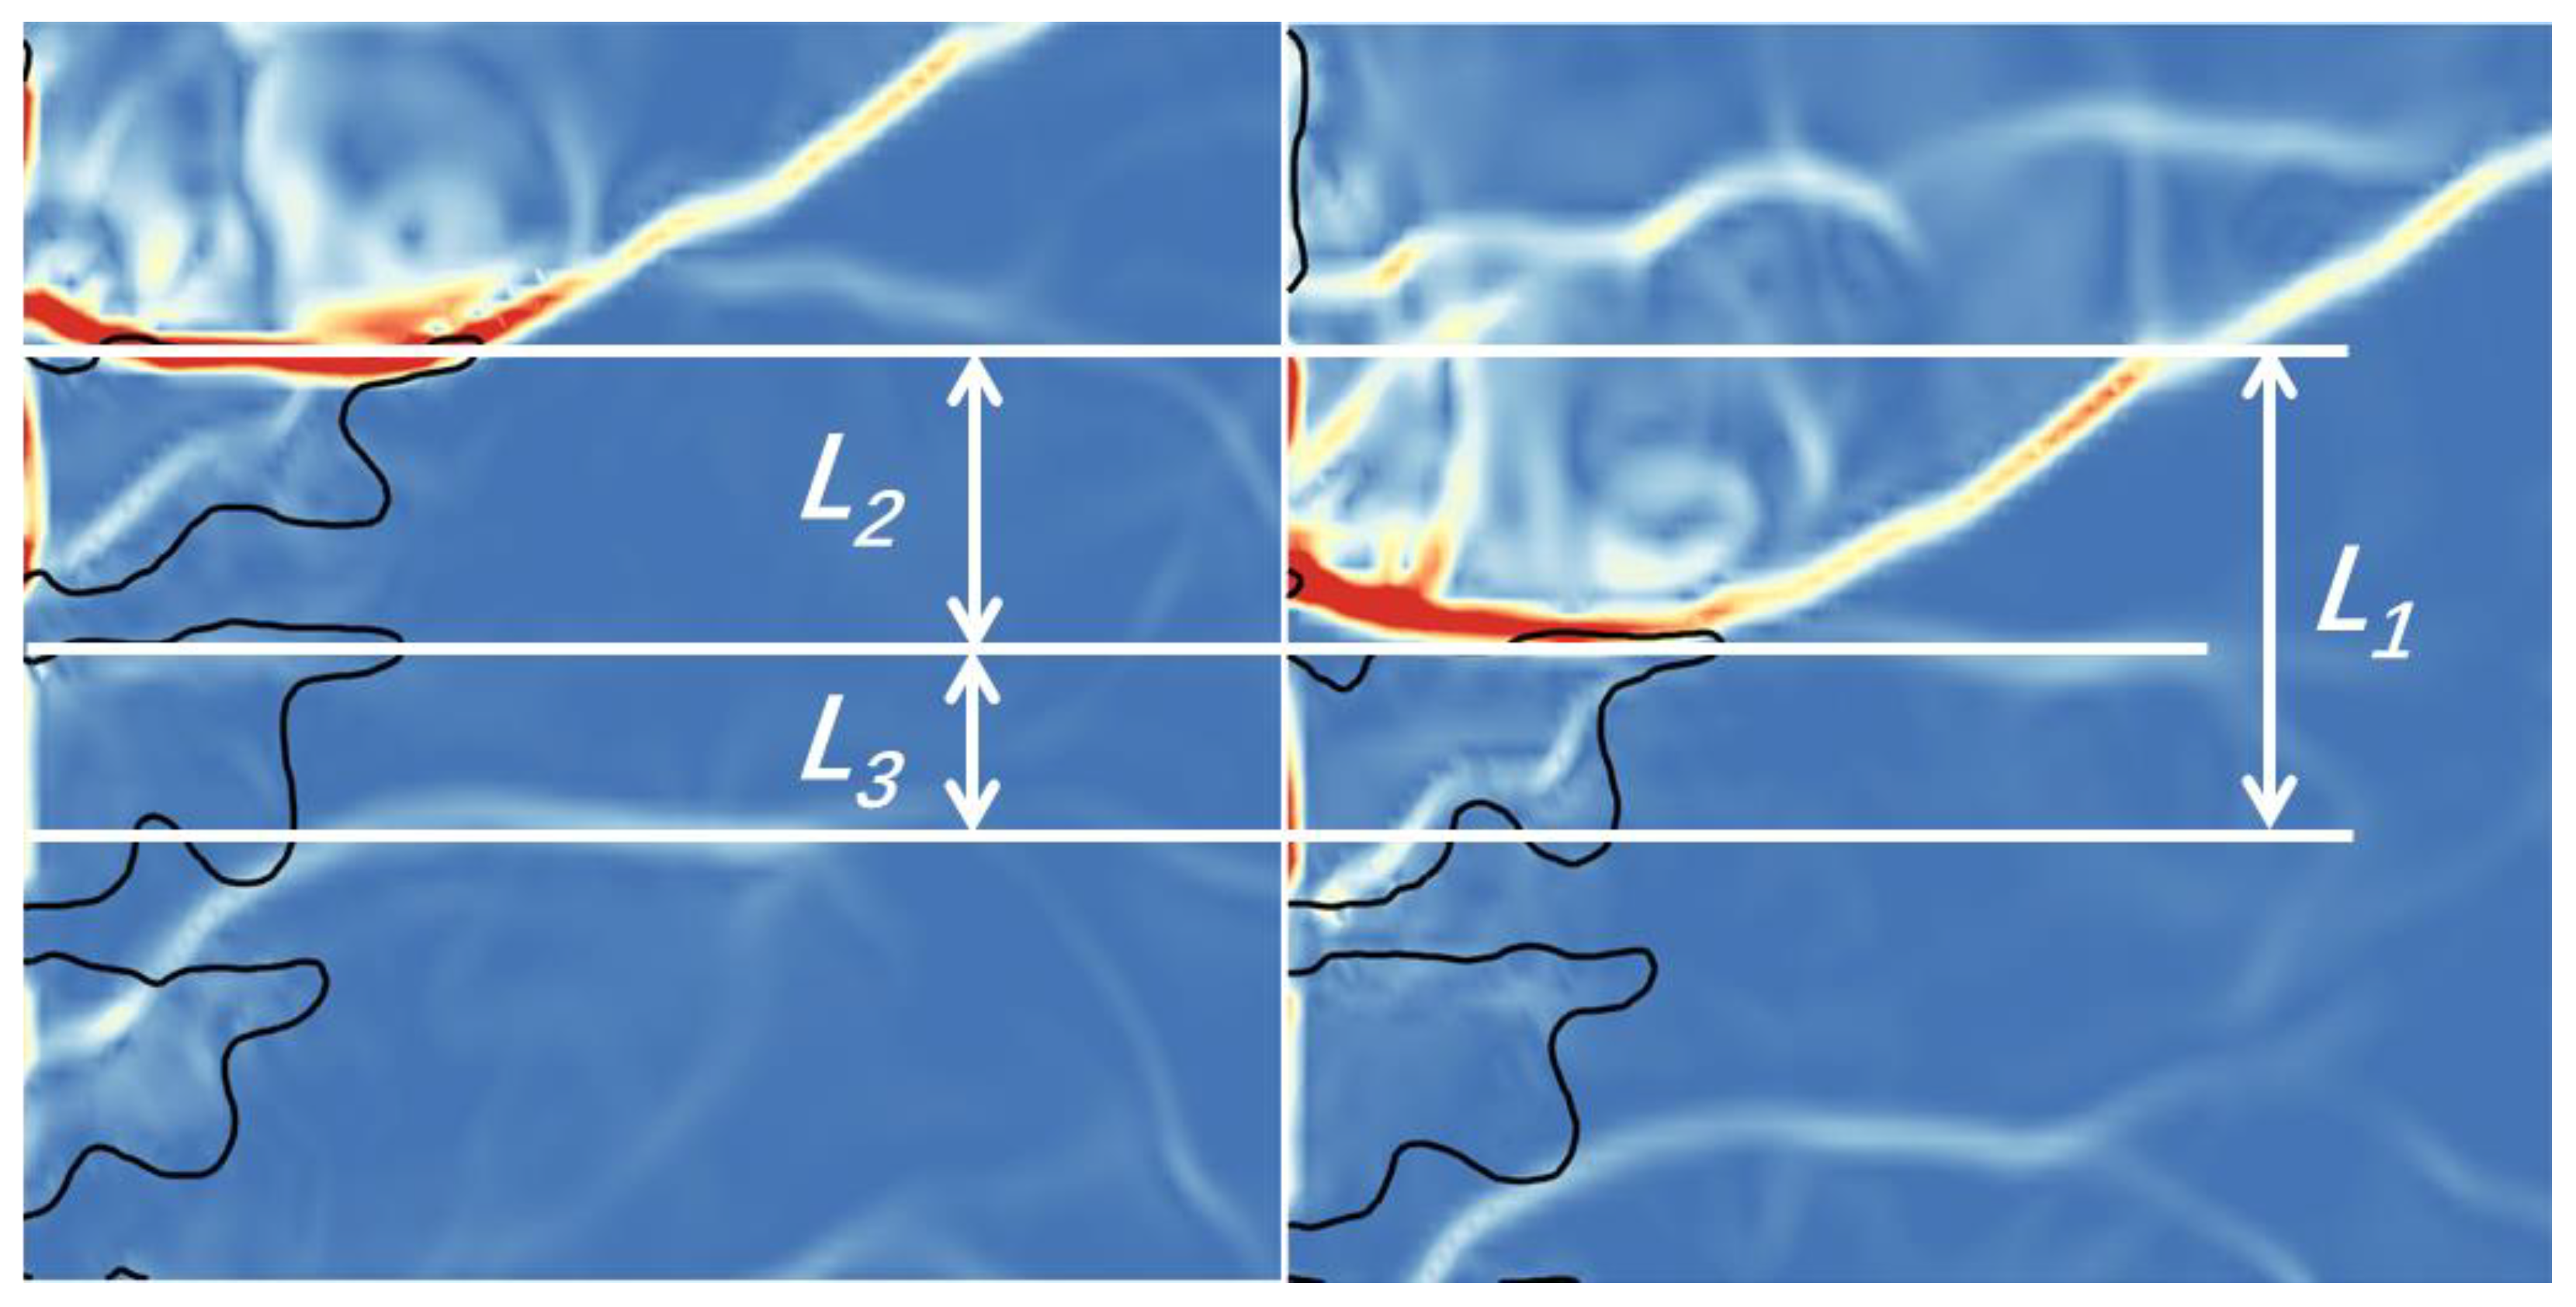
When the flow field in RDC is stable, number of reversed shock waves remains constant, which means that no new reversed shock waves are produced. So, it requires that a detonation wave collides with a shock wave while it steps into fresh gas region, as shown in Figure 5. Using this relation, we can calculate the average velocity of shock waves. In the result in Figure 4, there are 13 reversed shock waves and 20 micro-nozzles. The average distance between two shock waves shown in Figure 5 is L1 = L/13. The length of one injection unit is L2 = L/20. When the detonation wave pass through a distance L1, the distance a shock wave pass through is L3 = L1 − L2, therefore the average velocity of reversed shock wave is L3/L2·D = 7/13·D, in which D is the speed of detonation wave. The average velocity of reversed shock waves nears to the sound speed of detonation products, which is consistent with the experimental results [9,10].

3.2. SDT after Passing through Isolated Fresh Gas Region

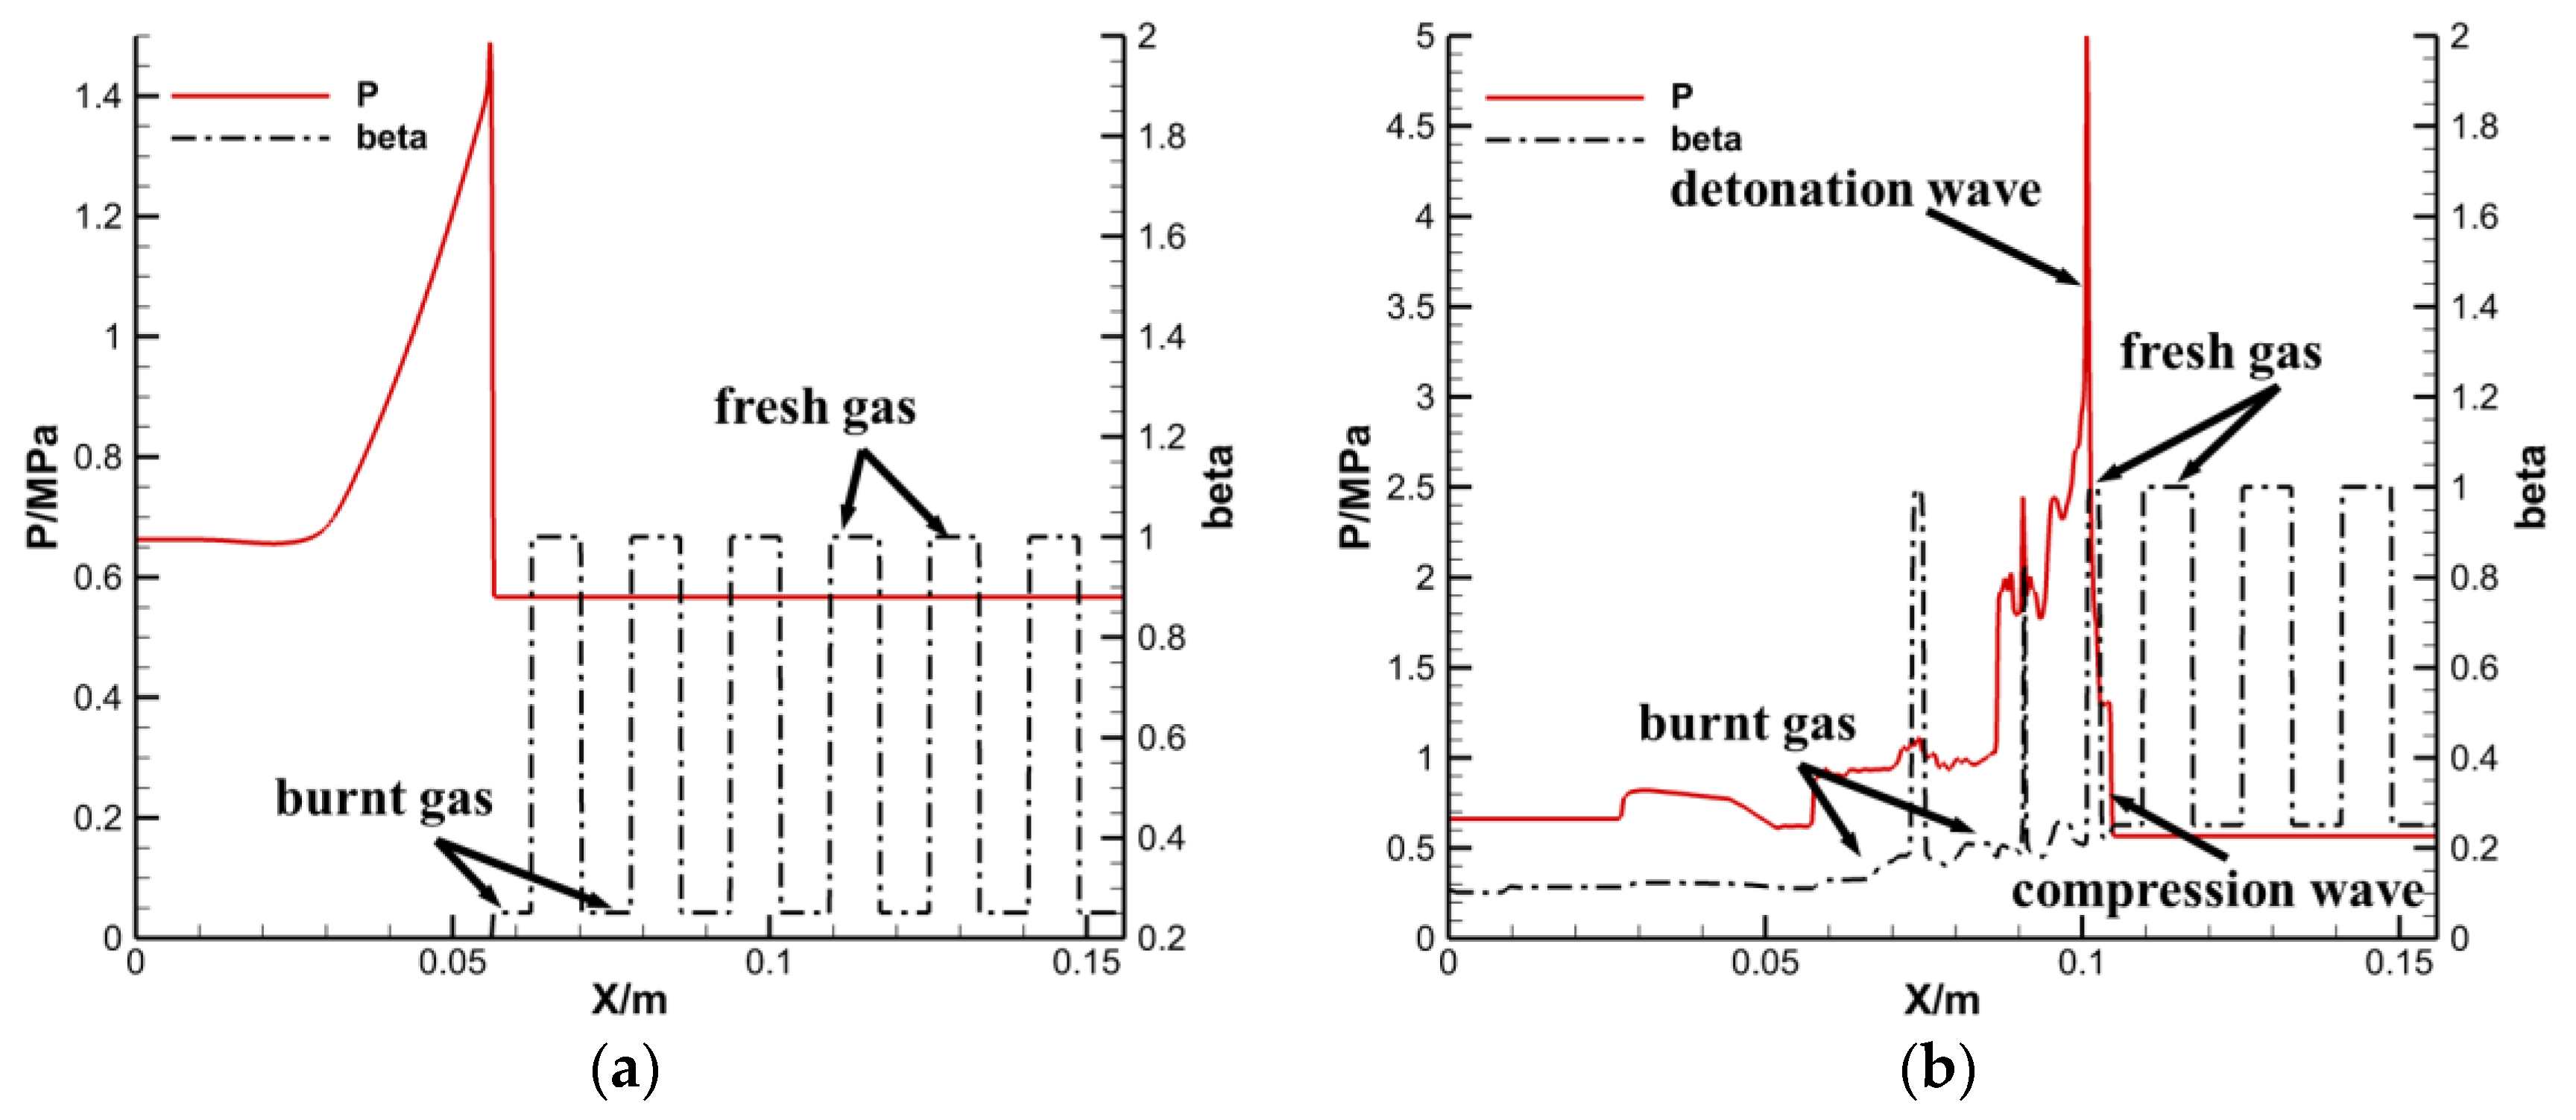
There is a feature of shock waves that can influence mode switching in RDCs. When a shock wave passes through a distance of isolated fresh gas region, it may develop into a detonation wave, as shown in Figure 6. This SDT phenomenon is the direct factor on operation modes and mode switching. It is similar with the experiment by Burr et al. [29]. The process will be discussed in detail.
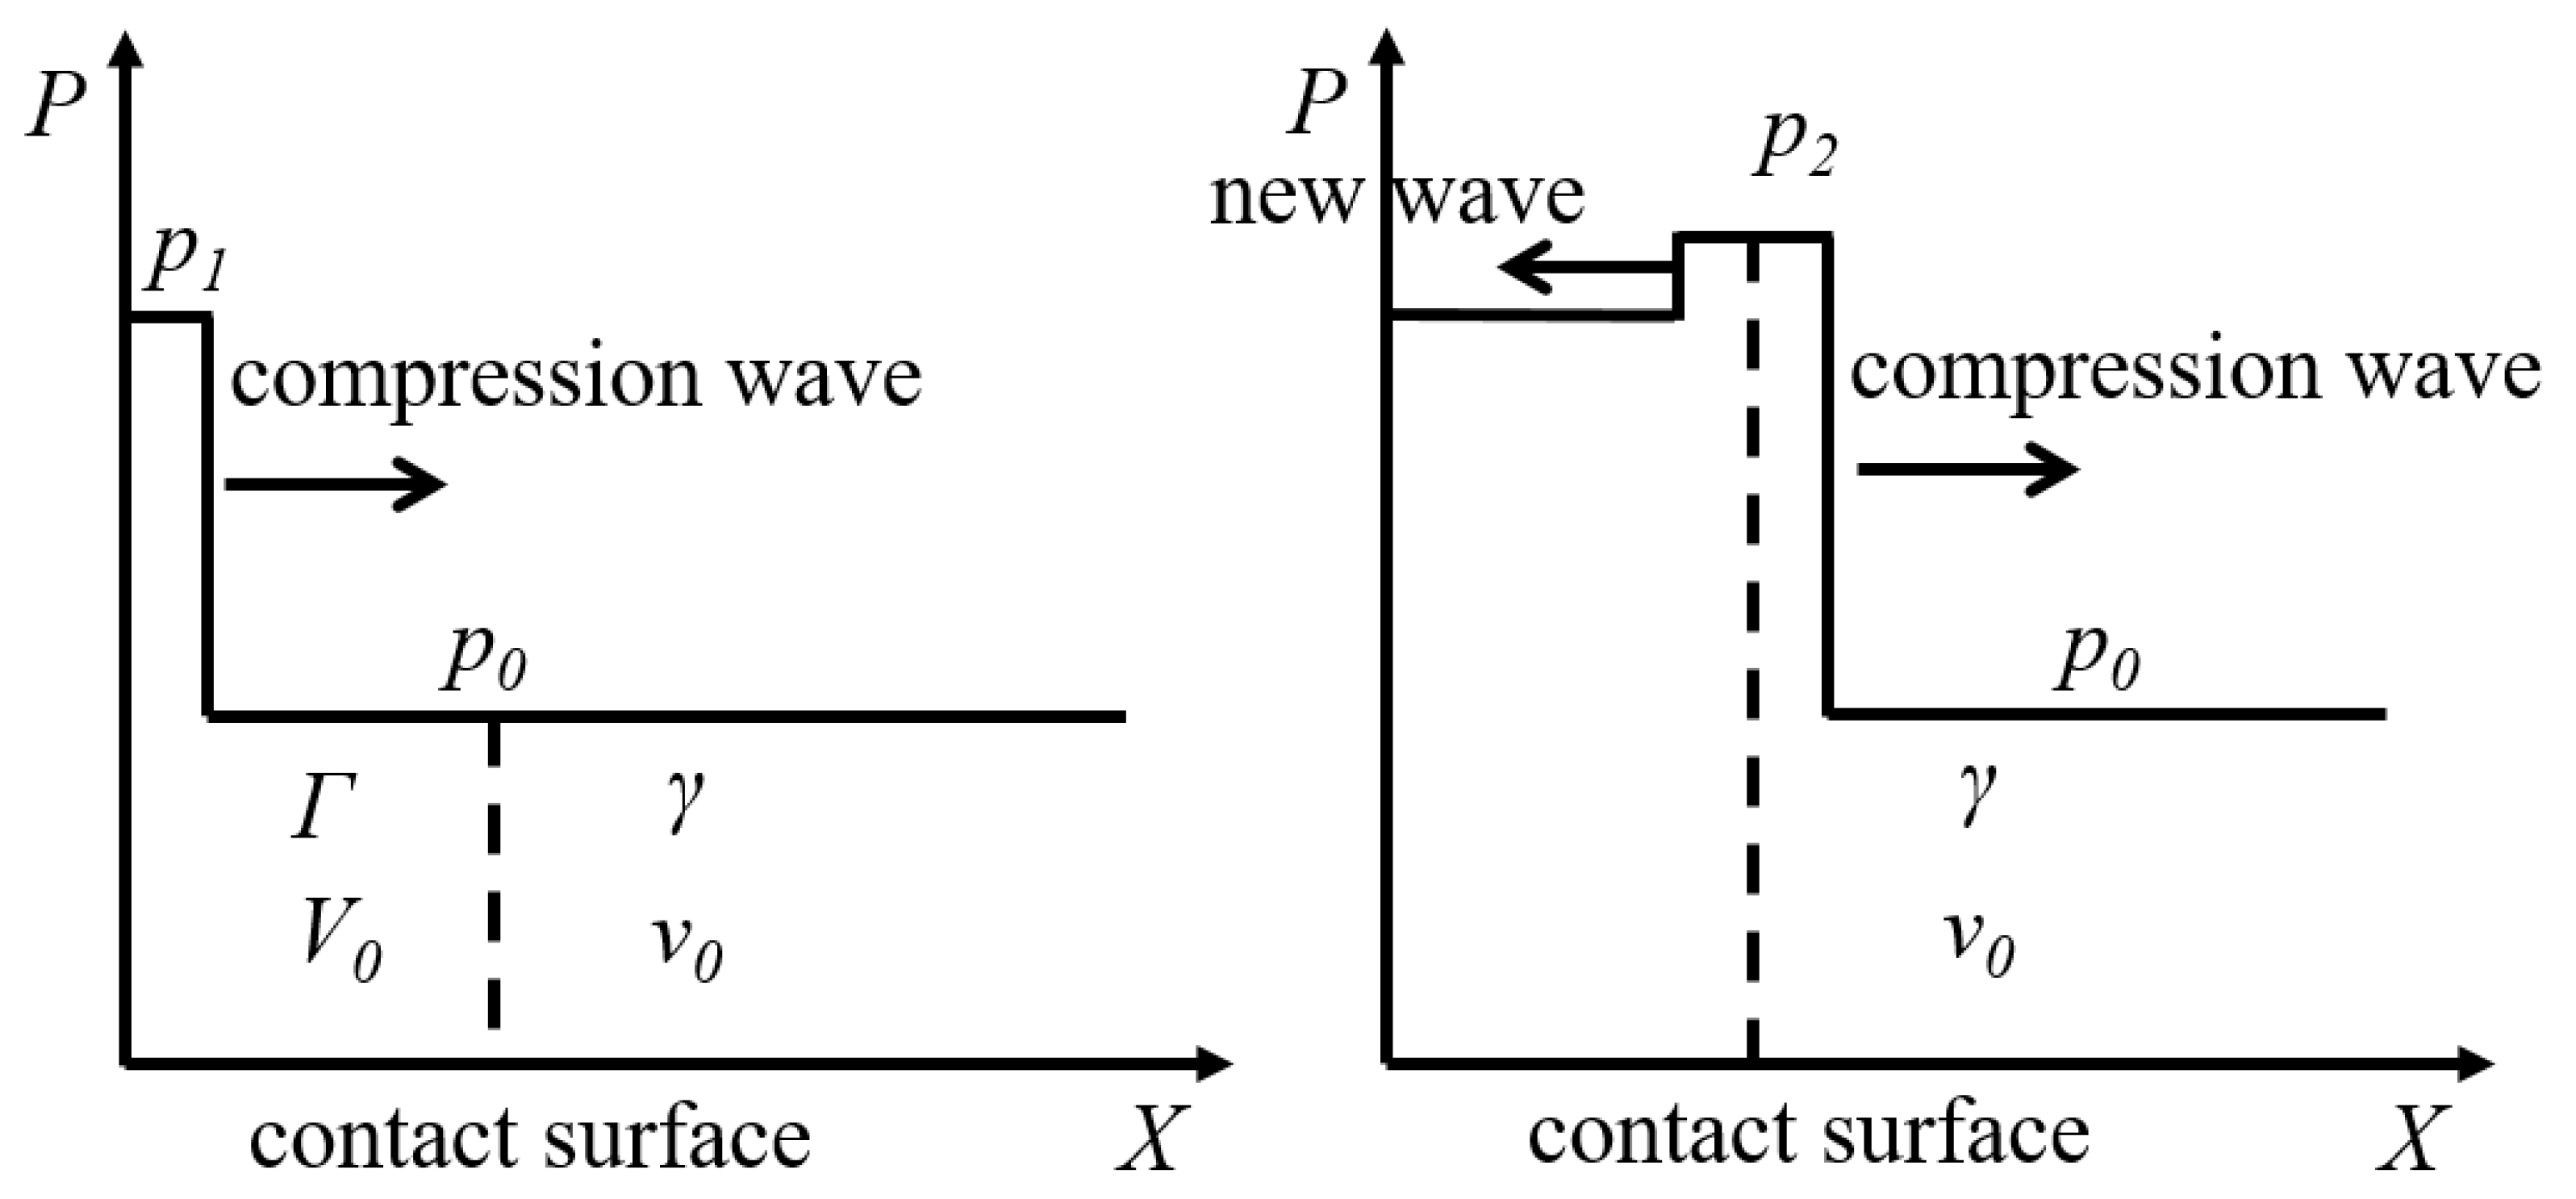
When a shock wave passes through a contact surface, it will produce a new reversed wave, the wave maybe a shock wave or a rarefaction wave, which is depended on the specific heat ratio and specific volume in two sides. This interaction between shock wave and contact surface can be theoretically proved using Rankine-Hugoniot relation [30].
As shown in Figure 7 the shock wave travels from left to right. Γ and V0 denote specific volume and specific heat ratio of gas in the left side, respectively. γ and v0 denote specific volume and specific heat ratio of gas in the right side, respectively.
Considering the condition that a shock wave passing though isolated fresh gas, when a shock wave steps into low temperature fresh gas from high temperature burnt gas, the temperature in front of wave decreases to around one eighth while the pressure keep constant. So the specific volume also decreases to around one eighth, V0 ≈ 8v0. The change of specific volume in this case is much larger than that of specific heat ratio, so Γ / V 0 < γ / v 0 and ( Γ + 1 ) / V 0 < ( γ + 1 ) / v 0 , therefore the reflected wave is always a shock wave. In this condition, we can get the relation p2 > p1, in which p2 and p1 are the pressure of the shock wave after and before passing through the contact surface, that is to say, the shock wave is enhanced. Reversed shock waves produced by detonation wave in RDC is because of same reason.
By contract, when a shock wave steps into high temperature burnt gas form fresh gas, Γ / V 0 > γ / v 0 and ( Γ + 1 ) / V 0 > ( γ + 1 ) / v 0 , the reflected wave is always a rarefaction wave. This interaction between shock wave and contact surface is a main factor for SDT.
Let us see the detailed process for SDT in Figure 8. At first, low-temperature fresh gas and high-temperature burnt gas distribute alternatively in front of a shock wave. After the shock wave passes through a distance, a detonation wave appears near interface of burnt gas and fresh gas and catch up with the original shock wave soon.
At 11 μs, the shock wave steps into low temperature fresh gas from high temperature burnt gas, a reversed shock wave is generated, and the original shock wave is enhanced, as analyzed above. At 24 μs, the reversed shock wave can also produce another shock wave that propagates in the same direction with the original shock wave. So there will be two shock waves propagate to each other after a while, as shown in Figure 8c. These two shock waves collide with each other and be enhanced. After passing through a distance, fresh gas may be ignited by shock waves and a detonation wave is generated.
From the analysis above, we can see that shock wave can transit into detonation wave after passing through a length of isolated fresh gas, because of the interaction between shock wave and contact surface, and collision between two shock waves.
The distance a shock wave travels in isolated fresh gas region before SDT is related to many conditions, such as temperature of fresh gas. Figure 9 shows the relation between distance for SDT and temperature of fresh gas. The distance decreases with increasing of temperature. When the temperature increases, the chemical reaction rate also increases, a shock wave is easier to develop into a detonation wave, the distance for SDT decreases.

3.3. Effects of Reversed Shock Waves in RDC

SDT process is discussed above. Reversed shock waves can influence operation modes in RDCs by shock-to-detonation-transition(SDT). Specific effects of SDT on self-organization after ignition, contra-rotating waves mode and mode switching is analyzed then.

3.3.1. Self-Organization after Ignition

In the simulation in this paper, a one dimensional detonation wave is used for ignition. However, in some cases, when the flow field is stable, there is more than one detonation wave in the RDC [31]. The reversed shock waves play an important role in the self-organization in RDC before the flow field becomes stable.
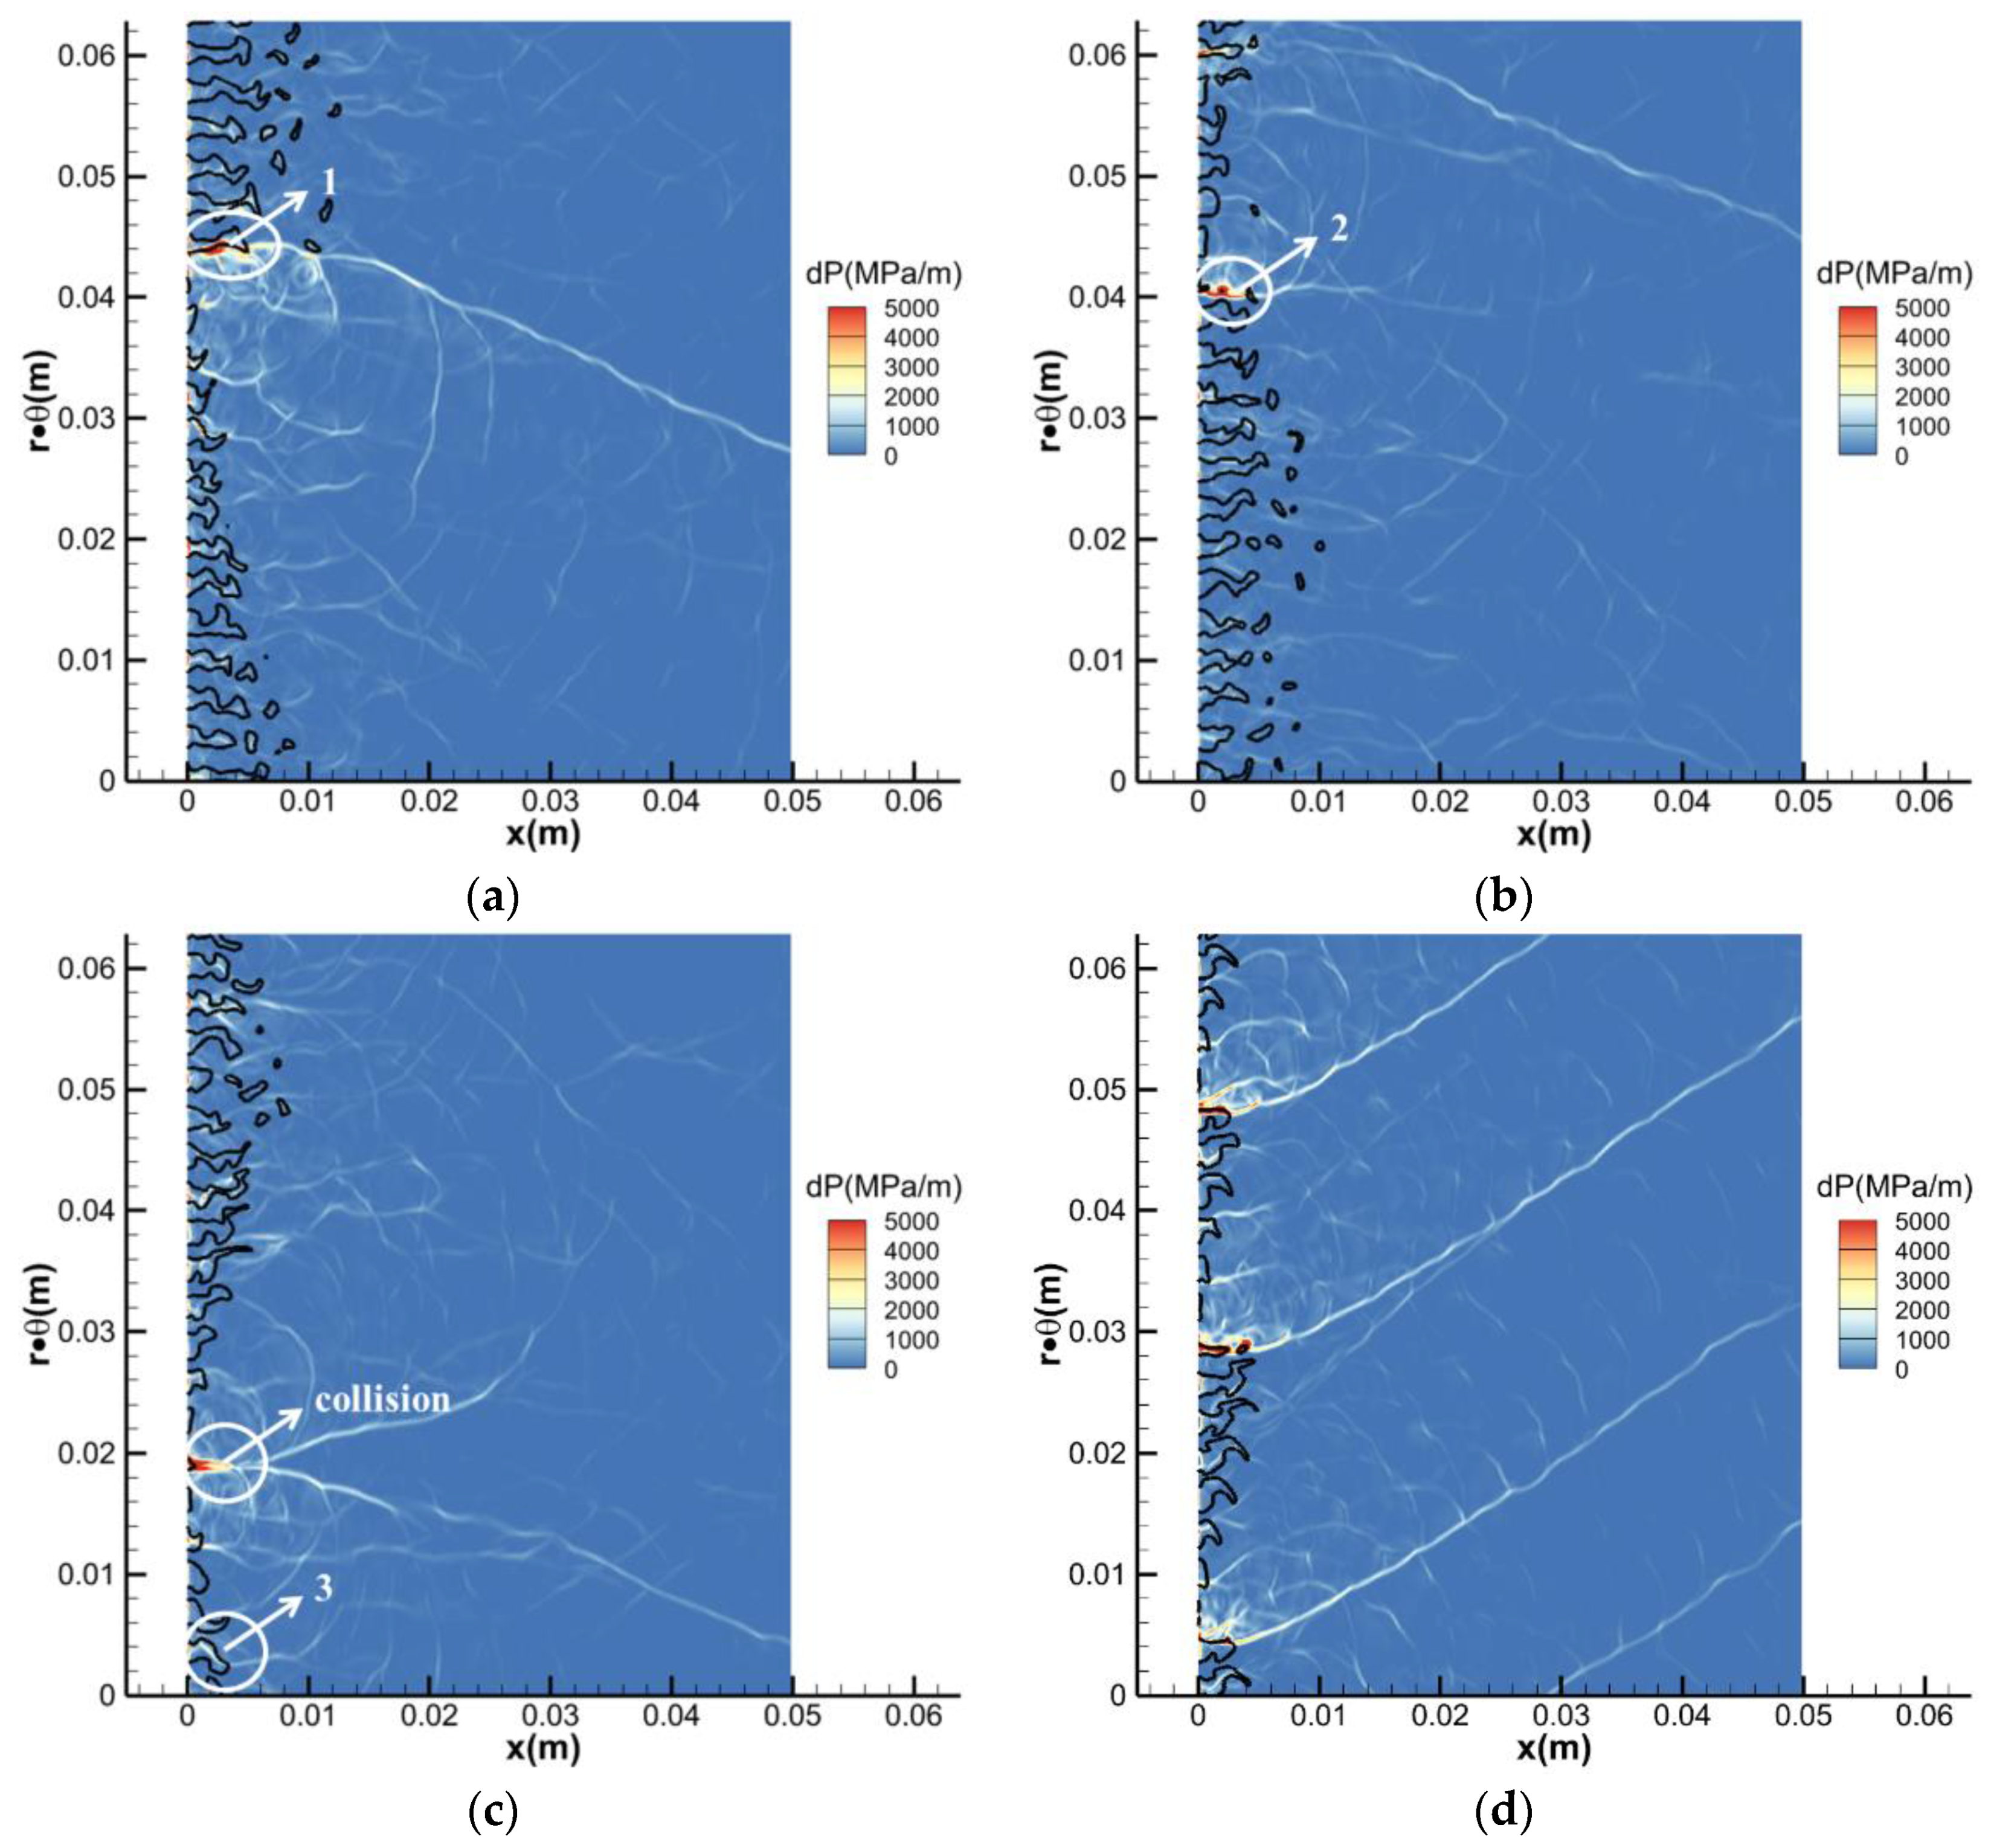
In the following case, N = 20, k = 0.6, total pressure P = 3 MPa, total temperature T = 800 K. Figure 10 show the detailed self-organization process. There is only one detonation wave (wave 1) in the flow field at first. After a while, isolated fresh gas region is formed, the initial detonation wave begins to produce reversed shock waves as shown in Figure 10a. Then, a reversed shock wave (wave2) transits into a detonation wave in Figure 10b, as introduced in Section 3.3. There are two detonation waves propagating in different direction now. In Figure 10c these two detonation waves collide with each other and quench, so there are no detonation waves in the flow field now. Similar phenomena have been observed both in numerical simulation [18] and experiment [7], detonation waves vanish in RDC after ignition for a while. However, there are still some shock waves, like wave 3 in Figure 10c. Length of fresh gas regions in front of these waves is enough for SDT, so these shock waves will transit into new detonation waves soon. Finally, when the flow field becomes stable, there are three detonation waves spreading in the same direction.
Though there are still some reversed shock waves, the distance between two detonation waves is not enough for shock waves to transit into detonation waves. Therefore, the flow field becomes stable, number of detonation waves keep constant.
From the analysis above, the initial detonation wave will produce reversed shock waves in RDCs with separate injectors. These reversed shock waves may transit into detonation waves. Therefore, when the flow filed is stable, there can be more than one detonation wave.

3.3.2. Contra-Rotating Waves Mode

Contra-rotating waves mode has been observed in experiments [14,16]. A couple of contra-rotating detonation waves spread in different direction collide with each other in RDC. In RDCs with separate injectors, this mode also relates to SDT.
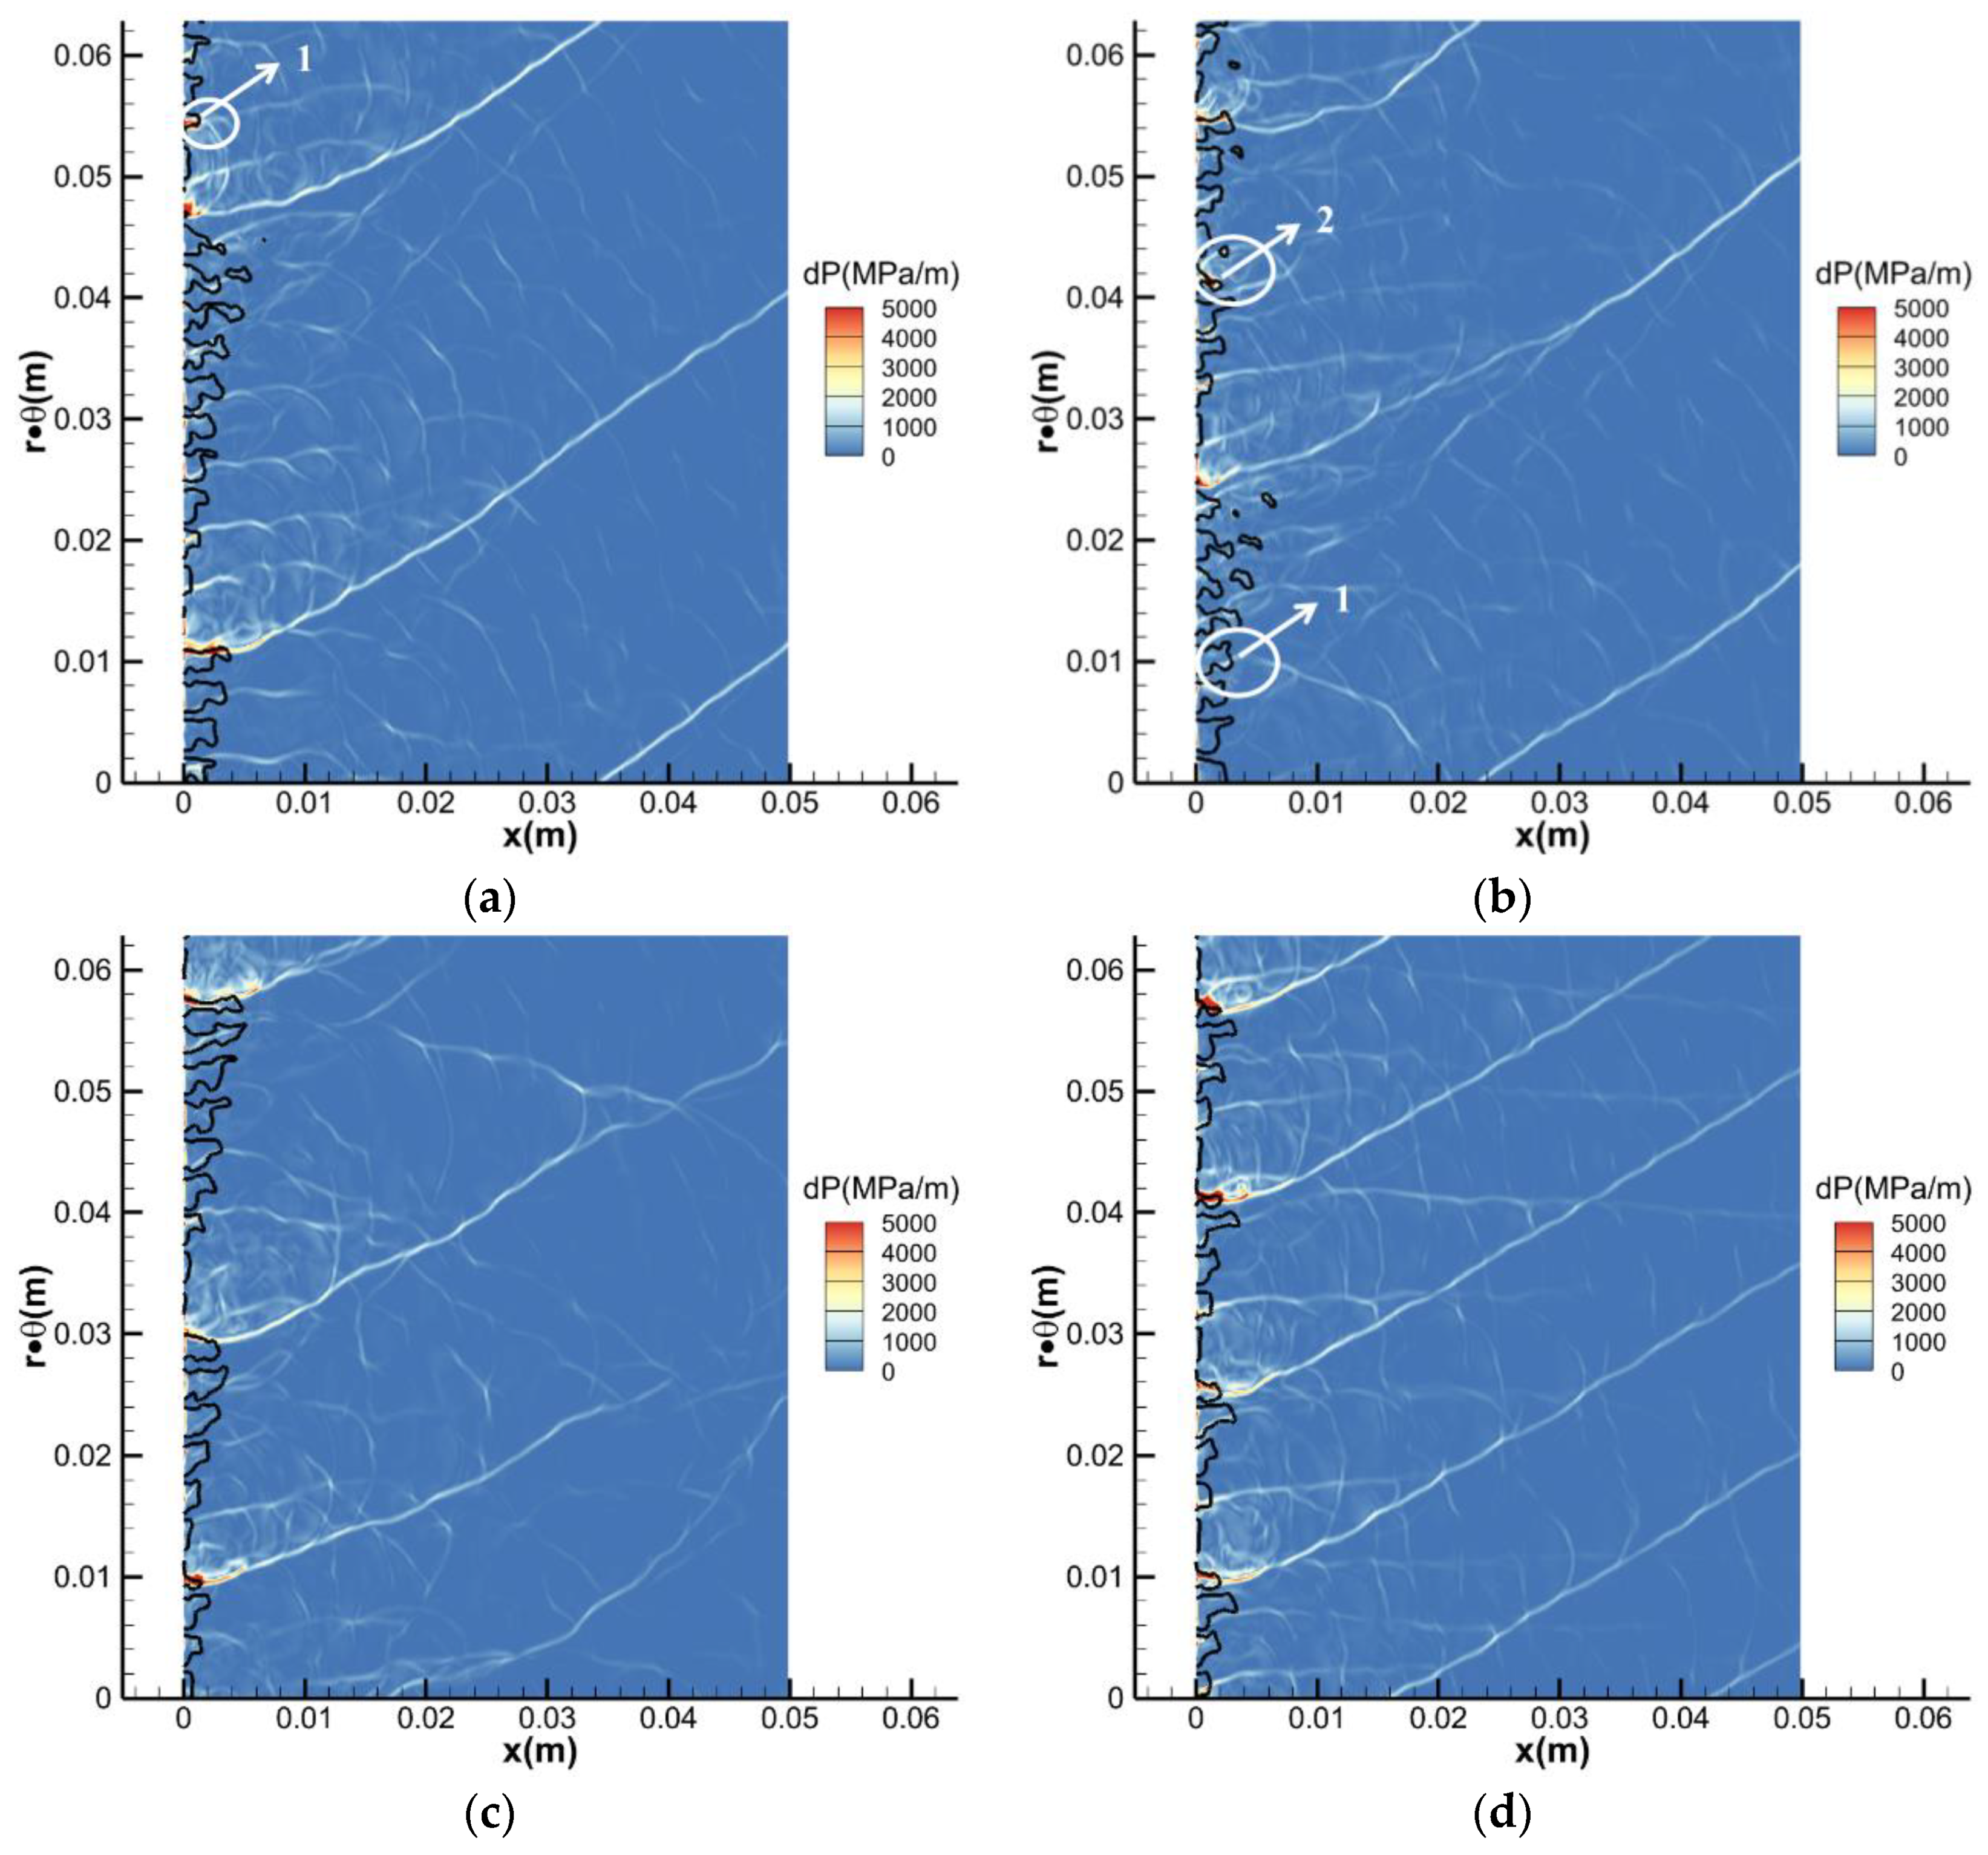
In this case, k = 0.75, N = 20, inlet total pressure P = 9 MPa, inlet total temperature T = 800 K. We can see that in Figure 11a there is one detonation wave (wave 1) at first. After a while, a reversed shock wave develops into a reversed detonation wave (wave 2) in Figure 11b. These two detonation waves collide with each other and quench because fresh gas in front of these two waves is not enough. So they become shock waves in Figure 11c. However, after passing through isolated fresh gas region, wave 3 transits into a detonation wave. Soon another wave 4 also transits into a detonation wave in Figure 11d. They collide with each other again.
A couple of contra-rotating detonation waves transit into shock waves after colliding with each other and transit into detonation waves after passing through isolated fresh gas region. This progress repeats in the flow field. So contra-rotating waves mode can last in RDC.

3.3.3. Mode Switching

Reversed shock waves also play an important role in mode switching in RDCs with separate injectors when the injection conditions change suddenly. We use the result in Figure 4 as the initial flow field. Then raise the inlet total temperature to 1.3 times. We can observe mode switching in the RDC. From Figure 12, we can see at 13 μs, after colliding with a detonation wave, the shock wave is strengthened. It ignites the fresh gas and develops into a detonation wave (wave 1) whose propagation direction is opposite to other detonation waves. At 22 μs, shock waves spreading in different direction collide with each other and, causing another new detonation wave, denoted by wave 2. Reversed shock wave 1 goes extinct after colliding with another detonation wave. At 121 μs, there are three detonation waves in the RDC. However, the flow field is still unstable now. Transitions between shock waves and detonation waves still happen. Finally, 4 detonation waves spread in the RDC stably.
In this case, when intel total temperature increases, shock waves transit into detonation waves after passing through isolated fresh gas. This phenomenon leads to mode switching, number of detonation waves increases to 4.

3.3.4. Influence on Detonation Wave Number

From the analysis above, a shock wave will transit into a detonation wave after passing through isolated fresh gas region. The distance for SDT is related to many conditions such as total temperature, total pressure and so on. When the inlet total temperature increases, a shock wave is easier to develop into a detonation wave. The distance that shock wave travels before SDT decreases with temperature increasing. Distance between two neighboring detonation waves in RDCs with separate injectors must be smaller than the distance for SDT. Otherwise, reversed shock waves will transit into detonation waves. This will make the flow field unstable and result in mode switching. Therefore, SDT determines that there is a lower bound of detonation wave number. When the flow field is stable, the wave number must be larger than this value.

4. Conclusions

Two-dimensional numerical simulation for Rotating Detonation Chambers (RDCs) with separate injectors have been carried out. It is found that reversed shock waves play an important role in operation mode and mode switching in RDCs with separate injectors. A reversed shock wave can develop into a detonation wave after passing through isolated fresh gas region where fresh gas and burnt gas distribute alternatively. This shock-to-detonation-transition (SDT) phenomenon plays an important role in operation mode and mode switching in RDCs with separate injectors.
In the self-organization after ignition, the initial detonation wave will produce shock waves after isolated fresh gas region is formed. These reversed shock waves may transit into detonation waves, resulting in multi-wave mode.
Contra-rotating waves mode also relates to SDT. A couple of contra-rotating detonation waves transit into shock waves after colliding with each other and transit into detonation waves after passing through isolated fresh gas region repeatedly.
When the inlet total temperature increases, a shock wave is easier to develop into a detonation wave and result in mode switching. SDT is one of the immediate causes of mode switching.
Distance between two neighboring detonation waves in RDCs with separate injectors must be smaller than the distance for SDT. Therefore, SDT determines that there is a lower bound of detonation wave number. The lower bound increases with the increasing of temperature.

Author Contributions

Conceptualization, Y.C. and J.W.; methodology, Y.C. and J.W. software, Y.C., X.L. and J.W.; validation, Y.C. and X.L.; formal analysis, Y.C. and X.L.; investigation, Y.C. and X.L.; resources, Y.C. and X.L.; data curation, Y.C. and X.L.; writing—original draft preparation, Y.C.; writing—review and editing, X.L. and J.W.; visualization, J.W.; supervision, J.W.; project administration, J.W.; funding acquisition, J.W. All authors have read and agreed to the published version of the manuscript.

Funding

This research was funded by National Natural Science Foundation of China, grant number 91741202.

Institutional Review Board Statement

Not applicable.

Informed Consent Statement

Not applicable.

Data Availability Statement

Not applicable.

Conflicts of Interest

The authors declare no conflict of interest.

References

  1. Voitsekhovskii, B.V. Stationary detonation. Dokl. Akad. Nauk. Nauk. SSSR 1959, 129, 1254–1256. [Google Scholar]
  2. Bykovskii, F.A.; Vedernikov, E.F. Continuous detonation combustion of an annular gas-mixture layer. Combust. Explos. Shock. Waves 1996, 32, 489–491. [Google Scholar] [CrossRef]
  3. Bennewitz, J.W.; Bigler, B.R.; Ross, M.C.; Danczyk, S.A.; Hargus, W.A.; Smith, R.D. Performance of a Rotating Detonation Rocket Engine with Various Convergent Nozzles; Chamber Lengths. Energies 2021, 14, 2037. [Google Scholar] [CrossRef]
  4. Han, H.S.; Lee, E.S.; Choi, J.Y. Experimental Investigation of Detonation Propagation Modes and Thrust Performance in a Small Rotating Detonation Engine Using C2H4/O2 Propellant. Energies 2021, 14, 1381. [Google Scholar] [CrossRef]
  5. Kindracki, J.; Wacko, K.; Woźniak, P.; Siatkowski, S.; Mężyk, Ł. Influence of Gaseous Hydrogen Addition on Initiation of Rotating Detonation in Liquid Fuel-Air Mixtures. Energies 2020, 13, 5101. [Google Scholar] [CrossRef]
  6. Frolov, S.M.; Aksenov, V.S.; Ivanov, V.S.; Shamshin, I.O. Large-scale hydrogen-air continuous detonation combustor. Int. J. Hydrogen Energy 2015, 40, 1616–1623. [Google Scholar] [CrossRef]
  7. Kindracki, J.; Wolański, P.; Gut, Z. Experimental research on the rotating detonation in gaseous fuels–oxygen mixtures. Shock. Waves 2011, 21, 75–84. [Google Scholar] [CrossRef] [Green Version]
  8. Anand, V.; St George, A.; Driscoll, R.; Gutmark, E.J. Characterization of Instabilities in a Rotating Detonation Combustor. Int. J. Hydrogen Energy 2015, 40, 16649–16659. [Google Scholar] [CrossRef]
  9. Chacon, F.; Gamba, M. Detonation Wave Dynamics in a Rotating Detonation Engine. In Proceedings of the AIAA Scitech 2019 Forum, San Diego, CA, USA, 7–11 January 2019. [Google Scholar] [CrossRef]
  10. Bluemner, R.; Bohon, M.D.; Paschereit, C.O.; Gutmark, E.J. Counter-rotating wave mode transition dynamics in an RDC. Int. J. Hydrogen Energy 2019, 44, 7628–7641. [Google Scholar] [CrossRef]
  11. Fotia, M.L.; Schauer, F.; Kaemming, T.; Hoke, J. Experimental Study of the Performance of a Rotating Detonation Engine with Nozzle. J. Propuls. Power 2016, 32, 674–681. [Google Scholar] [CrossRef]
  12. Ma, Z.; Zhang, S.; Luan, M.; Yao, S.; Xia, Z.; Wang, J. Experimental research on ignition, quenching, reinitiation and the stabilization process in rotating detonation engine. Int. J. Hydrogen Energy 2018, 43, 18521–18529. [Google Scholar] [CrossRef]
  13. Ma, Z.; Zhang, S.; Luan, M.; Wang, J. Experimental investigation on delay time phenomenon in rotating detonation engine. Aerosp. Sci. Technol. 2019, 88, 395–404. [Google Scholar] [CrossRef]
  14. Wang, C.; Liu, W.; Liu, S.; Jiang, L.; Lin, Z. Experimental investigation on detonation combustion patterns of hydrogen/vitiated air within annular combustor. Exp. Therm. Fluid Sci. 2015, 66, 269–278. [Google Scholar] [CrossRef]
  15. Chacon, F.; Gamba, M. Study of Parasitic Combustion in an Optically Accessible Continuous Wave Rotating Detonation Engine. In Proceedings of the AIAA Scitech 2019 Forum, San Diego, CA, USA, 7–11 January 2019. [Google Scholar] [CrossRef]
  16. Rankin, B.A.; Richardson, D.R.; Caswell, A.W.; Naples, A.G.; Hoke, J.L.; Schauer, F.R. Chemiluminescence imaging of an optically accessible non-premixed rotating detonation engine. Combust. Flame 2017, 176, 12–22. [Google Scholar] [CrossRef]
  17. Yao, S.; Ma, Z.; Zhang, S.; Luan, M.; Wang, J. Reinitiation phenomenon in hydrogen-air rotating detonation engine. Int. J. Hydrogen Energy 2017, 42, 28588–28598. [Google Scholar] [CrossRef]
  18. Yao, S.; Han, X.; Liu, Y.; Wang, J. Numerical study of rotating detonation engine with an array of injection holes. Shock. Waves 2017, 27, 467–476. [Google Scholar] [CrossRef]
  19. Uemura, Y.; Hayashi, A.K.; Asahara, M.; Tsuboi, N.; Yamada, E. Transverse wave generation mechanism in rotating detonation. Proc. Combust. Inst. 2013, 34, 1981–1989. [Google Scholar] [CrossRef]
  20. Braun, J.; Saracoglu, B.H.; Paniagua, G. Unsteady Performance of Rotating Detonation Engines with Different Exhaust Nozzles. J. Propuls. Power 2016, 33, 121–130. [Google Scholar] [CrossRef]
  21. Fujii, J.; Kumazawa, Y.; Matsuo, A.; Nakagami, S.; Matsuoka, K.; Kasahara, J. Numerical investigation on detonation velocity in rotating detonation engine chamber. Proc. Combust. Inst. 2016, 36, 2665–2672. [Google Scholar] [CrossRef]
  22. Chen, Y.; Liu, X.; Wang, J. Influences of Separate Injectors on Rotating Detonation Engines. In Proceedings of the 2018 Joint Propulsion Conference, Cincinnati, OH, USA, 9–11 July 2018. [Google Scholar] [CrossRef]
  23. Suchocki, J.A.; Yu, S.J.; Hoke, J.L.; Naples, A.G.; Schauer, F.R.; Russo, R. Rotating detonation engine operation. In Proceedings of the 50th AIAA Aerospace Sciences Meeting including the New Horizons Forum and Aerospace Exposition, Nashville, TN, USA, 9–12 January 2012. [Google Scholar]
  24. Batista, A.; Ross, M.C.; Lietz, C.; Hargus, W.A. Descending Modal Transition Dynamics in a Large Eddy Simulation of a Rotating Detonation Rocket Engine. Energies 2021, 14, 3387. [Google Scholar] [CrossRef]
  25. Oran, E.S.; James, W.W., Jr.; Stefaniw, E.I.; Lefebvre, M.H., Jr.; John, D.A. A numerical study of a two-dimensional H2-O2-Ar detonation using a detailed chemical reaction model. Combust. Flame 1998, 113, 147–163. [Google Scholar] [CrossRef]
  26. Korobeinikov, V.P.; Levin, V.A.; Markov, V.V.; Chernyi, G.G. Propagation of blast wave in a combustion gas. Astronaut. Acta 1972, 17, 529–537. [Google Scholar]
  27. Taki, S.; Fujiwara, T. Numerical analysis of two-dimensional nonsteady detonation. AIAA J. 1978, 16, 73–77. [Google Scholar] [CrossRef]
  28. Gamezo, V.N.; Desbordes, D.; Oran, E.S. Formation and evolution of two-dimensional cellular detonations. Combust Flame 1999, 116, 154–165. [Google Scholar] [CrossRef]
  29. Burr, J.R.; Yu, K.H. Detonation Reignition within a Rotating Detonation Engine. In Proceedings of the 54th AIAA Aerospace Sciences Meeting, San Diego, CA, USA, 4–8 January 2016. [Google Scholar]
  30. Paterson, S. The Reflection of a Plane Shock Wave at a Gaseous Interface. Proc. Phys. Soc. 1948, 61, 119–121. [Google Scholar] [CrossRef]
  31. Wang, Y.; Wang, J.; Li, Y.S.; Li, Y. Induction for multiple rotating detonation waves in the hydrogen–oxygen mixture with tangential flow. Int. J. Hydrogen Energy 2014, 39, 11792–11797. [Google Scholar] [CrossRef]
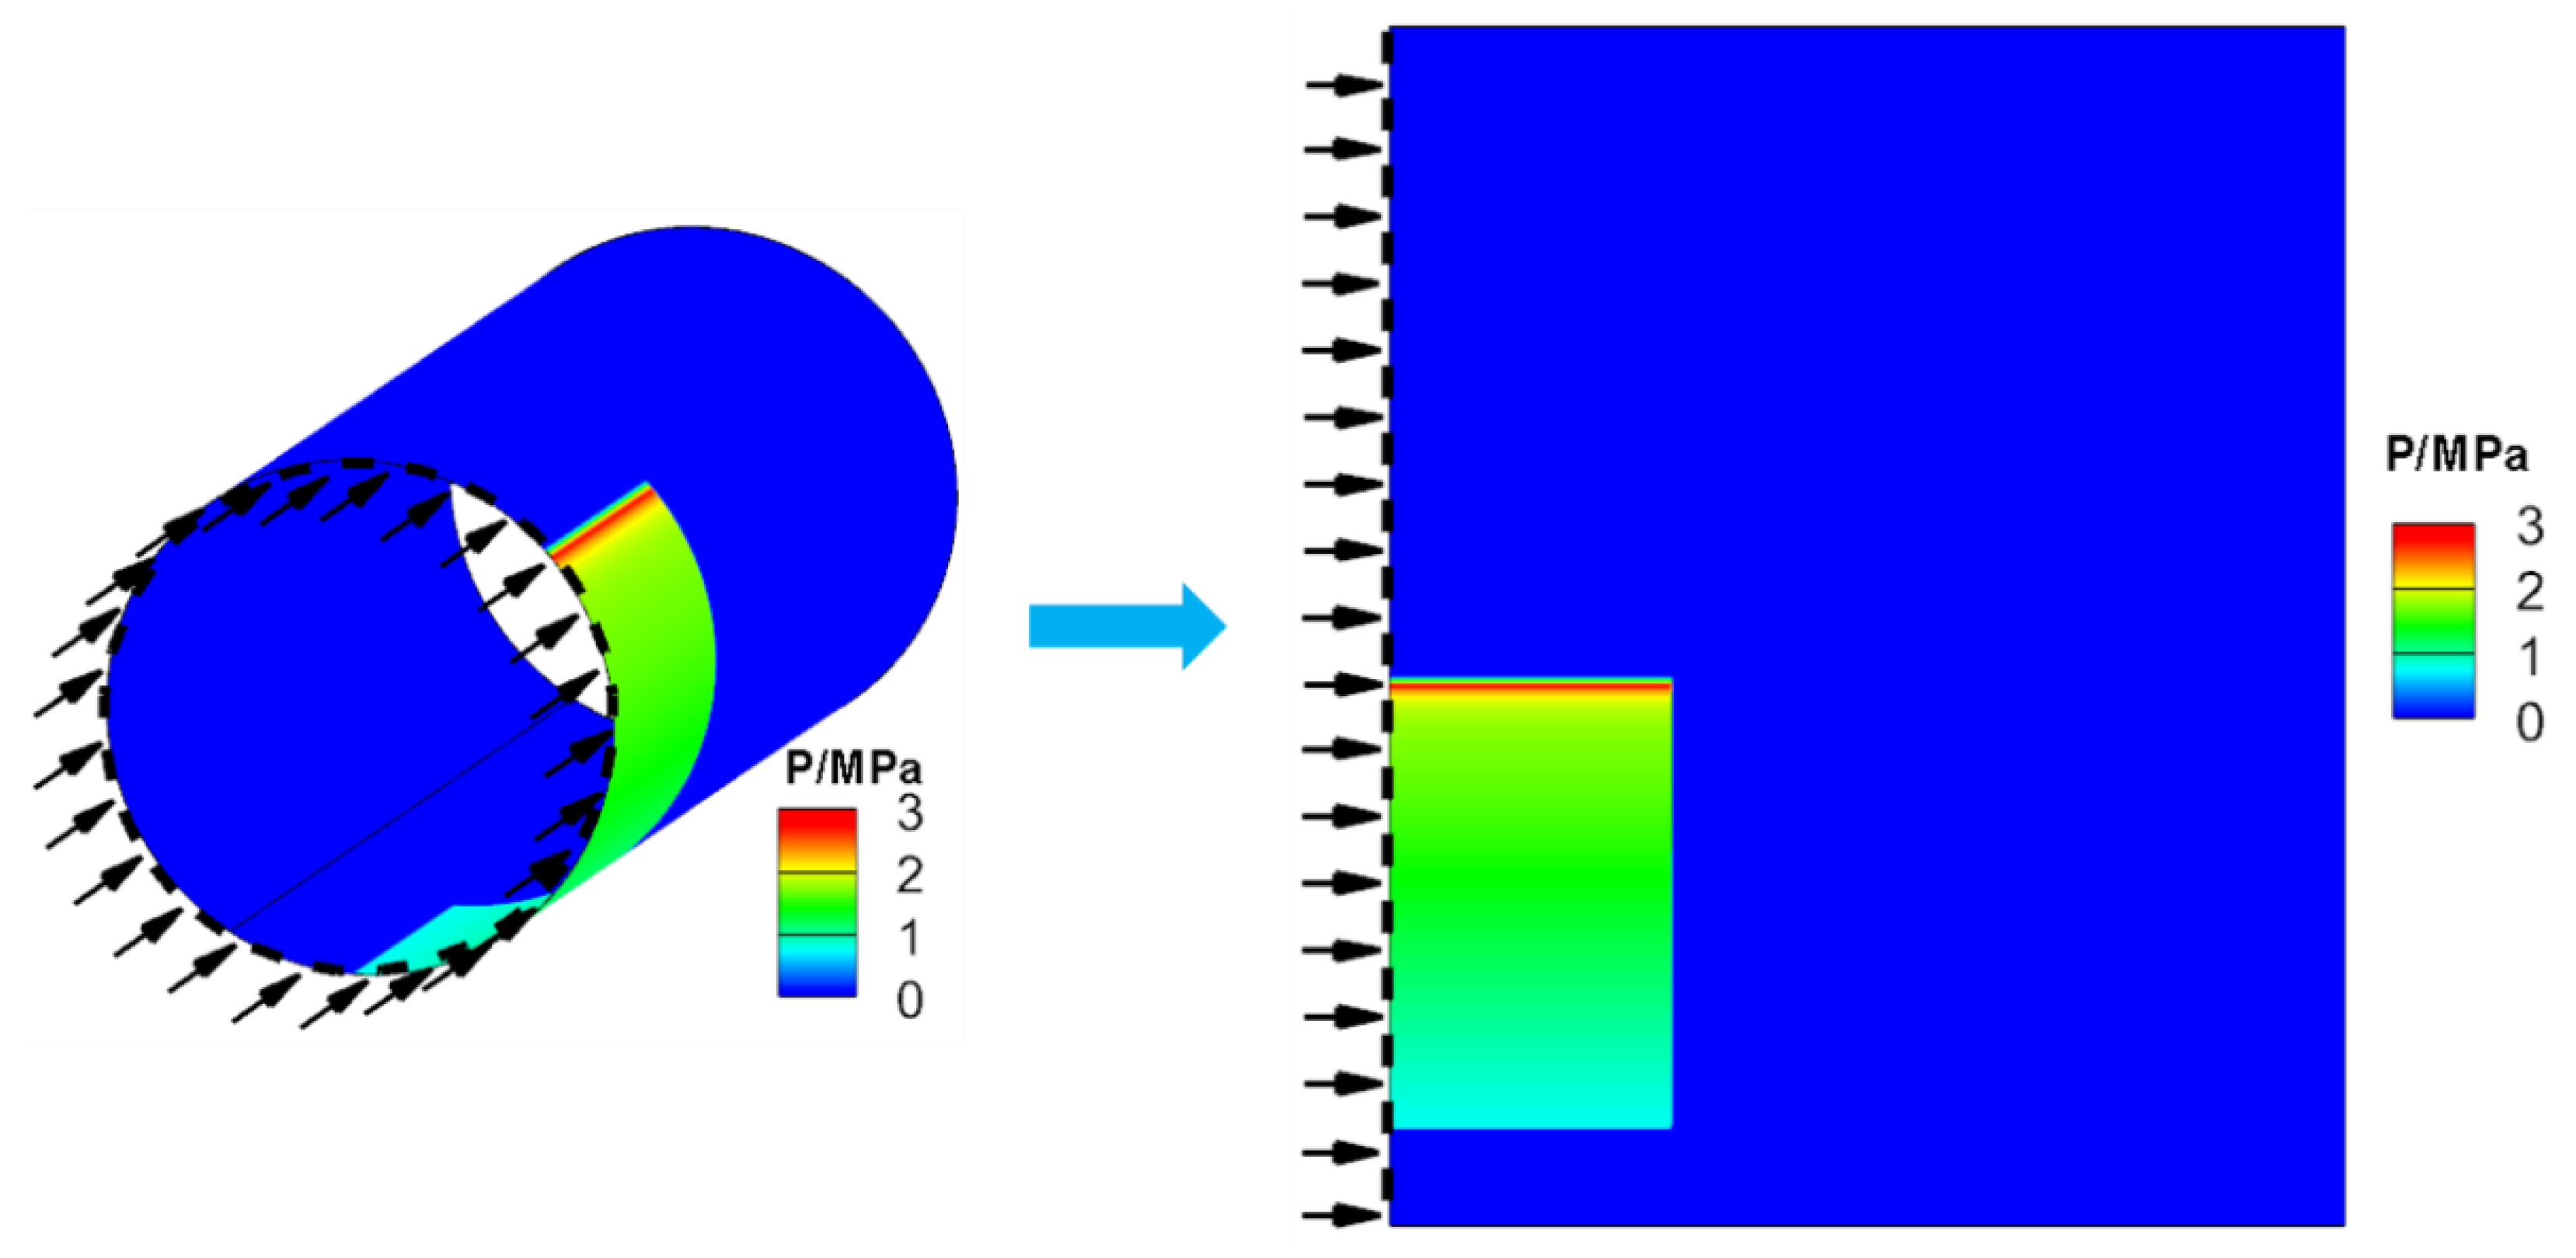
Figure 1. Sketch for the simulation region.
Energies 14 08296 g001
Figure 2. Sketch for the simulation region [22].
Energies 14 08296 g002
Figure 3. Pressure curves of different grid sizes for one-dimensional detonation tube problem. Time t = 120 μs. (a) Whole figure. (b) Local figure.
Energies 14 08296 g003
Figure 4. Pressure contours and temperature contours with different grid size. (a) 0.157 mm. (b) 0.0785 mm.
Energies 14 08296 g004
Figure 5. Pressure gradient magnitude contour for two collisions. Regions surrounded by black lines represent fresh gas regions.
Energies 14 08296 g005
Figure 6. SDT after passing through isolated fresh gas region. (a) before SDT; (b) after SDT.
Energies 14 08296 g006
Figure 7. Sketch for the interaction between shock wave and contact surface.
Energies 14 08296 g007
Figure 8. Detailed progress for SDT. (a) 11 μs to 12 μs; (b) 24 μs to 25 μs; (c) 33 μs to 34 μs.
Energies 14 08296 g008
Figure 9. Distance for SDT varies with temperature.
Energies 14 08296 g009
Figure 10. Pressure gradient magnitude contours. (a) 137 μs; (b) 155 μs; (c) 160 μs; (d) 230 μs. Regions surrounded by black lines represent fresh gas regions.
Energies 14 08296 g010
Figure 11. Pressure gradient magnitude contours. (a) 296 μs; (b) 303 μs; (c) 309 μs; (d) 321 μs. Regions surrounded by black lines represent fresh gas regions.
Energies 14 08296 g011
Figure 12. Pressure gradient magnitude contours. (a) 13 μs; (b) 22 μs; (c) 121 μs; (d) 504 μs. Regions surrounded by black lines represent fresh gas regions.
Energies 14 08296 g012
Publisher’s Note: MDPI stays neutral with regard to jurisdictional claims in published maps and institutional affiliations.