1. Introduction
In recent years, greenhouse gas (GHG) emissions from the shipping sector have concerned the international community. In 2018, the United Nations’ International Maritime Organization (IMO) agreed to reduce their GHG emissions of global shipping by 50% before 2050 compared to their levels in 2008 [
1].
Even the Paris Agreement and the Kyoto Protocol, which did not directly set any objectives to reduce emissions, have brought up shipping emissions in discussions [
2].
Figure 1 shows a comparison between the CO
2 emissions for the years of 2018 [
3] and 2015 [
4]. Considering that Germany is part of the European Union, this ranking includes the fifteen largest emitters in the world, where the shipping sector stands in the eighth place. Furthermore, this sector also had the seventh-largest increase (more than 6%) from 2015 to 2018. Regarding the fact that the emissions from countries are covered and analyzed by the agreements mentioned, this work aims at analyzing possible solutions to reduce the CO
2 emissions of ships.
Figure 1 shows a comparison between the CO
2 emissions for the years of 2018 [
3] and 2015 [
4], of the fifteen largest emitters in the world. Since Germany’s emission are already included in those of the European Union, the shipping sector alone is the eighth largest CO
2 emitter in the world. Furthermore, the sector also had the seventh largest increase (more than 6%) from 2015 to 2018. Regarding the fact that the emissions from countries are covered and analyzed by the agreements mentioned, this work aims at analyzing possible solutions to reduce the CO
2 emissions of ships.
The emission data presented in annual reports [
3,
4] show that there is still a great effort to be made regarding the reduction of GHG in the shipping sector. In this sense, the use of different hybrid technologies in ship power systems is essential to guarantee a more ecological future. There are many feasible solutions available that could be employed in shipboard power systems and potentially reduce GHG emissions: biofuels [
5], batteries [
6,
7], fuel cells [
8], and direct current (dc) distribution [
9], among others. Considering that the IMO aims at reducing the emissions related to ships, and these emissions may have a limit that when reached can implicate in taxes, the use of hybrid power systems is attractive to shipbuilders and ship companies to increase their profit by reducing their costs related to fuel and possibly avoiding paying taxes due to an excess of emissions.
Ship emission estimation methods are described in [
10,
11,
12,
13,
14]. These methods may have drawbacks based on how the emissions are measured. In [
12], it is mentioned that the more realistic approach would be to estimate emissions based on a ship’s actual speed. For ships with only main engines, the relationship between ship speed and power output of the generators is simple [
15]. When auxiliary generators, fuel cells, and batteries are considered, this relationship is much more complex. More detailed models, tools, and studies are needed to be able to more accurately measure the effects that ship power systems’ hybridization will have on the GHG emission levels. Currently, there are very few simulation and design optimization tools available for hybrid power systems in the shipping sector [
16]. General applications frequently use HOMER software for the optimal design of hybrid power grids [
17,
18,
19,
20], but HOMER can also be used for maritime applications [
7,
21,
22,
23,
24,
25]. As seen in previous works [
7,
23], HOMER can be used to estimate the CO
2 emissions of ships. Moreover, the main and auxiliary engines’ load factors will be set according to the software’s optimal energy-dispatch algorithm.
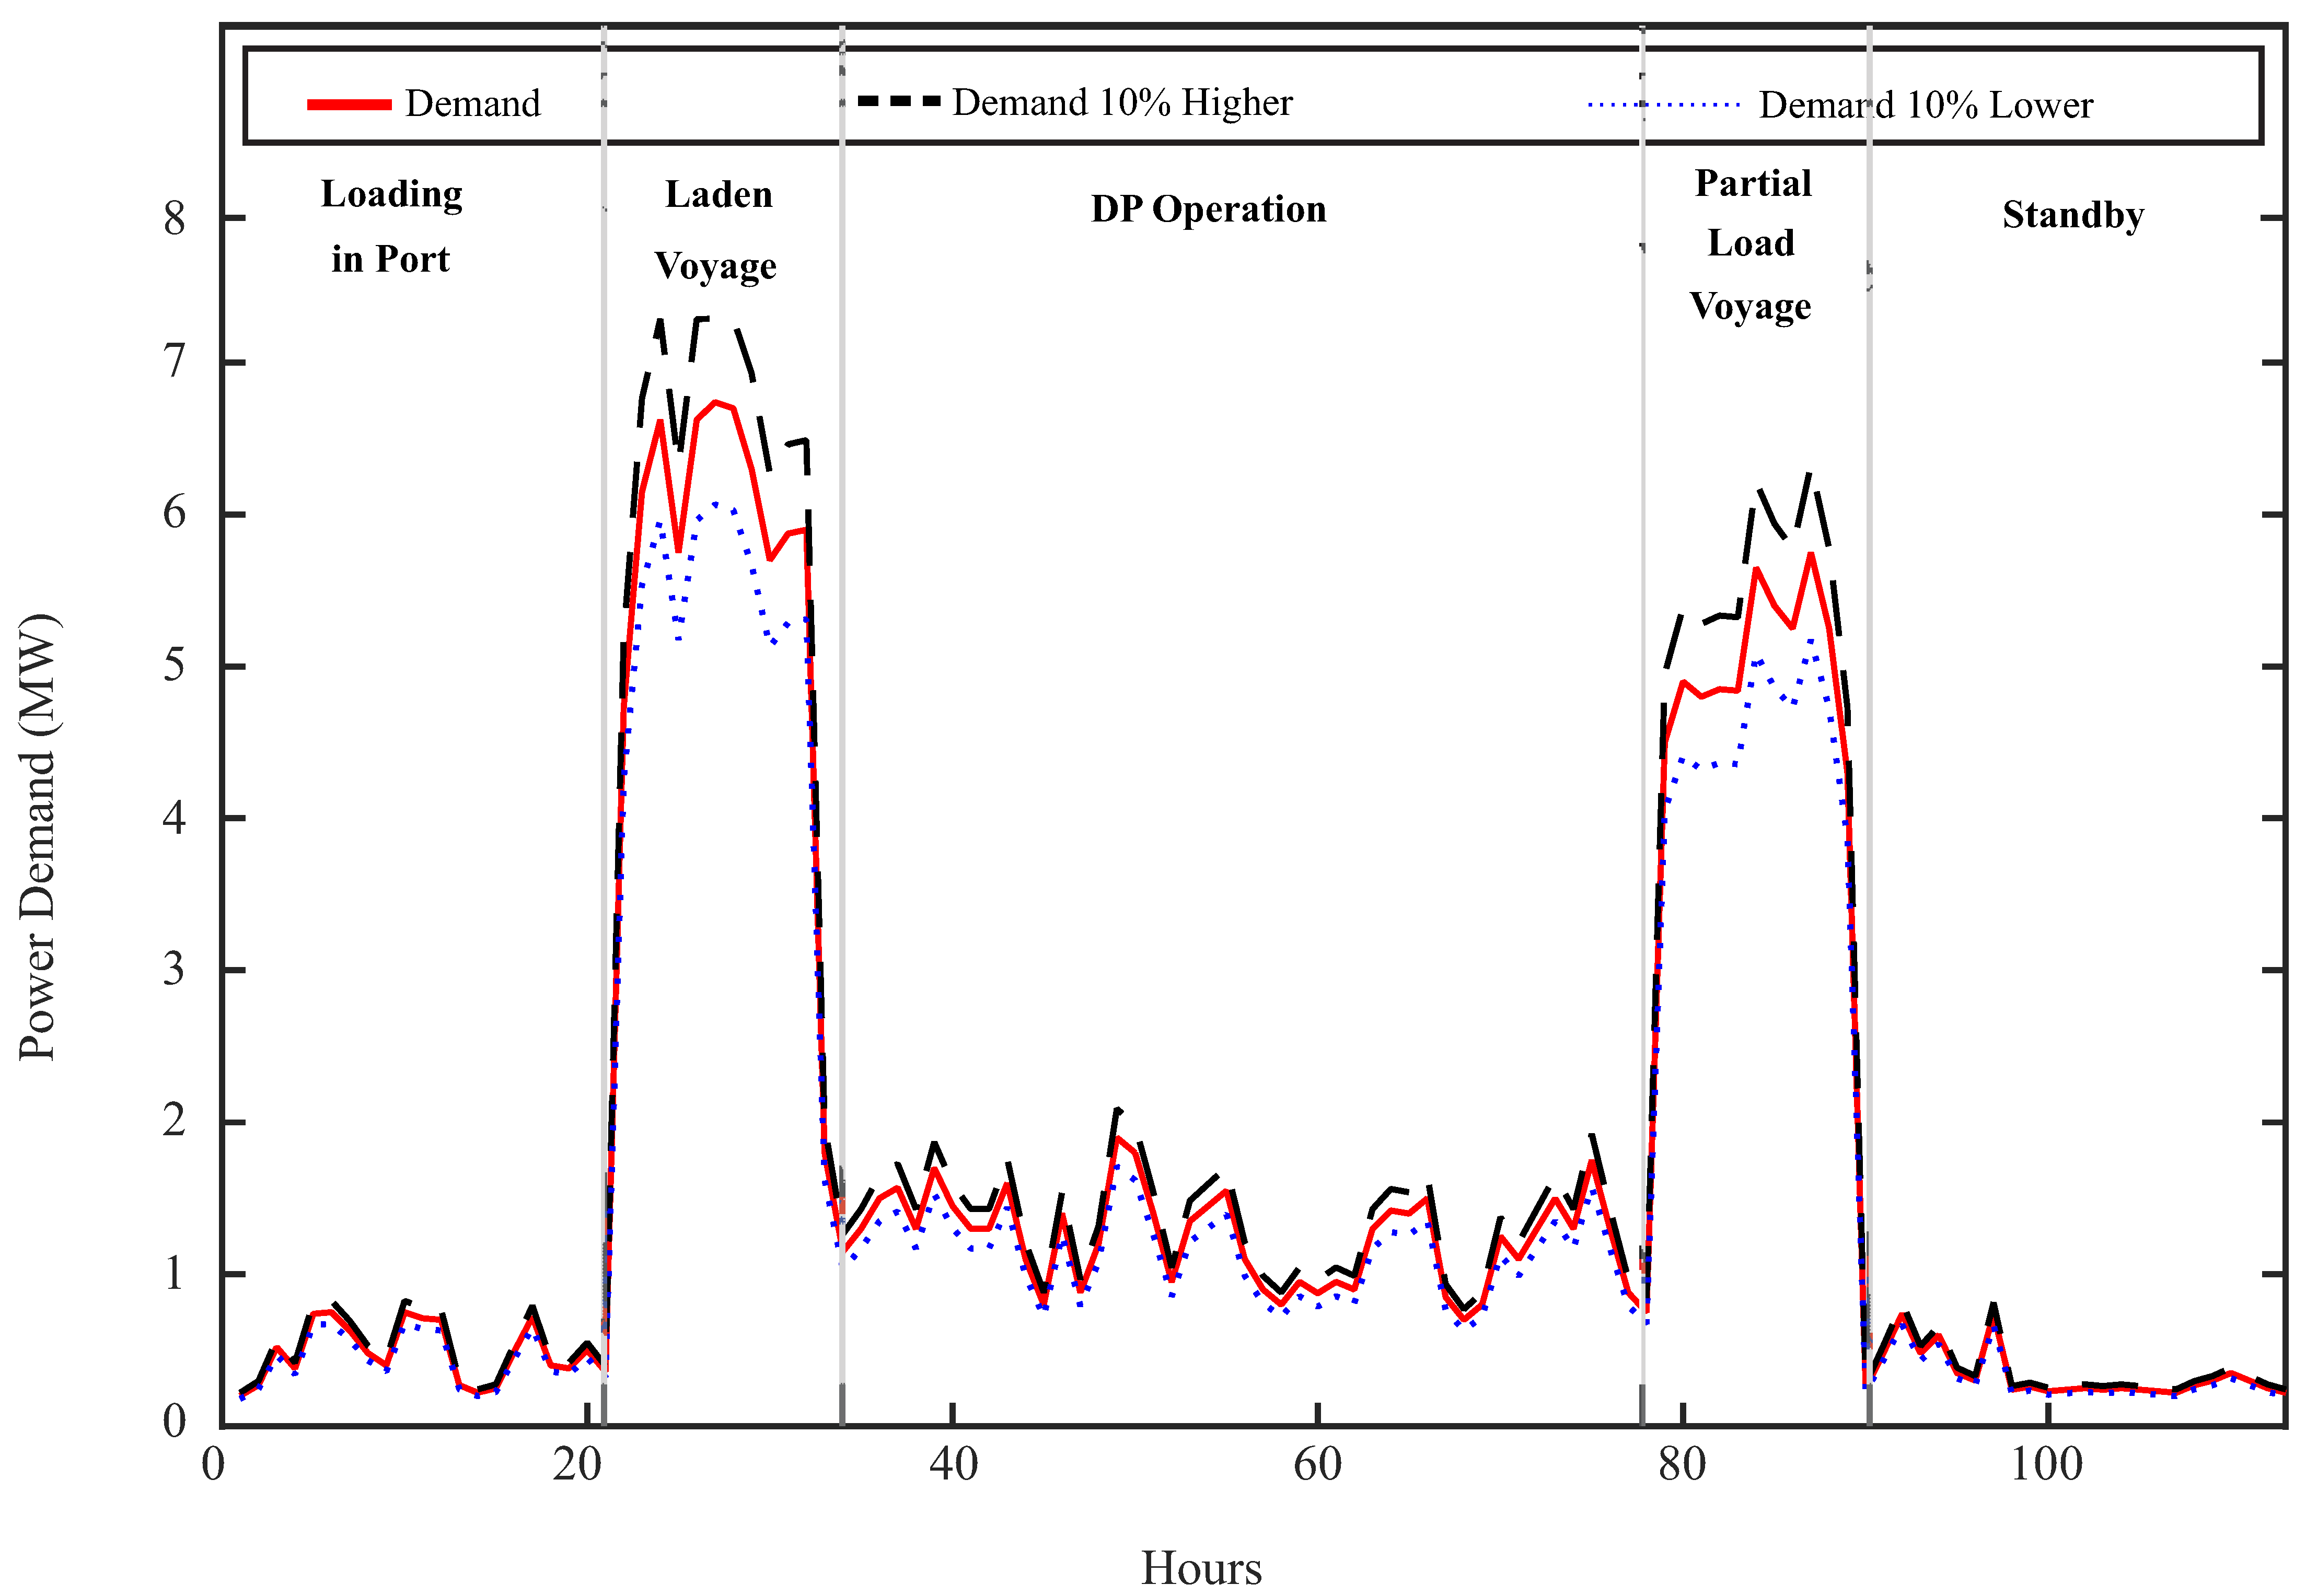
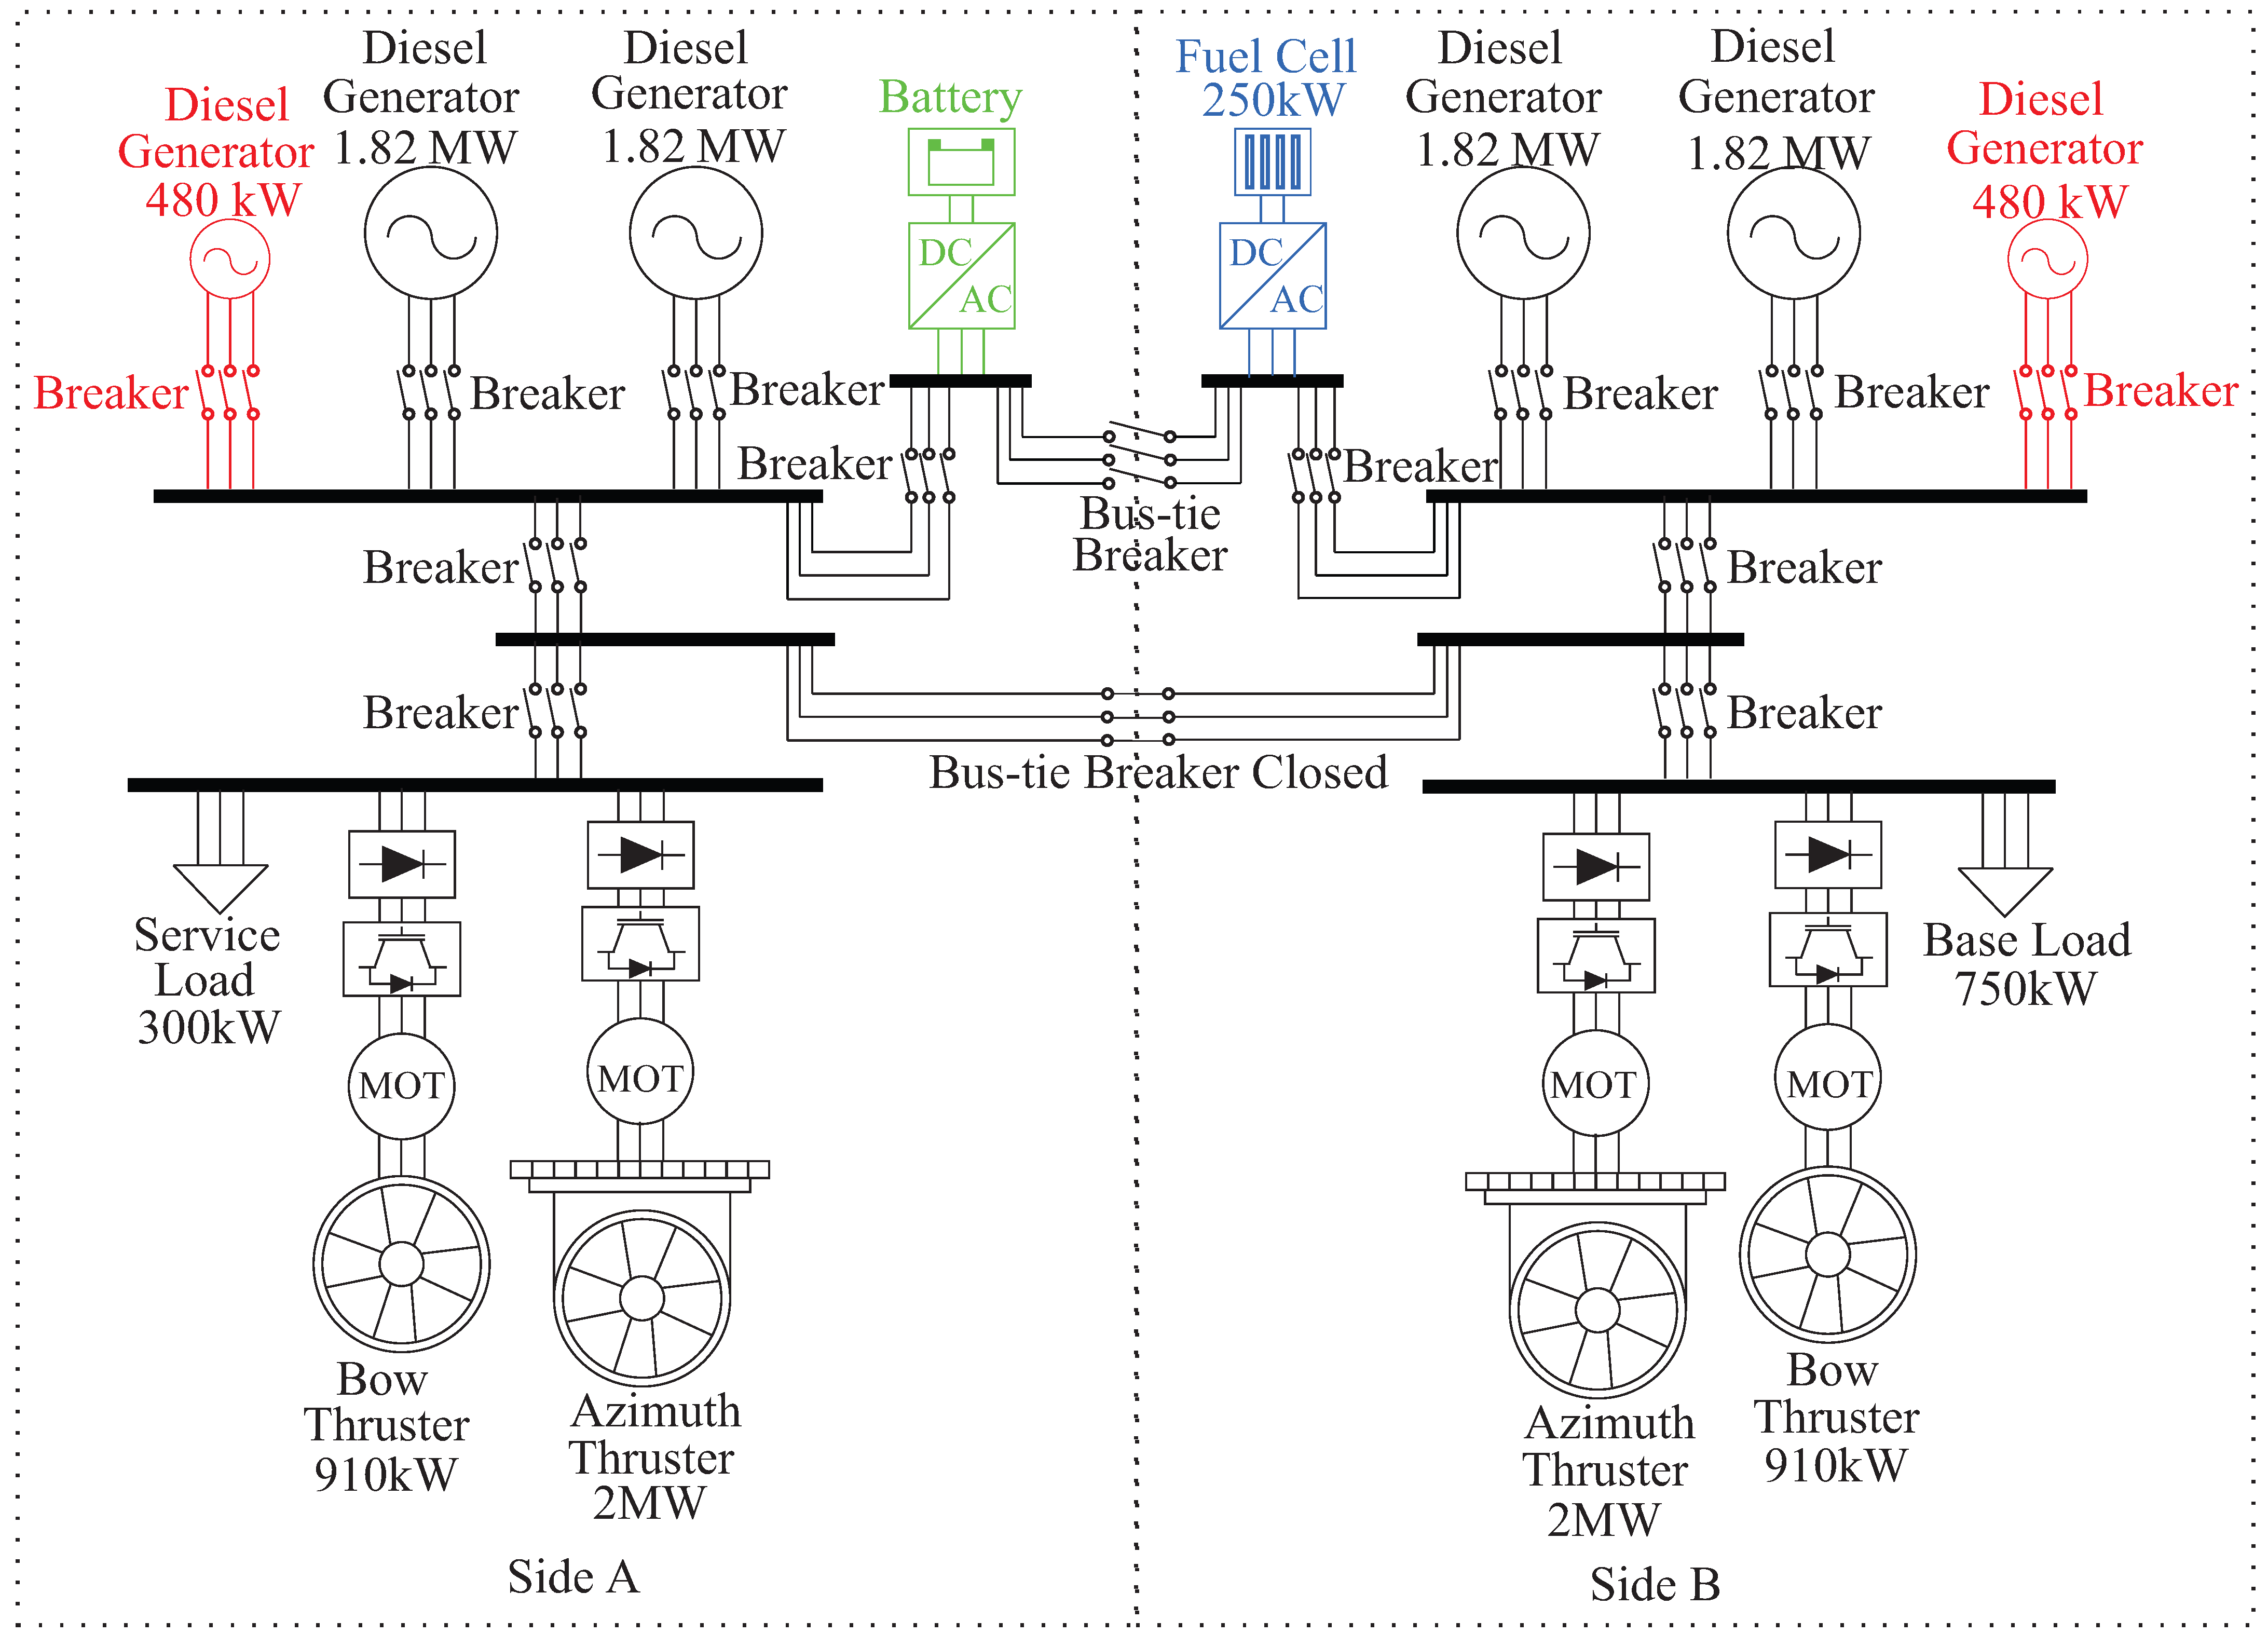
As the main objective, this paper selects an optimal configuration of a ship’s power system, considering the use of fuel cells and batteries, that would achieve the lowest CO2 emissions, also taking into consideration the number of battery cycles. HOMER PRO is used to calculate the emissions and the battery cycles of various configurations and three different levels of demand. Then, the best configuration that can be composed of fuel cells, batteries, and main and auxiliary generators is found based on these criteria. The ship analyzed in this work is a platform supply vessel (PSV). One main concern is that the solutions applied to ship power systems usually require a new ship to achieve the reductions estimated. This requires a higher amount of money and may take a long time to present benefits. For this reason, the solutions analyzed in this paper are designed for a ship’s retrofit. Therefore, this method can be used to assess if the CO2 reductions achieved can pay for the cost of installation and the loss of space required for the new equipment. Another important contribution is the sizing of the battery and hydrogen storage systems. This work sizes them for an installation in 20 ft containers commonly used in PSVs. Moreover, the proposed method performs a sensitivity analysis considering the variation of the ship’s demand curve. We considered that the PSV has a fixed scheduled routine, which means that, independent of the weather conditions, the ship must arrive on time. The variation in weather and sea condition interferes with the power demand required. When there is a rough sea with bad weather conditions, the demand will be higher. In a calm sea with good weather conditions, the same ship would require a lower demand to arrive on time.
The remaining sections of this paper are organized as follows.
Section 2 describes the power system dispatch strategy and CO
2 emissions calculation in the HOMER software.
Section 3 presents the main characteristics of the PSV under study, as well as the demand curve during a typical mission.
Section 4 presents the alternative power generation components considered in this work. In
Section 5, data on the fuel cell, diesel generator and batteries are presented together with hydrogen-storage-sizing and battery-system-sizing information.
Section 6 presents the results of the CO
2 emissions estimations. Finally,
Section 7 summarizes the main contributions of this work and presents the conclusions.
2. Dispatch Strategy and CO2 Emission Calculation
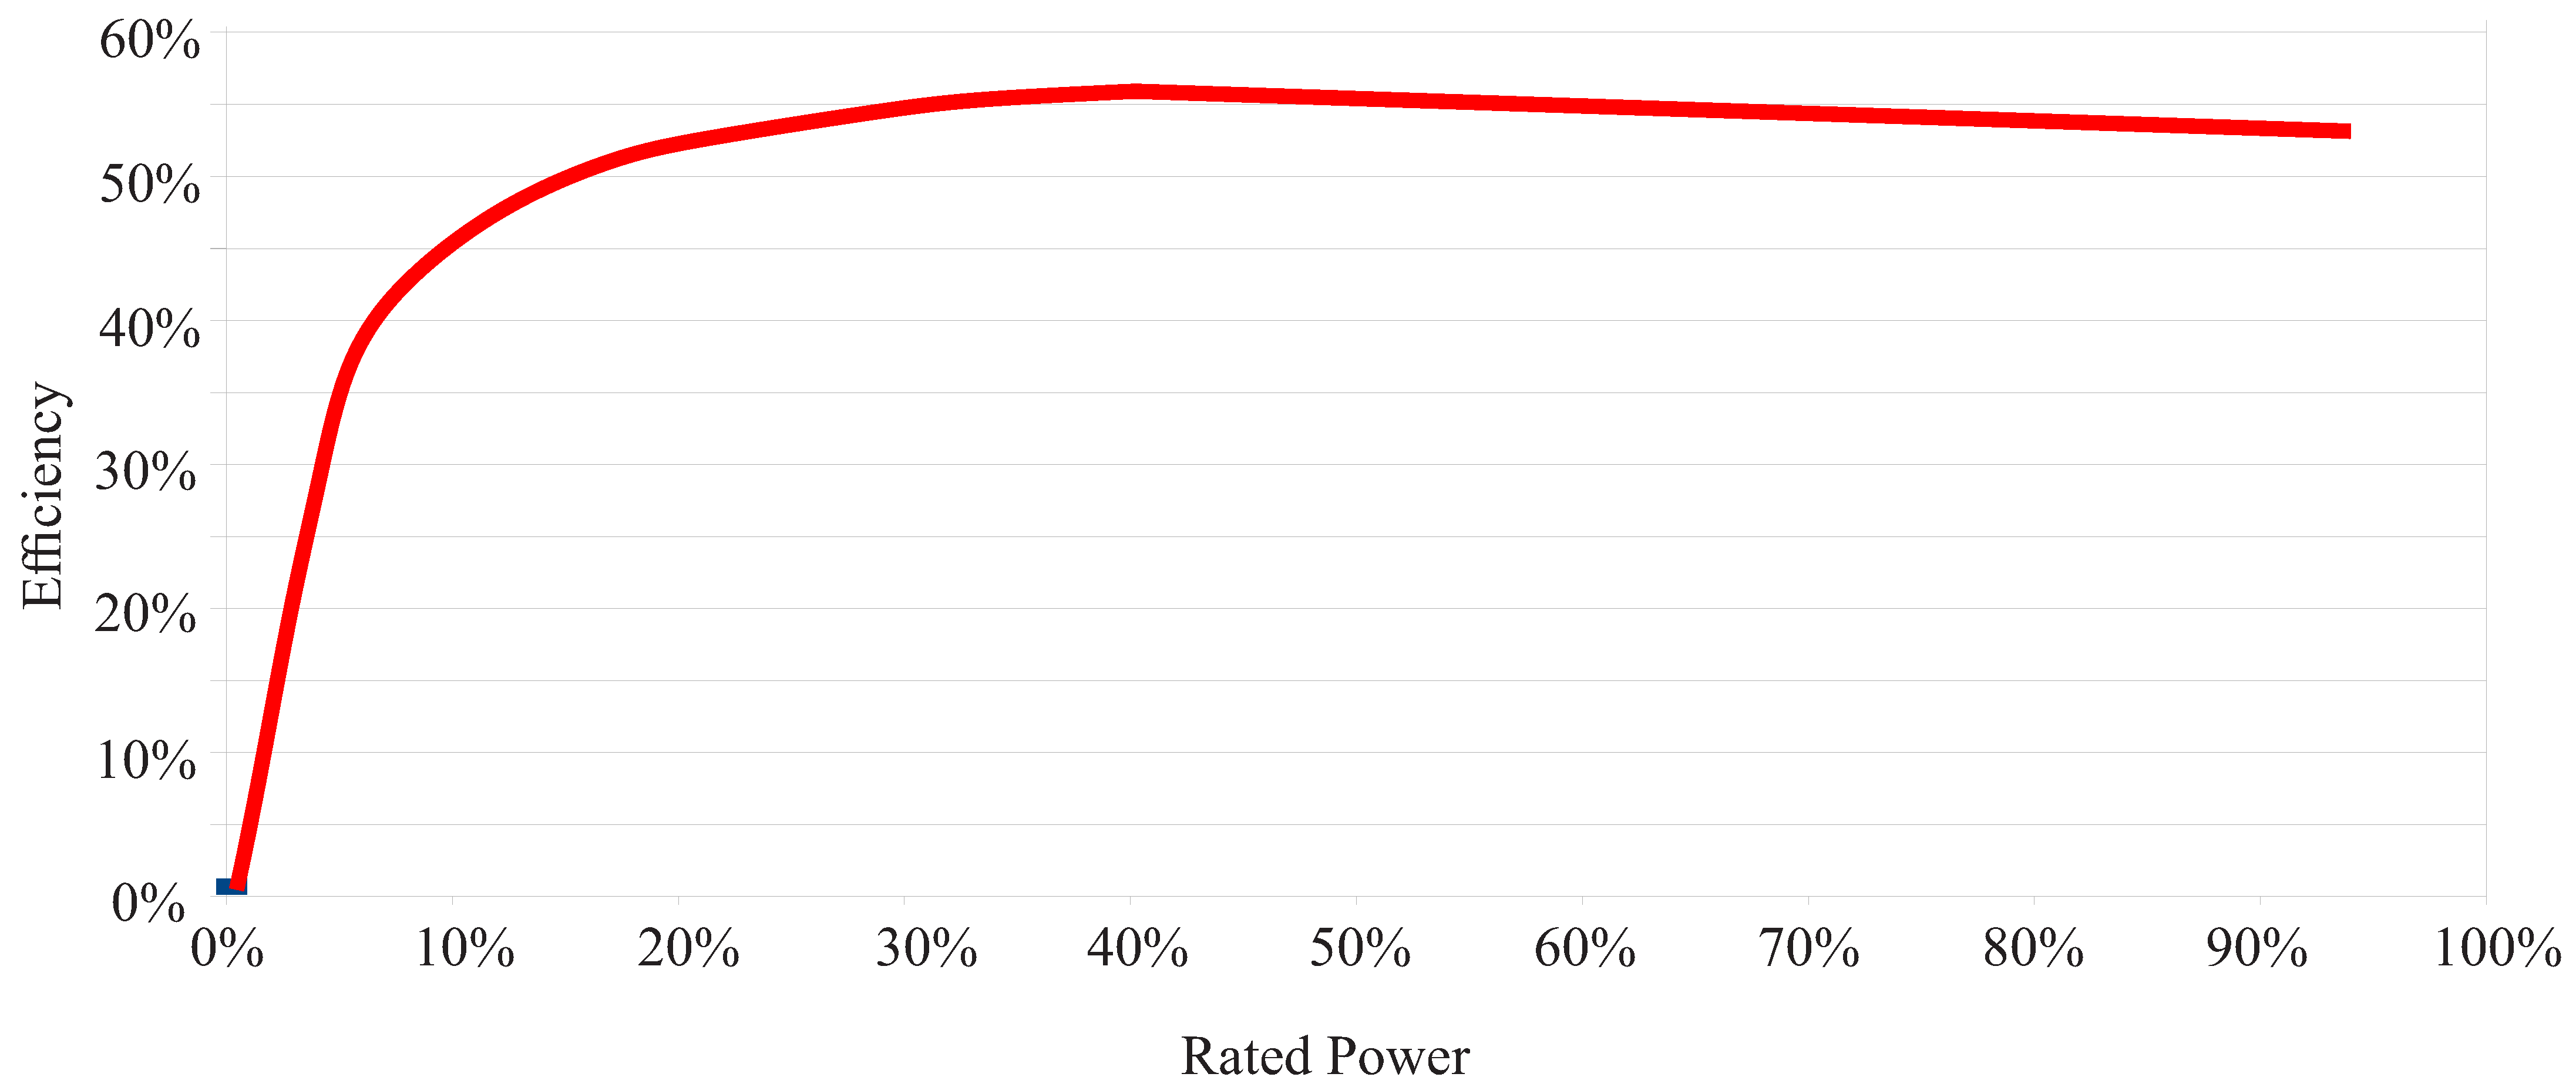
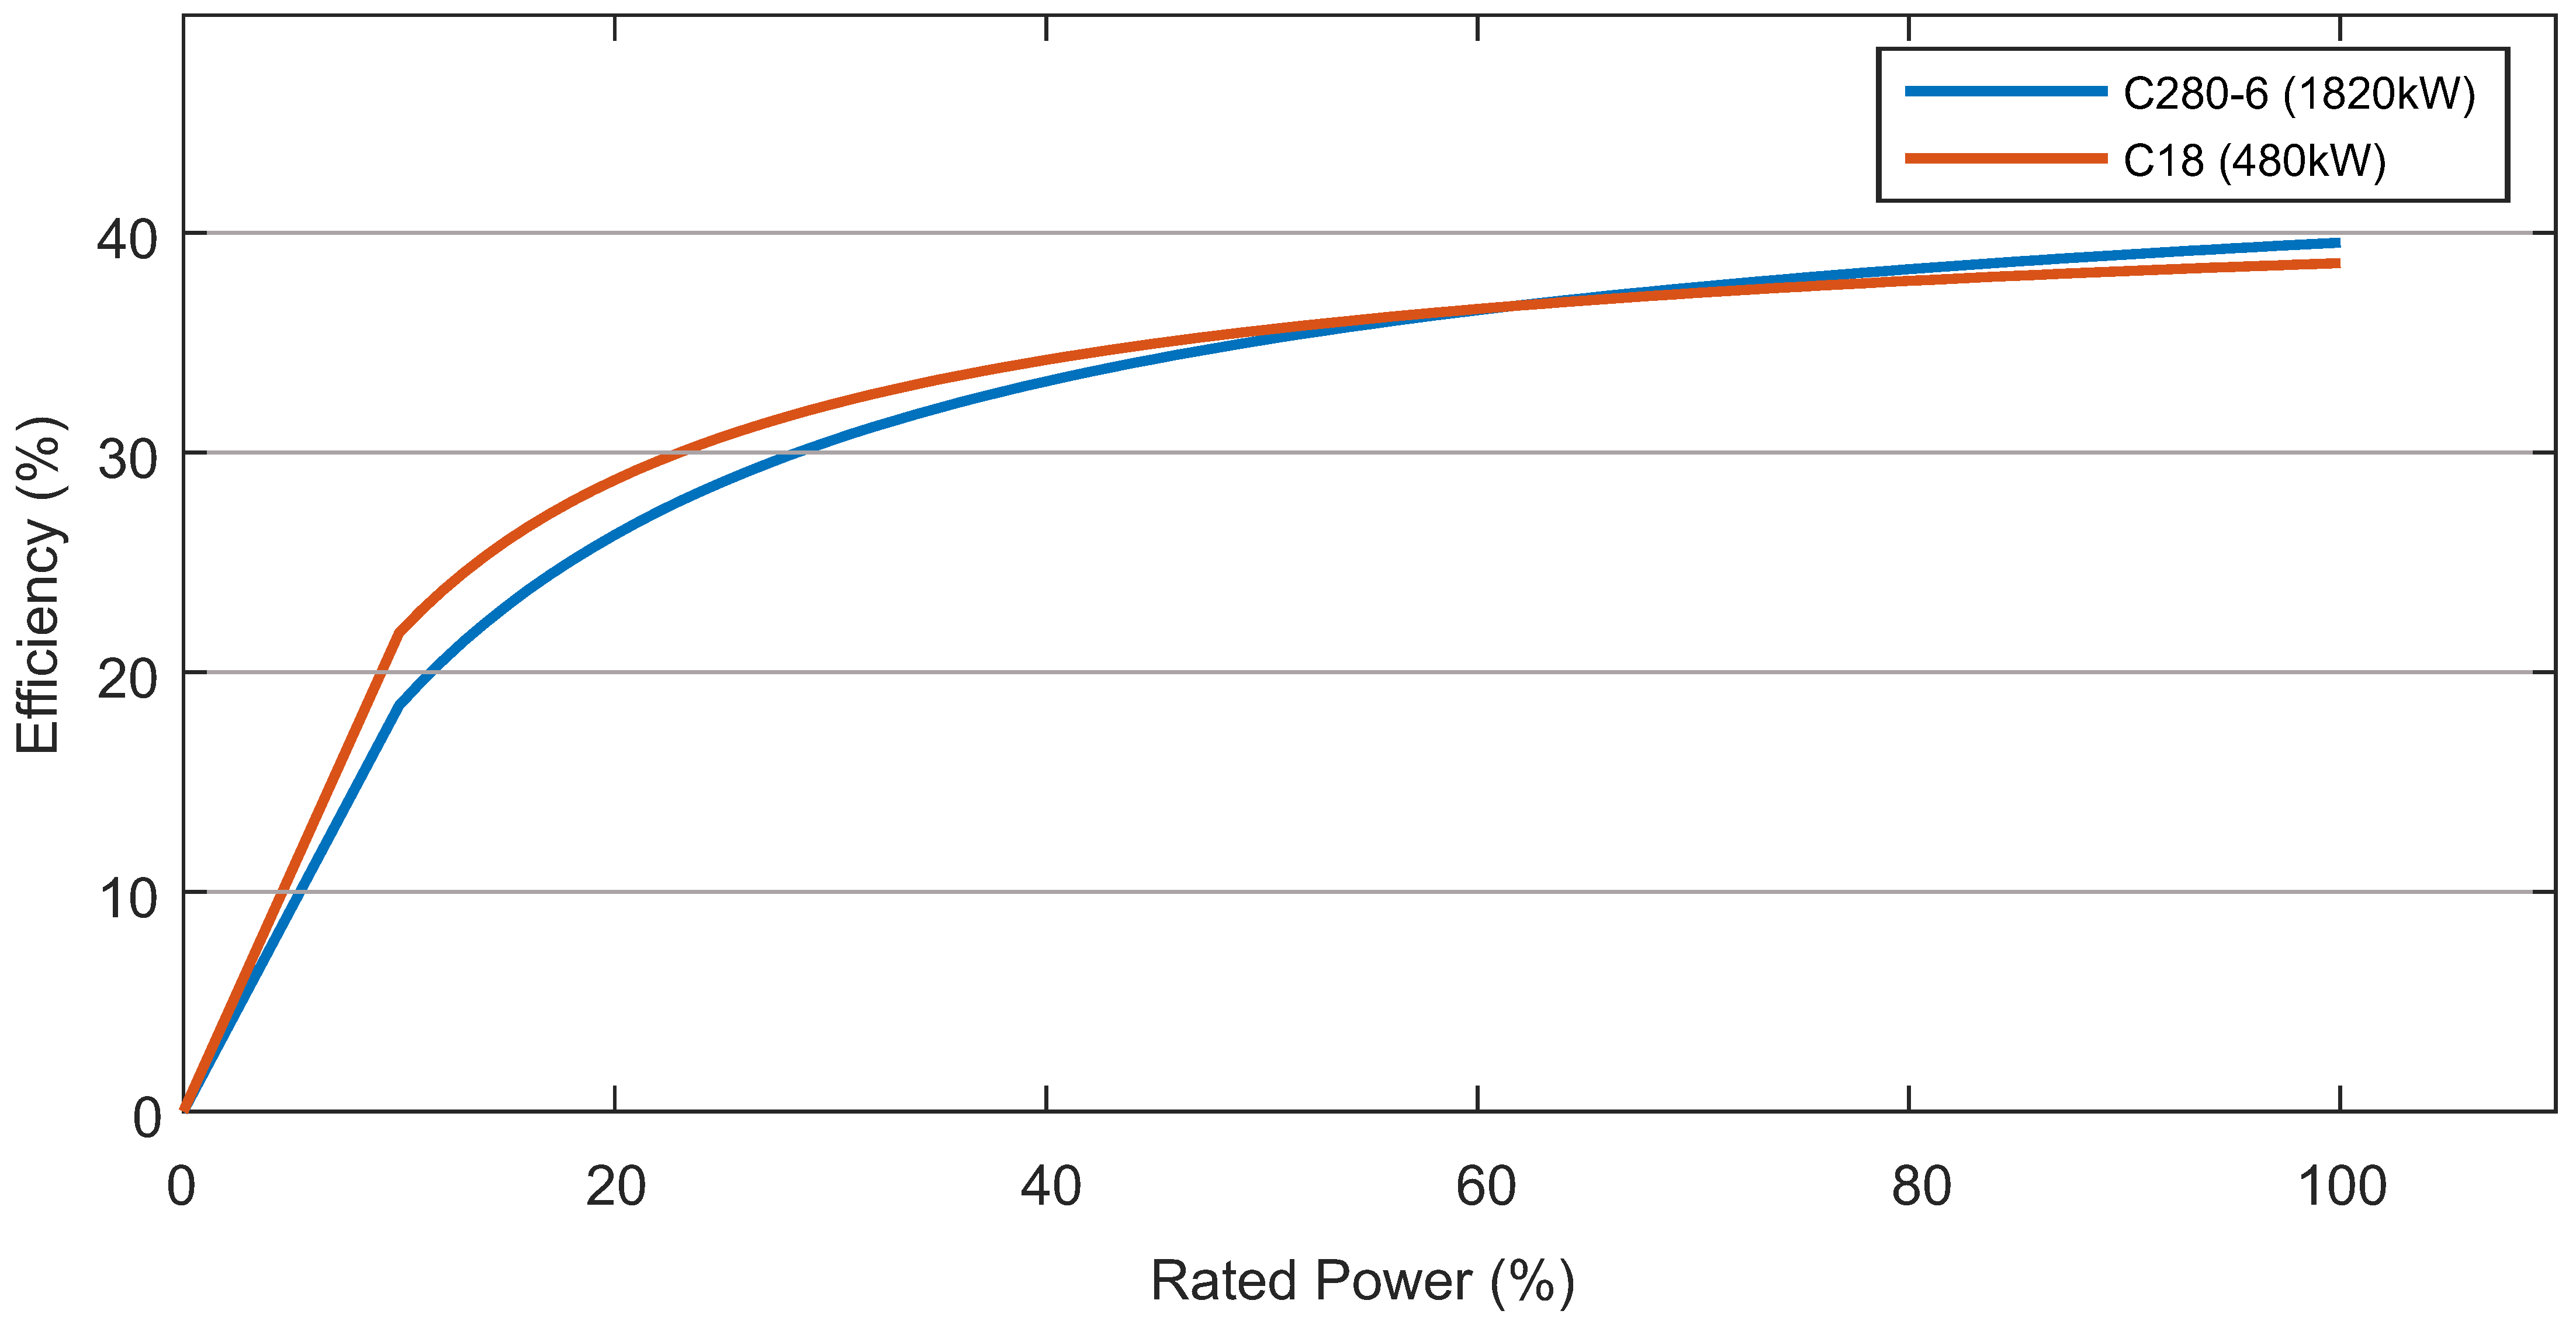
The simulations were performed with HOMER, a commercial software with a proprietary derivative-free optimization method that provides an optimal dispatch of the energy available to supply the demand. The objective function of HOMER’s optimal dispatch is the system’s net present cost, i.e., the sum of the costs of installing and operating all the system’s components over the project’s lifetime. As HOMER’s optimization is used to determine the impact that each configuration will have on the emissions, most of the costs that would have the highest impact on emissions were set to zero. Battery costs and hydrogen costs were set to zero to force HOMER to use them as much as possible. The aims to use these sources with no emissions as long as possible, in order to ensure as much emission reduction as possible, no matter the cost. Furthermore, the operations and maintenance (O&M) cost of the converters was also set to zero, and HOMER’s default diesel fuel price of 1$/L was maintained.
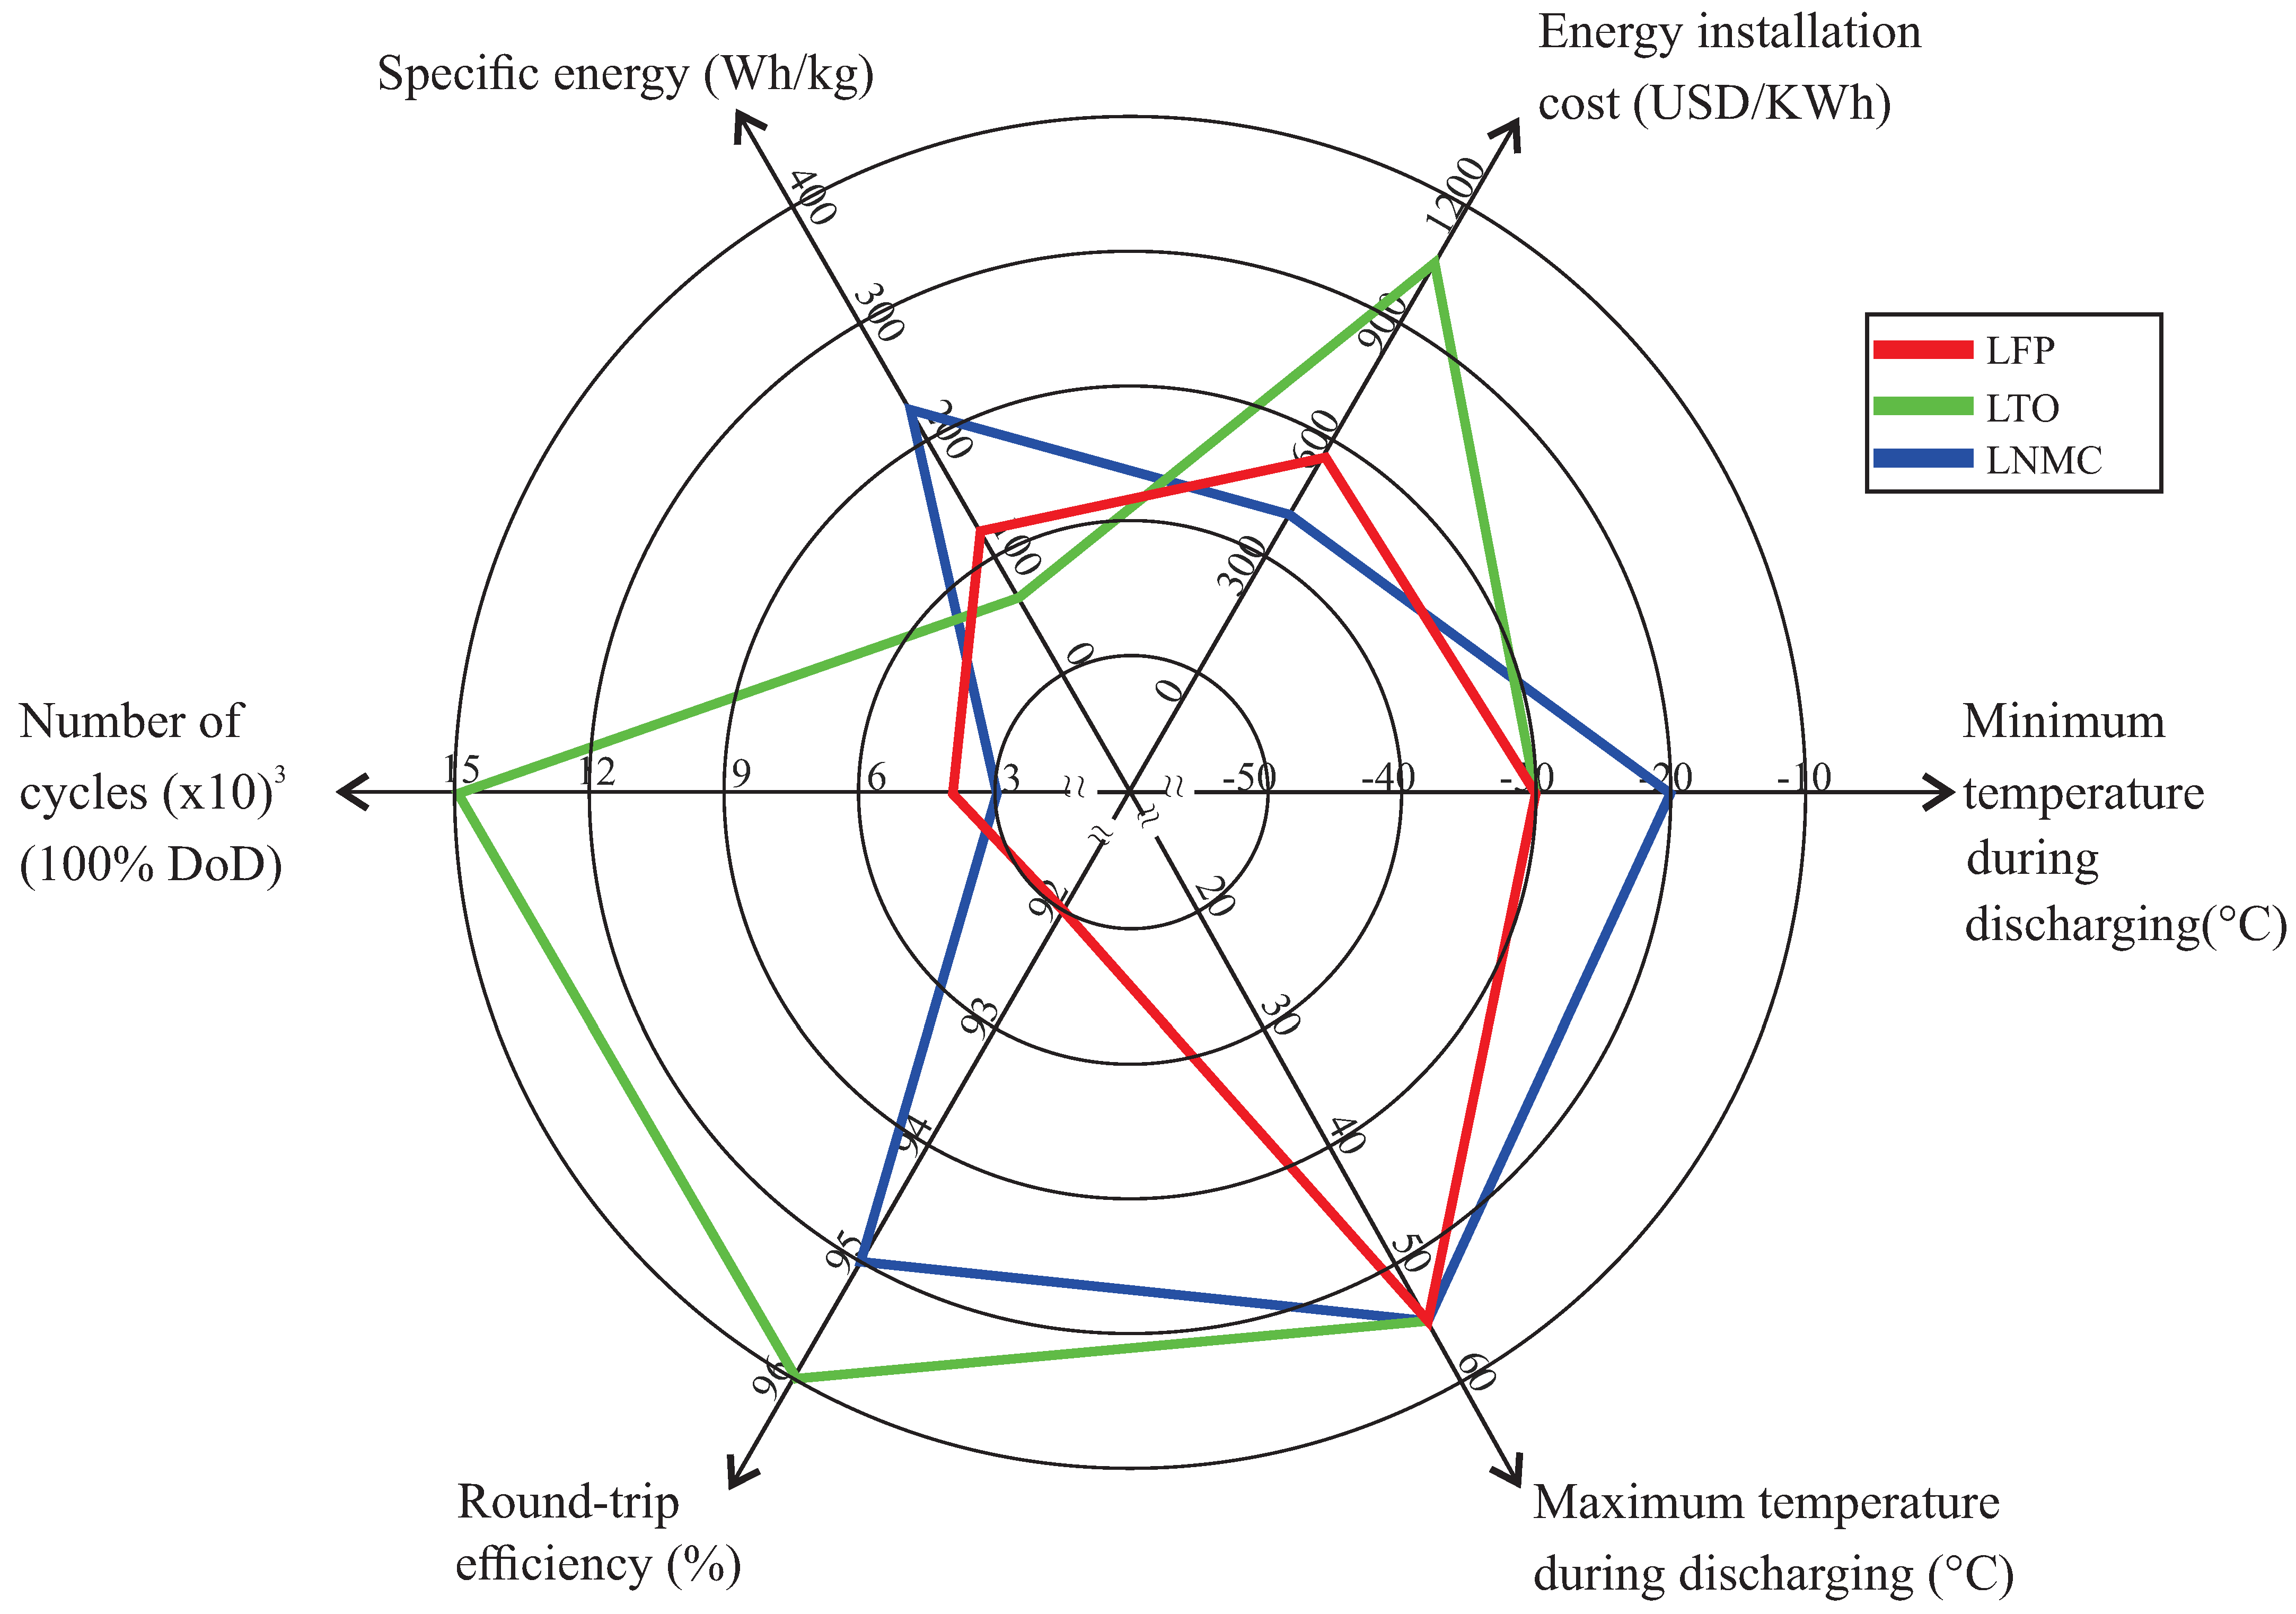
Beside the costs, HOMER has other inputs, such as fuel consumption curves for the generators, battery round-trip efficiency, converter efficiency, battery initial state of charge (SoC), minimum SoC, and the set-point SoC that is the maximum SoC allowed during the simulation. The choices of the minimum and maximum SoC values were made according to the impact that the depth of discharge (DoD) can cause in a battery’s life. The DoD is the difference between the maximum and the minimum SoC that the battery can reach during charge and discharge, respectively.
In [
26], there is a study investigating which would be the optimum DoD for a 24 kWh battery. The optimization method determined a DoD of 70.1%, considering a premise that the system would have 100% availability. In [
27], the DoD that would provide the lowest total cost for a battery installed in a round-trip electric bus route was determined through convex programming (CP).
When battery degradation is considered, the DoD estimated is 53.1%. Without the degradation, the DoD moves to 46.6%.
The optimal DoD values obtained in [
26,
27] were, respectively, 70.1% and 46.6%. Based on this variation, considering cost reduction and availability, the DoD chosen in this paper is 60%, and the maximum and minimum SoCs are set to 80% and 20%, respectively. The present study considers a new and fully charged battery at the beginning of the simulation. Therefore, from the simulation start until the moment that the battery SoC is under 80%, no charge is allowed. Moreover, the battery is not allowed to discharge more if the SoC reaches 20%. The battery dispatch is chosen according to the cycle-charging dispatch of HOMER, in which a set-point SoC is applied to the cycle-charging strategy. The value applied for this set-point is 80%, which is the same used for the maximum SoC. In this way, the SoC will always be below the set-point during the simulation, and, if in a previous time step, the battery was not feeding the primary load, in the current time step HOMER will avoid discharging the storage. During the charging cycle, a generator needs to produce enough energy to serve the primary load and charge the storage bank. When a charging cycle starts, the battery is charged until it reaches the set point state of charge. In short, when the battery starts to discharge, it does so until its SoC reaches 20%. When it starts to recharge, it does so until the SoC reaches 80%.
Since HOMER optimizes the net present cost over its lifetime, it requires yearly demands to perform the simulations. In this work, the demand lasts for only 113 h, which is the ship’s mission duration, and, thus, the yearly demand curve is filled with zeros after the 113th hour. Since HOMER requires a load to dispatch a controllable power source, generally, there is no emission in the first hour with a demand level equal to zero. An exception is when the battery is charging in the previous time-step; then, the next hour after the end of the demand can be used to assess the battery until the set-point.
The calculation of CO
2 emissions by HOMER is divided into three steps that are run internally by the software. Firstly, before the simulation, HOMER determines the emission factor of CO
2, representing the amount of CO
2 emitted in kilograms per unit of fuel consumed in liters. The user directly specifies the carbon monoxide and unburned hydrocarbons emissions factors. Then, HOMER assumes that all the carbon in the fuel that was not emitted as carbon monoxide or unburned hydrocarbons will be emitted as carbon dioxide. The default emissions factors of diesel fuel given by the HOMER software and considered in this work are shown in
Table 1. In the second step, HOMER performs the simulation and evaluates the fuel consumed. After that, in the third step, HOMER multiplies the fuel consumed by the emission factor to obtain the amount of pollutant emitted.
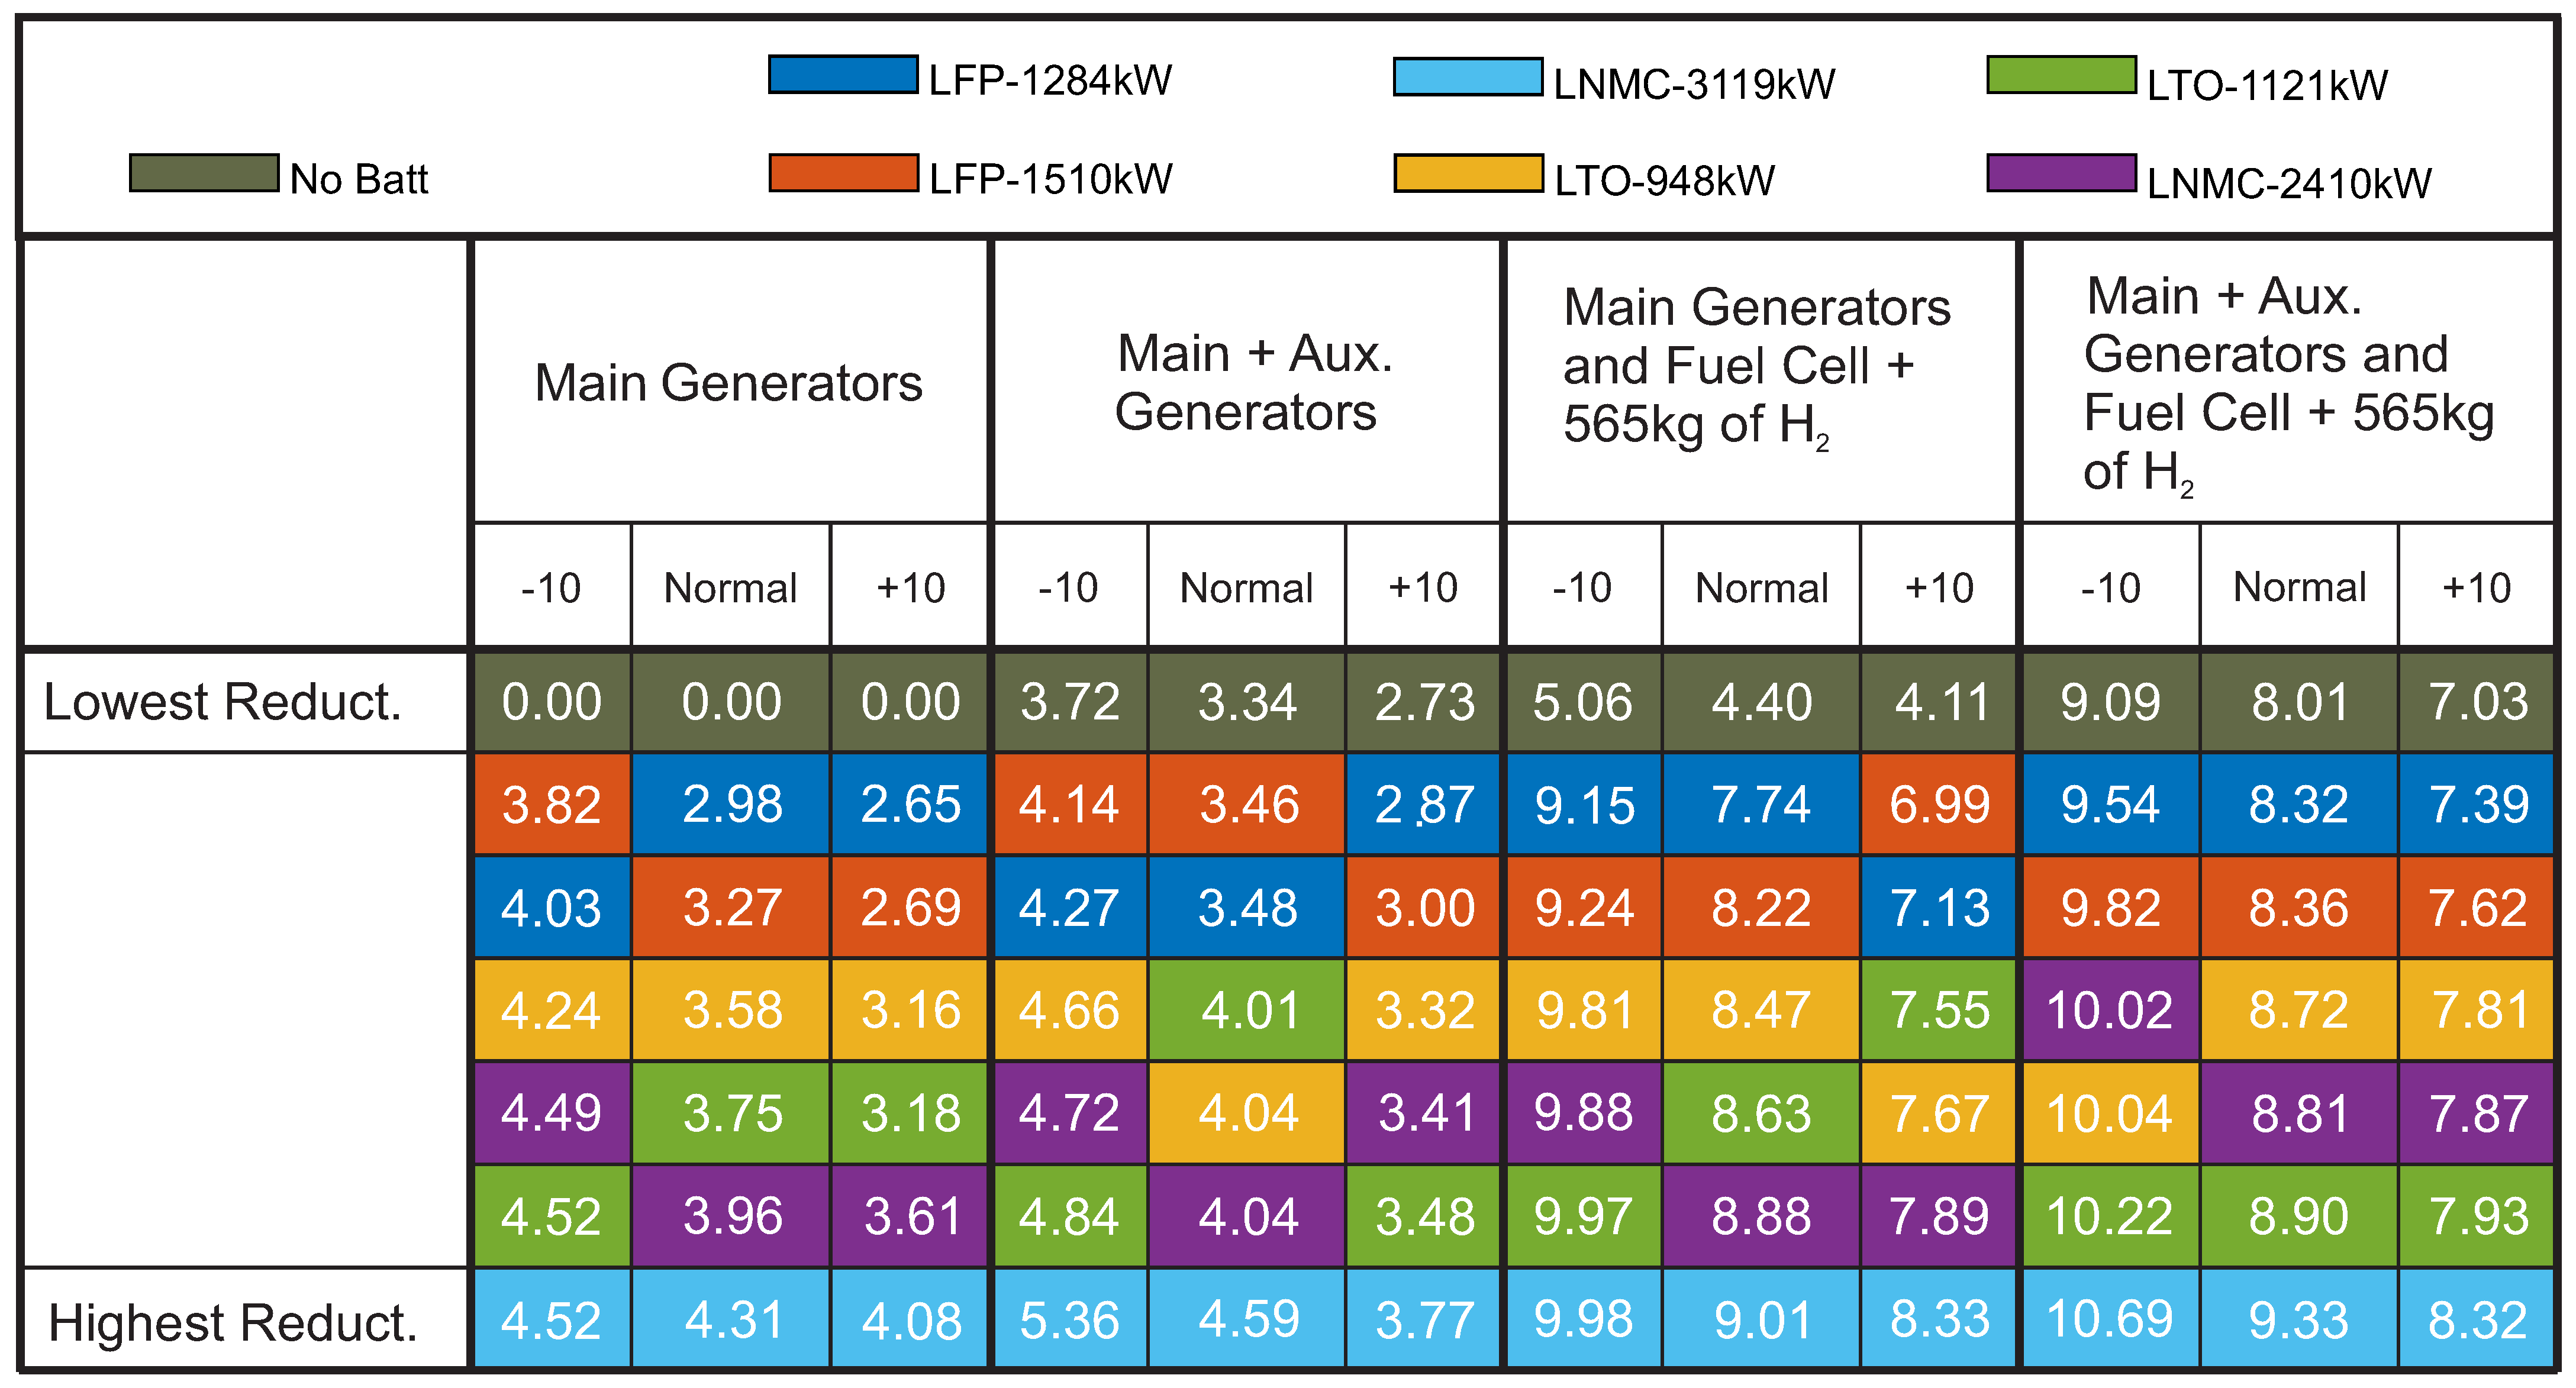
6. Results
In the following subsections, the results of the configurations analyzed are shown according to the demand level. For the following analysis, the minimum loads for main generators vary according to each configuration. For configurations including only main generators, main and auxiliary generators, main generators and PEMFC, main and auxiliary generators, and PEMFC, the minimum load set is 10%. For configurations including the battery, the minimum load set is 40%.
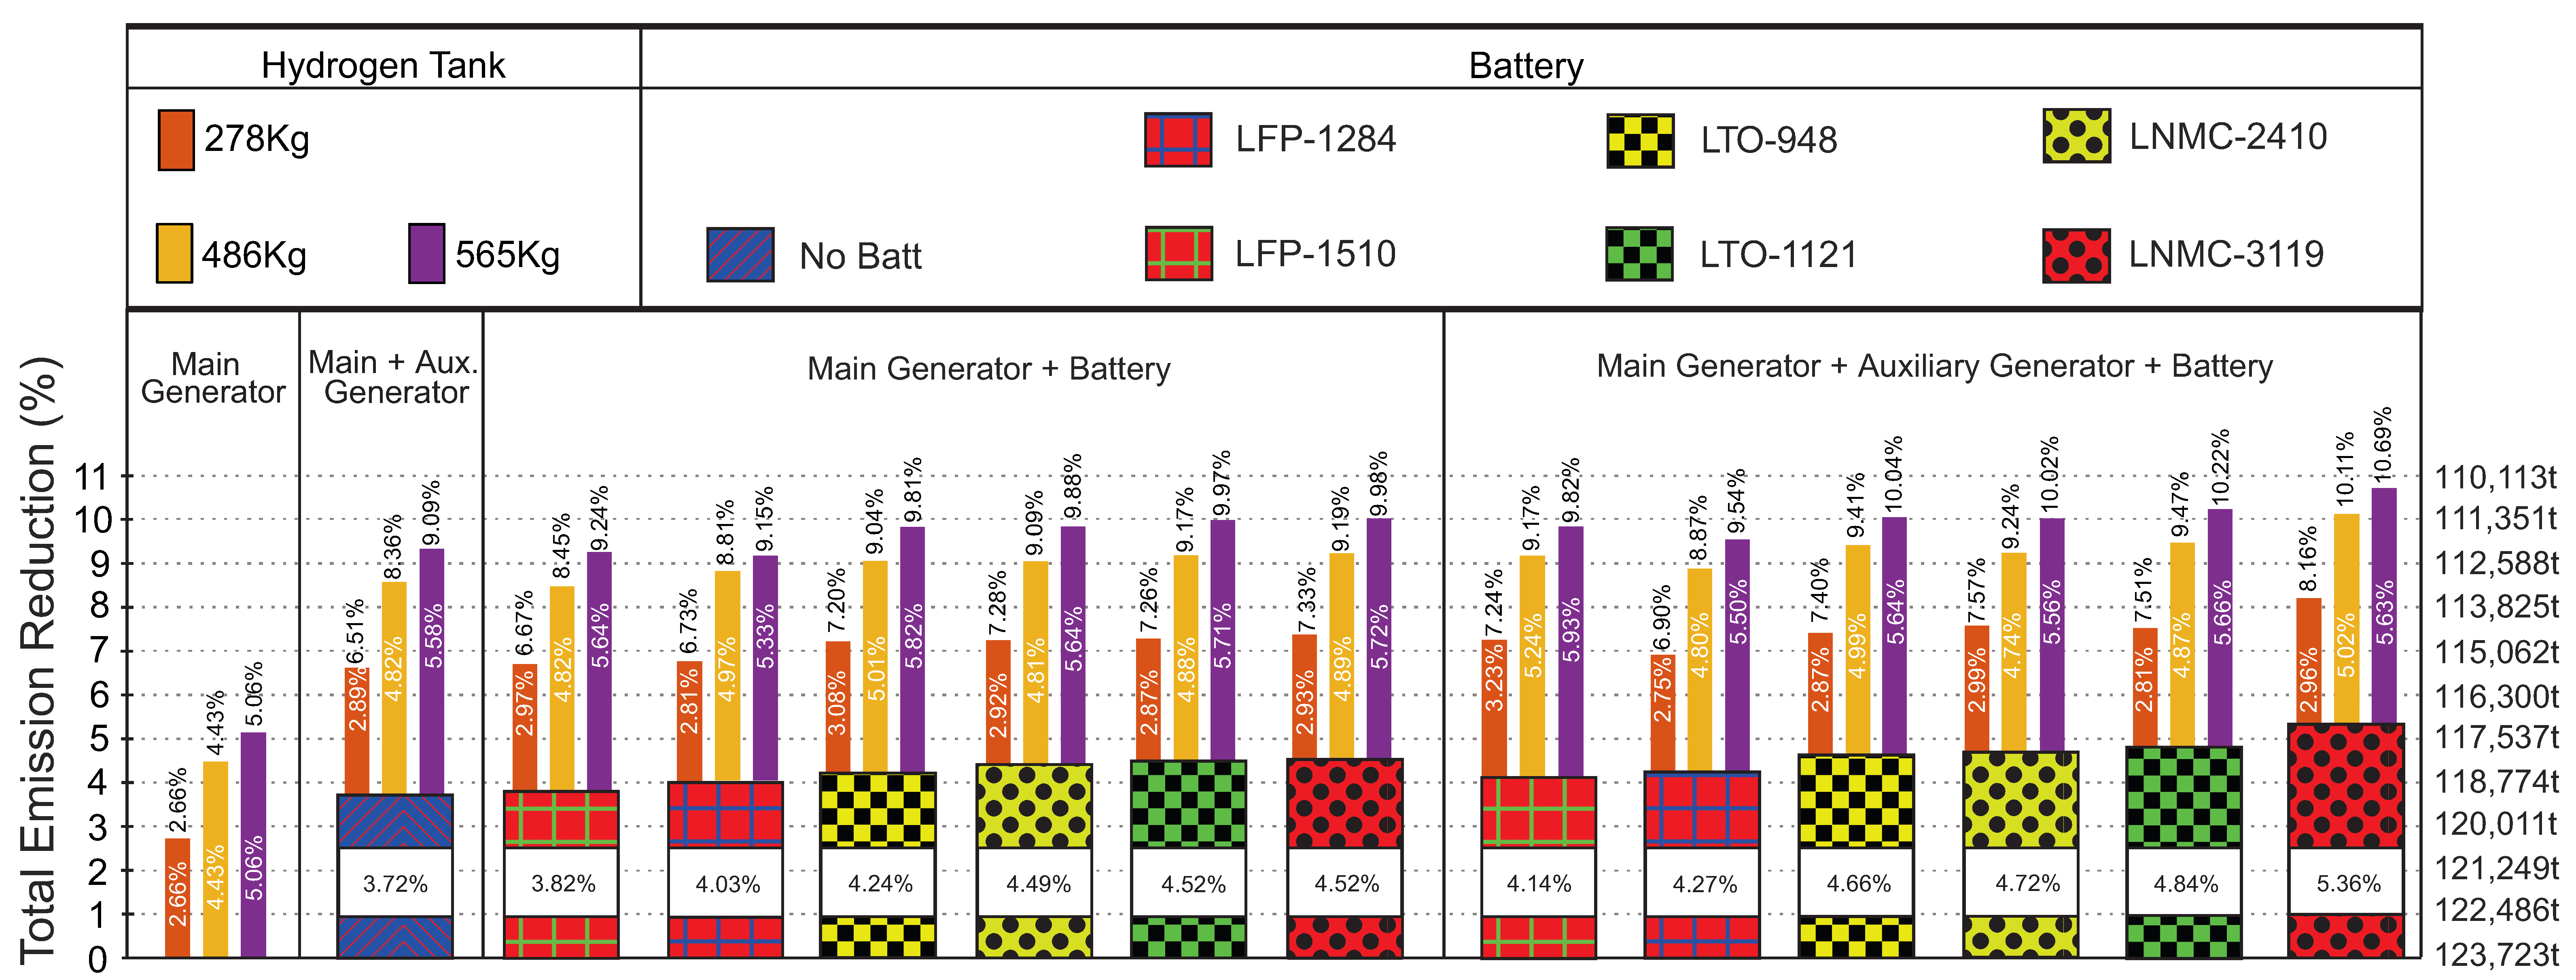
In figures that shows the emission results, as
Figure 8, the bar colour represent the amount of hydrogen stored in the tanks, and the illustrated rectangles represent the batteries. The figures are divided in four parts, each part represents the configuration results discussed in them, the configurations are named above the group of bars. The first box on the left shows the base case that includes only main generators. In this first box, the reduction obtained by the connection of fuel cells is also shown. The numbers, inside the bar, represent the percentage reduction that is achieved by the use of fuel cells when compared to the case written above the bars. The numbers above the bars represent the percentage reduction obtained by the configuration that includes the equipment names written above the bars and the PEMFC in comparison to the base case. In the first box, the numbers inside and above the bars are the same.
The second box from the left to the right shows the results of the configuration including the main generators and auxiliary generators. The reduction obtained by the comparison between this configuration and the base case is shown inside the larger rectangle. The bar above the rectangle in this second box shows two pieces of information. Firstly, inside the bar, we can see the reduction obtained from the use of fuel cells in comparison to the case including main and auxiliary generators. Secondly, above the bar, the total percentage reduction obtained by the configuration including main and auxiliary generators and PEMFC in contrast to the base case including only main generators is shown.
The same discussion did for the second box occurs for the third and the fourth boxes. For the third box, the larger rectangle represents the reduction obtained for the configuration, including the main generators and batteries. In the fourth box, the larger rectangle shows the reduction obtained by the configuration, including the main and auxiliary generators and batteries in relation to the base case.
6.1. 10% Lower Demand
Figure 8 shows the emission percentage reduced for all configurations related to the base case that has only four 1820 kW diesel generators. This percentage is shown in the vertical axis, and lines are traced through the figure to help readers to evaluate the emission reduction.
As can be seen, the most representative emission reduction is achieved for the configuration including main and auxiliary engines, a fuel cell with a hydrogen tank of 565 kg, and a LNMC-3119 kW battery. This configuration achieved an emission reduction of 10.69%, when the 10% lower demand is analyzed.
When configurations without auxiliary engines are analyzed, the configuration including main generators, a fuel cell with 565 kg of hydrogen, and the LNMC-3119 kW battery achieves the highest emission reduction. This configuration achieved a reduction of 9.98%. If the hydrogen storage is reduced to 486 kg, this same configuration also achieves the highest reduction, around 9.19%. For a hydrogen storage of 278 kg, this configuration also achieves the highest emission reduction, around 7.33%.
The results in
Figure 8 demonstrate that, for a demand equivalent to the 10% lower demand, the emission reduction achieved by configurations including main and auxiliary generators and batteries simultaneously is not much higher than the emission reduction achieved by configurations including main and auxiliary generators or a main generator and batteries.
The same analysis can be performed in configurations including PEMFC; the emission reduction obtained in configurations including main generators, PEMFC, auxiliary generators, and batteries is close to the one obtained by configurations including main generators, PEMFC, and auxiliary generators or configurations with main generators, PEMFC, and batteries. Therefore, if only the emission reduction perspective is analyzed, it may not be worth the investment in both auxiliary generators and batteries.
A cost analysis considering the relationship between the amount invested and the reduced CO2 ($/tCO2) emissions must be carried out later for a definitive choice between batteries or auxiliary generators. Despite the small influence of auxiliary generators in reducing total emissions, their use allows a reduction in the number of battery cycles. This discussion will be presented later.
Figure 8 also demonstrates the impact that the connection of fuel cells can cause in emission reduction. The reduction achieved by connecting a fuel cell, for the same hydrogen amount, is very close, regardless of the configuration. If we compare the emission reduction achieved by the connection of the three solutions (auxiliary engines, battery, and PEMFC) individually, we can see that batteries and auxiliary generators present a higher reduction than the use of the PEMFC with 278 kg. Hydrogen tanks with 486 kg and 565 kg achieve a higher emission reduction than batteries and auxiliary generators when connected to the base case. Additionally, a comparison between the emission reduction achieved using the hydrogen tank with 486 kg and the one obtained using 565 kg of hydrogen shows that the difference is not representative. Therefore, depending on the cost involved in storing more hydrogen, the use of 486 kg could have a higher cost–benefit relationship.
Figure 8 also shows the amount of CO
2 emitted for configurations without PEMFC. As can be seen, the use of batteries can provide a small emission reduction when connected in configurations including main and auxiliary engines. The best configuration without PEMFC is the configuration including main and auxiliary generators and the LNMC-3119 kW battery. Moreover, if configurations without PEMFC and auxiliary engines are evaluated, the highest emission reduction is achieved by the configuration including main generators and a LNMC-3119 kW battery. It is interesting to note that the configuration including only main engines and batteries presents a higher emission reduction than the configurations including only main and auxiliary engines and the configurations including only a main generator and PEMFC with 278 kg.
Finally, reductions of configurations with PEMFC and without a battery can also be measured in
Figure 8; for configurations including only main generators these reductions goes from 2.66% to 5.06%. Moreover, for configurations including main and auxiliary generators, these reductions change from 6.51% to 9.09%.
Figure 9 shows the number of cycles that these batteries have in each configuration when the 10% lower demand is considered. This figure also shows that there is a connection between the number of cycles and the battery capacity. Moreover, the use of auxiliary engines provides a considerable reduction on battery cycles.
LFP batteries achieved the minimal number of cycles with the configuration, including main and auxiliary generators and without the PEMFC. The LFP-1284 kW achieved 12 cycles, and the LFP-1510 kW achieved 11 cycles.
In terms of cycles, for all configurations, the best and worst batteries were LNMC-3119 kW and LTO-948 kW, respectively. Configurations with auxiliary engines also presented a smaller difference, in terms of cycles, between the best and the worst battery. For the configuration including only main generators and batteries, this difference was 24 cycles. For the configuration including main and auxiliary generators and batteries, this difference was reduced to 14 cycles. The use of auxiliary engines in this example reduced 10 battery cycles.
The use of the PEMFC does not present a significant reduction of cycles in configurations with auxiliary engines. In fact, for LFP batteries, the use of the PEMFC increased the number of cycles in configurations including main and auxiliary engines. For LTO batteries, on the other hand, the PEMFC helped to lightly reduce the number of cycles. Beside that, in configurations with only main generators and batteries, the highest reduction was achieved through the use of PEMFC with a hydrogen tank containing 278 kg. This reduction reached at least 3 cycles.
Figure 9 also shows that the size of the hydrogen tank plays no part in reducing the number of cycles. Compared to the case with main and auxiliary generators and batteries, the use of the PEMFC achieved, for LTO-948 kW and LTO-1121 kW batteries, a reduction of 2 and 1 cycles, respectively, for the best case with 565 kg of hydrogen storage. The LTO-948 kW charged and discharged 21 times, whereas the LTO-1121 kW charged and discharged 18 times. For LNMC batteries, the use of the PEMFC did not cause a considerable reduction in terms of cycles. The use of fuel cells with a hydrogen tank containing 565 kg of hydrogen reduced 1 cycle for the LNMC-3119 kW but did not reduce the number of cycles for LNMC-2410 kW battery. The LNMC-2410 kW had 9 cycles during the mission, whereas the LNMC-3119 kW cycled 7 times.
Based on the cycles’ limitation shown in
Figure 4, the number of missions that each battery can pursue is easily calculated. This number of missions is considered for a battery operating at a temperature of 25 °C and a DoD of 100%. The number of cycles increased with the decrease of the DoD. The DoD used in this work was 60%, so, the number of missions calculated can be higher for a real case. It is important to mention that aging is not considered here, so a real battery would see a reduction in capacity across the battery’s cycle life, which would probably lead to an increase in the number of cycles per mission; this effect is not estimated in this paper.
Considering that, when the battery reaches this theoretical maximum number of cycles, the battery should be replaced, we can estimate the number of missions for each battery. The highest number of missions is achieved by LTO batteries. In a PSV with the LTO-948 kW, the number of missions varies from 405, for the configuration with main engines and batteries, to 714, for the best configuration in terms of cycles in which main and auxiliary engines power the ship with the PEMFC and 565 kg of hydrogen. With the LTO-1121 kW, these numbers vary from 468 to 833 for the same configurations. For this battery, this maximum number of missions is also reached for a configuration including 486 kg of hydrogen. In terms of years that the PSV can operate for, the PSV can operate for between 5.2 and 9.2 years with the LTO-948 kW before replacing the batteries, and from 6 to 10.7 years with the LTO-1121 kW. The calculation in years assumes that one mission starts just after the other during the whole year.
LNMC batteries achieved the lowest number of cycles in the same configuration as the LTO batteries. The number of missions for these batteries varied from 187 to 333 for the LNMC-2,410 kW battery. In terms of years, this represents a variation from 2.4 to 4.3 years. For the LNMC-3119 kW battery, the numbers vary from 230 to 428 missions and from 3 to 5.5 years.
LFP batteries lasted for the lowest number of missions. As these batteries have their lowest number of cycles achieved in the configuration with main and auxiliary engines and without fuel cells, the highest number of missions will be mentioned for this configuration. LFP-1284 kW have the number of missions varying from 128 to 300. In terms of years, these numbers vary from 1.65 to 3.9. The LFP-1510 kW would be able to pursue from 144 to 327 missions, depending on which configuration they were installed. In terms of years the numbers would vary from 1.8 to 4.2.
Beside the analysis of emission and battery cycles for each configuration, an analysis in terms of energy generated also can be traced. A comparison of the energy generated by the main generators in all configurations can be made to determine the contribution of these generators to the total energy generated. This is important, because reducing this participation can lead to a broader period between maintenance services.
Considering the 10% lower demand, with only main generators, generators 1, 2, 3, and 4 are responsible for 60.6%, 22.4%, 15.5%, and 1.4% of the demand, respectively. When two auxiliary generators are included, the contribution of the four main generators is reduced by 19.2%. If fuel cells are used instead of auxiliary engines, the reduction of the energy generated by the four generators is lower and varies from 2.8% to 5.6% for 278 kg to 565 kg of stored hydrogen. The configuration with auxiliary generators and fuel cells connected to the main generators reduces the energy generated by the main engines in a variation from 19.4% to 24.6%. As can be seen, this reduction does not simply sum the reduction caused by the insertion of auxiliary generators to the one caused by fuel cells.
In the configurations including only main generators and batteries, there is an increase in the energy generated by the main generators to charge the batteries. Even though the energy generated increases,
Figure 8 shows that the configurations including only the main generators and batteries present an emission reduction. It is important to mention that the use of batteries allows for the increase of the generators’ minimal point of operation from 10% to 50%. It helps the generators to operate closer to their optimal point, reducing the consumption [
66], and, therefore, reducing the emissions even with an increase in energy generation. In terms of energy generated, the increases were 3.24%, 2.89%, 2.44%, 2.43%, 2.09%, and 1.99% for configurations including LFP-1510, LFP-1284, LNMC-2410, LNMC-3110, LTO-1121 and LTO-948, respectively.
For the configuration with main and auxiliary engines and batteries, considerable reductions in the energy generated by the four main generators can be seen for all battery types. The reductions were 19.8%, 20.5%, 21.0%, 21.4%, 30.9%, and 31.4% for LNMC-3119 kW, LTO-1121 kW, LNMC-2410 kW, LTO-948 kW, LFP-1510 kW, and LFP-1284 kW, respectively. The reductions for LFP batteries were the most significant found, with a 10% lower demand.
For configurations including main generators, the PEMFC, and batteries there were minor reductions regarding energy generated. For configurations with 278 kg of stored hydrogen, the reductions were around 0.55% for LNMC and 0.85% for LTO batteries. With LFP batteries, increases of approximately 0.25% were seen. These numbers are much lower when compared to the reduction brought by the same configuration without batteries, in which the reduction reached 2.7%. With an increase in hydrogen storage capacity, reductions around 2% and 3% with batteries and 4.7% and 5.5% for configurations without battery for 486 kg and 565 kg of hydrogen were observed, respectively.
For configurations including main and auxiliary engines, batteries, and the PEMFC, the reductions are substantial; for these configurations, the reductions vary from 18.7%, in the worst case that comprises a LNMC-3119 kW battery and 278 kg of hydrogen, to 25.2%, in the case comprising the same battery with 565 kg of hydrogen.
Finally, it is important to discuss about the contribution of the equipment in each part of the mission. This is shown in
Table 6. Since the discussion would be very long if we pointed out the participation of each piece of equipment in each configuration analyzed,
Table 6 only shows the data for the configuration including the main and auxiliary generators, LNMC-3119 kW battery, and a 250 kW PEMFC with 565 kg of hydrogen that achieved the highest-emission reduction for a 10% lower demand. The 565 kg of hydrogen finishes in the middle of the DP operation, which is the reason the PEMFC does not appear in the dispatch of Partial Load Voyage or Standby.
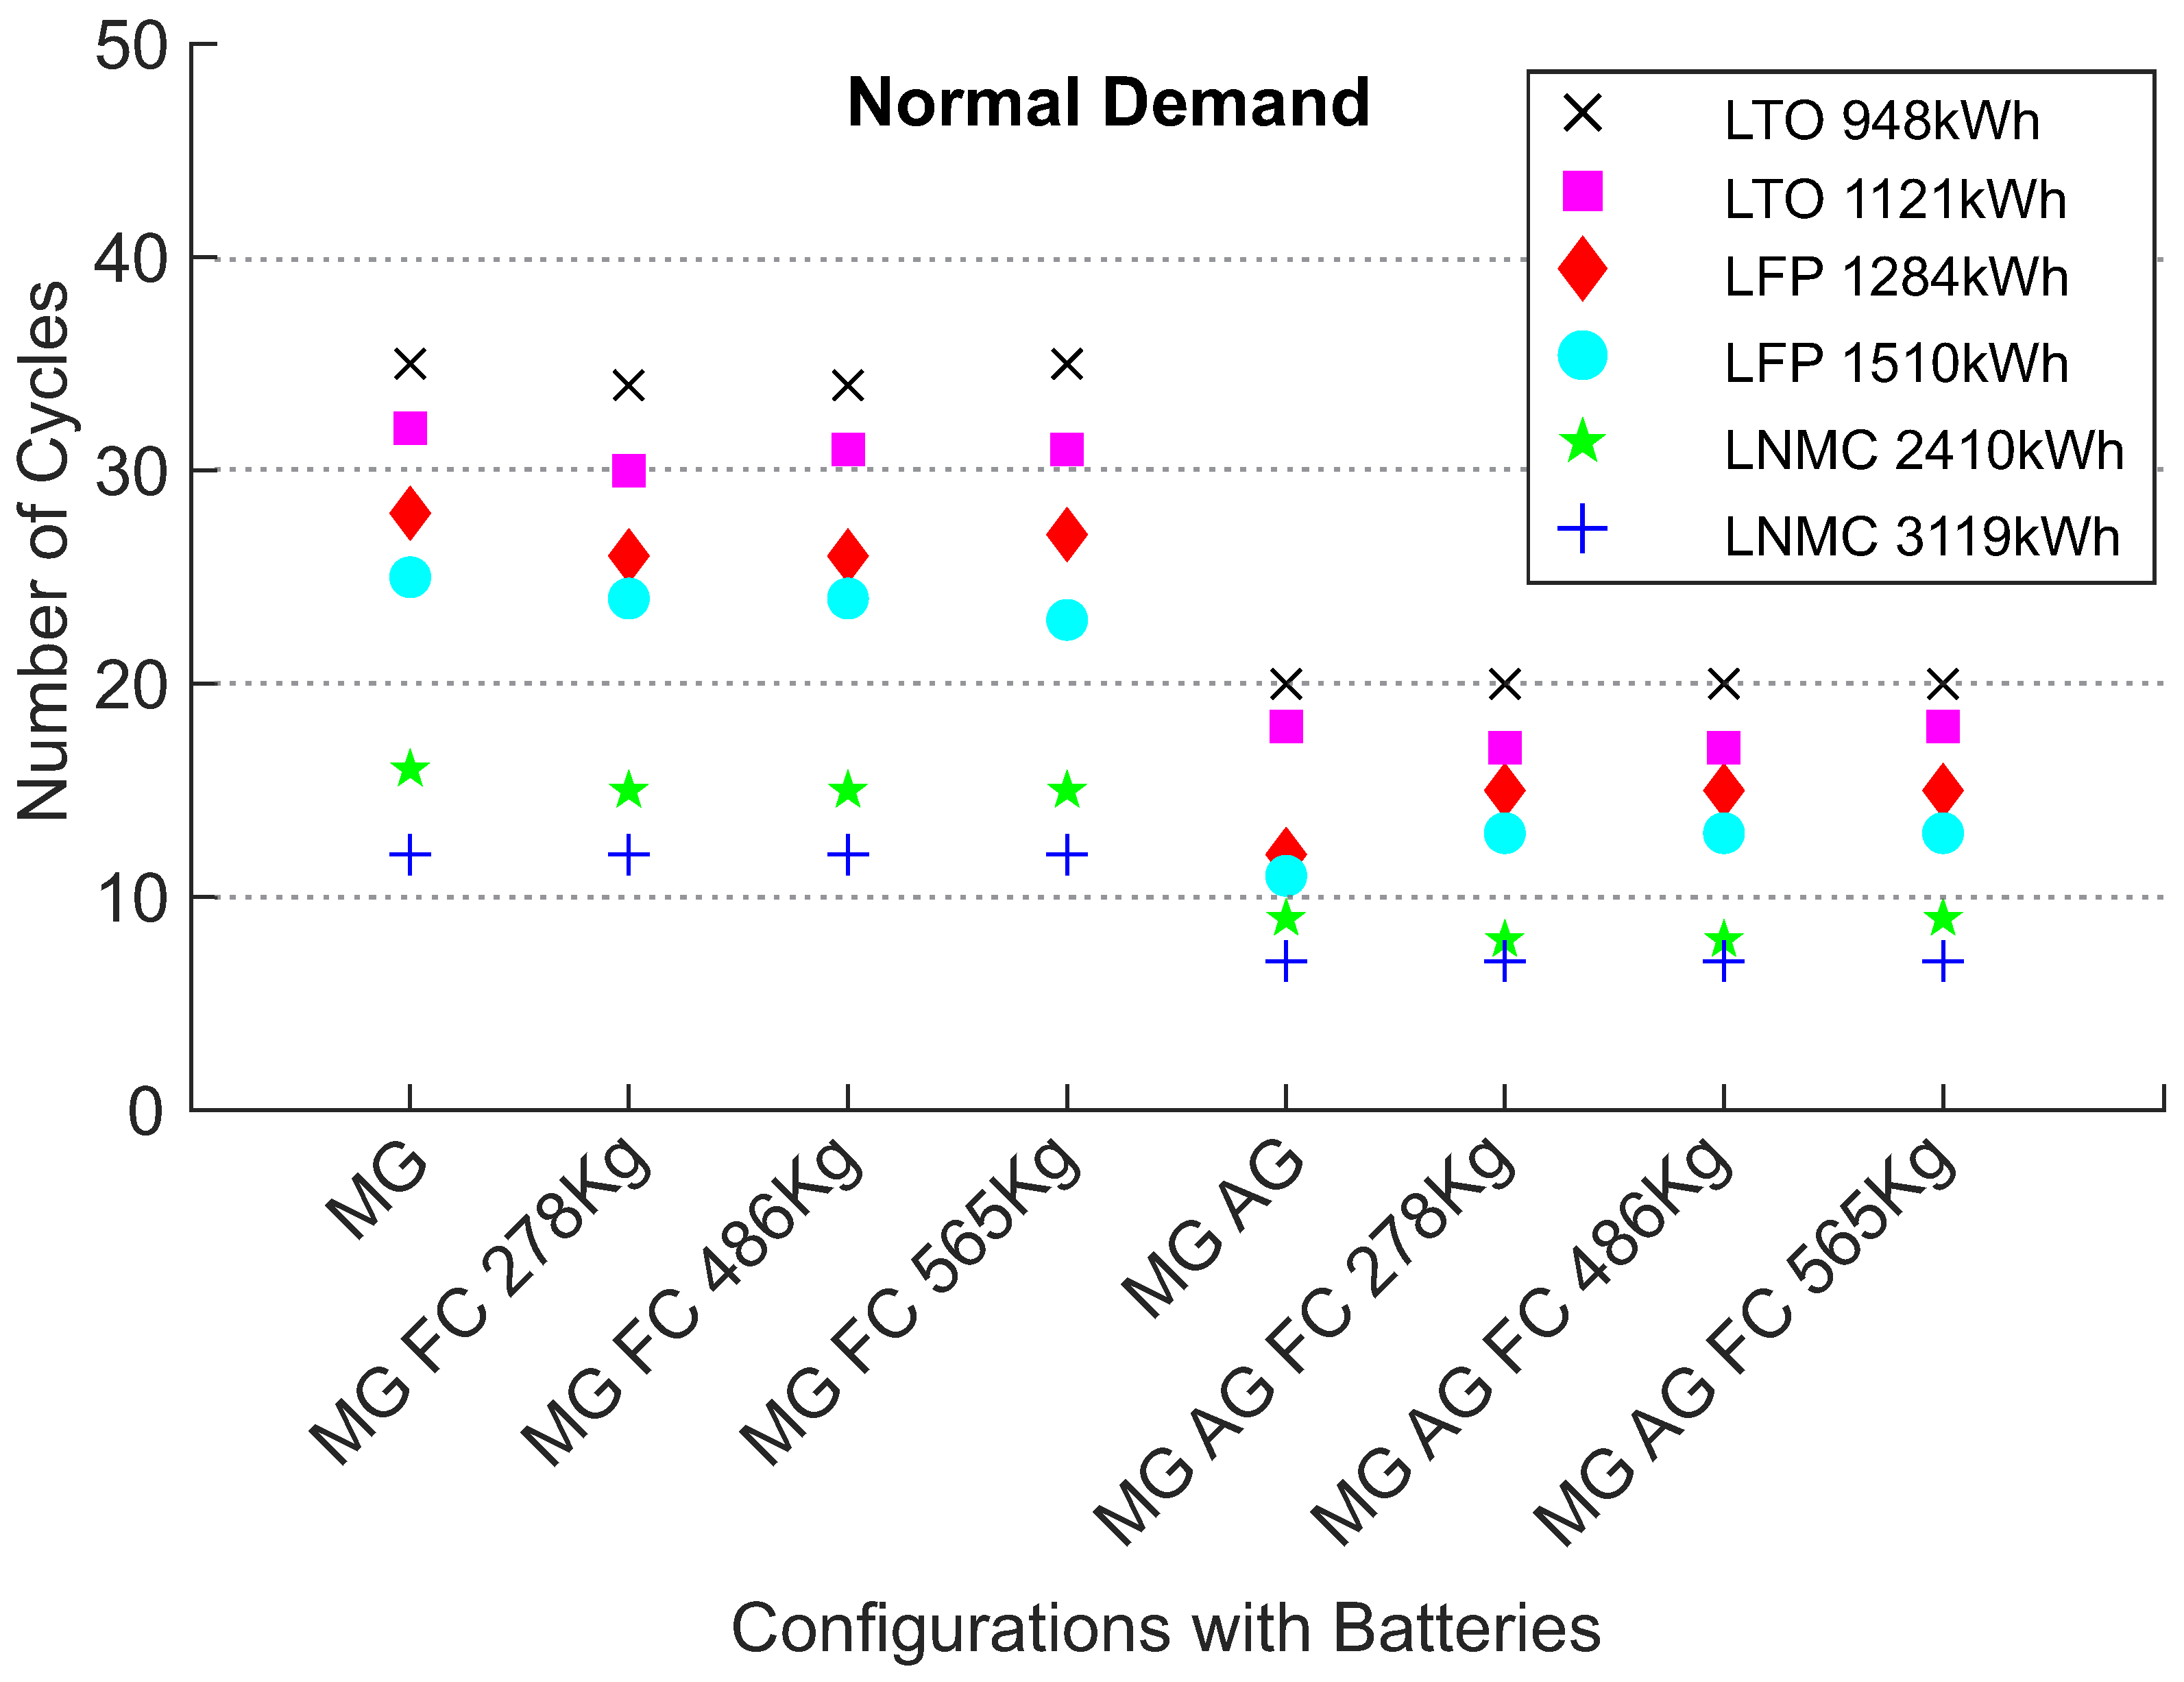
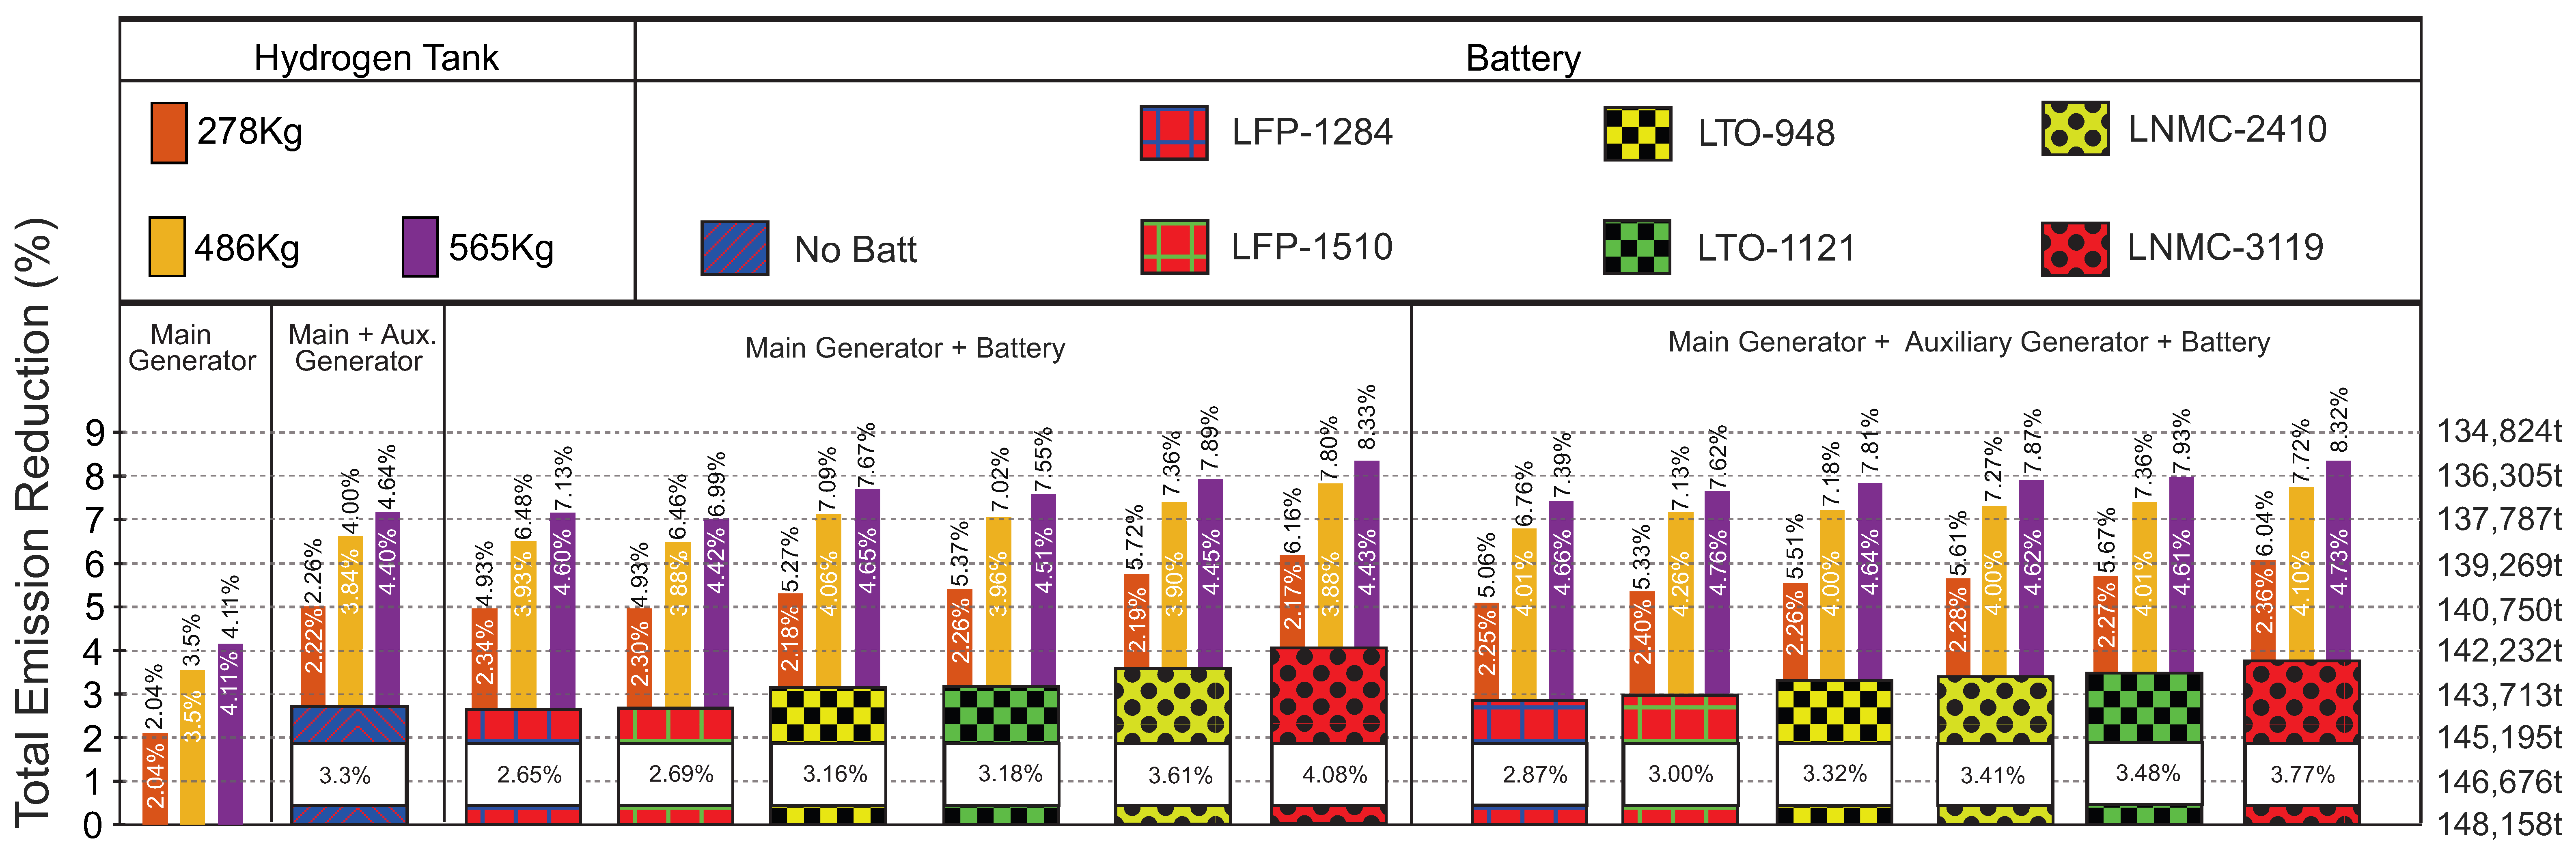
6.2. Normal Demand
Figure 10 presents the total emission percentages related to the base case obtained from the configurations operating at normal demand. The results demonstrate that the increase of the hydrogen capacity increases the emission reduction. Moreover, the most significant reductions are achieved with the LNMC-3119 kW in configurations with main and auxiliary generators, PEMFC and batteries with 565 kg of stored hydrogen. This configuration achieved a reduction of 9.32%. With 486 kg and 278 kg of hydrogen, the reductions are 8.64% and 7.08%.
Figure 10 presents the total emissions of configurations without the PEMFC written horizontally. As can be seen, auxiliary engines provided a better reduction of emissions in configurations without batteries and fuel cells. In that case, the reductions were close to those achieved in configurations with main generators and batteries. A comparison between configurations including main generators and LFP batteries and those including main and auxiliary engines shows that auxiliary generators can provide better results in terms of emissions if the normal demand is evaluated. In that case, shipowners must decide between batteries and auxiliary engines as configurations with main and auxiliary engines, and batteries do not provide much better emission reduction.
Contrasting the results in
Figure 10 with those presented in
Figure 8, it can be observed that the emission reductions obtained for the lowest demand are higher than those obtained for the normal demand. Beside that, for normal demand, the configuration including main and auxiliary generators achieved more emission reductions than configurations including main generators and LFP batteries, which did not occur for the 10% lower demand.
Considering the configurations including main and auxiliary diesel engines, PEMFC, and batteries one may see that the battery that provided the highest reduction is the LNMC-3119 kW. This occurs at all levels of hydrogen amounts. Comparing
Figure 8 and
Figure 10, it can be seen that there is a change in the battery that provides the second largest emission reduction. For normal demand, the battery is the LTO-1121 kW, whereas for a 10% lower demand it is the LNMC-2410 kW.
Regarding the impact of fuel cells in each configuration, when the same amount of hydrogen is considered, it presents emission reductions very close to each other for all configurations. The only configuration that presented lower reductions was the configuration including only main generators. It also happened when the 10% lower demand was considered. With 565 kg of hydrogen, the reductions vary from 4.4% to 5.13%; for 486 kg, the variation is from 3.83% to 4.44%; for 278 kg, the numbers go from 2.22% to 2.76%. The highest impacts were found in configurations including main and auxiliary generators, fuel cells, and the LFP-1510 kW battery with 278 kg and 486 kg of hydrogen. With 565 kg, the most significant reduction is found in the configuration including main generators, fuel cells, and the LNMC-2410 kW battery.
An evaluation of the battery impact in emissions can also be made based on the results in
Figure 10. Batteries presented a more significant impact in configurations without auxiliary engines. For all levels of hydrogen, LNMC-3119 batteries are those which present the largest difference in terms of emissions when configurations including only main generators are analyzed with and without a fuel cell. Even though the reduction is much smaller, for configurations including auxiliary generators, the LNMC-3119 kW battery also results in the highest emission reductions.
From
Figure 10, it is clear that, in terms of emissions, the use of auxiliary generators combined with a battery is not indicated for normal demand levels; apart from requiring more capital to buy the auxiliary generator, these engines do not present a considerable increase in emission reduction. Further discussions will highlight the importance of auxiliary generators in reducing the number of battery cycles.
Figure 11 shows the number of cycles of each battery in all configurations analyzed in this work when the normal demand is considered. As in the previous case with the 10% lower demand, the lowest numbers of cycles of LFP batteries are also achieved in the configuration with main and auxiliary engines and batteries. The number of cycles is exactly the same 12 and 11 cycles for LFP-1284 kW and LFP-1510 kW, respectively. The lowest number of cycles for LTO-948 kW and LNMC-2410 kW batteries was achieved with the configuration including main and auxiliary engines and fuel cells with 278 kg and 486 kg of hydrogen, 20 cycles for LTO-948 kW, 17 cycles for LTO-1121 kW, and 8 cycles for LNMC-2410 kW. With the LNMC-3119 kW battery, the lowest number of 7 cycles is obtained with the configuration with main and auxiliary generators and with the configuration that also included the fuel cell and all amounts of hydrogen.
Different from what happened with the 10% lower demand, the largest amount of hydrogen did not achieve the lowest number of cycles in any configuration with a normal demand. Moreover, with the normal demand, the increase from 485 kg to 565 kg caused an increase in one cycle of LTO-1121 kW and LNMC-2410 kW.
The variation from the 10% lower demand to the normal demand leads to an increase in the number of cycles for some batteries. For the LTO-948 kW batter, the number increases in configuration with the main engines and fuel cells with 278 kg and 565 kg of hydrogen. For the LTO-1121 kW battery, the increase happens when the configuration with main engines and fuel cells with 486 kg and 565 kg of hydrogen. The configuration with main engines and fuel cells with 278 kg and 486 kg of hydrogen presents an increase in the number of cycles for LFP-1510 kW, whereas for configuration including LFP-1284 kW the cycles’ increase is seen only in configurations including main generators and fuel cells with 565 kg of hydrogen. LNMC batteries presented a lower or identical number of cycles for all configurations. For the configuration including only main generators, the increase of the demand reduces the number of cycles for LTO-948 kW and both LNMC batteries; for the remaining batteries the number of cycles remains the same.
As was completed for the 10% lower demand, the number of missions and the number of years can be calculated based on the number of cycles that each battery can pursue. LTO-948 kW can accomplish a number of missions that vary from 428 to 750; in terms of years, the numbers vary from 5.5 to 9.7. LTO-1121 kW can last from 6 to 11.4 years; in terms of missions, the numbers vary from 238 to 441. LFP-1284 kW would be able to pursue from 128 to 300 missions; in terms of hours, these numbers vary from 1.6 to 3.9 years. LFP-1510 kW can last from 1.8 to 4.2 years and pursue a number of missions that varies from 144 to 327. LNMC-2410 kW can accomplish a number of missions that varies from 187 to 375, in years, the numbers vary from 2.4 to 4.8. The number of missions vary from 250 to 428 and the number of years from 3.2 to 5.5 for the LNMC-3119 kW battery.
A comparison between each configuration analyzed and the base case which comprises only main generators can also be traced in terms of energy generated. Considering the normal demand curve, for the configuration with only main generators, generators 1, 2, 3, and 4 are responsible for 58.2%, 20.3%, 17.3%, and 4.2%, respectively. When two auxiliary generators are included, the contribution of the four main generators is reduced by 17.8%. If fuel cells are used instead of the auxiliary engines, the reduction of the energy generated by the four generators is lower and varies from 2.4% to 4.9% for 278kg to 565 kg. The configuration with auxiliary generators and fuel cells connected to the main generators reduced the energy generated by the main engines in a variation from 17.8% to 22.4%. As can be seen, this reduction does not simply sum the reduction caused by the insertion of auxiliary generators to the one caused by fuel cells.
In the configurations including only main generators and batteries, there are no reductions, because, in those cases, energy is generated by the main engines to charge the batteries. However, the relationship between energy generated and emissions must be discussed. As shown in
Figure 10, the configurations including only main generators and batteries provide a reduction of emissions. This happens, because, for the configuration with only main generators, there is energy generated from 10% to 40% of the generator rated power, whereas the insertion of batteries allows for a change of the minimum load of generation from 10% to 50%.
For the configuration with main and auxiliary engines and batteries, considerable reductions in the energy generated by the four main generators can be seen for all battery types. The reductions are 17%, 17.3%, 18.7% and 18.8%, 25.4%, and 26% for LNMC-3119 kW, LNMC-2410 kW, LTO-1121 kW, LTO-948 kW, LFP-1510 kW, and LFP-1284 kW. The reductions for LFP batteries are the highest found for the normal demand. These levels of reductions are not seen in configurations including main generators, fuel cells, and batteries. For configurations with 278 kg of hydrogen, there are minor reductions for LNMC and the LTO-948 kW batteries. For other batteries, minor increases are seen. With 486 kg and 565 kg of hydrogen, reductions around 2% and 3% are found, respectively. For configurations including main and auxiliary engines, batteries, and fuel cells, the reductions are substantial. In these cases, the reductions vary from 17.9%, in the worst case that comprises LNMC-2410 kW battery and 278 kg of hydrogen, to 22.9%, in the case comprising LNMC-3119 kW with 565 kg of hydrogen.
The same discussion pursued at the end of the subsection of the 10% lower demand will be performed here for the normal demand. The data of the generators and battery participation to fed the demand is shown in
Table 7. For normal demand, we have the same configuration analyzed for a 10% lower demand, this configuration includes main and auxiliary generators, a LNMC-3119 kW battery, and a 250 kW PEMFC with 565 kg of hydrogen. This configuration achieved the highest emission reduction for the normal demand. The 565 kg of hydrogen also finishes during DP operation and, for normal demand, the PEMFC does not participate in the dispatch of Partial Load Voyage or Standby. Comparing
Table 6 to
Table 7, we can see that the increase of the demand requires four main generators instead of three for a laden voyage.
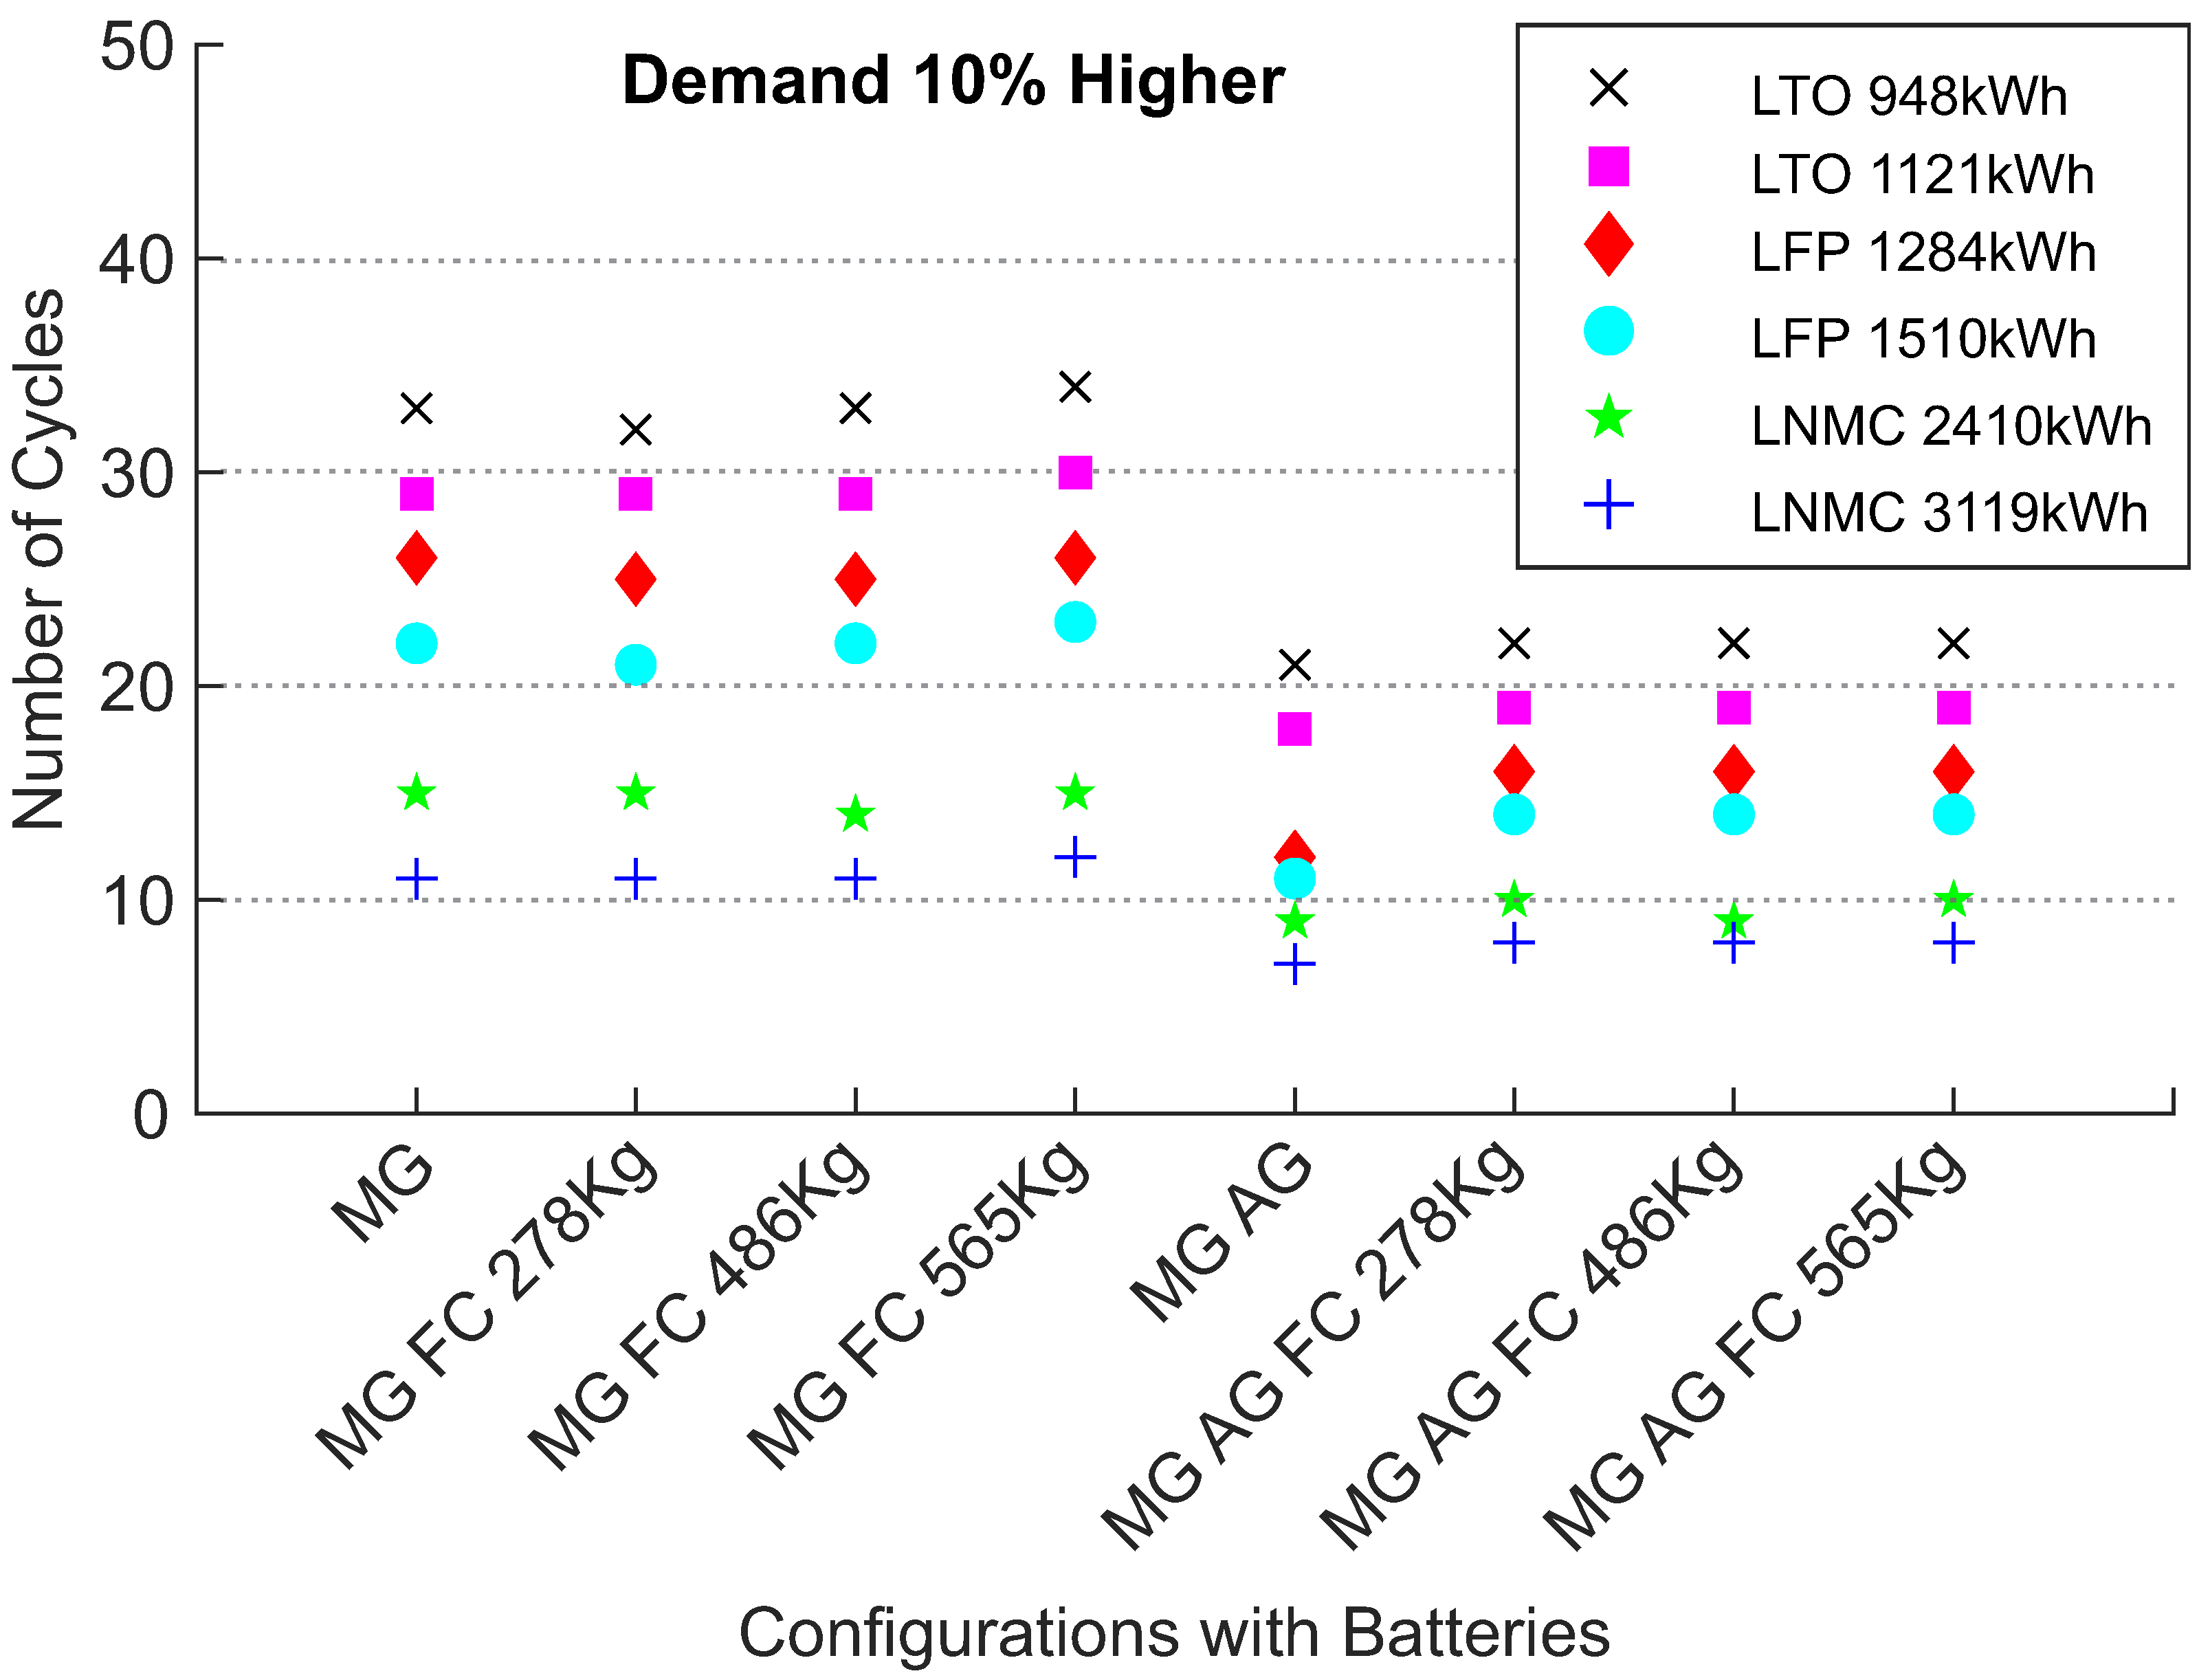
6.3. 10% Higher Demand
Figure 12 shows the emission reductions obtained from the different power system configurations operating with a 10% higher demand related to the base case including only four main diesel generators. The most significant emission reduction was approximately 8.33% and was achieved with the configuration including main, LNMC-3119 kW batteries and PEMFC with 565 kg of hydrogen. On the other hand, in configurations including auxiliary generators, the same battery also achieves the highest reduction, which is very similar to the highest emission reduction achieved (around 8.32%).
Figure 12 also shows the emission reduction obtained by configurations without fuel cells. It is interesting to note that LNMC batteries presented better results in configurations without auxiliary engines. For other batteries, the use of auxiliary engines presented a small reduction. The configuration including only a main generator and a LNMC-3119 battery presented a reduction of 4.08%, whereas the configuration including auxiliary engines achieved an emission reduction of 3.77%.
Figure 12 also shows the impact of battery connection in configurations with main generators, as well as main and auxiliary generators. In configurations with only main generators, batteries can provide reductions of ship emissions that vary from 2.65% to 4.08%, depending on which battery is chosen. On the other hand, in configurations including main and auxiliary generators, this reduction achieved by the connection of batteries is not significant. Depending on the battery chemistry, the emission reduction numbers compared to the configuration including main and auxiliary generators vary from 0.12% to 1.06%. Considering that the configuration including main and auxiliary generators achieved an emission decrease of 2.75%, the costs of the auxiliary generators and of each battery should be investigated before a final decision is made.
Figure 13 shows the number of cycles that each battery pursues for all configurations analyzed in this work for a 10% higher demand. In this case, the lowest number of cycles is achieved for the configurations including main and auxiliary engines for every battery analyzed. It is important to note that the use of fuel cells in the configuration including auxiliary and main engines led to an increase in the number of cycles in all amounts of hydrogen stored. Whereas for LNMC and LTO batteries, the numbers do not differ much, for LFP batteries the insertion of fuel cells cause an increase of 25% in the number of cycles.
Considering the three demand levels, in a 10% higher demand, the insertion of fuel cells brings about, for the first time, an increase in the number of cycles in configurations without auxiliary generators. Here, the configuration including main engines and a fuel cell with a hydrogen tank of 565 kg increased the number of cycles for all batteries, except for the LNMC-2410 kW and the LFP-1284 kW batteries. With these batteries, the number of cycles was kept the same as presented in the configuration with the main engines.
The variation of the demand level from normal demand to a 10% higher demand implies an increase in the number of cycles for all batteries in configurations with main and auxiliary engines and fuel cells with all sizes of hydrogen tanks. For configurations with main and auxiliary engines, the number of cycles increased for LTO-948 kW batteries, for other batteries this configuration did not change the number of cycles.
The impact that the demand variation can cause on configurations with only main generators and batteries varies from one battery to another. From the 10% lower demand to the 10% higher demand, LTO-948 kW reduces the number of cycles from 37 to 33, LTO-1121 kW reduces it from 32 to 29, LFP-1284 kW from 28 to 26, and LFP-1510 kW from 25 to 22. The reduction in LNMC-2410 kW was from 16 to 15 and in LNMC-3119 kW from 13 to 11.
In terms of missions, when a level of power is required such as a 10% higher demand, the numbers vary from 441 to 714 for LTO-948 kW. For LTO-1121 kW, it varies from 500 to 833. LFP-1284 kW and LFP-1,510 kW have the same maximum number of missions as presented for a 10% lower demand and normal demand, 300 for LFP-1284 kW and 327 for LFP-1510 kW battery; the lowest number on the other hand is higher than other levels of demand, 138 and 156 for these batteries, respectively. For LNMC-2410 kW, the numbers vary from 200 to 333, and, for, LNMC-3119 kW, the numbers vary from 250 to 428. In terms of years, the minimal and maximum values of years are 5.7 and 9.2 for LTO-948 kW. For LTO-1121 kW, they are 6.4 and 10.7. For LFP-1284 kW, they are 1.8 and 3.9 and 2 and 4.2 for LFP-1510 kW. For LNMC-2410 kW and LNMC-3119 kW, the minimal numbers of years are 2.6 and 3.2, whereas the maximum numbers are 4.3 and 5.5, respectively.
Moving to the electrical analysis, in configurations with only main generators, generators 1, 2, 3, and 4 are responsible for 56.1%, 18.8%, 17.5%, and 7.6% of the energy generated, respectively. The connection of auxiliary generators reduces the amount of energy generated by the main generators to 14.5%. When fuel cells are used instead of auxiliary generators, these reductions vary from 2.2% to 4.5%. For configurations including main and auxiliary generators and fuel cells, the reductions vary from 14.8% to 16.9%.
For configurations including only main generators and batteries, there is an increase in energy generation from the main generators. The increases are 1%, 1.5%, 1.5%, 1.7%, 2.4%, and 2.5% for LNMC-3119 kW, LNMC-2410 kW, LTO-948 kW, LTO-1121 kW, LFP-1284 kW, and LFP-1510 kW, respectively.
For configurations including main and auxiliary generators and batteries, the reductions in energy generation from the main generators are 14.8%, 15.4%, 15.5%, 16.1%, 23.5%, and 23.8% for LNMC-2410 kW, LTO-1121 kW, LNMC-3119 kW, LTO-948 kW, LFP-1284 kW, and LFP-1510 kW, respectively. As mentioned previously, LFP batteries have the largest difference between energy charged and discharged; for this configuration, this energy does not come from main generators but from auxiliary generators. For configurations including LFP batteries, the energy from auxiliary generators is around 70% higher than that of the configuration without a battery.
Using the hydrogen tank with 278 kg in configurations with only main generators and batteries provides almost no change in energy generation from main generators. With 486 kg, the reductions in energy generation from the main generators are 1.5%, 1.6%, 2.2%, 2.5%, 2.5%, and 2.9% for LFP-1510 kW, LFP-1284 kW, LTO-1121 kW, LTO-948 kW, LNMC-2410 kW, and LNMC-3119 kW, respectively. With 565 kg, the reductions for LFP-1284 kW, LFP-1510 kW, LTO-1121 kW, LNMC-2410 kW, LTO-948 kW, and LNMC-3119 kW are 2%, 2.3%, 2.8%, 3% 3.1%, and 3.5%, respectively.
For configurations including main and auxiliary generators, fuel cells, and batteries, the use of 278 kg of hydrogen leads to reductions of 14.3%, 15.4%, 15.5%, 15.8%, 16.4%, and 16.5% for LNMC-2410 kW, LNMC-3119 kW, LFP-1510 kW, LTO-1121 kW, LFP-1284 kW, and LTO-948 kW, respectively. With 486 kg, the numbers are 15.3%, 16.9%, 16.9%, 17.2%, 17.6%, and 17.6% for LNMC-2410 kW, LFP-1510 kW, LTO-1121 kW, LTO-948 kW, LNMC-3119 kW, and LFP-1284 kW, respectively. With 565 kg, the numbers for LNMC-2410 kW, LFP-1284 kW, LFP-1510 kW, LNMC-3119 kW, LTO-1121 kW, and LTO-948 kW are 15.8%, 17.2%, 17.2%, 17.5%, 17.6%, and 17.6%, respectively. As can be seen, an increase in the amount of hydrogen stored does not produce a reduction in the energy generated by the main generators for all batteries. Moreover, for LFP batteries, the increments in the energy generated from the auxiliary generators are, on average, 21%, 18%, and 13% for 278 kg, 486 kg, and 565 kg, respectively.
The discussion about energy contributions should also be completed for a 10% higher demand. For a 10% higher demand, the configuration that achieved the highest emission reduction is composed by main generators, a LNMC-3119 kW battery, and a 250 kW PEMFC with 565 kg of hydrogen. The contribution percentages of the generators and battery are shown in
Table 8. The 565 kg of hydrogen also finishes during DP operation and, for normal demand PEMFC, does not participate in the dispatch of Partial Load Voyage or Standby. Comparing
Table 8 to
Table 6 and
Table 7, we can see that the absence of auxiliary generators led to a higher participation of batteries. Moreover, the increase of the demand requires four main generators instead of three for partial load voyage.
6.4. Emission Results Summary
Figure 14 compiles the results obtained in this work. For each configuration, the highest levels of reduction are achieved for the 10% lower demand. As mentioned before, this demand level can result from a ship-speed reduction or from a load disconnection. This demand may also represents a ship with the same characteristics that attend a platform closer to the port. The lowest reductions were achieved by the configurations without batteries, and the highest reductions were achieved by configurations including a LNMC-3119 kW battery.
Summarizing the results, the five best results for each demand level can be discussed. For the 10% lower demand, four of these five highest emissions were achieved with the same configuration that included main and auxiliary engines, batteries, and fuel cells with 565 kg of hydrogen. The third highest emission reduction of these five was achieved with the same configuration but with 486 kg of hydrogen.
With the normal demand, among the five best results were two configurations including main generators, fuel cells, and batteries, while the other three also had auxiliary generators. With the 10% higher demand, the configurations that achieved the five highest emission results are the same as those presented for the normal demand. However, the ranking order was different. For the normal and the 10% higher demand, the use of 486 kg of hydrogen did not achieve one of the five largest emission reductions.
The five lowest emission reductions for the three levels of demand can also be analyzed. For the 10% lower demand, apart from the configuration including only main generators, there is also one including main generators and the PEMFC with 278 kg of hydrogen, one comprising main and auxiliary generators only, and two including main generators and batteries.
The same analysis can be performed for a normal demand. For this demand level, the configurations that achieved the five lowest emission reductions are the same configurations that were presented for a 10% lower demand. Nonetheless, the ranking order is different. For the 10% higher demand, the ranking order is the same as that obtained for normal demand. The configuration including only main generators and a PEMFC with 486 kg of hydrogen achieved the second lowest reduction for all levels of demand.
It is possible to see that, comparing the lowest and the highest emission reductions for the same configuration, these numbers decrease with the increase of the demand, i.e., from 4.52% to 4.08% for main generators, from 1.64% to 1.04% for main and auxiliary generators. For main and fuel cells the variation goes from 4.66% to 4.12% for 278 kg kg of hydrogen, from 4.76% to 4.30% for 486 kg, and from 4.92% to 4.22% for 565 kg. For configuration with main and auxiliary engines and PEMFC, the difference between the highest and the lowest varies from 1.66% to 1.14% for 278 kg, from 1.75% to 1.24% for 486 kg, and from 1.60% to 1.29% for 565 kg.
As can be seen, for a normal demand and for a 10% lower demand, the use of auxiliary generators always increases the emission reduction obtained from a configuration without auxiliary generators. For a 10% higher demand, there are configurations in which the use of auxiliary generators will not increase the emission reduction.
7. Conclusions
This work presented a study to assess the CO2 emission reductions obtained from the connection of different solutions in a platform supply vessel (PSV). The power systems studied consisted of auxiliary diesel generators, three battery chemistries, and a 250 kW proton exchange membrane fuel cell (PEMFC). The CO2 emissions for each possible configuration, considering these technologies, were estimated by simulations performed using the HOMER software.
The reductions achieved numbers higher than 10%. A configuration with main and auxiliary generators, a fuel cell with 565 kg of hydrogen stored, and the LNMC-3119 kW battery reduced 10.69% of the CO2 emissions for a 10% lower demand. Considering the same demand level and this configuration without a battery, the emission reduction achieved was 9.09%.
The configuration with LNMC-3119 kW also achieved the highest emission reduction for a normal demand and for a 10% higher demand. For normal demand the reduction was 9.33%, for a 10% higher demand it was 8.32%. For configuration without a battery, the reductions were 8.01% and 7.03% for normal demand and 10% higher demand, respectively.
This paper also presents a discussion about the number of cycles pursued by each battery in each configuration and for each demand level. It can be seen that the increase in the demand level from a 10% lower demand to a 10% higher demand leads to a decrease in the number of cycles in configurations without auxiliary generators. In configurations with auxiliary generators, the variation is minimal with the increase of the demand. For some configurations, there was an increase of one cycle, for others, there was a reduction of one cycle. Beside that, we discussed the importance of auxiliary engines in reducing the number of battery cycles. On average, the use of auxiliary engines reduce in 40% the number of cycles.
From the point of view of emission reduction, the results demonstrate that batteries and auxiliary diesel engines may not present a financially viable solution when used together. The connection of batteries provided a higher emission reduction than the connection of auxiliary engines, but, as mentioned before, the use of only batteries without auxiliary generators has a much higher number of cycles, which will heavily impact costs.
It is important to mention that fuel cells with 565 kg of hydrogen present the largest emission reduction in comparison to batteries and auxiliary engines when these three solutions are analyzed alone. Due to its maturity level, the cost to implement it in a ship is very high.
This paper also discusses the reduction of the participation of main generators in energy dispatches when each solution is connected to the ship’s power system. For the three levels of demand, the best solution to reduce the amount of energy generated from main generators is the use of auxiliary generators combined with LFP batteries.
We also discussed the participation of the equipment for the configuration that achieved the highest emission reduction at each level of demand, it can be seen that the configuration without an auxiliary generator relied more on batteries in all parts of the mission. Moreover, it is interesting to note that the absence of two auxiliary generators led to the use of four main generators for partial load voyage.
The main contributions of this paper are the discussion about the influence of each component of battery cycles, the discussion about the influence of each solution on emission reduction, the discussion about the energy reduced in main generators by the connection of each solution, and how each solution behaves depending on the demand level.
Future work should include an economic analysis that would guide the decision related to buying batteries, auxiliary generators, or fuel cells. This economic analysis should also evaluate the fuel reduced by the connection of those solutions. Beside that, future work should also considers the variation of the DoD, i.e., the reduction of the DoD that leads to an increase in the maximum number of cycles. An increase in the power of the PEMFC should also be analyzed, one of the cited papers describes the installation of two 250 kW PEMFC.


 ,
, 


