Article

Features, Mechanisms and Optimization of Embodied Carbon Emissions for Energy Supply Bases: Case Study of Shanxi, China

1
Institute of Geographic Sciences and Natural Resources Research, Chinese Academy of Sciences, Beijing 100101, China
2
College of Resource and Environment, University of Chinese Academy of Sciences, Beijing 100049, China
3
Innovation Academy for Green Manufacture, Chinese Academy of Sciences, Beijing 100190, China
4
Department of Development Strategy and Regional Economy, Development Research Center, State Council, Beijing 100010, China
5
School of Economics and Management, Beijing University of Technology, Beijing 100124, China
*
Author to whom correspondence should be addressed.
Energies 2022, 15(6), 2079; https://doi.org/10.3390/en15062079
Submission received: 16 February 2022 / Revised: 4 March 2022 / Accepted: 9 March 2022 / Published: 12 March 2022

Abstract

:
Energy supply bases (ESBs) are vital regions, intended to satisfy global energy demands and secure global energy supplies, which provide large amounts of energy products to their host countries (and even the world through trade). However, due to long-term dependency on energy trade, ESBs are facing the dual pressure of reaching emission reduction targets and securing energy supplies and have become one of the main obstacles for host countries trying to reach emission reduction targets. (1) Methods: We used the EEBT model, SDA model, and CR model to explore the spatio-temporal features and mechanisms of embodied carbon emissions in inter-provincial trade (ECEs-PT) in Shanxi. (2) Results: The spatio-temporal development characteristic of net ECEs-PT outflow in Shanxi is “from expanded coverage to enhanced agglomeration”. A total of 98% of the net ECEs-PT is highly concentrated in coal mining and washing (Coalmin), metal smelting and rolling processing (MetalSmelt) and petroleum processing, coking, and nuclear fuel processing (RefPetraol). Moreover, the ECEs-PT driving forces were technology, structure, and scale. While trade expands, the pressure of CEs reduction is increasing. We discussed optimization for different types of sectors. The results could provide scientific support for similar ESBs to reduce carbon emissions more efficiently with less disturbance to energy supply stability.

1. Introduction

Fossil fuels are a long-standing and important guarantee for human survival and development but are also the major source of global carbon emissions (CEs) [1]. Thus, as the major producers and suppliers of fossil fuels, energy supply bases (ESBs) are the source and significant contributors of CEs, receiving serious carbon leakage from other regions [2]. Massive CEs embodied in trade often causes large amounts of extra CEs in ESBs, which makes ESBs extremely vulnerable as high CEs regions [3]. Globally, oil, natural gas, and other energy sources are highly concentrated in a few countries and regions such as the Middle East, Russia, and Venezuela. Many countries, such as Japan and Germany, rely on energy imports to maintain their production and living needs. According to the statistics of Carbon Dioxide Information Analysis Center (CDIAC), the main ESBs in the world, such as Russia and Saudi Arabia, were also among the top 10 countries in global CEs. This is also true for regions within a country. As the largest one of ESBs in the United States, Texas is also the region with largest CEs in the country [4]. Russia’s Novosibirsk, one of the ESBs in Russia, has huge annual CEs. In this process, ECEs-PT took a huge proportion. On the one hand, due to high energy demand, ESBs have gradually solidified into the economic development mode dominated by the export on energy products. Due to high dependence on energy products, the economic development of ESBs will be greatly affected by realizing the CEs reduction target [5]. On the other hand, the mission of ESBs is to satisfy necessary energy demands of human productivity and to secure energy supplies of the country (and even the world). As a result, the radical abatement measures may break the existing supply-demand balance [6]. Summarily, ECEs-PT has made ESBs into one the most vital difficulty for global CEs reduction, which is the decisive impact on the global CEs reduction realization [7]. Moreover, strengthening the features, mechanisms, and optimization research of ECEs-PT in ESBs is essential to secure energy supplies and achieving CEs reduction.
The energy supply and CEs in ESBs have attracted a lot of attention in the ESBs research [8,9,10,11]. For example, Kalashnikov et al., revealed the Far East as one of the main ESBs in Russian, providing large energy supplies. Martinez, A et al. showed that the CEs in Texas were mainly derived from energy production and interregional supply. However, current research has less consideration for the long-term features and mechanisms of ECEs-PT in ESBs, which lead to the limited research on targeted optimization policies to reduce CEs effect [12]. ESBs are currently trapped in the carbon leakage dilemma, which is affected ESBs to satisfy energy demands and secure energy supplies under pressing CEs carbon reduction targets [13,14,15,16,17,18,19].
To fill this research gap, we need to analyze the features the ECEs-PT transference in ESBs, and explore the underlying mechanisms of the features. The result could provide scientific support for achieve CEs reduction with the maximum CEs reduction while securing energy supply.
Therefore, Shanxi, the largest coal ESB in China [20] (China is the highest CEs country in the world), was selected as the case area [21]. 1997–2012, the core period for China to become the global largest fossil fuels consumer and CEs origin, was selected as the research period [22]. Based on the 1997, 2002, 2007, and 2012 input-output (IO) tables for China, this study used EEBT model to analyze the ECEs-PT transfer in ESBs to other regions, applied two-stage SDA model for exploring the driving forces for ECEs-PT. Finally, we built CR model and proposed time-sequenced regulatory measures to achieve the carbon emission reduction target with less disturbance to energy supply stability [23]. This study could provide reference to ESBs, such as the Middle East, North Africa, West Asia, and North America. We can reveal the ECEs-PT feature and mechanism of ESBs and Equationte optimization policies that secures energy supplies and reduces CEs to a greater extent.

2. Materials and Methods
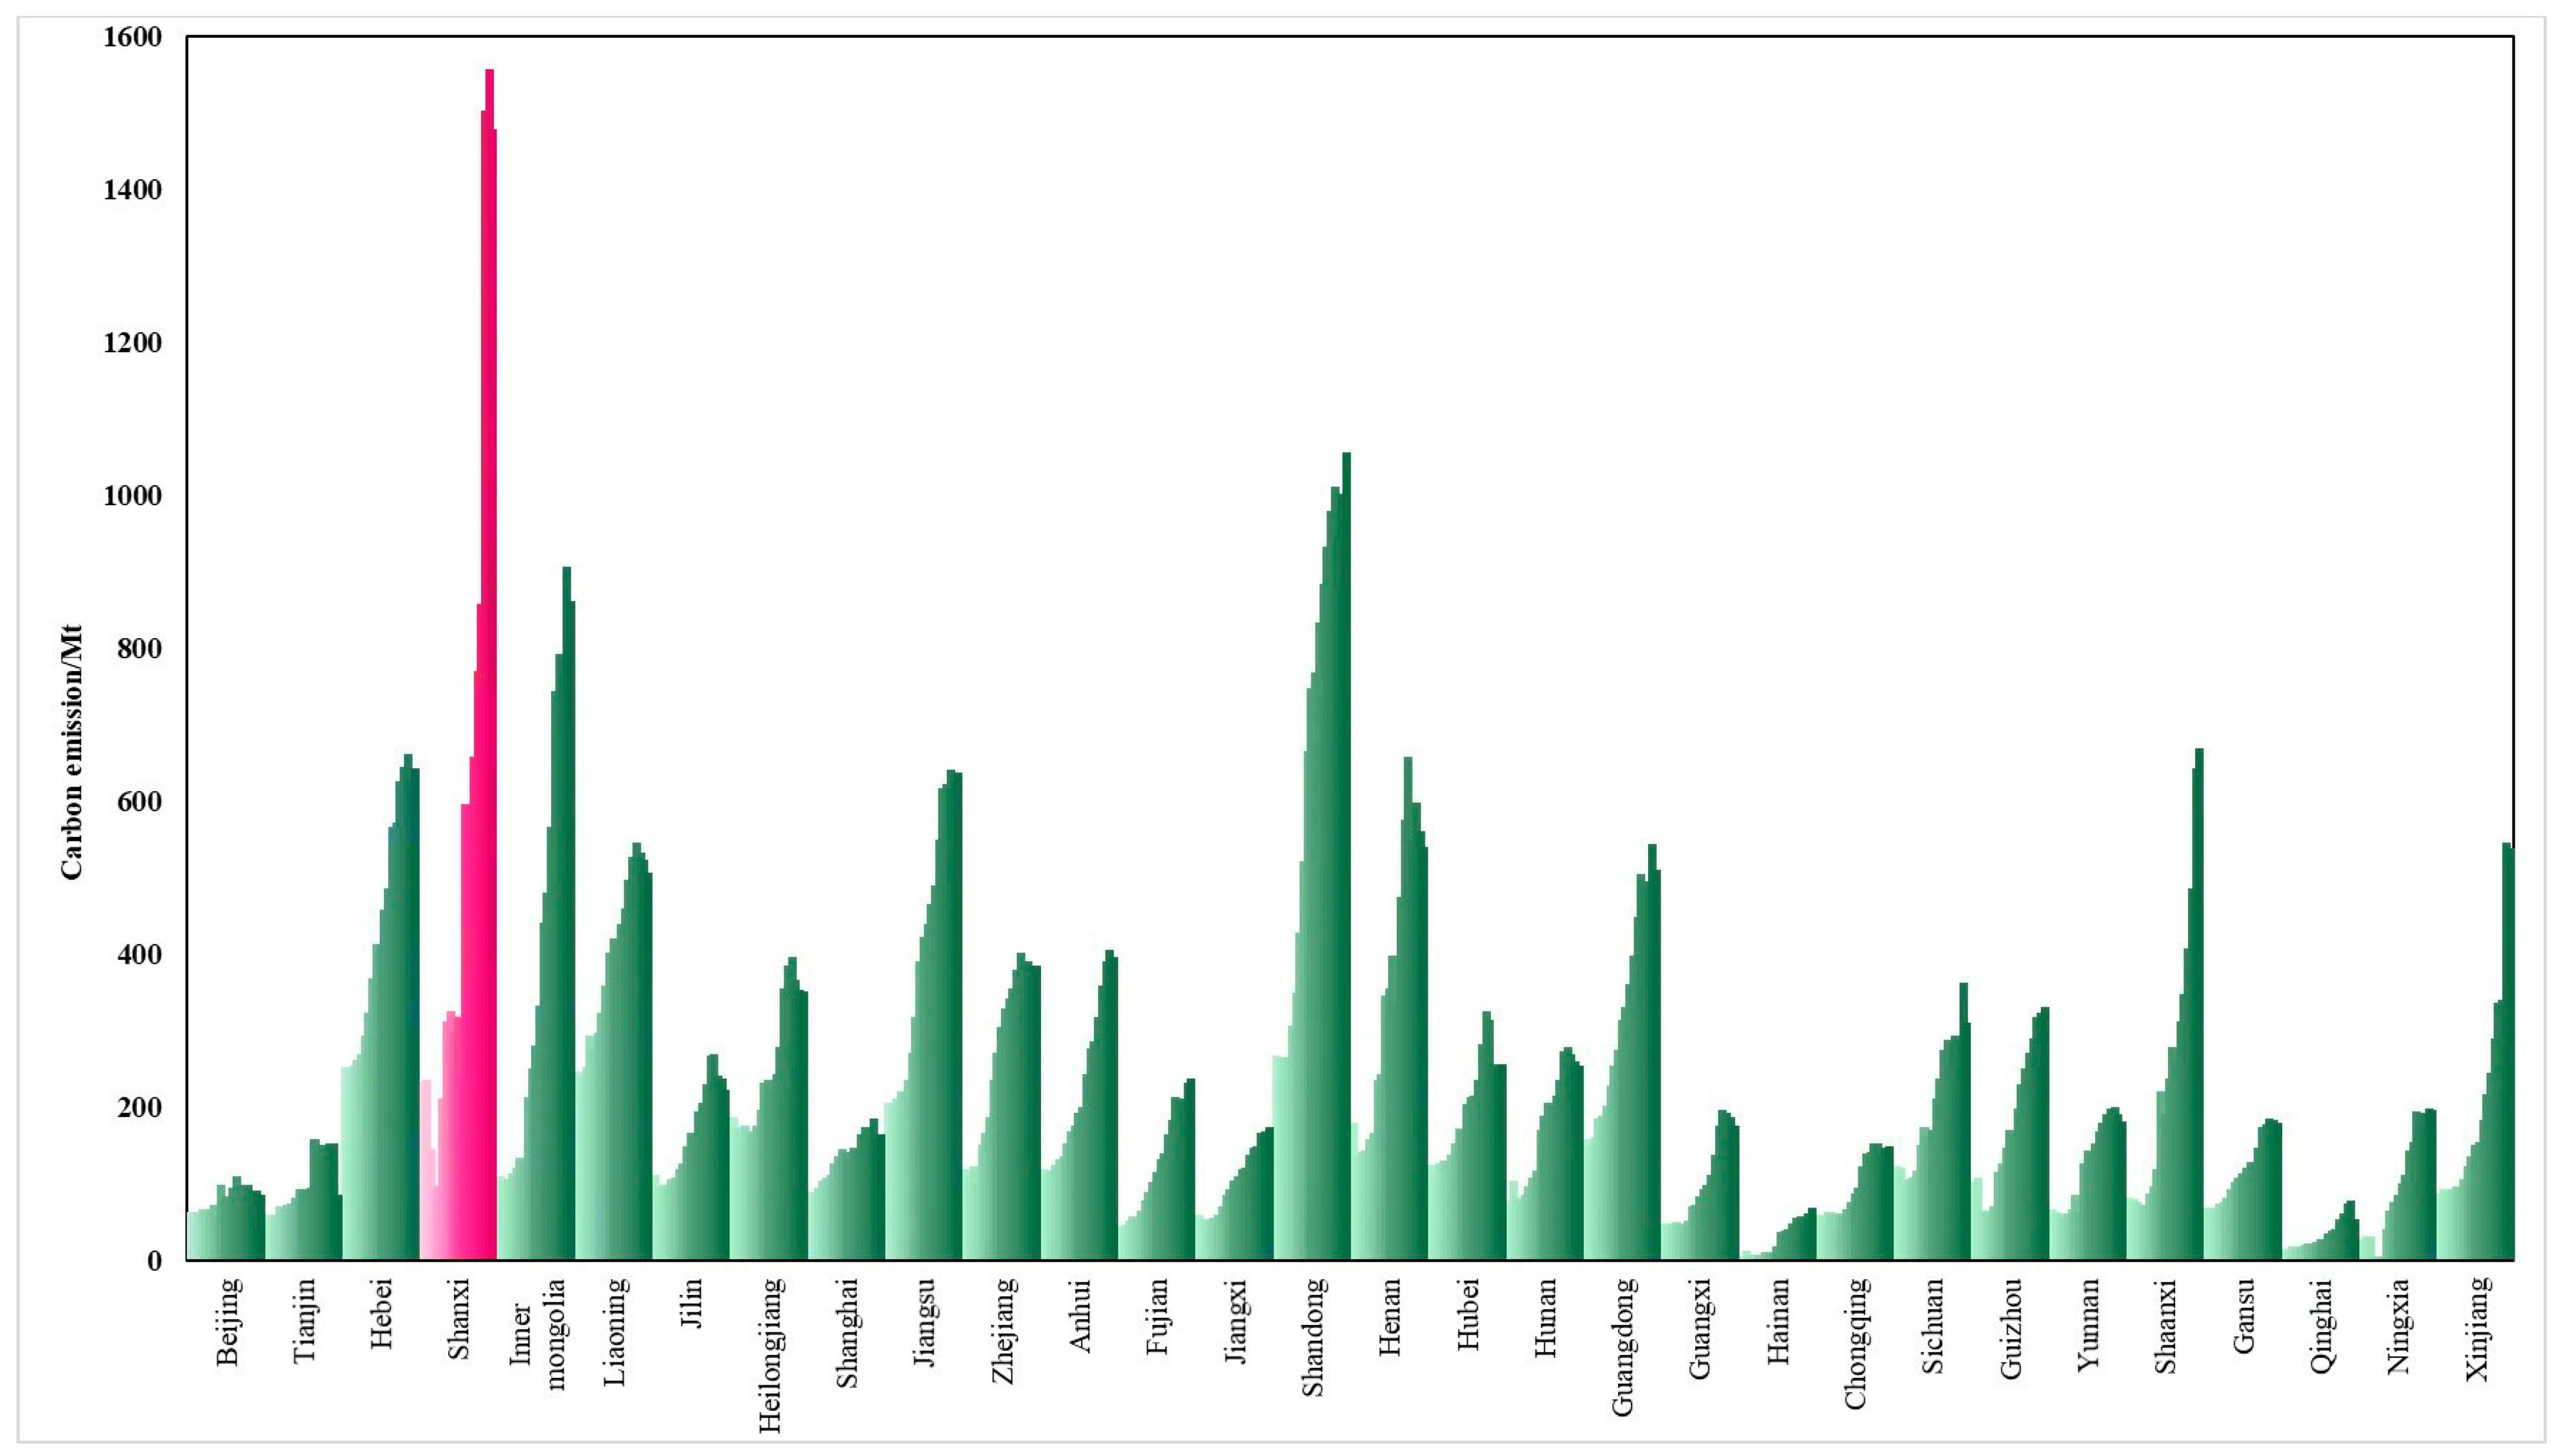
2.1. Case Study

China is the global largest CEs regions and energy consumer [24], The energy system of China is supported by fossil energy, especially coal [25], which took up 56.8% of China’s primary energy consumption in 2020. Shanxi (Figure 1), is the largest coal energy supplier in China [26]. whose raw coal output exceeds 20% of China and the contribution rate is more than 15% to primary and secondary energy. Therefore, Shanxi is taking an indispensable position in maintaining the stability of the national energy supply [27].
However, high-intensity production and trade of energy products have caused a large amount of ECEs-PT in Shanxi, whose CEs have been among the highest in China. In particular, in 1997–2015, the CEs of Shanxi increased from 231.00 to 1474.50 Mt, with an average annual growth rate of 35.89%, making Shanxi the largest and fastest-growing province in China (Figure 1). Among them, ECEs-PT was 117.72 Mt in 2012, which accounted for 13.77% of CEs. Thus, it is double pressure for Shanxi to secure energy supplies and achieve CER efficiently.
Especially in 2020, government put forward the “dual carbon goal”, China strives to reach CEs peak by 2030 and achieve CEs neutrality by 2060. The National Development and Reform Commission (NDRC) proposed to work out the action plan for reaching the CEs peak in fields including coal power. At the same time, China’s energy demand is rising continuously, and the pressure to secure energy supplies is growing concomitantly [28], especially as the production capacity recovers after COVID-19, energy demand is stronger. Government proposed that in the process of achieving the “dual carbon goal”, it is necessary to rectify “campaign-style” carbon reduction and ensure a stable and smooth electricity supply during the summer peak season. Therefore, as a major energy supply base in China, Shanxi must strive to promote the realization of the “dual carbon goal” with the premise of securing energy supplies, which means that Shanxi is under a greater pressure of CEs reduction.
Shanxi is just the most typical case of global ESBs, which are all facing double dilemma to achieve CEs reduction and secure energy supplies. Therefore, this study chose Shanxi as the case area to analyse the evolution features and driving mechanism of ECEs-PT in the rapid growth stage and Equationte targeted optimization policies, in order to provide a reference for ESBs in the world of secure energy supplies and scientific CEs reduction.

2.2. Methodology

2.2.1. ECEs-PT Spatio-Temporal Evolution: EEBT Model

In the 1930s, Leontief proposed the input-output analysis method. There are two common methods for calculating specific embodied emissions [29]: The EEBT model is transparent and is considered to be superior for analysing bilateral trade in order to propose climate measures. The MRIO model is applied for analysing the level of environmental responsibility arising from final consumption. This study used the EEBT model to analyse the evolution of ECEs-PT transference between Shanxi and other Chinese provinces from 1997 to 2012. Therefore, there were 121 MRIO tables in China in 1997, 2002, 2007, and 2012 (there were 30 tables in 1997, 2002 and 2007, respectively, and 31 tables in 2012). Then, we used the EEBT model to analyse the ECEs-PT transfer [30].
According to EEBT, we obtained Equation (1).
X = ( I A ) 1 E
where ( I A ) 1   matrix is generally called the Leontief inverse matrix, E represents the outflow value in interregional trade, X represents the total input value for E production.
The ECEs-PT outflow of Shanxi can be calculated as Equation (2):
C = e × μ × X = e × μ × [ ( I A ) 1 E ]
where C is the ECEs-PT outflow of Shanxi, e is the energy consumption coefficient, which represents different for different fuel types and represents standard coal generated by energy consumption per unit, and μ is the carbon emission coefficient, which represents carbon emissions from standard coal per unit.
Therefore The net ECEs-PT outflow from Shanxi to the other provinces ( n C i j ) can be calculated as Equation (3), and the net commodity value (CV) outflow from Shanxi to the other provinces n   ( V s i j ) can be calculated as Equation (4):
n C i j = C i j C j i
n V i j = V i j V j i
where C i j represents the ECEs-PT outflow from Shanxi, and C j i represents the ECEs-PT inflow to Shanxi. V i j represents the commodity value (CV) outflow from Shanxi, and V j i represents the CV inflow to Shanxi.
The validation of the model is as follows: Based on the calculation results of the SDA model, we conducted an empirical test. First, we compared the technical level changes, demand level changes, trade structure changes and trade scale changes of 28 industries in Shanxi Province in 1997 and 2012. The situation is checked and compared with the SDA analysis results to ensure the accuracy of the model.

2.2.2. Driving Mechanisms and Deep-Seated Causes Analysis Based on Two-Stage SDA Model

The input-output model can reveal the quantitative dependence between inputs and outputs of an economic system and its components and includes direct and indirect linkages. Combining SDA model with the EEBT model being more conducive to the analysis of total amounts, structural changes, development speeds and energy consumption in economic systems [31]. Therefore, this study combined the EEBT model with the two-stage SDA model to describe the driving forces of embodied carbon transference.
The specific derivation process is as follows: this study took 1997 as the base stage and 2012 as the reporting stage and decomposed the net ECES-PT outflows of the two time periods.
First, we split the net ECEs-PT outflow as Equation (5):
n C t = n K t × n V t
where n C t is the ECEs-PT outflow in stage t (t = 0 and 1, in our study, 0 represents 1997, and 1 represents 2012), n K t showing the technology difference. n V x t is the related trade demand showing the demand difference.
Then, the Equation of the first stage SDA model is as follows:
Δ n C = n C 1 n C 0 = n K 1 n V 1 n K 0 n V 0 = ( 1 / 2 ) ( Δ n K ) ( n V 1 + n V 0 ) + ( 1 / 2 ) ( n K 1 + n K 0 ) ( Δ n V )
where ( 1 / 2 ) ( Δ n K ) ( n V 1 + n V 0 ) represents the impact of connected changing technology. ( 1 / 2 ) ( n K 1 + n K 0 ) ( Δ n V ) represents the impact of connected changing demand value.
According to the principle of first stage SDA model research, we performed the second stage SDA model. We split the net CV outflow as Equation (7):
Δ n V = n V 1 n V 0 = n S 1 n G 1 n S 0 n G 0 = ( 1 / 2 ) ( Δ n S ) ( n G 1 + n G 0 ) + ( 1 / 2 ) ( n S 1 + n S 0 ) ( Δ n G )
where n S t represents the net CV outflow coefficient matrix from Shanxi to other provinces in stage t, n G t represents the net CV outflow matrix in interprovincial trade from Shanxi to other provinces in stage t, ( 1 / 2 ) ( Δ n S ) ( n G 1 + n G 0 ) represents the variation of net ECEs-PT driven by technology, and ( 1 / 2 ) ( n S 1 + n S 0 ) ( Δ n G ) represents the variation of net ECEs-PT driven by scale.
The demand difference can be decomposed into the structure difference and scale difference [32], as Equation (8):
( 1 / 2 ) ( n K 1 + n K 0 ) ( Δ n V ) = ( 1 / 2 ) ( n K 1 + n K 0 ) ( 1 / 2 ) ( Δ n S ) ( n G 1 + n G 0 ) + ( 1 / 2 ) ( n K 1 + n K 0 ) ( 1 / 2 ) ( n S 1 + n S 0 ) ( Δ n G )
However, the driving mechanism of ECEs-PT is complex, such as efficiency, production structure, etc. More in-depth research on these factors can better propose the optimization measures of ECEs-PT in ESBs, We will further in-depth analysis in future research to make our results more accurate and specific.

2.2.3. Optimization Policies Equationtion: CR Model

To analyse the coupling relationship between net CV outflow and net implied carbon outflow, we established a CR model [33]. According to the results of the CR model analysis, optimization objectives and measures were Equationted. In the CR model, the contribution rate change is used to figure out the changes between net CV outflows and net ECEs-PT outflows.
First, according to Equation (9), we calculated the Δ n R V and Δ n R C for each industry.
{ Δ n R V = n R V 1 n R V 0 = n V i 1 / V t o t a l 1 n V i 0 / V t o t a l 0 Δ n R C = n R C 1 n R C 0 = n C i 1 / C t o t a l 1 n C i 0 / C t o t a l 0
where Δ n R V and Δ n R C represents the changing outflow rate of net CV and net ECEs-PT, respectively; V t o t a l t represents the total CV (including outflow and inflow), V t o t a l t = V x t + V i t ; and C t o t a l t represents the total ECEs-PT (including outflow and inflow), C t o t a l t = C x t + C i t . n V i t and n C i t represents the net CV outflow and net ECEs-PT outflow of sector i in year t, respectively.
Then, with the coupling relationship of Δ n R V and Δ n R C , we divided sectors into four types. The specific divisions are as follows:
Type A: Δ n R V > 0 and Δ n R C < 0, represents increased net CV outflow but decreased net ECEs-PT outflow during the study period.
Type B: Δ n R V < 0 and Δ n R C > 0, represents decreased net CV outflow but increased net ECEs-PT outflow during the study period.
Type C: Δ n R V > 0 and Δ n R C > 0, represents increased net CV outflow and increased net ECEs-PT outflow during the study period. Type C1: Δ n R V > Δ n R C > 0, represents the increased net CV outflow more than the increased net ECEs-PT outflow; Type C2: Δ n R C > Δ n R V > 0, represents increased net CV outflow less than increased net ECEs-PT outflow.
Type D: Δ n R V < 0 and Δ n R C < 0, represents decreased net CV transference and decreased net ECEs-PT transference during the study period.

2.3. Data

In this study, we used the extended IO tables of 1997, 2002, 2007 and 2012 for China [34,35,36,37]. The IO tables were compiled by the Development Research Center of the State Council, P.R.C. and were compiled every five years. In order to unify the data for time evolution analysis, we have consolidated the four annual industries into 28 identical sectors, the 28 sectors are farming, forestry, animal husbandry, and fisheries (Agri); coal mining and washing (Coalmin); petroleum and natural gas extraction (CrudeOil); metal ores mining and dressing (MtealOreMin); nonmetal mineral ores mining and dressing (NonMtealOreMin); food manufacturing and tobacco processing (FoodTobacco); textile industry (Textile); apparel, leather, and related products (Apparel); wood processing and furniture manufacturing (WoodFurniture); papermaking, printing and paper product manufacturing (PaperCulture); petroleum processing, coking, and nuclear fuel processing (RefPetrol); chemicals and medicinal products (Chemical); nonmetal mineral products (NonMProd); metal smelting and rolling processing (MetalSmelt); metal products (MetalProd); ordinary and special machinery manufacturing (Machinery); transportation equipment manufacturing (TranspEq); electric equipment and machinery manufacturing (ElecMachinery); electronic and telecommunications equipment manufacturing (ElectronicEq); other manufacturing industry (OtheManuf); electricity and heat production and supply (ElectpowerProd); gas production and supply (Gas); water production and supply (Water); construction (Construct); transportation, storage, and post and telecommunication services(Transport); wholesale and retail trade, catering services (WholesRetail); and other.
Due to computational requirements, we estimated the CEs coefficients and energy consumption coefficients for the provinces according to the method provided by the Intergovernmental Panel on Climate Change [38]. We then converted different energy types into standard coal to resolve the differences among energy types.

3. Results

3.1. The Variation Features of the ECEs-PT Outflow in Shanxi

In the 1997–2012 period, the net ECEs-PT outflow in Shanxi increased from 9.49 Mt to 55.49 Mt, which showed a sustained and fast increasing tendency and an average annual growth rate of 12.49%. The growth was fastest from 2007 to 2012. The trade in energy products has driven the rapid economic growth in Shanxi. At the same time, it has also led to a rapid increase of ECEs-PT. This has become the main source of its CEs reduction pressure.

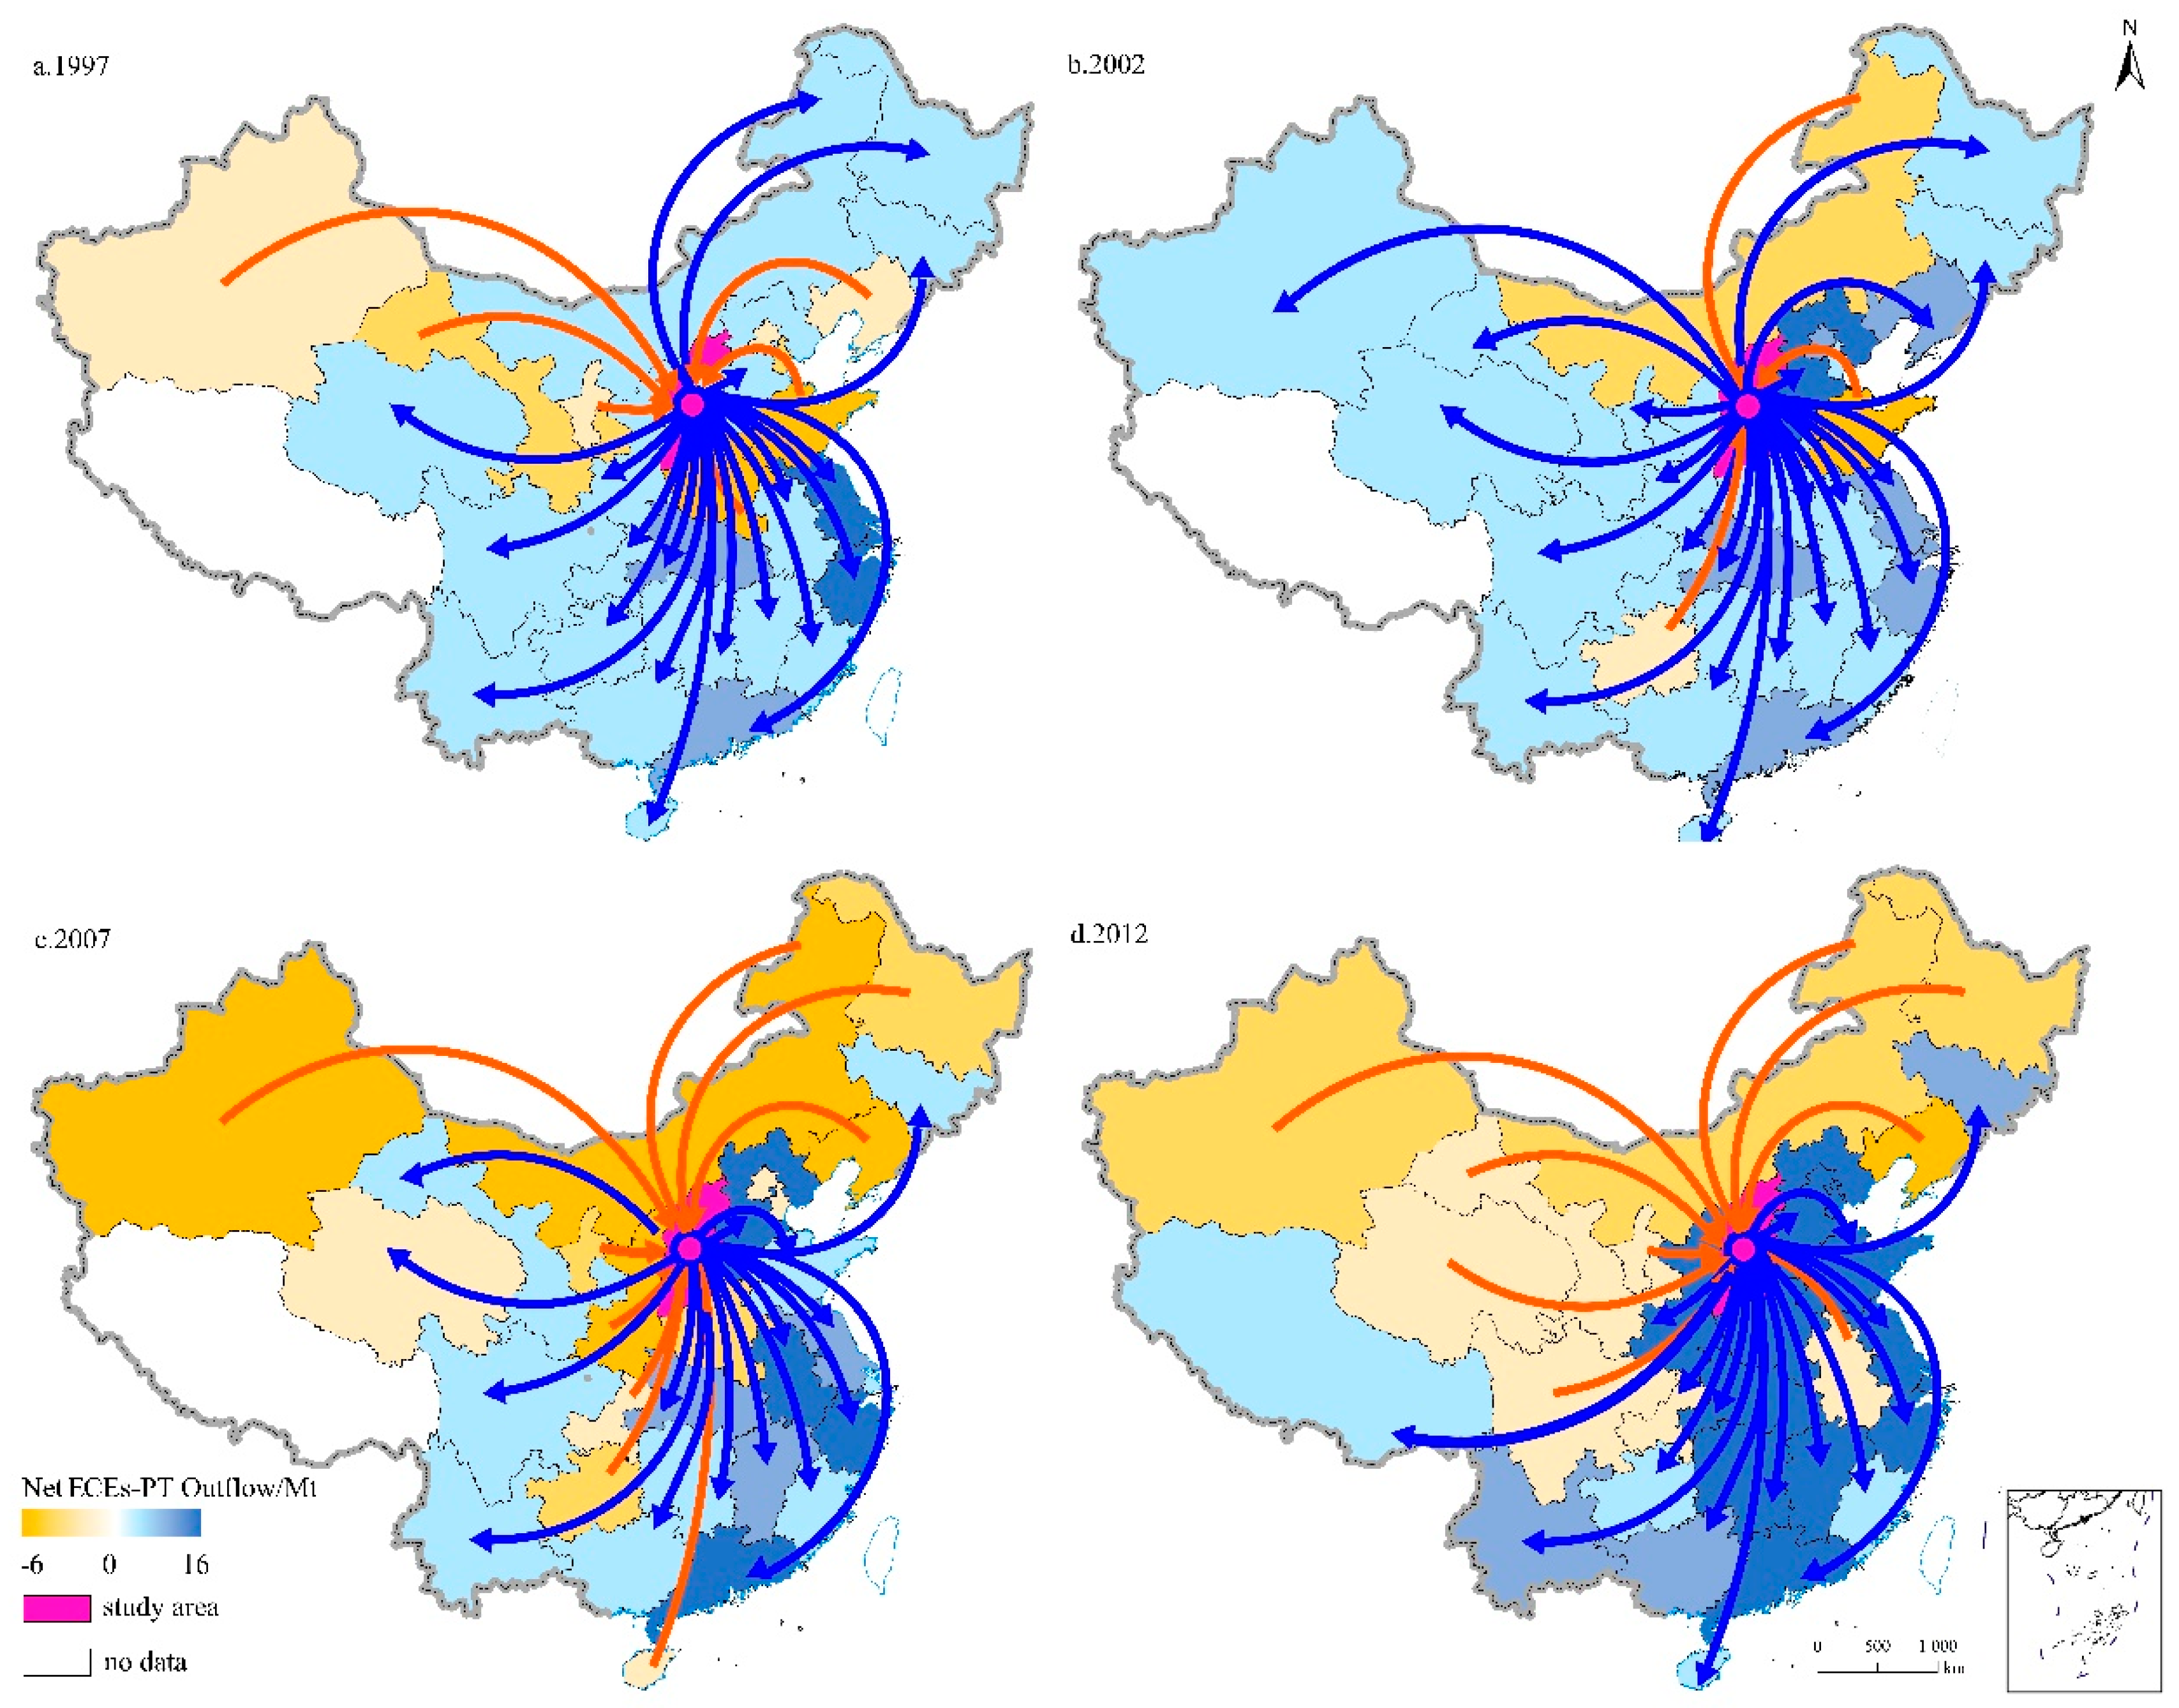
3.2. Spatio-Temporal Features of the Net ECEs-PT Outflow in Shanxi

1997–2012, the net ECEs-PT outflow in Shanxi grew continuously. Its spatial evolution features was “from expanded coverage to agglomeration enhancement”.
1997–2002, the spatial evolution features of net ECEs-PT outflow was “expanded coverage” in Shanxi. During this period, China’s economy growth rapidly with increased energy demand.
As China’s largest coal supply base, Shanxi supports the energy demand in many regions, and thus bears huge ECEs-PT transfer pressure. Target provinces for net ECEs-PT outflow in Shanxi rapidly increased from 21 in 1997 (Figure 2a) to 26 in 2002 (Figure 2b), which covered almost all of China. As a result, Shanxi became the target region of carbon leakage in China, and its CEs increased rapidly.
2002–2012, with the refinement and deepening of the industrial division in China, the net ECEs-PT outflow in Shanxi changed into “enhanced agglomeration”. The targeted provinces for the net ECEs-PT outflow gradually agglomerated in the eastern coastal provinces with energy demand increased rapidly (Figure 2d). Therefore, the targeted provinces for net ECEs-PT outflow decreased to 20, but the total net ECEs-PT outflow increased and reached 55.49 Mt. By 2012, the main targeted provinces were Jiangsu, Zhejiang and Guangdong, with net ECEs-PT outflow of 15.51 Mt, 10.26 Mt and 5.23 Mt, respectively, which accounted for 55.87% of the total net ECEs-PT outflow of Shanxi.
Similar to the situation in Shanxi, along with the continuous refinement and enhancement of the international industrial division, trading partners of global ESBs have agglomerated to some regions [39]. This trade situation has further exacerbated the accumulation of ECEs-PT and the unification of trade structures in ESBs. As a result, ESBs fall under the “resource curse” and difficult to achieve industrial transformation.

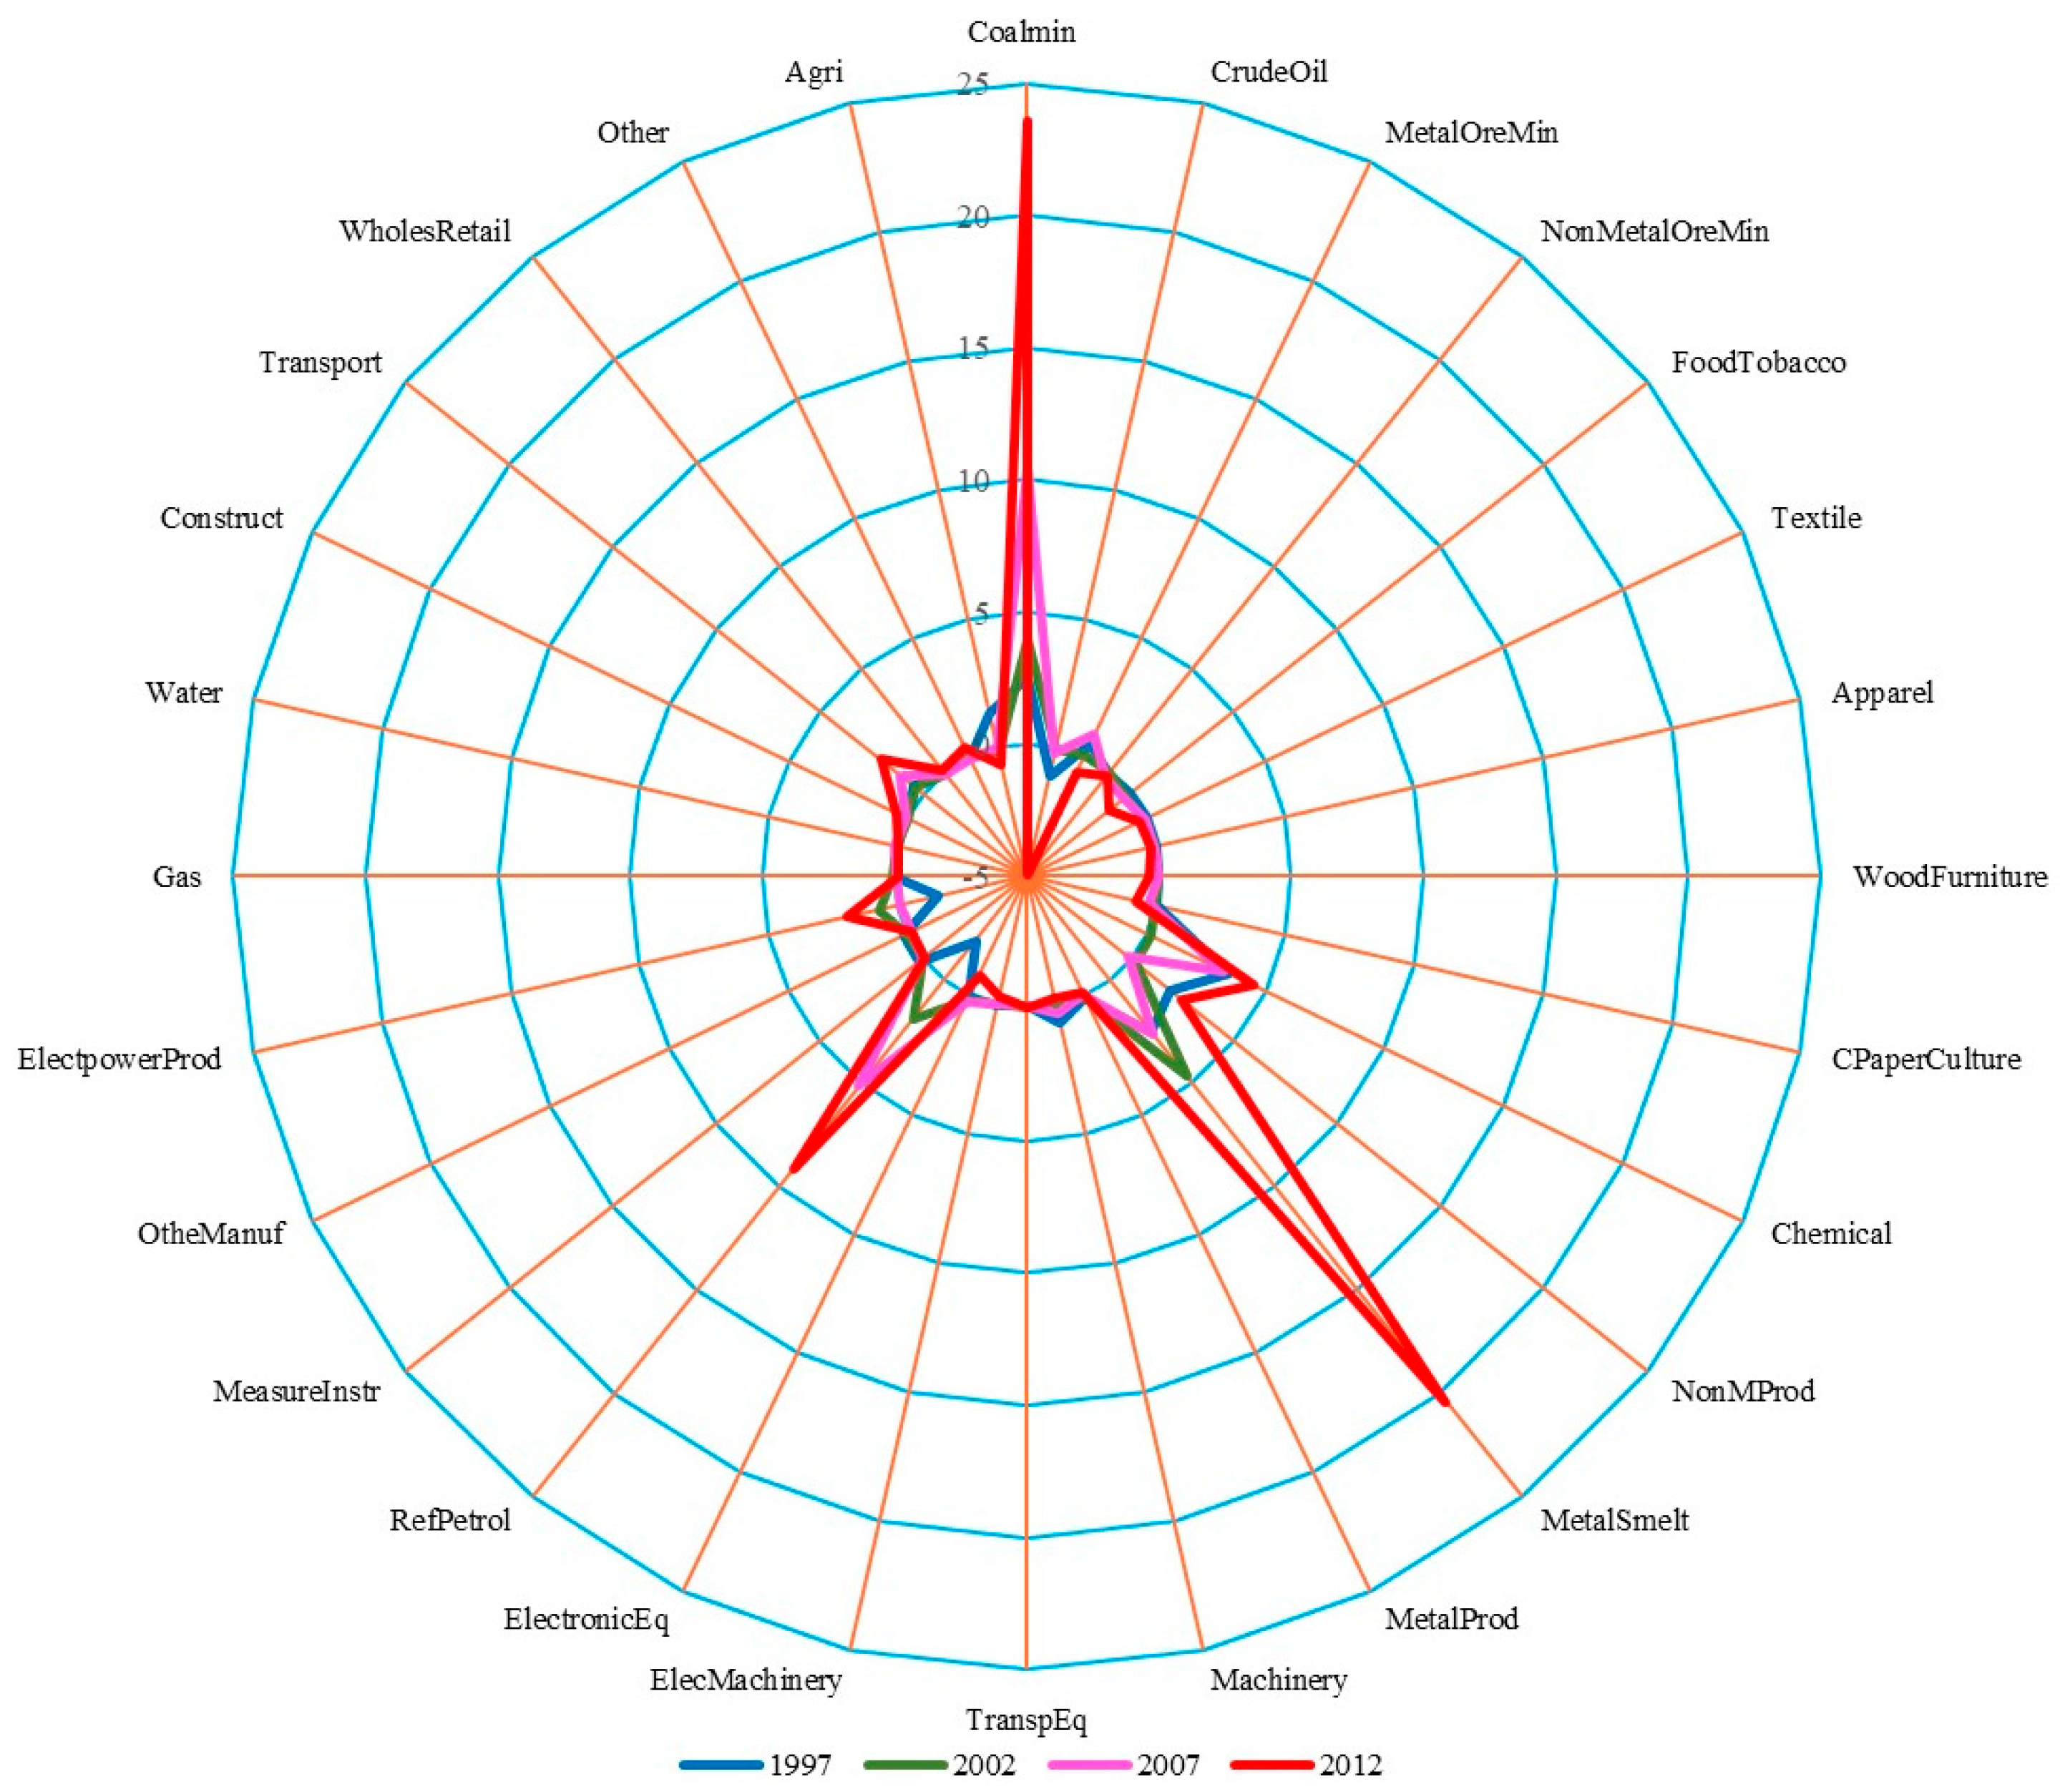
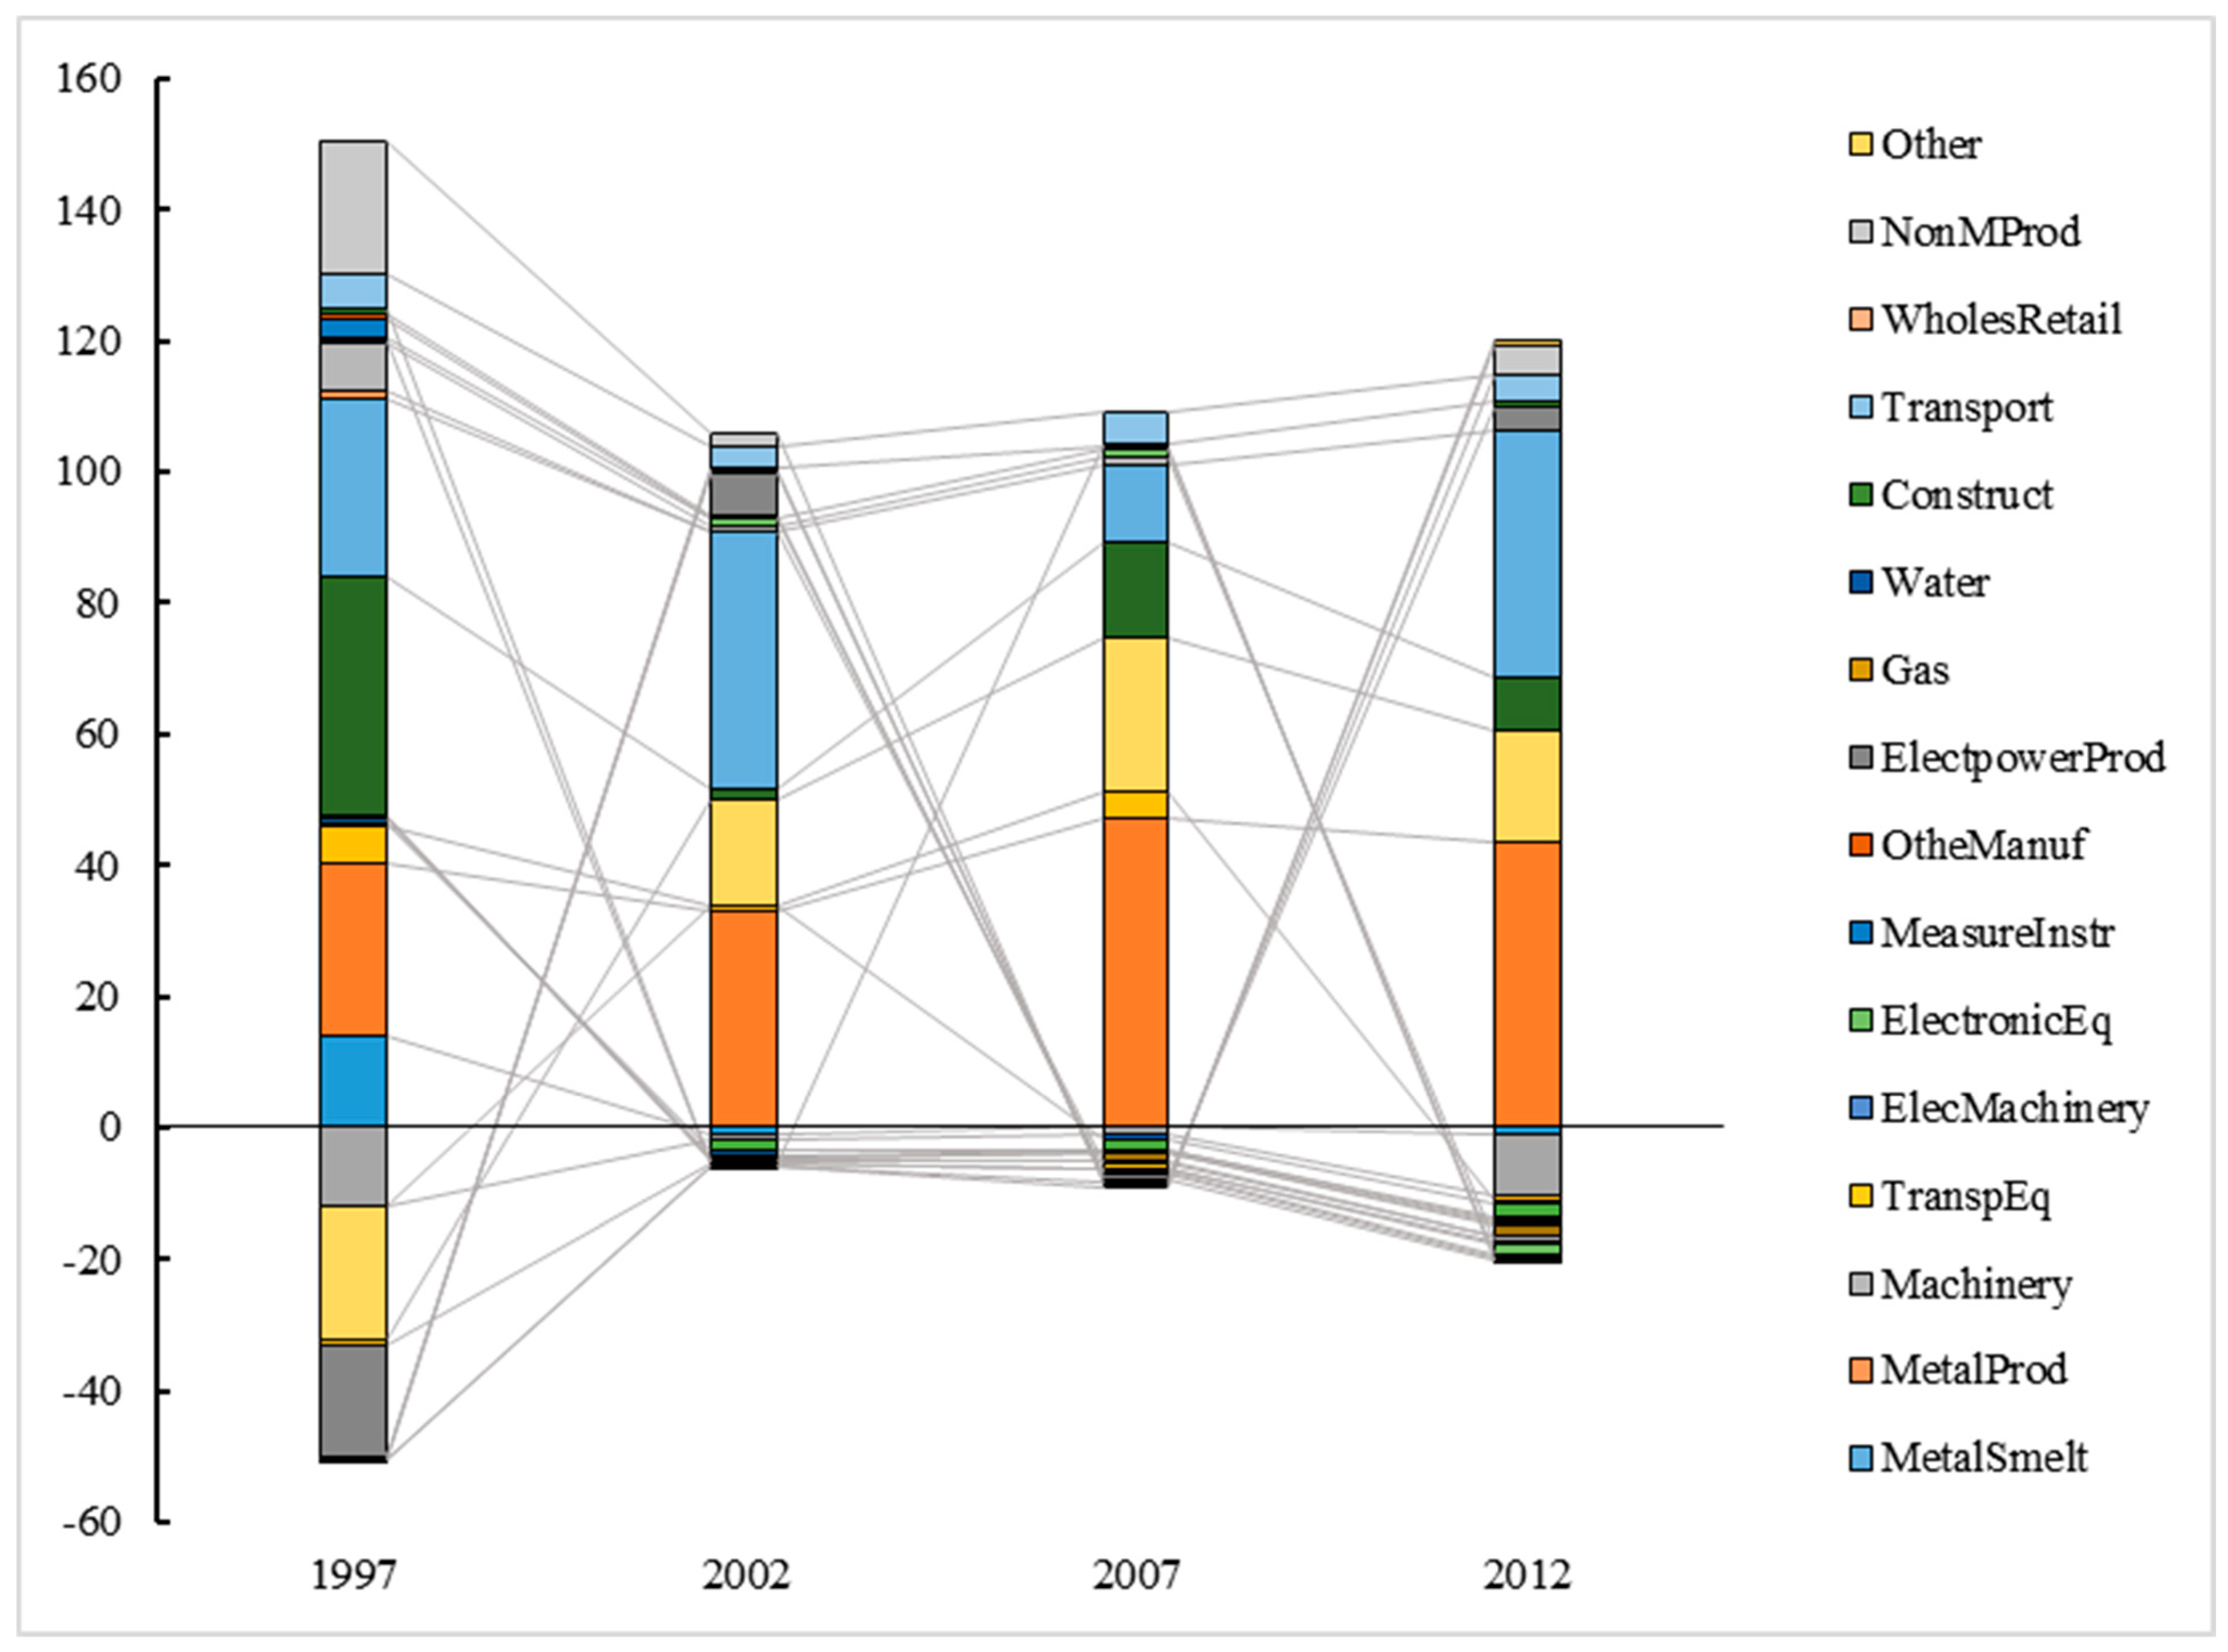
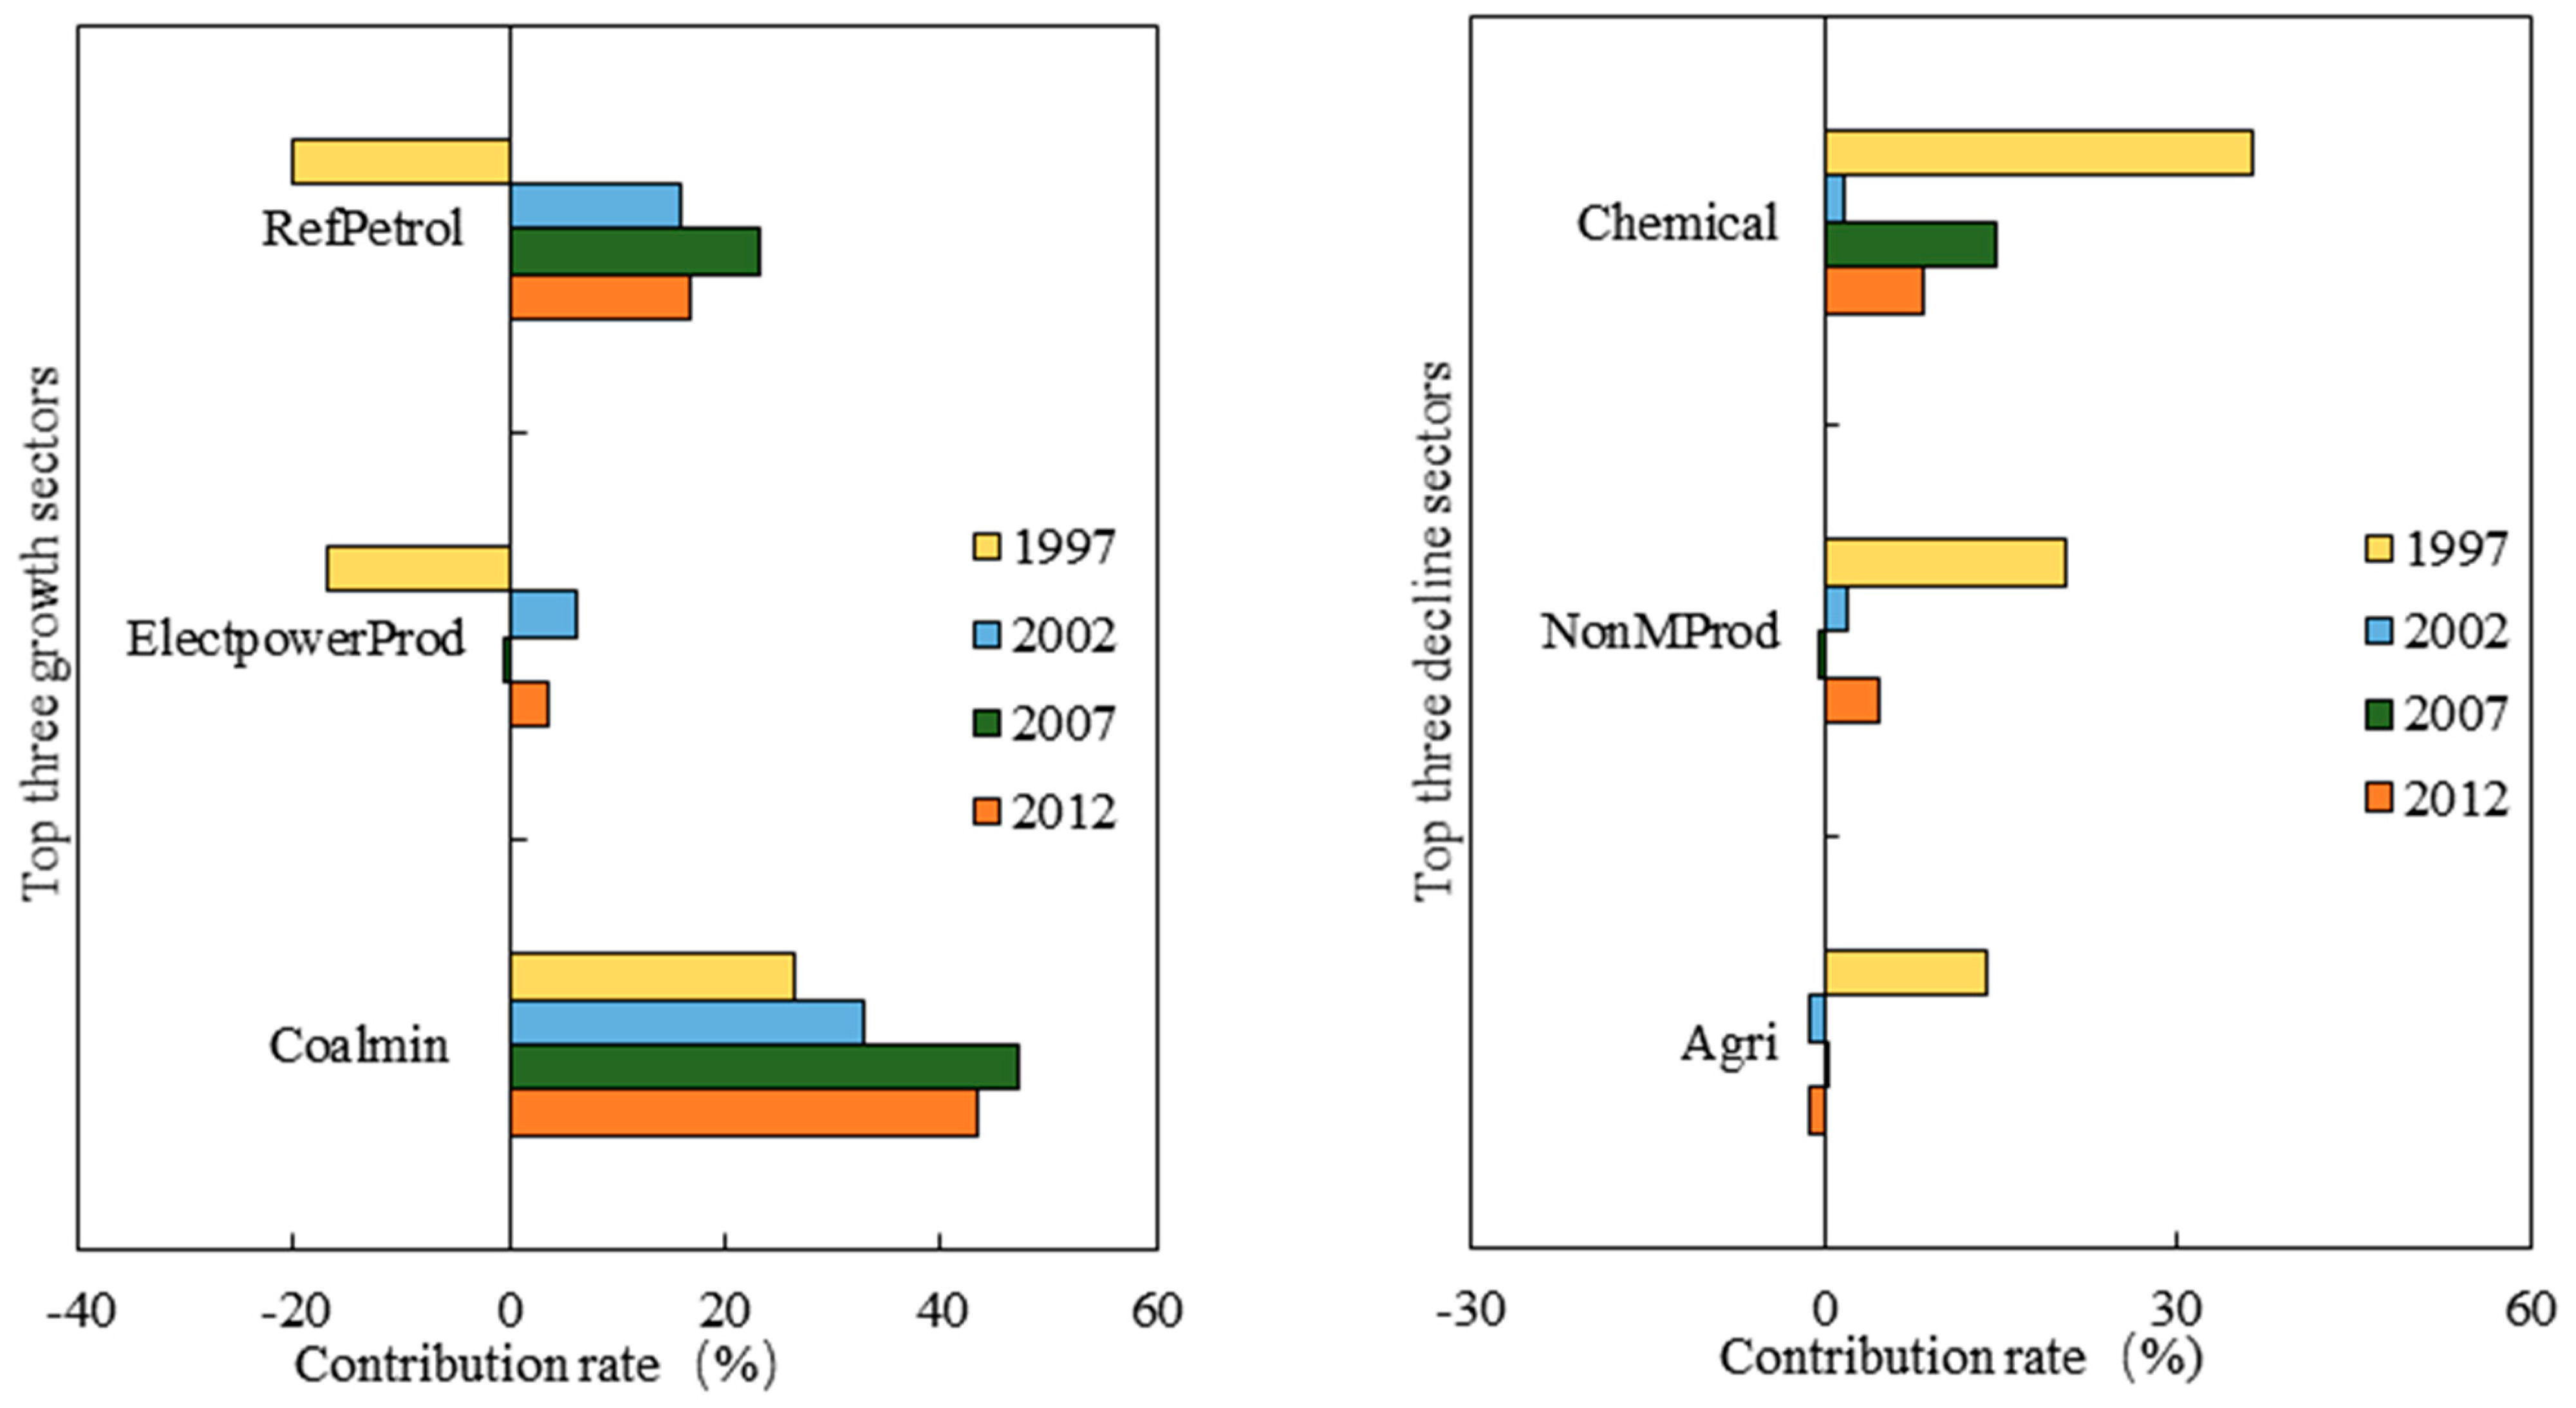
3.3. Industry Features of the Net ECEs-PT Outflow in Shanxi

To further reveal the sources and driving mechanisms of ECEs-PT transference, we traced the industrial changes of ECEs-PT transference in Shanxi over 15 years. In 1997, the top sector with the greatest net ECEs-PT outflows was chemicals and medicinal products (Chemical), with net ECEs-PT outflow of 3.46 Mt (Figure 3), and contribution rates of 36.49% (Figure 4). In 2012, the industry converted to coal mining and washing (Coalmin), with net ECEs-PT outflow of 23.60 Mt (Figure 3) and contribution rates of 43.51% (Figure 4).
The net ECEs-PT outflow contribution rate of Chemical fell from 36.49% in 1997 to 8.36% in 2012 (Figure 4), a decrease of 28.13%. Coalmin became the sector of the greatest decrease in net ECEs-PT outflow contribution rates. This decline was due to a recession in the industry.
Chemical was a traditional dominant industry that was early developed in Shanxi. The majority of Chemical is the coal chemical. Due to the great market demand and high profits of primary coal commodities, enterprises were generally satisfied with the considerable income from primary coal commodities and have lacked the motivation for technological innovation and in-depth research. Therefore, since 1999, large chemical enterprises, such as the Shanxi Coking Plant, have encountered problems such as ageing equipment and low efficiency. In 2010, for example, the chemical industry assets of Shanxi accounted for 2.3% of China chemical industry assets, ranking 12th. However, the chemical industry profits of Shanxi accounted for only 0.28% of China chemical industry profits, ranking 27th, and the return on assets (ROA) was only 0.81%. The ROA for the chemical industry in Inner Mongolia, with a scale similar to that of Shanxi, reached 3.8%.
The traditional equipment and technology of the coal chemical industry in Shanxi have not been updated and are still in the stage of primary commodities with low resource utilization rates. At the same time, other provinces have invested technology and funds to actively develop new coal chemical industries. When comparing with Inner Mongolia, Shaanxi, Ningxia, Anhui, Henan, and other provinces that subsequently strongly developed their coal chemical industries, Shanxi gradually lost its comparative advantage. Shanxi formed a trade mode of relying on primary coal products to create value and obtained only primary processing fee in the industry chain. What’s worse, Shanxi came at significant environmental costs, such as carbon leakage, and fell under the dilemma of “resource curse”. Therefore, the decline of the net ECEs-PT in Chemical was the recession of the industry. The fundamental reason for this phenomenon is that, for a long time, the market pursued only economic interests and regardless of the massive potential ecological costs. In the end, this led to increasingly extensive economy and unbalanced industrial structure of Shanxi.
In contrast, Coalmin gradually became the industry with the largest net ECEs-PT outflow in 2012 (Figure 3), with the contribution rate increased from 26.52% to 43.51%. (Figure 4). As a large coal-producing base, the development of Shanxi mainly depended on the energy products such as coal from 1997 to 2007. Especially after 2001, the demand for the coal market gradually became stronger, stimulating investment in the coal industry, so the sale of primary coal products gradually became the key trade in Shanxi. From 1997 to 2012, Shanxi’s raw coal production ranked first in China and accounted for more than 20% of the national raw coal production. At the same time, the net ECEs-PT outflow contribution rate of Coalmin continued to rise, making it the largest industry of net ECEs-PT outflow in 2012 (Figure 5).
MetalSmelt was the second largest industry of net ECEs-PT outflow in 2012 (Figure 3). Since 1997, the proportion of MetalSmelt for the net ECEs-PT outflow in Shanxi has continued to rise, and MetalSmelt became the largest industry of net ECEs-PT outflow in 2002. As the main body of the MetalSmelt, the important raw material of steel industry is coking coal. Therefore, Shanxi plays an indispensable role in the coking coal supply of China’s steel industry. The net ECEs-PT outflow of MetalSmelt in Shanxi was stimulated by trade demand and it remained high.
RefPetral was the third largest industry with net ECEs-PT outflow in 2012 (Figure 3). At the same time, it was also the industry with the largest contribution rate rise of the net ECEs-PT outflow from 1997 to 2012 (Figure 4). Its contribution rates increased from −20% in 1997 to 16.85% in 2012, with an increase of 36.85%. The rise of RefPetral was mainly due to the continuous increase in the proportion of the coking industry. National coal demand has been rising in 1997–2012. Therefore, the value created by the coal coking industry prompted Shanxi to continuously increase its export trade of this industry, which directly led to the increase of net ECEs-PT outflow.

3.4. Driving Mechanisms and Deep-Seated Causes of the Net ECEs-PT Transference in Shanxi

According to the analysis on spatio-temporal features of net ECEs-PT outflow in Shanxi, this study explored the deep-seated causes of the net ECEs-PT outflow.
In the first stage SDA model, we decomposed the changes in net ECEs-PT outflow in Shanxi into technology-driven and demand-driven to analyse the impact of technology and demand differences between Shanxi and other regions on carbon transference. The results revealed that from 1997 to 2012, net ECEs-PT outflow increased by 46.00 Mt, of which 49.25% was caused by technical disadvantages and 50.75% was caused by trade demand. The top three sectors that had the largest contributions of demand-driven and technology-driven to the net ECEs-PT outflow were Coalmin, RefPetral, and MetalSmelt (Table 1). These three sectors were all sectors with high CEs and high energy consumption, and they were also the three sectors with the largest net ECEs-PT outflow in Shanxi in 2012.
The results of the first stage of SDA model showed that, the technical disadvantages and trade demand of Shanxi were increasing and that the low technological level and high trade demand were the dual driving forces of the increase in net ECEs-PT outflow. As for demand-driven, different structures and different scales also showed different impacts on ECEs-PT outflow. Therefore, in the second stage of the two-stage SDA model, this study further decomposed the demand-driven into structure-driven and scale-driven. This study analysed the influence of the differences in trade structures and trade scales on the net ECEs-PT transference in Shanxi and then obtained the driving forces and contribution matrix of the net ECEs-PT transference in various industries (Table 1).
The second-stage SDA model decomposition results showed that Coalmin was the sector with the largest demand-driven effect of net ECEs-PT transference in Shanxi. And the corresponding structure-driven and scale-driven effects accounted for 52.65% and 47.45% of the total demand-driven effect, respectively. MetalSmelt was the second largest demand-driven effect sector, with corresponding structure-driven and scale-driven effects accounting for 51.51% and 48.49%, respectively. The backward demand structure and continuous expansion of the trade scale were the driving forces for the increases of net ECEs-PT outflow of Coalmin and MetalSmelt. RefPetral was the third largest demand-driven effect sector, with corresponding structure-driven and scale-driven effects accounting for 65.14% and 34.86%, respectively. The irrational demand structure was the main driving factor for the increase in the industry’s net ECEs-PT outflow. The pulling role of the demand structure has not been reflected.
Based on the driving mechanisms of the net ECEs-PT outflow in Shanxi, it can be found that the commodity trade and ECEs-PT transference of Shanxi are all related to trade of primary processing energy products such as coal and coking. Although such trading system can obtain considerable economic benefits in the short term, it will lose the capability of long-term, higher-quality development. Before 1997, China’s economy had not yet entered a stage of rapid economic growth, and the national demand for coal was not very high. Thus, Shanxi was able to rely on the advantages of coal to develop the coal chemical industry, metal smelting and other downstream industries. From 1997 to 2012, during the 15 years of rapid economic growth in China, a large number of industries developed, energy demand increased rapidly, and coal prices continued to rise. Direct mining and sale of coal required little investment and simple technologies but could obtain high income. It promoted a rapid expansion of Coalmin scale in Shanxi, but the development quality was not improved. In addition, successive intensive processing-related industries that produced energy products with high costs, high difficulty and slow effects gradually shrank.
Further research revealed that, during this period, town-owned enterprises became the main coke producers in Shanxi. In 2002, town-owned coking enterprises in Shanxi exported 9.50 Mt of coke, which accounted for 70% of China’s total coke exports. Generally, these enterprises had limited investment, technology levels and outdated equipment. What’s worse, most of them did not recover coking by-products such as gas and coal tar. The recovery rates of coal mining were low, and the production mode was extremely extensive. According to “the Energy Development Report of China 2007”, the recovery rates in town-owned coal mines were only 10~20%, which is much lower than state-owned coal mines of about 75%. As a result, the coal industry is developing with low quality and low efficiency.
From the evolution and driving mechanisms of ECEs-PT transference in Shanxi, it can be observed that the ECEs-PT transference of industries of Shanxi became increasingly concentrated on Coalmin, MetalSmelt, and other coal dependent industries. Moreover, with the decline of the high-tech industries, the industrial structure has regressed, the “resource curse” has intensified. In the international energy market, ESBs face similar problems. The negative effects brought by energy trade have caused many ESBs in the world to suffer from the same “resource curse” as Shanxi. Energy enrichment, which brings about economic benefits, it has led to uncoordinated industrial development mode in ESBs. Their high dependence on primary energy exports for economic benefits not only always places them at the lower end of the global value chain, but also makes industrial transformation and upgrading difficult. At the same time, it also brings challenges to environmental governance, ecological protection, and sustainable economic development.

4. Discussion

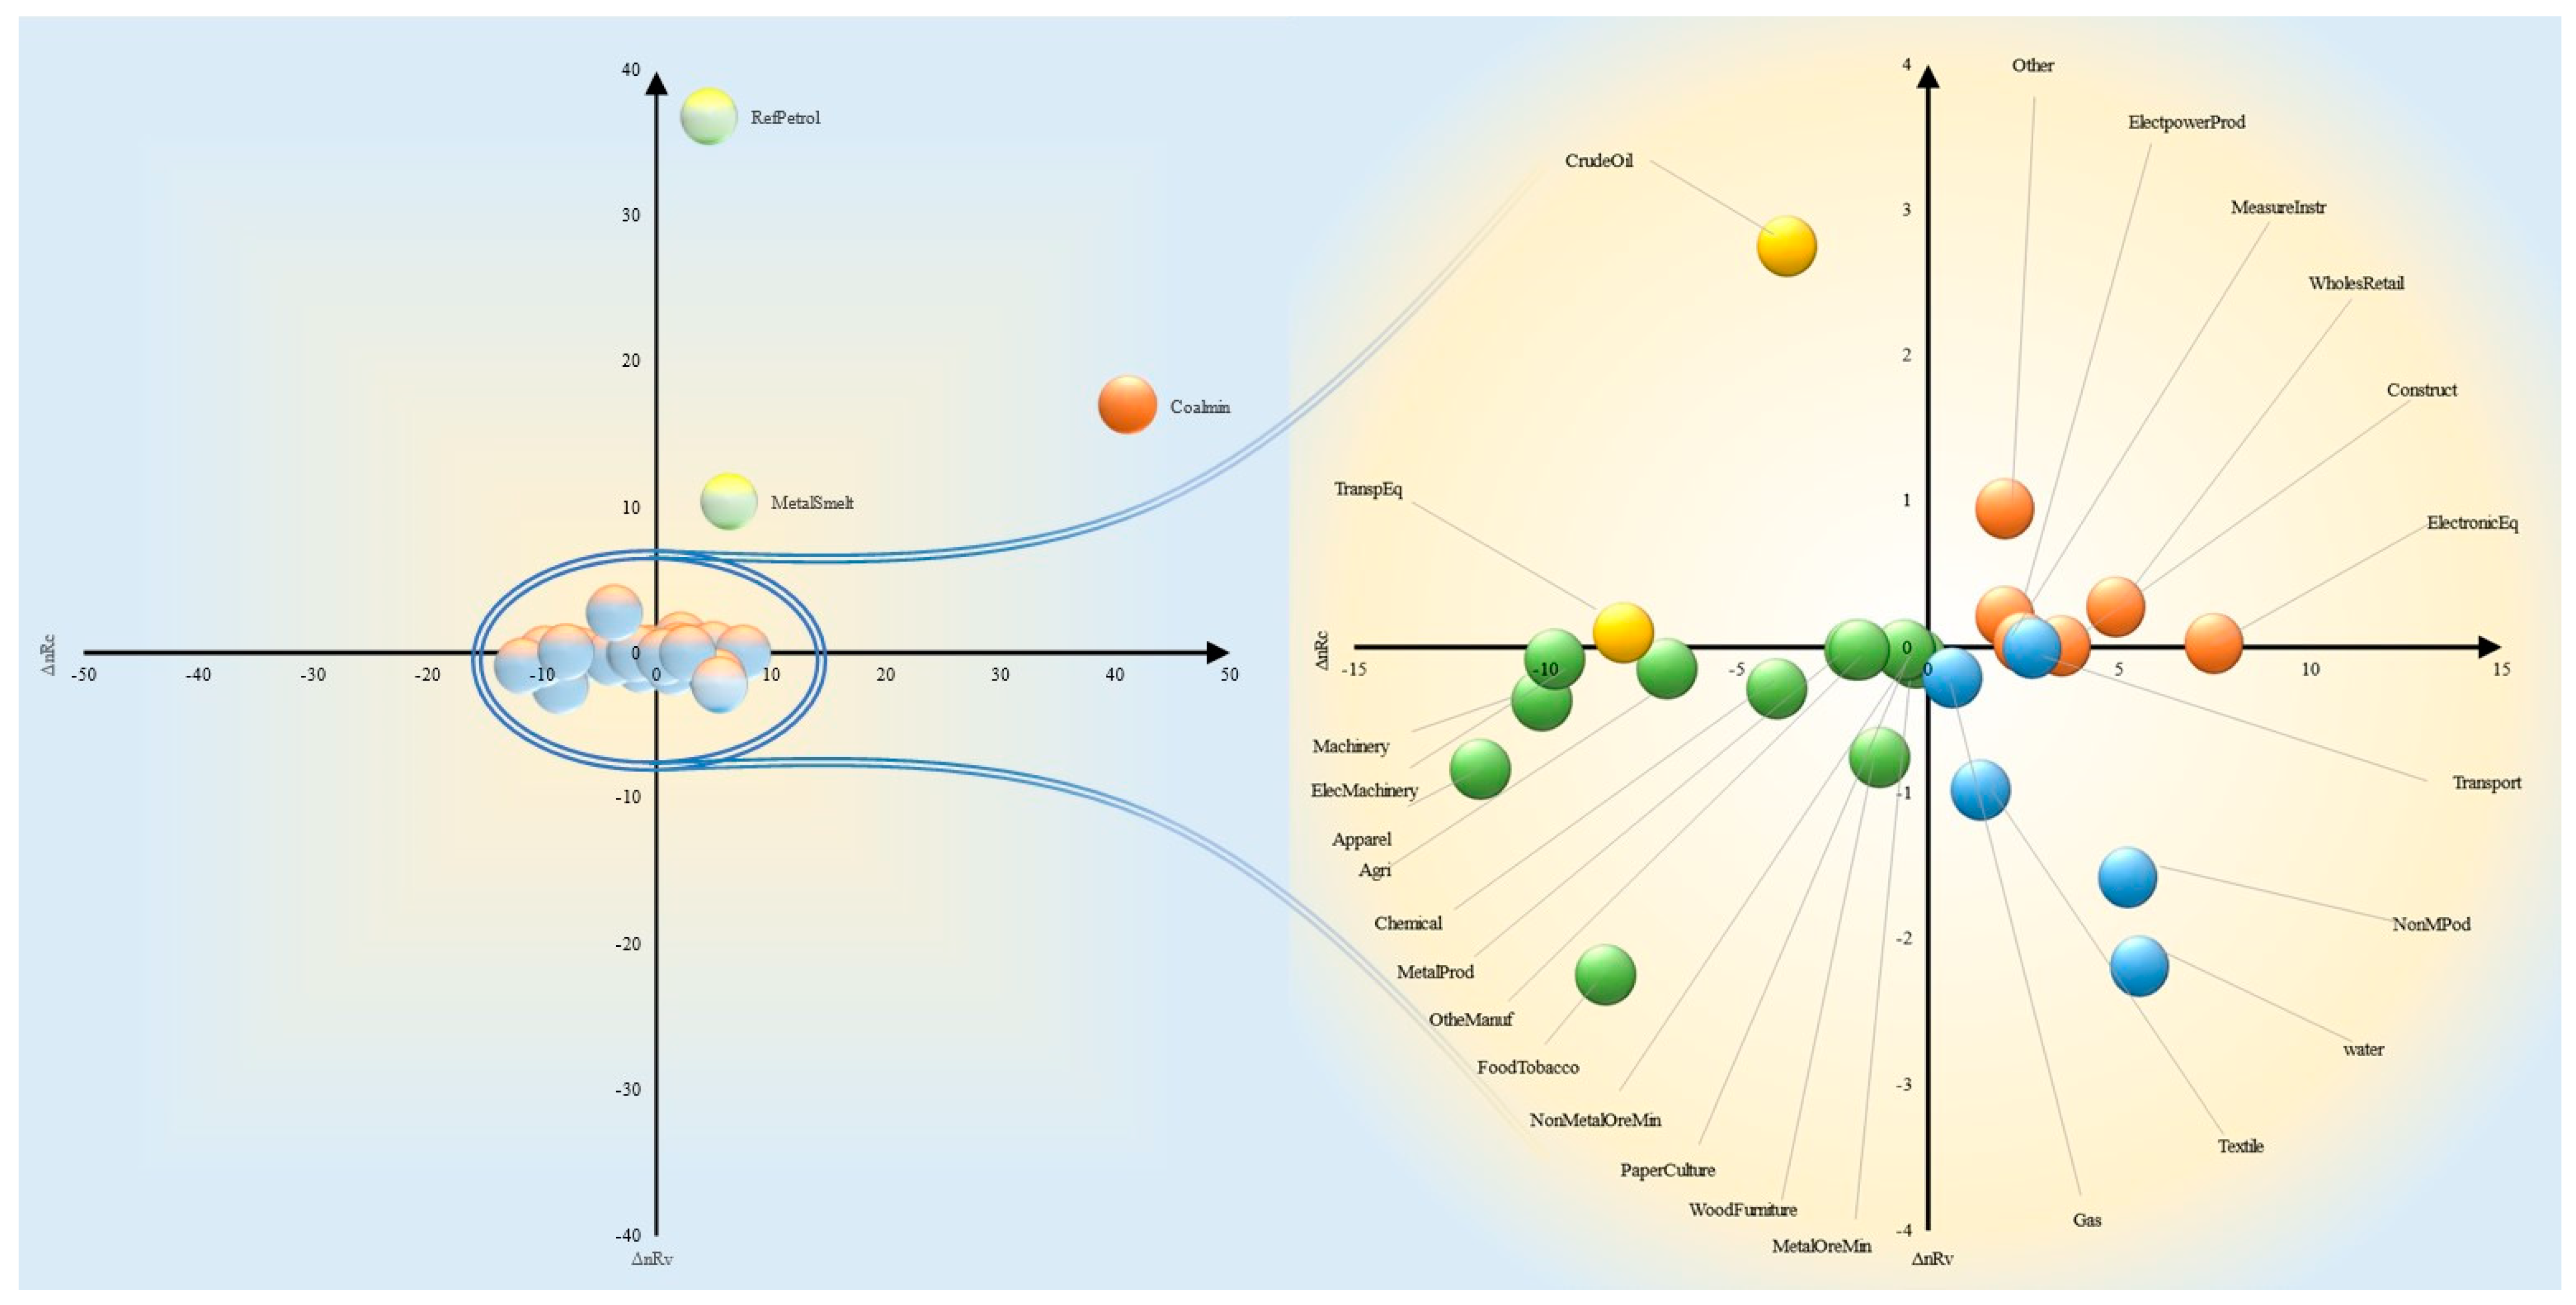
4.1. Coupling Relation between Net CV Outflow Effect and Net ECEs-PT Outflow Effect

The ESBs faces the dual pressure of carbon emission reduction and energy supply guarantee. Through the study of the structure and mechanism of CEs-PT, it is found that the economic benefits of some industries are small, but the carbon leakage caused by them is huge. The industrial structure needs to be optimized urgently in order to fundamentally solve the dual pressure problem faced by the ESBs. Therefore, we propose a classification and staged optimization control strategy, which can reduce the CEs-PT more efficiently and scientifically based on causing less disturbance to the stability of energy supply. Our research on the structure and mechanism of CEs-PT found that trade in some industries has small economic benefits but leads to huge carbon leakage.
According to the spatio-temporal features, industry features and driving mechanism, we proposed optimization measures for different sectors to reduce the negative effect of trade on the net ECEs-PT outflow. Meanwhile, we also noticed that the widely used CEs reduction countermeasure in the world is reducing the relevant production capacity of high emission regions. However, as the guarantee and source of energy supply, if ESBs blindly reduce their industrial scale, it will inevitably have an enormous relevance influence on downstream sectors in other regions, affecting the balance of the national industrial structure and the stability of energy supply. Therefore, based on the results of the driving mechanisms of net ECEs-PT outflow, this study analyzed the coupling relationship between net ECEs-PT outflow and the net CV outflow. Furthermore, this study proposed classified and targeted optimization measures to Equationte a more scientific CEs reduction program in Shanxi on the basis of securing energy supplies.

4.1.1. Industrial Classification

Based on two-step SDA model, we established a CR model between the changes in contribution rates of net CV outflows (ΔnR_V) and net ECEs-PT outflows (ΔnR_C). According to the coupling analysis of these two changes, we classified the 28 sectors into four types: type A: ΔnR_V > 0, ΔnR_C < 0, type B: ΔnR_V < 0, ΔnR_C > 0, type C: ΔnR_V > 0, ΔnR_C > 0, and type D: ΔnR_V < 0, ΔnR_C < 0 (Figure 6). For the above four types, through fiscal, subsidies and other policies, we can implement targeted measures such as promotion, control, regulation. Thus, through targeted CEs reduction optimization, ESBs are expected to reduced ECEs-PT to a greater extent, while have less spillover impact in other regions.

4.1.2. Optimization for Each Types

For type A, in 1997–2012, the contribution rates of net CV outflow increased, which represented the increasing demand in interprovincial trade and the corresponding increasing economic benefits. In contrast, the contribution rates of net ECEs-PT outflows decreased during the research period, which reflected the increasing positive environmental effect of ECEs-PT transference. This type of industry usually with advanced technology, broad market demand, low-energy consumption and low carbon emissions. We classified it as the Promoted type, which included Textile, NonMProd, Transport, Gas, and Water. Since the investment in this type of industry is insufficient, the numbers of this type of industry in Shanxi are small. As the high relatively technology level industries, these are the key industries to solve the “resource curse” dilemma in Shanxi. We should gradually increase investment, scale up production, and increase market share (Table 2).
For type B, in the stage of rapid economic growth, the contribution rates of net CV outflows to interprovincial trade decreased, which reflected the declining trade demand for this type of industry and the corresponding declining economic benefits. However, the increasing contribution rates of net ECEs-PT outflows reflected the increasing negative effects of this type of industry. This type usually with backward technology, shrinking market demand, high energy consumption and high carbon emissions. Due to the low economic and environmental benefits, development of this type will further aggravate the “resource curse” dilemma in Shanxi. We classified this as the controlled type, which included CrudeOil and TranspEq. We should gradually decrease investment, scale down production, and decrease market share (Table 2).
For type C, in 1997–2012, the contribution rates of net CV outflows in interprovincial trade increased continuously, which reflected that the demand of this type of industry in interprovincial trade is increasing and the corresponding economic benefits are increasing. However, the increasing contribution rates of net ECEs-PT outflows reflected the increasing negative effects of this type. Due to the different growth rates of the value outflow proportions and ECEs-PT outflow proportions, different optimization policies should be adopted, and we classified this type as an adjusted type. We classified this type of industry into two subtypes: (C1 and C2). If ΔnR_V > ΔnR_C > 0, the industry is recognized as type C1. The characteristic is net CV outflows that have increased more than the net ECEs-PT outflows. We classified this as an orientation-encouraged type, which included Coalmin, ElectpowerProd, Construct, WholesRetail, ElectronicEq, MeasureInstr, and Other. For this kind of industry, we proposed: moderately expand investment and extend interprovincial trade with low-tech provinces. If ΔnR_C > ΔnR_V > 0, the industry is recognized as C2. The characteristic is the increased net CV outflows have less than the increased net ECEs-PT outflows. We classified this as the orientation-reduced type, which included RefPetrol and MetalSmelt. For this kind of industry, the following optimization measures are suggested: expand interprovincial trade with low-tech provinces and reduce interprovincial trade with high-tech provinces (Table 2).
For type D, during the research period, the contribution rates of net CV outflows in interprovincial trade decreased, which reflected that the trade demand of this type of industry continued to decline. The contribution rates of net ECEs-PT outflows also decreased during the research period, which reflected the increasing positive environmental effects of net ECEs-PT outflow. For this type, we should fully play the combined role of market regulation and government control on the basis of appropriately reducing market share. It can be achieved by managing and adjusting its scale according to the features of industrial development, stimulating the industrial advantages and vitality of this type of industry. While maintaining the reduction of negative environmental effects, deepen the industrial chain and improving economic benefits. We classified it as the Regulated type, which included Agri, MetalOreMin, NonMetalOreMin, FoodTobacco, Apparel, WoodFurniture, PaperCulture, Chemical, MetalProd, Machinery, ElecMachinery, and OtheManuf (Table 2).
In addition, due to the deep dilemma of the “resource curse” in Shanxi, energy-based industries have obvious features, and the industrial structure is relatively unitary. Therefore, the timing sequence of optimizing the implementation of regulatory measures is also crucial. If the four sectors are regulated at the same time, this may offset regulation effects or impede the stability of energy supply. Therefore, we must prioritize the development of advanced technology industries. When the industry chain of advanced technology industries is nearly perfect, we then control and gradually reduce the energy-dependent industries. The industrial adjustment and control of Shanxi should be carried out step by step, optimized first and then controlled. Therefore, we should prioritize the industrial structure adjustment of types I and C1 and improve the technical level of type I and C1 sectors. Under the condition of ensuring stable energy supply, we should further regulate types B, C2, D and change the dilemma of heavy energy supply and low environmental efficiency in Shanxi.

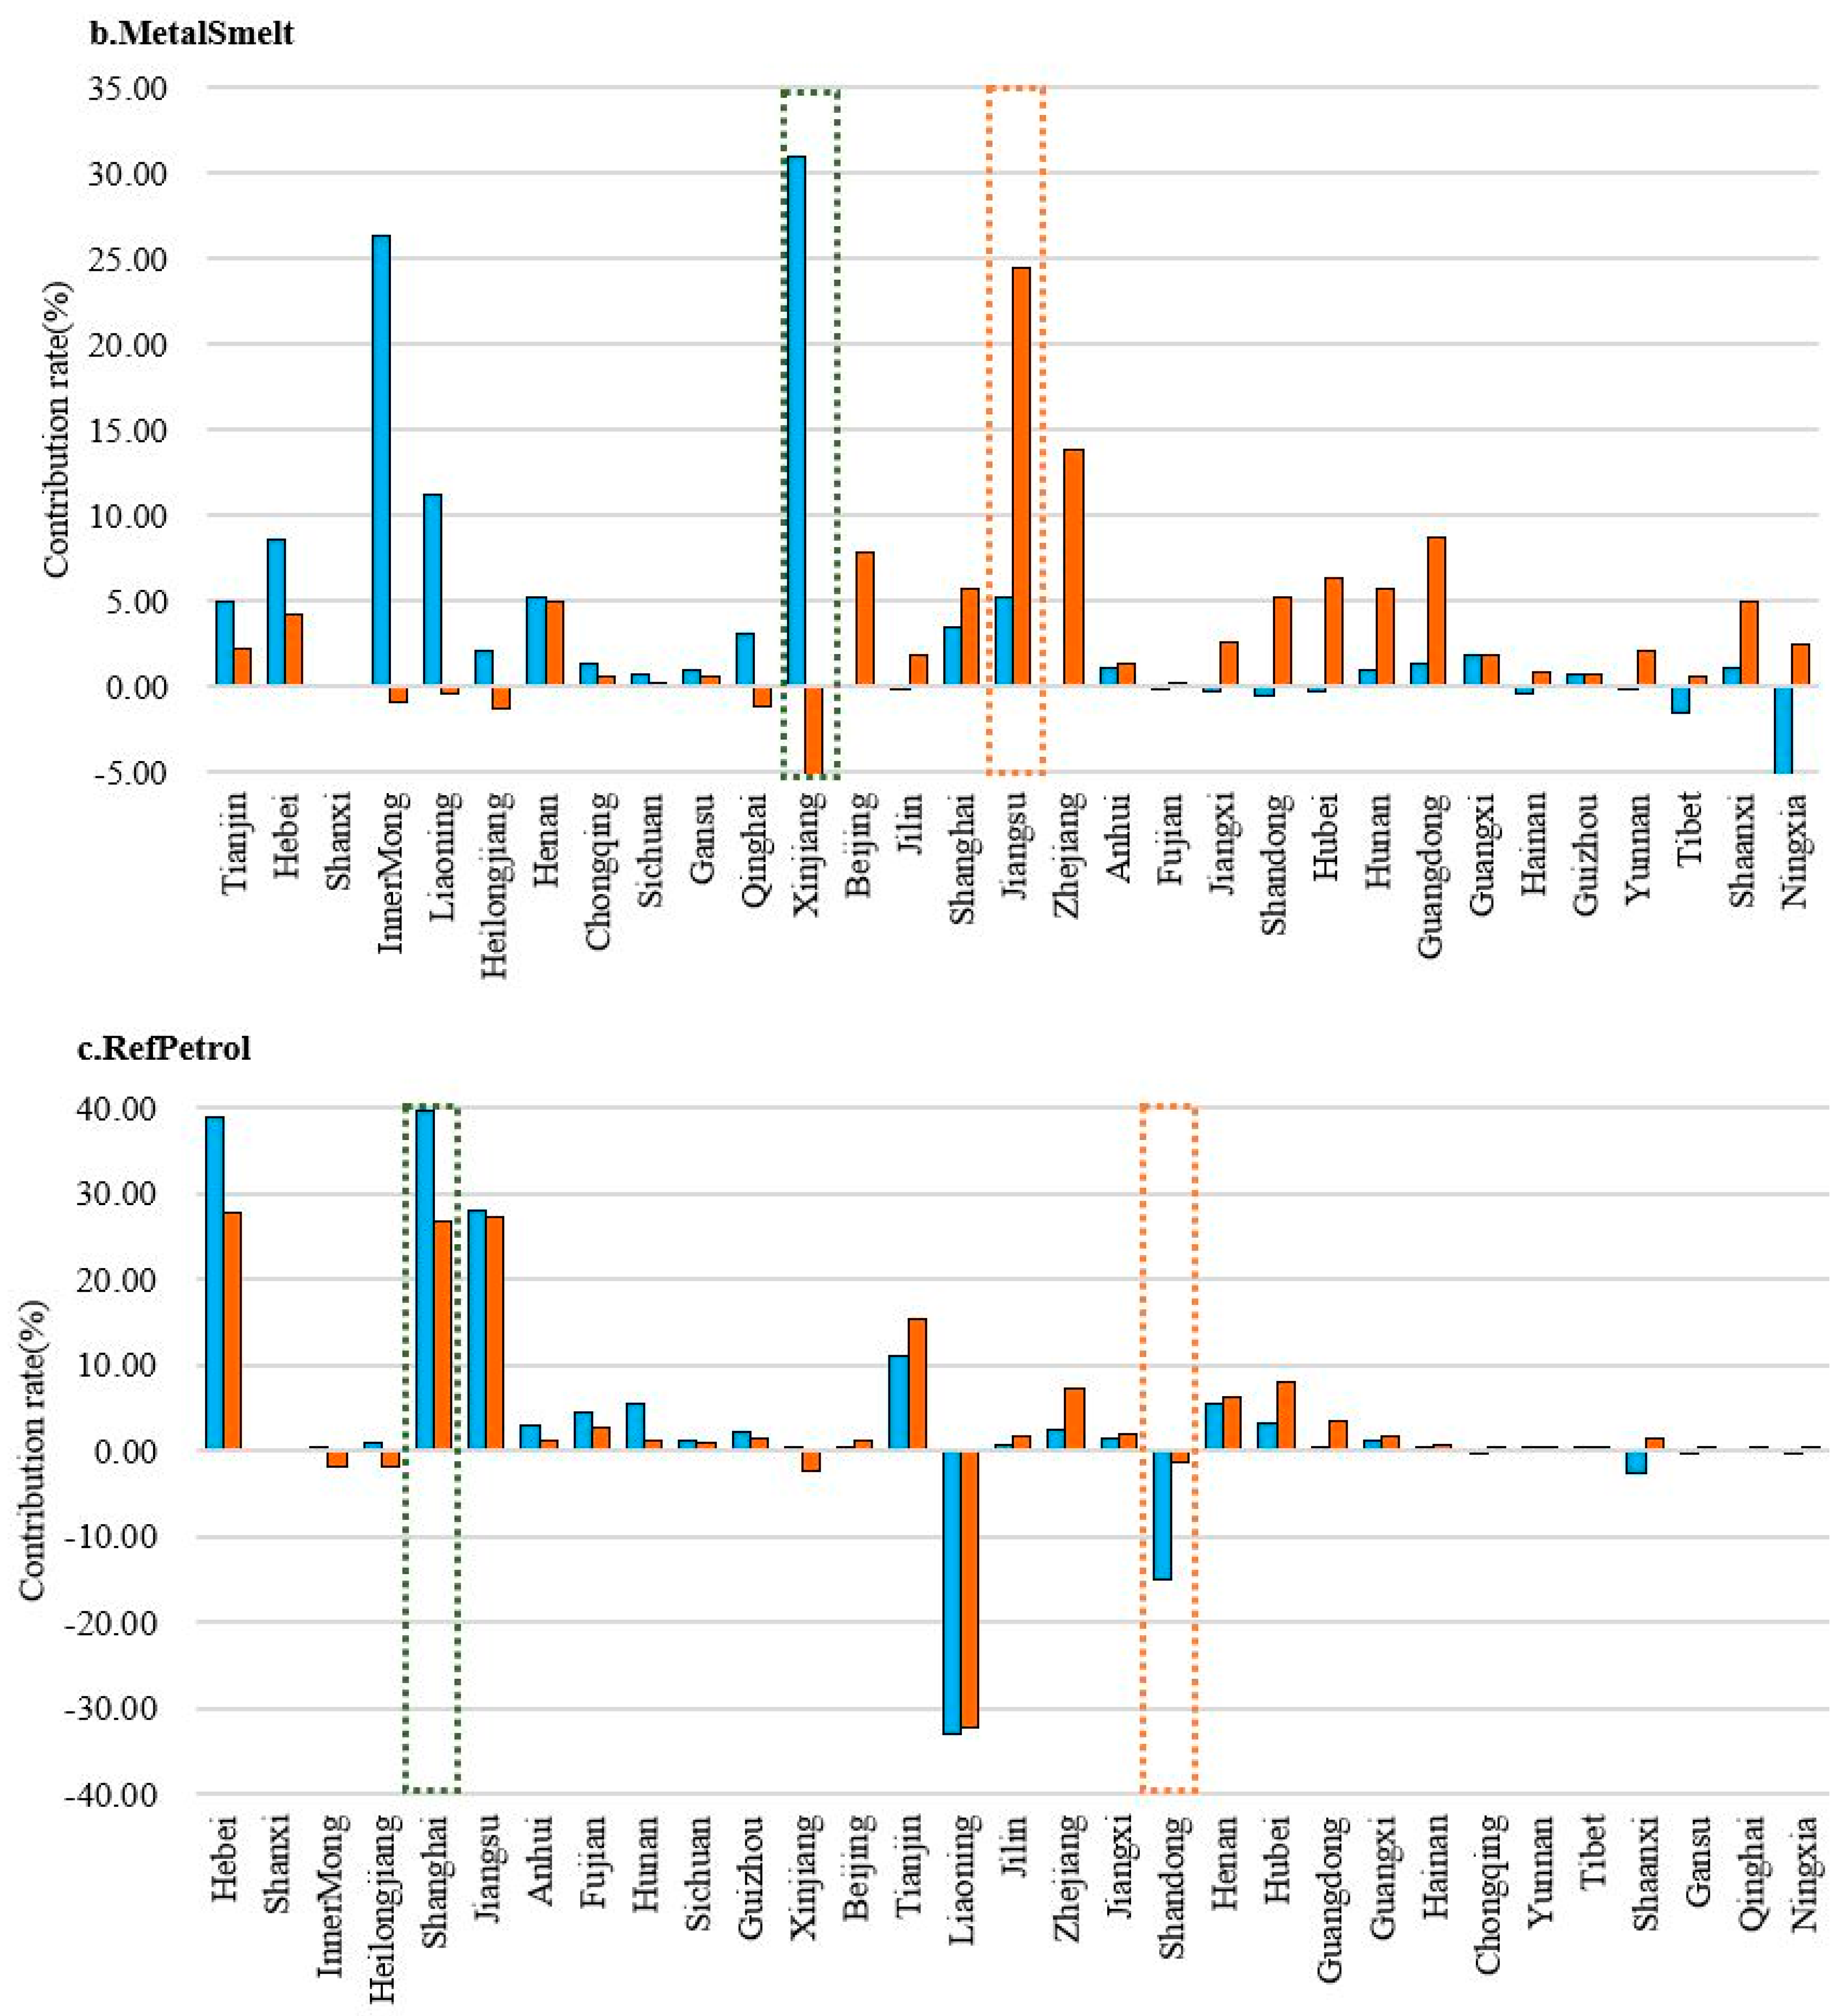
4.2. Deep Optimization for the Case Industries

For a specified sector, the ECEs-PT changes of the per unit CV changes from Shanxi vary between difference provinces (Figure 7). As for specific inter-provincial trade, we need to refine the regulatory measures in different provinces.
According to the result of the industrial characteristic of net ECEs-PT outflow in Shanxi in 2012, the top three sectors with the largest net ECEs-PT outflow were Coalmin, MetalSmelt, and RefPetral. The sum of the net ECEs-PT outflow of top three sectors is far greater than that of other sectors and reaches 98.00% of the total. Therefore, we focused on these three sectors as the case studies and proposed optimization from the provincial level.

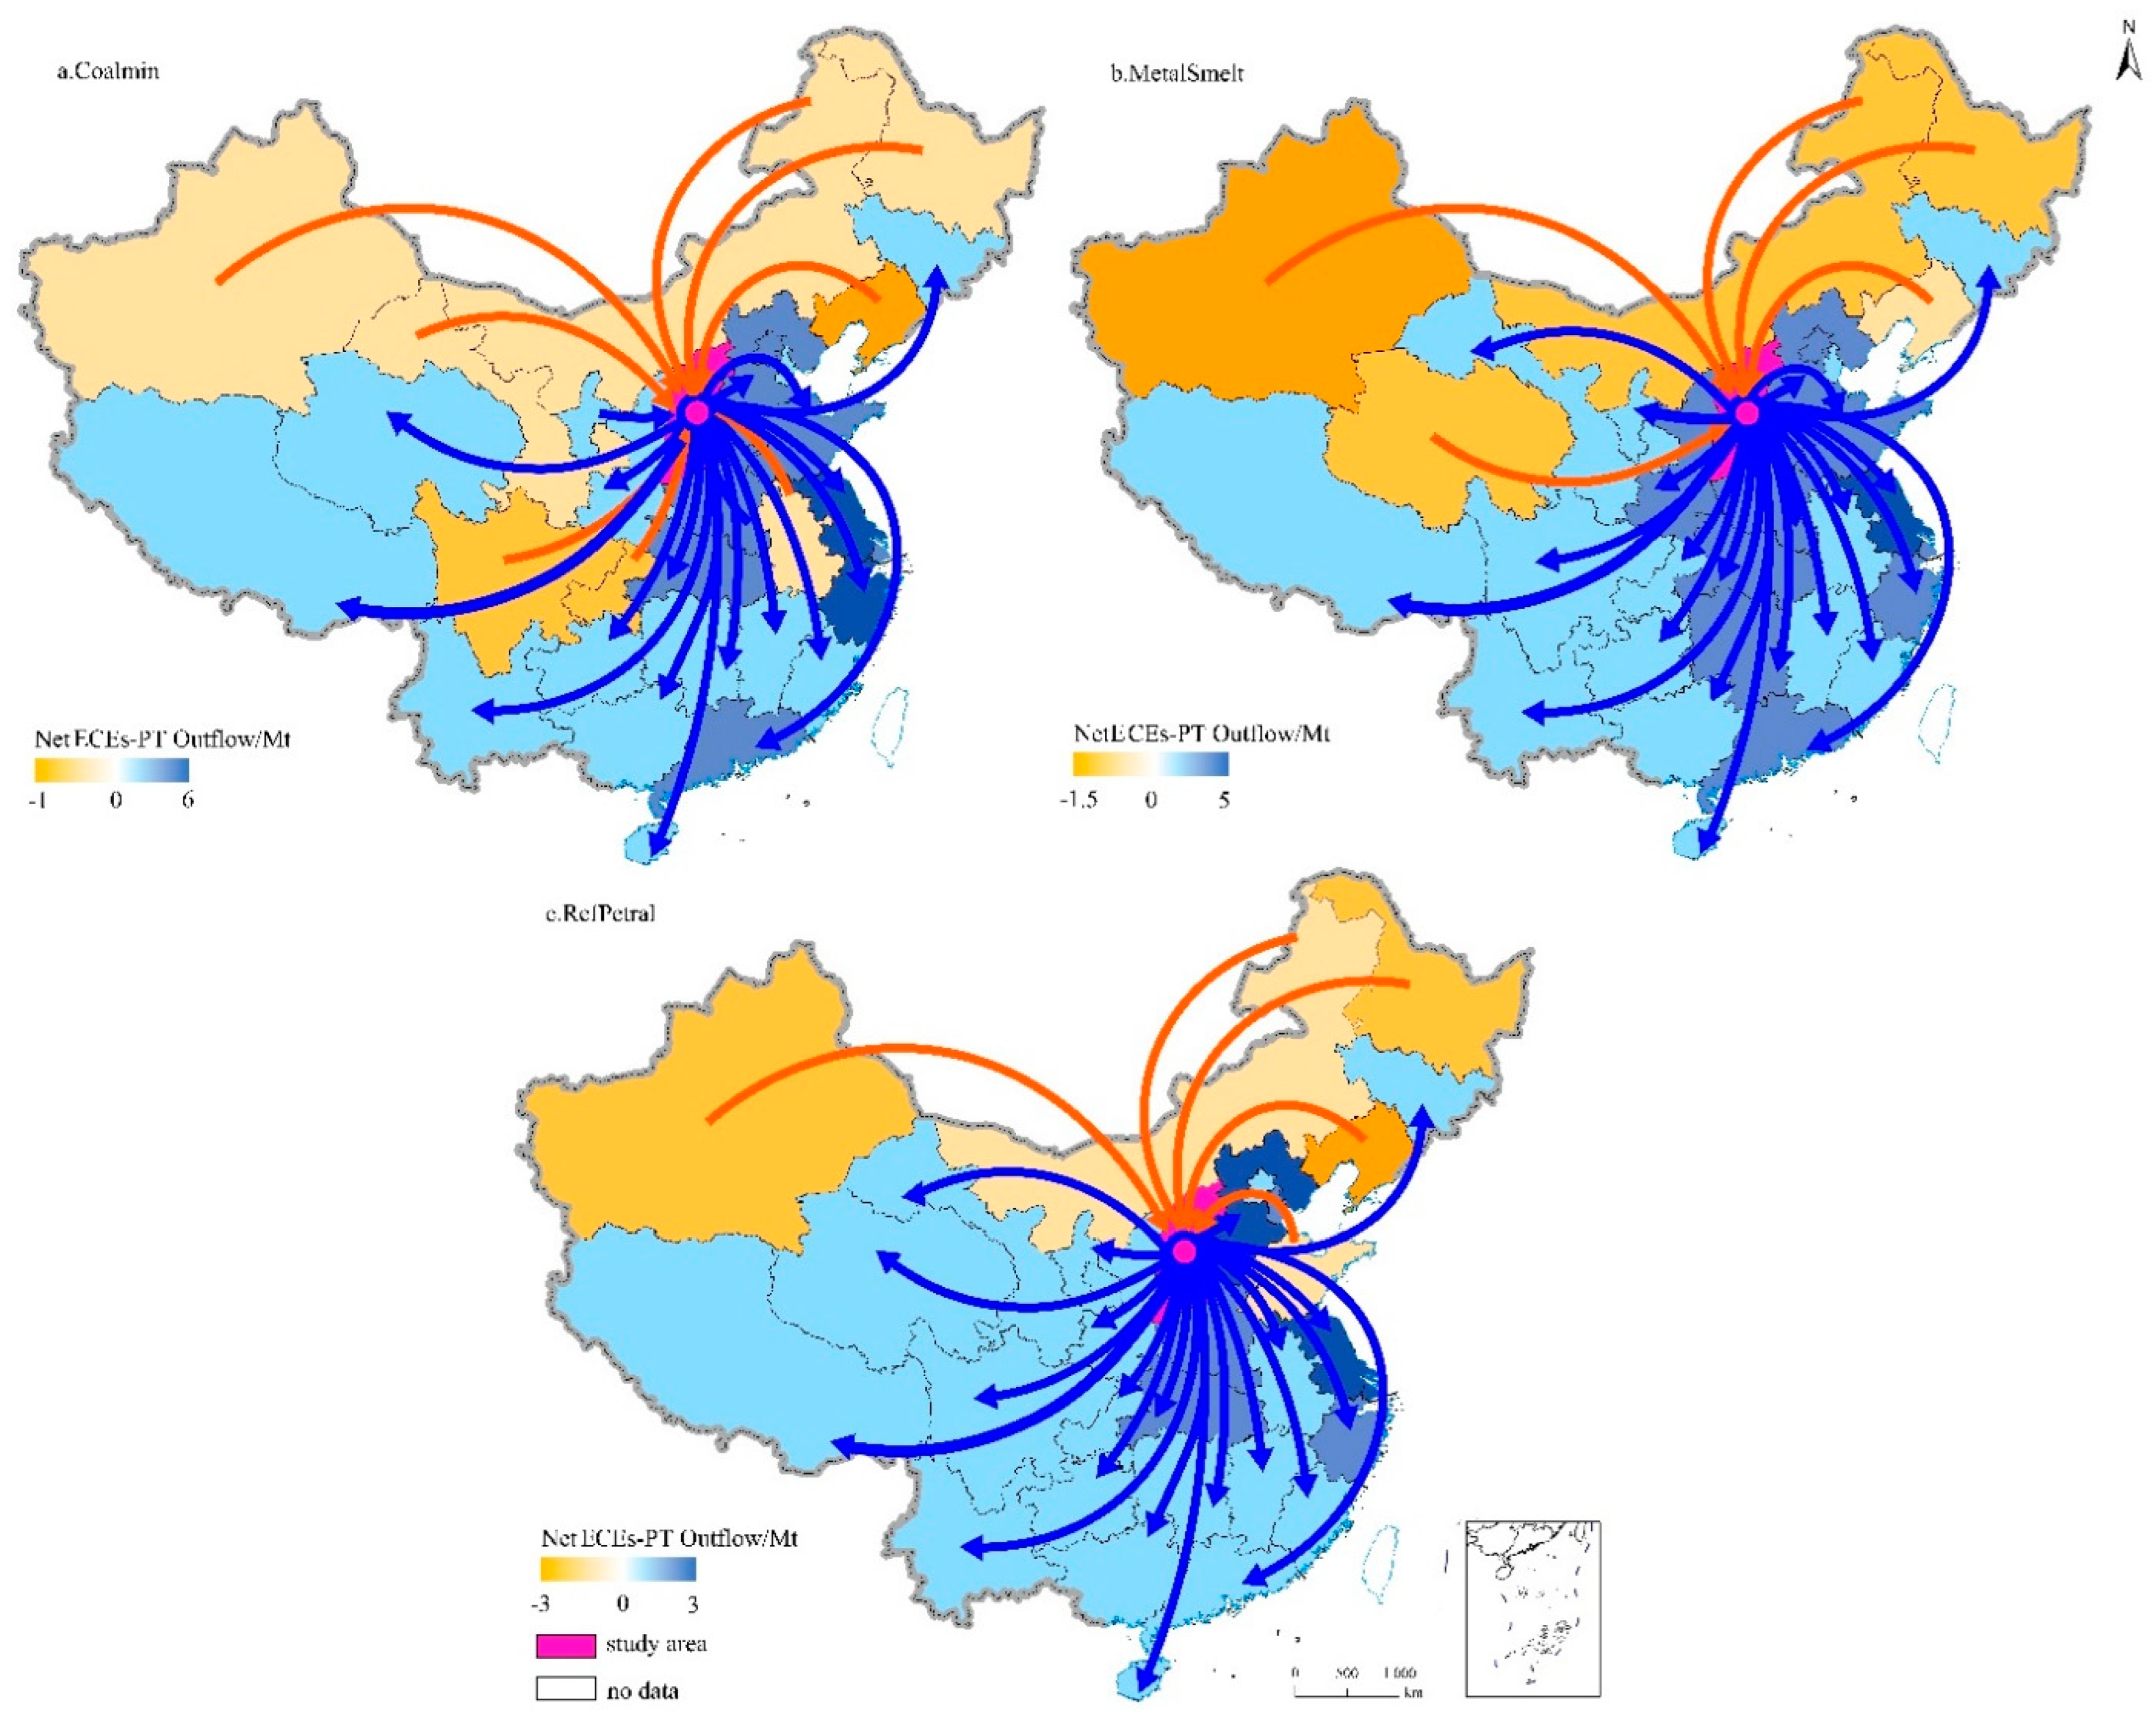
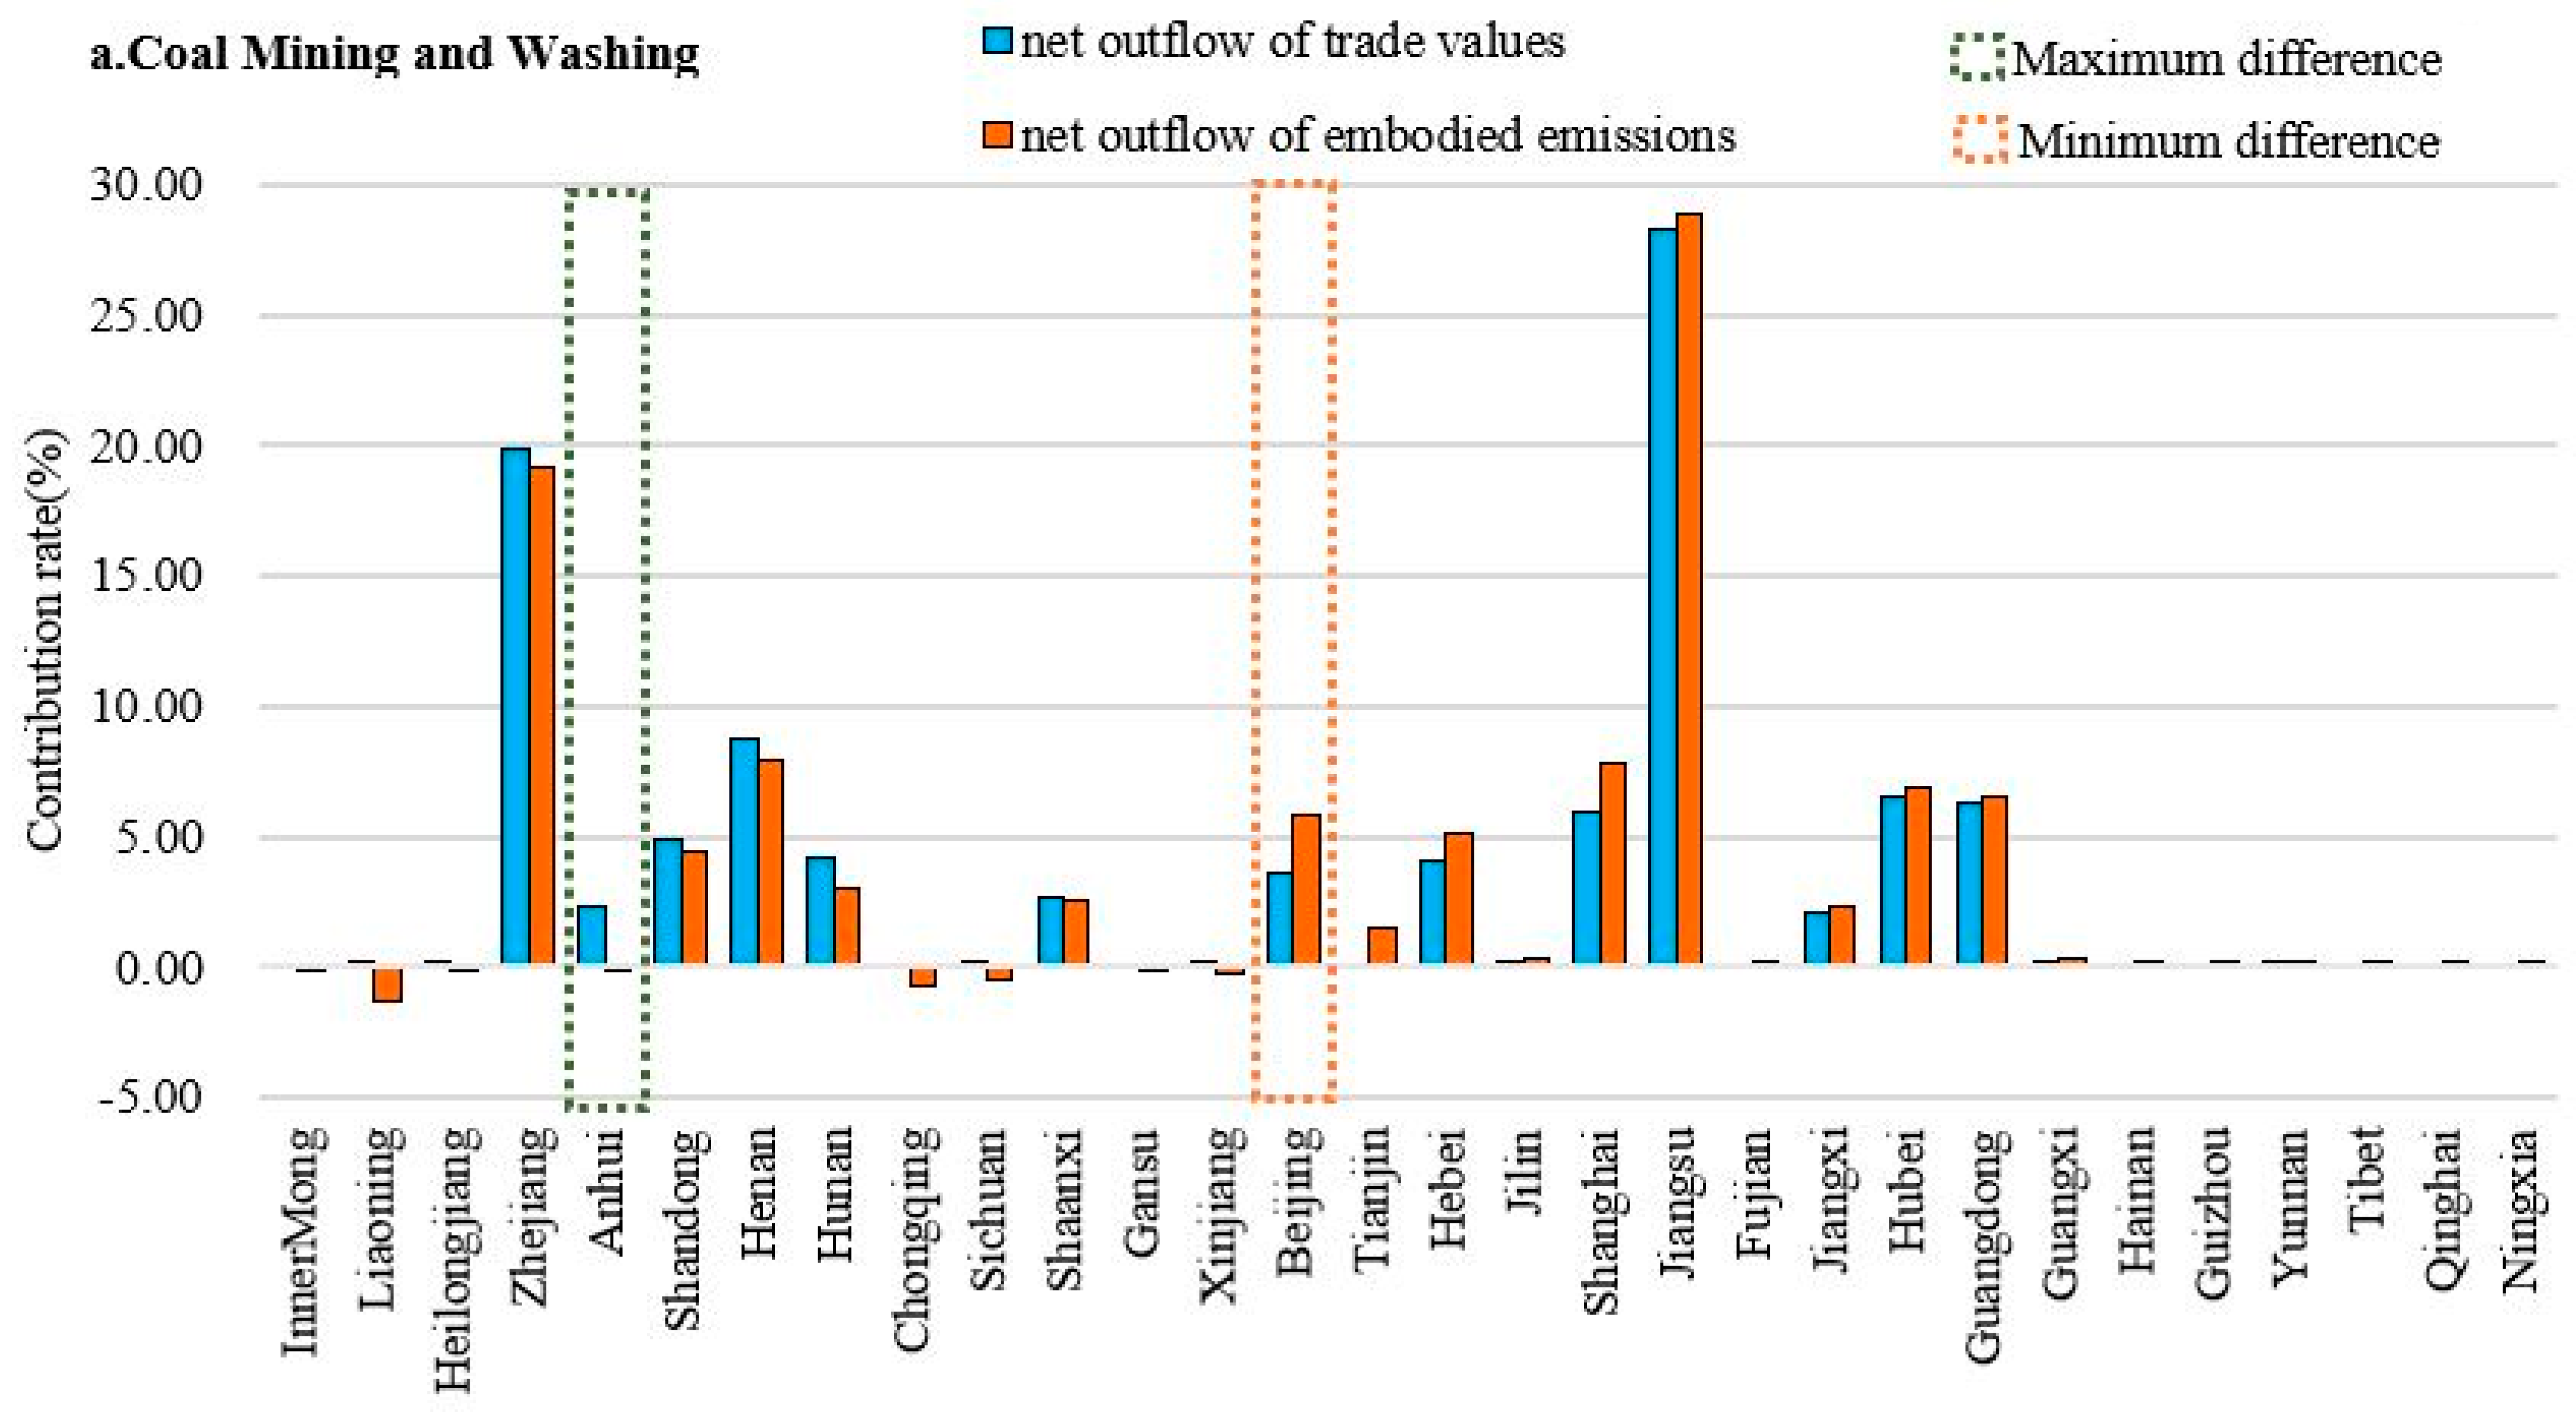
4.2.1. Optimization for Coalmin

Coalmin was the largest net ECEs-PT outflow sector in Shanxi in 2012, with a net ECEs-PT outflow of 23.60 Mt and contribution rate of 43.51% to the total. From a trade structure perspective, the contribution rates of net CV outflows between Shanxi and Beijing changed by 3.59%, while their contribution rates to net ECEs-PT outflows changed by 5.82% (Figure 8a), which showed seriously unbalanced features. This means that the negative environmental effects of the ECEs-PT outflow between Shanxi and Beijing were much greater than the positive economic effects. The industrial adjustment strategy appropriately reduces the trade scale with Beijing, which can significantly reduce the negative effects of carbon emission transference. The same types of trade objects include Hebei, Jilin, and other provinces (Figure 8a).
The contribution rates of net CV outflows from Shanxi to Anhui changed by 2.29%, and the contribution rates of net ECEs-PT outflows changed by −0.08% (Figure 8a). This showed that the negative environmental impact of interprovincial trade between Shanxi and Anhui was much lower than that of other provinces. Anhui is a large manufacturing province with a large demand for coal. Therefore, for the optimization measures of Coalmin, we should appropriately expand the scale of trade between Shanxi and Anhui, which can achieve better CER effects on the basis of ensuring the stability of energy supply.

4.2.2. Optimization for MetalSmelt

Metalsmelt was the second largest sector of net ECEs-PT outflow in 2012, with a net ECEs-PT outflow of 20.41 Mt and contribution rate of 37.64% to the total net ECEs-PT outflow. 1997–2012, the contribution rates of net CV outflows in Shanxi increased by 6.33%, while the contribution rates of net ECEs-PT outflows increased by 10.40% (Figure 6). Metalsmelt belonged to C2.
Based on the EEBT model, the contribution rates of net CV outflows from Shanxi to Jiangsu changed by 5.25%, while the contribution rates of net ECEs-PT outflows changed by 24.49% (Figure 8b). It showed that the negative environmental effects of trade between Shanxi and Jiangsu were greater than the positive economic effects. The same situation also existed in Zhejiang, Guangdong, and other provinces (Figure 8b). Therefore, for the optimization measures of Metalsmelt, we should appropriately control the trade scales with Jiangsu, Zhejiang, and other provinces to achieve a better CER effect.
The contribution rates of net CV outflows from Shanxi to Xinjiang changed by 30.97%, and the contribution rates of net ECEs-PT outflows changed by −6.43% (Figure 8b). It showed that there was a positive environmental effect from trade with Xinjiang. The same situation also existed in Liaoning, Anhui and other provinces. Therefore, we should appropriately expand trade scales with Xinjiang, Liaoning, and other provinces of this industry to reduce carbon emission more efficiently while ensuring energy supply (Figure 8b).

4.2.3. Optimization for RefPetral

RefPetral was the third largest sector of net ECEs-PT outflow in 2012, with a net ECEs-PT outflow of 9.14 Mt and contribution rate of 16.85%. 1997–2012, the contribution rates of net CV outflows in Shanxi increased by 4.57%, while the contribution rates of net ECEs-PT outflows increased by 36.85% (Figure 6). RefPetral belonging to C2.
From a trade structure perspective, the contribution rates of net CV outflows from Shanxi to Shandong changed by −15.12%, while the contribution rates of net ECEs-PT outflows changed by −1.28% (Figure 8c). It showed a serious incongruous feature. The negative environmental effects of the ECEs-PT outflow between Shanxi and Beijing (or Shandong) were far greater than the positive economic effects. Provinces with the same situation include Henan, Guangxi, and other provinces. Therefore, the trade scales with Shandong, Henan, Guangxi, and other provinces should be appropriately controlled to achieve a better CER effect (Figure 8c).
However, the contribution rates of net CV outflows from Shanxi to Shanghai changed by 39.76%, and the contribution rates of net ECEs-PT outflows changed by −26.69% (Figure 8c), which had positive environmental effects. Provinces with the same conditions include Heilongjiang, Xinjiang, and other provinces. Therefore, we should appropriately expand the scales of trade with Heilongjiang, Xinjiang, and other provinces to achieve more efficient CER while ensuring energy supply.

5. Conclusions

Based on provincial interregional input-output data of China from 1997, 2002 and 2012, this study used the EEBT model and SDA model to analyze the spatio-temporal features, industry features and driving mechanisms of the net ECEs-PT outflow in a typical ESB, Shanxi. Based on the CR model, we evaluated the coupling relationship between net CV outflows and net ECEs-PT outflows. Finally, we propose optimization measures for different types of sectors. Based on the analysis result, the following points are highlighted:
(a)
This study revealed the spatio-temporal features of the net ECEs-PT outflow. From 1997 to 2012, the net ECEs-PT outflows in Shanxi continuously grew, the spatial trend is “from expanded coverage to agglomeration enhancement”. and the target provinces of the ECEs-PT agglomerated to the eastern coastal provinces. This reflected the typical features of ESBs with the continuous expansion of energy demand and the increasingly detailed division of labor. (1) Energy trade grows rapidly, the target provinces of energy outflow gradually concentrate to some major trading regions; (2) ESBs gradually depend highly on the trade of direct energy products, which leads to a single industrial structure. Industries with potential for high technology and high investment are confronted with recession risk, dilemma of the “resource curse”, and difficulty in economic transformation; (3) while interregional energy trade gains short-term economic benefits rapidly and supports energy demand in other regions, it brings an enormous amount of ECEs-PT transference and other negative environmental effects, which result in great ecological pressures; (4) in the process of achieving the urgent CER goals, ESBs need to meet energy needs and secure energy supplies, which bring great pressure to ESBs.
(b)
This study explored the driving mechanisms of ECEs-PT transference. By using the two-stage SDA, we analyzed deep-seated causes of ECEs-PT transference of the 28 sectors in ESBs. The results showed that (1) low technology level and high trade demand were the dual driving forces that lead to changes in the patterns of ECEs-PT transference in ESBs. Trade demand stimulates changes in ECEs-PT transference through changes in trade scales and trade structures; (2) the rapid increase in trade demand stimulates the industrial structure of ESBs highly concentrated in the production of energy products, thus supporting the demand for energy and obtaining rapid economic benefits, which hinders the improvement of the overall technology level of the industry; (3) the concentrations of trade structures and differences in technology level cause ESBs to be the low-end production link of the energy industry value chain over the long-term and to further rely on the energy trade; (4) for industries with different technology and trade structure characteristics, the trade scale plays a different role in the growth of carbon emissions transference.
(c)
According to the CR model, we analyzed the elasticity between the trade values and carbon emission transferences of different industries. By combining the driving force analysis conclusions, we proposed targeted optimization and control strategies for ESBs. (1) We divided the sectors into four types: Type A is the promoted type, and the optimization measure is increase investment, scale up production, and increase market share; Type B is the controlled type, and the optimization measure is reducing investment, controlling production scale, and reducing market share; Type C is the adjusted type, and the optimization measure for Type C1 is moderately increasing investment, expanding interprovincial trade with those lower industrial advantages provinces; the optimization measure for Type C2 is expanding interprovincial trade with those lower industrial advantages provinces and reducing interprovincial trade with those greater industrial advantages provinces; Type D is the regulated type, and the optimization measure is reducing investment, controlling production scale, and combining market regulation and government control; (2) this study proposes a regulation sequence of first optimizing and then controlling industries in Shanxi to improve the technical level of ESBs, expanding and improving industrial systems, gradually guiding the exit of energy-dependent industries, and finally changing the industrial development mode of extensive technology and the unitary structure of ESBs. This sequence will eventually achieve the best CER effect at a lower economic cost and achieve a great degree of CER effects on the basis of less interference to the stability of energy supply, and achieve sustainable CER goals.
(d)
This study discussed the optimization strategies for the trade structures of the top three net ECEs-PT outflow sectors. By gradually adjusting the trade structures of high-concentration industries, the relevance of CER measures for different industries in different provinces can be enhanced. By targeting different industries, we divided the provinces into expanding trade scales and reducing trade scales to rectify “campaign-style carbon reduction” that cause excessive emission reduction and threaten the security and stability of energy supply.
(e)
Based on the EEBT model, SDA model, and CR model, we explored the spatio-temporal features, industry features, driving mechanisms of the net ECEs-PT outflow and proposed targeted optimization measures for different sectors. This technical route, methods and relevant optimization measures can provide references for Shanxi and other similar ESBs to adjust and optimize their industrial structures, reduce and eliminate the “resource curse”. It has positive reference and significance for Equationting optimization policy that eliminate carbon leakage to a greater extent, with less interference to the energy trade pattern, and achieve balanced and sustainable development between energy supply and ecological protection.

Author Contributions

Conceptualization, F.L.; methodology, Q.L.; data curation, Q.L., Y.Y.; writing—original draft preparation, Q.L.; writing—review and editing, F.L.; supervision, S.D.; project administration, H.C.; funding acquisition, S.L. All authors have read and agreed to the published version of the manuscript.

Funding

The work was supported by National Natural Science Foundation of China (Grants No. 42071282, 41911530103, and 71733003), and Innovation Academy for Green Manufacture, Chinese Academy of Sciences (Grants No. IGAM-2019-A16-2).

Data Availability Statement

Not applicable.

Conflicts of Interest

The authors declare that they have no known competing financial interests or personal relationships that could have appeared to influence the work reported in this paper.

References

  1. Keohane, R.O. After Hegemony: Cooperation and Discord in the World Political Economy; Princeton University Press: Princeton, NJ, USA, 2005. [Google Scholar]
  2. Fu, F.; Ma, L.W.; Li, Z.; Polenske, K.R. The implications of China’s investment-driven economy on its energy consumption and carbon emissions. Energ. Convers. Manag. 2014, 85, 573–580. [Google Scholar] [CrossRef]
  3. Zhang, Q.; Jiang, X.; Tong, D.; Davis, S.J.; Zhao, H.; Geng, G.; Feng, T.; Zheng, B.; Lu, Z.; Streets, D.G.; et al. Transboundary health impacts of transported global air pollution and international trade. Nature 2017, 543, 705. [Google Scholar] [CrossRef] [PubMed] [Green Version]
  4. International Energy Agency. World Energy Balances 2016; IEA—International Energy Agency; IEA Publications: Paris, France, 2016. [Google Scholar]
  5. He, Y.; Zhang, S.; Zhao, Y.; Wang, Y.; Li, F. Energy-saving decomposition and power consumption forecast: The case of liaoning province in China. Energy Convers. Manag. 2011, 52, 340–348. [Google Scholar] [CrossRef]
  6. Shui, B.; Harriss, R.C. The role of CO2 embodiment in US–China trade. Energy Policy 2006, 34, 4063–4068. [Google Scholar] [CrossRef]
  7. Su, B.; Ang, B. Input–output analysis of CO2 emissions embodied in trade: A multi-region model for China. Appl. Energy 2014, 114, 377–384. [Google Scholar] [CrossRef]
  8. Su, B.; Ang, B.W. Multiplicative structural decomposition analysis of aggregate embodied energy and emission intensities. Energy Econ. 2017, 65, 137–147. [Google Scholar] [CrossRef]
  9. Meng, J.; Mi, Z.; Yang, H.; Shan, Y.; Guan, D.; Liu, J. The consumption-based black carbon emissions of China’s megacities. J. Clean. Prod. 2017, 161, 1275–1282. [Google Scholar] [CrossRef] [Green Version]
  10. Schwerhoff, G. Response to the comment on: ‘The economics of leadership in climate change mitigation’. Clim. Policy 2017, 17, 817–818. [Google Scholar] [CrossRef]
  11. Kalashnikov, V.; Gulidov, R.; Ognev, A. Energy sector of the Russian Far East: Current status and scenarios for the future. Energy Policy 2011, 39, 6760–6780. [Google Scholar] [CrossRef]
  12. Nasir, M.; Rehman, F.U. Environmental Kuznets Curve for carbon emissions in Pakistan: An empirical investigation. Energy Policy 2011, 39, 1857–1864. [Google Scholar] [CrossRef]
  13. Sánchez-Chóliz, J.; Duarte, R. CO2 emissions embodied in international trade: Evidence for Spain. Energy Policy 2004, 32, 1999–2005. [Google Scholar] [CrossRef]
  14. Andress, D.; Nguyen, T.D.; Das, S. Reducing GHG emissions in the United States’ transportation sector. Energy Sustain. Dev. 2011, 15, 117–136. [Google Scholar] [CrossRef]
  15. Feng, K.; Davis, S.; Sun, L.; Hubacek, K. Drivers of the US CO2 emissions 1997–2013. Nat. Commun. 2015, 6, 7714. [Google Scholar] [CrossRef] [PubMed] [Green Version]
  16. Salman, M.; Long, X.; Dauda, L.; Mensah, C.N. The impact of institutional quality on economic growth and carbon emissions: Evidence from Indonesia, South Korea and Thailand. J. Clean. Prod. 2019, 241, 118331. [Google Scholar] [CrossRef]
  17. Wang, Z.; Yang, Y.; Wang, B. Carbon footprints and embodied CO2 transfers among provinces in China. Renew. Sustain. Energy Rev. 2018, 82, 1068–1078. [Google Scholar] [CrossRef]
  18. Davis, S.J.; Caldeira, K. Consumption-based accounting of CO2 emissions. Proc. Natl. Acad. Sci. USA 2010, 107, 5687–5692. [Google Scholar] [CrossRef] [Green Version]
  19. Guan, D.; Peters, G.P.; Weber, C.L.; Hubacek, K. Journey to world top emitter: An analysis of the driving forces of China’s recent CO2 emissions surge. Geophys. Res. Lett. 2009, 36, 82–85. [Google Scholar] [CrossRef] [Green Version]
  20. Zhang, Z.; Guo, J.; Hewings, G.J. The effects of direct trade within China on regional and national CO2 emissions. Energy Econ. 2014, 46, 161–175. [Google Scholar] [CrossRef]
  21. Onat, N.C.; Aboushaqrah, N.N.; Kucukvar, M.; Tarlochan, F.; Hamouda, A.M. From sustainability assessment to sustainability management for policy development: The case for electric vehicles. Energy Convers. Manag. 2020, 216, 112937. [Google Scholar] [CrossRef]
  22. Steinberger, J.; Roberts, J.T.; Peters, G.; Baiocchi, G. Pathways of human development and carbon emissions embodied in trade. Nat. Clim. Chang. 2012, 2, 81–85. [Google Scholar] [CrossRef]
  23. Liu, J.; Diamond, J. China’s environment in a globalizing world. Nature 2005, 435, 1179–1186. [Google Scholar] [CrossRef] [PubMed]
  24. Chen, W.D.; Wu, F.Y.; Geng, W.X.; Yu, G.Y. Carbon emissions in China’s industrial sectors. Resour. Conserv. Recycl. 2017, 117, 264–273. [Google Scholar] [CrossRef]
  25. Zhao, N.; Xu, L.X.; Malik, A.; Song, X.G.; Wang, Y.F. Inter-provincial trade driving energy consumption in China. Resour. Conserv. Recycl. 2018, 134, 329–335. [Google Scholar] [CrossRef]
  26. Zhang, Y.G.; Tang, Z.P. Driving factors of carbon embodied in China’s provincial exports. Energy Econ. 2015, 51, 445–454. [Google Scholar] [CrossRef]
  27. Fang, K.; Zhang, Q.F.; Song, J.N.; Yu, C.; Zhang, H.R.; Liu, H.M. How can national ETS affect carbon emissions and abatement costs? Evidence from the dual goals proposed by China’s NDCs. Resour. Conserv. Recycl. 2021, 171, 105638. [Google Scholar] [CrossRef]
  28. Mi, Z.; Sun, X. Provinces with transitions in industrial structure and energy mix performed best in climate change mitigation in China. Commun. Earth Environ. 2021, 2, 1–12. [Google Scholar] [CrossRef]
  29. Peters, G.P.; Minx, J.C.; Weber, C.L.; Edenhofer, O. Growth in emission transfers via international trade from 1990 to 2008. Proc. Natl. Acad. Sci. USA 2011, 108, 8903–8908. [Google Scholar] [CrossRef] [Green Version]
  30. Wiedmann, T. A review of recent multi-region input–output models used for consumption-based emission and resource accounting. Ecol. Econ. 2009, 69, 211–222. [Google Scholar] [CrossRef]
  31. Wang, Q.; Liu, Y.; Wang, H. Determinants of net carbon emissions embodied in Sino-German trade. J. Clean. Prod. 2019, 235, 1216–1231. [Google Scholar] [CrossRef]
  32. Cheng, H.; Dong, S.C.; Li, F.J.; Yang, Y.; Li, S.T.; Li, Y. Multiregional Input-Output Analysis of Spatial-Temporal Evolution Driving Force for Carbon Emissions Embodied in Interprovincial Trade and Optimization Policies: Case Study of Northeast Industrial District in China. Environ. Sci. Technol. 2018, 52, 346–358. [Google Scholar] [CrossRef]
  33. Xu, X.C.; Li, S.T. China Regional Expansion Input-Output Table in 1997: Preparation and Application; Tsinghua University Press: Beijing, China, 2008. [Google Scholar]
  34. Li, S.T.; Qi, S.C.; Xu, Z.Y. China Regional Expansion Input-Output Table in 2002: Preparation and Application; Economic Science Press: Beijing, China, 2010. [Google Scholar]
  35. Li, S.T. China Regional Expansion Input-Output Table in 2007: Preparation and Application; Economic Science Press: Beijing, China, 2016. [Google Scholar]
  36. Li, S.T. China Regional Expansion Input-Output Table in 2012: Preparation and Application; Economic Science Press: Beijing, China, 2018. [Google Scholar]
  37. IPCC. Climate Change: The Physical Science Basis. Contribution of Working Group A to the Fourth Assessment Report of the Intergovermental Panel on Climate Change. Available online: https://www.ipcc.ch/report/ar4/wg1/ (accessed on 10 February 2022).
  38. Gregg, J.S.; Losey, L.M.; Andres, R.; Blasing, T.J.; Marland, G. The Temporal and Spatial Distribution of Carbon Dioxide Emissions from Fossil-Fuel Use in North America. J. Appl. Meteorol. Clim. 2009, 48, 2528–2542. [Google Scholar] [CrossRef] [Green Version]
  39. International Panel on Climate Change (IPCC). IPCC Guidelines for National Greenhouse Gas Inventories; IGES: Kanagawa, Japan, 2006. [Google Scholar]
Figure 1. Trend of Carbon Emissions in China in 1997–2015.
Energies 15 02079 g001
Figure 2. Spatio-temporal features of net ECEs-PT outflow for Shanxi from 1997 to 2012.
Energies 15 02079 g002
Figure 3. The net ECEs-PT outflow of 28 sectors in Shanxi.
Energies 15 02079 g003
Figure 4. Contribution for net ECEs-PT outflow of 28 sectors in Shanxi.
Energies 15 02079 g004
Figure 5. Contribution for net ECEs-PT outflow of top three sectors in Shanxi.
Energies 15 02079 g005
Figure 6. Changes of contribution rates of industrial net ECEs-PT outflow and net CV outflow of study area in 1997–2012.
Energies 15 02079 g006
Figure 7. The spatial pattern of the three largest industries of net ECEs-PT transference.
Energies 15 02079 g007
Figure 8. Net CV outflow and net ECEs-PT outflow of the top three largest net ECEs-PT outflow sectors ((a). Coalmin; (b). MetalSmelt; (c). RefPetrol) from Shanxi to the other provinces in 2012.
Energies 15 02079 g008aEnergies 15 02079 g008b
Table 1. Driving force for 28 sectors in the study area.
SectorsTechnologyStructureVolume
Agri−0.96−0.86−0.13
Coalmin10.125.775.20
CrudeOil−1.81−0.90−1.09
MetalOreMin−0.57−0.47−0.13
NonMetalOreMin−0.06−0.03−0.03
FoodTobacco−0.49−0.31−0.21
Textile−0.15−0.10−0.05
Apparel−0.09−0.05−0.04
WoodFurniture−0.18−0.11−0.08
PaperCulture−0.39−0.25−0.17
RefPetrol5.353.701.98
Chemical0.45−0.411.03
NonMProd0.24−0.240.57
MetalSmelt8.554.784.50
MetalProd−0.11−0.09−0.03
Machinery−0.50−0.45−0.06
TranspEq0.030.04−0.01
ElecMachinery−0.17−0.11−0.07
ElectronicEq−0.44−0.28−0.19
MeasureInstr−0.15−0.14−0.01
OtheManuf−0.14−0.11−0.04
ElectpowerProd1.741.400.41
Gas−0.07−0.04−0.03
Water−0.010.00−0.01
Construct0.190.100.10
Transport0.750.370.46
WholesRetail0.060.040.02
Other0.200.130.08
Agri−0.96−0.86−0.13
Coalmin10.125.775.20
CrudeOil−1.81−0.90−1.09
MetalOreMin−0.57−0.47−0.13
Table 2. Optimization Measures of Each Type.
TypeOptimization Measures
Type APromoted typeExpand investment, scale up production, and expand market share
Type BControlled typeDecrease investment, scale down production, and decrease market share
Type CC1: Orientation-encouraged typeModerately expand investment, extend trade with lower industrial advantage provinces
C2: Orientation-reduced typeExpand trade with lower advantage industrial provinces and decrease trade with greater industrial advantage provinces
Type DRegulated typeCut down investment, control production scale, combining market regulation and government control
Publisher’s Note: MDPI stays neutral with regard to jurisdictional claims in published maps and institutional affiliations.

