Abstract
This paper presents the results of a multifaceted analysis of the application of catalytic additives to hemp pellets’ combustion in a low-power boiler. The research concerns the effects of five catalytic additives applied inside the boiler’s combustion chamber—based on TiO2, MnO2, Cu(NO3)2 × 3H2O, H2PtCl6 solution, and 99.5% pure urea solution—on the quality of hemp pellets’ combustion process. For this purpose, technical and elemental analyses of the used fuel were performed. The chemical composition of exhaust gases (NOx, CO, SO2, and PM content) was also examined using an exhaust gas analyzer and a dust meter. The highest reductions in emissions of individual pollutants were for CO (−113%; combustion with Ad3), NOx (−66%; combustion with Ad 4), SO2 (−48%; combustion with Ad3), and PM (−78%; combustion with Ad1). The study also determined the amount of avoided costs due to the use of catalytic additives, as well as the annual prevented CO2 emissions to the atmosphere. Due to rising fuel and energy prices, this study could be helpful for biomass boiler owners who would like to burn locally available raw materials and increase the combustion process’ efficiency.
1. Introduction
The energy industry is associated with continuous economic growth. Despite the emergence of energy-saving solutions, the demand for energy is constantly growing. According to forecasts, from 2018 to 2050, global energy consumption will increase by 50%, and in the industrial sector by over 30%. This will increase the consumption of non-renewable fuels, especially in industries where most customers use liquid or solid fuels. This situation will negatively affect society and the environment [1,2].
Air pollutants can be divided into primary and secondary types. The former are emitted to the atmosphere from the source of their production, i.e., by power plants or heat sources in households. These pollutants include carbon dioxide (CO2), particulate matter (PM), sulfur oxides (SOX), and nitrogen oxides (NOX). Carbon monoxide, which is formed during incomplete combustion of fuels, is also a harmful substance, the emission of which depends on the method of combustion. On the other hand, the latter kind arises from chemical reactions of primary pollutants, and includes, for example, ozone (O3) [3]. Nitrogen oxides are emitted to the atmosphere mainly during fuel combustion processes, and the main emitters are transport and the energy industry [4,5]; their emission contributes to global warming, smog formation, and acid rain [6]. The development of civilization has led to a significant increase in greenhouse gas (GHG) emissions, resulting in accelerated temperature rise, climate change, danger to human health. Greenhouse gases mainly include carbon dioxide (CO2), methane (CH4), and nitrous oxide (N2O) [7,8].
The total CO2 emissions from fossil fuels in 2018 were 37.9 gigatonnes, and China was the largest emitter, with 11.3 Gt of CO2. On the other hand, in the European Union (EU), CO2 emissions from fossil fuels have decreased by over 20% since 1990, and in 2018 amounted to 3.5 gigatonnes of CO2 [9]. Most of the pollutants emitted to the atmosphere come from the combustion of fossil fuels. Therefore, technologies that use renewable energy sources are being introduced [10]. Solar, wind, hydro, geothermal, ocean, and biomass are considered alternatives to fossil resources; their use has a positive effect in terms of reducing the emission of harmful compounds—especially CO2 [11,12].
Due to environmental problems, countries such as China, the United States, and Germany have decided to introduce legislation regulating the use of renewable energy sources in order to reduce the energy industry’s negative impact on the climate [13,14,15,16]. The European Union aims to achieve net-zero greenhouse gas emissions by 2050. The European Green Deal proposes increasing the emission reduction targets. The current 2030 climate and energy policy targets include at least 40% GHG reduction and at least 32% energy share from renewable sources in the total energy consumption [17].
Biomass is an energy source that can significantly reduce pollutant emissions and replace fossil fuels such as coal. According to the Directive of the European Parliament and the Council, biomass is waste from the agricultural industry, forestry, and biodegradable fractions of industrial and municipal waste [18]; it can be obtained from many materials, including wood and its processing products, household waste, or sewage [19]. Biomass can be divided according to the degree of processing (and according to the source of origin) into primary and secondary. Primary biomass comes from dedicated energy crops and production surpluses, while secondary biomass is from waste, i.e., byproducts from various industries [20].
Undoubtedly, a significant part of the biomass used for energy purposes should come from production processes, where the material remaining after processing is considered as waste; its use has a beneficial effect in two areas: First of all, using waste for energy production prevents problems with its management. Secondly, energy crops are limited, focused only on the production of materials intended for energy purposes, which negatively affects crops intended for edible products and sterilizes the soil [21,22].
Cannabis sativa L. is an annual plant grown for use in oil, fiber, and building materials. Hemp is not a difficult plant to grow, and shows the ability to adapt to various conditions. This plant can be used for soil reclamation, and can absorb heavy metals. Additionally, its cultivation shows great possibilities for using solar energy and CO2 during photosynthesis [23,24,25]. The dry matter yield of hemp is between 10 and 15 Mg∙ha−1.
In 2018, Canada, North Korea, and France were the leading hemp producers in terms of cultivated area [26,27]. According to studies conducted by Frankowski and Sieracka [28], the calorific value of hemp biomass is 17.1 MJ∙kg−1, while the study conducted by Kraszkiewicz et al. [24] showed that the calorific value of the examined biomass was 16.6 MJ∙kg−1. For comparison, the calorific value of straw pellets is 15.82 MJ∙kg−1, while that of wood pellets is 17.49 MJ∙kg−1. Therefore, hemp biomass can be used as a fuel, with favorable energy properties [29].
Nitrogen oxides (NOX) are a severe threat to the environment, so direct real-time measurement—especially of large sources—is essential, allowing us to monitor emissions and take measures to reduce the release of harmful compounds into the atmosphere. There are three main mechanisms of NOX formation: fuel, thermal, and fast. The first is the result of the oxidation of nitrogen compounds in fuel, which takes place during combustion. In contrast, depending on the oxidation temperature, the other mechanisms use the nitrogen contained in the air for combustion for this purpose.
Emissions of nitrogen oxides can be reduced during the combustion process by controlling the oxidation temperature and excess air. There are two leading treatment technologies: selective catalytic reduction (SCR), and non-selective catalytic reduction (SNCR) [30].
Selective catalytic reduction (SCR) uses ammonia, urea, or cyanuric acid to convert nitrogen oxides to water and molecular nitrogen (N2) over catalytic beds at a temperature range of 150–600 °C. SCR technology can be used for the combined removal of NOX and SOX as well as NOX and CO. This is one of the most widely used methods of reducing NOX emissions; it is used in power plants, combined heat and power plants, and industrial furnaces [30,31]. Selective non-catalytic reduction (SNCR) reduces nitrogen oxides to molecular nitrogen using ammonia or urea at temperatures of 850–1150 °C. This technology does not use catalysts, making it simpler and cheaper than SCR technology [32,33].
Research carried out on sunflower husk pellets [34] and wood pellets [35] has confirmed the effectiveness of the use of catalytic additives in both reducing the emission of pollutants and increasing the profitability of their use. An increase in combustion efficiency was observed, translating into a reduction in fuel consumption. In the case of sunflower husk pellets, the additive containing copper oxide, manganese oxide, and urea particles at proportions of 10%, 60%, and 30%, respectively, was the most advantageous combustion additive; its use reduced the emission of nitrogen oxides by as much as 48%. During the combustion of wood pellets, the greatest reduction in NOx emissions was recorded during the combustion of material with the addition of manganese oxide and urea particles; the reduction in NOx emissions in this case was as high as 72%.
The novelty of this article consists of research on different catalytic substances and their efficiency in emissions reduction. In the article, an interesting analysis of increased carbon monoxide and NOX emissions for one of the additives was performed. The discussion of this phenomenon considers the temperature increase in the furnace due to the use of this catalyst. The material (Cannabis sativa) is also not widely investigated.
The structure of the paper is as follows: Section 1 provides information regarding air pollutants and their impact on the environment, the hemp used in the research, and the types of catalysts. Section 2 includes information about the methodology for measuring exhaust gases’ quality, particulate matter content, the temperature in the combustion chamber, fuel consumption reduction, and calculation of annual avoided costs and prevented atmospheric CO2 emissions. Section 3 contains the research results. Section 4 presents a discussion of the obtained results. Section 5 provides the conclusions of our conducted analysis.
2. Materials and Methods
2.1. Research Stand
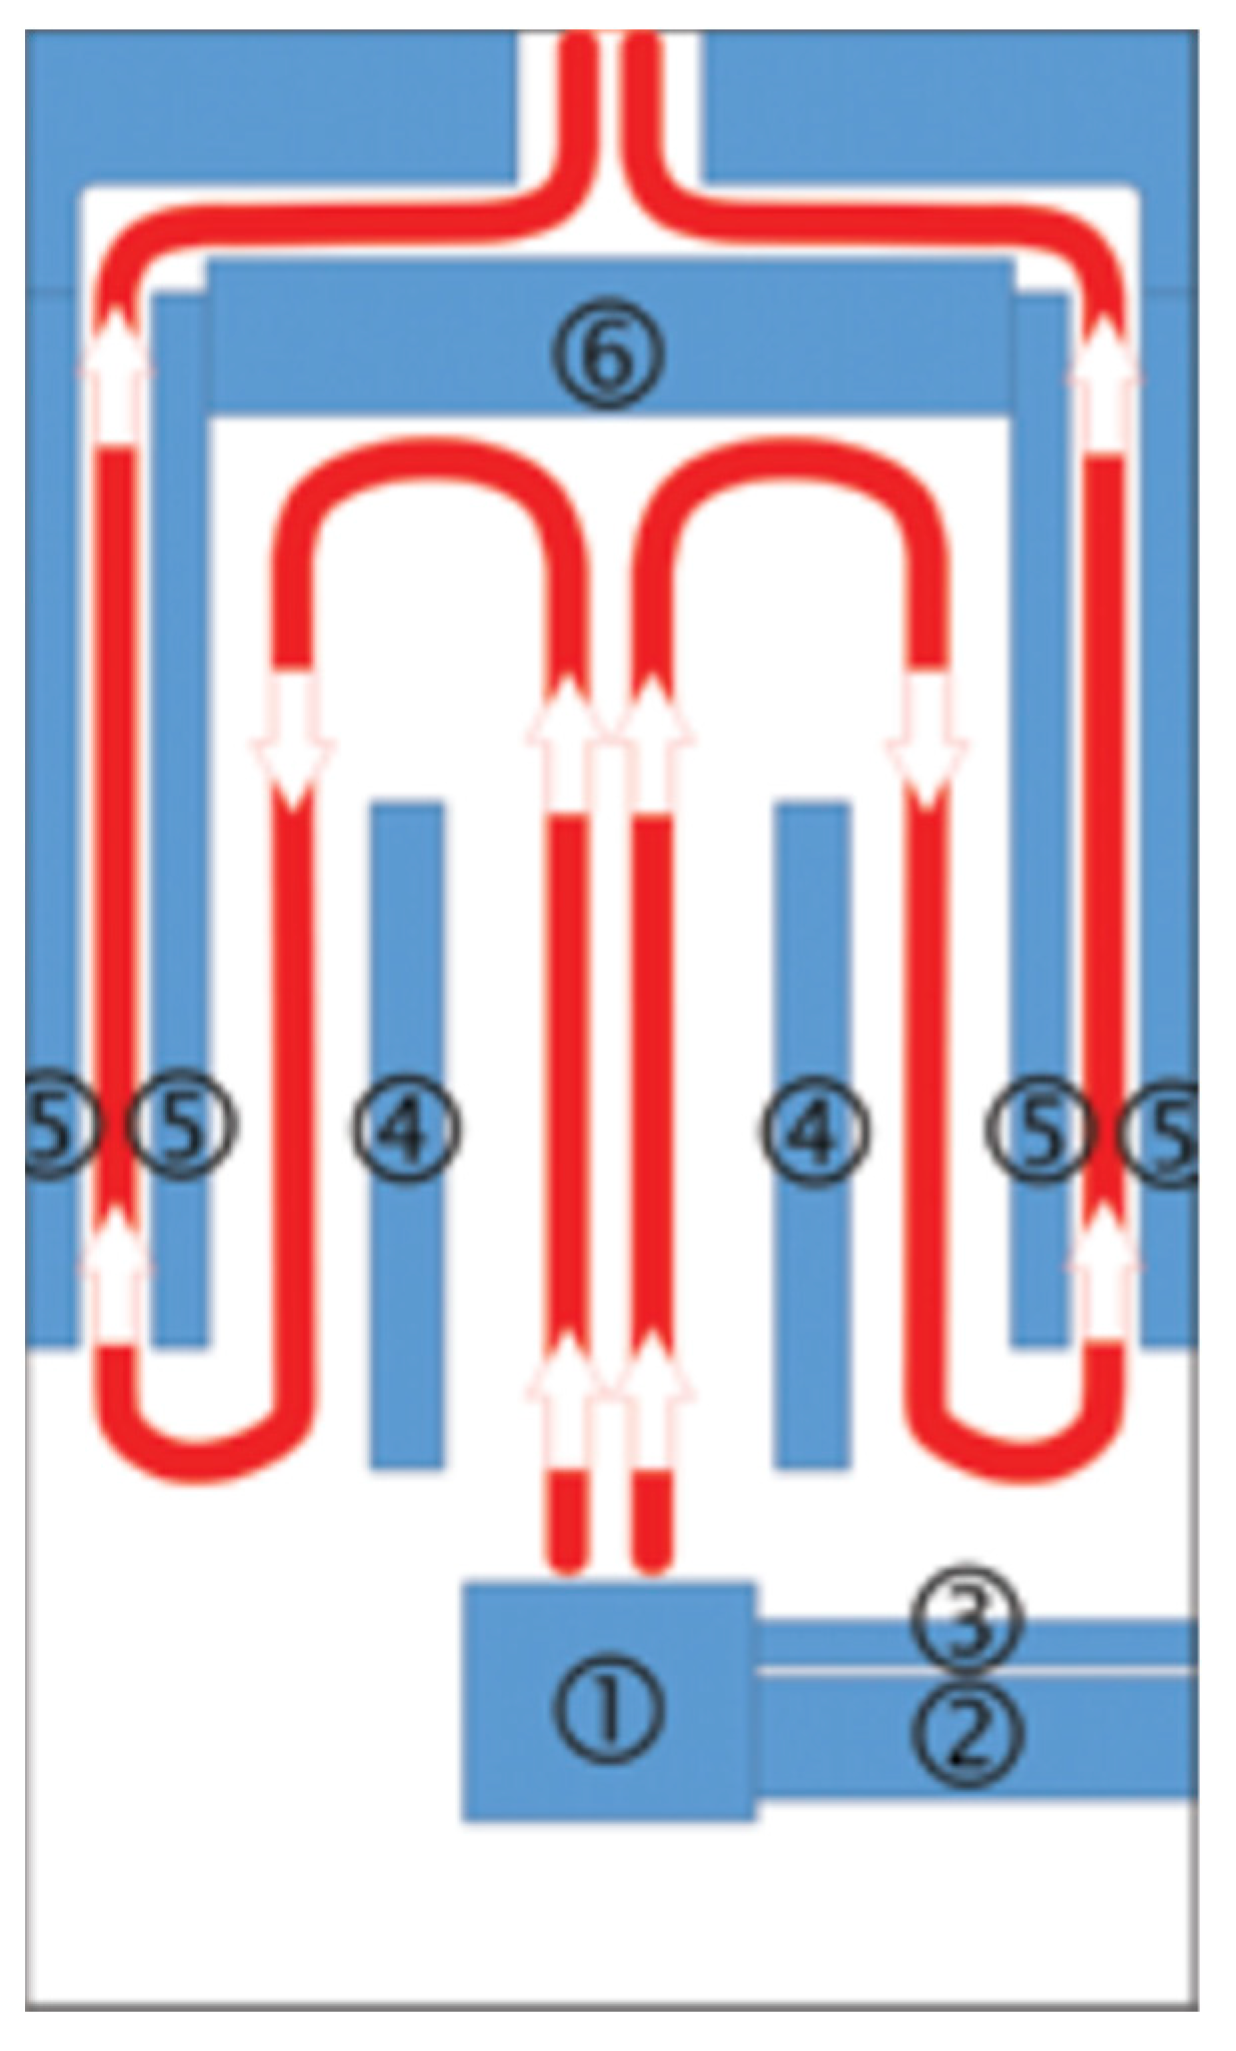
The research was conducted using a fully automatic retort boiler with nominal thermal power of 15 kW (EG-PELLET 15, produced by EKOGREŃ, Pszczyna, Poland); a controller had regulated its operating parameters. The temperature sensor readings and the lambda probe supplied the appropriate dose of fuel and air to the combustion chamber. An exhaust fan and a screw feeder coupled with a container provided the air dose and the fuel, respectively. The generated heat energy was transferred to the environment through fan heaters with a heating capacity of 40 kW. The scheme of the combustion chamber’s construction, with flue gas flow, is presented in Figure 1.
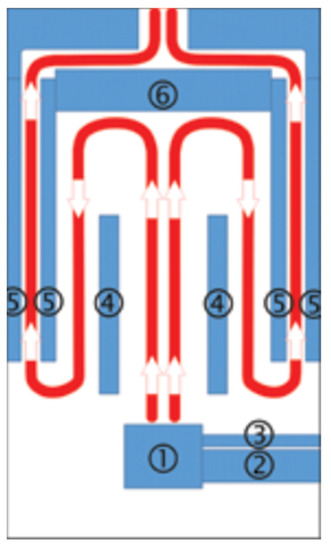
Figure 1.
Scheme of combustion chamber construction, with flue gas flow—1: burner, 2: pellet feeder, 3: aeration pipe, 4: partition, 5: water jacket, 6: exhaust deflector.
2.2. Materials
To power the boiler, hemp pellets with a diameter of 6 mm were used; they were purchased in a pelletized form from a local farmer. In the process of preparing active substances, TiO2 (WARCHEM, Warsaw, Poland), MnO2 (WARCHEM), oxides, Cu nitrate (NO3)2 × 3H2O (WARCHEM), H2PtCl6 solution (Avantor Performance Materials Poland SA, Warsaw, Poland), and urea solution with a purity of 99.5% (manufacturer Pol-Aura) were applied. The carrier for the active substance was sodium aluminosilicate (SIPERNAT 820 A, manufactured by Evonik, Essen, Germany). The active substances were applied to the support based on the wet impregnation method. In the following stages, they were subjected to drying and calcination. Five different variants of catalytic additives are presented in Table 1.

Table 1.
Mass fraction of individual active substances in the produced catalytic additives.
The produced catalytic substances were applied to the surface of pellets via the method of dry impregnation until the moment of obtaining the appropriate concentration in the pellet structure, corresponding to 0.1% in relation to the weight of the fuel burned. The dose of the active substance was determined based on preliminary studies [36]. In order to evenly introduce the catalytic additive to the pellet surface, mixing was performed in a semi-open rotary paddle mixer (60 rpm).
2.3. Biofuel Physicochemical Analysis
The technical analysis of the biofuels used to power the boiler was carried out following the standards applicable to solid biofuels. The technical analysis included determining such fuel properties as moisture content, ash content, volatile matter content, and gross and net calorific value. All tests in the field of analyzing the physicochemical properties of materials were carried out in triplicate.
The moisture content in the fuel was determined using the weighing-dryer method with the use of a laboratory dryer (WAMED KBC-65 W), following the PN-EN standard [37]. The technical specification of the used laboratory dryer is presented in Table 2.

Table 2.
Technical specifications of the WAMED KBC-65 W laboratory dryer.
The value of the combustion heat was determined with the use of an IKA C 200 calorimeter. The calorific value was determined following the PN-EN standard [38]. The technical data of the used calorimeter are presented in Table 3.

Table 3.
Technical specifications of the IKA C 200 calorimeter.
The content of mineral parts in the fuel (content after ashing) was determined by soaking crucibles containing a certain amount of fuel in a muffle furnace (SNOL 8.2/1100) at a temperature of 550 °C, following the requirements of the PN-EN standard [39]. The content of volatile parts in the fuel was determined by heating in an inert atmosphere in a muffle furnace according to the PN-EN standard [40]. The inert atmosphere in the muffle furnace chamber was obtained by introducing carbon dioxide into it during the analysis. The technical specifications of the used muffle furnace are presented in Table 4.

Table 4.
Technical specifications of the SNOL 8.2/1100 muffle furnace.
The elemental composition of biomass fuels—i.e., the determination of the contents of carbon, hydrogen, nitrogen, and sulfur—was ascertained with the use of the PerkinElmer CHNS/O 2400 apparatus. The tests were carried out on samples in a dry state, crushed to a grain size smaller than 0.2 mm, following the requirements of the PN-EN standard [41]. The technical specifications of the used apparatus are presented in Table 5.

Table 5.
Technical specifications of the PerkinElmer CHNS/0 2400 apparatus.
2.4. Analysis of Exhaust Gas Composition
The measurement was performed with the use of the Testo 350 flue gas analyzer. The detection of individual compounds in the exhaust gas was performed based on the photochemical method. The recording of the exhaust gas composition was started after the stabilization of the combustion process. The measurement lasted 5 h continuously, and the results were recorded every 1 s.
The used analyzer’s technical data are shown in Table 6.

Table 6.
Technical specifications of the Testo 350 flue gas analyzer.
The particulate matter content in the flue gas was measured with the use of a Testo 380 particulate matter analyzer. It was determined as a sum of the suspended dusts, without division into individual fractions. The amount of PM in the exhaust gas was measured based on the infrared detection method. Prior to the measurement, the apparatus was conditioned.
The specifications of the used particulate matter analyzer are shown in Table 7.

Table 7.
Technical data of the Testo 380 particulate matter analyzer.
The analyzer and dust meter probe were placed through a stub pipe in the chimney at a distance of 30 cm from the boiler’s flue gas outlet.
2.5. Measurement of the Temperature in the Combustion Chamber
The temperature measurements in the combustion chamber were carried out with the use of an APAR AR205 data recorder connected to four K-type thermocouples. These were placed in special connectors passing through the water jacket directly to the combustion chamber. The thermocouples were arranged parallel to the deflector and the burner. The instantaneous temperature values were recorded at a frequency of 1 s for the entire measurement duration. On the basis of the obtained results, the average values were determined. The outcomes included the mean measurement error, amounting to ±1.5 °C.
2.6. Fuel Consumption Measurement
Fuel consumption was measured while the boiler was operating at nominal power. The burnt pellet dose was determined by measuring the fuel stream fed to the boiler for 1 h. The boiler worked under set conditions, where the working medium temperature at the boiler’s outlet was 70 °C, while at the inlet it was 40 °C. The degree of pellet consumption reduction was determined on the basis of the relationship between the weight of fuel burned with a catalytic additive and the weight of primary fuel burned.
2.7. Economic Analysis of the Use of Catalytic Additives
The economic analysis of catalytic additives used for hemp pellets’ combustion in a low-power biomass boiler was performed by calculating the average annual heat demand in a household and the fuel weight necessary to generate an appropriate amount of heat. The calculations also considered the costs related to purchasing the required amounts of fuel and active substances. The assumptions adopted for the calculations are presented in Table 8. The analysis was performed following the methodology contained in the Regulation of the Minister of Infrastructure and Development of 27 February 2015 on the Methodology for Determining the Energy Performance of a Building or Part of a Building and Energy Performance Certificates [42]. The individual coefficients/values presented in Table 8 are taken from verified and up-to-date sources of information [42,43,44,45,46,47,48].

Table 8.
Adopted assumptions for the economic analysis.
2.8. Calculation of the Annual CO2 Emissions
The environmental effect resulting from the use of catalytic additives in the heating installation is determined by the reduction in the emissions of CO2, calculated for one year. The calculation was made for the assumed heat demand, and using the data contained in the document of The National Centre for Emissions Management entitled “Calorific Values and CO2 Emission Factors in 2019 to be Reported under the Emission Trading Scheme for 2022” [49].
Annual CO2 emissions to the atmosphere were calculated using the following formula:
where represents the annual CO2 emissions to the atmosphere (kg∙year−1); is the annual mass of burnt hemp pellets for heating purposes and domestic hot water (kg∙year−1); is the hemp pellets’ lower heating value (MJ∙year−1); and is the CO2 emission factor for biomass fuel (kg∙MJ−1).
3. Results
This research aims to compare the effect of selected catalytic additives on the hemp pellets’ combustion process, considering the energy, economic, and environmental aspects. The recorded values from exhaust gases’ quality and particular matter content measurements were recalculated on 10% oxygen content in the flue gas.
3.1. Biofuel Physicochemical Analysis
The basic technical properties of the analyzed biomass fuel are presented in Table 9.

Table 9.
Results of the technical analysis of the biomass fuel.
The results of the research on the content of elements in the biomass fuel are shown in Table 10.

Table 10.
Biomass fuel elemental analysis results.
The analysis of physicochemical properties proved that hemp pellets are suitable for energetic use in the combustion process. Their low ash content (7.26%) and high calorific value (17.01 MJ kg−1) are comparable with those of other popular biomass energy carriers. Hemp pellets have a high nitrogen content (4.90%), which may increase the emission of nitrogen oxides in the combustion process. The second element that influences the formation of harmful compounds in the combustion process is sulfur; hemp pellets have a small amount of this element in their chemical composition (0.27%). Nevertheless, even such a small amount of sulfur in the fuel will be reflected in the subsequent SO2 emissions in the exhaust gas.
3.2. Measurement of the Temperature in the Combustion Chamber
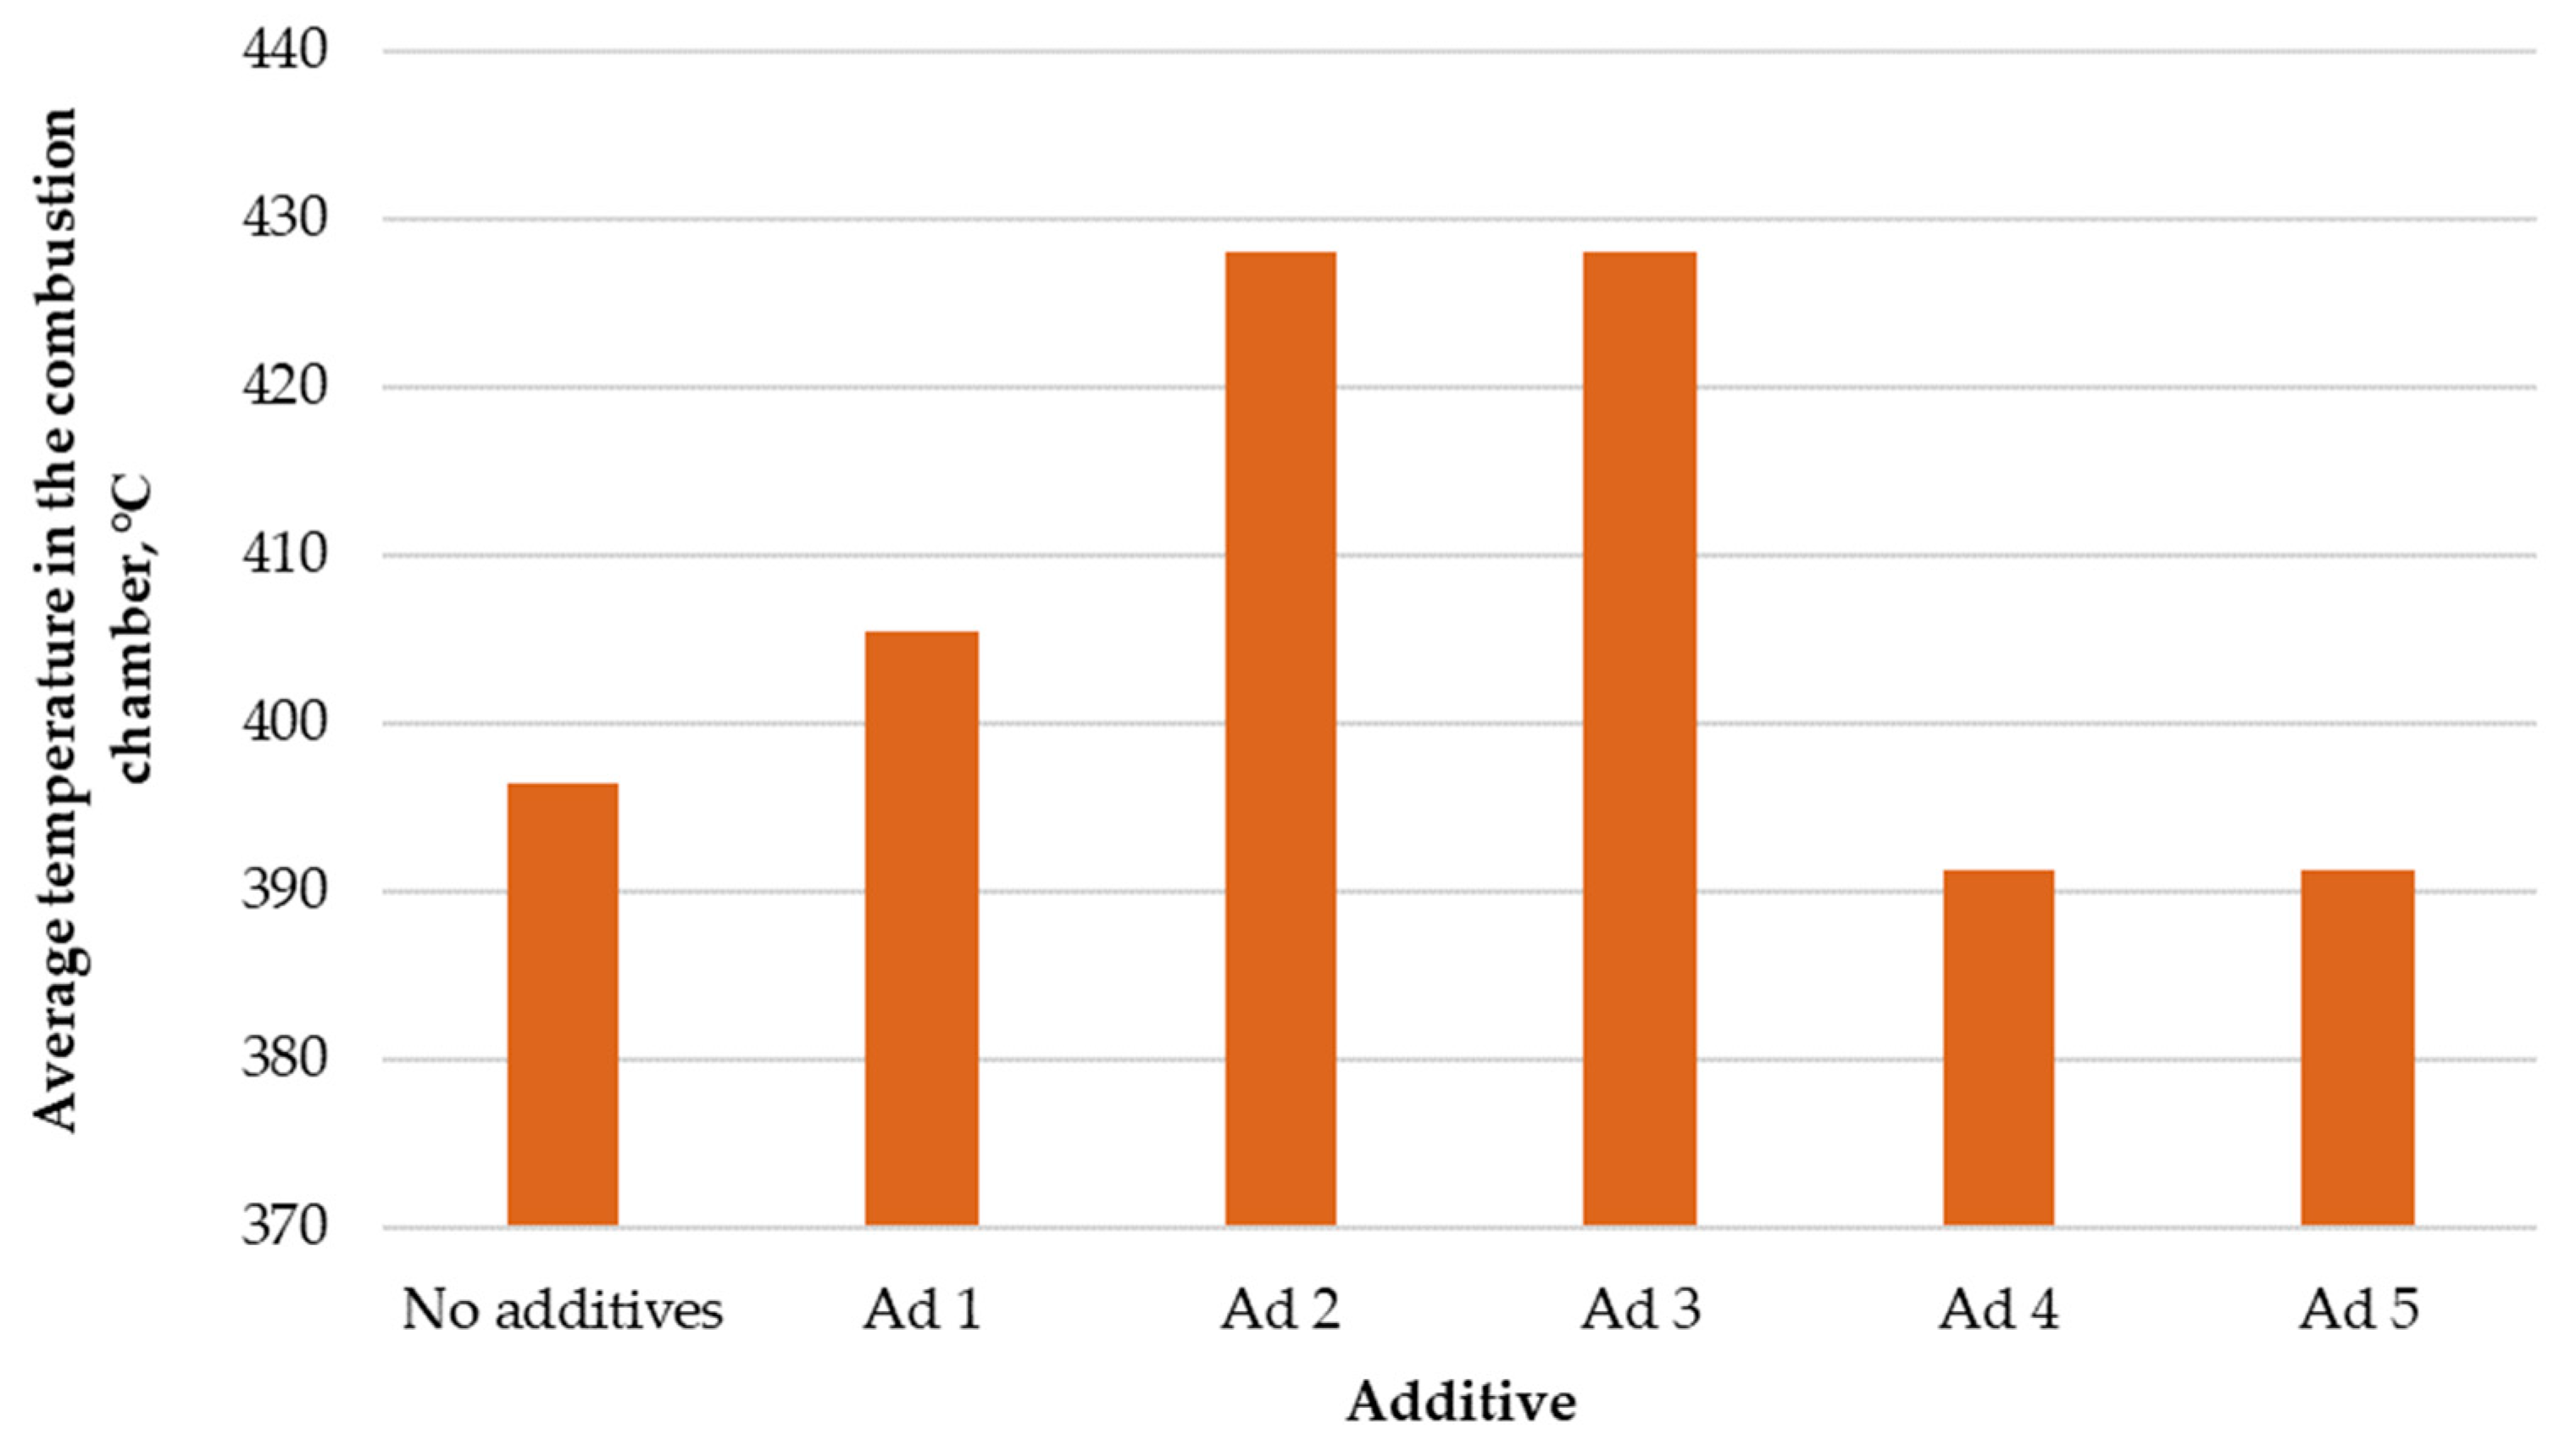
Figure 2 presents the comparison of average temperatures in the combustion chamber.
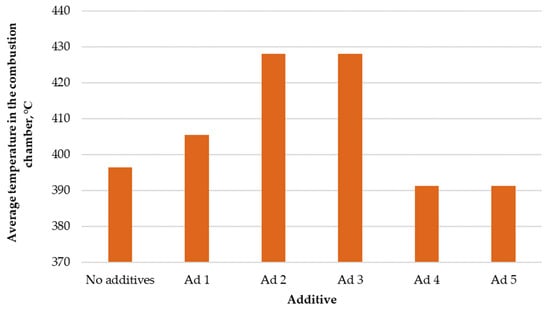
Figure 2.
Comparison of average temperatures in the low-power biomass boiler’s combustion chamber.
The use of active substances in the thermal conversion process did not result in an increase in temperature in every case. The use of catalyst additives No. 4 and No. 5 caused a slight decrease in temperature in the combustion chamber, by 10 °C on average. The use of other substances increased the temperature by ~10–35 °C. The increase in the average temperature in the combustion chamber may have been due to the improvement in the course of the combustion reaction. This is evidenced by the fact that the catalysts causing the temperature increase in the chamber caused a simultaneous reduction in the amount of CO in the exhaust gas. As a result of the combustion of carbon monoxide, the average temperature increased, and the boiler efficiency increased by reducing the so-called stack loss.
3.3. Analysis of Catalytic Additives’ Influence on Fuel Consumption
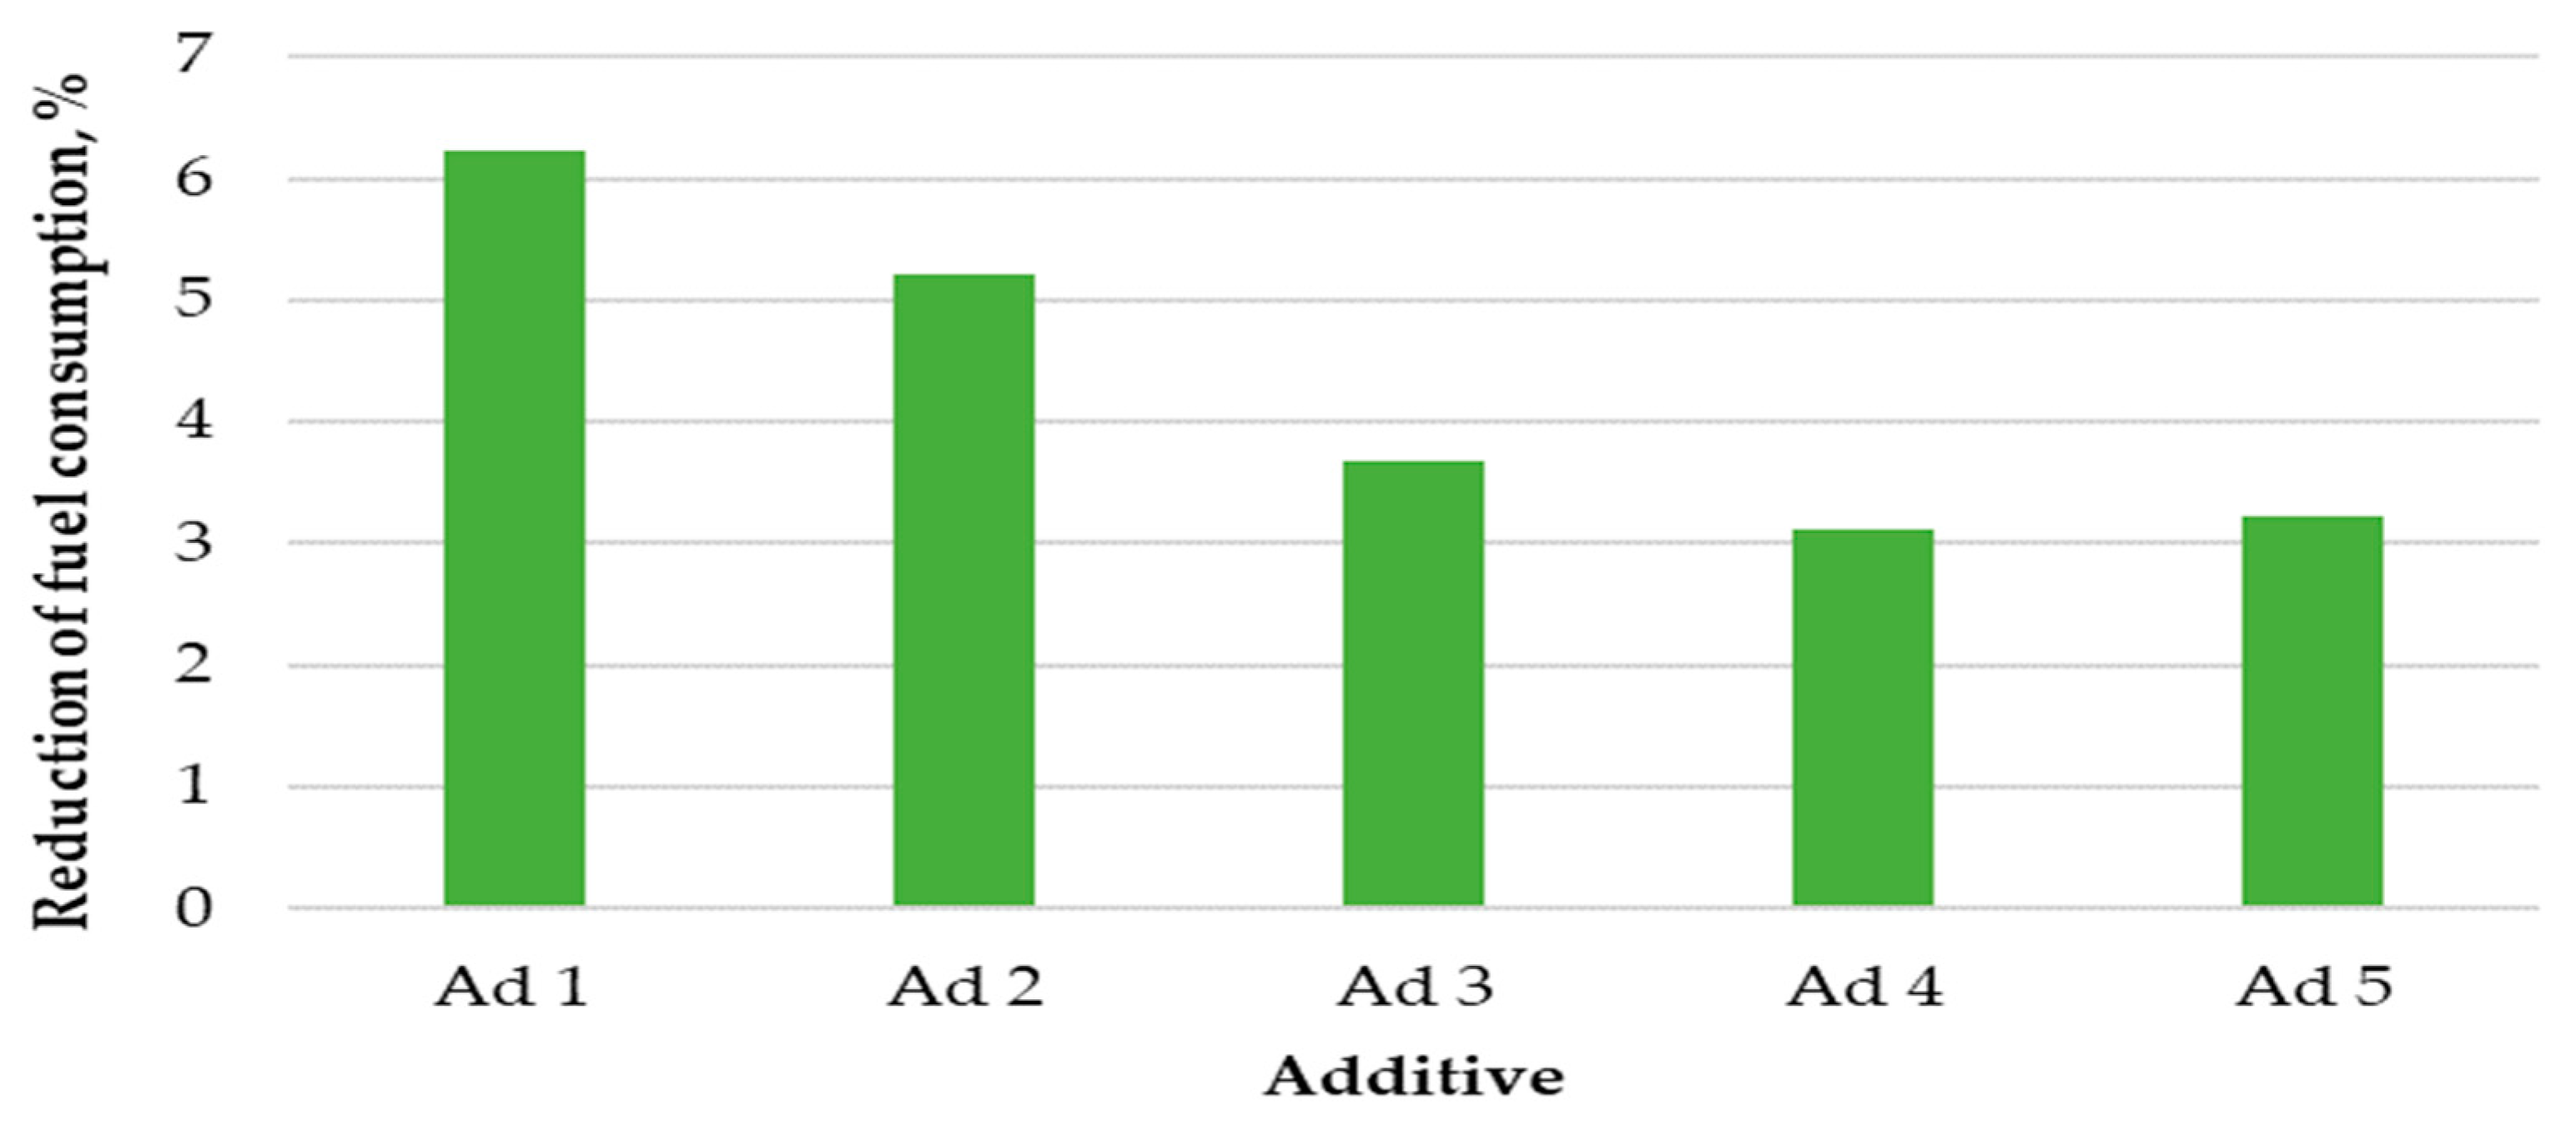
The results of fuel consumption reduction after the application of catalytic additives are shown in Figure 3.
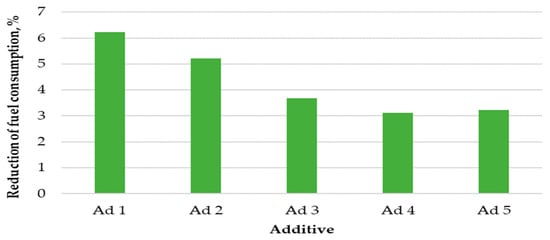
Figure 3.
Percentage reduction in fuel consumption.
The use of catalysts co-combusted with hemp pellets resulted in a reduction in fuel consumption. The highest pellet consumption reduction coefficient was recorded for additive No. 1, which amounted to 6.2%. A slightly lower reduction in fuel consumption was caused by the use of additive No. 2; during the combustion of this substance with pellets, fuel consumption decreased by 5.3%. The other additives also reduced fuel consumption, but to a lesser extent. The average percentage of fuel consumption reduction for additives No. 3, No. 4, and No. 5 oscillated in the range between 3.1% and 3.6%.
3.4. Analysis of Exhaust Gas Composition
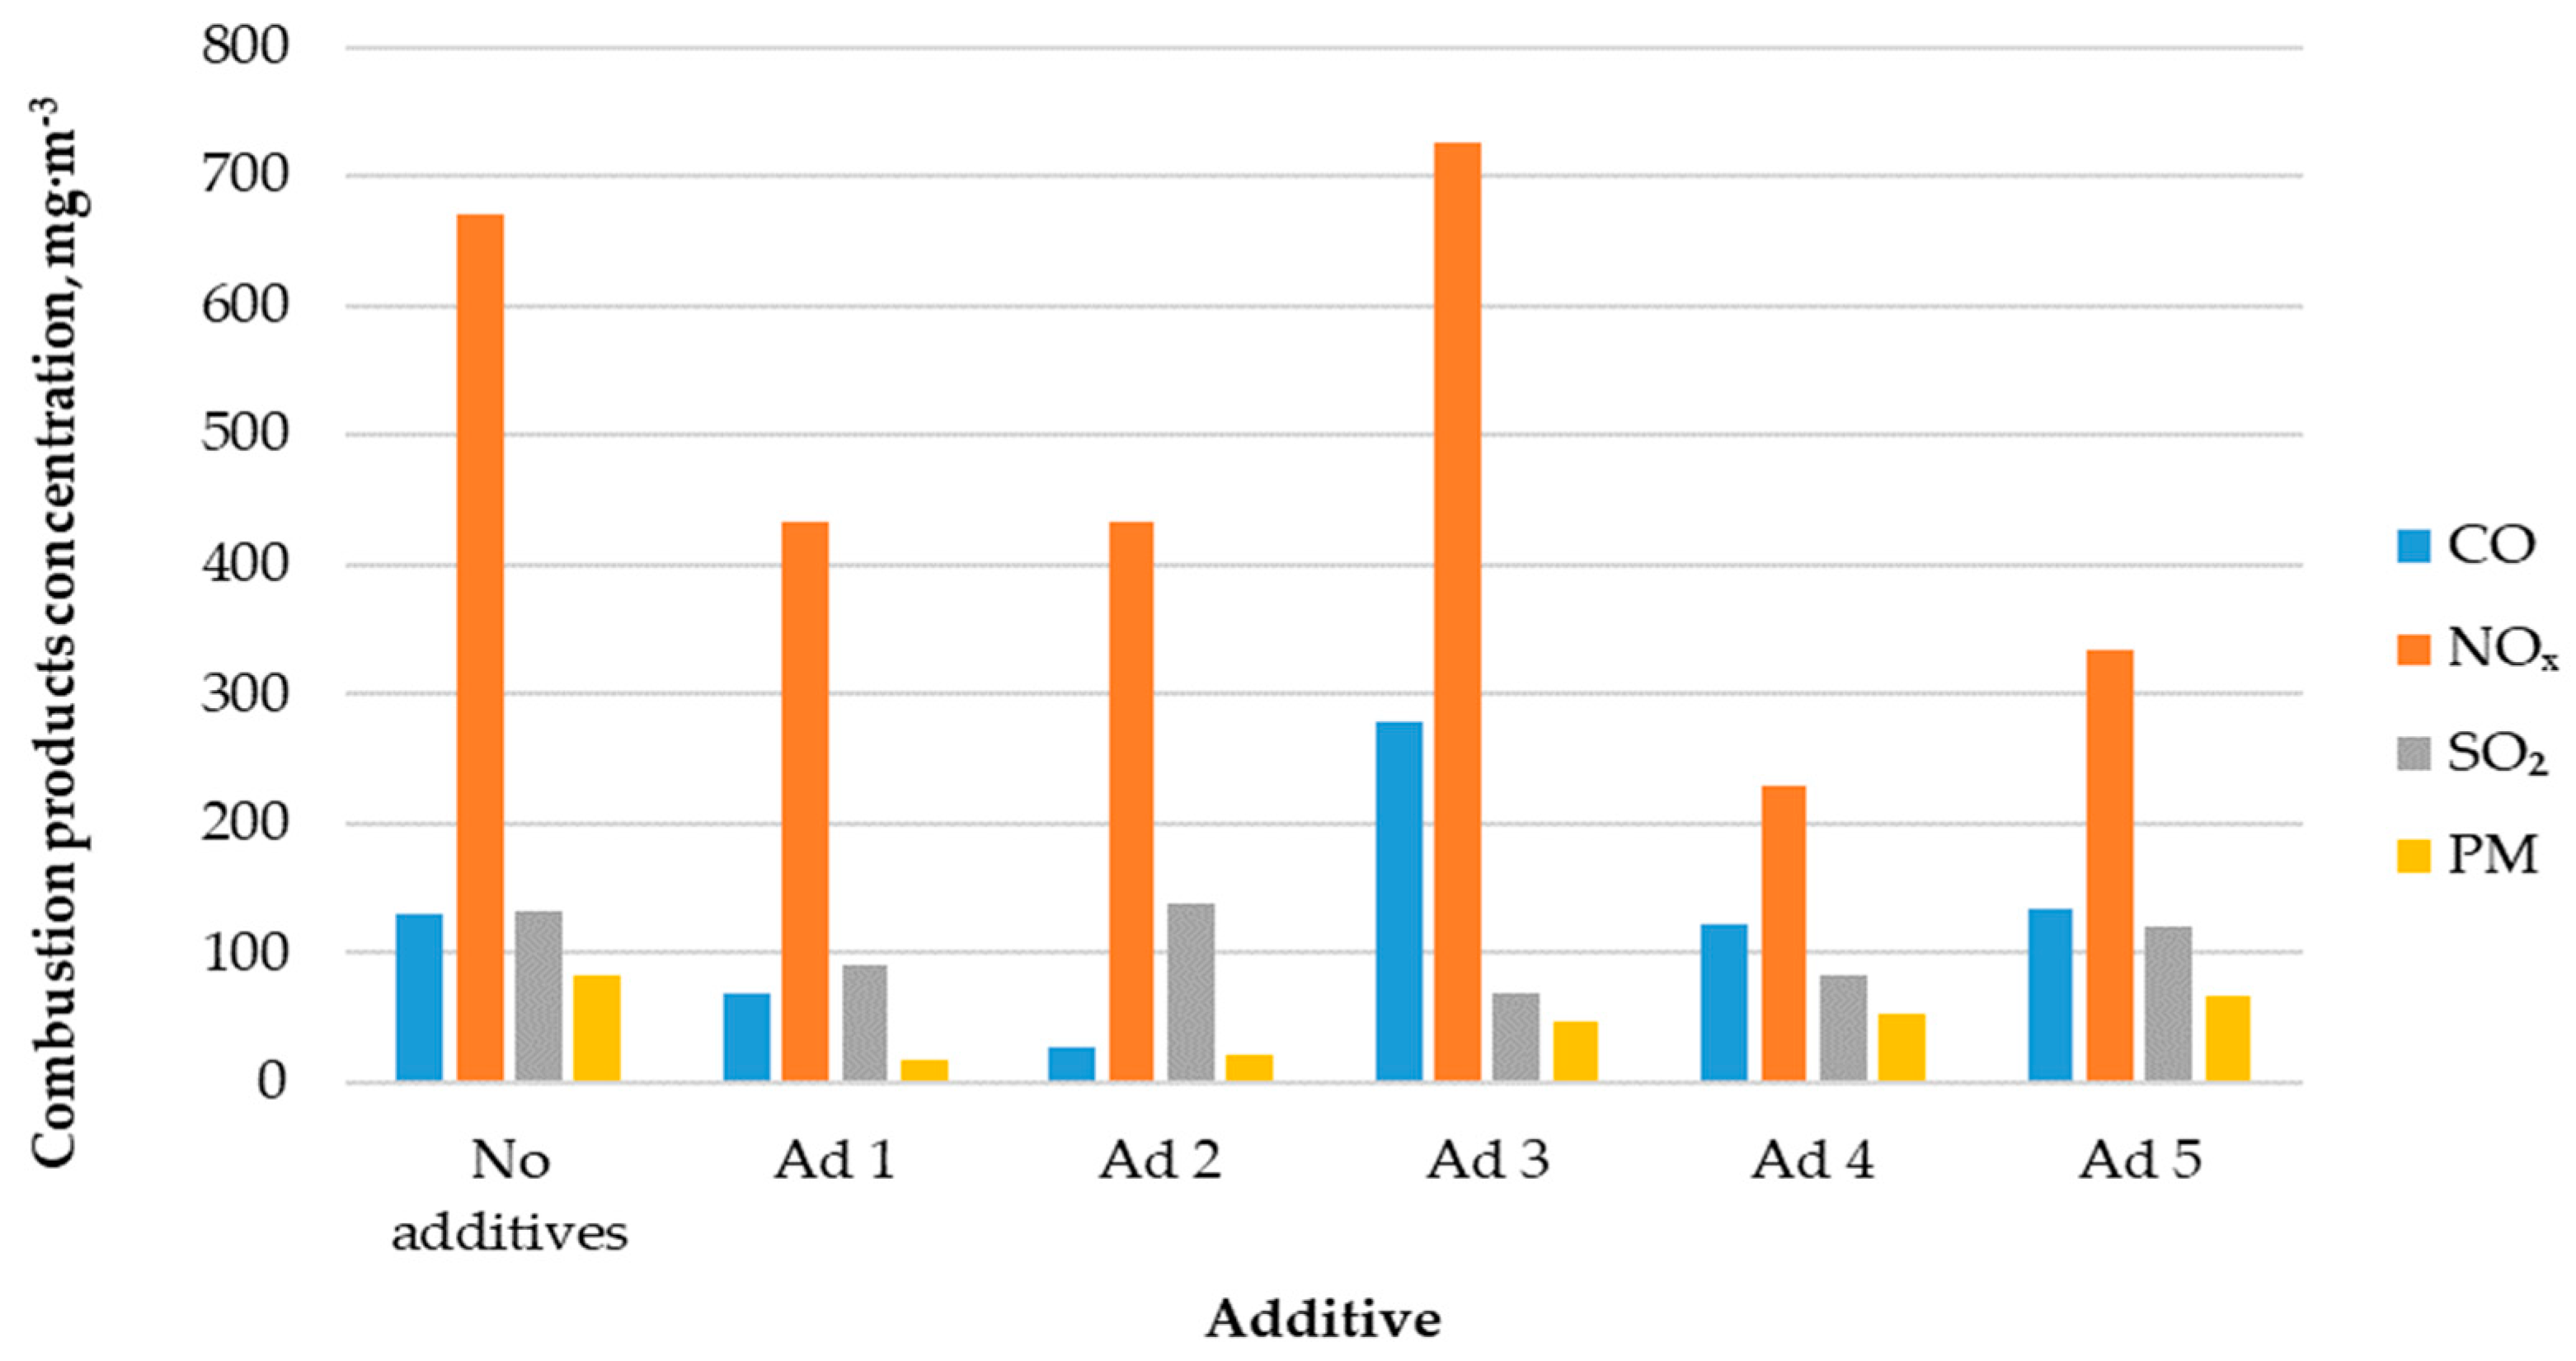
Figure 4 shows the correlation between combustion products’ concentrations in the flue gas and the used catalytic additive type.
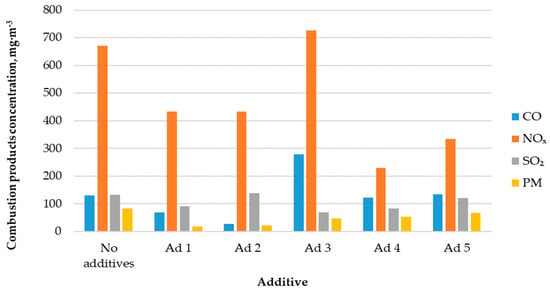
Figure 4.
Concentration of combustion products in the exhaust gases.
The CO concentration in the flue gas during the hemp pellets’ combustion without a catalytic additive was 131 mg·m−3. The use of catalysts did not always cause the reduction in carbon monoxide emissions into the atmosphere. Additives No. 3 and No. 5 increased emissions by 113% and 2%, respectively. The use of the remaining three additives caused emissions to decrease in the range of 6–79%.
During the hemp pellets’ combustion without catalytic additives, nitrogen oxide emissions were on average 670 mg·m−3. Except for additive No. 3, almost all catalytic additives resulted in a several dozen percent reduction in NOX emissions into the atmosphere.
The process of hemp pellets’ combustion without the use of catalytic additives resulted in sulfur dioxide emissions into the atmosphere of 133 mg·m−3. Applying most of the catalytic additives to the boiler combustion chamber resulted in a 9–48% decrease in SO2 emissions to the atmosphere. Only additive No. 2 increased the emission of this compound, by 9%.
During the analyzed biofuel’s combustion without catalytic additives, the average particulate matter (PM) concentration was 82 mg·m−3. In every case, the use of catalytic additives caused a reduction in PM content in the flue gas, in the range of 18–78%.
3.5. Economic Analysis of the Use of Catalytic Additives
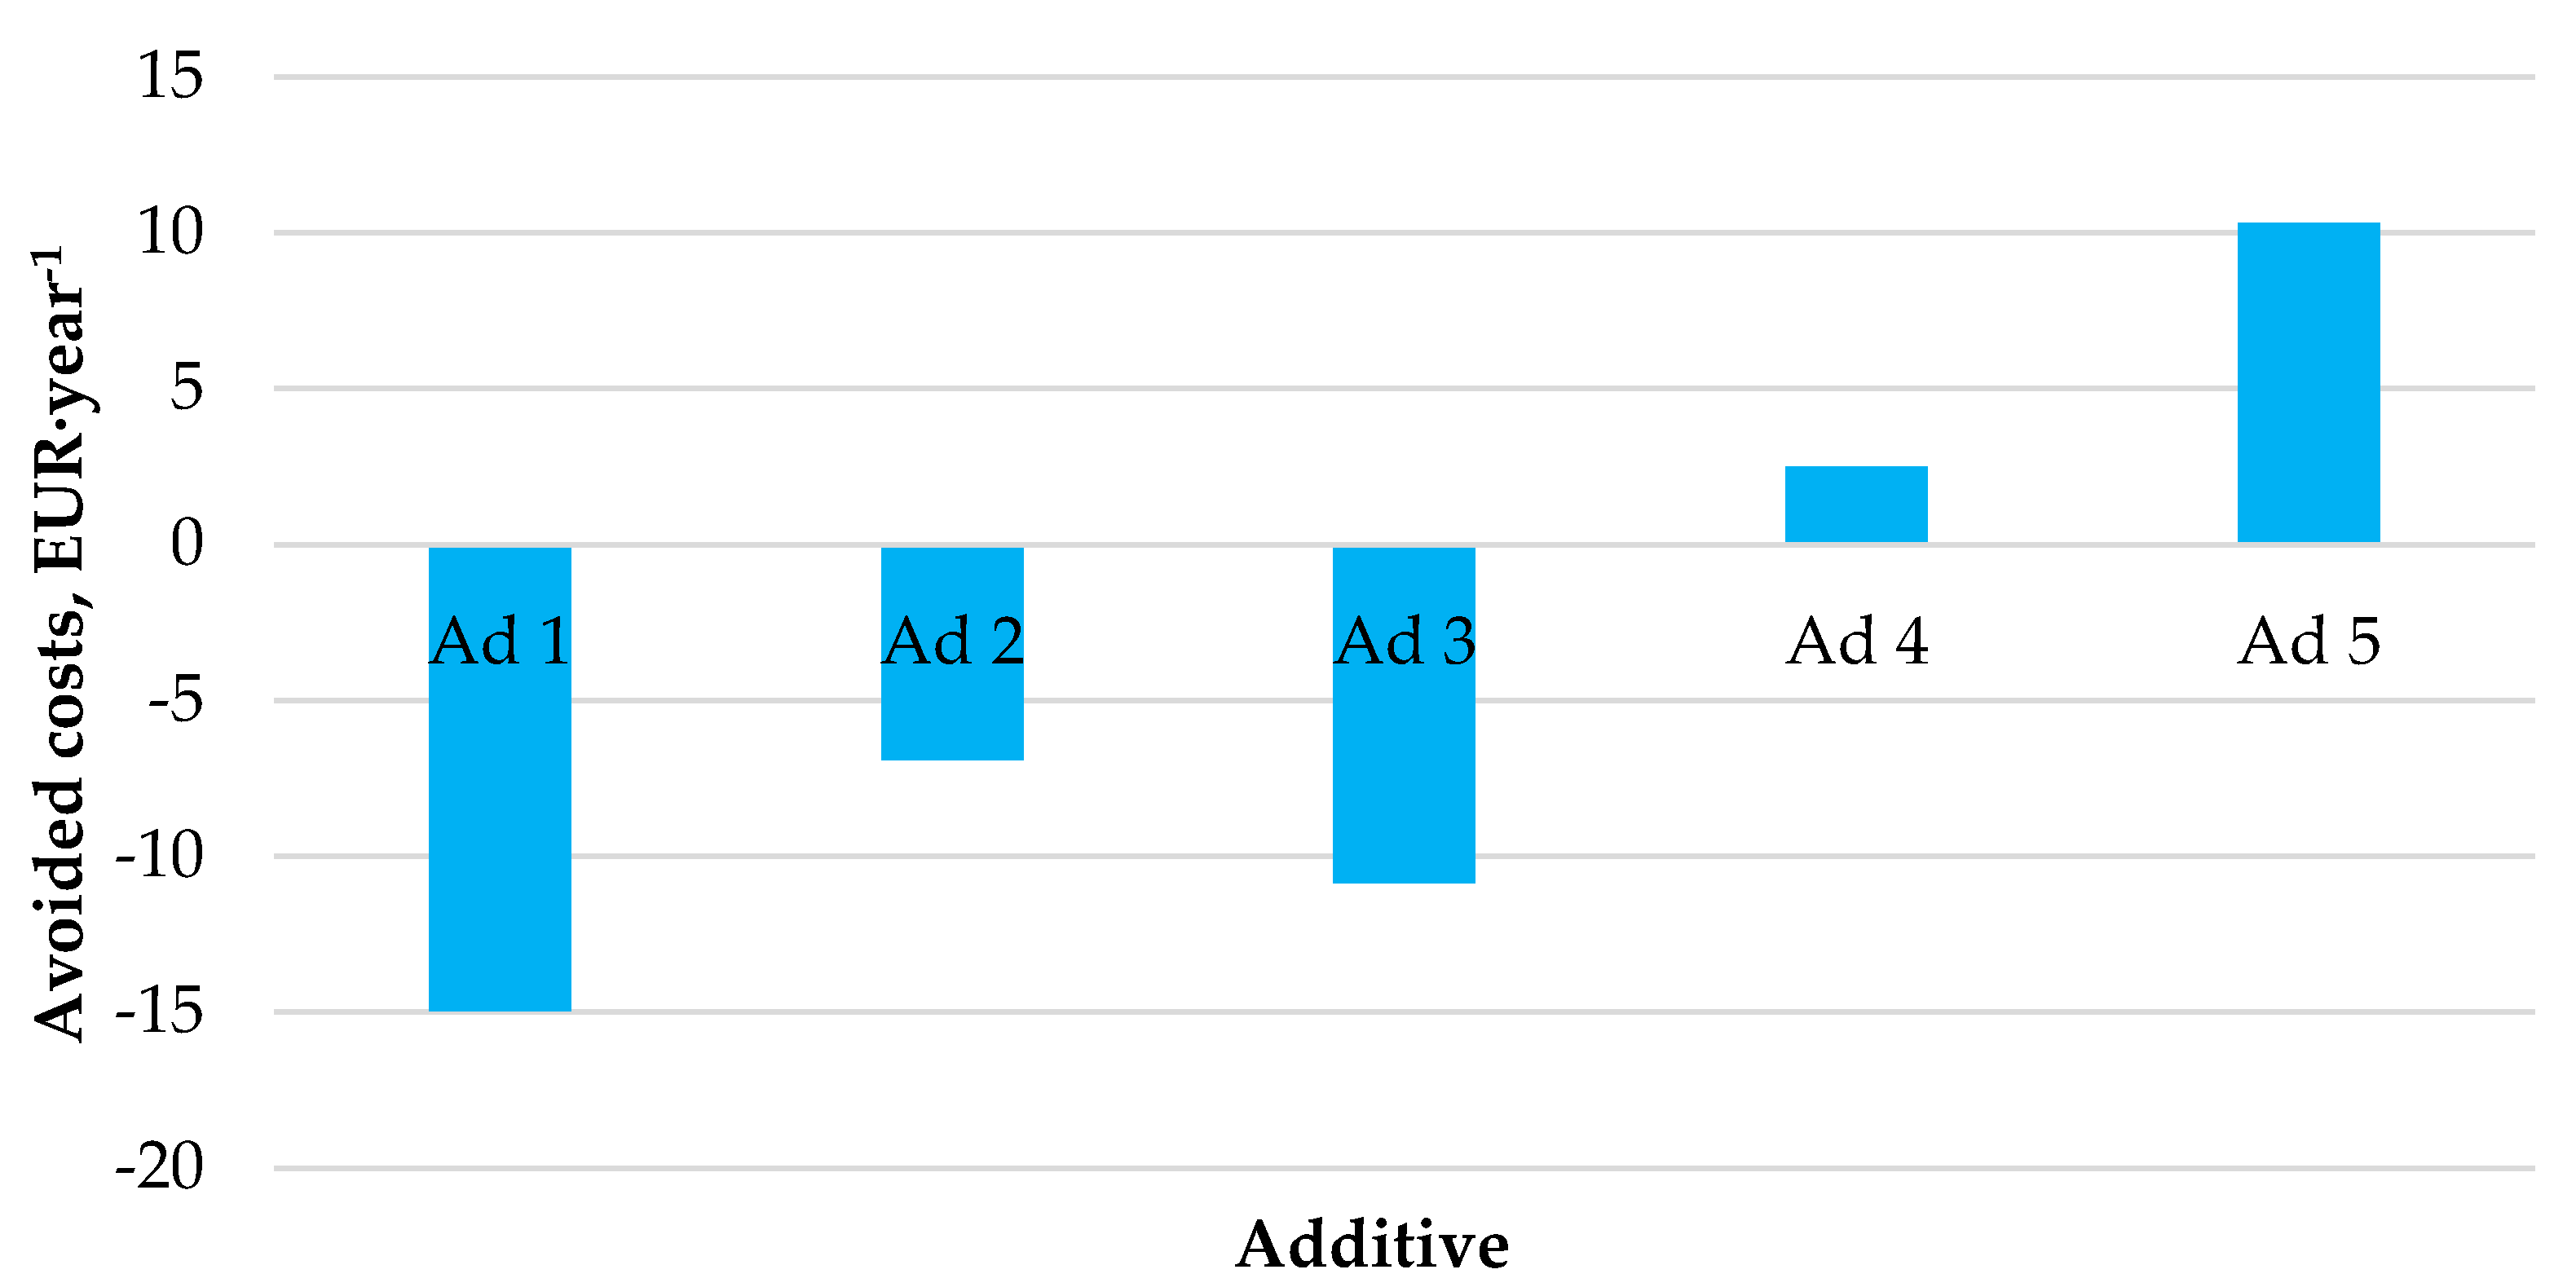
Figure 5 shows the outcomes of the performed economic analysis investigating the effect of the use of catalytic additives on the generation of financial savings.
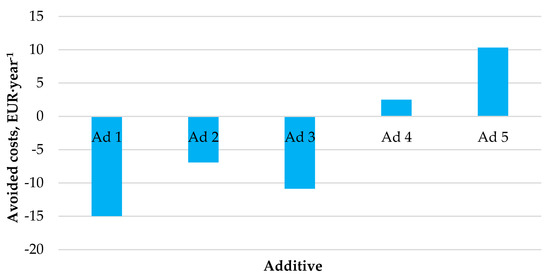
Figure 5.
Expected amounts of avoided costs by the co-combustion of hemp pellets with catalytic additives.
The economic profitability analysis showed that not every catalytic additive generates financial savings for heating and domestic hot water preparation in a medium-sized household. Annual financial savings were generated only using additives No. 4 and No. 5, amounting to EUR 3–10 per year.
3.6. Calculation of the Annual CO2 Emission
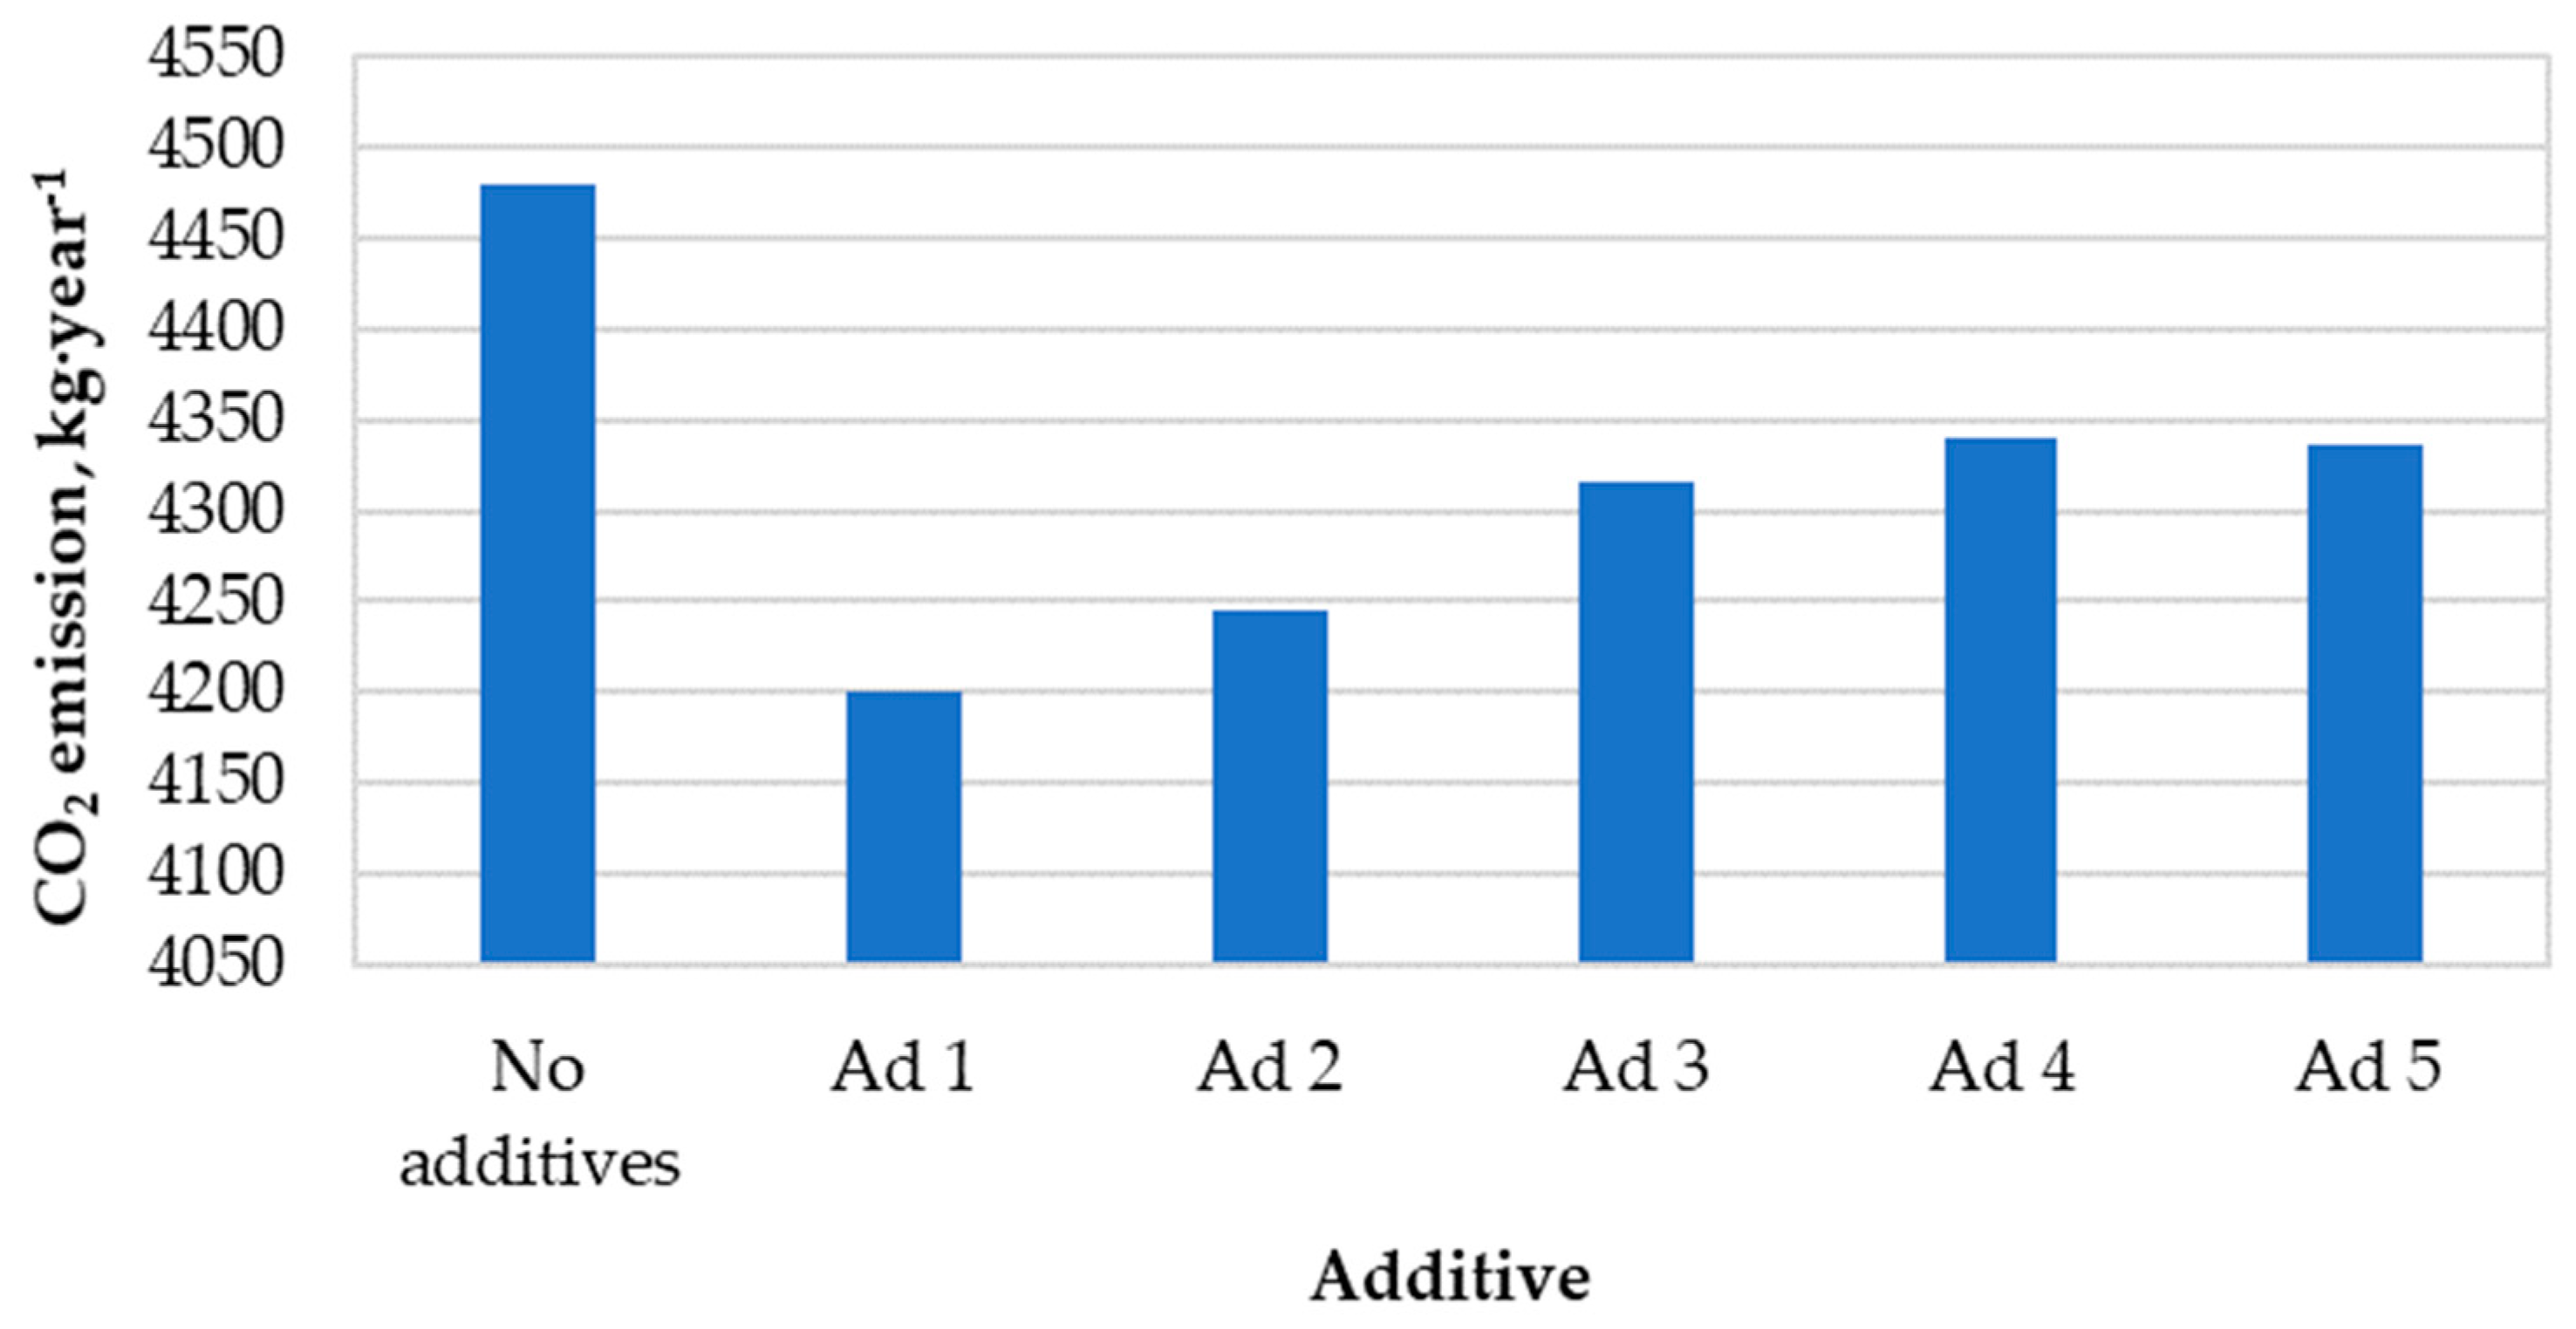
Figure 6 presents the calculated values of annual carbon dioxide emissions to the atmosphere resulting from the combustion of hemp pellets with and without catalytic additives.
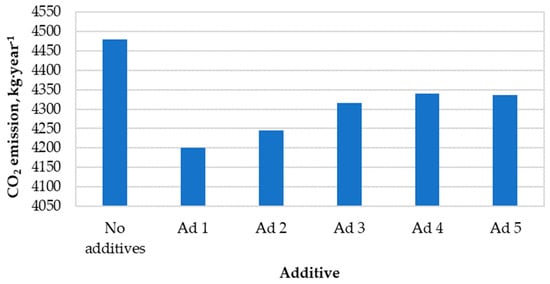
Figure 6.
Annual amount of carbon dioxide emissions into the atmosphere.
The use of each of these active substances resulted in a reduction in carbon dioxide emissions. The greatest decrease was caused by the use of additive No. 1 in the combustion process (c.a. −6%. compared to non-catalytic combustion). The average reduction in CO2 emissions resulting from the use of catalytic additives was ~200 kg∙year−1.
4. Discussion
The positive effect on emissions reduction was disturbed by carbon monoxide (CO) emissions, which increased by 113%, while NOX emission increased by 8% for additive No. 3 (consisting mainly of titanium oxide nanoparticles (~70%)). The tendency was rechecked, and the result remained similar. The discussion of this phenomenon should consider the temperature increase in the furnace due to the use of this catalyst (additive No. 3). There are three mechanisms of NOX creation: One of them (the temperature mechanism of creation) depends on the temperature in the combustion chamber. In the literature, the minimum temperature for this mechanism of NOx creation is 1100 °C, and the hypothesis to explain the rise of NOX emissions gives reason for the catalytic reduction in the minimal temperature of this mechanism to as low as 400 °C [50]. At this temperature, NOX emissions increase, and the oxygen needed to form these particles is responsible for a local oxygen deficiency in the furnace chamber. This, in turn, influences the amount of carbon monoxide formation. It should be pointed out that additive No. 3 had the highest efficiency in SO2 reduction, making it useful for technologies aimed at sulfur reduction.
The remaining emissions after adding various catalysts were consistent with the expectations and conclusions described in the literature. The NOX emissions dropped the most with additive No. 4, due to it having the highest proportion of urea. Interestingly, this reduction would not be effective if there were not a high share of magnesium oxide, which lowers the temperature of the reduction reaction. Adding copper (additive No. 5) made the catalytic reduction less effective, but it lowered the cost of the additive (Figure 5).
Additives No. 1 and No. 2 (substantially based on platinum) were efficient in reducing all emissions, and were the most universal; they had the most positive influence on the boiler’s efficiency (Figure 3), but the cost of platinum made this solution economically ineffective.
In summary, the results obtained throughout the research cycle confirm the positive environmental and economic effects of using catalytic additives co-combusted with biomass fuel. In the process of carbon monoxide and suspended dust afterburning, substances containing platinum, titanium, and copper particles, characterized by oxidizing properties, became the most effective additives. The best variant of additive No. 1 enabled reduction in CO emissions by as much as 79%. Afterburning the combustible parts in the flue gas increases boiler efficiency by reducing stack losses. The combustion of flammable substances in the exhaust gas causes an increase in the temperature in the combustion chamber, which translates into a reduction in fuel consumption. Additive No. 1 turned out to be the most effective in this respect, reducing fuel consumption by 6.2%. Lower fuel consumption also generates savings in the form of lower costs incurred when purchasing the energy carrier. The afterburning properties of catalysts also reduce the operating costs of the boiler by reducing the frequency of cleaning or servicing of the boiler. The effect of catalysts on reducing pollutants—i.e., nitrogen oxides—was also noted. The catalytic additives containing urea and manganese particles, characterized by reducing properties, turned out to be the most effective in reducing nitric oxide. Additive No. 4 proved to be the most effective catalyst in reducing NOX. The use of this additive co-combusted with the fuel resulted in a reduction in nitrogen oxide emissions into the atmosphere by as much as 66%.
5. Conclusions
The main conclusion is that catalytic additives were efficient in reducing individual emissions, and two of them (additives No. 4 and No. 5) positively influenced the profitability of their use. Carbon dioxide emissions reductions of up to −6% (compared to non-catalytic combustion) were observed for all examined additives. The rest of the emissions varied for different catalytic substances. The most efficient in SO2 reduction was additive No. 3, based on titanium oxide, but it increased NOX and CO emissions due to the increase in the temperature in the combustion chamber. The hypothesis for this phenomenon is discussed in the previous chapter. Additives No. 1 and No. 2 (with a significant share of Pt) were the most suitable for raising the boiler’s efficiency and CO2 reduction, but had a negative economic effect. This may change if CO2 emissions for small boilers are subject to environmental changes. Additives No. 4 and No. 5 were the most effective for NOX reduction. The research of different forms of biomass showed that both substances are required: urea to reduce NOX to molecular nitrogen (N2), and magnesium oxide to reduce the minimum activation energy for this reaction (i.e., the reduction in emissions with urea can take place at a lower temperature).
All additives were examined to make the combustion of hemp pellets more effective. As pointed out in the introduction, hemp’s popularity as a fuel is growing, and it can be a significant renewable fuel in countries with high agricultural potential, such as Poland. Finding the technology for environmentally friendly and cheap hemp combustion was the most important reason for undertaking the research described in this article. By using catalysts, it is possible to compensate for the undesirable properties of the waste from the production and processing of hemp. Hemp waste, like any biomass, contains high contents of nitrogen and sulfur, which affect the subsequent emission of NOX and SO2. Thanks to the applied catalytic additives, the emissions from the combustion of this type of biomass are negligible, and the combustion process itself is more effective, increasing the attractiveness of hemp waste from the perspective of its energetic management. Thanks to catalytic additives, it is possible to increase the energy use of biomass waste, facilitating the development of a waste-free economy.
The solution described in the manuscript based on catalysts co-combusted with biomass fuel has certain limitations. The catalysts used are characterized by optimal reduction in pollutants in a specific temperature range, i.e., 500–1000 °C. The range of these temperatures is achieved only in low-power boilers; therefore, this solution cannot be implemented in high-power boiler installations, where the temperatures in the combustion chamber exceed the temperature range of the catalysts. In the future, our team plans to study the impact of selected catalysts on emissions from the combustion of other biomass waste, in order to increase the possibility of their energy use.
We also plan to combine the most effective catalytic substances in a single additive for optimal reduction in impurities.
Author Contributions
Conceptualization, B.G. and B.K.; methodology, B.G., B.K. and P.B.; software, B.G. and B.K.; validation, P.B. and M.D. formal analysis, P.B. and M.D. investigation, B.G.; resources, B.G.; data curation, B.G.; writing—original draft preparation, B.G., B.K., P.W., P.B. and M.D.; writing—review and editing, B.G., B.K. and P.W.; visualization, B.G. and B.K.; supervision, P.B. and M.D. All authors have read and agreed to the published version of the manuscript.
Funding
This research received no external funding.
Institutional Review Board Statement
Not applicable.
Informed Consent Statement
Not applicable.
Data Availability Statement
The data presented in this study are available on request from the corresponding author.
Conflicts of Interest
The authors declare no conflict of interest.
References
- Cergibozan, R. Renewable energy sources as a solution for energy security risk: Empirical evidence from OECD countries. Renew. Energy 2022, 183, 617–626. [Google Scholar] [CrossRef]
- Szufa, S.; Piersa, P.; Adrian, Ł.; Sielski, J.; Grzesik, M.; Romanowska-Duda, Z.; Piotrowski, K.; Lewandowska, W. Acquisition of Torrefied Biomass from Jerusalem Artichoke Grown in a Closed Circular System Using Biogas Plant Waste. Molecules 2020, 25, 3862. [Google Scholar] [CrossRef]
- European Environment Agency. Air Quality in Europe—2020 Report; European Environment Agency: Copenhagen, Denmark, 2020. [Google Scholar]
- Duncan, B.N.; Lamsal, L.N.; Thompson, A.M.; Yoshida, Y.; Lu, Z.; Streets, D.G.; Hurwitz, M.M.; Pickering, K.E. A space-based, high-resolution view of notable changes in urban NOx pollution around the world (2005–2014). J. Geophys. Res. Atmos. 2016, 121, 976–996. [Google Scholar] [CrossRef] [Green Version]
- National Emission Balance of SO2, NOX, CO, NH3, NMVOC, Dust, Heavy Metals and POPs for the Years 1990–2018 in the SNAP Classification System; KOBiZE, IOS-PIB: Warsaw, Poland, 2020; Available online: https://www.kobize.pl/uploads/materialy/materialy_do_pobrania/krajowa_inwentaryzacja_emisji/Bilans_emisji_za_2018_v.2.pdf (accessed on 5 February 2022).
- Gómez-García, M.A.; Pitchon, V.; Kiennemann, A. Pollution by nitrogen oxides: An approach to NOx abatement by using sorbing catalytic materials. Environ. Int. 2005, 31, 445–467. [Google Scholar] [CrossRef] [PubMed]
- Mei, B.; Yue, H.; Zheng, X.; McDowell, W.H.; Zhao, Q.; Zhou, Z.; Yao, Z. Effects of grazing pattern on ecosystem respiration and methane flux in a sown pasture in Inner Mongolia, China. Atmosphere 2019, 10, 5. [Google Scholar] [CrossRef] [Green Version]
- Mohammed, S.; Gill, A.R.; Alsafadi, K.; Hijazi, O.; Yadav, K.K.; Hasan, M.A.; Khan, A.H.; Islam, S.; Cabral-Pinto, M.; Harsanyi, E. An overview of greenhouse gases emissions in Hungary. J. Clean. Prod. 2021, 314, 127865. [Google Scholar] [CrossRef]
- Crippa, M.; Oreggioni, G.; Guizzardi, D.; Muntean, M.; Schaaf, E.; Lo Vullo, E.; Solazzo, E.; Monforti-Ferrario, F.; Olivier, J.G.J.; Vignati, E. Fossil CO2 & GHG Emissions of All World Countries. Luxembourg 2019, 107877. Available online: https://publications.jrc.ec.europa.eu/repository/bitstream/JRC117610/fossil_co2_emissions_of_all_world_countries_booklet_online_final.pdf (accessed on 5 February 2022).
- Bukowski, M.; Majewski, J.; Sobolewska, A. Macroeconomic Electric Energy Production Efficiency of Photovoltaic Panels in Single-Family Homes in Poland. Energies 2021, 14, 126. [Google Scholar] [CrossRef]
- Vakulchuk, R.; Overland, I.; Scholten, D. Renewable energy and geopolitics: A review. Renew. Sustain. Energy Rev. 2020, 122, 109547. [Google Scholar] [CrossRef]
- Rahman, M.M.; Sultana, N.; Velayutham, E. Renewable energy, energy intensity and carbon reduction: Experience of large emerging economies. Renew. Energy 2022, 184, 252–265. [Google Scholar] [CrossRef]
- Liu, J. China’s renewable energy law and policy: A critical review. Renew. Sustain. Energy Rev. 2019, 99, 212–219. [Google Scholar] [CrossRef]
- Wang, Q. Effective policies for renewable energy—The example of China’s wind power—lessons for China’s photovoltaic power. Renew. Sustain. Energy Rev. 2010, 14, 702–712. [Google Scholar] [CrossRef]
- Muhammed, G.; Tekbiyik-Ersoy, N. Development of renewable energy in China, USA, and Brazil: A comparative study on renewable energy policies. Sustainability 2020, 12, 9136. [Google Scholar] [CrossRef]
- Ogunmakinde, O.E. A review of circular economy development models in China, Germany and Japan. Recycling 2019, 4, 27. [Google Scholar] [CrossRef] [Green Version]
- European Commission. Communication from the Commission; The European Green Deal; European Commission: Brussel, Belgium, 2017. [Google Scholar]
- Directive 2001/77/EC of the European Parliament and of the Council of 27 September 2001 on the Promotion of Electricity Produced from Renewable Energy Sources in the Internal Electricity Market. Off. J. Eur. Union 2001, 283, 33–40.
- Perea-Moreno, M.A.; Samerón-Manzano, E.; Perea-Moreno, A.J. Biomass as renewable energy: Worldwide research trends. Sustainability 2019, 11, 863. [Google Scholar] [CrossRef] [Green Version]
- Marks-Bielska, R.; Bielski, S.; Novikova, A.; Romaneckas, K. Straw stocks as a source of renewable energy. A case study of a district in Poland. Sustainability 2019, 11, 4714. [Google Scholar] [CrossRef] [Green Version]
- Directive 2018/2001 of the European Parliament and of the Council of 11 December 2018 on the Promotion of the Use of Energy from Renewable Sources. Off. J. Eur. Union 2018, 328, 82–209.
- Knápek, J.; Králík, T.; Vávrová, K.; Valentová, M.; Horák, M.; Outrata, D. Policy implications of competition between conventional and energy crops. Renew. Sustain. Energy Rev. 2021, 151, 111618. [Google Scholar] [CrossRef]
- Cattaneo, C.; Givonetti, A.; Leoni, V.; Guerrieri, N.; Manfredi, M.; Giorgi, A.; Cavaletto, M. Biochemical aspects of seeds from Cannabis sativa L. plants grown in a mountain environment. Sci. Rep. 2021, 11, 3927. [Google Scholar] [CrossRef]
- Kraszkiewicz, A.; Kachel, M.; Parafiniuk, S.; Zając, G.; Niedziółka, I.; Sprawka, M. Assessment of the possibility of using hemp biomass (Cannabis sativa L.) for energy purposes: A case study. Appl. Sci. 2019, 9, 4437. [Google Scholar] [CrossRef] [Green Version]
- Rheay, H.T.; Omondi, E.C.; Brewer, C.E. Potential of hemp (Cannabis sativa L.) for paired phytoremediation and bioenergy production. GCB Bioenergy 2021, 13, 525–536. [Google Scholar] [CrossRef]
- Wawro, A.; Batog, J.; Gieparda, W. Chemical and enzymatic treatment of hemp biomass for bioethanol production. Appl. Sci. 2019, 9, 5348. [Google Scholar] [CrossRef] [Green Version]
- Ahmed, A.F.; Islam, M.Z.; Mahmud, M.S.; Sarker, M.E.; Islam, M.R. Hemp as a potential raw material toward a sustainable world: A review. Heliyon 2022, 8, e08753. [Google Scholar] [CrossRef] [PubMed]
- Frankowski, J.; Sieracka, D. Possibilities for Using Waste Hemp Straw for Solid Biofuel Production. Environ. Sci. Proc. 2021, 9, 18. [Google Scholar] [CrossRef]
- Gaze, B.; Noszczyk, T.; Romanski, L.; Dyjakon, A.; Kulazynski, M. Determination of the dominant mechanism for NOx formation in low power boilers fed with biomass. Przemysł Chem. 2020, 99, 228–233. [Google Scholar] [CrossRef]
- Sterner, T.; Turnheim, B. Innovation and diffusion of environmental technology: Industrial NOx abatement in Sweden under refunded emission payments. Ecol. Econ. 2009, 68, 2996–3006. [Google Scholar] [CrossRef]
- Forzatti, P. Present status and perspectives in de-NOx SCR catalysis. Appl. Catal. A Gen. 2001, 222, 221–236. [Google Scholar] [CrossRef]
- Roy, S.; Hegde, M.S.; Madras, G. Catalysis for NOx abatement. Appl. Energy 2009, 86, 2283–2297. [Google Scholar] [CrossRef]
- Javed, M.T.; Irfan, N.; Gibbs, B.M. Control of combustion-generated nitrogen oxides by selective non-catalytic reduction. J. Environ. Manag. 2007, 83, 251–289. [Google Scholar] [CrossRef]
- Wojtko, P.; Gaze, B.; Knutel, B.; Wacławek, A.; Bukowski, P.; Romański, L. The use of catalytic additives for the combustion of sunflower husk pellets in a low-power boiler. Przemysł Chem. 2021, 100, 1000–1004. [Google Scholar] [CrossRef]
- Gaze, B.; Knutel, B.; Jajczyk, M.; Wacławek, A.; Bukowski, P.; Dębowski, M. Analysis of the use of catalytic additives for combustion with wood pellets in a low-power boiler. Rynek Energii 2021, 4, 93–98. [Google Scholar]
- Gaze, B.; Romański, L.; Kułażyński, M. Koncepcja wykorzystania mocznika do ograniczenia emisji NOx w kotłach małej mocy. Przemysł Chem. 2020, 99, 569–573. [Google Scholar] [CrossRef]
- Standard PN-EN ISO 18134-1; Solid Biofuels—Determination of Moisture Content—Oven Dry Method—Part 1: Total Moisture—Reference Method. Polish Committee for Standarization: Warsaw, Poland, 2016. Available online: https://standards.globalspec.com/std/9951652/iso-18134-1 (accessed on 24 January 2022).
- Standard PN-EN ISO 18125:2017-07; Solid Biofuels—Determination of Calorific Value. Polish Committee for Standarization: Warsaw, Poland, 2017. Available online: https://standards.globalspec.com/std/9972508/iso-18125 (accessed on 24 January 2022).
- Standard PN-EN ISO 18122:2016-01; Solid Biofuels—Determination of Ash Content. Polish Committee for Standarization: Warsaw, Poland, 2016. Available online: https://standards.globalspec.com/std/2051854/iso-18122 (accessed on 24 January 2022).
- Standard PN-EN ISO 18123:2016-01; Solid Biofuels—Determination of the Content of Volatile Matter. Polish Committee for Standarization: Warsaw, Poland, 2016. Available online: https://standards.globalspec.com/std/2051856/iso-18123 (accessed on 24 January 2022).
- Standard PN-EN ISO 16948:2015-07; Solid Biofuels—Determination of Total Content of Carbon, Hydrogen and Nitrogen. Polish Committee for Standarization: Warsaw, Poland, 2015. Available online: https://standards.globalspec.com/std/2048180/iso-16948 (accessed on 24 January 2022).
- Ministry of Infrastructure and Development. Regulation of the Minister of Infrastructure and Development of February 27, 2015 on the Methodology for Determining the Energy Performance of a Building or Part of a building and Energy Performance Certificates; Monitor of Poland of 2015: Warsaw, Poland, 2015.
- Wantuch, A. RES in Low-Energy Buildings. IAPGOS 2016, 4, 63–66. [Google Scholar] [CrossRef]
- Datasheet of Catalytic Additive No 1 Cost. Available online: https://kotly.com.pl/produkt-aktywator-spalania-anlen-wegiel-0-5-kg-4000.html?l=pl (accessed on 15 January 2022).
- Datasheet of Catalytic Additive No 2 Cost. Available online: https://www.castorama.pl/catalog/product/view/id/14388/s/preparat-przeciw-sadzy-diavolina-270-g/ (accessed on 15 January 2022).
- Datasheet of Catalytic Additive No 3 Cost. Available online: https://czystykomin.com.pl/witaminy-do-paliwa/49-witaminy-do-paliwa-stalego-50-szt-hansa-4779022360367.html (accessed on 15 January 2022).
- Datasheet of Catalytic Additive No 4 Cost. Available online: https://itermo.pl/pl/p/PROPFEU (accessed on 15 January 2022).
- Datasheet of Catalytic Additive No 5 Cost. Available online: https://sklep.serwiskotly.com/sklepserwiskotlycom-p-274.html (accessed on 15 January 2022).
- Calorific Values and CO2 Emission Factors in 2019 to Be Reported Under the Emission Trading Scheme for 2022; KOBiZE: Warsaw, Poland, 2021.
- Kordylewski, W. Spalanie i Paliwa; Oficyna Wydaw; Politechniki Wrocławskiej: Wrocław, Poland, 2008; ISBN 9788374933780. [Google Scholar]
Publisher’s Note: MDPI stays neutral with regard to jurisdictional claims in published maps and institutional affiliations. |
© 2022 by the authors. Licensee MDPI, Basel, Switzerland. This article is an open access article distributed under the terms and conditions of the Creative Commons Attribution (CC BY) license (https://creativecommons.org/licenses/by/4.0/).

